Embed Size (px)
Citation preview
2021, Vol. 9, No. 3 10.15678/EBER.2021.090311
Links between the economy competitiveness
and logistics performance in the Visegrád Group countries:
Empirical evidence for the years 2007-2018
Botond Kálmán, Arnold Tóth
A B S T R A C T
Objective: The objective of the article is to examine the relationship of competitiveness and logistics per-
formance and – on the basis of this relationship – inspect which of the 12 pillars of the Global Competi-
tiveness Index (GCI) reveal developments in the logistics performance of Visegrád Group (V4) countries.
Next, we analyse the possibility of creating a common indicator number, by which the index formulated
based on the GCI pillars and the Logistics Performance Index (LPI) values can simultaneously express com-
petitiveness and logistics development level.
Research Design & Methods: For our research, we used the time series from the Logistic Performance In-
dex published every three years by the World Bank and the Global Competitiveness Index annually pub-
lished by the World Economic Forum. We analysed the correlation between the pillars of the GCI and the
index components of the LPI and then chose pillars that make it apparent how competitiveness determines
the development level of logistics. To that end, we first used the Pearson correlation coefficient and, later,
structural equation modelling. We performed the examination of the logistics development level of V4
countries based on the competitiveness pillars by objective index values, but also by comparison to coun-
tries that are on top of the LPI ranking.
Findings: Institutions, adoption of information and communication technology (ICT), and Innovation have the
most defining effect on logistics performance in V4. The countries of V4 were successful in improving the
performance level of their logistics sector, but the performance of Poland and the Czech Republic exceeds the
performance of Slovakia and Hungary in practically all of the studied areas.
Implications & Recommendations: The present study primarily highlights the fact that further efficient devel-
opment can only be realised by appropriately harmonising the activities of economic policymakers and actors.
The examined V4 countries showed similar development levels, so we also gave them similar suggestions,
which mainly include the development of the info-communication sector and the improvement in the effec-
tiveness of the Institutions competitiveness pillar.
Contribution & Value Added: The last time V4 countries logistics capabilities were scrutinised was in 2015.
Since then, the pillar structure of the World Economic Forum underwent a significant change. This study ex-
amines the group’s logistics performance by using more up-to-date data and highlighting the way for further
research activities by searching for comparative advantages, which may allow V4 countries to further increase
their competitiveness and logistics performance.
Article type: research article
Keywords: competitiveness; logistics; performance; the Visegrád Group; development
JEL codes: F63, P25, P27, R11
Received: 1 November 2020 Revised: 24 April 2021 Accepted: 26 April 2021
Suggested citation:
Kálmán, B., & Tóth, A. (2021). Links between the economy competitiveness and logistics performance in the
Visegrád Group countries: Empirical evidence for the years 2007-2018. Entrepreneurial Business and Econom-ics Review, 9(3), 169-190. https://doi.org/10.15678/EBER.2021.090311
170 | Botond Kálmán, Arnold Tóth
INTRODUCTION
The country competitiveness and logistics performance are in close relationship. The implementation
of a well-organised production-transport-storage chain is necessary for competitiveness in the era of
Industry 4.0, as is appropriate digital equipment and competences (Rymarczyk, 2020; 2021; Sieja &
Wach, 2019). The country that implements all this successfully will gain a significant competitive ad-
vantage over other countries. At the same time, the information technology (IT) or wider information
and communication technology (ICT) sector is also an important pillar of the Global Competitiveness
Index (GCI) used by the World Economic Forum (WEF). This means that improvement in competitive-
ness pillars could also improve logistics performance. The role of the logistics sector in the whole econ-
omy is increasing. The share of the logistics and transport sectors in the EU economy is 5% and 10%
respectively (European Commission, 2016). These data clearly indicate the significance of economic
performance. In satisfying the ever-increasing market demand – which results from the progress of
globalization – a great role is played by organised transport, distribution, product monitoring, and
warehousing. Development increases constantly, primarily thanks to digitization. IT that is applied in
more and more areas of life is essential in modern logistics as well. IT primarily plays a key role in the
organization of supply chains, stock management, and transport processes (Magill et al., 2020, Zhiwen
et al., 2020). In the future, the importance of digital awareness will be clear in every area of the econ-
omy, from management through workplace environment design to logistics. Likewise, as a result of
accelerating development and on top of the characteristics of supply chains, new areas will become
the focus of scientific research (Agyabeng-Mensah et al., 2020, Ren et al., 2020) because of increasing
environmental awareness and the rapid shortening of deadlines. Sufficient logistics performance is
essential for economic growth. Although, these types of services are generally provided by firms, na-
tional governments with regional and international organizations also play a decisive role by establish-
ing regulations. The importance of logistics was recognised in recent decades. Logistics activity is de-
termined by strategic-business approach, which means that on top of examining costs, even in the
case of the potential increase of costs (Duran & Alfonso, 2020), the primary objectives remain better
performance and higher customer satisfaction (Wang et al., 2021). For nations in pursuit of further
development, the effective harmonization of logistics strategy and regulations will become necessary,
which is an important element of government policy. Besides this, cooperation between countries is
also important, which is a competitiveness increasing factor.
Although, the share of logistics in a country’s gross domestic product (GDP) is not necessarily as
large as the share of other competitive sectors, we must not disregard its role played in supporting all
other economic activities. Under appropriate conditions, the known connection between transport-
logistics and national development brings numerous other favourable economic and social results. The
sector enables companies to be efficient with regards to products and services, along with related
transactions. Inadequately efficient logistics increase the costs of commerce and reduce integration
potentials. However, not just infrastructure requires development but also new factors of competi-
tiveness such as the efficiency of information flow, telecommunication systems, innovation systems,
and the practical application of new knowledge. Thus, the role of logistics increases in improving the
economic competitiveness of the region.
The elements of efficient and competitive product transport contribute to the growth of the Euro-
pean economy. Logistics is one of the main drivers and pillars of European competitiveness, by creating
routes for the movement of goods and cooperation among firms. For further development, it would
be expedient to harmonise related national strategies.
The objective of the article is to examine the relationship of competitiveness and logistics perfor-
mance and – on the basis of this relationship – inspect which of the 12 pillars of the Global Competi-
tiveness Index reveal developments in the Logistics Performance Index (LPI) of Visegrád Group (V4)
countries. Our research question sought which pillars should be modified to enhance logistical perfor-
mance most effectively. To that end, we first examined the relationship between competitiveness pil-
lars and logistics performance and then examined the effect of relevant pillars on this performance.
Links between the economy competitiveness and logistics performance… | 171
During our work, we paid special attention to the Visegrád Group (V4) countries. The relevance of our
investigation derives from the fact that the Global Competitiveness Index – published from year to
year by the World Economic Forum – changed prior to our research. This change resulted in a research
gap in the literature, which we decided to begin filling. Accordingly, old (till 2017) and new (since 2018)
pillars of competitiveness had been reconciled with each other before statistical treatment in order to
ensure the proper application of the GCI in the future. The novelty of this article lies in the fact that
the augmentation of the political influence and the co-operation of the V4 countries will soon produce
tangible results, namely in the field of logistics, the V4 railway project abating the duration of War-
szawa-Budapest distances under six hours or the Via Carpathia public road development programme.
The structure of the work is the following. Based on comprehensive prior literature review, we
formulate our hypothesis, followed by the description of the research method. During the review of
the results and discussion, we first show the model we used and then its application for V4 countries.
In the closing chapter, we conclude and demonstrate the results.
LITERATURE REVIEW
Theoretical relationships between competitiveness and logistics performance
Modern competitiveness is one of the most often used terms in the literature on economics. However,
the notion lacks a generally accepted definition. One of the reasons for this is that modern competi-
tiveness is interpreted on multiple levels – corporate, regional, and national – which are described by
various indices (Siudek & Zawojska, 2014). Of course, competitive behaviour and its components may
also be evaluated with other methods. In the present work, we chose logistics as area of analysis,
whose one of the most accepted condition indicators today is the Logistics Performance Index (LPI),
generally published biannually by the World Bank since 2007 (Arvis et al., 2007). Since logistics is a
component of the GCI, a correlation can be assumed between the two indicators, which has been
proven by several authors (Tongzon, 2007; Kasarda, 2016).
Puertas et al. (2014) studied the role of logistics performance in the bilateral international com-
merce processes of European Union member states. By fitting the LPI into the two-step Heckman-
model – widespread in economics – they conclude that in balanced two-way commerce, the GDP of
the importing country, the distance between the two countries, and the LPI are the three determining
factors. Their further significant conclusion is that logistics is a key factor from the perspective of ex-
porting countries. In the trend of the LPI value, the role of interstate commerce processes has appre-
ciated because the local market is rather a hindrance than a driver of increasing logistics performance,
even in countries more developed economically. The efficiency of a product transport firm or a depart-
ment store delivery company can follow increasing market demand only to a limited extent, but in
small countries these actors probably dominate in supplying the local market. However, only the com-
panies that explicitly specialise in logistics can keep up with the requirements of the market growth
caused by international cooperation. Consequently, the significant expansion in the range of consum-
ers makes it necessary for manufacturers and distributers to use such companies for transport. These
international service providers are in competition with each other, which ensures their constant de-
velopment. With regards to the role played by local markets and their effect on logistics performance
Kiisler (2008) demonstrated that on local markets the role of manufacturers is more significant in de-
livering products than the role of logistics service providers. On the one hand, this entails a considera-
ble increase of manufacturers’ costs. On the other hand, in companies specialised in production, nei-
ther sufficient knowledge nor adequate resources are available to provide professional logistics ser-
vices. In turn, this causes a considerable performance disadvantage for a country.
Innovation is also of key importance in logistics (Cieślik et al., 2018; Roscoe et al., 2016). Björ-
klund and Forslund (2018) analyse the role played by innovation, in connection with a study of in-
ternational supply chains. They highlight the characteristics of the innovation process, emphasising
that its cost reducing and performance increasing effect can be maximised if we study the possibili-
ties of development of all the participants of logistics. Among manufacturers, this could be realised
by improving the efficiency of production, while on the side of consumers, assessing needs and
172 | Botond Kálmán, Arnold Tóth
adapting to them would represent the greatest progress. Among transport companies, what is im-
portant is the role of committed managers who can determine the most efficient sequence of activ-
ities while viewing the process of product delivery in its entirety. One of these innovative processes
is the just-in-time (JIT) system developed by Toyota for its production process as early as in 1938,
whose logistics application offer significant opportunities even today (Lai & Cheng, 2016). At the
same time, air cargo transport plays a leading role in the delivery of high value, quickly perishing
foods, medications, flowers, and similar products, generates important innovative solutions, cou-
pled with the requirement of sustainable development (Kasarda, 2016).
Ghoumrassi and Tigu (2018) studied the role of ICT in logistics processes among Pakistani retail
stores. Based on their results, according to a majority of transport companies, emphasis on increasing
delivery performance volume per time and simultaneously reducing delivery time improves customer
satisfaction, which originates from the customer always receiving the right amount of product at the
right time and for the lowest price. Today, the significant growth of online purchases makes fast and
convenient solutions increasingly important from the perspective of clients. Thus, we must keep this in
mind when considering the development of firms that perform products delivery. Delfmann et al. (2002)
analysed the effect of e-commerce on logistics and indicated that with the increasing popularity of e-
shops, the elements of a traditional supply chain also transform. It is a frequent opinion that suppliers
and subcontractors should use the same information technology. Primarily, the point is not which type
of system they use but that all participants have an identical system. Bates et al. (2018) analyse the mod-
ern ICT use method. This means that special opportunities of IT systems can be used in the area of ‘last
mile’ logistics. In this case, the point primarily is not what system they use, rather for the system to be
the latest and most modern possible version. This facilitates delivering the package from the last distri-
bution point to its destination – mostly the customer’s home – in the fastest and most environmentally
friendly manner. The concept of smart cities plays a great role in this, along with the 5G information
system, currently in its initial phase but developing at an increasing speed. The continuous development
of information systems plays an important role not only for countries that lag behind in logistics devel-
opment as in the absence of adequate technology, there doubtlessly is no realistic chance of increasing
performance and catching up to more developed countries. Jhawar and Garg (2016) studied the effect
of investments in IT development on competitiveness. Based on the examination of several models, they
demonstrated that investment in IT development has little effect on increasing a company’s profit (<
0.1%). Despite this, investments in business management systems have an outstanding role since with
them, the company’s time and performance efficiency can be greatly increased, which in the longer term,
certainly increases the logistics performance and competitiveness of businesses.
The subject of logistics and competitiveness has been studied by multiple authors and following var-
ious viewpoints. One of the most common goals is to make suggestions for increasing logistics perfor-
mance (Beysenbaev & Dus, 2020; Roekel, 2013). Primiana et al. (2016) scrutinise the performance of the
logistics sector primarily with a cost level approach. They use the classic division of logistics costs as a
framework to conclude that the logistics costs of the studied companies comprise only 0.2% of their sales
revenue. However, they also discover significant differences between specific cost categories: half of the
logistics costs comprise costs related to warehousing, while fuel costs are in the second place. Thus, re-
ducing both expenses may result in the possibility of spending considerable financial resources on other
tasks. Another research team (Civelek et al., 2015) employ the hierarchic regression method to study
how the LPI, the GCI, and GDP affect each other. Their results show that improvement achieved in the
GCI value directly increases GDP, while a similar effect is observed in an indirect way by improving the
LPI values. Another team observes the effect of the GCI on the LPI trends (Çemberci et al., 2015). They
consider the effect of the GCI on the six indices that comprise the LPI, with the hierarchic regression
method presuming a correlation separately in the case of every index. According to their conclusion, the
GCI has affects logistics competence, product monitoring, international shipments, and timeliness, while
a change in competitiveness failed to affect customs administration and infrastructure. Other authors
study what differences can be detected in the effect of logistics performance on competitiveness pillars
in countries with various incomes. Their new method is the ARAS-G method, used to evaluate the logis-
tics performance of OECD countries in 2010-2018 (Yildirim & Adiguzel Mercangoz, 2020).
Links between the economy competitiveness and logistics performance… | 173
Moreover, clustering is also a popular study method, sometimes employed for a grouping of
logistical characteristics (Carlan et al., 2017). However, country-based grouping is more frequent
due to the large number of countries (C4L, 2017). The income classification of countries was con-
ducted based on the World Bank’s 2016 ranking. Among others, the study connects infrastructure,
health condition, higher education, and market size more closely to logistics performance. At the
same time, the study shows that a country’s place in an income category is closely related to its
chances of competitiveness development. For the logistically most developed countries of Asia,
Chung (2016) applies Porter’s Diamond Model by using the GCI and LPI data, along with the model
applied in multiple criteria decision-making and the analytic hierarchy process (AHP) for multi-at-
tribute decision-making, also described by Rapcsák (2007). Chung (2016) demonstrates that even
though the scrutinised countries all have high positions on the LPI ranking, they comprise two sepa-
rate groups from the viewpoint of logistics development level. Hwang et al. (2017) study the corre-
lations between the competitive and logistics features of the most dynamically developing countries
to find that proper industry policy, infrastructure development, market expansion, and appropriately
selected IT background are the most important logistics performance stimulants.
Hypotheses development
As it was mentioned, one of the most popular macro-level indices is the GCI, developed and annually
published by the World Economic Forum, which may be described by its twelve pillars (Schwab, 2007).
As evident from the above overview, several studies examine the correlation between the GCI and the
LPI. The future prospects of output values and usability are significantly changed by the fact that in
2017 the World Economic Forum modified the structural composition of the 12 GCI pillars. In consid-
eration of the changes, the present work sets the goal of examining the effects of the new GCI pillars
on logistics performance. Our intention was also to create an index which – based on the elements of
the GCI and the LPI – can be used for the comprehensive and joint characterization of competitiveness
and logistics. Using our own results, we planned the creation of country groups, for which we can make
specific recommendations to their governments.
In our study, we particularly focused on the group of V4 countries (Czech Republic, Hungary, Po-
land, and Slovakia as the members). Although Handfield and Withers (1993) nearly 30 years ago com-
pared Hungary to the logistics of Korea, China, and Japan, we regarded a regional comparison more
expedient, thus we made the comparison with the V4 members. These countries are tied together by
the heritage of their shared socialist past, which forestalled their economic development for many
years, and they have been unable to completely eliminate their disadvantage to this day. The V4 coun-
tries were logistically presented in 2015 with a summary work edited by Veres (2015). Ricci (2019)
highlights two competitive strategies in the manufacturing industry in Central Eastern European coun-
tries. The research team of Dorożyński and Kuna-Marszałek (2015) studied only selective subfields,
similarly other researchers focusing especially on themes of intermodal transportation (Białobłocka,
2019), road transport logistics (Włodarczyk & Mesjasz-Lech, 2019), and railway development (Tóth,
2019). We will join these series of studies on V4 countries with our current research, primarily to re-
evaluate the old data from previous studies and the results of the literature on the topic.
The empirical results from previous studies allowed us to assume the following research hy-
potheses, which seem in the literature to be worth verifying (Hwang et al., 2017; Arvis et al., 2018;
Ahmad & Mehmood, 2016):
H1: It is primarily Institutions (Pillar 1), Infrastructure (Pillar 2), and ICT adoption (Pillar 3) that
have the most defining effect on logistics performance.
H2: Countries can be grouped into clusters based on their logistics performance for which the
development of different competitiveness pillars can be recommended, depending on their
specific cluster.
H3: In the studied period, the V4 countries took similar development paths, and they managed
to make progress in the area of logistics development.
174 | Botond Kálmán, Arnold Tóth
RESEARCH METHODOLOGY
Data and period
We based our study on two publicly available data sources. First, we mean the competitiveness report
entitled “Global Competitiveness Report” that conveys the GCI, which is annually published by the
World Economic Forum. From these reports we compiled the data for the period of 2007-2018
(Schwab, 2007, 2008, 2009, 2010, 2011, 2012, 2013, 2014, 2015, 2016, 2017, 2018). As we mentioned
above, the index structure of the GCI changed in 2017, thus eliminating its issues that had received
criticism (Table 1). The main reason for the change was the need to adapt to Industry 4.0. The change
had numerous favourable effects on the index, since the number of indicators based on statistical data
increased, and the weighting of the elements that produce the value of specific pillars was simplified.
The content’s relevance was modernised as well, e.g., the role of specific pillars in competitiveness is
now measured by the WEF with statistical data rather than subjective questionnaire surveys.
Table 1. Adaptation of the old and new competitiveness pillars of GCI by WEF
GCI till 2017 GCI from 2018
1. Institutions 1. Institutions
2. Infrastructure 2. Infrastructure
3. Macroeconomic Environment 4. Macroeconomic Stability
4. Health and Primary Education 5. Health
5. Higher Education and Training 6. Skills (all education is included here)
6. Goods Market Efficiency 7. Product Market
7. Labour Market Efficiency 8. Labour Market
8. Financial Market Development 9. Financial System
9. Technological Readiness 3. ICT Adoption
10. Market Size 10. Market Size
11. Business Sophistication 11. Business Dynamism
12. Innovation 12. Innovative Capability
Source: Schwab (2016) and Schwab (2018).
Our second source was the LPI developed by the World Bank, which publishes the report since 2007,
usually every two years. The LPI numerically evaluates and ranks logistics performance, thus assisting
government leaders, key policymakers, and the private sector in understanding the challenges that they
and their trading partners face. The LPI enables government and business leaders to better recognise the
competitive advantage provided by efficient logistics and understand the significance of policy factors
related to the economy that affect logistics. The LPI measures the logistics performance of countries with
six components, which we mentioned in the introduction. Of this data series, we also used the values
published in the period of 2007-2018 (Arvis et al., 2007, 2010, 2012, 2014, 2016, 2018). Since the World
Bank’s report was most recently published in 2018, we only studied the GCI up to this year.
Standardization and triangulation of data
In the first step we had to adapt the pre-2018 GCI pillars to the 12 indices applied in 2018. This was
necessary to enable the use of a consistent structure for the comparability of our results in the time-
series analysis sequence tests. In the case of some of the pillars – e.g., with Institutions or Infrastruc-
ture – such an adaptation did not cause any difficulty. Specifically, in cases when a pillar’s name clearly
indicates that the old and the new pillar measure the same indicator, even if they use different com-
ponents for their characterization. In cases when the correlation between the pillars was not clearly
identifiable based on names, we applied the Pearson correlation to adapt the pillars to each other. The
original fourth (Health and Primary Education) and fifth (Higher Education and Training) pillars can be
aligned with the new system’s fifth (Health) and sixth (Skills) pillars, as proven by the Pearson-correla-
tion analysis, which revealed that the condition of health was the defining factor in the case of Health
and Primary Education. This is why we adapted the original fourth pillar to the fifth (Health) pillar of

Links between the economy competitiveness and logistics performance… | 175
the new system (Table 2). We found the greatest difference between the old Technological Readiness
and the new ICT adoption indicators. Thus, we studied the adaptation with the Pearson correlation in
this case as well. The results are shown in Table 3, proving our assumption that the ICT is the compo-
nent that indeed mostly defines readiness.
Table 2. The role of the health factor and primary education in the old fourth pillar – results of Pearson corre-
lations until 2017
Pillars Statistics A. Health B. Primary education Fourth pillar Health
and Primary Education
A. Health
Correlation coeff. 1 0.647 0.909
p-value (2 tailed) 0.000 0.000
N 1524 1524 1524
B. Primary education
Correlation coeff. 0.647 1 0.906
p-value (2 tailed) 0.000 0.000
N 1524 1524 1524
Fourth pillar Health
and Primary Education
Correlation coeff. 0.909 0.906 1
p-value (2 tailed) 0.000 0.000
N 1524 1524 1524
Source: own elaboration based on Schwab (2017).
Table 3. The role of ICT in the old ninth pillar – results of Person correlations until 2017
Pillars Statistics A. Technological
adoption B. ICT use
Ninth Pillar Technological
Readiness
A. Technology adoption
Correlation coeff. 1 0.689 0.837
p-value (2 tailed) 0.000 0.000
N 1132 1132 1132
B. ICT use
Correlation coeff. 0.689 1 0.973
p-value (2 tailed) 0.000 0.000
N 1132 1132 1132
Ninth Pillar
Technological Readiness
Correlation coeff. 0.837 0.973 1
p-value (2 tailed) 0.000 0.000
N 1132 1132 1524
Source: own elaboration based on Schwab (2017).
To unify the present study and for its planned future expansion, we decided that from here on,
we will use the names and numbering of pillars according to the prevailing valid system from 2018.
Further procedures used in the methodology will be discussed in the next chapter to ensure better
availability and transparency of the model.
Research methods
We conducted our study with the application of multiple methods. We used Pearson correlation coef-
ficient and structural equation modelling (SEM) method. For calculations we used SPSS Amos software
package by IBM. To create our model, we first took account of the extent of correlation between the
variables we examined, and we put special emphasis on partial correlations to make model construc-
tion more sophisticated. Building from this, we associated the variables based on the closeness of their
relationships. Arrows indicate causal connections. Their directions were concluded based on literature
review and own experiences attained during previous research of the authors. The actual revelation
of causal connections necessitated the application of the Granger test but due to the shortness of the
time series of LPI it was not practicable.
Then, we observed the fit indices of the model. We considered the followings for their assessment:
an NFI (Normed Fit Index) of 0.95 indicates that the model of interest improves the fit by 95% relative
to the null model. The Incremental Fit Index (IF) adjusts the NFI for sample size and degrees of freedom.

176 | Botond Kálmán, Arnold Tóth
Over 0.90 is a good fit but the index can exceed 1. The Relative Fit Index (RFI) is not guaranteed to vary
from 0 to 1. However, RFI close to 1 indicates a good fit.
RESULTS AND DISCUSSION
Building and testing the model for 160 countries
The first step in the creation of our model was the study of possible connections of 160 countries.
Since the GCI is a composite type of index, its pillars are not independent of each other. Thus, one
cannot be selected from among them for a competitiveness increasing purpose because of mutual
interactions between all the pillars, which would result in an unexpected result. Therefore, not only
the effect of the pillars on the LPI should be analysed but also the complex correlation systems
among them. However, analysing all the correlations is unnecessary, so we only focused on the
significant correlations. Because of considerable multicollinearities, after normalising the value of
the 0-100 pillar-score to values 1-7, we performed partial correlation analyses to select the most
significant ones. Then, we followed the same principle in the assessment of interactions between
the six components of the LPI (Table 4 and Table 5).
Table 4. GCI partial correlations in the year 2016
Pillars
1.
Inst
itu
tio
ns
2.
Infr
ast
ruct
ure
3.
ICT
Ad
op
tio
n
4.
Ma
cro
-eco
no
mic
Sta
bil
ity
5.
He
alt
h
6.
Sk
ills
7.
Pro
du
ct M
ark
et
8.
Lab
ou
r M
ark
et
9.
Fin
an
cia
l S
yst
em
10
. M
ark
et
Siz
e
11
. B
usi
ne
ss D
yn
am
ism
12
. In
no
va
tiv
e C
ap
ab
ilit
y
1. Institutions 1
2. Infrastructure 0.328 1
3. ICT Adoption -0.099 0.381 1
4. Macroeconomic Stability 0.090 0.115 -0.002 1
5. Health -0.024 0.085 0.043 0.008 1
6. Skills -0.028 0.157 0.413 0.004 0.542 1
7. Product Market 0.351 -0.039 0.209 -0.016 0.112 -0.117 1
8. Labour Market 0.120 -0.051 -0.011 0.135 -0.125 0.064 0.202 1
9. Financial System 0.169 -0.043 -0.048 0.159 -0.014 0.044 0.179 0.169 1
10. Market Size -0.420 0.233 -0.159 0.161 0.028 0.035 0.002 -0.196 0.082 1
11. Business Dynamism -0.012 0.243 -0.123 -0.052 -0.122 0.166 0.337 -0.085 0.268 0.203 1
12. Innovation Capability 0.339 -0.210 0.293 -0.086 -0.052 0.046 -0.107 0.209 -0.150 0.309 0.477 1
Notes:
p < 0.05
Coefficients > 0.3 <0.2 – 0.3 > <0.1 – 0.2 > In other cases, there is no
assessable correlation.
Source: own elaboration based on Schwab (2017).
In consideration of the complex correlations between the pillars, we regarded their extent use-
able from 0.3. Thus, we created a model with the application of significant correlations with the
help of the IBM-SPSS Amos module and with the structural equation modelling method. With ex-
plorative factor analyses method, we created the LPI as a latent variable from its six indices. The
created model is shown in Figure 1.

Links between the economy competitiveness and logistics performance… | 177
Table 5. LPI partial correlations between GCI Pillars and LPI for 2018
GCI Pillars Correlation coeff. p-value
1. Institutions 0.034 0.356
2. Infrastructure 0.020 0.592
3. ICT Adoption 0.319 0.000
4. Macroeconomic Stability -0.053 0.148
5. Health 0.046 0.212
6. Skills -0.099 0.007
7. Product Market 0.175 0.000
8. Labour Market -0.077 0.036
9. Financial System 0.029 0.426
10. Market Size 0.408 0.000
11. Business Dynamism 0.013 0.732
12. Innovation Capability 0.240 0.000
Source: own elaboration based on Arvis et al. (2018).
While creating the model, we only included the countries for which all annual data in 2007-2017 was
completely available to us. Then, we created the LPI, which is included in the model, as a latent variable,
with explorative factor analysis (EFA) method. This is a technique used to reveal the elemental structure
of a major set of variables. EFA is a statistical method within factor analysis the comprehensive aim of
which is to detect the intrinsic links between metrical data (Norris & Lecavalier, 2009). We employed it
to evolve a scale being a database of matters used to assess a given area of research. EFA aims to specify
a set of potential elements hidden behind a series of measured variables (Fabrigar et al., 1999).
We constructed the LPI from its six indices, practically with total correlation. The arrows between the
model’s elements denote significant correlation. The direction of arrows demonstrates the cause-and-
effect relationship between the two endpoints, pointing from the cause toward the result. We determined
the direction of the arrow based on our economic knowledge. The effect strength is indicated by the num-
ber marking of the arrow, which corresponds to the standardised coefficient from the factor score. The
complexity of the GCI pillars’ interaction between each other is evident. The two indices that play central
roles are Institutions and Infrastructure, which affect practically every other pillar. The received model
explains 85% of the LPI. The value of the parameters characterising fitness (NFI, RFI, IF) exceeds 95%. Based
on the study of effect strengths, ICT Adoption has the strongest direct effect on logistics performance, the
second being Innovative Capability, followed by Market Size and the effect of Product Market. However,
Knowledge/Skills and the Labour Market show a direct negative effect, while Institutions do not directly
affect logistics performance. In our opinion, the negative effect related to Knowledge/Skills is only appar-
ent. The reason for this is probably that – primarily – physical type indicators are used for the measure-
ment of logistics performance, and these considerably underrepresent the role of the human factor, so
better skills and higher knowledge level do not directly appear in logistics performance but, instead, indi-
rectly through ICT Adoption. Regarding the growth of the Labour Market from among the indicator num-
bers applied by the WEF as statistical data, one of the defining factors is the extent of workforce reduction
costs. By their reduction, the position of the labour market improves. However, logistics development may
entail that less and less employees can perform a task involving increasingly modern technologies, so we
may deem it likely that in this sector the cost of labour has no effect on increasing efficiency. The indicator
of ICT Adoption as a stronger direct effect factor is explained in 84% by its two components: knowledge
and infrastructure. Based on the analysis of indirect effects, Institutions and Infrastructure affect the LPI
the most, while in the third place appears the Knowledge/Skills pillar, but the effect strength of the latter
is only about one-third of the former two. The indicators of ICT Adoption and Market Size have a further
and weak indirect effect. The third-type effect is the cumulative effect that we receive as the total of direct
and indirect effects, which reveal that – in sum – logistics performance is mostly influenced by Institutions.

Figure 1. LPI-GCI model
Source: own elaboration.

Links between the economy competitiveness and logistics performance… | 179
In the next step, we decided to prepare the importance-performance analysis (IPA), which can be
calculated from our analysis (O’Leary & Lee, 2015). The IPA quantitatively shows how large is the role
of each competitiveness factor in increasing logistics performance (Figure 2).
Figure 2. Importance-performance map
Source: own elaboration.
Figure 2 indicates the complete effect of competitiveness pillars on the horizontal axes. The
vertical axis represents logistical performance, describing the absolute value of multiplying the pil-
lar value and the total effect. We standardised this value to a one-hundred-degree scale, then we
worked out the average pillar by pillar. The numbers shown in each quadrant correspond to the
serial numbers of GCI pillars. We sought those competitiveness indicators that currently contribute
to logistics performance with low efficiency, meaning that their cumulative effect is considerable
but the performance increasing effect is low. These appear in the Q4 quadrant. As most recom-
mended appeared the development of the twelfth pillar, Innovation, followed by Market Size and
then ICT Adoption. Since Market size is limited by the geographic characteristics of each country, it
is most expedient to focus on innovation, if the goal is to increase logistics performance. Of course,
as a result of the abovementioned multicollinearities, this conclusion represents a significant sim-
plification compared to reality. Still, those economic policy developments that increase the effi-
ciency of innovation will expectedly result in increasing logistics performance.
Our next goal was the creation of an index that characterises the relationship between logistics
performance and competitiveness with a common indicator. For this, we first made the GPI pillars
comparable with the LPI components by normalization, then from these variables we created a
factor in the SPSS program through main component analysis. Based on such received index value,
we classified countries described by both the WEF and the World Bank into groups with cluster
analysis, according to their economic-logistics development level. During the clustering, our goal
was to create well-separated country groups. For this purpose, we classified the countries in the
clustering that were closest to each other into the same group, based on the values of the 12 pillars,
because in this way the cluster centres could have been determined at the largest distance from
each other. Based on the dendrogram received as a result of computer analysis, we created three
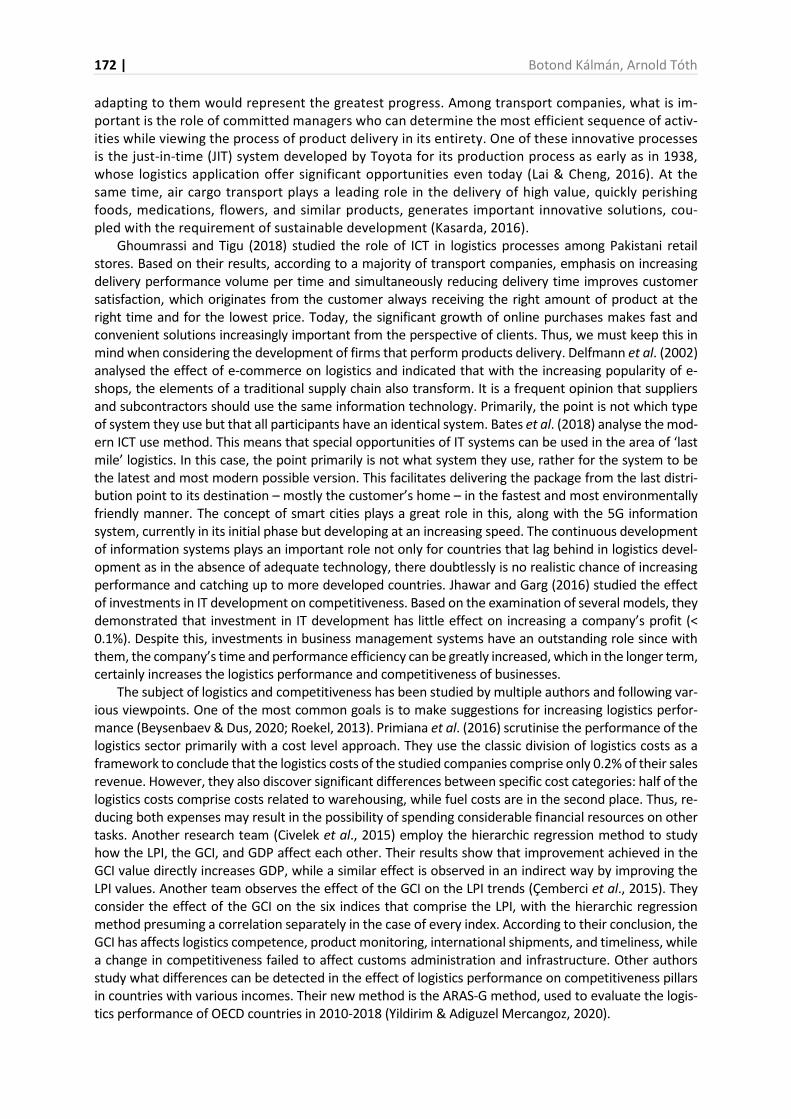
clusters – high, medium, and low development level – then based on the index values of countries
in the same group for which we calculated cluster averages. The average values and deviations of
the index created by us are shown in Figure 3.
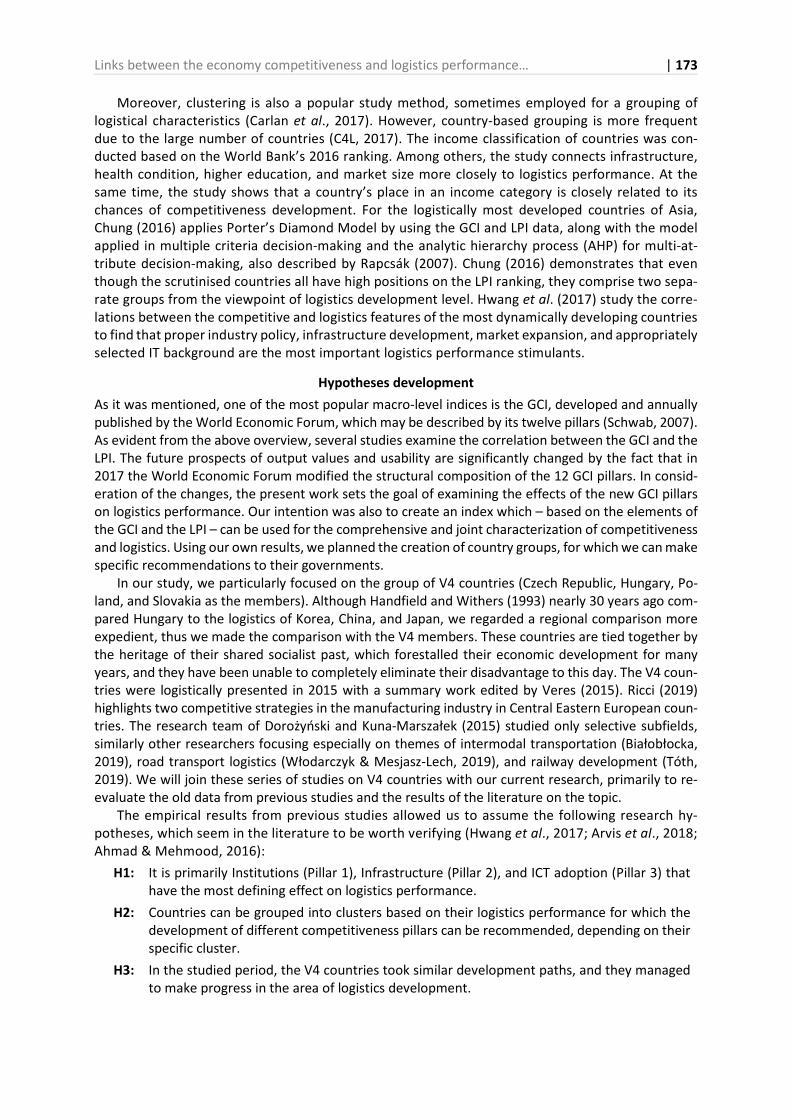
Based on our index values, of the 160 countries included in our study, 48 countries were in the low
logistics performance and competitiveness group, 78 were among the medium development level, 34
were in the developed cluster. The cluster averages of each variable are shown in Figure 4.
0
10
20
30
40
50
60
70
80
90
100
0 0,2 0,4 0,6 0,8 1 1,2
Log
isti
cs P
erf
orm
an
ce
Total effects
4.
8.9.
11.
5.
6.7. 10.
12.
1. 2. 3.
Q1 Q2
Q3 Q4
180 | Botond Kálmán, Arnold Tóth
Figure 3. Average values and deviations of the clusters for 160 countries in the years 2007-2018
Source: own elaboration.
Figure 4. GCI pillar and LPI cluster averages for 160 countries in the years 2007-2018
Source: own elaboration.
We selected the countries located at the limit values of the quantiles from the different clusters.
Since the high and low development level clusters include fewer countries then the medium cluster,
we divided the former into three groups and selected two countries for further study, each located on
the boundaries of the terciles, we divided the medium development-level group into quartiles and
selected for three countries further study, each located on the boundaries of the quartiles.
In accordance with the results of the importance-performance study, here it is also evident that irre-
spective of development level, the relatively low level of Innovation proved to be a general problem,
which is further increased by the underdevelopment of the IT sector in less developed countries. An
additional problem may be represented by the small size of the market, which makes it difficult to in-
crease performance even in economically and logistically developed countries. Other studies in literature
have dealt with these problems in the past few years. Here, we reference the work of Ghoumrassi and
Tigu (2018) who analyse the correlation between ICT and logistics, along with the conclusions of Bates et al. (2018) regarding the key importance of IT even in logistically developed countries. The results of anal-
yses by Delfmann et al. (2002) evaluate the effect of e-commerce on supply chain trends. The key im-
portance of innovation in logistics is highlighted in the works of Roscoe et al. (2016) and Björklund and
Forslund (2018). Furthermore, we cite the fact that there is potential for development even with such
traditional methods as the application of the just-in-time system (Lai & Cheng, 2016). The results of Kiisler
(2008) supports our results regarding the performance-limiting effect of the size of local markets.
0
2
4
6
8
10
low middle advanced
0,00000
1,00000
2,00000
3,00000
4,00000
5,00000
6,00000
7,00000Cluster 1 Cluster 2 Cluster 3

Links between the economy competitiveness and logistics performance… | 181
By using our own clusters, we also studied the logistics development levels of European countries.
Based on this, we can observe that three European countries – Ireland, the Czech Republic, and Hun-
gary – show the highest development pace, thanks to which these countries in 2010-2018 moved from
medium-developed to highly-developed clusters logistics-wise. Thus, in 2018, only three countries,
Greece, Croatia, and Cyprus remained in the second cluster.
Our model’s application for the V4 countries
By the application of the results received after the creation of our model, we focused our further study
on a narrower, regional group of the V4 countries. In the literature section, we have described their
similar economic characteristics that originate from shared history. Here, we foreground the fact that
based on their geographic location, they play a special role in the East-West commerce, and a portion
of the North-South commercial routes toward Southern and Eastern Europe also cross here.
Similarly to the shared historical background, the trends of logistical development are also simi-
lar among the V4 countries. Economic underdevelopment originating from their shared socialist past
greatly impacted the performance of all of these countries. This is visible from the development
classification of our own clusters. All four countries were in the medium logistics development level
until 2018, and only moved into the developed cluster in 2018. This also means that during the eight
years under scrutiny, these countries experienced dynamic development, overtaking e.g., Greece
that has been an EU member since 1981, Cyprus that joined the EU at the same time as the V4
countries, and Croatia that has been an EU member since 2013, which all still showed only medium
logistics development level in 2018.
Although clustering and classification based on this provides a good overview, such a picture is not
sufficiently differentiated. Therefore, to refine our analysis, we studied our index values for each coun-
try and for the V4 countries together (Figure 5).
Notes: CZE – Czechia HUN – Hungary, POL – Poland, SVK – Slovakia, Total – all V4 countries
Figure 5. Authors’ index values for the V4 countries in the years 2010-2018
Source: own elaboration.
Figure 5 clearly shows that during the studied years, the performance of the Czech Republic and
Poland was continuously above the V4 average, while the Hungarian and Slovakian index value continu-
ously remained below the average. However, after 2016, Hungary’s development was the most dynamic
in the group. From the perspective of the Innovation aspect, the Czech Republic continuously performs
well, while Hungary showed performance exceeding the V4 average until 2014. In the area of Innovation
only the Czech Republic has shown uninterrupted and above average development (Figure 6).
By 2016, Hungary fell back in this area to the last place among the V4 countries, but by 2018, it
approached the average again as a dynamically developing member of the group. Considering that the
performance of the Czech Republic significantly exceeds all others, it could mean a major step ahead
for the V4 if they were the leader of cooperative developments by sharing their experience. Market
7,00
7,50
8,00
8,50
9,00
2010 2012 2014 2016 2018
Au
tho
rs'
ind
ex
CZE HUN POL SVK Total
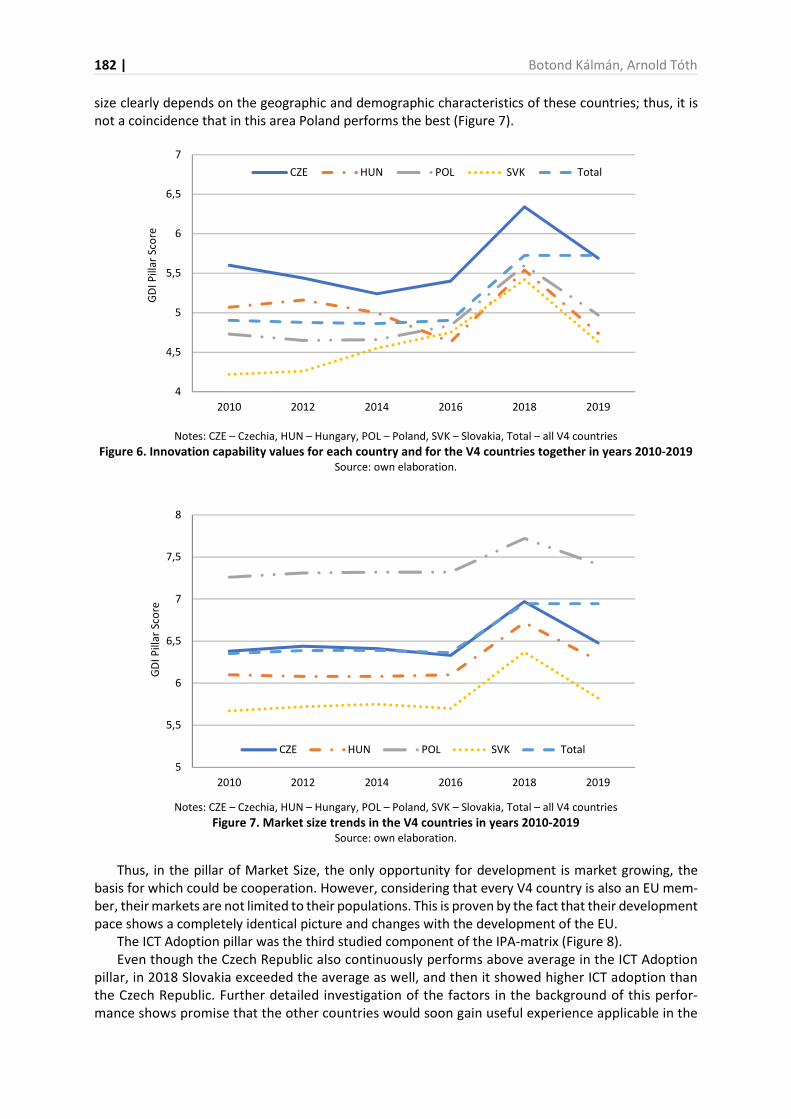
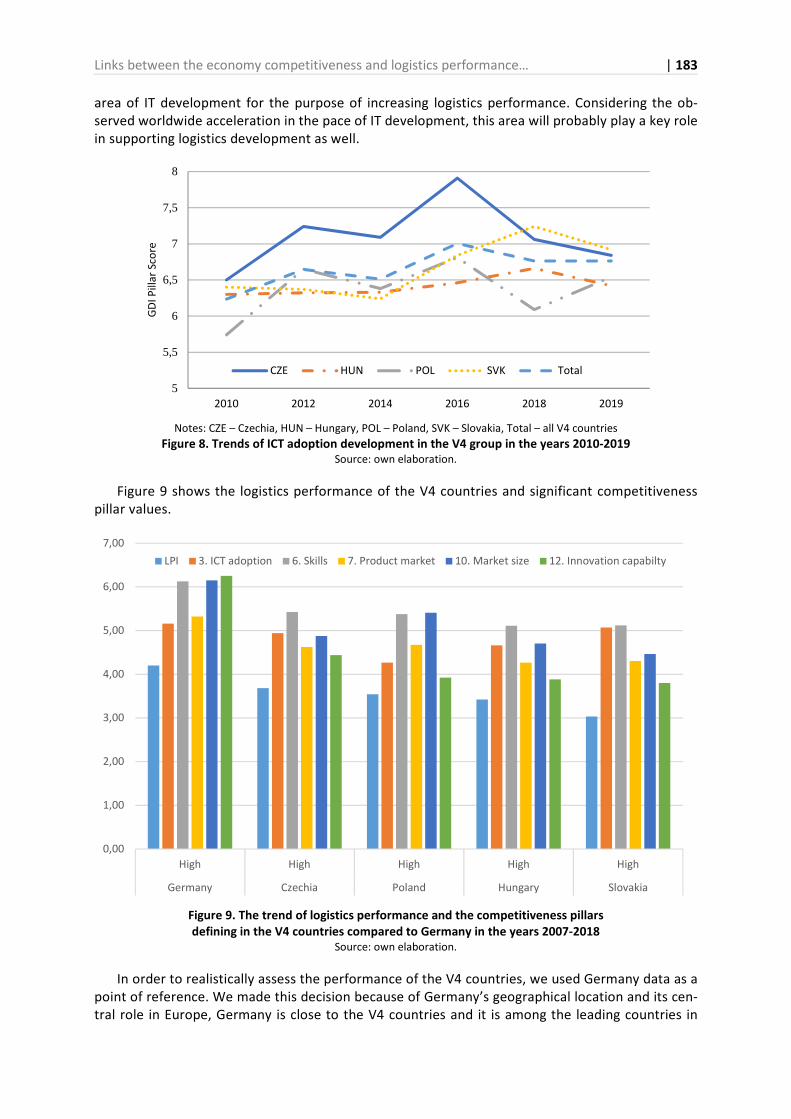
182 | Botond Kálmán, Arnold Tóth
size clearly depends on the geographic and demographic characteristics of these countries; thus, it is
not a coincidence that in this area Poland performs the best (Figure 7).
Notes: CZE – Czechia, HUN – Hungary, POL – Poland, SVK – Slovakia, Total – all V4 countries
Figure 6. Innovation capability values for each country and for the V4 countries together in years 2010-2019
Source: own elaboration.
Notes: CZE – Czechia, HUN – Hungary, POL – Poland, SVK – Slovakia, Total – all V4 countries
Figure 7. Market size trends in the V4 countries in years 2010-2019
Source: own elaboration.
Thus, in the pillar of Market Size, the only opportunity for development is market growing, the
basis for which could be cooperation. However, considering that every V4 country is also an EU mem-
ber, their markets are not limited to their populations. This is proven by the fact that their development
pace shows a completely identical picture and changes with the development of the EU.
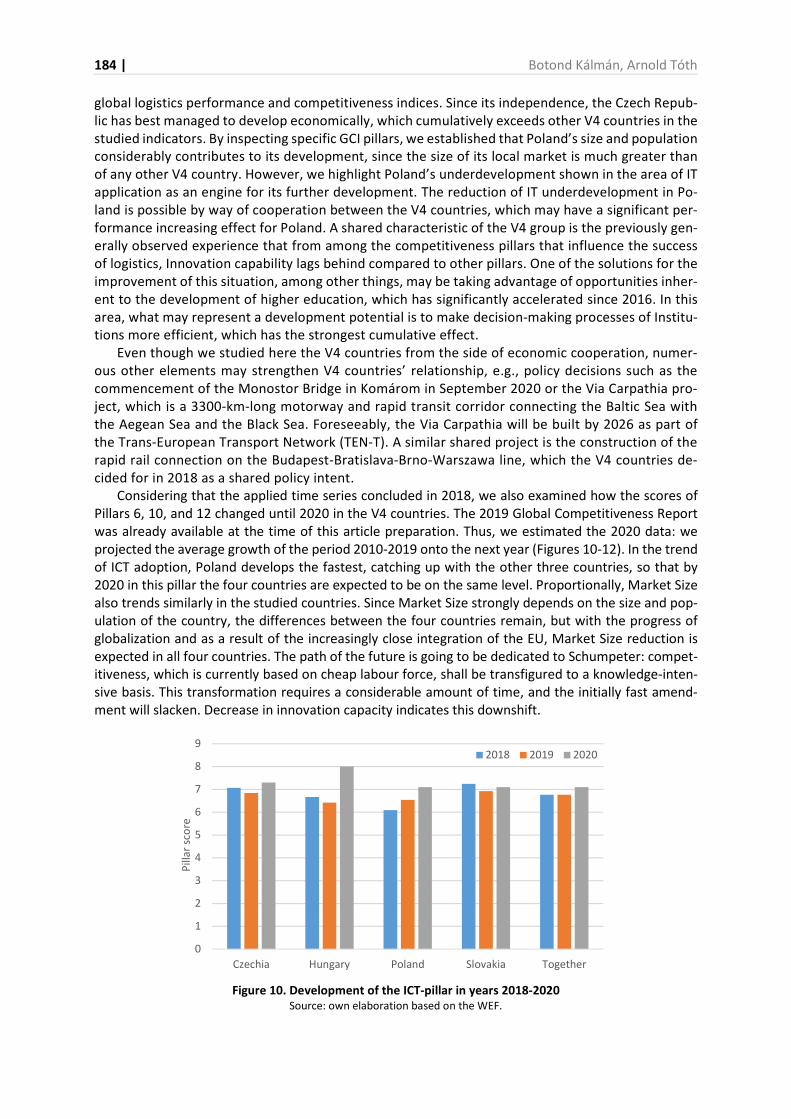
The ICT Adoption pillar was the third studied component of the IPA-matrix (Figure 8).
Even though the Czech Republic also continuously performs above average in the ICT Adoption
pillar, in 2018 Slovakia exceeded the average as well, and then it showed higher ICT adoption than
the Czech Republic. Further detailed investigation of the factors in the background of this perfor-
mance shows promise that the other countries would soon gain useful experience applicable in the
4
4,5
5
5,5
6
6,5
7
2010 2012 2014 2016 2018 2019
GD
I P
illa
r S
core
CZE HUN POL SVK Total
5
5,5
6
6,5
7
7,5
8
2010 2012 2014 2016 2018 2019
GD
I P
illa
r S
core
CZE HUN POL SVK Total
Links between the economy competitiveness and logistics performance… | 183
area of IT development for the purpose of increasing logistics performance. Considering the ob-
served worldwide acceleration in the pace of IT development, this area will probably play a key role
in supporting logistics development as well.
Notes: CZE – Czechia, HUN – Hungary, POL – Poland, SVK – Slovakia, Total – all V4 countries
Figure 8. Trends of ICT adoption development in the V4 group in the years 2010-2019
Source: own elaboration.
Figure 9 shows the logistics performance of the V4 countries and significant competitiveness
pillar values.
Figure 9. The trend of logistics performance and the competitiveness pillars
defining in the V4 countries compared to Germany in the years 2007-2018
Source: own elaboration.
In order to realistically assess the performance of the V4 countries, we used Germany data as a
point of reference. We made this decision because of Germany’s geographical location and its cen-
tral role in Europe, Germany is close to the V4 countries and it is among the leading countries in
5
5,5
6
6,5
7
7,5
8
2010 2012 2014 2016 2018 2019
GD
I P
illa
r S
core
CZE HUN POL SVK Total
0,00
1,00
2,00
3,00
4,00
5,00
6,00
7,00
High High High High High
Germany Czechia Poland Hungary Slovakia
LPI 3. ICT adoption 6. Skills 7. Product market 10. Market size 12. Innovation capabilty
184 | Botond Kálmán, Arnold Tóth
global logistics performance and competitiveness indices. Since its independence, the Czech Repub-
lic has best managed to develop economically, which cumulatively exceeds other V4 countries in the
studied indicators. By inspecting specific GCI pillars, we established that Poland’s size and population
considerably contributes to its development, since the size of its local market is much greater than
of any other V4 country. However, we highlight Poland’s underdevelopment shown in the area of IT
application as an engine for its further development. The reduction of IT underdevelopment in Po-
land is possible by way of cooperation between the V4 countries, which may have a significant per-
formance increasing effect for Poland. A shared characteristic of the V4 group is the previously gen-
erally observed experience that from among the competitiveness pillars that influence the success
of logistics, Innovation capability lags behind compared to other pillars. One of the solutions for the
improvement of this situation, among other things, may be taking advantage of opportunities inher-
ent to the development of higher education, which has significantly accelerated since 2016. In this
area, what may represent a development potential is to make decision-making processes of Institu-
tions more efficient, which has the strongest cumulative effect.
Even though we studied here the V4 countries from the side of economic cooperation, numer-
ous other elements may strengthen V4 countries’ relationship, e.g., policy decisions such as the
commencement of the Monostor Bridge in Komárom in September 2020 or the Via Carpathia pro-
ject, which is a 3300-km-long motorway and rapid transit corridor connecting the Baltic Sea with
the Aegean Sea and the Black Sea. Foreseeably, the Via Carpathia will be built by 2026 as part of
the Trans-European Transport Network (TEN-T). A similar shared project is the construction of the
rapid rail connection on the Budapest-Bratislava-Brno-Warszawa line, which the V4 countries de-
cided for in 2018 as a shared policy intent.
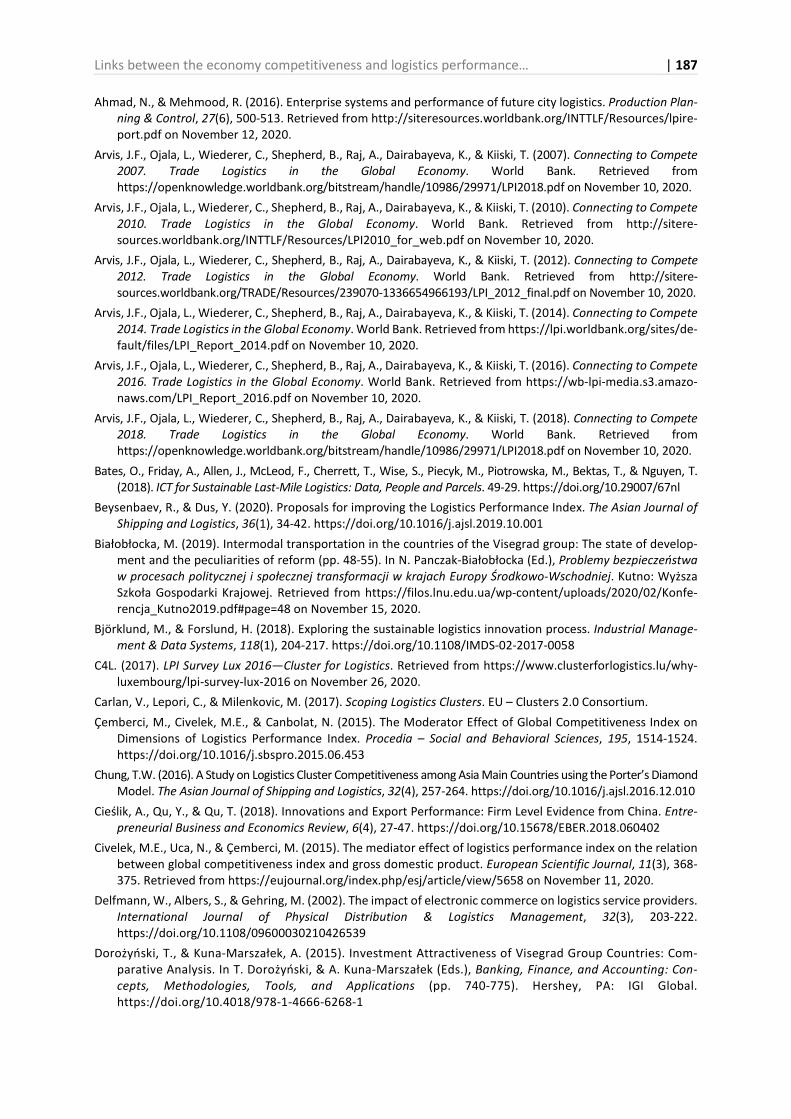
Considering that the applied time series concluded in 2018, we also examined how the scores of
Pillars 6, 10, and 12 changed until 2020 in the V4 countries. The 2019 Global Competitiveness Report
was already available at the time of this article preparation. Thus, we estimated the 2020 data: we
projected the average growth of the period 2010-2019 onto the next year (Figures 10-12). In the trend
of ICT adoption, Poland develops the fastest, catching up with the other three countries, so that by
2020 in this pillar the four countries are expected to be on the same level. Proportionally, Market Size
also trends similarly in the studied countries. Since Market Size strongly depends on the size and pop-
ulation of the country, the differences between the four countries remain, but with the progress of
globalization and as a result of the increasingly close integration of the EU, Market Size reduction is
expected in all four countries. The path of the future is going to be dedicated to Schumpeter: compet-
itiveness, which is currently based on cheap labour force, shall be transfigured to a knowledge-inten-
sive basis. This transformation requires a considerable amount of time, and the initially fast amend-
ment will slacken. Decrease in innovation capacity indicates this downshift.
Figure 10. Development of the ICT-pillar in years 2018-2020
Source: own elaboration based on the WEF.
0
1
2
3
4
5
6
7
8
9
Czechia Hungary Poland Slovakia Together
Pil
lar
sco
re
2018 2019 2020

Links between the economy competitiveness and logistics performance… | 185
Figure 11. Trend of Market Size in years 2018-2020
Source: own elaboration based on the WEF.
Figure 12. Trend of Innovative Capability in years 2018-2020
Source: own elaboration based on the WEF.
CONCLUSIONS
The goal of our study was to establish what effects GCI pillars have on logistics development, and by
the application of which factors can logistics performance be increased. Our knowledge gained by
reviewing literature played a significant role in decision on the direction of our study. Specifically, the
literature review revealed that the authors who conducted earlier studies were more curious about
which components of the LPI are affected by the competitiveness pillars or which only focused on the
effect of an individual pillar. Several external factors have also been the subject of research, e.g., to
what extent does the income of a country influence competitiveness and logistics efficiency. Consid-
ering the fact that neither specific competitiveness pillars nor LPI components can be realistically
evaluated in isolation – because of the multicollinearities that exist among them – we decided to
include all the GCI pillars in our analysis. Although there is a complex correlation system between the
pillars, their effect on logistics performance cannot be equal. Based on information gained from the
literature review, when we formulated our first hypothesis H1, we assumed that Institutions, Infra-
structural Background, and ICT Adoption have the most defining effect. This hypothesis has been par-
tially proven. Specifically, based on the results of the importance-performance analysis (IPA), Innova-
tion proved to have by far more significant effect than the role of Infrastructure, but we managed to
0
1
2
3
4
5
6
7
8
9
Czechia Hungary Poland Slovakia Together
Pil
lar
sco
re
2018 2019 2020
0
1
2
3
4
5
6
7
8
Czechia Hungary Poland Slovakia Together
Pil
lar
sco
re
2018 2019 2020

186 | Botond Kálmán, Arnold Tóth
support the significant role of Institutions in ICT Adoption. The practical relevance of the model is the
fact that with the development of the ICT sector, the state can make a significant increase in logistics
performance while at the same time improving competitiveness. Therefore, our advice is to provide
significant state aid to ensure the ICT modernisation in all V4 countries, while also considering the
multicollinearity found among competitiveness pillars.
In our second hypothesis H2, we assumed that the clusters created according to logistics develop-
ment level emphasise the development of different competitive factors and will mostly increase the
performance of the members of specific country groups. This hypothesis was disproved since in every
cluster, Innovation development was proven to be the most important factor, and only the countries
characterised by the lowest LPI showed a specific factor, which was the lack of IT development.
In the formulation of our third hypothesis H3, we assumed a similar development of the specific
group of countries – the V4 countries – in the studied period. This assumption was proven, with the
addition that the performance of Poland and the Czech Republic exceeds the performance of Slovakia
and Hungary in practically all of the studied areas. Moreover, we managed to show that in 2016-2018,
all four countries were successful in improving the performance level of their logistics sectors. Based
on our results, one of the mutually beneficial solutions for further development would be cooperation
as pooling resources and experience may result in additional qualitative progress of all V4 countries.
Profit-oriented market expansion caused by accelerating globalization only brings expected result
with sufficient efficiency and organization. Logistics play a key role in these tasks. As a consequence of
the mutually complex correlations between competitiveness and logistics development, competitive-
ness is just as important for logistics development as efficient logistics for greater competitiveness.
The present study primarily intended to raise awareness of this fact, highlighting that further efficient
development can only be realised by appropriately harmonising the activities of economic policymak-
ers and actors. Of course, the correlations studied in the present work only represent a portion of the
entire picture. An analysis from another aspect, not described in the present study, may refine the
assessment more. The assessment may become even more subtle by an analysis not featuring in the
framework of the current study, which represents a different viewpoint.
Of course, the correlations studied in the present work only represent a portion of the entire
picture. An analysis from another aspect – not described in the present study – may make the as-
sessment more refined. Thus, the outlining of normative conditions required for increased perfor-
mance may be conducted and their realisation may be studied based on economic-policy measures
and the results they bring.
Our research is, on the one hand, limited by the world economy being constrained to shut down
by the outbreak of the coronavirus pandemic after the publishing of the last available data. The
long-term effects of this cessation are yet to be assessed exactly, as of today. Another not foresee-
able factor is the outcome of the EU’s economic climate. And a further issue is the scheduled en-
largement of the Union, resulting in the inclusion of new actors. For example, the admission of
Serbia and the accession of the Western Balkans may accelerate the accomplishment of the V4
countries’ intended projects in the region.
Future research should keep the data up-to-date and thus ensure the examination of a longer
time series according to the new pillar structure by the WEF. By extending the study to further coun-
tries and regions, new viewpoints may arise that can be used to further develop our current study.
The actualisation of our study’s results is severely limited by the fact that the last publication of the
LPI was in 2018 and current data will only be available in 2021. Unfortunately, to prove our assump-
tions, we will have to wait for the next publication of the LPI, whose data will hopefully support our
conclusions derived from our current results.
REFERENCES
Agyabeng-Mensah, Y., Afum, E., & Ahenkorah, E. (2020). Exploring financial performance and green logistics
management practices: examining the mediating influences of market, environmental and social perfor-
mances. Journal of Cleaner Production, 258, 120613. http://doi.org/10.1016/j.jclepro.2020.120613
Links between the economy competitiveness and logistics performance… | 187
Ahmad, N., & Mehmood, R. (2016). Enterprise systems and performance of future city logistics. Production Plan-ning & Control, 27(6), 500-513. Retrieved from http://siteresources.worldbank.org/INTTLF/Resources/lpire-
port.pdf on November 12, 2020.
Arvis, J.F., Ojala, L., Wiederer, C., Shepherd, B., Raj, A., Dairabayeva, K., & Kiiski, T. (2007). Connecting to Compete 2007. Trade Logistics in the Global Economy. World Bank. Retrieved from
https://openknowledge.worldbank.org/bitstream/handle/10986/29971/LPI2018.pdf on November 10, 2020.
Arvis, J.F., Ojala, L., Wiederer, C., Shepherd, B., Raj, A., Dairabayeva, K., & Kiiski, T. (2010). Connecting to Compete 2010. Trade Logistics in the Global Economy. World Bank. Retrieved from http://sitere-
sources.worldbank.org/INTTLF/Resources/LPI2010_for_web.pdf on November 10, 2020.
Arvis, J.F., Ojala, L., Wiederer, C., Shepherd, B., Raj, A., Dairabayeva, K., & Kiiski, T. (2012). Connecting to Compete 2012. Trade Logistics in the Global Economy. World Bank. Retrieved from http://sitere-
sources.worldbank.org/TRADE/Resources/239070-1336654966193/LPI_2012_final.pdf on November 10, 2020.
Arvis, J.F., Ojala, L., Wiederer, C., Shepherd, B., Raj, A., Dairabayeva, K., & Kiiski, T. (2014). Connecting to Compete 2014. Trade Logistics in the Global Economy. World Bank. Retrieved from https://lpi.worldbank.org/sites/de-
fault/files/LPI_Report_2014.pdf on November 10, 2020.
Arvis, J.F., Ojala, L., Wiederer, C., Shepherd, B., Raj, A., Dairabayeva, K., & Kiiski, T. (2016). Connecting to Compete 2016. Trade Logistics in the Global Economy. World Bank. Retrieved from https://wb-lpi-media.s3.amazo-
naws.com/LPI_Report_2016.pdf on November 10, 2020.
Arvis, J.F., Ojala, L., Wiederer, C., Shepherd, B., Raj, A., Dairabayeva, K., & Kiiski, T. (2018). Connecting to Compete 2018. Trade Logistics in the Global Economy. World Bank. Retrieved from
https://openknowledge.worldbank.org/bitstream/handle/10986/29971/LPI2018.pdf on November 10, 2020.
Bates, O., Friday, A., Allen, J., McLeod, F., Cherrett, T., Wise, S., Piecyk, M., Piotrowska, M., Bektas, T., & Nguyen, T.
(2018). ICT for Sustainable Last-Mile Logistics: Data, People and Parcels. 49-29. https://doi.org/10.29007/67nl
Beysenbaev, R., & Dus, Y. (2020). Proposals for improving the Logistics Performance Index. The Asian Journal of Shipping and Logistics, 36(1), 34-42. https://doi.org/10.1016/j.ajsl.2019.10.001
Białobłocka, M. (2019). Intermodal transportation in the countries of the Visegrad group: The state of develop-
ment and the peculiarities of reform (pp. 48-55). In N. Panczak-Białobłocka (Ed.), Problemy bezpieczeństwa w procesach politycznej i społecznej transformacji w krajach Europy Środkowo-Wschodniej. Kutno: Wyższa
Szkoła Gospodarki Krajowej. Retrieved from https://filos.lnu.edu.ua/wp-content/uploads/2020/02/Konfe-
rencja_Kutno2019.pdf#page=48 on November 15, 2020.
Björklund, M., & Forslund, H. (2018). Exploring the sustainable logistics innovation process. Industrial Manage-ment & Data Systems, 118(1), 204-217. https://doi.org/10.1108/IMDS-02-2017-0058
C4L. (2017). LPI Survey Lux 2016—Cluster for Logistics. Retrieved from https://www.clusterforlogistics.lu/why-
luxembourg/lpi-survey-lux-2016 on November 26, 2020.
Carlan, V., Lepori, C., & Milenkovic, M. (2017). Scoping Logistics Clusters. EU – Clusters 2.0 Consortium.
Çemberci, M., Civelek, M.E., & Canbolat, N. (2015). The Moderator Effect of Global Competitiveness Index on
Dimensions of Logistics Performance Index. Procedia – Social and Behavioral Sciences, 195, 1514-1524.
https://doi.org/10.1016/j.sbspro.2015.06.453
Chung, T.W. (2016). A Study on Logistics Cluster Competitiveness among Asia Main Countries using the Porter’s Diamond
Model. The Asian Journal of Shipping and Logistics, 32(4), 257-264. https://doi.org/10.1016/j.ajsl.2016.12.010
Cieślik, A., Qu, Y., & Qu, T. (2018). Innovations and Export Performance: Firm Level Evidence from China. Entre-preneurial Business and Economics Review, 6(4), 27-47. https://doi.org/10.15678/EBER.2018.060402
Civelek, M.E., Uca, N., & Çemberci, M. (2015). The mediator effect of logistics performance index on the relation
between global competitiveness index and gross domestic product. European Scientific Journal, 11(3), 368-
375. Retrieved from https://eujournal.org/index.php/esj/article/view/5658 on November 11, 2020.
Delfmann, W., Albers, S., & Gehring, M. (2002). The impact of electronic commerce on logistics service providers.
International Journal of Physical Distribution & Logistics Management, 32(3), 203-222.
https://doi.org/10.1108/09600030210426539
Dorożyński, T., & Kuna-Marszałek, A. (2015). Investment Attractiveness of Visegrad Group Countries: Com-
parative Analysis. In T. Dorożyński, & A. Kuna-Marszałek (Eds.), Banking, Finance, and Accounting: Con-cepts, Methodologies, Tools, and Applications (pp. 740-775). Hershey, PA: IGI Global.
https://doi.org/10.4018/978-1-4666-6268-1

188 | Botond Kálmán, Arnold Tóth
Duran, O., & Afonso, P.S.L.P. (2020). An activity based costing decision model for life cycle economic assessment
in spare parts logistic management. International Journal of Production Economics, 222, 107499.
http://doi.org/10.1016/j.ijpe.2019.09.020
European Commission (2016). Transport sector economic analysis. Retrieved from https://ec.eu-
ropa.eu/jrc/en/research-topic/transport-sector-economic-analysis on October 30, 2021.
Fabrigar, L.R., Wegener, D.T. MacCallum, R.C. & Strahan, E.J. (1999). Evaluating the use of exploratory factor analysis
in psychological research. Psychological Methods, 4(3), 272-299. http://doi.org/10.1037/1082-989X.4.3.272
Ghoumrassi, A., & Tigu, G. (2018). The impact of the logistics management in customer satisfaction. Proceedings of the International Conference on Business Excellence, 12(1), 407-415. https://doi.org/10.2478/picbe-2018-0036
Handfield, R.B., & Withers, B. (1993). A comparison of logistics management in Hungary, China, Korea, and Japan.
Journal of Business Logistics, 14(1), 81-109. Retrieved from https://www.semanticscholar.org/paper/A-
COMPARISON-OF-LOGISTICS-MANAGEMENT-IN-HUNGARY%2C-Handfield-With-
ers/415eb5b9b21646dec0ee277716c1c511de9a7fc8 on November 14, 2020
Hwang, D.W., Hong, P.C., & Lee, D.Y. (2017). Critical factors that affect logistics performance: A comparison of
China, Japan and Korea. International Journal of Shipping and Transport Logistics, 9(1), 107.
https://doi.org/10.1504/IJSTL.2017.080587
Jhawar, A., & Garg, S.K. (2016). System Dynamics Modelling to Study the Effects of Investment in Information
Technology on Logistics Performance: A Case Study from India. International Journal of System Dynamics Applications, 5(2), 19-40. https://doi.org/10.4018/IJSDA.2016040102
Kasarda, J. (2016). Logistics Is about Competitiveness and More. Logistics, 1(1), 1-3. https://doi.org/10.3390/lo-
gistics1010001
Kiisler, A. (2008). Logistics in Estonian Business Companies. Transport, 23(4), 356-362.
https://doi.org/10.3846/1648-4142.2008.23.356-362
Lai, K., & Cheng, T.C.E. (2016). Just-in-Time Logistics (0 ed.). Routledge. https://doi.org/10.4324/9781315590875
Magill, L.J., Jafarifar, N., Watson, A., & Omotayo, T. (2020). 4D BIM integrated construction supply chain logistics
to optimise on-site production. International Journal of Construction Management, 1-10.
http://doi.org/10.1080/15623599.2020.1786623
Norris, M., & Lecavalier, L. (2009). Evaluating the Use of Exploratory Factor Analysis in Developmental Disability
Psychological Research. Journal of Autism and Developmental Disorders, 40(1), 8-20.
http://doi.org/10.1007/s10803-009-0816-2
O’Leary, J.T., & Lee, G. (2015). Importance-performance analysis. In J. Jafari & H. Xiao (Eds.), Encyclopedia of Tourism (pp. 1-2). Cham: Springer. https://doi.org/10.1007/978-3-319-01669-6_371-1
Primiana, I., Juanim, Y.A., Yunani, A., & Herwany, A. (2016). Improvement Strategy for Supply Chain Performance
of the Garment Industry to Decrease Logistics Costs and Enhance Competitiveness. Journal of Industrial and Intelligent Information, 4(2), 121-124. https://doi.org/10.18178/jiii.4.2.121-124
Puertas, R., Martí, L., & García, L. (2014). Logistics performance and export competitiveness: European experi-
ence. Empirica, 41(3), 467-480. https://doi.org/10.1007/s10663-013-9241-z
Ren, R., Hu, W., Dong, J., Sun, B., Chen, Y., & Chen, Z. (2020). A systematic literature review of green and sustain-
able logistics: bibliometric analysis, research trend and knowledge taxonomy. International Journal of Envi-ronmental Research and Public Health, 17(1), 261. http://doi.org/10.3390/ijerph17010261
Rapcsák T. (2007). Többszempontú döntési problémák. BCE-MTA SZTAKI. Retrieved from http://www.oplab.szt-
aki.hu/tanszek/download/I_Tobbsz_dont_modsz.pdf on November 28, 2020.
Roekel, W.V. (2017). Improving the logistics performance index (lpi) by assigning weights to its six core compo-nents, using the best-worst method. (Unpublished master’s thesis). Delft University of technology, Delft,
Netherlands.
Ricci, A. (2018). Is There Social or Monetary Dumping in the European Union? Manufacturing Competitiveness in
Central and Eastern Europe. Entrepreneurial Business and Economics Review, 7(1), 159-180.
http://doi.org/10.15678/EBER.2019.070109
Roscoe, S., Cousins, P.D., & Lamming, R.C. (2016). Developing eco-innovations: A three-stage typology of supply
networks. Journal of Cleaner Production, 112(3), 1948-1959. https://doi.org/10.1016/j.jclepro.2015.06.125
Links between the economy competitiveness and logistics performance… | 189
Rymarczyk, J. (2020). Technologies, opportunities and challenges of the Industrial Revolution 4.0: Theoretical
considerations. Entrepreneurial Business and Economics Review, 8(1), 185-198.
https://doi.org/10.15678/EBER.2020.080110
Rymarczyk, J. (2021). The impact of industrial revolution 4.0 on international trade. Entrepreneurial Business and Economics Review, 9(1), 105-117. https://doi.org/10.15678/EBER.2021.090107
Schwab, K. (2007). The Global Competitiveness Report 2007. World Economic Forum. Retrieved from
http://www3.weforum.org/docs/WEF_GlobalCompetitivenessReport_2006-07.pdf on December 3, 2020.
Schwab, K. (2008). The Global Competitiveness Report 2008. World Economic Forum. Retrieved from
http://www3.weforum.org/docs/WEF_GlobalCompetitivenessReport_2008-09.pdf on December 3, 2020.
Schwab, K. (2009). The Global Competitiveness Report 2009. World Economic Forum. Retrieved from
http://www3.weforum.org/docs/WEF_GlobalCompetitivenessReport_2009-10.pdf on December 3, 2020.
Schwab, K. (2010). The Global Competitiveness Report 2010. World Economic Forum. Retrieved from
http://www3.weforum.org/docs/WEF_GlobalCompetitivenessReport_2010-11.pdf on December 3, 2020.
Schwab, K. (2011). The Global Competitiveness Report 2011. World Economic Forum. Retrieved from
http://www3.weforum.org/docs/WEF_GCR_Report_2011-12.pdf on December 3, 2020.
Schwab, K. (2012). The Global Competitiveness Report 2012. World Economic Forum. Retrieved from
http://www3.weforum.org/docs/WEF_GlobalCompetitivenessReport_2012-13.pdf on December 3, 2020.
Schwab, K. (2013). The Global Competitiveness Report 2007. World Economic Forum. Retrieved from
http://www3.weforum.org/docs/WEF_GlobalCompetitivenessReport_2013-14.pdf on December 3, 2020.
Schwab, K. (2014). The Global Competitiveness Report 2007. World Economic Forum. Retrieved from
http://www3.weforum.org/docs/WEF_GlobalCompetitivenessReport_2014-15.pdf on December 3, 2020.
Schwab, K. (2015). The Global Competitiveness Report 2007. World Economic Forum. Retrieved from
https://www.weforum.org/reports/global-competitiveness-report-2015 on December 3, 2020.
Schwab, K. (2016). The Global Competitiveness Report 2007. World Economic Forum. Retrieved from
http://www3.weforum.org/docs/gcr/2015-2016/Global_Competitiveness_Report_2015-2016.pdf on De-
cember 3, 2020.
Schwab, K. (2017). The Global Competitiveness Report 2007. World Economic Forum. Retrieved from
http://www3.weforum.org/docs/GCR2016-2017/05FullReport/TheGlobalCompetitivenessReport2016-
2017_FINAL.pdf on December 3, 2020.
Schwab, K. (2018). The Global Competitiveness Report 2007. World Economic Forum. Retrieved from
http://www3.weforum.org/docs/GCR2018/05FullReport/TheGlobalCompetitivenessReport2018.pdf on De-
cember 3, 2020.
Sieja, M., & Wach, K. (2019). The Use of Evolutionary Algorithms for Optimization in the Modern Entrepreneurial
Economy: Interdisciplinary Perspective. Entrepreneurial Business and Economics Review, 7(4), 117-130.
https://doi.org/10.15678/EBER.2019.070407
Siudek, T., & Zawojska, A. (2014). Competitiveness in the economic concepts, theories and empirical research.
Oeconomia, 13(1), 91-108. Retrieved from http://www.oeconomia.actapol.net/pub/13_1_91.pdf on De-
cember 8, 2020.
Tongzon, J. (2007). Determinants of Competitiveness in Logistics: Implications for the ASEAN Region. Maritime Economics & Logistics, 9(1), 67-83. https://doi.org/10.1057/palgrave.mel.9100172
Tóth, B.L. (2019). The Visegrád Group and the railway development interest articulation in Central Eastern Eu-
rope. Eastern Journal of European Studies, 10(2), 175-195. Retrieved from https://ejes.uaic.ro/arti-
cles/EJES2019_1002_TOT.pdf on December 2, 2020.
Veres, L. (2015). Logistics strategies in the Visegrad countries: A comparative analysis (p. 213). Hungarian Logistics
Association Budapest. Retrieved from http://v4log.eu/download/V4STUDY-final.pdf on December 2, 2020.
Wang, M., Wang, Y., Liu, W., Ma, Y., Xiang, L., Yang, Y., & Li, X. (2021). How to achieve a win-win scenario between
cost and customer satisfaction for cold chain logistics? Physica A: Statistical Mechanics and its Applications,
566, 125637. http://doi.org/10.1016/j.physa.2020.125637
Włodarczyk, A., & Mesjasz-Lech, A. (2019). Development of Road Transport Logistic Infrastructure and Air Pollu-
tion in the Visegrad Group Countries. Journal of Economic and Social Development, 6(1), 93-103.
https://doi.org/10.26352/DJ02F5011

190 | Botond Kálmán, Arnold Tóth
Yildirim, B.F., & Adiguzel Mercangoz, B. (2020). Evaluating the logistics performance of OECD countries by using fuzzy
AHP and ARAS-G. Eurasian Economic Review, 10(1), 27-45. https://doi.org/10.1007/s40822-019-00131-3
Zhiwen, Z., Yujun, X., Junxing, L., Limin, G., & Long, W. (2020). Supply chain logistics information collaboration
strategy based on evolutionary game theory. IEEE Access, 8, 46102-46120. http://doi.org/10.1109/ac-
cess.2020.2978943
Authors
Contribution share of authors is equal and amounted to 50% for each of them.
Botond Kálmán
MSc degree in Financial Management at International Business School, University of Buckingham (UK), with
distinction. BA degree in International Business from the Budapest campus of Coventry University (UK), with
distinction. He currently works as a manager of a limited liability company. His principal areas of interest in-
clude workplace stress, logistics, and the relationship of tertiary education and competitiveness. He is contin-
uing his studies at PhD level.
Correspondence to: Mr. Botond Kálmán, Faculty of Law, Eötvös Loránd University 1-3 Egyetem tér, Budapest
H-1053, Hungary, e-mail: [email protected]
ORCID http://orcid.org/0000-0001-8031-8016
Arnold Tóth
Associate professor at Budapest Business School (Hungary), and he works at the Hungarian Academy of Sci-
ences. PhD on the financial returns of marketing communication at Corvinus University (Hungary). Graduated
from both engineering management and economics (2002). Thereafter, he taught at various universities in
Budapest such courses as economics, finance, investments and related subjects.
Correspondence to: Dr Arnold Tóth, Faculty of Finance and Accountancy, Budapest Business School Depart-
ment of Business Economics, 11-13 Buzogány u., Budapest 1149, Hungary, e-mail: [email protected]
ORCID http://orcid.org/0000-0003-0860-6405
Conflict of Interest
The authors declare that the research was conducted in the absence of any commercial or financial relation-
ships that could be construed as a potential conflict of interest.
Copyright and License
This article is published under the terms of the Creative Commons
Attribution – NoDerivs (CC BY-ND 4.0) License
http://creativecommons.org/licenses/by-nd/4.0/
Published by Cracow University of Economics – Krakow, Poland