Embed Size (px)
Citation preview
19
Lipid and Lipoprotein Abnormalities in Chronic Renal
Insufficiency: Review
Oliver Rácz1, Rudolf Gaško2 and Eleonóra Klímová3 1Šafárik University, Medical School, Košice
2Railway Hospital, Košice 3University of Prešov,
Faculty of Health Care, Prešov Slovak Republic
1. Introduction
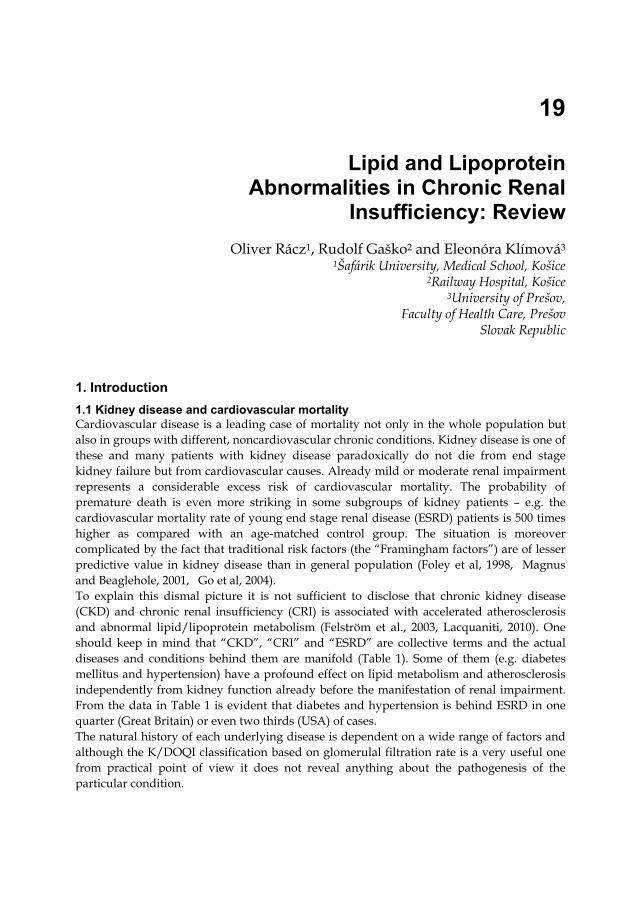
1.1 Kidney disease and cardiovascular mortality Cardiovascular disease is a leading case of mortality not only in the whole population but also in groups with different, noncardiovascular chronic conditions. Kidney disease is one of these and many patients with kidney disease paradoxically do not die from end stage kidney failure but from cardiovascular causes. Already mild or moderate renal impairment represents a considerable excess risk of cardiovascular mortality. The probability of premature death is even more striking in some subgroups of kidney patients – e.g. the cardiovascular mortality rate of young end stage renal disease (ESRD) patients is 500 times higher as compared with an age-matched control group. The situation is moreover complicated by the fact that traditional risk factors (the “Framingham factors”) are of lesser predictive value in kidney disease than in general population (Foley et al, 1998, Magnus and Beaglehole, 2001, Go et al, 2004). To explain this dismal picture it is not sufficient to disclose that chronic kidney disease (CKD) and chronic renal insufficiency (CRI) is associated with accelerated atherosclerosis and abnormal lipid/lipoprotein metabolism (Felström et al., 2003, Lacquaniti, 2010). One should keep in mind that “CKD”, “CRI” and “ESRD” are collective terms and the actual diseases and conditions behind them are manifold (Table 1). Some of them (e.g. diabetes mellitus and hypertension) have a profound effect on lipid metabolism and atherosclerosis independently from kidney function already before the manifestation of renal impairment. From the data in Table 1 is evident that diabetes and hypertension is behind ESRD in one quarter (Great Britain) or even two thirds (USA) of cases. The natural history of each underlying disease is dependent on a wide range of factors and although the K/DOQI classification based on glomerulal filtration rate is a very useful one from practical point of view it does not reveal anything about the pathogenesis of the particular condition.
Progress in Hemodialysis – From Emergent Biotechnology to Clinical Practice
350
Etiology of ESRD Great
Britain Australia USA Japan
Chronic glomerulonephritis 30% 30% 9% 47% Diabetic nephropathy 16% 22% 43% 31% Hypertension 12% 14% 26% 10% Chronic interstitial nephritis 8% 10% 2% 2% Polycystic degeneration 6% 6% 2% 2% Other/unkown 28% 18% 13% 8%
Table 1. Etiology of end stage renal disease in different regions of word. (According to Viklický, 2006)
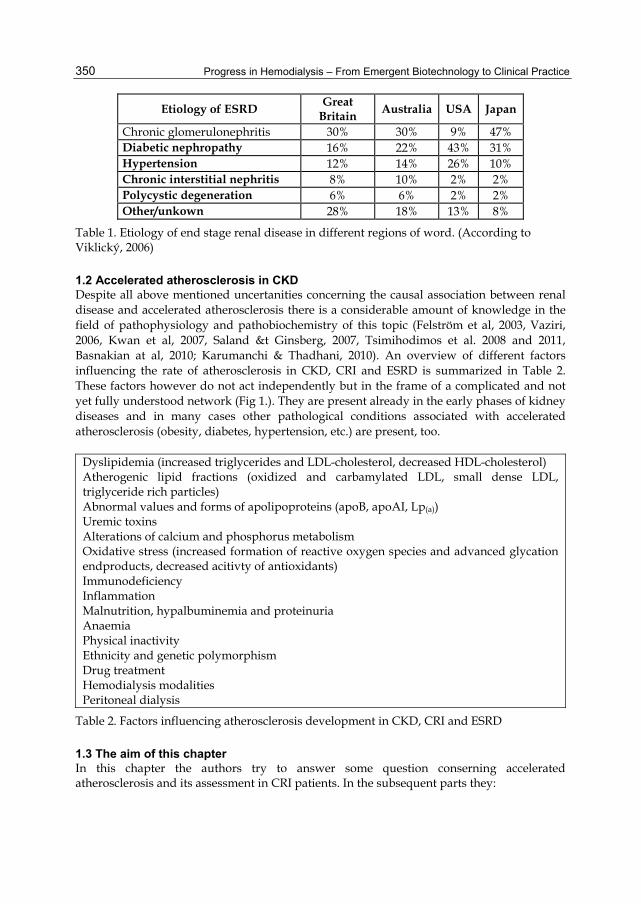
1.2 Accelerated atherosclerosis in CKD Despite all above mentioned uncertanities concerning the causal association between renal disease and accelerated atherosclerosis there is a considerable amount of knowledge in the field of pathophysiology and pathobiochemistry of this topic (Felström et al, 2003, Vaziri, 2006, Kwan et al, 2007, Saland &t Ginsberg, 2007, Tsimihodimos et al. 2008 and 2011, Basnakian at al, 2010; Karumanchi & Thadhani, 2010). An overview of different factors influencing the rate of atherosclerosis in CKD, CRI and ESRD is summarized in Table 2. These factors however do not act independently but in the frame of a complicated and not yet fully understood network (Fig 1.). They are present already in the early phases of kidney diseases and in many cases other pathological conditions associated with accelerated atherosclerosis (obesity, diabetes, hypertension, etc.) are present, too.
Dyslipidemia (increased triglycerides and LDL-cholesterol, decreased HDL-cholesterol) Atherogenic lipid fractions (oxidized and carbamylated LDL, small dense LDL, triglyceride rich particles) Abnormal values and forms of apolipoproteins (apoB, apoAI, Lp(a)) Uremic toxins Alterations of calcium and phosphorus metabolism Oxidative stress (increased formation of reactive oxygen species and advanced glycation endproducts, decreased acitivty of antioxidants) Immunodeficiency Inflammation Malnutrition, hypalbuminemia and proteinuria Anaemia Physical inactivity Ethnicity and genetic polymorphism Drug treatment Hemodialysis modalities Peritoneal dialysis
Table 2. Factors influencing atherosclerosis development in CKD, CRI and ESRD
1.3 The aim of this chapter In this chapter the authors try to answer some question conserning accelerated atherosclerosis and its assessment in CRI patients. In the subsequent parts they:
Lipid and Lipoprotein Abnormalities in Chronic Renal Insufficiency: Review
351
1. Describe and analyze the lipid and lipoprotein abnormalities in CRI, ESRD and HD. 2. Show the results of a metaanalysis dealing with methodological problems measuring
LDL-cholesterol in CRI, ESRD and HD patients and results from a study on analytical quality of LDL-cholesterol assessment in real word laboratories.
3. Give simple advice how to assess cardiovascular risk in CRI, ESRD and HD patients in everyday clinical practice.
Therapeutic attempts and possibilities to normalize the lipid abnormalities and decrease the high risk of cardiovascular events in CRI, ESRD and HD patients are not the topics of this chapter.
IMPAIRMENT OF KIDNEY FUNCTION
UREMIC TOXINSGENETICBACKGROUND
ETHNICITY
OTHER DISEASES, PATHOLOGICAL
CONDITIONS
ABNORMAL LIPID STATUS
ALTERED APOPROTEINS
DECREASED LIPOPROTEIN CATABOLISM
INFLAMMATIONIMMUNE DISORDER
ANAEMIAPROTEIN LOSS
OXIDATIVE STRESSGLYCATION
CARBAMYLATION
TREATMENTDIALYSIS
MODALITIES
ALTERATIONS IN Ca AND P
METABOLISM
ENDOTHELIAL DYSFUNCTIONACCELERATED ATHEROSCLEROSIS
CARDIOVASCULAR MORTALITY
Fig. 1. Factors responsible for abnormal lipid metabolism and accelerated atherosclerosis in kidney disease form a complicated and intertwined network
2. Lipid and lipoprotein abnormalities in kidney disease
2.1 Changes of routinely measured lipid parameters in CRI and HD The changes of two basic lipid parameters – the concentration of triglycerides (TG) and total cholesterol (TC) in different forms of renal disease are in Table 3. Increased triglyceride concentration is a general feature of kidney disease whereas increased cholesterol is not. Assesment the risk of atherosclerosis related morbidity from these two parameters is of course not possible because they do not reflect the real metabolic situation sufficiently. Lipids are insoluble in blood plasma and therefore they can circulate only in the form of lipoproteins. On the other side increased TG alone is an important warning sign of the presence of highly
Progress in Hemodialysis – From Emergent Biotechnology to Clinical Practice
352
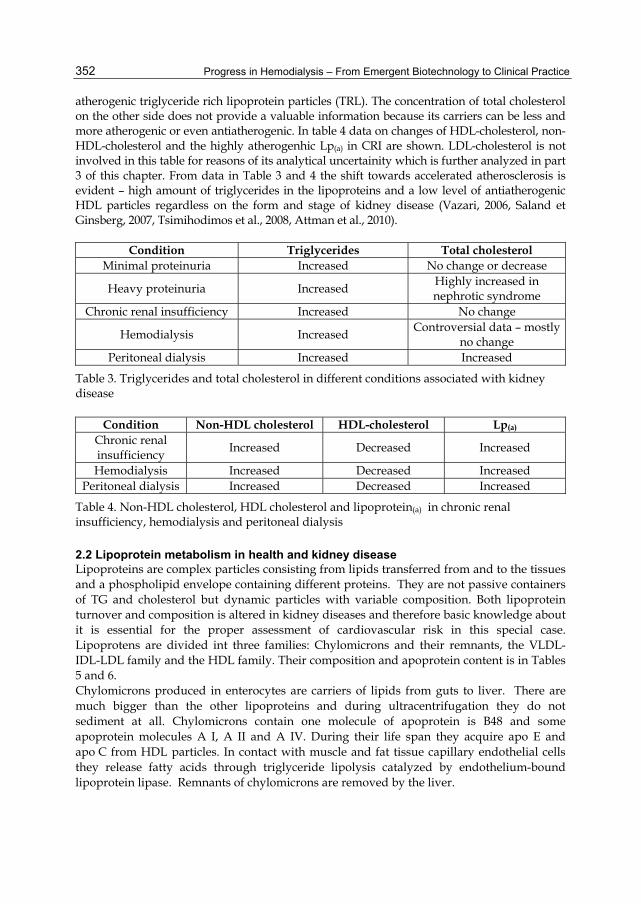
atherogenic triglyceride rich lipoprotein particles (TRL). The concentration of total cholesterol on the other side does not provide a valuable information because its carriers can be less and more atherogenic or even antiatherogenic. In table 4 data on changes of HDL-cholesterol, non-HDL-cholesterol and the highly atherogenhic Lp(a) in CRI are shown. LDL-cholesterol is not involved in this table for reasons of its analytical uncertainity which is further analyzed in part 3 of this chapter. From data in Table 3 and 4 the shift towards accelerated atherosclerosis is evident – high amount of triglycerides in the lipoproteins and a low level of antiatherogenic HDL particles regardless on the form and stage of kidney disease (Vazari, 2006, Saland et Ginsberg, 2007, Tsimihodimos et al., 2008, Attman et al., 2010).
Condition Triglycerides Total cholesterol Minimal proteinuria Increased No change or decrease
Heavy proteinuria Increased Highly increased in nephrotic syndrome
Chronic renal insufficiency Increased No change
Hemodialysis Increased Controversial data – mostly
no change Peritoneal dialysis Increased Increased
Table 3. Triglycerides and total cholesterol in different conditions associated with kidney disease
Condition Non-HDL cholesterol HDL-cholesterol Lp(a) Chronic renal insufficiency
Increased Decreased Increased
Hemodialysis Increased Decreased Increased Peritoneal dialysis Increased Decreased Increased
Table 4. Non-HDL cholesterol, HDL cholesterol and lipoprotein(a) in chronic renal insufficiency, hemodialysis and peritoneal dialysis
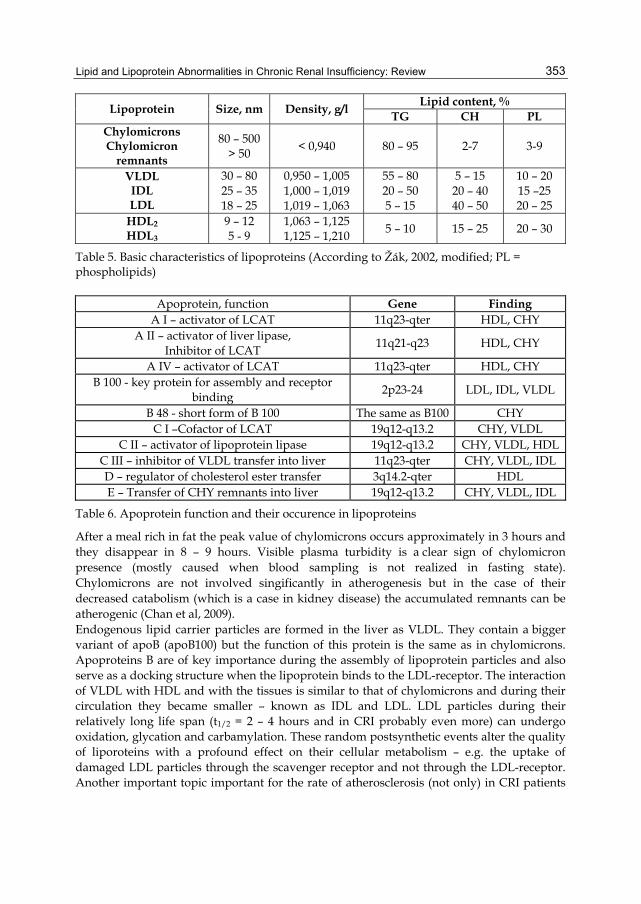
2.2 Lipoprotein metabolism in health and kidney disease Lipoproteins are complex particles consisting from lipids transferred from and to the tissues and a phospholipid envelope containing different proteins. They are not passive containers of TG and cholesterol but dynamic particles with variable composition. Both lipoprotein turnover and composition is altered in kidney diseases and therefore basic knowledge about it is essential for the proper assessment of cardiovascular risk in this special case. Lipoprotens are divided int three families: Chylomicrons and their remnants, the VLDL-IDL-LDL family and the HDL family. Their composition and apoprotein content is in Tables 5 and 6. Chylomicrons produced in enterocytes are carriers of lipids from guts to liver. There are much bigger than the other lipoproteins and during ultracentrifugation they do not sediment at all. Chylomicrons contain one molecule of apoprotein is B48 and some apoprotein molecules A I, A II and A IV. During their life span they acquire apo E and apo C from HDL particles. In contact with muscle and fat tissue capillary endothelial cells they release fatty acids through triglyceride lipolysis catalyzed by endothelium-bound lipoprotein lipase. Remnants of chylomicrons are removed by the liver.
Lipid and Lipoprotein Abnormalities in Chronic Renal Insufficiency: Review
353
Lipoprotein Size, nm Density, g/l Lipid content, %
TG CH PL Chylomicrons Chylomicron
remnants
80 – 500 > 50
< 0,940 80 – 95 2-7 3-9
VLDL IDL LDL
30 – 80 25 – 35 18 – 25
0,950 – 1,005 1,000 – 1,019 1,019 – 1,063
55 – 80 20 – 50 5 – 15
5 – 15 20 – 40 40 – 50
10 – 20 15 –25 20 – 25
HDL2 HDL3
9 – 12 5 - 9
1,063 – 1,125 1,125 – 1,210
5 – 10 15 – 25 20 – 30
Table 5. Basic characteristics of lipoproteins (According to Žák, 2002, modified; PL = phospholipids)
Apoprotein, function Gene Finding A I – activator of LCAT 11q23-qter HDL, CHY
A II – activator of liver lipase, Inhibitor of LCAT
11q21-q23 HDL, CHY
A IV – activator of LCAT 11q23-qter HDL, CHY B 100 - key protein for assembly and receptor
binding 2p23-24 LDL, IDL, VLDL
B 48 - short form of B 100 The same as B100 CHY C I –Cofactor of LCAT 19q12-q13.2 CHY, VLDL
C II – activator of lipoprotein lipase 19q12-q13.2 CHY, VLDL, HDL C III – inhibitor of VLDL transfer into liver 11q23-qter CHY, VLDL, IDL D – regulator of cholesterol ester transfer 3q14.2-qter HDL E – Transfer of CHY remnants into liver 19q12-q13.2 CHY, VLDL, IDL
Table 6. Apoprotein function and their occurence in lipoproteins
After a meal rich in fat the peak value of chylomicrons occurs approximately in 3 hours and they disappear in 8 – 9 hours. Visible plasma turbidity is a clear sign of chylomicron presence (mostly caused when blood sampling is not realized in fasting state). Chylomicrons are not involved singificantly in atherogenesis but in the case of their decreased catabolism (which is a case in kidney disease) the accumulated remnants can be atherogenic (Chan et al, 2009). Endogenous lipid carrier particles are formed in the liver as VLDL. They contain a bigger variant of apoB (apoB100) but the function of this protein is the same as in chylomicrons. Apoproteins B are of key importance during the assembly of lipoprotein particles and also serve as a docking structure when the lipoprotein binds to the LDL-receptor. The interaction of VLDL with HDL and with the tissues is similar to that of chylomicrons and during their circulation they became smaller – known as IDL and LDL. LDL particles during their relatively long life span (t1/2 = 2 – 4 hours and in CRI probably even more) can undergo oxidation, glycation and carbamylation. These random postsynthetic events alter the quality of liporoteins with a profound effect on their cellular metabolism – e.g. the uptake of damaged LDL particles through the scavenger receptor and not through the LDL-receptor. Another important topic important for the rate of atherosclerosis (not only) in CRI patients
Progress in Hemodialysis – From Emergent Biotechnology to Clinical Practice
354
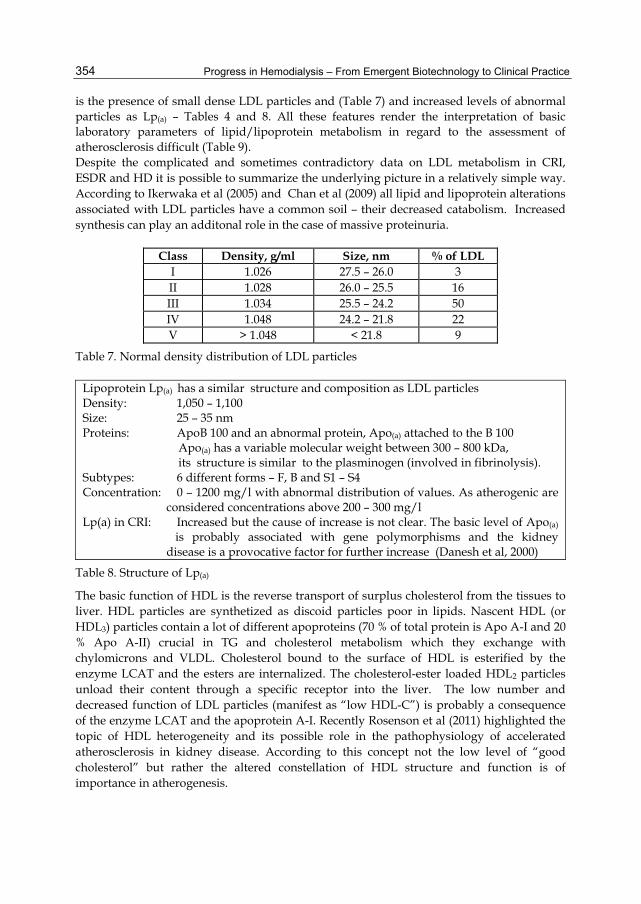
is the presence of small dense LDL particles and (Table 7) and increased levels of abnormal particles as Lp(a) – Tables 4 and 8. All these features render the interpretation of basic laboratory parameters of lipid/lipoprotein metabolism in regard to the assessment of atherosclerosis difficult (Table 9). Despite the complicated and sometimes contradictory data on LDL metabolism in CRI, ESDR and HD it is possible to summarize the underlying picture in a relatively simple way. According to Ikerwaka et al (2005) and Chan et al (2009) all lipid and lipoprotein alterations associated with LDL particles have a common soil – their decreased catabolism. Increased synthesis can play an additonal role in the case of massive proteinuria.
Class Density, g/ml Size, nm % of LDL I 1.026 27.5 – 26.0 3 II 1.028 26.0 – 25.5 16 III 1.034 25.5 – 24.2 50 IV 1.048 24.2 – 21.8 22 V > 1.048 < 21.8 9
Table 7. Normal density distribution of LDL particles
Lipoprotein Lp(a) has a similar structure and composition as LDL particles Density: 1,050 – 1,100 Size: 25 – 35 nm Proteins: ApoB 100 and an abnormal protein, Apo(a) attached to the B 100 Apo(a) has a variable molecular weight between 300 – 800 kDa, its structure is similar to the plasminogen (involved in fibrinolysis). Subtypes: 6 different forms – F, B and S1 – S4 Concentration: 0 – 1200 mg/l with abnormal distribution of values. As atherogenic are considered concentrations above 200 – 300 mg/l Lp(a) in CRI: Increased but the cause of increase is not clear. The basic level of Apo(a)
is probably associated with gene polymorphisms and the kidney disease is a provocative factor for further increase (Danesh et al, 2000)
Table 8. Structure of Lp(a)
The basic function of HDL is the reverse transport of surplus cholesterol from the tissues to liver. HDL particles are synthetized as discoid particles poor in lipids. Nascent HDL (or HDL3) particles contain a lot of different apoproteins (70 % of total protein is Apo A-I and 20 % Apo A-II) crucial in TG and cholesterol metabolism which they exchange with chylomicrons and VLDL. Cholesterol bound to the surface of HDL is esterified by the enzyme LCAT and the esters are internalized. The cholesterol-ester loaded HDL2 particles unload their content through a specific receptor into the liver. The low number and decreased function of LDL particles (manifest as “low HDL-C”) is probably a consequence of the enzyme LCAT and the apoprotein A-I. Recently Rosenson et al (2011) highlighted the topic of HDL heterogeneity and its possible role in the pathophysiology of accelerated atherosclerosis in kidney disease. According to this concept not the low level of “good cholesterol” but rather the altered constellation of HDL structure and function is of importance in atherogenesis.
Lipid and Lipoprotein Abnormalities in Chronic Renal Insufficiency: Review
355
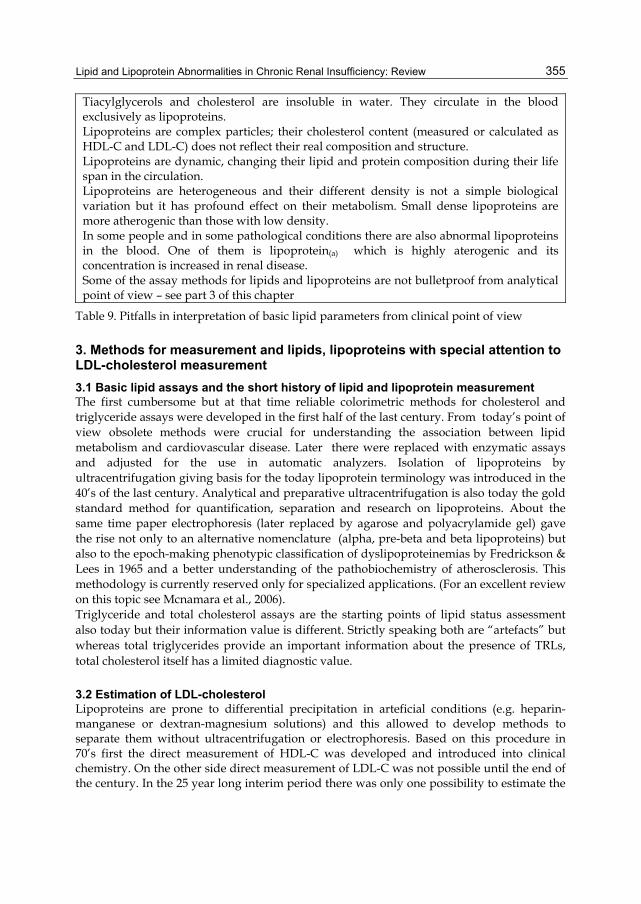
Tiacylglycerols and cholesterol are insoluble in water. They circulate in the blood exclusively as lipoproteins. Lipoproteins are complex particles; their cholesterol content (measured or calculated as HDL-C and LDL-C) does not reflect their real composition and structure. Lipoproteins are dynamic, changing their lipid and protein composition during their life span in the circulation. Lipoproteins are heterogeneous and their different density is not a simple biological variation but it has profound effect on their metabolism. Small dense lipoproteins are more atherogenic than those with low density. In some people and in some pathological conditions there are also abnormal lipoproteins in the blood. One of them is lipoprotein(a) which is highly aterogenic and its concentration is increased in renal disease. Some of the assay methods for lipids and lipoproteins are not bulletproof from analytical point of view – see part 3 of this chapter
Table 9. Pitfalls in interpretation of basic lipid parameters from clinical point of view
3. Methods for measurement and lipids, lipoproteins with special attention to LDL-cholesterol measurement
3.1 Basic lipid assays and the short history of lipid and lipoprotein measurement The first cumbersome but at that time reliable colorimetric methods for cholesterol and triglyceride assays were developed in the first half of the last century. From today’s point of view obsolete methods were crucial for understanding the association between lipid metabolism and cardiovascular disease. Later there were replaced with enzymatic assays and adjusted for the use in automatic analyzers. Isolation of lipoproteins by ultracentrifugation giving basis for the today lipoprotein terminology was introduced in the 40’s of the last century. Analytical and preparative ultracentrifugation is also today the gold standard method for quantification, separation and research on lipoproteins. About the same time paper electrophoresis (later replaced by agarose and polyacrylamide gel) gave the rise not only to an alternative nomenclature (alpha, pre-beta and beta lipoproteins) but also to the epoch-making phenotypic classification of dyslipoproteinemias by Fredrickson & Lees in 1965 and a better understanding of the pathobiochemistry of atherosclerosis. This methodology is currently reserved only for specialized applications. (For an excellent review on this topic see Mcnamara et al., 2006). Triglyceride and total cholesterol assays are the starting points of lipid status assessment also today but their information value is different. Strictly speaking both are “artefacts” but whereas total triglycerides provide an important information about the presence of TRLs, total cholesterol itself has a limited diagnostic value.
3.2 Estimation of LDL-cholesterol Lipoproteins are prone to differential precipitation in arteficial conditions (e.g. heparin-manganese or dextran-magnesium solutions) and this allowed to develop methods to separate them without ultracentrifugation or electrophoresis. Based on this procedure in 70’s first the direct measurement of HDL-C was developed and introduced into clinical chemistry. On the other side direct measurement of LDL-C was not possible until the end of the century. In the 25 year long interim period there was only one possibility to estimate the
Progress in Hemodialysis – From Emergent Biotechnology to Clinical Practice
356
concentration of LDL-C in everyday practice. It was the calculation according to Friedewald formula (Friedewald et al, 1972). The formula was based on the analysis of a large LDL database created in research laboratories using ultracentrifugation. It was however clear that a calculation from three (TC, TG, HDL-C) measured values with their own analytical uncertainity is only a recourse from necessity. The uncertainity of the currently employed 3rd generation methods is much lower than that of the Friedewald formula or the older methods but from strictly analytical point of view they are also not sufficient to obtain accurate results (Bairaktari et al., 2005). Another unsolved problem is that the assay methods from different providers are not yet harmonized at all (Fuentes-Arderiu et al, 2009, Miller et al, 2010).
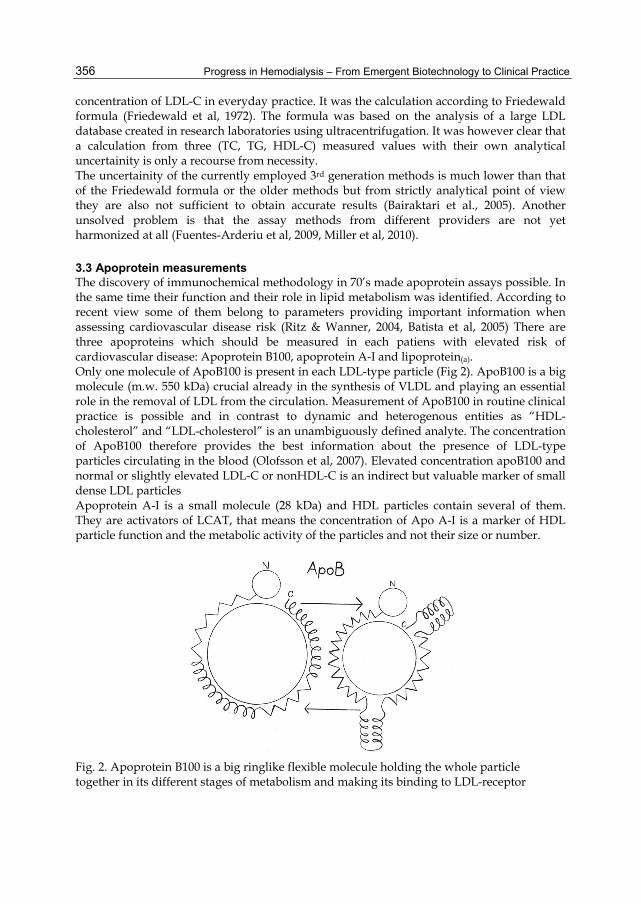
3.3 Apoprotein measurements The discovery of immunochemical methodology in 70’s made apoprotein assays possible. In the same time their function and their role in lipid metabolism was identified. According to recent view some of them belong to parameters providing important information when assessing cardiovascular disease risk (Ritz & Wanner, 2004, Batista et al, 2005) There are three apoproteins which should be measured in each patiens with elevated risk of cardiovascular disease: Apoprotein B100, apoprotein A-I and lipoprotein(a). Only one molecule of ApoB100 is present in each LDL-type particle (Fig 2). ApoB100 is a big molecule (m.w. 550 kDa) crucial already in the synthesis of VLDL and playing an essential role in the removal of LDL from the circulation. Measurement of ApoB100 in routine clinical practice is possible and in contrast to dynamic and heterogenous entities as “HDL-cholesterol” and “LDL-cholesterol” is an unambiguously defined analyte. The concentration of ApoB100 therefore provides the best information about the presence of LDL-type particles circulating in the blood (Olofsson et al, 2007). Elevated concentration apoB100 and normal or slightly elevated LDL-C or nonHDL-C is an indirect but valuable marker of small dense LDL particles Apoprotein A-I is a small molecule (28 kDa) and HDL particles contain several of them. They are activators of LCAT, that means the concentration of Apo A-I is a marker of HDL particle function and the metabolic activity of the particles and not their size or number.
Fig. 2. Apoprotein B100 is a big ringlike flexible molecule holding the whole particle together in its different stages of metabolism and making its binding to LDL-receptor
Lipid and Lipoprotein Abnormalities in Chronic Renal Insufficiency: Review
357
4. Analytical accuracy of LDL-C in kidney disease and hemodialysis
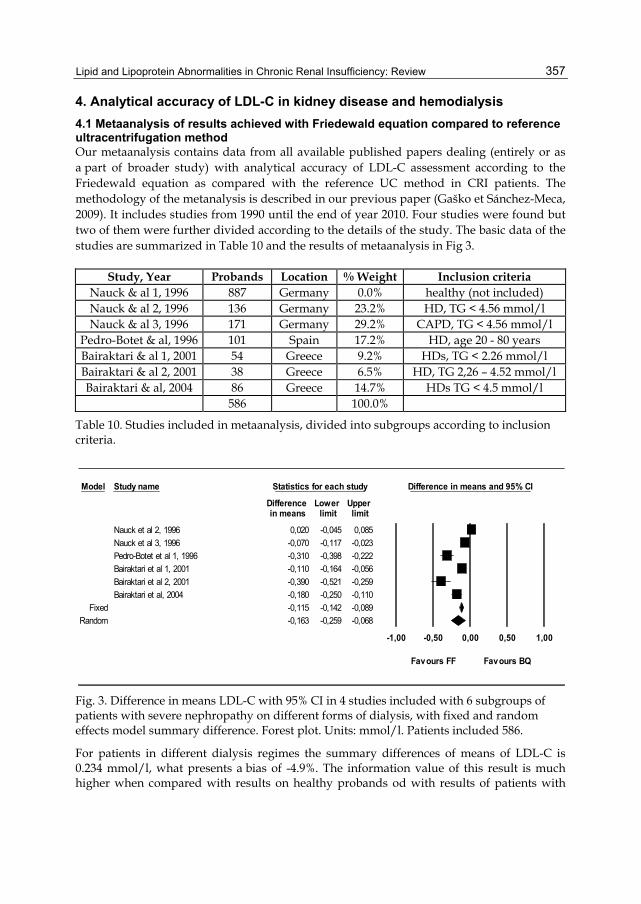
4.1 Metaanalysis of results achieved with Friedewald equation compared to reference ultracentrifugation method Our metaanalysis contains data from all available published papers dealing (entirely or as a part of broader study) with analytical accuracy of LDL-C assessment according to the Friedewald equation as compared with the reference UC method in CRI patients. The methodology of the metanalysis is described in our previous paper (Gaško et Sánchez-Meca, 2009). It includes studies from 1990 until the end of year 2010. Four studies were found but two of them were further divided according to the details of the study. The basic data of the studies are summarized in Table 10 and the results of metaanalysis in Fig 3.
Study, Year Probands Location % Weight Inclusion criteria Nauck & al 1, 1996 887 Germany 0.0% healthy (not included) Nauck & al 2, 1996 136 Germany 23.2% HD, TG < 4.56 mmol/l Nauck & al 3, 1996 171 Germany 29.2% CAPD, TG < 4.56 mmol/l
Pedro-Botet & al, 1996 101 Spain 17.2% HD, age 20 - 80 years Bairaktari & al 1, 2001 54 Greece 9.2% HDs, TG < 2.26 mmol/l Bairaktari & al 2, 2001 38 Greece 6.5% HD, TG 2,26 – 4.52 mmol/l Bairaktari & al, 2004 86 Greece 14.7% HDs TG < 4.5 mmol/l
586 100.0%
Table 10. Studies included in metaanalysis, divided into subgroups according to inclusion criteria.
Model Study name Statistics for each study Difference in means and 95% CI
Difference Lower Upper in means limit limit
Nauck et al 2, 1996 0,020 -0,045 0,085Nauck et al 3, 1996 -0,070 -0,117 -0,023Pedro-Botet et al 1, 1996 -0,310 -0,398 -0,222Bairaktari et al 1, 2001 -0,110 -0,164 -0,056Bairaktari et al 2, 2001 -0,390 -0,521 -0,259Bairaktari et al, 2004 -0,180 -0,250 -0,110
Fixed -0,115 -0,142 -0,089Random -0,163 -0,259 -0,068
-1,00 -0,50 0,00 0,50 1,00
Favours FF Favours BQ
Fig. 3. Difference in means LDL-C with 95% CI in 4 studies included with 6 subgroups of patients with severe nephropathy on different forms of dialysis, with fixed and random effects model summary difference. Forest plot. Units: mmol/l. Patients included 586.
For patients in different dialysis regimes the summary differences of means of LDL-C is 0.234 mmol/l, what presents a bias of -4.9%. The information value of this result is much higher when compared with results on healthy probands od with results of patients with
Progress in Hemodialysis – From Emergent Biotechnology to Clinical Practice
358
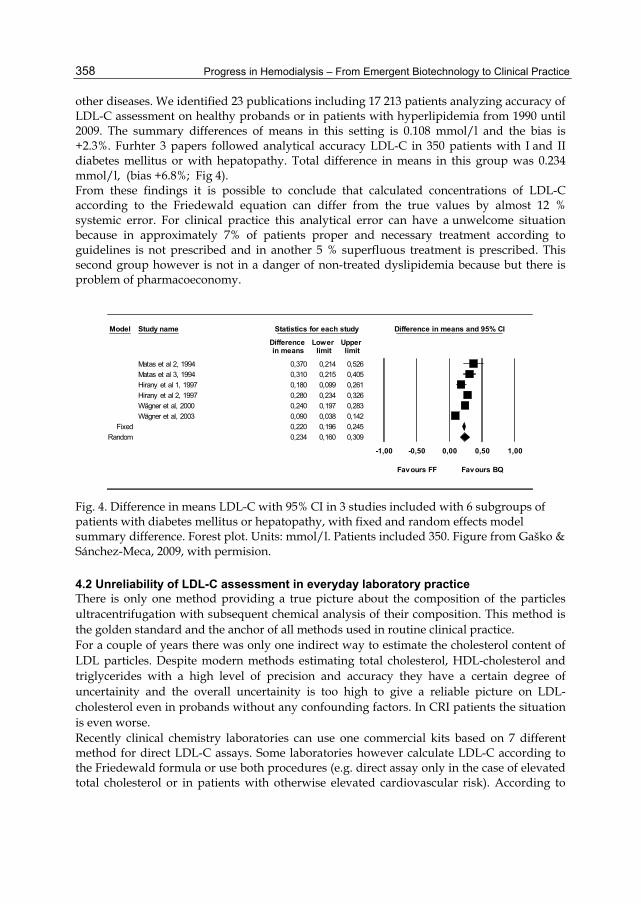
other diseases. We identified 23 publications including 17 213 patients analyzing accuracy of LDL-C assessment on healthy probands or in patients with hyperlipidemia from 1990 until 2009. The summary differences of means in this setting is 0.108 mmol/l and the bias is +2.3%. Furhter 3 papers followed analytical accuracy LDL-C in 350 patients with I and II diabetes mellitus or with hepatopathy. Total difference in means in this group was 0.234 mmol/l, (bias +6.8%; Fig 4). From these findings it is possible to conclude that calculated concentrations of LDL-C according to the Friedewald equation can differ from the true values by almost 12 % systemic error. For clinical practice this analytical error can have a unwelcome situation because in approximately 7% of patients proper and necessary treatment according to guidelines is not prescribed and in another 5 % superfluous treatment is prescribed. This second group however is not in a danger of non-treated dyslipidemia because but there is problem of pharmacoeconomy.
Model Study name Statistics for each study Difference in means and 95% CI
Difference Lower Upper in means limit limit
Matas et al 2, 1994 0,370 0,214 0,526Matas et al 3, 1994 0,310 0,215 0,405Hirany et al 1, 1997 0,180 0,099 0,261Hirany et al 2, 1997 0,280 0,234 0,326Wägner et al, 2000 0,240 0,197 0,283Wägner et al, 2003 0,090 0,038 0,142
Fixed 0,220 0,196 0,245Random 0,234 0,160 0,309
-1,00 -0,50 0,00 0,50 1,00
Favours FF Favours BQ
Fig. 4. Difference in means LDL-C with 95% CI in 3 studies included with 6 subgroups of patients with diabetes mellitus or hepatopathy, with fixed and random effects model summary difference. Forest plot. Units: mmol/l. Patients included 350. Figure from Gaško & Sánchez-Meca, 2009, with permision.
4.2 Unreliability of LDL-C assessment in everyday laboratory practice There is only one method providing a true picture about the composition of the particles ultracentrifugation with subsequent chemical analysis of their composition. This method is the golden standard and the anchor of all methods used in routine clinical practice. For a couple of years there was only one indirect way to estimate the cholesterol content of LDL particles. Despite modern methods estimating total cholesterol, HDL-cholesterol and triglycerides with a high level of precision and accuracy they have a certain degree of uncertainity and the overall uncertainity is too high to give a reliable picture on LDL-cholesterol even in probands without any confounding factors. In CRI patients the situation is even worse. Recently clinical chemistry laboratories can use one commercial kits based on 7 different method for direct LDL-C assays. Some laboratories however calculate LDL-C according to the Friedewald formula or use both procedures (e.g. direct assay only in the case of elevated total cholesterol or in patients with otherwise elevated cardiovascular risk). According to
Lipid and Lipoprotein Abnormalities in Chronic Renal Insufficiency: Review
359
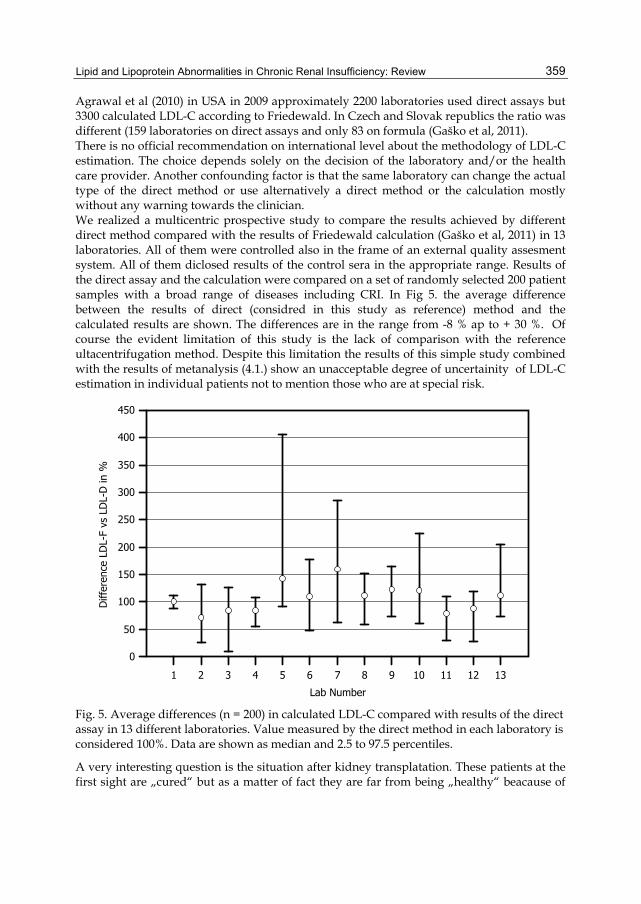
Agrawal et al (2010) in USA in 2009 approximately 2200 laboratories used direct assays but 3300 calculated LDL-C according to Friedewald. In Czech and Slovak republics the ratio was different (159 laboratories on direct assays and only 83 on formula (Gaško et al, 2011). There is no official recommendation on international level about the methodology of LDL-C estimation. The choice depends solely on the decision of the laboratory and/or the health care provider. Another confounding factor is that the same laboratory can change the actual type of the direct method or use alternatively a direct method or the calculation mostly without any warning towards the clinician. We realized a multicentric prospective study to compare the results achieved by different direct method compared with the results of Friedewald calculation (Gaško et al, 2011) in 13 laboratories. All of them were controlled also in the frame of an external quality assesment system. All of them diclosed results of the control sera in the appropriate range. Results of the direct assay and the calculation were compared on a set of randomly selected 200 patient samples with a broad range of diseases including CRI. In Fig 5. the average difference between the results of direct (considred in this study as reference) method and the calculated results are shown. The differences are in the range from -8 % ap to + 30 %. Of course the evident limitation of this study is the lack of comparison with the reference ultacentrifugation method. Despite this limitation the results of this simple study combined with the results of metanalysis (4.1.) show an unacceptable degree of uncertainity of LDL-C estimation in individual patients not to mention those who are at special risk.
0
50
100
150
200
250
300
350
400
450
Lab Number
Diff
eren
ce L
DL-
F vs
LD
L-D
in %
1 2 3 4 5 6 7 8 9 10 11 12 13
Fig. 5. Average differences (n = 200) in calculated LDL-C compared with results of the direct assay in 13 different laboratories. Value measured by the direct method in each laboratory is considered 100%. Data are shown as median and 2.5 to 97.5 percentiles.
A very interesting question is the situation after kidney transplatation. These patients at the first sight are „cured“ but as a matter of fact they are far from being „healthy“ beacause of
Progress in Hemodialysis – From Emergent Biotechnology to Clinical Practice
360
the long-life immunosuppression therapy and of the slightly decreased kidney function in most of them. Balal et al (2010) compared results from 103 renal transplant recipients and the sum of differences between the calculation according to Friedewaldovho and the direct method was – 6,5 % ± 6,6 % (mean ± SD). According to Tsimihodimos et al (2008) after transplantation one very important atherogenic factor disappears – the increased level of Lp(a).
5. Conclusions
5.1 Where we stand today? From our metaanalysis and the study on the unreliability of LDL-C estimation we conclude that the Friedewald formula seems to be no longer a viable test for appropriate targeted therapy in chronic renal failure and hemodialysis. Direct assays of LDL-C are not absolutely without error but they provide considerably more reliable results as a calculation from three measurements. Clinicians should be aware that despite our gradually better understanding of the pathobiochemistry, pathobiochemistry and genetic background of atherosclerosis and kidney disease laboratories are not able to provide full explanation about the situation in individual patients. According to McNamara et al (2006) “we are still only scratching the surface, and mich more research and discovery remains to fully understand these critically important particles”. As is depicted in Fig. 6 the scientist are looking on the different visible parts of the problem. The situation in clinical chemistry is even more problematic because the currently available methods are showing only the footprints of the real situation, not its essence.
Fig. 6. Scientist looking at miscellaneous aspects of the problem and a clinical chemist trying to gain some information from the footseps.
5.2 Conclusion In patients with CRI and/or ESRD, HD the pace of atherosclerosis development should be estimated as follows:
Lipid and Lipoprotein Abnormalities in Chronic Renal Insufficiency: Review
361
Proper clinical and biochemical evaluation of the underlying kidney disease and continuous monitoring of its progression. Special attenttion should be devoted to proteinuria and hypalbuminemia because they directly influence the metabolism of LDL-type particles and their concentration in the blood. Evaluation of the risk factors not directly associated with the kidney disease (smoking, obesity, diabetes, hypertension, etc.) Evaluation of lipid parameters – total cholesterol, LDL-cholesterol measured directly, HDL-cholesterol, triglycerides, apoprotein B100, apoporotein AI and Lp(a). The evaluation should not be a mechanistical process but should be based on pathophysiology of atherosclerosis in renal disease and should consider the strengths and weaknesses of the employed methods. Measurement of other parameters not fully validated yet from analytical point of view and from their clinical usefulness (small dense LDLs, parameters of the oxidative stress and antioxidant systems) is possible for research purposes.
6. List of abbreviations
C Cholesterol (as LDL-C, HDL-C, nonHDL-C) CHY Chylomicron CKD Chronic kidney disease CRI Chronic renal insufficiency ESRD End stage renal disease HD Hemodialysis HDL High-density lipoprotein IDL Intermediate-density lipoprotein LCAT Lecithin-cholesterol acyltransferase LDL Low-density lipoprotein TC Total cholesterol TG Triglyceride TRL Triglyceride rich particle VLDL Very low-density lipoprotein
7. References
Agrawal, M., Spencer, H.J., Fass, F.H. (2010) Method of LDL cholesterol measurement influences classification of LDL cholesterol treatment goals: Clinical research study. Journal of Investigative Medicine, Vol.58, No.8, pp. 945-949, ISSN 1081-5589
Attman, P.O., Samuelson, O. & Alaupovic P. (2011) The effect of decreasing renal function on lipoprotein profiles. Nephrol Dialysis Transplant doi:10.1093/ndt/gfq762, ISSN 1460 - 2385
Bairaktari, E., Tzallas, C., Kalientzidou, M. & al. (2004) Evaluation of alternative calculation methods for determining low-density lipoprotein cholesterol in hemodialysis patiens. Clinical Biochemistry, Vol.37, No.10, pp. 937-940, ISSN 0009-9120
Bairaktari, E., Elisaf, M., Tzallas, Ch. & al. (2001) Evaluation of five methods for determining low-density lipoprotein cholesterol (LDL-C) in hemodialysis patients. Clinical Biochemistry, Vol.34, No.8, pp. 593-602, ISSN 0009-9120
Progress in Hemodialysis – From Emergent Biotechnology to Clinical Practice
362
Balal, M., Paydas, S., Inal, T. & al. (2010) Validation of the Friedewald formula for the determination of low-density lipoprotein cholesterol in renal transplant recipients. Renal Failure, Vol.32, No. 4, pp. 455-458, ISSN 1525-6049
Basnakian, A.G., Shah, S.V. & Ok, E. (2010) Carbamylated LDL. Advances in Clinical Chemistry, Vol.51, pp. 25-52, ISSN 0065-2423
Batista MC, Welty FK, Diffenderfer MR et al (2004) Apolipoprotein A-I, B-100, and B-48 metabolism in subjects with chronic kidney disease, obesity and the metabolic syndrome. Metabolism Clin Exp Vol 53, No, 10, pp. 1255-1261, ISSN 1532 - 8600
Chan, D.T., Dogra, G.K., Irish A.B. et al (2009) Chronic kidney disease delays VLDL-apoB- 100 particle catabolism: potential role of apolipoprotein C-III. J Lipid Res Vol. 50, pp. 2524-2531, ISSN 1539 - 7262
Danesh, J., Collins, R. & Peto, R. (2000) Lipoprotein(a) and coronary heart disease: Meta-analysis of prospective studies. Circulation Vol. 102, pp. 1082-1085, ISSN 0009 - 7322
Felström, B.C., Holdaas, H. & Jardine, A.G. (2003) Why do we need a statin trial hemodialysis patiens? Kidney International, Vol. 63, No. S84, pp. S204–S206, ISSN 0085-2538
Foley, R.N., Parfrey, R.S., Sarmak M.J. (1998) Clinical epidemiology of cardiovascular disease in chronic renal disease. Am J Kidney Dis Vol. 32, pp. S112-S119, ISSN 0272-6386
Fredrickson, D.S. & Lees, R.S. (1965) A system for phenotyping hyperlipoproteinemias. Circulation Vol. 31, pp. 321-327, ISSN 0009-7322
Friedewald, W.T., Levy, R.I., Fredrickson, D.S. (1972) Estimation of the concentration of low- density lipoprotein cholesterol in plasma, without use of the preparative ultracentrifuge. Clin Chem Vol. 18, pp. 499–502, ISSN 0009-9147
Fuentes-Arderiu, X., Braga-Fernández, S., Freire-Campo, L. & al. (2009) Comparison of measurement uncertainties in direct plasma low-density lipoprotein cholesterol method of measurement and indirect estimation according to Friedewald equation. Accreditation and Quality Assurance, Vol.14, No.2, pp. 179-183, ISSN 1432 0517
Gaško, R. & Sánchez-Meca, J. (2009) LDL cholesterol: A critical assessment of analytical accuracy of Friedewald's formula. Meta-analysis. Kardiológia/Cardiology, Vol.18, No.5, pp. 244–255, ISSN 1210-0048
Gaško, R., Rácz, O., Jedličková, B. & al. (2011) Methods for measurement of LDL-cholesterol: a critical assessment of direct measurement versus calculation in the treatment goals by European guidelines (2007), a multicenter study. Cardiology Letters, ISSN 1210-0048, accepted
Go, A.S., Chertow, G.M., Fan, D. & al (2004) Chronic kidney disease and the risks of death, cardiovascular events, and hospitalization. N Engl J Med Vol. 351, pp. 1296-1305, ISSN 1533-4406
Ikewaki, K., Schaefer, J.R., Frischmann, M.E. et al (2005) Delayed in vivo catabolism of intermediate-density lipoprotein and low-density lipoprotein in hemodialysis patients as potential cause of premature atherosclerosis. Arteriosclerosis, Thrombosis & Vasc Biol Vol 25, pp. 2615-2622, ISSN 1079 - 5642
Karumanchi, S.A. & Thadhani, R. (2010) Kidney complications: Why don´t statins always work? Nature Medicine, Vol.16, pp. 38-40, ISSN 1546-170X
Lipid and Lipoprotein Abnormalities in Chronic Renal Insufficiency: Review
363
Kwan, B.C.H., Kronenberg, F., Beddhu, S. & Cheing, A.K. (2007) Lipoprotein Metabolism and Lipid Management in Chronic Kidney Disease. Journal of the American Society of Nephrology, Vol.18, No.4, pp. 1246-1261, ISSN 1533-3450
Lacquaniti, A., Bolignano, D., Donato, V. & al. (2010) Alterations of lipid metabolism in chronic nephropathies: Mechanisms, diagnosis and treatment. Kidney&Blood Pressure Research, Vol.33, pp. 100-110. ISSN 1420-4096
Magnus, P. & Beaglehole, R. (2001) The real contribution of the major risk factors to the coronary factors to the coronary epidemics: time to end the “only 50%” myth. Arch Intern Med Vol. 161, pp. 2657-2669, ISSN 1538-3679
McNamara, J.R., Warnick, G.R & Cooper, G.R. (2006) A brief hisstory of lipid and lipoprotein measurements and their contribution to clinical chemistry. Clin Chim Acta 369, No 2, pp. 158-167, ISSN 0009-8981
Miller, W.G., Myers, G.L., Sakurabayashi, I. & al. (2010) Seven direct methods for measuring HDL and LDL cholesterol compared with ultracentrifugation. Reference measurement procedures. Clin Chem Vol. 56, pp. 1007-1014, ISSN 0065-2423
Nauck, M., Kramer-Guth, A., Bartens, W. & al. (1996) Is the determination of LDL cholesterol according to Friedewald accurate in CAPD and HD patients? Clinical Nephrology, Vol.46, No.3, pp. 319-325, ISSN 0301-0430
Olofsson, S.E., Wiklund, O. & Borén, J (2007) Apolipoproteins A-I and B: biosynthesis, role in the development of atherosclerosis and targets for intervention against cardiovascular disease. Vasc Health Risk Manag Vol. 3, pp. 491 – 503, ISSN 1178-2048
Pedro-Botet, J., Sentí, M., Rubiés-Prat, J. & al. (1996) When to treat dyslipidaemia of patients with chronic renal failure on haemodialysis ? A need to define specific guidelines. Nephrology Dialysis Transplantation, Vol.11, No.2, pp. 308-313, ISSN 1460-2385
Rosenson, R.S., Brewer, H.B., Chapman, M.J. et al (2011) HDL measures, particle heterogeneity, proposed nomenclature, and relation to atherosclerotic cardiovascular events. Clin Chem Vol. 57, No 1, pp. 392-410, ISSN ISSN 1530 - 8561
Ritz, E. & Wanner, C. (2008) Lipid abnormalities and cardiovascular risk in renal disease. J Am Soc Nephrol Vol 18, pp. 1065-1070, ISSN 1533 - 3450
Saland, J.M. & Ginsberg H.N. (2007) Lipoprotein metabolism in chronic renal insufficiency. Pediatr Nephrol Vol 22, pp. 1095-1112, ISSN 1432-198X
SHARP Collaborative Group. (2010) Study of Heart and Renal Protection (SHARP): Randomized trial to assess the effects of lowering low-density lipoprotein cholesterol among 9,438 patients with chronic kidney disease. American Hearth Journal, Vol.160, No.5, pp. 785-794, ISSN 1097-6744
Viklický O. (2006) Chronické selhání ledvin a uremický syndrom. In: Tesař, V. Schück, O. (Eds) Klinická nefrologie. Grada Publishing Praha pp. 477-511 ISBN 80-247-0503-6
Tsimihodimos, V., Dounousi, E., Siamopoulos, K.C. (2008) Dyslipidemia in chronic kidney disease: An approach to pathogenesis and treatment. Am J Nephrol Vol. 28, pp. 958-973, ISSN 1421-9670
Tsimihodimos, V., Mitrogianni Z., Elisaf M. (2011) Dyslipidemia associated with chronic kidney disease. Open Cardiovasc Med J Vol. 5, pp. 41-49, ISSN 1874-1924
Vaziri, N.D. (2006) Dyslipidemia of chronic renal failure: the nature, mechanisms, and potential consequences. Am J Physiol Renal Physiol Vol. 290, pp. F262-F272, ISSN 1522-1466

Progress in Hemodialysis – From Emergent Biotechnology to Clinical Practice
364
Žák, A. (2002) Poruchy metabolismu lipidů a lipoproteinů. In: Zima T (Ed.) Laboratorní diagnostika. Galén Praha pp. 125-153 ISBN 80-7262-201-3