Embed Size (px)
Citation preview

i
Lipids and metabolites detected by magnetic resonance
spectroscopy as biomarkers in nervous system tumour cell lines
Xiaoyan Pan
A thesis submitted to The University of Birmingham for the degree of DOCTOR OF PHILOSOPHY
School of Cancer Science
College of Medical and Dental Sciences
The University of Birmingham
2012JUL

University of Birmingham Research Archive
e-theses repository This unpublished thesis/dissertation is copyright of the author and/or third parties. The intellectual property rights of the author or third parties in respect of this work are as defined by The Copyright Designs and Patents Act 1988 or as modified by any successor legislation. Any use made of information contained in this thesis/dissertation must be in accordance with that legislation and must be properly acknowledged. Further distribution or reproduction in any format is prohibited without the permission of the copyright holder.

ii
Abstract Introduction
Nuclear magnetic resonance spectroscopy (NMR) resonances from lipids and
metabolites in tumours are associated with tumour grade and treatment response. The
origin of NMR lipid signal is mainly considered to be cytoplasmic lipid droplets (LDs).
The aim of this study is to investigate the lipid species of LDs in nervous system
tumour cells and identify potential lipidic or metabolic markers in treatment response.
Methods
Density-gradient ultracentrifugation was performed on homogenised cells to isolate
LDs. Staining and microscopy were used to characterize LDs. NMR was performed on
whole cells, isolated LDs and their extracts. Cisplatin exposure was used to induce cell
death.
Results
NMR spectroscopic analysis revealed that the LDs contain phosphatidylcholine,
cholesterol and cholesterol ester with saturated, mono-unsaturated and polyunsaturated
fatty acid species. Both saturated and unsaturated lipids are accumulated into LDs in
cancer cell death. It is shown that Uridine diphosphate N-acetylglucosamine (UDP-
GlcNAc) and Uridine diphosphate N-acetylglucosamine galactosamine (UDP-GalNAc),
the main donors of glycosylation, in parallel with 1H NMR detected lipids, increased in
apoptotic cancer cells.
Conclusion
LDs in nervous system cancer cell lines contain specific lipid species. To the best of
our knowledge, it is the first study mechanistically links UDP-GlcNAc and UDP-
GalNAc to cancer cell death.

iii
Declaration
I confirm that this work is my own and that I have been involved in the design and
conduct of this study, analysis of data and preparation of this thesis. The following
aspects of this study were undertaken as part of collaboration:
1. Dr. Martin Wilson set up and validated the pulse sequence for NMR experiments.
2. Dr. Martin Wilson and Dr. Greg Reynolds developed the TARQUIN algorithm and
Martin analysed the data using this algorithm.
3. Mass spectrometry and the following spectra analysis was performed by Dr. Julian
Griffith, Department of Biochemistry, University of Cambridge
4. Mr Paul Stewart, manager of the Centre for Electron Microscopy, performed the
negative staining and transmitted electron microscopy on isolated lipid droplets.

iv
Acknowledgements First of all, I would like to thank my leading supervisor Dr Andrew Peet for creating
the opportunity of my study in UK. I am deeply grateful for his invaluable guidance
and for his consistent encouragement during the past three years. Without his offering
and guidance in this research, I would not be able to finish my study.
I would like to thank my co-supervisors, Dr Martin Wilson for his continued support
and inspiration, Dr Carmel McConville for her patience and guidance in experimental
techniques and data analysis and Dr Theodoros Arvanitis for his guidance and
encouragement during my study.
Many thanks to Professor Risto Kauppinen for his input in my PhD study.
I would also like to thank all the members in our brain tumour research group, James
Davison, Yu Sun, Eleni Orphanidou, Simrandip Gill, Nigle Davies and Rachel
Grazier. It has been a great pleasure to work with them.
I am very appreciative of the staff in Henry-Wellcome Building, Sara Whittaker,
Christian Ludwig and Susan Rhodes, for their assistance with NMR experiments.
School of Cancer Sciences is a great place to study and work. I thank Dr Roger Grand
for his help with ultracentrifuge and Dr Sally Robert for her support in microscopy. I
thank all the members for their friendship and help.
v
I wish to express my gratitude to the Andrew McCartney Trust Fund, Mr Charles
Grant and Mrs Olga Grant for their support to my study.
I would especially like to thank my family. Thanks go to my parents who have
supported me all my life, my husband who has contributed and sacrificed much for
me to accomplish this thesis and a great couple who have supported me all along.
Conference abstracts based on this work
Oral presentation: 2009 18th ISMRM British symposium for post-doc and phD, London Liquid-state 1H NMR spectroscopy detects differences in the metabolic profiles of four high grade nervous system tumours. X Pan, M. Wilson, C. McConville, T. N. Arvanitis, J. Griffin, R. A. Kauppinen and A. C. Peet 2010 16th BC-ISMRM, Nottingham The size of cytoplasmic lipid droplets is a critical factor to the visibility of NMR lipid signal. X Pan, M. Wilson, C. McConville, T. N. Arvanitis, J.L Griffin, R. A. Kauppinen and A. C. Peet (Abstract No: O31) 2011 19th ISMBM, Montreal Canada An in vitro metabonomic study detects increases in UDP-GlcNAc and UDP-GalNAc, as early phase markers of cisplatin treatment response in brain tumour cells. X Pan, M Wilson, C McConville, T. N. Arvanitis, J.L Griffin, R. A. Kauppinen and A. C. Peet (Abstract No: 252) 2011 20th ISMRM British symposium for post-doc and phD, Cambridge The lipid composition of lipid droplets is different from the whole cell lipid pool in brain and nervous system tumour cells. X Pan, M. Wilson, C. McConville, T. N. Arvanitis, J.L Griffin, R. A. Kauppinen and A. C. Peet (Abstract No: O22) Poster presentation: 2010 14th ISPNO, Vienne Cytoplasmic lipid droplets - a novel indicator of tumour type and potential theraputic target in childhood brain and nervous system tumours. X Pan, M. Wilson, C. McConville, T. N. Arvanitis, J.L Griffin, R. A. Kauppinen and A. C. Peet (Abstract No: P-BIO.11) 2010 18th ISMRM, Stockholm. 1H NMR spectroscopy analysis of isolated intracellular lipid droplets from a human cancer cell line, BE(2)M17. X Pan, M. Wilson, C. McConville, T. N. Arvanitis, J.L Griffin, R. A. Kauppinen and A. C. Peet (Abstract N0: 3360)
vi
2011 19th ISMBM, Montreal Canada The alteration of the lipids in cytoplasmic lipid droplets after cisplatin treatment in human brain tumour cells. X Pan, M Wilson, C McConville, T. N. Arvanitis, J.L Griffin, R. A. Kauppinen and A. C. Peet (Abstract No:4262) 2011 17th British Chapter of ISMRM, Manchester, UK 1H NMR demonstrates that oleic acid (18:1) and linoleic acid (18:2) accumulate during cell death in human Primitive Neuroectodermal Tumour cells. X Pan, M Wilson, C, McConivelle, T. N. Arvanitis, J. L. Griffin, R. A. Kauppinen and A. C. Peet Journal papers based on this work
2011 An in vitro metabonomic study detects increases in UDP-GlcNAc and UDP-GalNAc, as early phase markers of cisplatin treatment response in brain tumour cells, X. Pan, M. Wilson, L. Mirbahai, C. McConville, T. N. Arvanitis, J.L. Griffin, R. A. Kauppinen and and A.C. Peet, Journal of Proteome Research 2012 The lipid composition of isolated cytoplasmic lipid droplets from a human cancer cell line, BE(2)M17. Xiaoyan Pan, Martin Wilson, Carmel McConville, Marie-Anne Brundlerc, Theodoros N. Arvanitis, John P. Shockcor, Julian L. Griffin, Risto A. Kauppinen and Andrew C. Peet , Molecular Biosystems 2012 The size of cytoplasmic lipid droplets varies between tumour cell lines of the nervous system and can be probed by the 1H NMR lipid signal. Xiaoyan Pan, Martin Wilson, Carmel McConville, Theodoros N Arvanitis, Risto A Kauppinen and Andrew C Peet Magnetic Resonance Materials in Physics, Biology and Medicine 2012 Increased unsaturation of lipids in cytoplasmic lipid droplets in DAOY brain cancer cells in response to cisplatin treatment Xiaoyan Pan, Martin Wilson, Carmel McConville, Theodoros N Arvanitis, Risto A Kauppinen and Andrew C Peet Metabolomics 2013 Cytoplasmic lipid droplets in nervous system tumour cell lines: Size and lipid species as analysed by 1H nuclear magnetic resonance spectroscopy Xiaoyan Pan, Martin Wilson, Carmel McConville, Theodoros N. Arvanitis Risto A. Kauppinen and Andrew C. Peet BSI DOI 10.3233/BSI-130035

vii
Table of contents
Chapter 1 General introduction to lipids and metabolites ............................................................... 1 1.1 Lipids and Lipidomics ............................................................................................................... 2 1.2 Categories of lipids ................................................................................................................... 2
1.2.1 Fatty acyls ......................................................................................................................... 3 1.2.2 Glycerophospholipids ....................................................................................................... 5 1.2.3 Sterol lipids ....................................................................................................................... 6 1.2.4 Sphingolipids .................................................................................................................... 7
1.3 Lipid composition in normal human brain ................................................................................ 7 1.4 Lipids in cancer ......................................................................................................................... 8
1.4.1 Lipids in cancer cell lines ................................................................................................. 9 1.4.2 Lipids in human brain tumours ......................................................................................... 9
1.4.2.1 Variation of lipids in brain tumours ....................................................................... 10 1.4.3 Lipids in cancer therapy .................................................................................................. 10
1.5 Methods for detecting lipids in biological systems .................................................................. 11 1.5.1 NMR detection of lipids ................................................................................................. 11 1.5.2 Mass Spectrometry ......................................................................................................... 12 1.5.3 Extraction of lipids from cells ........................................................................................ 12 1.5.4 Lipid staining .................................................................................................................. 12
1.6 Metabolites and Metabonomics ............................................................................................... 14
Chapter 2 Detection of lipids and metabolites by nuclear magnetic resonance
spectroscopy ........................................................................................................................................ 15 2.1 An introduction to nuclear magnetic resonance spectroscopy ................................................ 16 2.2 NMR detection of lipids and metabolites ................................................................................. 18
2.2.1 In vivo MRS .................................................................................................................... 18 2.2.2 In vitro NMR for cancer specimen ................................................................................. 18 2.2.3 NMR spectral assignment ............................................................................................... 20 2.2.4 HSQC to assign lipid species and metabolites ................................................................ 21 2.2.5 Total Correlation Spectroscopy (TOCSY) ..................................................................... 22
Chapter 3 NMR detectable lipids and metabolites .......................................................................... 24 3.1 NMR detectable lipids ............................................................................................................. 25
3.1.1 Clinical applications ....................................................................................................... 25 3.1.1.1 Diagnostic use ........................................................................................................ 25 3.1.1.2 Prognostic use and treatment monitoring ............................................................... 26
3.1.2 NMR lipid signal in cancer research............................................................................... 26 3.2 Origin of NMR lipid signal ...................................................................................................... 27
3.2.1 Mobile and immobile lipids ............................................................................................ 29 3.3 NMR detectable metabolites .................................................................................................... 30
3.3.1 In vivo MRS metabolite signal ....................................................................................... 30 3.3.2 In vitro NMR metabolite signal ...................................................................................... 30 3.3.3 NMR in metabonomic studies ........................................................................................ 31
3.4 NMR spectroscopy in biomarker identification ....................................................................... 31 3.5 The Lipid droplet ..................................................................................................................... 32
3.5.1 Structure .......................................................................................................................... 32 3.5.1.1 Lipoproteins and lipid droplets ............................................................................. 33
viii
3.5.1.2 Lipid rafts and lipid droplets .................................................................................. 34 3.5.2 Formation of lipid droplets ............................................................................................. 35 3.5.3 Biological function of lipid droplets ............................................................................... 37
3.5.3.1 Lipid storage .......................................................................................................... 37 3.5.3.2 Interaction with other organelles ............................................................................ 38 3.5.3.3 Cellular signalling .................................................................................................. 39
3.5.4 Lipid droplets in tumours................................................................................................ 39 3.5.5 Lipid droplet alterations with cancer treatment .............................................................. 40 3.5.6 Microtubular system in cytoplasm .................................................................................. 41 3.5.7 Isolation of lipid droplets from cell lines ........................................................................ 42
3.6 Aims and objectives ................................................................................................................. 43
Chapter 4 Materials and methods ..................................................................................................... 46 4.1 Nervous system tumour cells ................................................................................................... 47
4.1.1 Cell culture ..................................................................................................................... 47 4.1.2 Cell counting ................................................................................................................... 48 4.1.3 Cisplatin treatment of cancer cell lines ........................................................................... 48 4.1.4 Cell harvest ..................................................................................................................... 49
4.1.4.1 Cell pellets for isolation, extraction and NMR investigation ................................. 49 4.1.4.2 Cell suspension for staining ................................................................................... 49
4.2 Lipid droplets visualization ..................................................................................................... 49 4.2.1 Slides preparation ........................................................................................................... 50 4.2.2 Fluorescent microscopy .................................................................................................. 50
4.2.2.1 Nile red staining ..................................................................................................... 50 4.2.2.2 Observation and fluorescent image capture ........................................................... 50
4.2.3 Light microscopy ............................................................................................................ 51 4.2.3.1 Oil red O staining ................................................................................................... 51
4.2.4 Transmission electron microscopy (TEM) ..................................................................... 51 4.2.4.1 Negative staining ................................................................................................... 51 4.2.4.2 TEM observation and image capture ..................................................................... 51
4.2.5 Post-processing for stained LD images .......................................................................... 51 4.3 Lipid droplets isolation ........................................................................................................... 52
4.3.1 Homogenous preparation ................................................................................................ 53 4.3.2 Sucrose-gradient ultracentrifuge ..................................................................................... 53
4.4 Gel electrophoresis of extracted protein from different fractions after isolation ................... 53 4.4.1 Protein extraction and measurement of concentration .................................................... 54 4.4.2 Measurement of total protein concentration ................................................................... 54 4.4.3 SDS-PAGE gel electrophoresis ...................................................................................... 55 4.4.4 Coomassie blue staining ................................................................................................. 55
4.5 Lipid and metabolite extraction from cell pellets and isolated fraction .................................. 56 4.5.1 Homogenate preparation in methanol and deionised water ............................................ 56 4.5.2 Partition of sonicated homogenate on ice ....................................................................... 56 4.5.3 Vacuum centrifugation ................................................................................................... 56
4.6 Cell Viability assessment ......................................................................................................... 57 4.6.1 Alamar blue assay ........................................................................................................... 57
4.6.1.1 Cell growth curve ................................................................................................... 57 4.6.1.2 Cisplatin treatment and cell incubation .................................................................. 58 4.6.1.3 Fluorescence measurement and calculation ........................................................... 58
4.6.2 DAPI staining ................................................................................................................. 59 4.6.3 RNA fragmentation ........................................................................................................ 59
4.6.3.1 RNA extraction ...................................................................................................... 59
ix
4.6.3.2 Agarose gel electrophoresis ................................................................................... 59 4.7 Nuclear Magnetic Resonance .................................................................................................. 60
4.7.1 Sample preparation for liquid state 1H NMR .................................................................. 60 4.7.2 Sample preparation for HR-MAS ................................................................................... 60 4.7.3 Performing NMR spectroscopy ...................................................................................... 60
4.7.3.1 Liquid-state 1H NMR with HCN probe ................................................................. 61 4.7.3.2 HR-MAS ................................................................................................................ 62 4.7.3.3 HSQC (1H and 13C) ................................................................................................ 62 4.7.3.4 TOCSY .................................................................................................................. 63
4.7.4 Spectra post-process and analysis ................................................................................... 63 4.7.4.1 Totally Automatic Robust Quantitation in NMR (TARQUIN) ............................. 64 4.7.4.2 wxNUTS software ................................................................................................. 64 4.7.4.3 Spectral analysis with R ......................................................................................... 65
4.8 Characterization of lipid species in isolated LDs by mass spectrometry ................................ 66 4.9 Statistical tests ......................................................................................................................... 67
Chapter 5 The lipid composition of isolated cytoplasmic lipid droplets from a human
cancer cell line, BE(2)M17 ................................................................................................................. 68 5.1 Introduction ............................................................................................................................. 69 5.2 Methods ................................................................................................................................... 70 5.3 Results ..................................................................................................................................... 71
5.3.1 LDs from BE(2)M17 cells .............................................................................................. 71 5.3.2 1H NMR spectra of lipids ............................................................................................... 74 5.3.3 HSQC spectra of extracted lipids ................................................................................... 78 5.3.4 Characterization of isolated LDs by mass spectrometry................................................. 79
5.4 Discussion ............................................................................................................................... 82 5.5 Conclusion ............................................................................................................................... 86
Chapter 6 The size of cytoplasmic lipid droplets varies between tumour cell lines of the
nervous system .................................................................................................................................... 87 6.1 Introduction ............................................................................................................................. 88 6.2 Methods ................................................................................................................................... 89 6.3 Results ..................................................................................................................................... 90
6.3.1 Size of LDs ..................................................................................................................... 90 6.3.2 1H NMR lipid signal ....................................................................................................... 94 6.3.3 Correlation between LD size and NMR lipid signal intensity ....................................... 95
6.4 Discussion ............................................................................................................................... 99 6.4.1 Variations of LDs in five cell lines ................................................................................. 99 6.4.2 NMR detection of LDs ................................................................................................... 99
6.5 Conclusion ............................................................................................................................. 101
Chapter 7 Lipids in cytoplasmic lipid droplets and whole cells in nervous system tumour
cell lines ............................................................................................................................................. 102 7.1 Introduction ........................................................................................................................... 103 7.2 Methods ................................................................................................................................. 104 7.3 Results ................................................................................................................................... 105
7.3.1 Isolation of LDs ........................................................................................................... 105
x
7.3.2 Lipid composition analysis ........................................................................................... 108 7.4 Discussion ............................................................................................................................. 113 7.5 Conclusion ............................................................................................................................. 116
Chapter 8 An increase in unsaturated lipids of cytoplasmic lipid droplets in DAOY
cells responding to cisplatin treatment ........................................................................................... 117 8.1 Introduction ........................................................................................................................... 118 8.2 Methods ................................................................................................................................. 119 8.3 Results ................................................................................................................................... 120
8.3.1 Survival with cisplatin treatment .................................................................................. 120 8.3.2 Lipid droplet accumulation with cell death .................................................................. 120 8.3.3 Validation of isolation .................................................................................................. 122 8.3.4 NMR Lipid signal ......................................................................................................... 123 8.3.5 Lipid composition analysis ........................................................................................... 129 8.3.6 HSQC............................................................................................................................ 131
8.4 Discussion ............................................................................................................................. 133 8.4.1 Cell death and LD accumulation .................................................................................. 133 8.4.2 1H NMR of isolated LDs from treated DAOY cells .................................................... 133 8.4.3 Lipid composition analysis ........................................................................................... 134
8.5 Conclusion ............................................................................................................................. 136
Chapter 9 An in vitro metabonomic study detects increase UDP-GlcNAc and UDP-
GalNAc in early phase of cisplatin treatment in brain tumour cells ........................................... 137 9.1 Introduction ........................................................................................................................... 138 9.2 Methods ................................................................................................................................. 141 9.3 Results ................................................................................................................................... 142
9.3.1 Cell survival and cell death ........................................................................................... 142 9.3.2 HR-MAS peak assignment ........................................................................................... 145 9.3.3 HR-MAS spectral changes in cisplatin exposed tumour cells ...................................... 148
9.4 Discussion ............................................................................................................................. 154 9.5 Conclusion ............................................................................................................................. 158
Chapter 10 Conclusion ..................................................................................................................... 159 10.1 Contribution of LDs to NMR lipid signal .......................................................................... 160 10.2 LDs in the progression of cancer cells .............................................................................. 161 10.3 Early detection of treatment response with NMR spectroscopy ....................................... 162 10.4 Summary ........................................................................................................................... 163 10.5 Future work ....................................................................................................................... 163
10.5.1 LD component analysis ............................................................................................ 163 10.5.2 Investigation on cancer cell survival ........................................................................ 164
References ...................................................................................................................................... 165
Appendix: Publications based on this thesis .................................................................................. 178
xi
Table of Figures
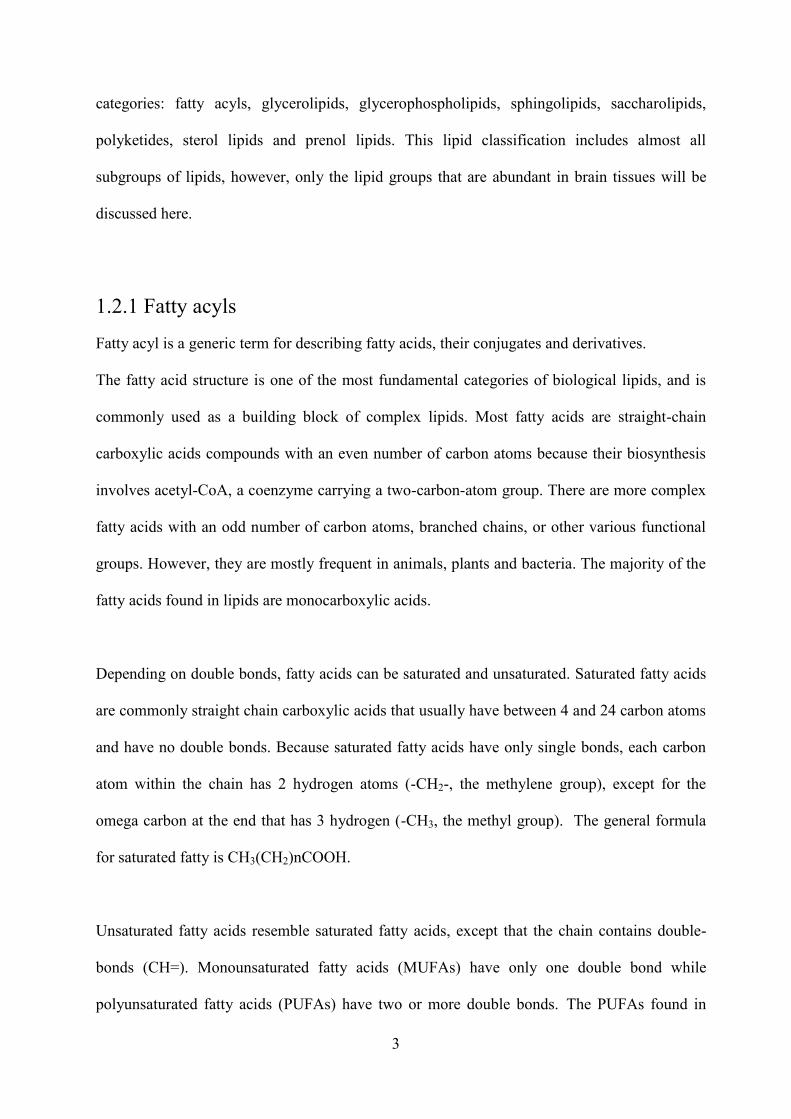
Figure 1.1 The structure of phosphatidylcholin (dm16:0/20:4(5Z,8Z,11Z,14Z)) with a choline head group, glycerol back bone, palmitic acid (C16:0) and arachidonic acid (C20:4,5,8,11,14) HMDB11220 .................................................................................................... 6
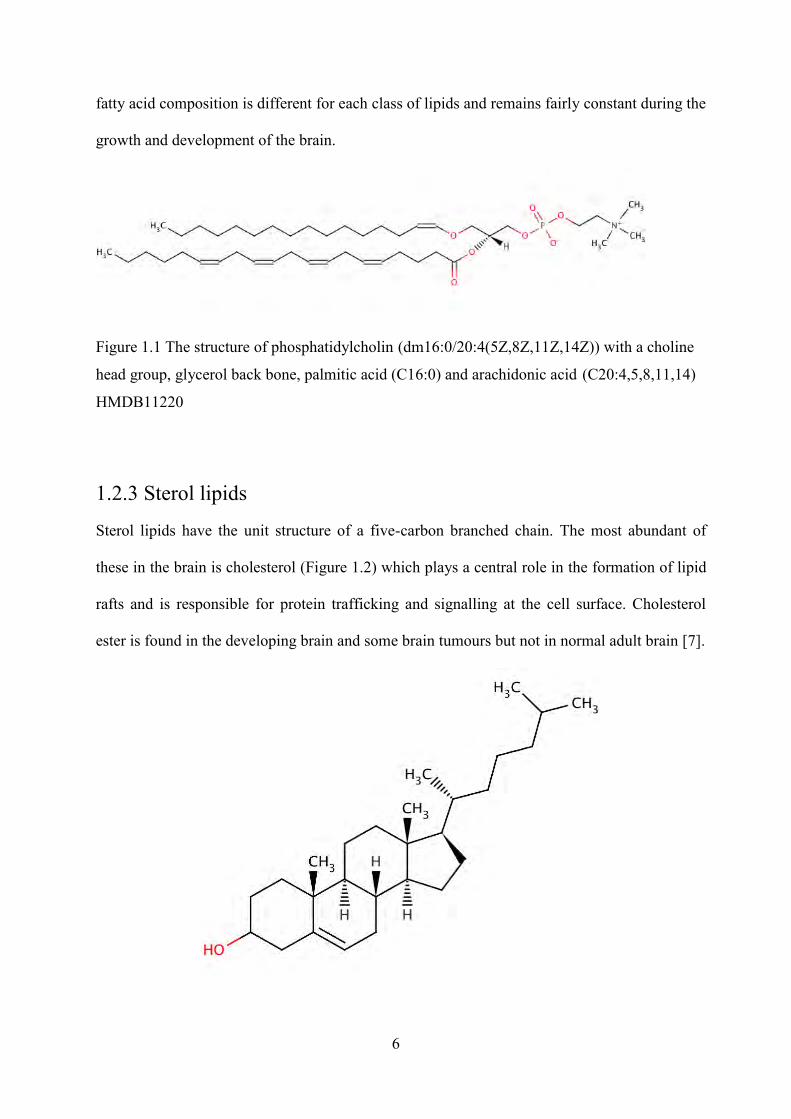
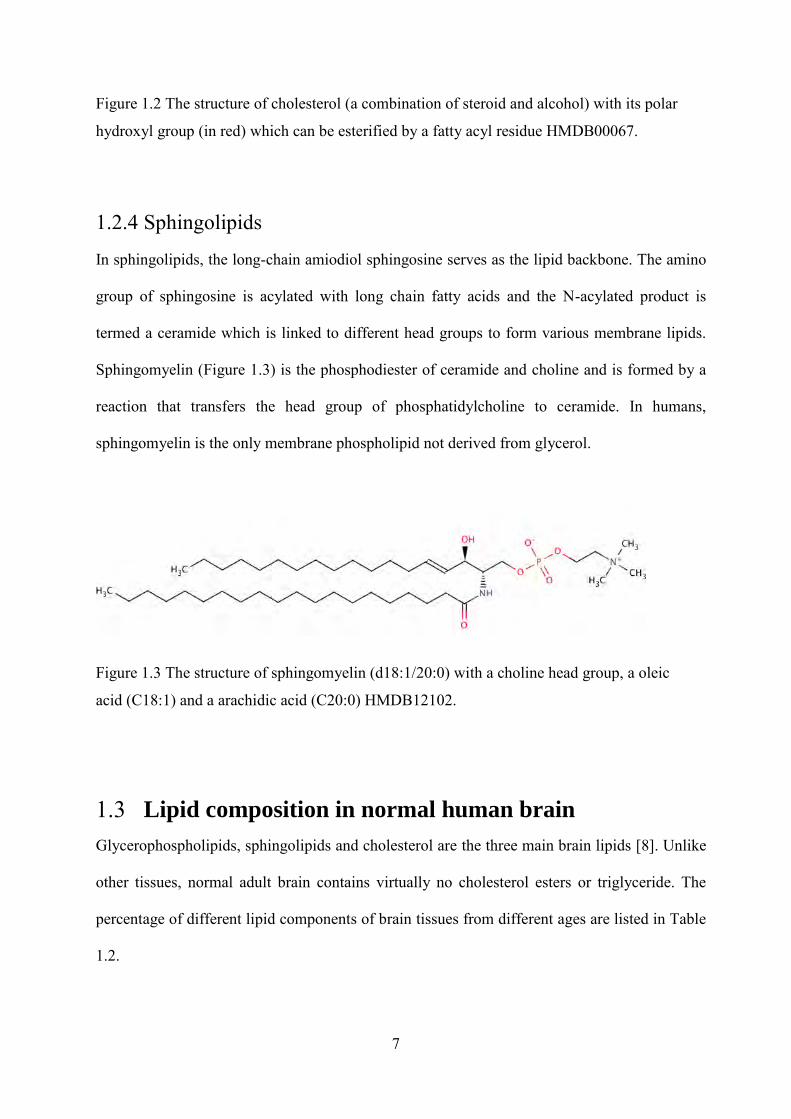
Figure 1.2 The structure of cholesterol (a combination of steroid and alcohol) with its polar hydroxyl group (in red) which can be esterified by a fatty acyl residue HMDB00067. ................ 7
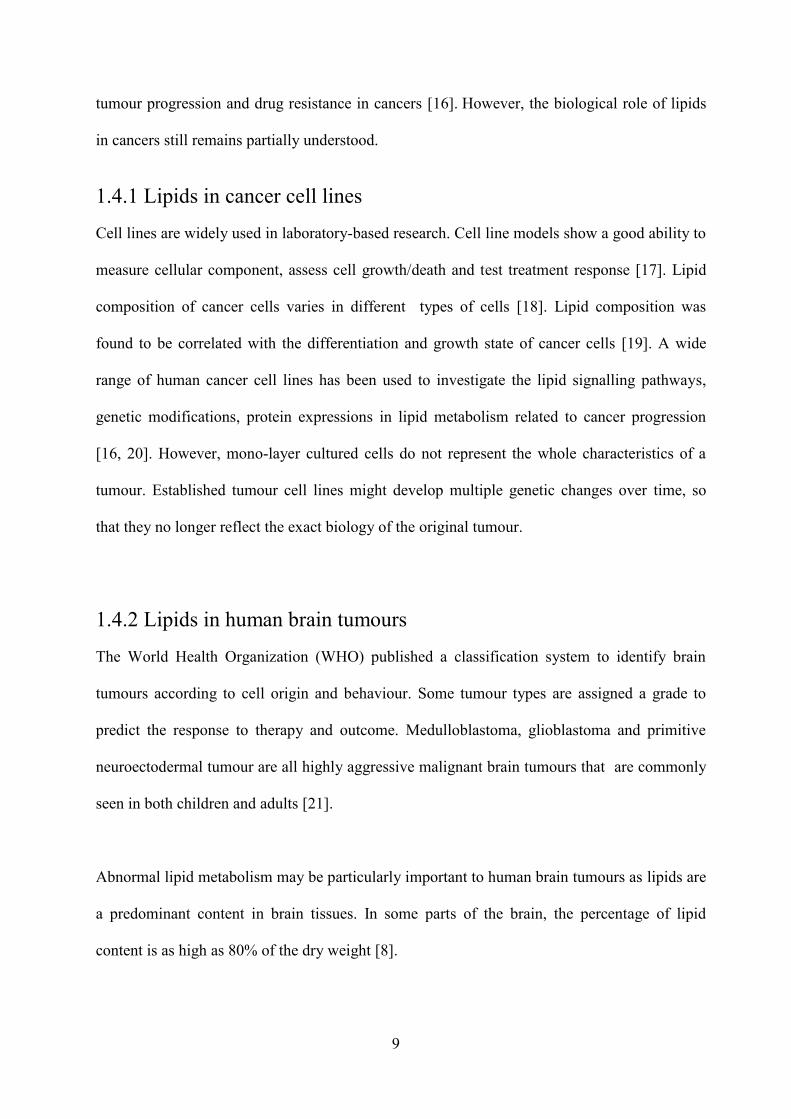
Figure 1.3 The structure of sphingomyelin (d18:1/20:0) with a choline head group, a oleic acid (C18:1) and a arachidic acid (C20:0) HMDB12102. ............................................................. 7
Figure 2.1 A The two spin states (positive and negative) of nuclei in an orbital are of the same energy (B
0=0). The different energy states of nuclei when interact with an external
magnetic field (B0) B The excitement of the nuclei from the low-energy state to the
high-energy one after application of a RF pulse. C Subsequent emission of electromagnetic radiation. ............................................................................................................ 16
Figure 2.2 An overlay of individually collected spectra of the fatty acids, oleic (blue), linoleic (red), linolenic (green) and arachidonic (black). ......................................................................... 22
Fgiure 2.3 a. The structure and chemical shifts of J coupled protons in linoleic acids. Proton in bold participate in the J coupling. b. The TOCSY spectrum of linoleic acids to show the connectivity information [55]. ..................................................................................................... 23
Figure 1.1 The structure of a lipid droplet (taken from project webpage of Dr. Mathias Beller) ........ 33 Figure 1.2 The current model of endoplasmic reticulum(ER) formation of lipid droplets. a)
Neutral lipids are synthesized between the leaflets of the ER membrane. b) The LD then bud from the ER membrane and c) matured with a monolayer of phospholipids and associated proteins [113]. ............................................................................................................ 36
Figure 1.3 Examples of LDs with microtubule system in mammals (A-F), fish (G), insects (H, I) and fungi (J) [ ........................................................................................................................... 42
Figure 4.1 Image J 1.41O platform for image measurements. The diameter of a lipid droplet is measured by drawing a line across the droplet and measuring the length of the line. ................. 52
Figure 4.2 The standard curve of BSA the Bio-rad Protein Assay ....................................................... 55 Figure 4.3 The growth curve of BE(2)M17 cells to assess the proper seeding density........................ 58 Figure 4.4 A Varian 600 MHz spectrometer (left) and a Bruker DRX 500MHz spectrometer
(right) at the Henry Wellcome Building for Biomolecular NMR Spectroscopy, The University of Birmingham. .......................................................................................................... 61
Figure 4.5 Line fitting of 1H NMR signals from the –CH3 group of a lipid extract with wxNUTs. (Blue: peaks of interest, Green and red: simulated peaks, Grey: residue) .................. 65
Figure 5.1 Nile red and DAPI staining (A) of BE(2)M17, Nile red staining (B), Oil red O and haematoxylin staining (C) and Negative staining (D) of isolated fraction. ................................. 72
Figure 5.2 Oil red O and haematoxylin staining of different fractions after isolation. Bars represent 50µm. A isolated fraction, B middle sucrose zone, C pellet, Upper (D) and lower (E) fraction after first 2000xg centrifuge The membrane structure (pointed by arrows) were absent from isolated fraction and middle sucrose zone. ........................................ 73
Figure 5.3 Protein extracts from different fractions after gel electrophoresis and Coomassie Blue staining.1.SeeBlue® Plus2 Pre-Stained Standard (invitrogen), 2. whole cell lysate, 3. isolated fraction, 4. middle sucrose zone, 5.pellet, 6. upper fraction and 7. lower fraction of 2000xg centrifuge. ..................................................................................................... 74
Figure 5.4 Liquid-state 1H NMR spectrum from the buoyant fraction (A) and HR-MRS spectrum from intact cell (B) ....................................................................................................... 75
Figure 5.6 Liquid-state 1H NMR spectra vertically scaled to the resonance intensity at 2.0ppm (left),1.25ppm (centre) and 0.9ppm (right) highlighting the resonances around 2.0–2.9ppm, 1.2–1.4ppm and 0.5-1.0ppm. A: lipid extract from the isolated lipid droplet fraction. B: whole cell lipid extracts and C: HR-MAS spectra from intact cells. ........................ 78
Figure 5.7 The region of 5.45 to 5.25ppm of proton axis of HSQC spectra from the extracts of A: whole cells and B: isolated lipid droplet fraction. .................................................................. 79
xii
Figure 5.8 GC-FID chromatograms of lipid extracts from isolated LDs (A) and BE(2)M17 cells (B).The peaks labelled on the bottom spectrum are as follows: 1. Deuterated tridecanoic acid (retention time and concentration standard), 2. myristic acid (C14:0), 3. palmitic acid (C16:0), 4. palmitoleic acid (C16:1, cis-9), 5. stearic acid (C18:0), 6. oleic acid (C18:1, cis-9), 7. linoleic acid (C18:2, cis-9, 12), 8. arachidic acid (C20:0), 9. gondoic acid (C20:1, cis-11), 10. arachidonic acid (C20:4, cis-5, 8, 11, 14) .............................. 80
Figure 5.9 A two dimensional chromatogram and mass spectrum plot of the intact lipids detected in isolated lipid droplets by liquid chromatography mass spectrometry. Each peak corresponds to an individual intact lipid and the chromatography separates the polar lipids, largely phosphatidylcholines, and the triglycerides. Mass and fragmentation patterns are then used to identify the individual lipid species. ............................ 82
Figure 6.1 Nile red and DAPI staining of five brain and nerve system tumour cells. LDs appear as green spots and the cell nuclei are in blue. .................................................................. 91
Figure 6.2 Box-plot (B) of the diameters (µm) of lipid droplets to show the distribution and the number of LDs in five tumour cell lines. The middle black line represents the median and the box represents a distribution from 25% to 75%. The area between the whiskers represented the total distribution of all LDs except for the outliers shown as dots (mild outliers) and stars (extreme outliers). ......................................................................... 92
Figure 6.3 Histogram of the diameters (µm) of lipid droplets to show the distribution of lipid droplet size in five tumour cell lines. ........................................................................................... 93
Figure 6.4 HR-MAS spectra of five nervous system and brain tumour cells. ...................................... 95 Figure 6.5 Line fit plot for the largest LD in a single cell of each cell line and the lipid signal
intensity of the methyl groups at 0.9ppm (A) and the methylene groups at 1.3ppm (B). ............ 97 Figure 6.6 Line fit plot for the sum of total LD volume in each cell and the lipid signal
intensity measured from 0.9ppm, CH3 groups (A) and 1.3ppm, CH2 groups (B) ...................... 98 Figure 7.1 Nile red stained LDs in whole cells (a, c) and isolated fraction after isolation (b, d)
from two cell lines: BE(2)M17 (a, b) and DAOY (c, d). The size bars represent 5µm. ............ 105 Figure 7.2 HR-MAS spectra acquired from BE(2)M17 (a) and DAOY (c) whole cell pellets
and lipid-state 1H NMR spectra acquired from the isolated fraction of BE(2)M17 (b) and DAOY (d). Spectra were normalised to the maximum point of lipid peaks at 0.9ppm. The peaks labelled with numbers in the top spectrum are assigned as follows: 1–CH3 at 0.9ppm, 2–(CH2) –at 1.3ppm, 3–CH2–CH2–C=O at 1.58ppm, 4 –CH2–CH= at 2.02ppm, 5–CH2–CH2–C=O at 2.2ppm, 6 =CH–CH2–CH= at 2.8ppm. .................................................... 107
Figure 7.3 Linear regression of the ratio of lipid/macromolecular at 0.9ppm peaks between HRMAS spectra and isolated LDs spectra for five cell lines. Each point in the plot represents one cell line and the error bars represent standard errors. ........................................ 107
Figure 7.4 The whole spectra of lipid-state 1H NMR spectra acquired from the lipid extracts of isolated LDs of five cell lines: a BE(2)M17, b BT4C, c U87MG, d PFSK-1 and e DAOY. The assignment for the peaks labelled in top spectra is as follows: 1 –CH3 at 0.9ppm, 2 Chol+CholE at 1.0ppm 3 –(CH2) –at 1.3ppm, 4 N(CH3)3 at 3.4ppm 5, CH= at 5.4ppm. .................................................................................................................................. 108
Figure 7.5 The whole spectra of lipid-state 1H NMR spectra acquired from the lipid extracts of whole cells of five cell lines a BE(2)M17, b BT4C, c U87MG, d PFSK-1 and e DAOY. The assignment for the peaks labelled in top spectra is as follows: 1 –CH3 at 0.9ppm, 2 Chol+CholE at 1.0ppm 3 –(CH2) –at 1.3ppm, 4 N(CH3)3 at 3.4ppm 5, CH= at 5.4ppm. ...................................................................................................................................... 109
Figure 7.6 The expanded region of CH= around 5.4ppm (A), TG around 4.3ppm (B), N(CH3)3 around 3.4ppm (C), =CHCH2CH= around 2.8ppm (D), and Chol+CholE around 1.0ppm (E) of 1H NMR spectra of lipid extracts of LDs a BE(2)M17, b BT4C, c U87MG, d PFSK-1 and e DAOY. .......................................................................................... 110
Figure 7.7 The expanded region of CH= around 5.4ppm (A), TG around 4.3ppm (B), N(CH3)3 around 3.4ppm (C), =CHCH2CH= around 2.8ppm (D),and Chol+CholE around 1.0ppm (E) of 1H NMR spectra of lipid extracts of whole cells. a BE(2)M17, b BT4C, c U87MG, d PFSK-1 and e DAOY. ............................................................................................. 111

xiii
Figure 7.8 Bar plots of the signal intensity of different lipid groups in five cell lines. Black bars for isolated LDs and white bars for whole cells. The error bars represent standard deviation. ................................................................................................................................... 113
Figure 8.1 Cell survival curve of DAOY and PFSK-1 cells after exposed to cisplatin with indicated concentrations at 48h. ................................................................................................. 120
Figure 8.2 Nile red and DAPI staining of DAOY cells with and without 10µM cisplatin exposure. The size bars represent 5µm. ..................................................................................... 122
Figure 8.3 Nile red and DAPI staining of PFSK-1 cells with and without 10µM cisplatin exposure. The error bars represent 5µm. ................................................................................... 122
Figure 8.4 Nile red stained LDs in whole cell (a, c) and in isolated fractions (b, d) of DAOY (a, b) and PFSK-1 (c, d). The size bars represent 5µm. ............................................................. 123
Figure 8.5 HR-MAS spectra from whole cell pellets of DAOY (A) and PFSK-1 (B) with and without cisplatin exposure. The assignment for peaks labelled with numbers are as follows:1–CH3 at 0.9ppm, 2–(CH2) –at 1.3ppm, 3–CH2–CH2–C=O at 1.58ppm, 4 –CH2–CH= at 2.02ppm, 5–CH2–CH2–C=O at 2.2ppm, 6 =CH–CH2–CH= at 2.8ppm‚ 7 –CH=CH– at 5.4ppm. .................................................................................................................. 124
Figure 8.6 HR-MAS spectra from whole cell pellets of control cells: DAOY (A) and PFSK-1 (B). The assignment for peaks labelled with numbers is as follows: 1–CH3 at 0.9ppm, 2–(CH2) –at 1.3ppm. .................................................................................................................. 125
Figure 8.7 Signal intensity of lipid peak at 0.9ppm (A), 1.3ppm (C), 2.8 ppm (B) 5.4ppm (D), double bond proton signal/methyl group proton signal (CH=/CH3) and methylene group proton signal/methyl group proton signal (CH2/CH3) from HR-MAS spectra of treated and control DAOY and PFSK-1 cells. ....................................................................................... 126
Figure 8.8 Liquid-state 1H NMR spectrum from the isolated fraction of cisplatin exposed DAOY cells. Spectra were normalised to the maximum point of MM peak at 0.9ppm. Structural assignments are made as following:: 1 CH3 at 0.9ppm, 2 CH2 at 1.3ppm, 3 CH2CH2CO at 1.58ppm , 4 CH2CH=CH at 2.02ppm, 5 CH2COOH at 2.2ppm, 6 =CHCH2CH= at 2.8ppm. ........................................................................................................... 127
Figure 8.9 1H NMR spectra of lipid extracts from LDs of DAOY cells exposed to cisplatin with indicated times. whole spectrum (A) and the expansion for peaks at 1.3ppm (B), 3.4ppm (C) and 5.4ppm (D). Arrows show the increased signal of methylene groups from unsaturated lipids. ............................................................................................................. 128
Figure 8.10 1H NMR spectra of lipid extracts from DAOY cells exposed to cisplatin with indicated times. whole spectrum (A) and the expansion for peaks at 1.3ppm (B), 3.4ppm (C) and 5.4ppm (D). ................................................................................................................... 129
Figure 8.11 The ratio of signal intensity of different lipid groups from the lipids extracted from isolated LDs of DAOY and PFSK-1 cells with and without cisplatin exposure. The error bars represent standard deviation. ..................................................................................... 131
Figure 8.12 The ratio of signal intensity of different lipid groups from the lipids extracted from DAOY and PFSK-1 cells with and without cisplatin exposure. The error bars represent standard deviation. ..................................................................................................... 131
Figure 8.13 HSQC spectra of 10μM cisplatin 48h treated DAOY cells............................................. 132 Figure 9.2 Cell survival curve of four brain tumour cells treated with cisplatin for 48h at the
indicated concentration .............................................................................................................. 143 Figure 9.3 total-RNA of 50 µM cisplatin treated BT4C cells 1:1kb Plus DNA Ladder, 2: 0h,
3-7: 3h, 6h, 12h, 24h and 48h exposed cells. ............................................................................. 144 Figure 9.4 DAPI-stained cell nuclei with 10µM cisplatin treatment of DAOY(a), BT4C(b),
PFSK-1(c) and U87-MG(d) at the following exposure time: 0h (i), 24h (ii) and 48h (iii). The size bar represents 10µm. ................................................................................................... 145
Figure 9.5 1H NMR spectra for the metabolites extracted from 48h cisplatin- treated U87-MG cells with or without pure glycosylated UDP-compounds a: cell extracts, b: cell extracts and UDP-GlcNAc, c: cell extracts, UDP-GlcNAc and UDP-GalNAc. The peaks labelled in the bottom spectrum are 1. GCH3 at 2.09ppm, 2. G2 at 5.5ppm 3. U5 at 5.98ppm, 4.U6 at 7.98ppm. A whole spectrum region. B Expansion of the 2.09ppm region. C Expansion of the 5.5ppm region. ............................................................................................... 146

xiv
Figure 9.6 STOCSY analysis of all HR-MAS spectra acquired from BT4C cells. Peaks represent highly correlated spectral regions (the circled points). .............................................. 147
Figure 9.7 TOCSY spectra from A: extracts of 48h 10µM cisplatin exposed U87-MG cells B: pure UDP-GlcNAc and UDP-GalNAc. (Rectangles to show the correlated peaks between 7.98ppm with 5.98ppm, 5.5ppm and the signals in 4.5ppm region.) .......................... 148
Figure 9.8 HR-MAS spectra of a responder, 50 µM cisplatin treated BT4C cells. ........................... 149 Figure 9.9 HR-MAS spectra of a non-responder,10 µM cisplatin treated U87-MG cell. .................. 150 Figure 9.10 1H NMR spectra of cell extracts from A BT4C B U87-MG cells exposed to
cisplatin at 0h, 24h and 48h The peaks labelled on the bottom spectrum are 1. U5 at 5.98ppm, 2.U6 at 7.98ppm,3. G2 at 5.5ppm .............................................................................. 151
Figure 9.11 Measurement of HR-MAS spectra. A, the UDP-GlcNAc and UDP-GalNAc peak at 7.98ppm. B, the lipid peak at 5.3ppm at 0h, 12h, 24h and 48h treatment with 10µM cisplatin. The error bars represent standard errors. *P<0.05 **P<0.001 ................................... 153
Figure 9.12 The A 8.1-5.4ppm and B 4.5-0.5ppm region of HR-MAS proton spectra of BT4C cells at a: control at 0h, b: 24h untreated, c: 48h untreated d:24h cisplatin treated. The peaks labelled on the bottom spectrum are 1. Choline at 3.2ppm, 2. Lipid at 5.4ppm, 3. G2 at 5.5ppm, 4.H5 at 5.98ppm, 5. U6 at 7.98ppm C: The expansion to show the choline peak. ........................................................................................................................................... 153
Table of tables
Table 1.1 Major fatty acids of human brain (taken from Basic Neurochemistry 8th edition, page 83, Figure5-1). ....................................................................................................................... 4
Table 1.2 Concentration of lipids in gray matter, white matter and myelin of human brains [8]. .................................................................................................................................................. 8
Table 5.1 1H NMR resonance of extracted lipids from BE(2)M17 cells in CDCl3 .............................. 77 Table 5.2 Summary of fatty acid composition as percentage of total fatty acids in lipid
extracts studied by GC-FID (*P<0.05) ........................................................................................ 80 Table 7.1 Statistical information of LD diameter from whole cell and isolated fraction of
BE(2)M17 and DAOY cells. ..................................................................................................... 105 Table 9.1 The level of UDP-GlcNAc + UDP-GalNAc in untreated cells .......................................... 152

xv
Abbreviations
ADRP Adipocyte differentiation related protein
ATP Adenosine triphosphate
CCMs Choline containing metabolites
Cho Choline
Chol Cholesterol
CholE Cholesteryl Ester
Cisplatin Cis-dichlorodiammineplatinum II
CNS Central Nervous System
Cr Creatine
D2O Dideuterium monoxide
DAPI 4',6-diamidino-2-phenylindole
D-PBS Dulbecco’s phosphate buffered saline
DAG Diacylglycerol
DAPI 4’, 6-diamino-2-phenylindole
DMEM Dulbecco’s modified Eagles medium
DMSO Dimethyl sulfoxide
DNA Deoxyribonucleic acid
DNase Deoxyribonuclease
ER Endoplasmic reticulum
FCS Foetal calf serum
FID Free induction decay
GC Gas chromatography
GC-FID Gas chromatography with flame-ionization detector
GCV gene therapy Ganciclovir thymidine kinase gene therapy
Gly Glycine
GPC Glycerophosphocholine
GTP Guanosine-5'-triphosphate
HBP Hexosamine biosynthesis pathway
HCN Proton, nitrogen, carbon
HDL High density lipoprotein
HMDB Human Metabolome Database
HR-MAS High resolution magic angle spinning magnetic resonance spectroscopy
xvi
HSQC Heteronuclear Single Quantum Coherence
HSV-tk Herpes simplex virus thymidine kinase
IDL Intermediate density lipoprotein
IFN-γ Interferon-gamma
IP3 Inositol triphosphate
ISM Industrial methylated spirit
LC-MS Liquid chromatography mass spectrometry
LD Lipid droplet
LDL Low density lipoprotein
MAS Magic Angle Spinning
MEM minimum essential medium
MM Macromolecule
MRI Magnetic resonance imaging
MRS Magnetic resonance spectroscopy
MS mass spectrometry
MUFA Monounsaturated fatty acids
NAA N-Acetylaspartic acid
NEAA Non-essential amino acid
Nile red Nile blue oxazone (9-diethylamino-5H-benzo[α]phenoxazine- 5-one)
NMR Nuclear magnetic resonance spectroscopy
O-GlcNAc O-linked β-N-acetylglucosamine
O-GlcNAcylation O-linked β-N-acetylglucosamine glycosylation
PC Phosphocholine
PKC Protein kinase C
PIP2 phosphatidylinositol bisphosphate
PtCho Phosphatidylcholine
PtdEtn Phosphatidylethanolamine
PtdSer Phosphatidylserine
PUFA Poly unsaturated fatty acid
RNAi Ribonucleic acid interference
S1P Sphingosine-1-phpsphate
SDS-PAGE Sodium dodecyl sulfate polyacrylamide gel electrophoresis
Shh Sonic Hedgehog
SPL Sphingosine-1-phpsphate lyase

xvii
STOCSY Statistical total correlation spectroscopy
ST-PNET Supratentorial primitive neuroectodermal tumour
TARQUIN Totally automatic robust quantitation in NMR
TBE Tris/Borate/ Ethylenediaminetetraacetic acid
TEM Transmission electron microscopy
TG Triglyceride
TIP47 The 47-kDa tail interacting protein
TMS Trimethylsilylproprionate d4
TNF-α Tumour necrosis factor-alpha
TOCSY Total Correlation Spectroscopy
UFA Unsaturated fatty acid
UDP-GlcNAc Uridine diphospho-N-acetylglucosamine
UDP-GalNAc Uridine diphospho-N-acetylgalactosamine
VLDL Very low intensity lipoprotein
WHO World health organisation

1
Chapter 1 General introduction to
lipids and metabolites

2
1.1 Lipids and Lipidomics
The definition for lipids recently proposed by Dr. Christin [1] is that lipids are fatty acids, their
derivatives (esters and amides) and substances related biosynthetically or functionally to these
compounds. The structure of a lipid usually consists of various combinations of different fatty
acids and functional head groups that are linked by a backbone, usually a glycerol or sphingoid
base backbone. Many human diseases, such as cancers, diabetes and infectious diseases
involve dysfunction of lipid synthesis, utilization and transport [2]. Therefore, lipid biology has
become a major research target after the post genomic revolution [3].
Lipidomics is a comprehensive study of cellular lipids in a biological system which involves
quality and quantity analysis of thousands of lipid molecules and the interaction with
themselves and with other compounds such as proteins and metabolites [4]. Compared with the
huge breakthrough in the fields of genomics and proteomics, the lipidomics research is
hindered due to the complexity of lipids and the lack of powerful analysis tools [3]. Recently,
the lipidomic profiling by mass spectrometry not only confirms the structural diversity of lipids
but also reveals that lipids are dynamic molecules with multiple functions [3].
1.2 Categories of lipids
Lipid biology has become a major target for chemists, biologists and biomedical researchers
since the post-genomic revolution, in order to deal with the massive amounts of data collected
from different fields, a naming scheme that unambiguously defines a lipid structure was
developed by E. Fahy et al. in 2005 [3].
Biological lipids originate entirely or partly from two distinct types of biochemical subunits:
ketoacyl and isoprene groups [3]. Using this approach, lipids can be divided into eight
3
categories: fatty acyls, glycerolipids, glycerophospholipids, sphingolipids, saccharolipids,
polyketides, sterol lipids and prenol lipids. This lipid classification includes almost all
subgroups of lipids, however, only the lipid groups that are abundant in brain tissues will be
discussed here.
1.2.1 Fatty acyls
Fatty acyl is a generic term for describing fatty acids, their conjugates and derivatives.
The fatty acid structure is one of the most fundamental categories of biological lipids, and is
commonly used as a building block of complex lipids. Most fatty acids are straight-chain
carboxylic acids compounds with an even number of carbon atoms because their biosynthesis
involves acetyl-CoA, a coenzyme carrying a two-carbon-atom group. There are more complex
fatty acids with an odd number of carbon atoms, branched chains, or other various functional
groups. However, they are mostly frequent in animals, plants and bacteria. The majority of the
fatty acids found in lipids are monocarboxylic acids.
Depending on double bonds, fatty acids can be saturated and unsaturated. Saturated fatty acids
are commonly straight chain carboxylic acids that usually have between 4 and 24 carbon atoms
and have no double bonds. Because saturated fatty acids have only single bonds, each carbon
atom within the chain has 2 hydrogen atoms (-CH2-, the methylene group), except for the
omega carbon at the end that has 3 hydrogen (-CH3, the methyl group). The general formula
for saturated fatty is CH3(CH2)nCOOH.
Unsaturated fatty acids resemble saturated fatty acids, except that the chain contains double-
bonds (CH=). Monounsaturated fatty acids (MUFAs) have only one double bond while
polyunsaturated fatty acids (PUFAs) have two or more double bonds. The PUFAs found in

4
brain tissue usually have from three up to six double bonds, generally separated by a single
methylene group (methylene-interrupted unsaturation,-CH=CH-CH2-CH=CH-).Some
uncommon PUFAs have two adjacent double bonds separated by more than one methylene
group, they are named polymethylene-interrupted fatty acids.
In addition to the degree of saturation, fatty acids can also be characterized by the chain length.
Most naturally occurring fatty acids have a chain of 4 to 28 carbons. Short-chain fatty acids are
fatty acids with aliphatic tails of fewer than six carbons and they are always saturated.
Medium-chain fatty acids are fatty acids with aliphatic tails of 6–12 carbons, which can form
medium-chain triglycerides. Long-chain fatty acids are fatty acids with aliphatic tails longer
than 12 carbons and can be either saturated or unsaturated [5]. Very-Long-chain fatty acids are
fatty acids with aliphatic tails longer than 20 carbons and they tend to be highly unsaturated.
Their physical and biological properties are related to this partition in 4 classes. Major brain
fatty acids contain 12 to 24 carbons (Table 1.1). Brain lipids contain some unusually long and
polyunsaturated fatty acids which cannot be biosynthesized in the animal body de novo.
Table 1.1 Major fatty acids of human brain (taken from Basic Neurochemistry 8th edition,
page 83, Figure5-1).

5
1.2.2 Glycerophospholipids
Glycerophospholipids essentially fall into glycerolipids as they are glycero-containing lipids as
well, but they are made into a separate category because of their abundance and importance.
The glycerophospholipids are ubiquitous in nature and are key components of the lipid bilayer
of cells.
Glycerophospholipids are defined into subclasses on the basis of the substituent base of the
diacylglycerophosphoryl unit. The amount and distribution of these lipids varies with brain
regions and with age. The most abundant ones in brains are phosphatidylethanolamine
(PtdEtn), including plasmalogens, phosphatidylcholine (PtdCho, lecithin) (Figure 2.1) and
phosphatidylserine (PtdSer) [6]. Each class in a given tissue has a characteristic fatty acid
composition, though the same fatty acid may be present in a number of lipids, the quantitative
6
fatty acid composition is different for each class of lipids and remains fairly constant during the
growth and development of the brain.
Figure 1.1 The structure of phosphatidylcholin (dm16:0/20:4(5Z,8Z,11Z,14Z)) with a choline
head group, glycerol back bone, palmitic acid (C16:0) and arachidonic acid (C20:4,5,8,11,14)
HMDB11220
1.2.3 Sterol lipids
Sterol lipids have the unit structure of a five-carbon branched chain. The most abundant of
these in the brain is cholesterol (Figure 1.2) which plays a central role in the formation of lipid
rafts and is responsible for protein trafficking and signalling at the cell surface. Cholesterol
ester is found in the developing brain and some brain tumours but not in normal adult brain [7].
7
Figure 1.2 The structure of cholesterol (a combination of steroid and alcohol) with its polar
hydroxyl group (in red) which can be esterified by a fatty acyl residue HMDB00067.
1.2.4 Sphingolipids
In sphingolipids, the long-chain amiodiol sphingosine serves as the lipid backbone. The amino
group of sphingosine is acylated with long chain fatty acids and the N-acylated product is
termed a ceramide which is linked to different head groups to form various membrane lipids.
Sphingomyelin (Figure 1.3) is the phosphodiester of ceramide and choline and is formed by a
reaction that transfers the head group of phosphatidylcholine to ceramide. In humans,
sphingomyelin is the only membrane phospholipid not derived from glycerol.
Figure 1.3 The structure of sphingomyelin (d18:1/20:0) with a choline head group, a oleic
acid (C18:1) and a arachidic acid (C20:0) HMDB12102.
1.3 Lipid composition in normal human brain
Glycerophospholipids, sphingolipids and cholesterol are the three main brain lipids [8]. Unlike
other tissues, normal adult brain contains virtually no cholesterol esters or triglyceride. The
percentage of different lipid components of brain tissues from different ages are listed in Table
1.2.

8
Table 1.2 Concentration of lipids in gray matter, white matter and myelin of human brains
[8].
1.4 Lipids in cancer
The correlation of dietary lipids and carcinogenesis has been known for a long time with
investigations starting in the 1960s [9]. Since then, the importance of lipids in cancer
development has been generally recognized. Variations in lipid composition, amount and
preoxidation status have been observed in a wide range of cancer cells, tissues and patients
[10-13]. Lipid metabolism genes are found to be important in tumour transformation and are
up-regulated in cancer tissues [14]. Certain lipids can activate intrinsic and extrinsic apoptotic
pathways through receptor-independent mechanism [14]. In addition, sphingolipids influence
cell cycle progression, telomerase function, cell migration and stem cell biology. Considering
the role of lipids in cell proliferation and cell death, some of them can be regarded as a tumour-
suppressor lipid or a tumour-promoting lipid [15]. Lipids are also found to be important to the
9
tumour progression and drug resistance in cancers [16]. However, the biological role of lipids
in cancers still remains partially understood.
1.4.1 Lipids in cancer cell lines
Cell lines are widely used in laboratory-based research. Cell line models show a good ability to
measure cellular component, assess cell growth/death and test treatment response [17]. Lipid
composition of cancer cells varies in different types of cells [18]. Lipid composition was
found to be correlated with the differentiation and growth state of cancer cells [19]. A wide
range of human cancer cell lines has been used to investigate the lipid signalling pathways,
genetic modifications, protein expressions in lipid metabolism related to cancer progression
[16, 20]. However, mono-layer cultured cells do not represent the whole characteristics of a
tumour. Established tumour cell lines might develop multiple genetic changes over time, so
that they no longer reflect the exact biology of the original tumour.
1.4.2 Lipids in human brain tumours
The World Health Organization (WHO) published a classification system to identify brain
tumours according to cell origin and behaviour. Some tumour types are assigned a grade to
predict the response to therapy and outcome. Medulloblastoma, glioblastoma and primitive
neuroectodermal tumour are all highly aggressive malignant brain tumours that are commonly
seen in both children and adults [21].
Abnormal lipid metabolism may be particularly important to human brain tumours as lipids are
a predominant content in brain tissues. In some parts of the brain, the percentage of lipid
content is as high as 80% of the dry weight [8].
10
1.4.2.1 Variation of lipids in brain tumours
Lipid accumulation can be found in different types of cancer cells [22, 23]. Extensive lipid
analysis of brain tumours has been performed since the introduction of thin layer
chromatography [24]. Brain tumour tissue was found to contain more fatty acids, sterol esters
and glycerol esters than normal brain. The lipid pattern in tumours resembled the pattern found
in normal brain surrounding the tumour [24]. The presence of cholesteryl esters and
triglycerides in high grade tumours were also confirmed using NMR, which is different from
normal brain tissue and low grade neoplasm [25]. All these studies indicated that the contents
of lipid fractions of brain tumours were significantly different from those of normal brain
tissues [26].
1.4.3 Lipids in cancer therapy
Two decades ago ,it was found that the fatty acid composition of cancer cell membranes could
alter when cells were exposed to different types of lipids [27]. A substantial change was
proposed to be the degree of unsaturation of membrane phospholipids [28]. Certain physical
and functional properties of membranes are modified when PUFA content is increased and
therefore cancer cells become more sensitive to drug treatment. Enrichment with PUFAs
makes cancer cells more susceptible to lipid peroxidation and leads to an increased lipid radical
formation in response to oxidant stress and photodynamic therapy [28]. In addition, the
immune response in cancer can be improved by manipulating the lipid levels in dendritic cells
[13]. All these observation suggests that PUFA supplementation can make certain forms of
cancer treatment more effective.
More interestingly, parinaric acid (C18:4), an PUFA containing conjugated double bonds is
reported to be cytotoxic to several types of human tumour cells[28]. In a study of the
cytotoxicity of PUFAs to pancreatic and leukaemic cells, a range of PUFAs including linoleic

11
acid (C18:2), linolenic acid (C18:3) and arachidonic acid (C20:4) together with oleic acid
(C18:1), an MUFA, were all found to inhibit cell growth and induce cell death within varied
exposure time [29].
The cytotoxicity of unsaturated fatty acids (UFAs) and their role in tumour growth inhibition
was identified in animal studies [30, 31] and clinical trials of linolenic acid therapy of human
gliomas [32]. Although the fatty acids induced cell killing is not as dramatic as other
chemotherapeutic drugs and radiation, these lipid-based approaches to cancer therapy show
selectivity for malignant cells without harming the normal cells [32, 33]. Their selective
activity against tumours implicates the potential of lipid therapy to be used in less advanced
tumours, to enhance the response of tumour cells to other anticancer drugs and to achieve a
higher cytotoxic action with higher dose in future studies.
Except for the external supplied fatty acids, internally synthesized fatty acids are reported to be
involved in cancer cell death as well. Cancer cell apoptosis is a major mechanism for most
chemotherapy and radiation therapy. Research found that there was NMR visible
polyunsaturated lipid accumulation during cancer cell apoptosis [34]. Tumours with high
apoptotic activity were found to have a higher content of -(CH2)n and -CH3 fatty acids while
monitoring the effect of an antitumor agent [35]. These findings indicated the potential of
lipids to be served as biomarkers for effective cancer therapy.
1.5 Methods for detecting lipids in biological systems
1.5.1 NMR detection of lipids
Nuclear Magnetic Resonance Spectroscopy is a non-invasive analytical technique which is
now widely used in both the research and clinical settings [36]. MRS is a term used for in vivo

12
studies while NMR is used when the same technique is applied in vitro. The information
provided by MRS can be processed and presented as peaks in spectra (detailed explanation see
section 2.1) and as density maps to show the spatial distribution of the detectable compounds
such as mobile lipids, low molecular weight metabolites and macromolecules [37].
1.5.2 Mass Spectrometry
Mass spectrometry (MS) is a technique for measuring the mass of molecules in an ionized
state. Both MS and NMR spectroscopy are common techniques used in lipid analysis. MS is
more sensitive than NMR. It not only provides a specific molecular mass value, but also
establishes the molecular formula of an unknown compound to give a clear identification [38].
However, the sample preparation for MS is relatively complicated and time consuming.
1.5.3 Extraction of lipids from cells
An effective method to reduce the problem of line shape broadening (details see section 2.1) in
NMR is to extract lipids chemically from cells and tissues and re-suspend the extracts in
solvents to produce homogeneous liquid state samples which are ideal for NMR analysis. In
addition, the extraction can eliminate unwanted enzyme activity and enhance the stability of
the samples. Methanol/chloroform/water extraction has been the classic way to extract lipids
since 1960s and is still widely used today [39]. However, it is difficult to estimate the alteration
to the detected sample caused by the chemical extraction and there is always the possibility that
contamination might be brought into the samples in the process.
1.5.4 Lipid staining
Staining is an auxiliary technique used in microscopy to enhance contrast in the microscopic
image. Stains and dyes are frequently used in biology and medicine to highlight structures in
biological tissues for viewing and assessment. The lipid of cells and tissues can be
demonstrated with specific lipid binding dye and the stained lipid can be observed using a

13
microscope [40].The ability to visualize lipids can help researchers to investigate the
distribution, intensity and volume of lipids. However, the image elements are observed
indirectly and lack molecular specificity.
There are a range of lipophilic dyes that used to be applied in lipid analysis. Oil red O largely
replaced Sudan III and Sudan IV, as it provides deeper red colour to be visualized under light
microscope. The fluorescent dyes such as Nile red, Bodipy are becoming more and more
popular as their high intensity can improve the clarity of images and also can track lipids in a
non-destructive way in living cell [41].
Nile red exhibits properties of a near-ideal lysochrome. Nile red can be used with living cells.
It fluoresces strongly when partitioned into lipids, but practically not at all in aqueous solution.
The dye is very soluble in the lipids it is intended to show, and it does not interact with any
tissue constituent except by solution. Nile red can be applied to cells in an aqueous medium,
and it does not dissolve the lipids it is supposed to reveal [40].
A lipophilic dye based on the Bodipy fluorophore, LD540, was developed recently for
microscopic imaging of lipid droplets. In contrast to previous lipid droplet dyes, it can be
resolved from both green and red fluorophores allowing multicolour imaging in both fixed and
living cells. Its improved specificity, brightness and photo-stability support live cell imaging,
which can be used to demonstrate by two-colour imaging lipid droplet motility along
microtubules[41].

14
1.6 Metabolites and Metabonomics
A general definition of metabolites is the intermediates and products of metabolism and
metabolites are usually small molecules. A scientific definition of metabolite proposed by Prof.
Harris ED in Biomedical Facts behind the Definition and Properties of Metabolites (FDA,
USA) is that metabolites are the products of enzyme-catalysed reactions that occur naturally
within cells. He proposed a summary of the major factors to designate a substance a metabolite
is as follows: 1. Metabolites are compounds found inside cells. 2. Metabolites are recognised
and acted upon by enzymes. 3. The product of a metabolite must be able to enter into
subsequent reactions. 4. Metabolites have a finite half-life; they do not accumulate in cells. 5.
Many metabolites are regulators that control the pace of metabolism. 6. Metabolites must serve
some useful biological functions in the cell.
Metabonomics/ Metabolomics is a systematic and untargeted study of all the metabolites in a
biological cell, tissue, body fluid or organ [42]. These two terms are often been used as
synonymous. Metabolomics emphasises metabolic profiling at a cellular or organ level. It is
primarily concerned with normal endogenous metabolism. Metabonomics extends metabolic
profiling to include information about the alteration of metabolism caused by environmental
factors, toxins, disease processes, and etc [43].

15
Chapter 2 Detection of lipids and
metabolites by nuclear magnetic
resonance spectroscopy

16
2.1 An introduction to nuclear magnetic resonance
spectroscopy
NMR is a spectroscopy technique established on nuclear magnetic resonance phenomenon
which was first described by Isidor Rabi in 1938 [44]. Some nuclei have magnetic spin, arising
from a disparity in the number of protons and neutrons within them. Magnetic spin can have
different energies; one is higher than the other. The basic principle of a NMR experiment
involves two steps: the alignment of the atomic nuclei with intrinsic magnetic spin properties
when placed in constant magnetic fields and the application of a NMR radio frequency (RF)
pulse, resulting in the excitement of some of the nuclei from the low-energy state to the high-
energy one. Following the pulse, the high-energy-spin nuclei relax back to a low-energy state
with an associated emission of electromagnetic radiation (Figure 2.1).
Figure 2.1 A The two spin states (positive and negative) of nuclei in an orbital are of the
same energy (B0=0). The different energy states of nuclei when interact with an external
magnetic field (B0) B The excitement of the nuclei from the low-energy state to the high-
energy one after application of a RF pulse. C Subsequent emission of electromagnetic
radiation.
The electromagnetic radiation is at a specific resonance frequency which depends on the
strength of the applied magnetic field, the atomic nuclei and their electronic environment.
17
These frequencies at which the radiation resonates are observed, registered and presented as
peaks on a normalised frequency scale.
The position and the shape of the peaks depend on the resonant frequencies of the specific
atomic nuclei of the studied sample. Therefore, each compound has its own spectral pattern
according to the molecular structure and the metabolite profile of the sample can be determined
form these NMR spectral patterns. The area under the peaks, also called the signal intensity is
proportional to the abundance of the detected nuclei which also represent the concentration of
the sample. Therefore, NMR is not only a qualitative technique but also a quantitative one.
Only the NMR active nuclei with an non-zero overall spin can be studied using NMR and the
commonly used nuclei are 1H, 19F, 31P, 13C, 15N, which are listed according to their sensitivity.
Proton (1H) has a relatively large magnetic movement and a high sensitivity and protons are
presented in almost all compounds, therefore 1H MRS is most extensively used in different
field, especially in the investigation of lipids. All NMR techniques discussed in this paper use
proton as the signal acquiring nuclei except for Heteronuclear Single Quantum Coherence
(HSQC), a 2D technique which uses both proton and carbon signal.
In NMR, relaxation is the process that nuclear magnetization in a non-equilibrium state returns
to the equilibrium distribution. T1 relaxation, also called longitudinal relaxation, Spin-Lattice
relaxation, describes the gain and loss of magnetization in the z-direction. T2 relaxation, also
called transverse relaxation or Spin-Spin relaxation describes the gain and loss of
magnetization in the x,y-direction. T2 is usually less than or equal to T1 as the return of
magnetization to the z-direction inherently causes loss of magnetization in the x-y plane. The
line width of an NMR signal is determined by T2. Shorter T2 means broader lines.
18
Rotational correlation time is the time it takes the average molecule to rotate one radian; it is a
quantitative measure of the rate of a molecular motion and usually depends on the molecular
size. The rotational correlation time becomes longer (molecule motion is slower, molecule size
is bigger), T2 becomes shorter. In larger molecules, molecular motion is slower and T2 is
much shorter than T1. The NMR signal from larger molecules is usually broader.
2.2 NMR detection of lipids and metabolites
2.2.1 In vivo MRS
The clinical use of in vivo magnetic resonance spectroscopy has been limited for a long time
due to the low sensitivity. MRS served as a new clinical tool from the 1990s [45] while the first
MR image was published in 1973 [46]. With the advent of clinical MR systems with higher
magnetic field strength and optimized pulse sequences, sensitivity has been largely improved
and nowadays, magnetic resonance spectroscopy is being routinely used in the clinic especially
in the management of brain tumour patients [47]. MRS can provide functional and metabolic,
rather than morphologic, tissue properties. Therefore, it can be used to improve diagnostic
accuracy, grade tumours, offer guidance for surgical intervention and drug treatment and
determine early response to therapy [48].
2.2.2 In vitro NMR for cancer specimen
Most NMR experiments are carried out in a solution state. A sample containing particles has a
field homogeneity distortion around every single particle. In solution NMR, the inherent
isotropy (same in all directions) means the NMR spectrum appears as a set of narrow, well
defined lines. The homogeneity of liquid samples allows the dissolved compound to tumble

19
randomly at rates fast enough to average out anisotropic chemical (oriental dependant) shifts.
Thus, most liquid-state samples can yield sharp signals in NMR spectroscopy. Cells and tissues
are inherently not homogeneous. The subsequent local variation in the B0 field at the cellular
level of these samples leads to line broadening. This effect is known as bulk magnetic
susceptibility (BMS) [49] induced broadening which is the main contributor to the poor line
shapes for small molecules in cells.
Lipids and macromolecules have a characteristic broad appearance in 1H NMR spectroscopy.
However, unlike to small molecules, BMS induced broadening is not the largest contributor to
their broad line shape. The restricted rotational mobility due to the large mass becomes the
main reason. In NMR spectroscopy, in order to give a narrow line shape, molecules must rotate
fast enough to fall into the transverse relaxation rate (R2) [50]. R2=1/T2. The longer R2
relaxation rate due to large and immobile molecules leads to broadening of frequencies and
sometimes loss of resolvable NMR peaks.
For biological macromolecules, their anisotropic features have largely limited their NMR
observation. However, certain kinds of anisotropic interactions can be controlled by a method
called Magic Angle Spinning (MAS) discovered by E. R. Andrew and I. J. Lowe in the late
1950s. MAS is the process of spinning the sample about an axis at an angle of 54.74o to the
static magnetic field B0. Spinning the sample at the magic angle significantly reduces line-
broadening interactions such as BMS induced broadening, chemical shift anisotropy and
dipolar effects. Another advantage of MAS is that excellent signal to noise can be achieved.
This is because MAS probes are optimised for samples volumes around 10 times smaller than
conventional liquid state probes. This microprobe design gives an improved filling factor (the

20
fraction of the coil detection volume filled with sample) which is crucial to improving
sensitivity.
2.2.3 NMR spectral assignment
Chemical shift describes the dependence of nuclear magnetic energy levels on the electronic
environment in a molecule[51]. Specifically, the external magnetic field induces currents of the
electrons in molecular orbital. These induced currents create local magnetic fields that often
vary across the entire molecular framework so that nuclei in distinct molecular environments
usually experience unique local fields from this effect. Because of the shielding effect, NMR is
highly specific to the chemical structure of a molecule and distinct chemical species possess
characteristic chemical shifts. Therefore, chemical shift information is suitable for
identification and quantization of NMR detectable molecules[52]. Chemical shift is usually
expressed in parts per million (ppm) by frequency, because it is calculated from the difference
in precession frequency between tow nuclei over the operating frequency of the magnet.
J-coupling or indirect nuclear spin-spin coupling is an indirect scalar interaction between two
nuclear spins which arises from hyperfine interactions between the nuclei and local electrons.
It describes the interaction of nuclear spins through chemical bonds. As an important
observable effect in 1D NMR, it can provide some of the most useful information of the
molecular structure. For example, in a CH3-CH2 group,the CH3 group is split into a triplet with
an intensity ratio of 1:2:1 by two neighbouring CH2 protons [25].
Compared with metabolites, lipids usually have a larger molecular weight and give broader and
less resolved peaks in the 1H NMR spectra. Several important moiety of lipids can be identified
in the proton spectrum, including –CH3 at 0.9ppm, –CH2 –at 1.3ppm, –CH2–CH2–C=O

21
at1.58ppm, –CH2–CH= at 2.02ppm, –CH2–CH2–C=O at 2.2ppm, =CH–CH2–CH= at 2.8ppm‚
–CH=CH– at 5.4ppm [37, 50]. The spectra acquired from lipid extracts re-suspended in
solvent, usually deuterated chloroform, are with better resolution [25].
2.2.4 HSQC to assign lipid species and metabolites
2D HSQC experiment is frequently used in NMR studies of organic molecules and is of
particular significance in the field of lipid and protein NMR. A HSQC spectrum is two-
dimensional with one axis for 1H and the other for a heteronucleus, most often 13C for lipid
studies. The analysis of lipid composition and other non-lipidic metabolites is important in
understanding the malignance transformation and the treatment of tumours. Most fatty acids
and small-molecule metabolites can be differentiated by their NMR spectra; however a huge
signal overlap of 1D 1H spectrum brought difficulties in the analysis of mixtures such as cell
extracts. 1D 13C spectrum is capable of providing better resolution but its low sensitivity
requires higher sample concentration, a major challenger for cell extracts. HSQC spectrum
contains information from each unique proton attached to the heteonucleus [53], the more
sensitive proton signal acquired with extra information from carbon nuclei makes it possible to
give a more accurate assignment to individual metabolite and fatty acid side-chain (Figure 2.2)
[54] in the extracts of tumour cells.
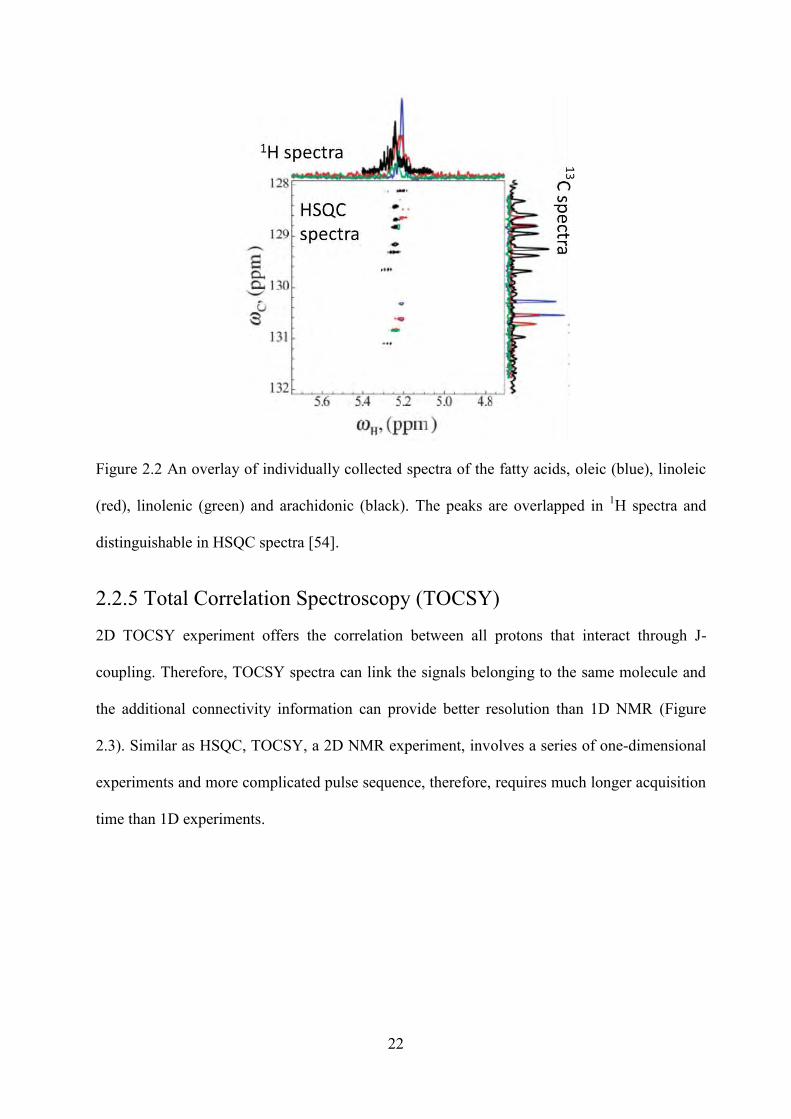
22
Figure 2.2 An overlay of individually collected spectra of the fatty acids, oleic (blue), linoleic
(red), linolenic (green) and arachidonic (black). The peaks are overlapped in 1H spectra and
distinguishable in HSQC spectra [54].
2.2.5 Total Correlation Spectroscopy (TOCSY)
2D TOCSY experiment offers the correlation between all protons that interact through J-
coupling. Therefore, TOCSY spectra can link the signals belonging to the same molecule and
the additional connectivity information can provide better resolution than 1D NMR (Figure
2.3). Similar as HSQC, TOCSY, a 2D NMR experiment, involves a series of one-dimensional
experiments and more complicated pulse sequence, therefore, requires much longer acquisition
time than 1D experiments.
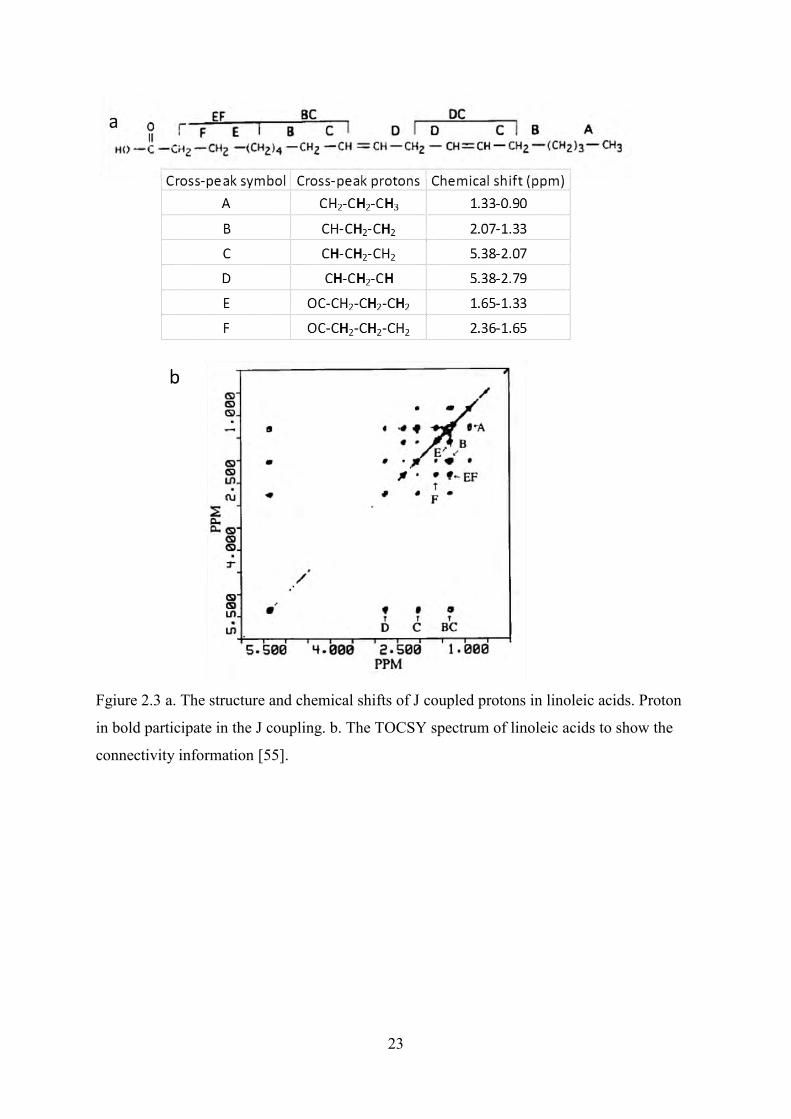
23
Fgiure 2.3 a. The structure and chemical shifts of J coupled protons in linoleic acids. Proton
in bold participate in the J coupling. b. The TOCSY spectrum of linoleic acids to show the
connectivity information [55].

24
Chapter 3 NMR detectable lipids and
metabolites

25
3.1 NMR detectable lipids
A certain group of cell lipids can be detected using nuclear magnetic resonance spectroscopy
(NMR) both in vivo and in vitro. Increasing evidence has been found to support that these
NMR lipid signals can provide vital information on the life and death of cells [50] and have
important applications to both clinical and research settings.
3.1.1 Clinical applications
With the involvement of NMR in the clinical management of brain tumour patients, this
technique has been increasingly important in brain tumour diagnosis prior to biopsy [56], in
monitoring the response of tumours to drugs or irradiation and in early detection of tumour
recurrence [57]. The biochemical profiles are established from the resonances of important
metabolites such as choline, creatine, lactate and an important component among these are the
mobile lipids [58].
Lipid resonances have been detected in different types of tumour cells and tissues and [37, 59]
seen in the 1H NMR performed on brain tumour patients. Increasing clinical and experimental
observations show that these lipid signals are related to the tumour type, grade [37, 60] and
treatment response [34, 61], demonstrating the potential of these signals to be used as a
diagnostic tool and to monitor the effectiveness of therapies.
3.1.1.1 Diagnostic use
The major metabolic alterations found using NMR in brain tumours compared to normal brain
have been described in several studies which include the appearance of lipids[62-64]. A study
across more than 100 primary brain tumour spectra showed that the lipid signals occurred in
some primitive neuroectodermal tumours and astrocytic tumours were not detected in other
types such as oligodendrogliomas, ependymomas and meningiomas [60]. In addition, the lipid
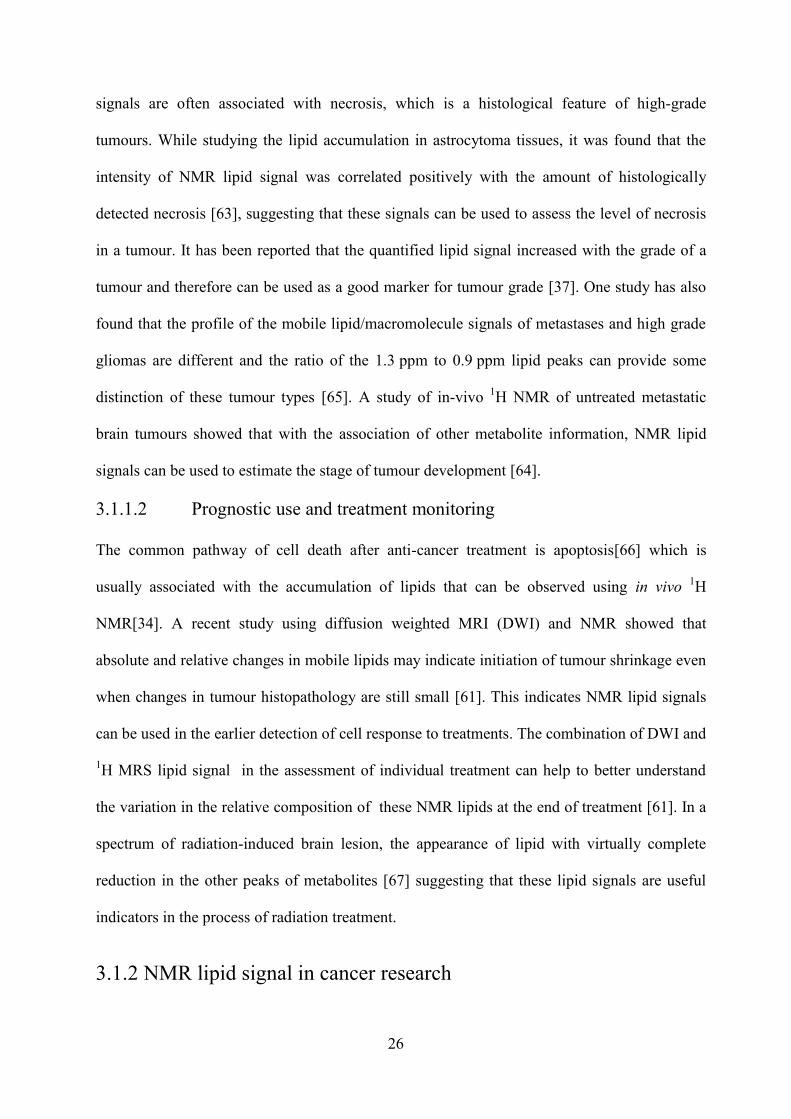
26
signals are often associated with necrosis, which is a histological feature of high-grade
tumours. While studying the lipid accumulation in astrocytoma tissues, it was found that the
intensity of NMR lipid signal was correlated positively with the amount of histologically
detected necrosis [63], suggesting that these signals can be used to assess the level of necrosis
in a tumour. It has been reported that the quantified lipid signal increased with the grade of a
tumour and therefore can be used as a good marker for tumour grade [37]. One study has also
found that the profile of the mobile lipid/macromolecule signals of metastases and high grade
gliomas are different and the ratio of the 1.3 ppm to 0.9 ppm lipid peaks can provide some
distinction of these tumour types [65]. A study of in-vivo 1H NMR of untreated metastatic
brain tumours showed that with the association of other metabolite information, NMR lipid
signals can be used to estimate the stage of tumour development [64].
3.1.1.2 Prognostic use and treatment monitoring
The common pathway of cell death after anti-cancer treatment is apoptosis[66] which is
usually associated with the accumulation of lipids that can be observed using in vivo 1H
NMR[34]. A recent study using diffusion weighted MRI (DWI) and NMR showed that
absolute and relative changes in mobile lipids may indicate initiation of tumour shrinkage even
when changes in tumour histopathology are still small [61]. This indicates NMR lipid signals
can be used in the earlier detection of cell response to treatments. The combination of DWI and
1H MRS lipid signal in the assessment of individual treatment can help to better understand
the variation in the relative composition of these NMR lipids at the end of treatment [61]. In a
spectrum of radiation-induced brain lesion, the appearance of lipid with virtually complete
reduction in the other peaks of metabolites [67] suggesting that these lipid signals are useful
indicators in the process of radiation treatment.
3.1.2 NMR lipid signal in cancer research

27
Increased NMR lipid signals at 0.9ppm and 1.3ppm have been reported in many cancer cells
and tissues[50]. NMR lipid signals have also been linked to important cellular processes, such
as proliferation[68],malignancy[50], necrosis[37], growth arrest[69] and apoptosis[12, 70].
Increased lipid signals have been reported in cancer cells exposed to anti-cancer drugs or to
anti-Fas antibodies [71]. These observations suggest that NMR lipid signals can be used as a
tool to study intact cancer cells undergoing biological changes.
As an analytical technique, NMR is also capable of revealing a detailed chemical structure of
target molecules. Therefore, NMR lipid signal has also been used to study the lipid profile and
lipid species of brain tumour tissues [25] and the difference of lipid composition between
normal and malignant human tissues [72] .
3.2 Origin of NMR lipid signal
NMR is increasingly used in the research and clinical practice. It is important to clarify the
origin of these lipid signals. The main controversy once lay in whether these resonances
originate from inter-membrane micro domains or the cytoplasmic lipid droplets [73]. There is
increasing evidence to support the latter.
The origin of these lipid signals was first thought to be from globular plasma membrane micro-
domains. An earlier study about the subcellular location of these NMR visible lipids in a
lymphocyte cell line proposed that these lipid signals mainly came from the lipid bilayers at the
plasma membrane [74]. It is suggested that the increased lipid signals in leukaemic cells
compared with normal lymphocytess was due to the increase of cell membrane fluidity caused
by the leukaemic transformation and cell differentiation [74]. Then, it was further postulated
that these signals came from lipoprotein like structures of the cell plasma membrane [74]. The
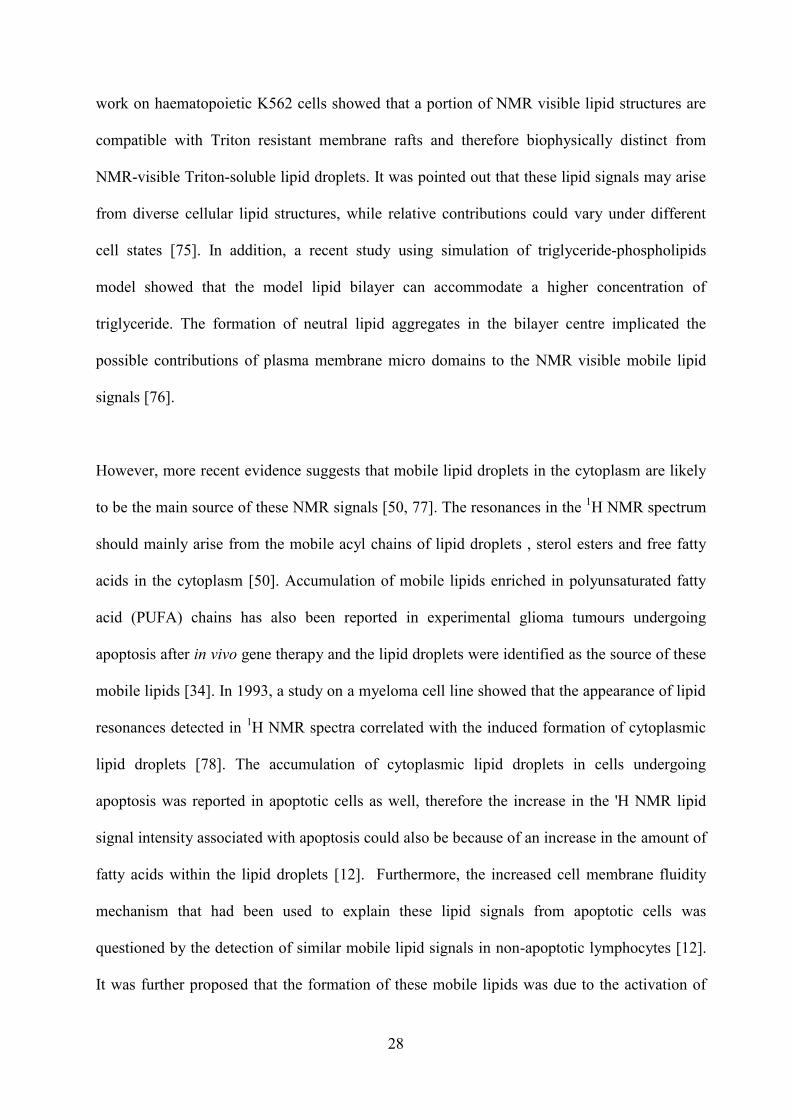
28
work on haematopoietic K562 cells showed that a portion of NMR visible lipid structures are
compatible with Triton resistant membrane rafts and therefore biophysically distinct from
NMR-visible Triton-soluble lipid droplets. It was pointed out that these lipid signals may arise
from diverse cellular lipid structures, while relative contributions could vary under different
cell states [75]. In addition, a recent study using simulation of triglyceride-phospholipids
model showed that the model lipid bilayer can accommodate a higher concentration of
triglyceride. The formation of neutral lipid aggregates in the bilayer centre implicated the
possible contributions of plasma membrane micro domains to the NMR visible mobile lipid
signals [76].
However, more recent evidence suggests that mobile lipid droplets in the cytoplasm are likely
to be the main source of these NMR signals [50, 77]. The resonances in the 1H NMR spectrum
should mainly arise from the mobile acyl chains of lipid droplets , sterol esters and free fatty
acids in the cytoplasm [50]. Accumulation of mobile lipids enriched in polyunsaturated fatty
acid (PUFA) chains has also been reported in experimental glioma tumours undergoing
apoptosis after in vivo gene therapy and the lipid droplets were identified as the source of these
mobile lipids [34]. In 1993, a study on a myeloma cell line showed that the appearance of lipid
resonances detected in 1H NMR spectra correlated with the induced formation of cytoplasmic
lipid droplets [78]. The accumulation of cytoplasmic lipid droplets in cells undergoing
apoptosis was reported in apoptotic cells as well, therefore the increase in the 'H NMR lipid
signal intensity associated with apoptosis could also be because of an increase in the amount of
fatty acids within the lipid droplets [12]. Furthermore, the increased cell membrane fluidity
mechanism that had been used to explain these lipid signals from apoptotic cells was
questioned by the detection of similar mobile lipid signals in non-apoptotic lymphocytes [12].
It was further proposed that the formation of these mobile lipids was due to the activation of

29
biochemical pathways triggered in response to cell stimulation rather than the mechanisms of
cell degradation and the loss of cell function[12]. Another study on C6 glioma cells found that
the behaviour of these lipid signals is paralleled by the percentage of cells containing
epifluorescence detectable Nile Red stained cytosolic droplets. It is also suggested that the
amount of NMR detectable mobile lipid could correlate with the cell proliferation rate [79].
3.2.1 Mobile and immobile lipids
NMR detection depends largely on the mobility of the detected molecules due to transverse
relaxation rate (R2) [50]. The evaluated lipid signal is caused by not only an increased amount
of mobile lipid content but the increased mobility of these lipids as well. In the work from
Blankenberg et al, it is pointed out that 1H NMR methylene resonances from intact, viable
lymphoblasts are broad and rarely observed because the acyl chains of the plasma lipid bilayer
are relatively immobile. A decrease in plasma membrane micro-viscosity must be sufficient
enough to increase the mobility of these lipids to give rise to the 1H NMR signal found in
apoptotic lymphoblasts [80]. Furthermore, the loss of cytoskeletal architecture may also allow
for the increased membrane lipids mobility [81].
Cytoplasmic lipid droplets are more often regarded as mobile lipids compared with the lipids in
the membrane raft; however, they are not floating freely in the cytoplasm but oscillating in a
restricted area formed by several cytoskeletal structures [82].Although they are under active
motion, their movement is in a directed manner explained by the restriction or guidance of
these cytoskeletal structures [82]. The restriction from cytoskeletal structures becomes loose
when the restriction area expands. Therefore, the accumulation of lipids inside these droplets
can increase their mobility due to the expanded size.

30
3.3 NMR detectable metabolites
NMR is a powerful tool to detect small molecular weight metabolites. NMR metabolite signals
can be used to assess the progression of tumour cells. It was first demonstrated that NMR could
detect metabolites in biological samples in 1974 [83]. The commonly observed metabolites
with NMR in brain tumours [84] and their cell lines [69] are: glycerophosphocholine (GPC),
phosphocholine (PC), choline (Cho), creatine (Cr), glycine (Gly), glutamine, glutamate, lactate
, alanine, taurine, myo-inositol, scyllo-inositol, valine and lactate.
3.3.1 In vivo MRS metabolite signal
MRS is a non-invasive technique for detection of the metabolites present in a selected volume
of a tumour or a region of interest. The metabolite signal can be used to assess a range of
diseases and conditions, such as brain tumours [85, 86], brain injury [87, 88] and some
neurological conditions [88, 89]. The ratio between Cho/Cr is a strong indicator of cancerous
tissue. Cho ratios have been used to monitor treatment response [90], recurrence and radiation
changes with radiotherapy [91]. The ratio of N-Acetylaspartic acid (NAA)/Cho can be used to
differentiate high and low grade gliomas [92]. Gly has been shown to be a marker for
malignancy and tumour aggressiveness [93].
3.3.2 In vitro NMR metabolite signal
NMR has been used to detect metabolites present in cells and tissues [69, 94]. A generally
good agreement observed between in vivo MRS and in vitro NMR on the quantities of
metabolites in brain tumours [84] showed that in vitro NMR studies can be used to improve the
analysis and understanding of clinical data. The investigation of metabolites in a glioblastoma
cell line shows that NMR can be used to reveal the metabolite alteration in tumour cell death
[69].

31
A widely studied group of metabolites in brain tumours are choline containing metabolites
(CCMs). Decreases in PC and increases in GPC have been observed in apoptotic rat glioma
[95]. Similarly, reduced levels of PC were detected in HSV-tk gene therapy treated BT4C
glioma cells leading to arrest in the G2/M phase of the cell cycle [34]. In addition to CCM , a
number of 1H MRS detectable metabolites such as taurine, glycine, alanine, succinate and
glutamate have been observed to undergo changes in cisplatin treated apoptotic BT4C cells
[69]. Therefore, a large number of endogenous metabolites and their alteration under treatment
can be monitored by NMR.
3.3.3 NMR in metabonomic studies
NMR is a powerful technique in metabonomic studies [96]. Many metabolites can be
simultaneously identified to give a metabolite profile. With appropriate statistical analysis,
metabolite profiles can be used to analyse the metabolism, important cellular processes of
tumour cells [69, 97]. The metabonomic approach associated with this technique has also been
used to build tumour classifiers as a diagnostic tool [98].
3.4 NMR spectroscopy in biomarker identification
A biomarker is a substance used as an indicator of biological states. Biomarkers can be used to
identify the presence, type, grade and progress of cancers and to determine the response to
cancer therapy [99, 100].
NMR, as a quantitative and qualitative method, can be used to investigate targeted metabolites
or lipids. A verification of their biomarker value can be undertaken by performing formal
assignment and quantitative analysis of NMR peaks [91, 93]. The level of apoptosis induced by

32
anti-cancer drugs was reported to be associated with the increase in the signal density of NMR
lipid peak at 1.3ppm. The NMR lipid signal was proposed to be useful in the study of
pharmacological effects of anti-cancer drugs [101].
The presence of 2-hydroxyglutarate, a metabolite accumulated in glioma patients carrying a
genetic mutation, on MRS would differentiate a tumour from a non-neoplastic lesion. It can
serve as a prognostic marker due to the association of this mutation with improved survival
among gliomas. Biomarkers can also be used in treatment response and follow up [102].
3.5 The Lipid droplet
Same as most sub-cellular structures, lipid droplets were first observed using an electronic
microscope around half century ago [103]. Lipid droplets are one form of macromolecular
proteolipid assemblies that present in most of the living organisms from animals, bacteria to
plants [73]. It the past two decades, lipid droplets have gathered increasing attention from
scientists due to their widespread distribution and dynamic metabolic role.
3.5.1 Structure
The structure of lipid droplets (Figure 3.1) is unique and quite different from other sub-cellular
structures which usually consist of one or more aqueous compartments separated by bilayer
lipid membranes. Lipid droplets have a spherical appearance surrounded by a monolayer of
polar lipids [104] with embedded or attached proteins that encircles a hydrophobic core of
various species of neutral lipids [73]. The same structure can be found both intracellular and
extracellular. However, only a few cell types, such as the epithelial cells of the small intestine
and liver cells have the capability to secret extracellular lipoprotein droplets, whilst almost all
cells are capable of accumulating neutral lipids and store them in cytoplasmic lipid droplets
[73].
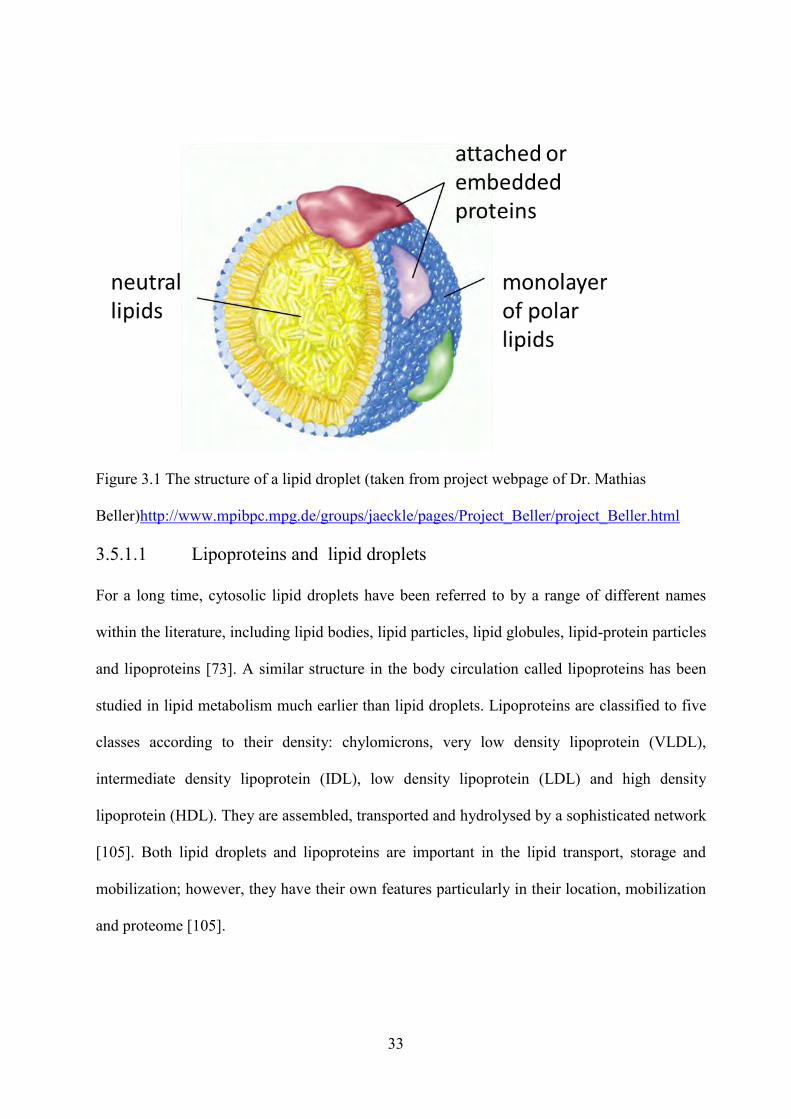
33
Figure 3.1 The structure of a lipid droplet (taken from project webpage of Dr. Mathias
Beller)http://www.mpibpc.mpg.de/groups/jaeckle/pages/Project_Beller/project_Beller.html
3.5.1.1 Lipoproteins and lipid droplets
For a long time, cytosolic lipid droplets have been referred to by a range of different names
within the literature, including lipid bodies, lipid particles, lipid globules, lipid-protein particles
and lipoproteins [73]. A similar structure in the body circulation called lipoproteins has been
studied in lipid metabolism much earlier than lipid droplets. Lipoproteins are classified to five
classes according to their density: chylomicrons, very low density lipoprotein (VLDL),
intermediate density lipoprotein (IDL), low density lipoprotein (LDL) and high density
lipoprotein (HDL). They are assembled, transported and hydrolysed by a sophisticated network
[105]. Both lipid droplets and lipoproteins are important in the lipid transport, storage and
mobilization; however, they have their own features particularly in their location, mobilization
and proteome [105].
34
Several apolipoproteins and their isoforms from apo-protein family were found in a detailed
study of the protein composition of VLDL using both two dimensional electrophoresis and
mass spectrometry [106]. The same combined technique was also performed on HDL and it
was shown that 56 proteins including all known apolipoprotein and lipid transport proteins
were associated with HDL [107].
The protein species on the lipid droplets are more complicated. A relatively well studied
member of the lipid droplet proteome is the PAT domain protein family, which is composed of
Perilipin, adipocyte differentiation related protein (ADRP) and the 47-kDa tail interacting
protein (TIP47). It is suggested that Perilipin and ADRP are both constitutively localized to the
lipid droplets [108]. Perilipin controls the rate of lipolysis [109] whereas ADRP modulates the
intracellular neutral lipid transport [110]. Caveolins, which traffic lipids from the Golgi and
plasma membrane, are frequently found in lipid droplets as well [111]. Recently, a
comprehensive proteomic study using mass spectrometry on purified lipid droplets from
Chinese Hamster Ovarian K2 (CHO K2) cells identified 125 proteins and some of them were
involved in the protein phosphorylation and Guanosine-5'-triphosphate (GTP) -mediated
protein translocation. The proteins that regulate trafficking pathways such as Rab proteins are
also identified [112]. In addition to lipid storage, these cytoplasmic lipid droplets were also
found to be able to serve as transient storage depots for proteins that lack appropriate binding
partners and provide them until they are needed.
3.5.1.2 Lipid rafts and lipid droplets
Lipid rafts and droplets are two sub-cellular structures that mainly consisted of lipids. The
former is a liquid ordered platform that compartmentalizes membranes while the latter is a
lipid-enriched depot served for lipid storage, transportation and other important cellular

35
activities [113]. Phospholipid bilayers can accommodate about 3% Triglyceride (TG) or 5%
sterol esters before the neutral lipids phase separate to form spherical domains [73] and these
structures of neutral lipids sandwiched between the bilayer leaflets are referred as membrane
micro domains, a possible contributor to the NMR visible lipid signal [74]. The simulation of
the lipid bilayer membrane work reported that evidence for the formation of stable, disordered,
mobile triolein aggregates at the centre of a lipid bilayer implicated the possible relation
between the lipid rafts and lipid droplet biogenesis [76]. The proteome and genome of lipid
droplets links lipid droplets with membrane trafficking. This indicates an active interaction
between lipid rafts and droplets [114].
3.5.2 Formation of lipid droplets
The biogenesis of lipid droplets including the site and process is still unclear. It is generally
believed that lipid droplets are formed de novo rather than duplicated from existing droplets
based on the observation that lipid droplets formed rapidly with the supply of free fatty acid
using live cell imaging [115]. The initial event of lipid accumulation cannot be spotted due to
the limitation of microscope resolution. However, there is evidence to suggest that lipid
droplets are likely to originate from the endoplasmic reticulum(ER). In some electron
microscopic images, lipid droplets were found to be connected with the ER membrane [116,
117]. In addition, the proteins that are involved in the synthesis of neutral lipids in the lipid
droplet core are mostly localized on the ER [118]. Several models have been proposed to the
ER formation of lipid droplets, the most frequently cited hypothesis (Figure 3.2) is that neutral
lipids are deposited in the membrane of the ER and segregate the two membrane leaflets by
phase separation. Then, the neutral lipids continue to accumulate towards the cytoplasm and
finally separate from the ER membrane and are released into the cytoplasm [73, 113]. This
model explains the origin of the phospholipids monolayer of lipid droplets and the continuity
observed between ER membrane and lipid droplets. A recent study using simulation also
36
confirmed the possibility of the neutral lipid accumulation in lipid bilayer membranes [76].
However, more direct evidence is still needed to support this theory.
Figure 3.2 The current model of endoplasmic reticulum(ER) formation of lipid droplets. a)
Neutral lipids are synthesized between the leaflets of the ER membrane. b) The LD then bud
from the ER membrane and c) matured with a monolayer of phospholipids and associated
proteins [113].
There is other data that suggests that lipid droplet biogenesis or growth might occur at the
plasma membrane. Lipid droplets were found to be formed from plasma membrane in some
gram-negative prokaryotes [119]. Furthermore, the PAT proteins which are integral to the
plasma membrane are found to be associated with lipid droplets [117] and caveolae, another
important protein that mainly located in the plasma membrane has been implicated in the lipid
droplet formation in adipocytes [120].
How neutral lipids are packaged into cytosolic droplets remains poorly understood. However,
with the development of photometric technique, many proteins of the lipid droplets have been

37
identified and it is further suggested that they are the main controllers of the growth of nascent
lipid droplets [41]. The observation that the majority of triglyceride in droplets is coated with
the proteins from the PAT family [121] indicated that the PAT protein family actually order the
neutral lipids packaging by managing the droplet interface with the cytosol.
3.5.3 Biological function of lipid droplets
Recent studies revealed that other than simply lipid inclusions, lipid droplets are dynamic
intracellular organelles with multiple cellular functions [113, 114]. Lipid droplets have been
involved in cell signalling, lipid metabolism, membrane trafficking and other important cellular
processes such as cell proliferation, apoptosis and necrosis [59, 113, 122]. For instance, a
recent study using ribonucleic acid interference (RNAi) screen in Drosophila identified
hundreds of genes involved in lipid-droplet formation and utilization and potentially link
diverse processes, such as protein synthesis and the cell cycle with lipid-droplet biology [123].
These findings indicate that lipid droplets are active cellular organelles that are vital to cell
growth and cell death.
3.5.3.1 Lipid storage
Traditionally, lipid droplets are viewed as specialized structures to store triacylglycerols, sterol
esters and other neutral lipids. There are 44% triacylglycerol, 34% cholesterol esters and 20%
other neural lipids stored in LDs of CHO K2 cells [112], and therefore it is widely accepted
that lipid droplets are essential reservoirs of metabolic energy and lipids. Later, free fatty acids
have been found in these lipid droplets [73] and it was proposed that in most cell types other
than adipocytes, the main function of lipid droplets is to collect these free fatty acids exerted by
cellular metabolism via triglyceride accumulation to avoid lipotoxic effects caused by these
free fatty acids [124]. A lipidomic study on CHO K2 cells by Bartz et al. revealed that although
lipid droplets contain only 1-2% phospholipids by weight, over 160 species were identified and
38
quantified. Phosphatidylcholine was the most abundant class and compared with total
membrane, the phospholipids were enriched in lysophospholipids [112]. These results
indicated that lipid droplets may function as a supply depot for the phospholipid biosynthesis
and play an important role in phospholipid recycling [112].
3.5.3.2 Interaction with other organelles
The evidence that lipid droplets interact with various organelles is extensive. The interaction
between lipid droplets and ER is of much importance since ER is the most probable site for the
biogenesis of lipid droplets [125]. However, some studies suggest there are regulated
interactions between them other than the lipid droplet formation. In macrophages loaded with
cholesterol and cholesterol esters, ER whorls were found to be embedded in the lipid droplets
and the esterase that regulates cholesterol ester and cholesterol was located on the ER whorls
[126].
Using electron microscopic imaging, the association between lipid droplets and mitochondria
has been identified [127]. The co-localization of lipid droplets and mitochondria in skeletal
muscle cells further supports their association [128]. Recent work using both electron and
confocal microscopy demonstrated that lipid droplets could form complexes with mitochondria
in NIH 3T3 fibroblasts. The presence of lipid droplet markers in isolated mitochondria was
reported [129]. The fact that fatty acid oxidation occurs in mitochondria in mammalian cells
suggests that lipid droplets are possibly one of the lipid suppliers for the beta oxidation in
mitochondria.
The members of Rab protein family which were frequently identified in the lipid droplet
proteome [114] strongly support the interaction of lipid droplets with other intracellular
39
organelles since Rab proteins recruit a variety of functional proteins to mediate vesicle motility,
docking and fusion to the target membranes [130]. For example, the work carried out by Liu et
al. indicated a role for Rab5 protein in the association of lipid droplets with early endosomes
[114]. Rab18, as a component of LDss induce apposition of LDs to the ER [104]. Therefore,
the current hypothesis is that each Rab specie on lipid droplets regulates interaction with a
specific membrane system.
3.5.3.3 Cellular signalling
Cell signalling is part of a complex system of communication that governs basic cellular
activities and coordinates cell actions. Although lipids may not be the direct actors to catalyze
reactions, they can participate in cellular activities as mediators. Especially for fatty acids, they
not only served as signalling molecules themselves but also as precursors of the synthesis of
other signalling lipids [131]. Signalling lipids, including eicosanoids, phosphoinositides,
sphingolipids and fatty acids, control important cellular processes such as cell proliferation,
apoptosis, metabolism and migration [131, 132]. Lipid droplets are expected to be involved in
these activities since they naturally contain some groups of signalling lipids. Further evidence
now shows that lipid droplets have been involved in the synthesis of eicosaniods [133] which
are arachidonic acid-derived signalling lipids. Well P.F. et al. demonstrated that arachidonate is
incorporated and etherified prominently in lipid droplets in leukocytes [134]. In addition, a
recent proteomic study suggested that lipid droplets governs lipid homeostasis and intracellular
trafficking through protein phophorylation and GTP-regulated protein translocation [112].
These studies further support the active role of lipid droplets in cellular signalling.
3.5.4 Lipid droplets in tumours
Initially, attention was drawn into lipid droplet research from the observation of excess lipid
accumulation in some of the most widespread human diseases, such as atherosclerosis, diabetes

40
and obesity. Recently there is increasing evidence that lipid droplets are also implicated in
other important pathologies such as inflammation [134], virus infections [135] and particularly
in malignancy [136].
The association between lipid droplets and tumours are largely emphasised by the 1H NMR, a
powerful technique to detect mobile lipids. The NMR lipid signal which is thought to mainly
rise from cytoplasmic lipid droplets is observed frequently in cancer cells [50, 59, 74, 137].
These lipid resonances have been more frequently observed in brain tumour patients
implicating the association between NMR lipid signals and tumours [50]. An increased
numbers of lipid droplets in human colon adenocarcinoma compared with the adjacent normal
tissue was observed [138]. These data suggest that the increase of either the number or size of
lipid droplets is a common feature in many malignant cells and tissues. It is also pointed out
that the accumulation of lipid droplets occurring in cancers is more likely because of active cell
proliferation or necrosis [37, 50].
Some proteins known to be involved in cell transformation, tumourigenesis and metastasis
such as PI3K, ERK1, ERK2, P38 ,P22 are found to localize in lipid droplets from various cells
[114, 139, 140], which implicates the relationship of lipid droplets with tumour development.
Another study demonstrated that lipid droplets were centrally involved in prostaglandin E2
synthesis in colon cancer cells indicating the potential involvement of lipid droplets in the
pathogenesis of colon andenocarcinoma [138].
3.5.5 Lipid droplet alterations with cancer treatment
The observation of NMR visible lipid signals in drug-induced apoptotic cells [81, 141]
suggests there is an alteration of lipid metabolism in lipid droplets during drug treatment. The
accumulation of cytoplasmic lipid droplets was demonstrated using microscopic and flow
41
cytometric measurements in both murine lymphoma cells and animal tumour models
undergoing etoposide induced apoptosis [141]. The similar accumulation of lipid droplets was
reported by Massimo et al. in apoptotic T lymphoblastoid cells and they proposed that this
process happened during an early and biochemically active phase of programmed cell death
[12]. The increase of NMR lipid signal in a human prostatic carcinoma cells treated with
differentiating agent phenylacetate suggests that lipid droplet accumulation can also be induced
in cell growth arrest rather than cell death [142].
There are also studies indicating the lipid content alteration in lipid droplets with treatment. For
example, polyunsaturated fatty acid accumulation (PUFA) in lipid droplets was observed in
glioma cells with gene therapy [34].
3.5.6 Microtubular system in cytoplasm
Lipid droplets participate in various intracellular processes in various locations with the
assistance of cytoskeletal polymers (Figure 3.3), also called the microtubules or the
intermediate filaments [73]. It was firstly observed that the intermediate filament proteins,
particularly vimentin, appeared to form cage-like structures around the small lipid droplets in
newly differentiating 3T3-L1 cells [143]. Live cell imaging in cultured mammal cells showed
that most droplets were oscillating in a restricted area and move in a directed manner along
these fibrous network [41]. It is proposed that lipid droplets might be associated with various
cytoskeletal elements in different cell types and these cytoskeleton related proteins might serve
the role to protect lipid droplets from lipolysis and tether them to the general cytoskeleton
network [73].
It is demonstrated in Bostrom et al’s study of NIH 3T3 cells that the growth of lipid droplets is
independent of triglyceride biosynthesis but involves the formation of microtubule dependent
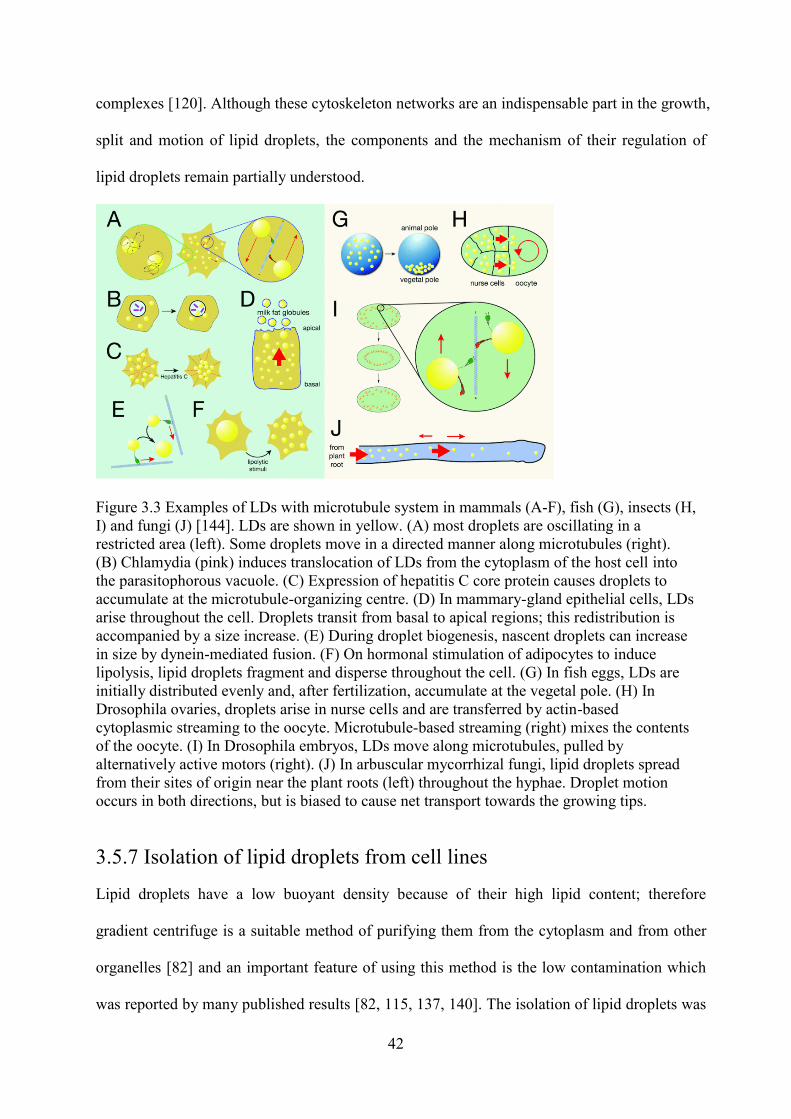
42
complexes [120]. Although these cytoskeleton networks are an indispensable part in the growth,
split and motion of lipid droplets, the components and the mechanism of their regulation of
lipid droplets remain partially understood.
Figure 3.3 Examples of LDs with microtubule system in mammals (A-F), fish (G), insects (H, I) and fungi (J) [144]. LDs are shown in yellow. (A) most droplets are oscillating in a restricted area (left). Some droplets move in a directed manner along microtubules (right). (B) Chlamydia (pink) induces translocation of LDs from the cytoplasm of the host cell into the parasitophorous vacuole. (C) Expression of hepatitis C core protein causes droplets to accumulate at the microtubule-organizing centre. (D) In mammary-gland epithelial cells, LDs arise throughout the cell. Droplets transit from basal to apical regions; this redistribution is accompanied by a size increase. (E) During droplet biogenesis, nascent droplets can increase in size by dynein-mediated fusion. (F) On hormonal stimulation of adipocytes to induce lipolysis, lipid droplets fragment and disperse throughout the cell. (G) In fish eggs, LDs are initially distributed evenly and, after fertilization, accumulate at the vegetal pole. (H) In Drosophila ovaries, droplets arise in nurse cells and are transferred by actin-based cytoplasmic streaming to the oocyte. Microtubule-based streaming (right) mixes the contents of the oocyte. (I) In Drosophila embryos, LDs move along microtubules, pulled by alternatively active motors (right). (J) In arbuscular mycorrhizal fungi, lipid droplets spread from their sites of origin near the plant roots (left) throughout the hyphae. Droplet motion occurs in both directions, but is biased to cause net transport towards the growing tips.
3.5.7 Isolation of lipid droplets from cell lines
Lipid droplets have a low buoyant density because of their high lipid content; therefore
gradient centrifuge is a suitable method of purifying them from the cytoplasm and from other
organelles [82] and an important feature of using this method is the low contamination which
was reported by many published results [82, 115, 137, 140]. The isolation of lipid droplets was

43
performed by Hood et al. on bovine mammary tissues using grinders as early as 1973 [145].
Various approaches of disrupting tissues and cells were evaluated and the main issue was the
low yield of lipid droplets due to the incomplete cell disruption and cellular damage [145].
In1991, Weller’s group successfully isolated the cytoplasmic lipid droplets of human blood
cells using gradient ultracentrifuge. In this work, nitrogen cavitation followed by
deoxyribonuclease (DNase) treatment was chosen for cell disruption to optimise the lipid
droplet release and recovery [146]. In 1998, Yu et al. got a satisfactory isolation of lipid
droplets by the use of tight-fitting Dounce homogenizer and illustrated that a reasonable yield
of isolated lipid droplets could be achieved just by the use of grinders with an appropriate
clearance [137]. In this process, after the ultracentrifuge, the sample was separated into four
fractions, Lipid droplet, Mid-zone, Cytosol and Pellet. All four fractions were subjected to the
protein distribution and enzyme specific activity analysis and the lipid droplet enriched fraction
was found to be essentially free of cytosolic and microsomal contamination [137].
3.6 Aims and objectives
The aims of this research are to investigate cytoplasmic lipid droplets as the origin of NMR
detectable lipids in nervous system tumour cell lines, determine how these droplets and their
NMR signal alter with treatment and identify potential lipids/ metabolites as biomarkers in
cancer cell death.Objectives
The research was planned into five steps to achieve the main purpose:
1. To isolate lipid droplets from cell lines and determine the composition of the LDs using
NMR and MS.
In chapter 5, BE(2)M17, a human neuroblastoma cell line, with the biggest LDs among the
five tumour cell lines was chosen to optimise and validate the isolation protocol. NMR spectra
from whole cells, the isolated fraction containing the LDs and their extracts were acquired to
44
characterize the LDs in BE(2)M17 cells. A more detailed chemical analysis on LD extracts was
performed by MS.
2. To investigate the correlation between LD size and NMR lipid signal intensity.
In chapter 6, Nile red staining was performed on whole cells to assess the size of LDs in five
nervous system tumour cell lines. NMR was performed to investigate the visibility and signal
intensity of NMR lipid signal. Statistics analysis was performed to investigate the correlation
between LD size and NMR lipid signal intensity.
3. To compare LD lipid composition with whole cell lipids using NMR for a range of cancer
cell lines.
In chapter 7, 1H NMR was performed on lipid extracts of whole cells and isolated LDs for five
tumour cell lines to investigate the difference in lipid composition between whole cells and
LDs.
4. To establish the alterations which occur in the LDs when the tumours are treated with drug.
In chapter 8, two brain tumour cells were treated with cisplatin, a deoxyribonucleic acid
(DNA) damaging agent, which is known to be a key drug in treating medulloblastoma and
primitive neuro-ectodermal tumours. LD accumulation was monitored by Nile red staining. 1H
NMR was performed on isolated LDs, whole cell pellets and their extracts to investigate the
alteration of LDs with cisplatin treatment.
5. To identify other NMR detectable biomarkers for early treatment response of drug exposure,
which may be related to LDs.

45
In chapter 9, 1H NMR metabolite profiles of two glioma and two neural tumour cell lines were
examined to identify early markers for treatment response. Cell nuclei staining and RNA
laddering was performed to assess the cell death/apoptosis.
46
Chapter 4 Materials and methods

47
4.1 Nervous system tumour cells
Five nervous system tumour cells are investigated in this study: BE(2)M17, a human
neuroblastoma cell line; BT4C, a rat glioblastoma cell line; U87-MG, a human glioblastoma
cell line; PFSK-1, a human supratentorial primitive neuroectodermal tumour (ST-PNET) cell
line; DAOY, a human medulloblastoma cell line.
4.1.1 Cell culture
Cells were grown in 25cm2 or 75 cm2 flasks with filter-vented caps (IWAKI, UK and Corning,
UK) and maintained in 15-20ml Dulbecco’s modified Eagles medium (DMEM F:12,
Invitrogen, UK) supplemented with 1% 200mM L-glutamine (100x) (Invitrogen, UK ), 10%
(v/v) fetal calf serum (PAA, UK) and 1% minimum essential medium (MEM) non-essential
amino acid solution (100x) (Sigma Aldrich, Dorset, UK). Cells were incubated at 370C in a
humidified atmosphere with 5% CO2 and 95% air. Cells were seeded at approximately 1-
2x10⁵/ml and were usually passaged on day 2 of culture at around 90% confluence.
The detachment of cells was performed as follows: The culture medium was removed using
sterile plastic pipettes. Cells were then washed with 5-6ml autoclaved phosphate buffered
saline (Dulbecco’s A PBS, Sigma Aldrich, UK). After the removal of PBS, 1ml accutase
solution (PAA, UK) was added in and the flask was placed in the incubator for 1-5 minutes
until cells were lifted off from the flask surface.
After the detachment, 10ml culture media was added in to stop the action of accutase and form
a single cell suspension with gentle pipetting. Suitable number of cells, usually 1 to 3 ml of the
cell suspension containing approximately 2x10⁶ cells were transferred to a new flask and
refilled with 15-20ml of culture medium.
48
4.1.2 Cell counting
After the cells were detached from the flask, one drop (~20 μl) of the cell suspension in
PBS/medium was added to the chamber of a Neubauer haemocytometer (Ruling 1/400 mm2,
cell depth 0.1 mm+1%; Hawksley, UK) by a sterile plastic transfer pipette. The cells were then
counted under a Nikon TMS microscope (Nikon Instruments Europe B.V., UK) with the 40 x
magnification lens.
4.1.3 Cisplatin treatment of cancer cell lines
Cisplatin (cis-dichlorodiammineplatinum II) was used to treat the cells. 100 mg of this drug
was purchased from Sigma-Aldrich, UK (P4394) in a yellow coloured powder form.
2mM cisplatin stock solution was made with DMEM F:12 solution. Cisplatin powder was
dissolved in DMEM and vortexed intensely with a whirler to ensure it was completely
dissolved. 60-500µl aliquots of the stock solution were put in autoclaved eppendorf tubes and
stored in -800C freezer under dark conditions.
Cells were exposed to cisplatin for the indicated times. On the day of treatment, the required
amount of cisplatin stock solution was thawed and diluted to a concentration of 0.1, 1, 10 or
100µM in complete DMEM medium.
Cells were incubated overnight to achieve a suitable confluence, usually 70%-90% and the
cells were washed with PBS. Freshly made culture medium with cisplatin at a working
concentration was added into the cells and was further incubated for the indicated treatment
time in the same condition as regular cell culture.

49
4.1.4 Cell harvest
Untreated cells were harvested at 80-95% confluence. Cisplatin treated cells and the untreated
control cells were harvested at the indicated time point with a slightly different washing
procedure and centrifuge speed in order to collect the dead cells.
4.1.4.1 Cell pellets for isolation, extraction and NMR investigation
After washing with 10ml ice-cold phosphate buffered saline, PBS (Invitrogen Ltd., Paisley,
UK) three times, cells were then removed from the flask using a manual scraper and
centrifuged at 250g for 6min to form a pellet. Cisplatin treated cells and control cells were
scraped down directly into the medium and then washed with 10ml ice-cold PBS two times
with centrifuge at 720g for 3 min. 1ml ice-cold PBS was used for a third time wash and the cell
suspension was transferred into a 1ml CryoTubes™ (Nunc, Thermo Scientific, UK) with the
centrifuge at 720g for 3min. Samples to be investigated with NMR and subjected to extraction
and isolation were snap-frozen in liquid nitrogen and stored in the -800C freezer to minimize
the degradation.
4.1.4.2 Cell suspension for staining
The procedure for cell scraping and washing was similar to the pellet preparation. After the
wash, cell number was counted and adjusted to 3-5x10⁵/ml with ice-cold PBS. Cells were
stained or spun onto the slides right after the harvest as described in section 4.2.
4.2 Lipid droplets visualization

50
Both extracellular and intracellular lipid droplets were assessed using different staining and
microscopic methods.
4.2.1 Slides preparation
For whole cell samples, Shandon cytospin 3 (Shandon, Thermo Scientific, UK) was used to
separate and place a monolayer of the cells on slides while preserving their integrity. The slides
were assembled with filter cards (Shandon, Thermo Scientific, UK) and cytofunnel sample
chambers (Shandon, Thermo, Scientific, UK). They were then placed in cytoclips (Shandon,
Thermo, Scientific, UK). 100μl of cell suspension containing 3-5x10⁴ cells was placed in each
cyto-funnel. The samples were then spun at 2000 rpm for 5 minutes at room temperature and
dried for at least 20min before staining. For the isolated fraction, an aliquot around 10µl was
dropped onto the slide and dried from at least 2 hours to overnight at room temperature.
4.2.2 Fluorescent microscopy
4.2.2.1 Nile red staining
Prepared slides were stained with 4µg/ml Nile red in PBS (made from 1mg/ml Nile red stock
solution in acetone, Sigma-Aldrich, Dorset, UK) for about 15 min under dark conditions. The
whole cell sample was usually followed with a DAPI staining. After the removal of staining
solution, a drop of 10µl anti-quenching mounting medium (Vector Laboratories Inc, CA) was
placed on the sample and covered with a 22x22mm cover slip.
4.2.2.2 Observation and fluorescent image capture
The slides were visualized with a Nikon Eclipse E600 microscope using 100X objective lens
and images were taken using a DXM1200 Nikon digital camera. The green fluoresce of Nile
red was observed with FITC (B-2A) filter set, with excitation wave length of 465-495 nm and
emission wave length of 550nm.

51
4.2.3 Light microscopy
4.2.3.1 Oil red O staining
Saturated Oil Red O (MERCK KGaA, Darmstadt, Germany) in 70% ethanol was applied to the
slides for 20 min, and then washed in running water. After haematoxylin staining, slides were
mounted with aqueous mounting medium and dried on a 370C heater for 2 hours.
Slides were observed with a Nikon Eclipse E600 under 100X oil objective lens using visual
light source. Pictures were taken by a DXM1200F digital camera attached to the microscope.
4.2.4 Transmission electron microscopy (TEM)
4.2.4.1 Negative staining
The isolated fraction was dropped onto a 300 mesh copper electron microscopy grid with
formvar coating. A 2% aqueous uranyl acetate solution was applied to the sample for 1 min.
4.2.4.2 TEM observation and image capture
After the negative staining, the grid with isolated LDs was observed using JEOL 1200EX TEM
(Jeol Ltd, Tokyo, Japan) with 120K amplification and images were captured with the camera
attached.
4.2.5 Post-processing for stained LD images
LD sizes were measured using the image analysis program ImageJ (National Institute of
Health, USA) (Figure 4.1) and presented as mean value ± standard deviation. The diameter of

52
all the LDs inside one cell was measured. The total LD volume of one cell was estimated with
the sum of the volume for each LD. The resolution limit of light microscopy is 200 nm. An
Inter Pixel Stepping (IPS) technique was used by the camera (DXM1200 digital camera,
Nikon) and ACT-1 software to increase the resolution of captured images by a factor of 9.
Figure 4.1 Image J 1.41O platform for image measurements. The diameter of a lipid droplet
is measured by drawing a line across the droplet and measuring the length of the line.
4.3 Lipid droplets isolation
A protocol developed by Weller et al. was used to isolate LDs [121, 140, 146]. In order to
minimise the enzyme activity and component degradation, the whole process was performed
53
with as low a temperature (40C) as possible and all the solution used was ice-cold prior to use.
At least three independent samples were prepared for each isolation.
4.3.1 Homogenous preparation
Approximately 40-60 million cells were taken out from -800C freezer, thawed at room
temperature and ground in either 600µl deionised water or D2O with a glass grinder (Sigma,
UK). The homogenate was transferred into an eppendorf tube and centrifuged at 2000g at 40C
for 10 min.
4.3.2 Sucrose-gradient ultracentrifuge
The supernatant after the first centrifuge was adjusted to 18.46% sucrose [140] by adding 1:4
(v:v) of 2.16M sucrose, topped with the same volume (600µl) as the sucrose fraction of
deionised water or D2O and centrifuged at 142,000g for 90min at 40C (Optima MAX
Ultracentrifuge, Beckman, Rotor TLA55, USA).Fraction collection
After ultracentrifugation, the sample was separated into three fractions, the upper isolated
fraction, the middle sucrose fraction and the pellet. The isolated fraction was collected for
extraction and subsequent NMR analyses. In order to control sucrose contamination, only the
top 300µl was collected for direct NMR experiment and top 450-500 µl was collected for lipid
extraction.
4.4 Gel electrophoresis of extracted protein from
different fractions after isolation
An experiment was performed to investigate the protein concentrations present in the fractions
after gradient centrifugation.
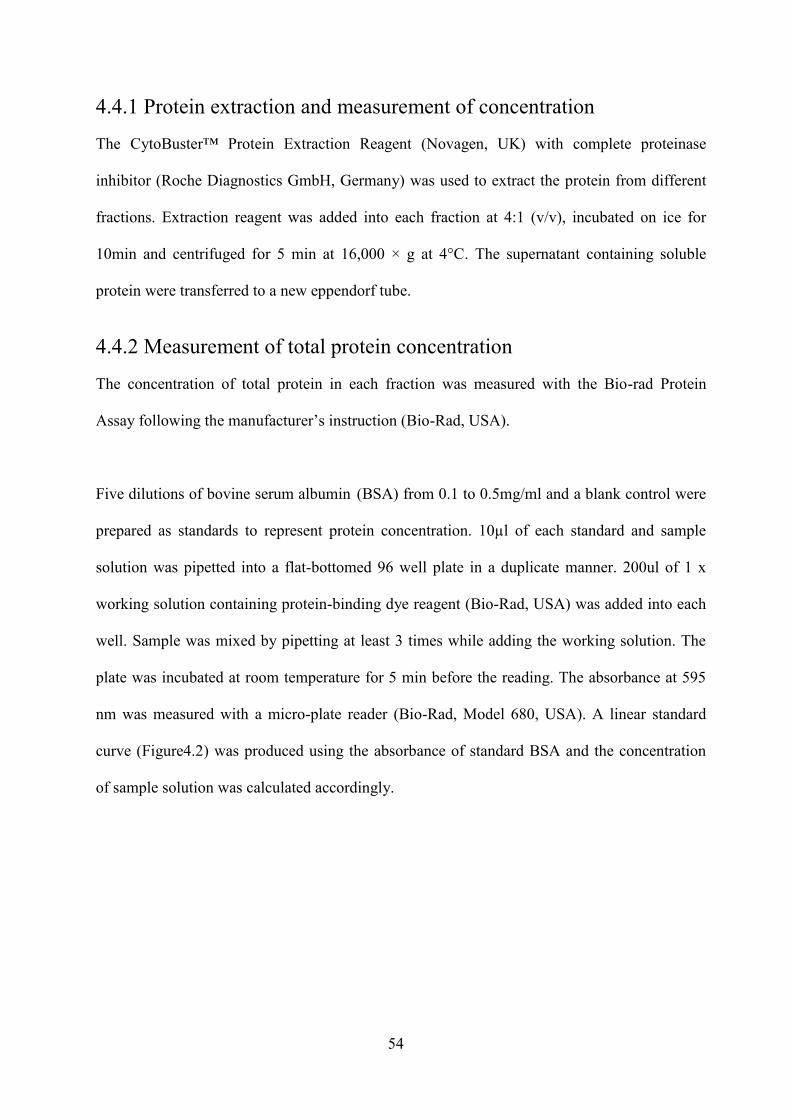
54
4.4.1 Protein extraction and measurement of concentration
The CytoBuster™ Protein Extraction Reagent (Novagen, UK) with complete proteinase
inhibitor (Roche Diagnostics GmbH, Germany) was used to extract the protein from different
fractions. Extraction reagent was added into each fraction at 4:1 (v/v), incubated on ice for
10min and centrifuged for 5 min at 16,000 × g at 4°C. The supernatant containing soluble
protein were transferred to a new eppendorf tube.
4.4.2 Measurement of total protein concentration
The concentration of total protein in each fraction was measured with the Bio-rad Protein
Assay following the manufacturer’s instruction (Bio-Rad, USA).
Five dilutions of bovine serum albumin (BSA) from 0.1 to 0.5mg/ml and a blank control were
prepared as standards to represent protein concentration. 10µl of each standard and sample
solution was pipetted into a flat-bottomed 96 well plate in a duplicate manner. 200ul of 1 x
working solution containing protein-binding dye reagent (Bio-Rad, USA) was added into each
well. Sample was mixed by pipetting at least 3 times while adding the working solution. The
plate was incubated at room temperature for 5 min before the reading. The absorbance at 595
nm was measured with a micro-plate reader (Bio-Rad, Model 680, USA). A linear standard
curve (Figure4.2) was produced using the absorbance of standard BSA and the concentration
of sample solution was calculated accordingly.

55
Figure 4.2 The standard curve of BSA the Bio-rad Protein Assay
4.4.3 SDS-PAGE gel electrophoresis
30µg proteins of each sample (3.5-10µl) were loaded on an 8%-12% sodium dodecyl sulfate
polyacrylamide gel electrophoresis (SDS-PAGE) gel except for the isolated fraction, which
was loaded at a maximum volume (40µl). After 100 min electrophoresis at 120V, gel was
stained with the Coomassie Blue.
4.4.4 Coomassie blue staining
Coomassie blue staining solution was made up with 1.25g Coomassie blue, 250ml Methanol,
25ml Acetic acid and the deionized water to a total volume at 550ml. The Coomassie de-stain
solution was made up with 300ml Methanol, 100ml Acetic acid and deionized water to a total
volume of 1 liter. After electrophoresis, the gel was washed with deionized water and stained
with Coomassie blue staining solution for 20min. After the staining, the gel was put into the
de-stain solution from 4h to overnight until the clear protein band showed up. Images were
taken under UV light using a digital camera (Syngene, UK).

56
4.5 Lipid and metabolite extraction from cell pellets and
isolated fraction
A dual phased methanol-chloroform extraction protocol was used to prepare the metabolite and
lipid extracts for NMR analysis [39]. At least three independent preparations were used for
isolation and extraction.
4.5.1 Homogenate preparation in methanol and deionised water
Cell pellets were taken out from the -800C freezer prior to the extraction and thawed at room
temperature. 400µl ice-cold methanol and 85µl ice-cold deionised water were added into 10-
20million cells. The mixture was then ground using a 2ml glass grinder (Sigma, UK). The
homogenate was transferred to a 1.5ml eppendorf tube and sonicated 10 to 15s on ice using an
ultrasonic cell disruptor (Misonix).
4.5.2 Partition of sonicated homogenate on ice
200 µl deionised water (ice cold) and 200 µl chloroform (ice cold) was added into the
sonicated homogenate. The mixture was vortexed at high speed for 10~20 seconds and shaken
at 20rpm for 20 minutes. The sample was then centrifuged at 2000g for 5 minutes at 4 0C.
After the centrifugation, the homogenate was separated into three phases due to the relative
density, the upper aqueous phase, the middle precipitated protein phase and the bottom
chloroform phase. The upper water phage and the lower chloroform phase was transferred into
new eppendorf tubes and extracted again with 200µl chloroform. The upper aqueous phase and
lower chloroform phase was collected after the second extraction.
4.5.3 Vacuum centrifugation
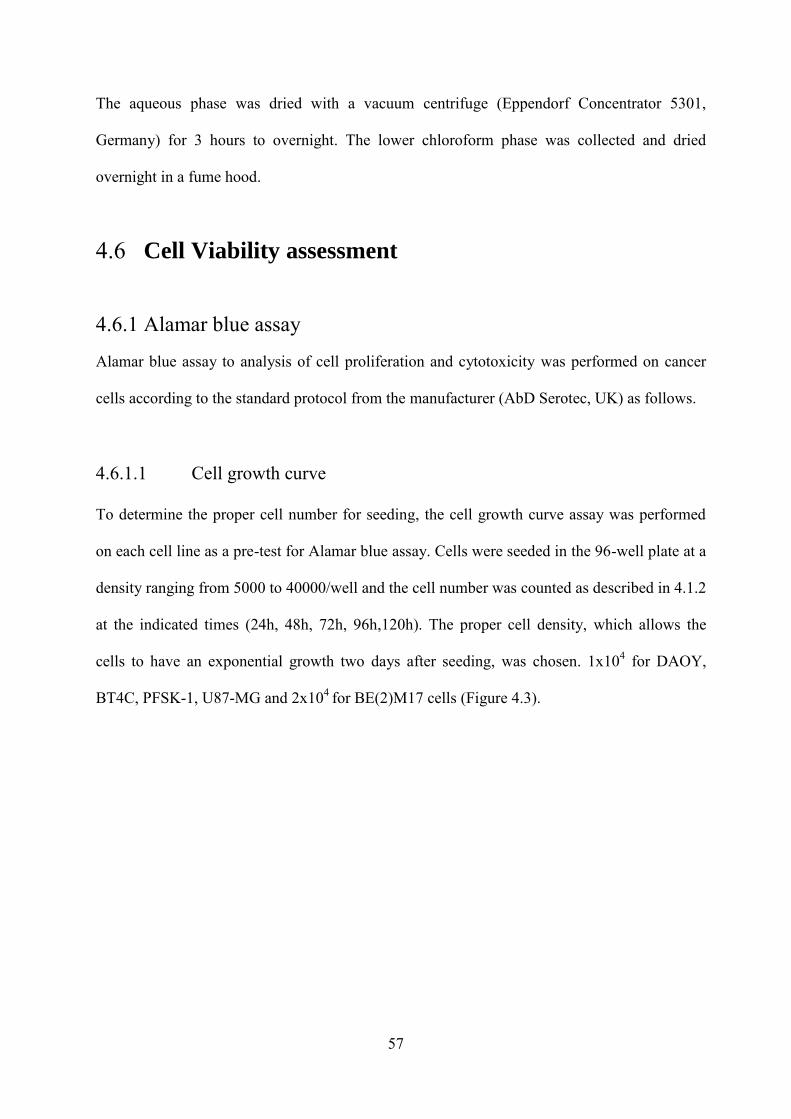
57
The aqueous phase was dried with a vacuum centrifuge (Eppendorf Concentrator 5301,
Germany) for 3 hours to overnight. The lower chloroform phase was collected and dried
overnight in a fume hood.
4.6 Cell Viability assessment
4.6.1 Alamar blue assay
Alamar blue assay to analysis of cell proliferation and cytotoxicity was performed on cancer
cells according to the standard protocol from the manufacturer (AbD Serotec, UK) as follows.
4.6.1.1 Cell growth curve
To determine the proper cell number for seeding, the cell growth curve assay was performed
on each cell line as a pre-test for Alamar blue assay. Cells were seeded in the 96-well plate at a
density ranging from 5000 to 40000/well and the cell number was counted as described in 4.1.2
at the indicated times (24h, 48h, 72h, 96h,120h). The proper cell density, which allows the
cells to have an exponential growth two days after seeding, was chosen. 1x10⁴ for DAOY,
BT4C, PFSK-1, U87-MG and 2x10⁴ for BE(2)M17 cells (Figure 4.3).

58
Figure 4.3 The growth curve of BE(2)M17 cells to assess the proper seeding density.
4.6.1.2 Cisplatin treatment and cell incubation
Cells were seeded in flat-bottomed IWAKI 96-well culture plates at a density of 1-
2x10⁴cells/well and cultured for 24h for a 50~70% confluent. Cisplatin at the indicated
concentration was added into each well and no cisplatin was added into control cells. The
plates were incubated at 37°C and 5% CO2 for 48h. 10 µl of Alamar Blue (AbD Serotec, UK)
was then added to each well and the plates were incubated for another 2h before measurement.
4.6.1.3 Fluorescence measurement and calculation
The fluorescence intensity was measured using a Victor 1402 multilabel counter (Wallac) with
an excitation wave length of 550 nm and an emission wavelength of 590 nm using a one-
second scan. The cell survival rate (the percentage difference between treated and control cells)
was calculated with the amount of fluorescence according to the following equation where FI
590 = Fluorescent Intensity at 590nm emission (550nm excitation).

59
4.6.2 DAPI staining
Cells were spun and stained with 0.4ug/ml 4',6-diamidino-2-phenylindole (DAPI, a fluorescent
stain that binds strongly to A-T rich regions in DNA) for 15 min. The slides were visualized
with a Nikon Eclipse E600 microscope using 100X objective lens and images were taken using
a DXM1200 digital camera. DAPI UV (UV-2A) filter with excitation wavelength of 340- 380
nm was used to detect DAPI stained nuclei. In this study, DAPI staining is performed
immediately after the Nile red staining.
4.6.3 RNA fragmentation
RNA degradation was assessed with gel electrophoresis of total RNA extracted from cisplatin
untreated and treated cells.
4.6.3.1 RNA extraction
To extract the total RNA from cells, 2.5ml TRIzol Reagent (Invitrogen, UK) was added into
one 25cm2 flask with cells ready to harvest. 500µl chloroform was added to each cell lysate to
achieve phase separation. The upper aqueous phase with RNA was transferred into a fresh tube
and the RNA was precipitated with 1.25ml 3 ml 100% isopropanol (Sigma-Aldrich, UK). After
being washed twice with 75% ethanol, RNA was dissolved in 30µl RNAse-free solution.
4.6.3.2 Agarose gel electrophoresis
1% agarose gel (Invitrogen, UK) was made in 0.5 x Tris/Borate/ Ethylenediaminetetraacetic
acid (TBE) solution containing (2x10⁵ : 1) ethidium bromide (10 mg/ml). The gel was placed

60
on a plastic tray in an electrophoresis tank and submerged just beneath 0.5 x TBE. 1µg of 1Kb
plus DNA Ladder (invitrogen, UK) and 10µg RNA of each sample was added on the 1%
agarose gel and electrophoresized at 120V for 90min. The RNA fragments were observed
under ultraviolet light.
4.7 Nuclear Magnetic Resonance
4.7.1 Sample preparation for liquid state 1H NMR
Metabolite extracts were re-suspended in 600µl deuterated water and 5µl 10mM
trimethylsilylproprionate d4 (TMS) (Sigma Aldrich, UK) resonating at 0ppm was added as a
chemical reference[147]. Lipid extracts were re-suspended in 600µl deuterated chloroform
containing 0.03 % (v/v) TMS (Sigma Aldrich, UK). All the liquid state samples were tested
with Norell s600 NMR tubes (Norell, USA).
4.7.2 Sample preparation for HR-MAS
Prior to HR-MAS, frozen cells were defrosted at room temperature. 36µl of cell pellets,
containing approximately 5-10 x 106 cells, were pipetted into a wide-mouthed zirconium oxide
sample tube (Varian Inc, Palo Alto, CA, USA) with a transferpette (Brand, German). 4 µL 10
mmol/L TMS in D2O was added as a chemical shift standard. To prepare the samples for the
HR-MAS probe (Bruker), 45µl cell pellets and 5 µL 50 mmol/L TMS in D2O was pipetted into
a 50μl rotor (Bruker, German).
4.7.3 Performing NMR spectroscopy
A Varian 600 spectrometer with a HCN probe and a nano-probe and a Bruker 500 spectrometer
(Figure 4.2) with a cryo-probe and a HR-MAS probe were used in this study.

61
Figure 4.4 A Varian 600 MHz spectrometer (left) and a Bruker DRX 500MHz spectrometer
(right) at the Henry Wellcome Building for Biomolecular NMR Spectroscopy, The
University of Birmingham.
4.7.3.1 Liquid-state 1H NMR with HCN probe
1H NMR spectra of cell extracts and the isolated LDs suspended in D2O were recorded on a
Varian 600-MHz (14.1 T) vertical bore spectrometer using a proton, nitrogen, carbon (HCN)
probe. The probe temperature was set to 200C. Tuning and matching and was optimized for
each sample. Presaturation pulse frequency was optimized by adjusting the transmitter offset.
A standard pulse and acquire sequence was used which consisted of a single 900 pulse
preceded by one second of water presaturation. The acquisition was of 16K complex points at a
sampling frequency of 7200Hz. Usually 256 scans were used for both metabolite and lipid
extracts and 1024 scans were used for isolated fraction samples. At least three independent
samples was used.
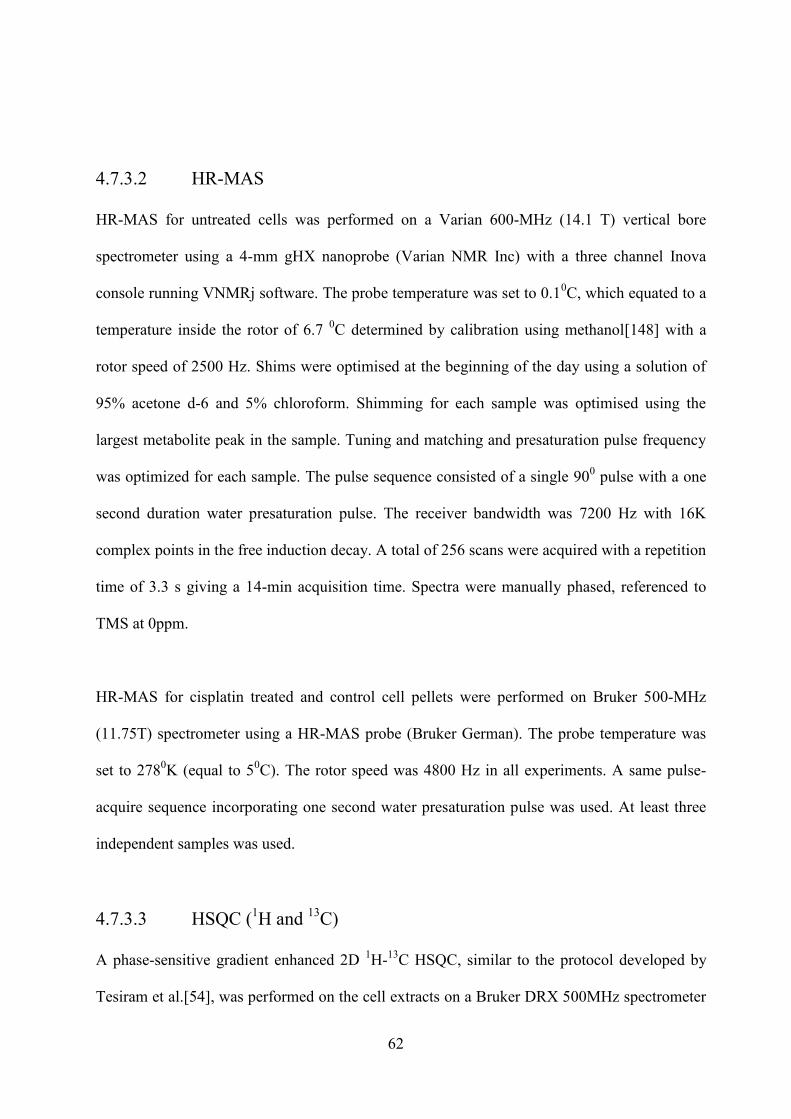
62
4.7.3.2 HR-MAS
HR-MAS for untreated cells was performed on a Varian 600-MHz (14.1 T) vertical bore
spectrometer using a 4-mm gHX nanoprobe (Varian NMR Inc) with a three channel Inova
console running VNMRj software. The probe temperature was set to 0.10C, which equated to a
temperature inside the rotor of 6.7 0C determined by calibration using methanol[148] with a
rotor speed of 2500 Hz. Shims were optimised at the beginning of the day using a solution of
95% acetone d-6 and 5% chloroform. Shimming for each sample was optimised using the
largest metabolite peak in the sample. Tuning and matching and presaturation pulse frequency
was optimized for each sample. The pulse sequence consisted of a single 900 pulse with a one
second duration water presaturation pulse. The receiver bandwidth was 7200 Hz with 16K
complex points in the free induction decay. A total of 256 scans were acquired with a repetition
time of 3.3 s giving a 14-min acquisition time. Spectra were manually phased, referenced to
TMS at 0ppm.
HR-MAS for cisplatin treated and control cell pellets were performed on Bruker 500-MHz
(11.75T) spectrometer using a HR-MAS probe (Bruker German). The probe temperature was
set to 2780K (equal to 50C). The rotor speed was 4800 Hz in all experiments. A same pulse-
acquire sequence incorporating one second water presaturation pulse was used. At least three
independent samples was used.
4.7.3.3 HSQC (1H and 13C)
A phase-sensitive gradient enhanced 2D 1H-13C HSQC, similar to the protocol developed by
Tesiram et al.[54], was performed on the cell extracts on a Bruker DRX 500MHz spectrometer
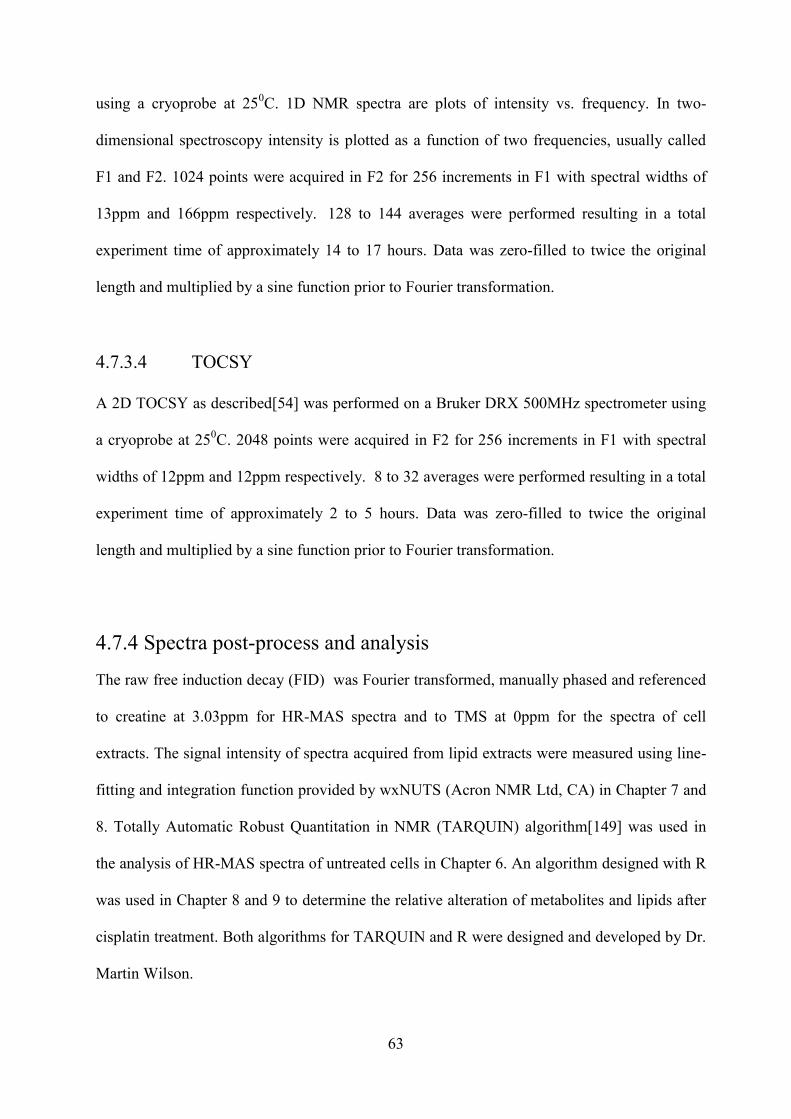
63
using a cryoprobe at 250C. 1D NMR spectra are plots of intensity vs. frequency. In two-
dimensional spectroscopy intensity is plotted as a function of two frequencies, usually called
F1 and F2. 1024 points were acquired in F2 for 256 increments in F1 with spectral widths of
13ppm and 166ppm respectively. 128 to 144 averages were performed resulting in a total
experiment time of approximately 14 to 17 hours. Data was zero-filled to twice the original
length and multiplied by a sine function prior to Fourier transformation.
4.7.3.4 TOCSY
A 2D TOCSY as described[54] was performed on a Bruker DRX 500MHz spectrometer using
a cryoprobe at 250C. 2048 points were acquired in F2 for 256 increments in F1 with spectral
widths of 12ppm and 12ppm respectively. 8 to 32 averages were performed resulting in a total
experiment time of approximately 2 to 5 hours. Data was zero-filled to twice the original
length and multiplied by a sine function prior to Fourier transformation.
4.7.4 Spectra post-process and analysis
The raw free induction decay (FID) was Fourier transformed, manually phased and referenced
to creatine at 3.03ppm for HR-MAS spectra and to TMS at 0ppm for the spectra of cell
extracts. The signal intensity of spectra acquired from lipid extracts were measured using line-
fitting and integration function provided by wxNUTS (Acron NMR Ltd, CA) in Chapter 7 and
8. Totally Automatic Robust Quantitation in NMR (TARQUIN) algorithm[149] was used in
the analysis of HR-MAS spectra of untreated cells in Chapter 6. An algorithm designed with R
was used in Chapter 8 and 9 to determine the relative alteration of metabolites and lipids after
cisplatin treatment. Both algorithms for TARQUIN and R were designed and developed by Dr.
Martin Wilson.

64
4.7.4.1 Totally Automatic Robust Quantitation in NMR (TARQUIN)
The spectra of untreated cell pellets were phased and referenced to the Cr signal at 3.03 ppm
and the peaks were assigned and quantified. 1H HR-MAS visible lipids were quantified using a
modified version for lipids of the automated algorithm, TARQUIN. The TARQUIN algorithm,
by fitting a series of simulated individual metabolite and lipid signals to the experimentally
acquired data, measures the metabolite and lipid quantities. The relative quantity of 1H HR-
MAS visible lipids was determined in relation to the macromolecule signals at 0.94, 1.68, and
3.00 ppm. The assignment of the resonances at 0.94, 1.68, and 3.00 ppm to macromolecules
rather than mobile lipids follows assignments by Opstad et al [37] and is substantiated by their
broad nature, strong correlation with each other and invariance during cisplatin treatment when
compared with other spectral features.
The relative concentrations of metabolites were measured in relation to the sum of the
metabolites in each sample. In other words, the spectra were normalised to the whole spectra
excluding the water peak. Where serial 1H NMR is undertaken to investigate different cell lines
and their response to treatment, water may alter considerably between investigations and
relative metabolite concentrations are likely to be the most consistent measurements hence this
approach was used in this in vivo work to measure the relative concentration of the metabolites.
4.7.4.2 wxNUTS software
Signal intensity of lipid peaks in spectra of extracts were measured with a line fitting method
provided by the wxNUTS, a commercial software designed for spectral analysis purposes.
Each raw spectrum was applied with phase and baseline correction before the measurement.
The spectral region with the peaks of interest was expanded and peaks were selected manually,
the algorithm of the software can simulate each peak and measure the signal intensities. The
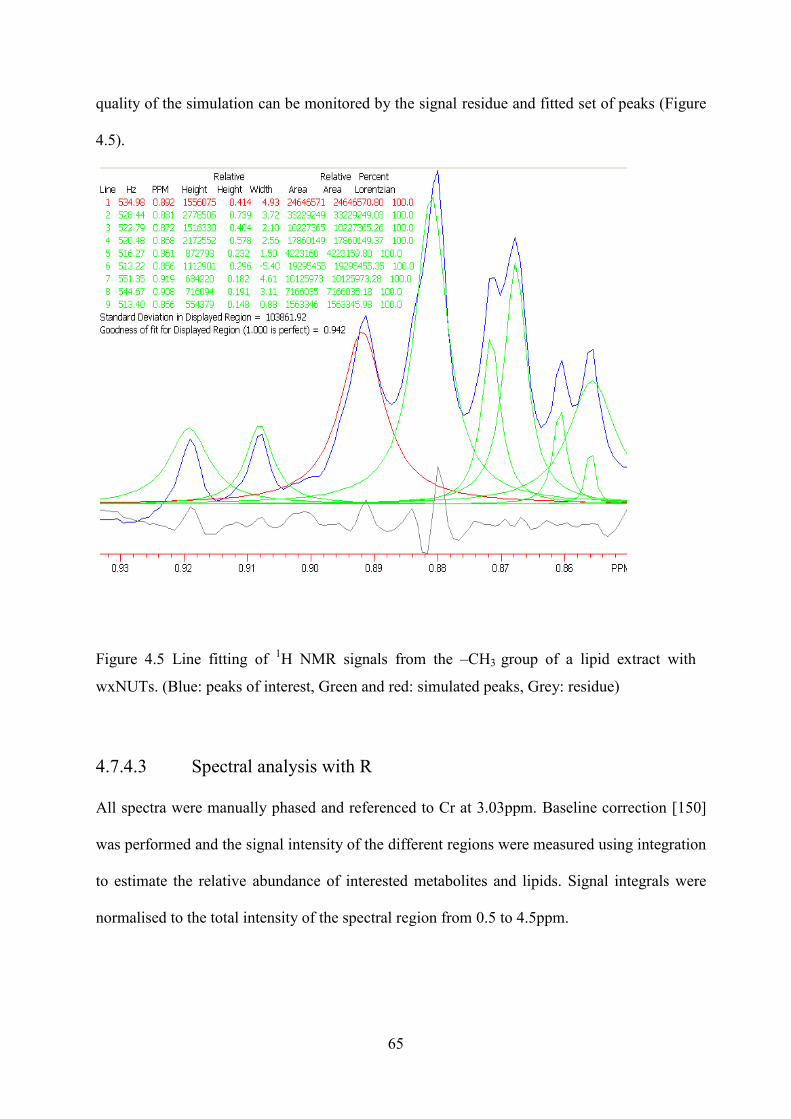
65
quality of the simulation can be monitored by the signal residue and fitted set of peaks (Figure
4.5).
Figure 4.5 Line fitting of 1H NMR signals from the –CH3 group of a lipid extract with
wxNUTs. (Blue: peaks of interest, Green and red: simulated peaks, Grey: residue)
4.7.4.3 Spectral analysis with R
All spectra were manually phased and referenced to Cr at 3.03ppm. Baseline correction [150]
was performed and the signal intensity of the different regions were measured using integration
to estimate the relative abundance of interested metabolites and lipids. Signal integrals were
normalised to the total intensity of the spectral region from 0.5 to 4.5ppm.
66
4.8 Characterization of lipid species in isolated LDs by
mass spectrometry
Lipid extracts were dissolved in 200 μl of chloroform/methanol (1:1 v/v): half was used for gas
chromatography with flame-ionization detector (GC-FID) analysis of total fatty acids and half
for liquid chromatography mass spectrometry (LC-MS) analysis of intact lipids. For the GC-
FID analysis 50 μl of D-25 tridecanoic acid (200 μM in chloroform), 650 μl of
chloroform/methanol (1:1 v/v) and 250 μl BF3/methanol (Sigma-Aldrich) was added to the
extract and the vials were incubated at 80 ºC for 90 min. 500 μl H2O and 1 ml hexane was
added and each vial vortex mixed. The organic layer was evaporated to dryness before
reconstitution in 100 μl hexane for analysis. The derivatised organic metabolites were injected
in a Focus gas chromatography (GC) and the column eluent was introduced into a flame-
ionization detector (FID, Thermo Electron Corporation). The column used was ZB-WAX
(Phenomenex; 30 m × 0.25 mm ID × 0.25 μm; 100% polyethylene glycol). The initial column
temperature was 60 ºC and was held for 2 min. This was increased by 15ºC min-1 to 150 ºC
then increased at a rate of 3 ºC min-1 to 230 ºC. This final temperature was held for 10 minutes.
Peaks were assigned using Food Industry FAME Mix (Restek 6098) solution.
For LC-MS 5 μl of each sample was analysed on a Waters Q-Tof Ultima mass spectrometer
combined with an Acquity Ultra Performance Liquid Chromatography (HPLC). The sample
was injected onto a 1.7 μm bridged ethyl hybrid C8 column (2.1 × 100 mm; Waters
Corporation) held at 65°C. The binary solvent system (flow rate 0.200 ml/min) included A.
HPLC grade water (1% 1 M NH4Ac, 0.1% HCOOH) and B. LC/MS grade
acetonitrile/isopropanol 5:2 (1% 1 M NH4Ac, 0.1% HCOOH). The gradient started from 65%
A/35% B, reached 100% B in 6 min and remained there for the next 7 min. The data was
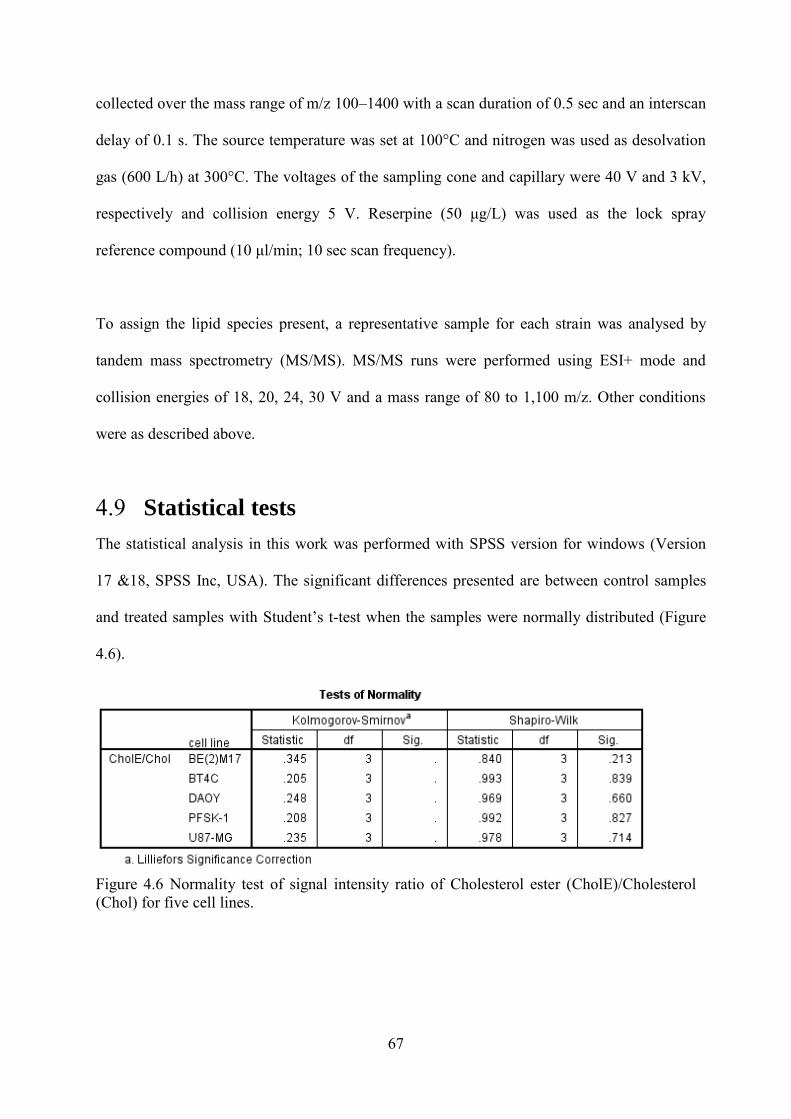
67
collected over the mass range of m/z 100–1400 with a scan duration of 0.5 sec and an interscan
delay of 0.1 s. The source temperature was set at 100°C and nitrogen was used as desolvation
gas (600 L/h) at 300°C. The voltages of the sampling cone and capillary were 40 V and 3 kV,
respectively and collision energy 5 V. Reserpine (50 μg/L) was used as the lock spray
reference compound (10 μl/min; 10 sec scan frequency).
To assign the lipid species present, a representative sample for each strain was analysed by
tandem mass spectrometry (MS/MS). MS/MS runs were performed using ESI+ mode and
collision energies of 18, 20, 24, 30 V and a mass range of 80 to 1,100 m/z. Other conditions
were as described above.
4.9 Statistical tests
The statistical analysis in this work was performed with SPSS version for windows (Version
17 &18, SPSS Inc, USA). The significant differences presented are between control samples
and treated samples with Student’s t-test when the samples were normally distributed (Figure
4.6).
Figure 4.6 Normality test of signal intensity ratio of Cholesterol ester (CholE)/Cholesterol (Chol) for five cell lines.

68
Chapter 5 The lipid composition of
isolated cytoplasmic lipid droplets
from a human cancer cell line,
BE(2)M17

69
5.1 Introduction
Proton nuclear magnetic resonance spectroscopy (NMR) allows the direct detection and
quantification of specific lipid species in situ[98]. The resonances of lipids have been observed
in 1H NMR spectra of cultured brain tumour cells[151] and tissues[38] both in vivo and ex
vivo. The origin of these lipid signals was first thought to be from globular plasma membrane
microdomains [74, 75], but more recent direct evidence suggests that the NMR signals are also
likely to be from mobile lipid droplets (LDs) in the cytoplasm [38, 50, 77]. Initially, the
function of these droplets was thought to be solely the storage of excess fatty acids present in
the cytoplasm. However, recent research has revealed that LDs dynamically interact with other
cell compartments and participate in several cellular processes such as membrane trafficking,
lipolysis and phospholipid recycling [113, 152].
The accumulation of intracellular LDs has been implicated in important cellular processes such
as proliferation, apoptosis and necrosis [37, 59, 122, 153]. There is evidence showing the
presence of LDs in necrotic regions of brain tumours [37, 77] and hypoxic-necrotic tumour
stroma of a C6 glioma [154]. It has been shown that modifications of intracellular LDs are
correlated with cell growth and growth arrest [68]. Many clinical studies have suggested that
the resonance signals from mobile lipids can be used as potential markers in the differential
diagnosis and grading of brain tumours [155]. These lipid signals may also be predictive of
treatment response [156]. These findings associate LDs with the cell cycle, malignancy and
cell death and consequently are an attractive topic for cancer research. The elucidation of their
composition and biochemical features is vital to the understanding of their function in these
cell processes and may provide novel information related to cell biology.

70
High resolution 1H NMR spectra of cell lipids can provide information on the number and type
of chemical entities of a molecule and has been widely used in the analysis of lipid structure
and composition [25, 157]. The standard method to obtain high resolution NMR spectra of
lipids from cells and tissue is to perform a chemical extraction of the tissue prior to the
acquisition of data in the liquid state. The resonances of lipids in NMR spectra from cell
extracts are usually dominated by membrane lipids which can mask the signals from sub-
cellular compartments, such as LDs. It is therefore desirable to isolate the LDs in order to
eliminate the signals from membrane lipids. Isolation of LDs from human cell lines has been
performed previously [146]. A commonly used method is density gradient ultra-centrifugation
[121, 140], but to the best of our knowledge, 1H NMR analysis of isolated LDs from tumour
cells has not been reported earlier.
This chapter presents the 1H NMR spectra acquired from isolated LDs of a human
neuroblastoma cell line, chemical analyses of lipid using gas chromatography with mass
spectrometry (GC-MS) and provides a new insights to the investigation of these highly
dynamic organelles separated from tumour cells.
5.2 Methods
BE(2)M17, a human neuroblastoma cell line, was cultured in 75 cm2 flasks and maintained in
20 ml complete DMEM and harvested at around 90% confluence (chapter 4.1).
Nile red and DAPI staining was performed on BE(2)M17 whole cells. Nile red staining, Oil red
O and haematoxylin staining, negative staining followed by TEM were performed on isolated
LDs (chapter 4.2).

71
HR-MAS on cell pellets and liquid-state 1H NMR spectroscopy on lipid extracts and isolated
LDs was performed with Varian 600-MHz (14.1 T) vertical bore spectrometer. 2D 1H-13C
HSQC was performed on the lipid extracts on a Bruker DRX 500MHz spectrometer using a
cryoprobe at 250C (chapter 4.7).
5.3 Results
5.3.1 LDs from BE(2)M17 cells
Nile red staining (Figure 5.1A) illustrated that there were a considerable number of
cytoplasmic LDs inside the cells, which tended to localise near to the cell membrane. The
mean diameter of these LDs with Nile red staining (Figure 5.1B) inside BE(2)M17 cells was
0.23±0.14µm (1.55-0.12µm,n=257) whereas in the isolated fraction it was 0.22±0.17µm (1.23-
0.10µm, n=79). The diameter of isolated LDs with Oil red O staining (Figure 5.1C) was 0.22
±0.05µm (0.47-0.17µm, n=52)

72
Figure 5.1 Nile red and DAPI staining (A) of BE(2)M17, Nile red staining (B), Oil red O and
haematoxylin staining (C) and Negative staining (D) of isolated fraction.
Membranes can be visualised with Oil red O and haematoxylin staining, appearing as annular
structures easily distinguishable from LDs. Figure 5.1c shows membrane structures were
absent from the isolated fraction and the middle sucrose fraction although they could be
visualized in other fractions (Figure 5.2). In addition, the transmission electron microscopy
(Figure 5.1D) shows the existence of LDs and the absence of membrane bound vesicles in the
isolated fraction, in accordance with Figure 5.1C.
D C
A B
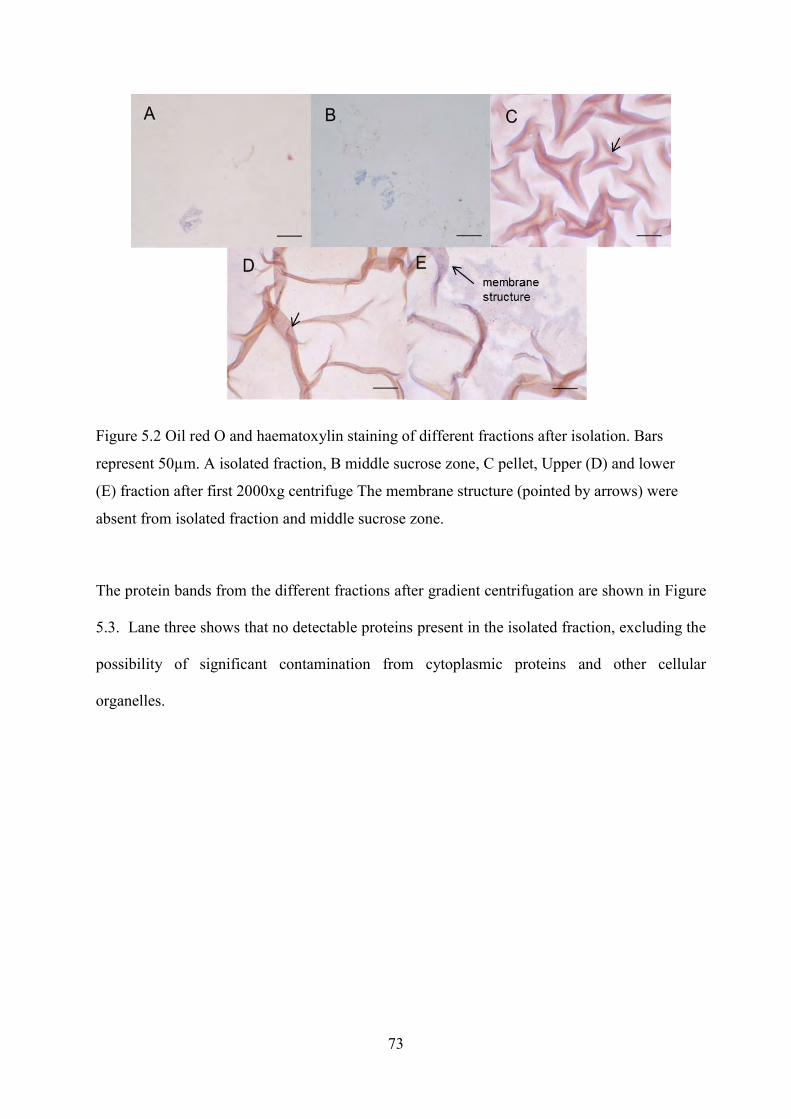
73
Figure 5.2 Oil red O and haematoxylin staining of different fractions after isolation. Bars
represent 50µm. A isolated fraction, B middle sucrose zone, C pellet, Upper (D) and lower
(E) fraction after first 2000xg centrifuge The membrane structure (pointed by arrows) were
absent from isolated fraction and middle sucrose zone.
The protein bands from the different fractions after gradient centrifugation are shown in Figure
5.3. Lane three shows that no detectable proteins present in the isolated fraction, excluding the
possibility of significant contamination from cytoplasmic proteins and other cellular
organelles.
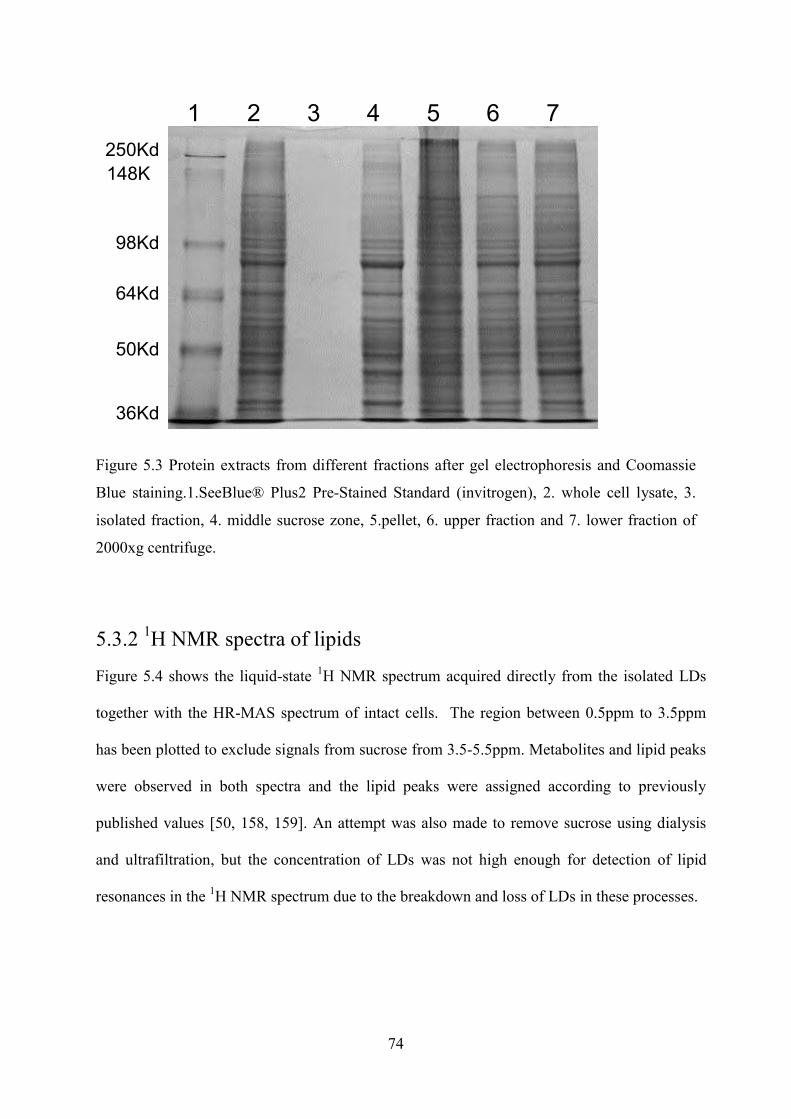
74
Figure 5.3 Protein extracts from different fractions after gel electrophoresis and Coomassie
Blue staining.1.SeeBlue® Plus2 Pre-Stained Standard (invitrogen), 2. whole cell lysate, 3.
isolated fraction, 4. middle sucrose zone, 5.pellet, 6. upper fraction and 7. lower fraction of
2000xg centrifuge.
5.3.2 1H NMR spectra of lipids
Figure 5.4 shows the liquid-state 1H NMR spectrum acquired directly from the isolated LDs
together with the HR-MAS spectrum of intact cells. The region between 0.5ppm to 3.5ppm
has been plotted to exclude signals from sucrose from 3.5-5.5ppm. Metabolites and lipid peaks
were observed in both spectra and the lipid peaks were assigned according to previously
published values [50, 158, 159]. An attempt was also made to remove sucrose using dialysis
and ultrafiltration, but the concentration of LDs was not high enough for detection of lipid
resonances in the 1H NMR spectrum due to the breakdown and loss of LDs in these processes.
1 2 3 4 5 6 7 250Kd 148Kd
98Kd
64Kd
50Kd
36Kd
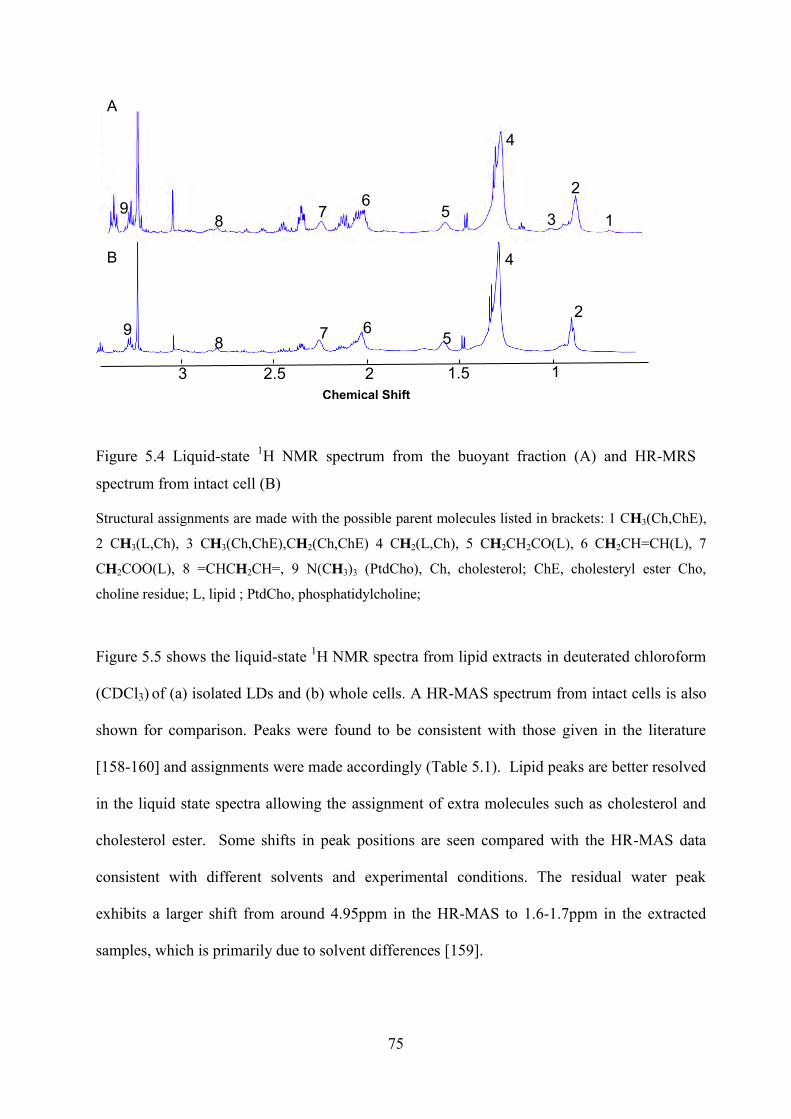
75
Figure 5.4 Liquid-state 1H NMR spectrum from the buoyant fraction (A) and HR-MRS
spectrum from intact cell (B)
Structural assignments are made with the possible parent molecules listed in brackets: 1 CH3(Ch,ChE),
2 CH3(L,Ch), 3 CH3(Ch,ChE),CH2(Ch,ChE) 4 CH2(L,Ch), 5 CH2CH2CO(L), 6 CH2CH=CH(L), 7
CH2COO(L), 8 =CHCH2CH=, 9 N(CH3)3 (PtdCho), Ch, cholesterol; ChE, cholesteryl ester Cho,
choline residue; L, lipid ; PtdCho, phosphatidylcholine;
Figure 5.5 shows the liquid-state 1H NMR spectra from lipid extracts in deuterated chloroform
(CDCl3) of (a) isolated LDs and (b) whole cells. A HR-MAS spectrum from intact cells is also
shown for comparison. Peaks were found to be consistent with those given in the literature
[158-160] and assignments were made accordingly (Table 5.1). Lipid peaks are better resolved
in the liquid state spectra allowing the assignment of extra molecules such as cholesterol and
cholesterol ester. Some shifts in peak positions are seen compared with the HR-MAS data
consistent with different solvents and experimental conditions. The residual water peak
exhibits a larger shift from around 4.95ppm in the HR-MAS to 1.6-1.7ppm in the extracted
samples, which is primarily due to solvent differences [159].
A
B
3 2 1.5 1 2.5 Chemical Shift (ppm)
1
2
3
4
5 6 9
2
4
5 6 7 8
9
7 8
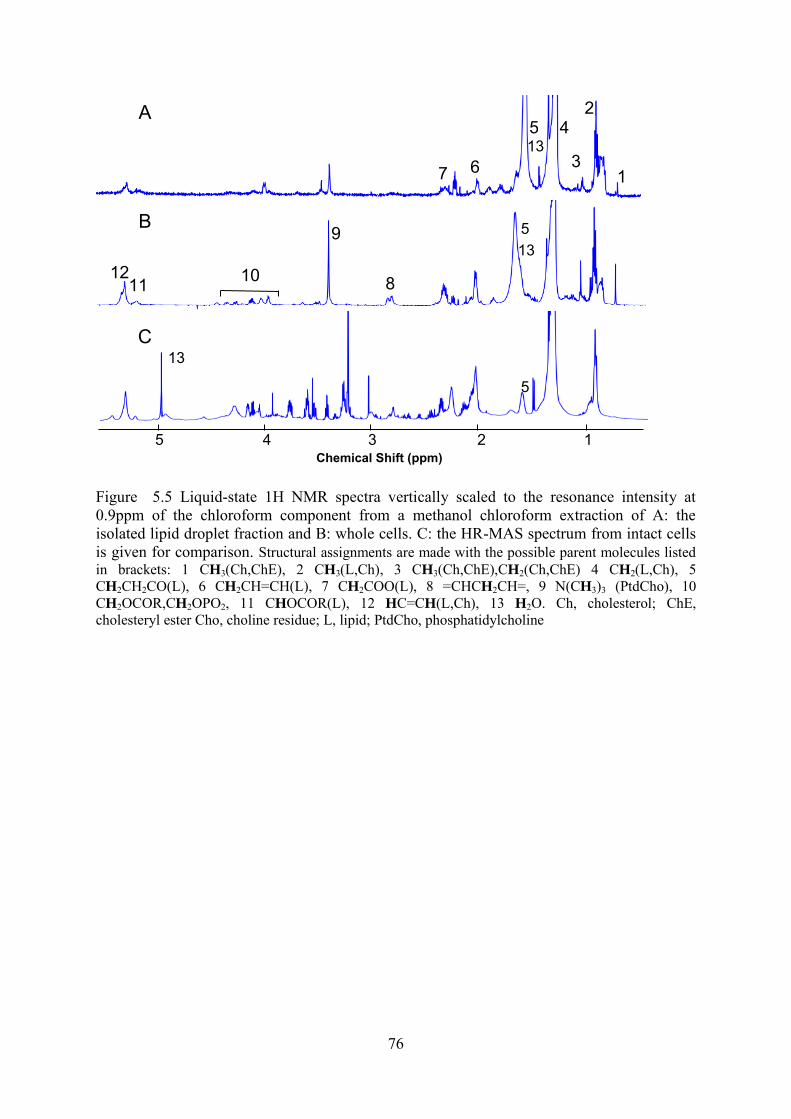
76
Figure 5.5 Liquid-state 1H NMR spectra vertically scaled to the resonance intensity at 0.9ppm of the chloroform component from a methanol chloroform extraction of A: the isolated lipid droplet fraction and B: whole cells. C: the HR-MAS spectrum from intact cells is given for comparison. Structural assignments are made with the possible parent molecules listed in brackets: 1 CH3(Ch,ChE), 2 CH3(L,Ch), 3 CH3(Ch,ChE),CH2(Ch,ChE) 4 CH2(L,Ch), 5 CH2CH2CO(L), 6 CH2CH=CH(L), 7 CH2COO(L), 8 =CHCH2CH=, 9 N(CH3)3 (PtdCho), 10 CH2OCOR,CH2OPO2, 11 CHOCOR(L), 12 HC=CH(L,Ch), 13 H2O. Ch, cholesterol; ChE, cholesteryl ester Cho, choline residue; L, lipid; PtdCho, phosphatidylcholine
Chemical Shift (ppm) 5 3 2 1 4
A
B
C
1
2 4 5
6 7
8
9
11 12 10
3
5
13
13
5
13
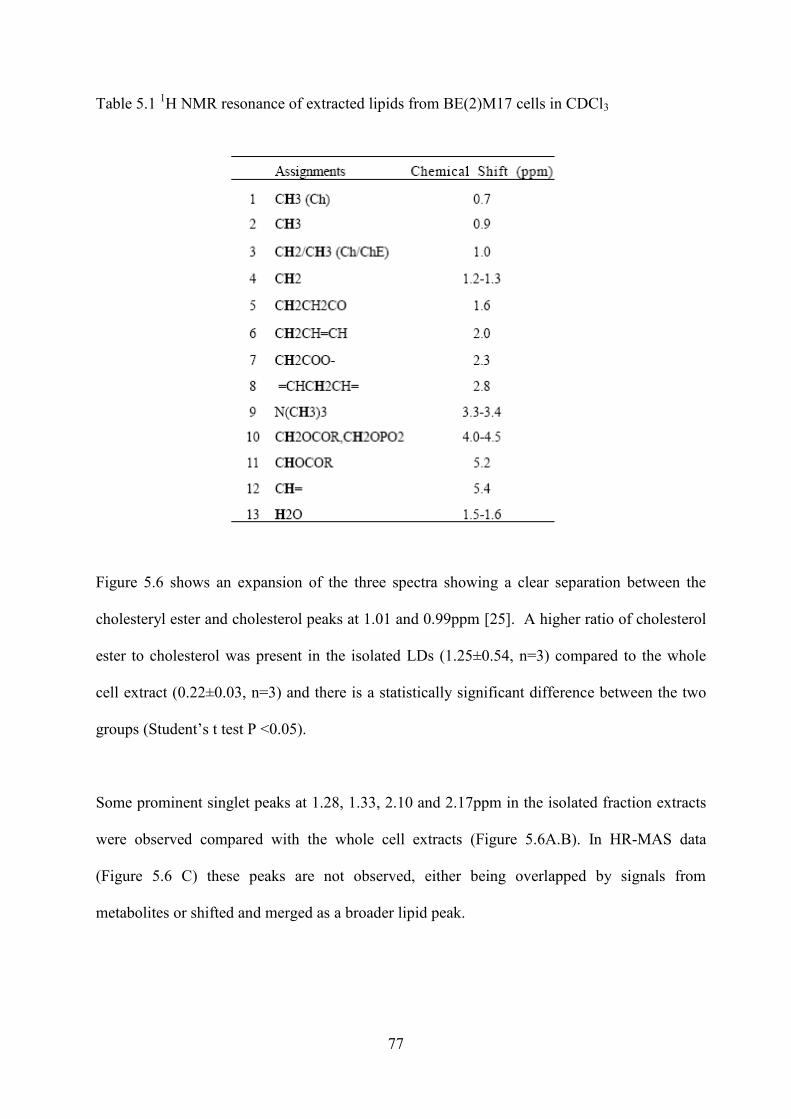
77
Table 5.1 1H NMR resonance of extracted lipids from BE(2)M17 cells in CDCl3
Figure 5.6 shows an expansion of the three spectra showing a clear separation between the
cholesteryl ester and cholesterol peaks at 1.01 and 0.99ppm [25]. A higher ratio of cholesterol
ester to cholesterol was present in the isolated LDs (1.25±0.54, n=3) compared to the whole
cell extract (0.22±0.03, n=3) and there is a statistically significant difference between the two
groups (Student’s t test P <0.05).
Some prominent singlet peaks at 1.28, 1.33, 2.10 and 2.17ppm in the isolated fraction extracts
were observed compared with the whole cell extracts (Figure 5.6A.B). In HR-MAS data
(Figure 5.6 C) these peaks are not observed, either being overlapped by signals from
metabolites or shifted and merged as a broader lipid peak.

78
Figure 5.6 Liquid-state 1H NMR spectra vertically scaled to the resonance intensity at
2.0ppm (left),1.25ppm (centre) and 0.9ppm (right) highlighting the resonances around 2.0–
2.9ppm, 1.2–1.4ppm and 0.5-1.0ppm. A: lipid extract from the isolated lipid droplet fraction.
B: whole cell lipid extracts and C: HR-MAS spectra from intact cells.
5.3.3 HSQC spectra of extracted lipids
Figure 5.7 shows the 5.45 to 5.25ppm region of the 500MHz HSQC (1H and 13C) spectra of the
lipid extracts from isolated LDs and whole cells. The double bond protons of unsaturated fatty
acids which were all superimposed at 5.3-5.4ppm in 1D proton spectra (Figure 5.4) were
separate into distinguishable signals and were assigned to oleic acid (C18:1) and linoleic acid
(C18:2) according to the literature [54] and HSQC experiments using standard oleic acid and
linoleic acid (Sigma, UK). The 2D spectra were manually processed and the signal intensity
was measured using Topspin 3.0 (Bruker Inc, German). The double bond protons in linoleic
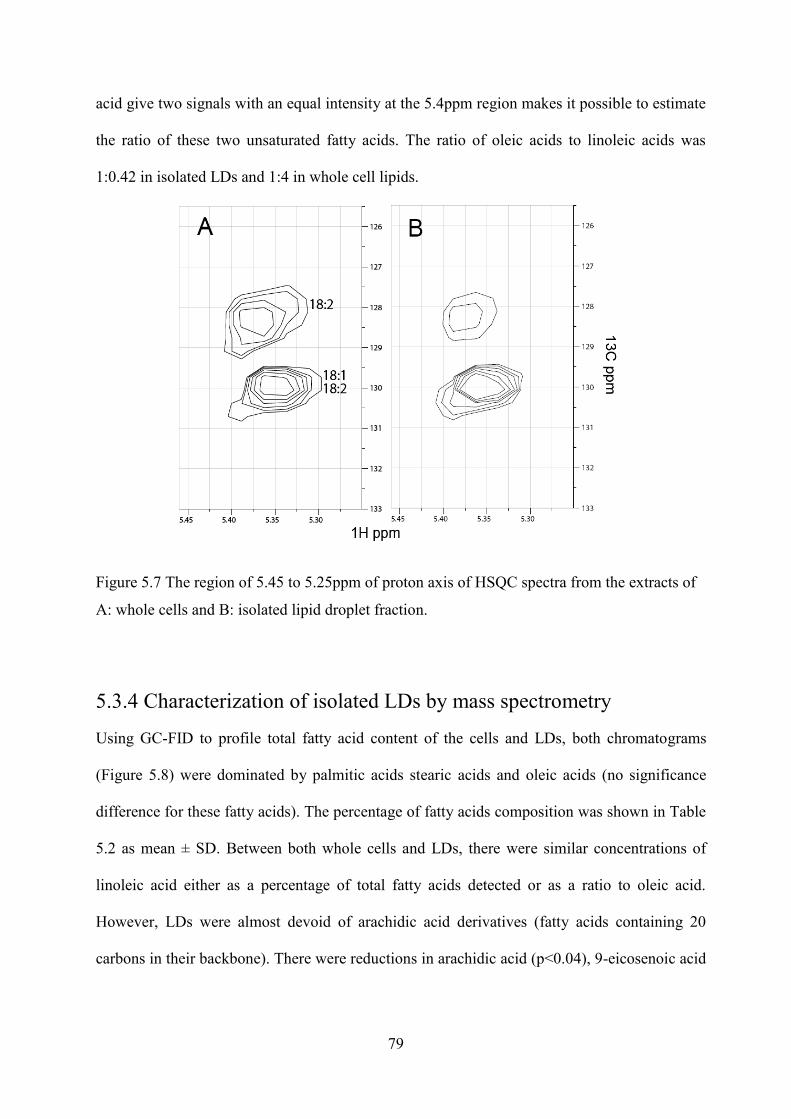
79
acid give two signals with an equal intensity at the 5.4ppm region makes it possible to estimate
the ratio of these two unsaturated fatty acids. The ratio of oleic acids to linoleic acids was
1:0.42 in isolated LDs and 1:4 in whole cell lipids.
Figure 5.7 The region of 5.45 to 5.25ppm of proton axis of HSQC spectra from the extracts of
A: whole cells and B: isolated lipid droplet fraction.
5.3.4 Characterization of isolated LDs by mass spectrometry
Using GC-FID to profile total fatty acid content of the cells and LDs, both chromatograms
(Figure 5.8) were dominated by palmitic acids stearic acids and oleic acids (no significance
difference for these fatty acids). The percentage of fatty acids composition was shown in Table
5.2 as mean ± SD. Between both whole cells and LDs, there were similar concentrations of
linoleic acid either as a percentage of total fatty acids detected or as a ratio to oleic acid.
However, LDs were almost devoid of arachidic acid derivatives (fatty acids containing 20
carbons in their backbone). There were reductions in arachidic acid (p<0.04), 9-eicosenoic acid

80
(p<0.005) and arachidonic acid (p<0.007). Similar concentrations of cholesterol derivatives
were detected in the chromatograms.
Figure 5.8 GC-FID chromatograms of lipid extracts from isolated LDs (A) and BE(2)M17
cells (B).The peaks labelled on the bottom spectrum are as follows: 1. Deuterated tridecanoic
acid (retention time and concentration standard), 2. myristic acid (C14:0), 3. palmitic acid
(C16:0), 4. palmitoleic acid (C16:1, cis-9), 5. stearic acid (C18:0), 6. oleic acid (C18:1, cis-
9), 7. linoleic acid (C18:2, cis-9, 12), 8. arachidic acid (C20:0), 9. gondoic acid (C20:1, cis-
11), 10. arachidonic acid (C20:4, cis-5, 8, 11, 14)
Table 5.2 Summary of fatty acid composition as percentage of total fatty acids in lipid
extracts studied by GC-FID (*P<0.05)

81
To further characterise the lipid species, LC-MS was performed on lipid extracts of LDs
(Figure 5.9). MS/MS was used to fragment intact lipids to identify individual lipid species. As
a crude measure of the polar-to-neutral lipids ratio the MS total ion intensity for the two types
of lipid species were integrated. The polar lipids-to-triglycerides (TG) ratio was ~2:1. The
major polar lipids were identified as phosphatidylcholine (PC) (16:0/18:1),
phosphatidylethanolamine (PE) (10:0/22:6), PC (10:0/18:2), PC(16:0/16:0), PC(16:0/16:1) and
PE(20:1/20:4), where the numbers indicates the fatty acids present. The TGs contained within
these droplets included TG(14:0/16:0/20:2), TG(16:0/18:1/16:0), TG(16:0/18:1/18:1),
TG(14:0/16:0/18:0), TG(14:0/16:0/18:1) and TG(16:1/20:2/18:0).

82
Figure 5.9 A two dimensional chromatogram and mass spectrum plot of the intact lipids
detected in isolated lipid droplets by liquid chromatography mass
spectrometry. Each peak corresponds to an individual intact lipid and the
chromatography separates the polar lipids, largely phosphatidylcholines, and
the triglycerides. Mass and fragmentation patterns are then used to identify
the individual lipid species.
5.4 Discussion
In agreement with other published studies [104, 146, 152], LDs can be isolated from whole
cells and our study found an excellent agreement between the diameter of the lipid droplets
observed within the cell and in their isolated state, confirming the isolated ones have a similar
size with those seen in the whole cell. Both the Nile red and Oil red staining also showed that
those lipid droplets are not free floating in the cytoplasm but connected to each other through
some cytoskeleton structure, which might be capable of providing certain protection to the
isolated LDs from the stress caused by the different physico-chemical conditions, such as
osmotic pressure and pH between deionised water and the intracellular environment. No lipid

83
bilayer structures were seen on transmission electron microscopy or vesicles on haematoxylin
and Oil red O staining indicating that there is a low level of contamination from other lipid
containing structures. Oil red O staining of the re-suspended pellet obtained after gradient
ultracentrifugation shows that some LDs are present in the lower fraction of the sample. The
absence of proteins in isolated fraction indicates there was low contamination from other
fractions.
The current results demonstrate a strong agreement between the line shape and relative
amplitudes of the lipid resonances at 0.9, 1.3, 1.6, 2.2 and 2.8ppm present in HR-MAS from
the whole cell and isolated LD. A signal at 5.4ppm likely to be from vinyl protons present in
lipids was also observed despite being partially overlapped with sucrose. These results support
the data presented by Griffin et al 4 which suggest that lipids in LDs present in cells and
tumour tissue possess a high degree of rotational freedom.
GC-FID detected a relatively low content of linoleic acid both in LDs and whole cell extracts,
when HSQC showed much lower oleic-to-linoleic acid ratio in whole cells. In order for GC-
FID to detect individual fatty acids, they must be converted into methyl esters which for fats
within triglycerides or phospholipids require a process of trans-esterification. A high oleic-to-
linoleic acid ratio in LDs suggests that a significant proportion of the linoleic acid is found in
lipid species such as triglycerides which may not be easily derivizated by direct methylation.
Indeed, LC-MS detected a number of oleic acid containing triglycerides in the LDs.
Furthermore, in vivo triglycerides are usually found on the inner-side of lipid droplets in a
relatively restricted environment compared with polar lipids which form the outer membrane
of the lipid droplet.

84
We observed a significant reduction in the phosphatidylcholine peak at 3.42ppm in isolated LD
extracts which is consistent with the assumption that LDs are surrounded with a single-layer
phospholipid. Differences in the total cholesterol peaks around 1.0ppm and 0.68ppm not only
explain the decrease of total signal intensity but also in the ratio between the esterified
cholesterol (CholE) and the unesterified cholesterol (Chol) peaks between the whole cell and
isolated lipid fraction samples. This variation may be due to differences in polarity of the two
forms of cholesterol. The main structure of LDs is a core of neutral lipids that are surrounded
by a monolayer of polar phospholipids [113]. Within the droplets, CholE would be
concentrated in the non-polar regions such as the core, whereas Ch would be located on or near
the droplet surface contributing to the biophysical stability of the droplet in the cytoplasm
[145]. Cell membranes contain more than 90% of the total cellular Chol [161, 162]; therefore
the Chol present in a whole cell extract is likely to be dominated by Chol present in the cell
membrane. After esterification, cholesterol esters are either stored in LDs or in hepatocytes and
certain epithelial cells secreted outside the plasma membrane as lipoproteins [163]. Therefore,
the isolated LDs are likely to have a low level of Chol and high level of CholE compared to the
whole cell lipids.
Key differences were apparent in the methylene lipid peak at 1.3ppm between the three spectra
shown in Figure 5.4. A broad lipid peak and a doublet from lactate were observed in the HR-
MAS spectrum, whereas a broad peak with four additional narrower peaks was present in the
lipid extracts at 1.25, 1.27, 1.28 and 1.33ppm. The narrower peaks were more prominent in the
isolated LDs and their relative intensities are different compared to the whole cell extract
spectra. In addition, two narrow peaks around 2.10 and 2.17ppm and one triplet near 2.25ppm
are also absent from the HR-MAS spectrum and much higher in the isolated LD spectrum than
in the whole cell extract. A comparison of these peaks between the isolated LD extract and the
85
whole cell extract indicates that these peaks mainly come from the LDs and may be a potential
marker of LDs reflecting the proportion of lipid signals arising from LDs within a whole cell
extract sample. The relatively low intensity of these peaks in whole cell extracts again indicates
that the lipids in the droplets only account for a small part of the lipids in the whole cell lipids.
The unsaturated fatty acid peak at 5.3ppm is clearly visible in the isolated LD spectrum
confirming their presence in LDs, which is of particular interest as unsaturated fatty acids are
linked with cell cycle arrest and programmed cell death in cancer cells and treated tumour
xenografts [50].
The relative intensities of the narrow peaks at 1.27, 1.28 and 1.33ppm in the isolated LD
spectra may indicate that the length of fatty acids in LDs is on average shorter than those in the
whole cells. The study of Subramanian et al [158] show that the most intense 1.25ppm signal
arises from the methylene between methylenes (x–CH2–(CH2)n–CH2–y) while signals around
1.27-1.33ppm arise from methylenes adjacent to different subunits ( x–CH2–(CH2)n–CH2–y).
The high intensity of the peak at 1.25ppm compared with the resonances at 1.27-1.33ppm in
the whole cell extract indicates that there are more –(CH2)n- inside these lipid samples. The
ratio between the peak at 1.25ppm and those around 1.27-1.33ppm could therefore be used to
estimate the mean length of the fatty acid chains. Comparison with the HR-MAS spectrum
indicates that these lipid peaks are broadened and overlapped by signals from metabolites and
macromolecules.
High resolved HSQC spectra are a promising technique to assign individual fatty acid signals,
also for constituents with minor concentrations [54]. In our study, the HSQC spectra confirmed
that oleic acid and linoleic acid were presented in the lipid extracts of isolated LDs. It is
86
possible for other unsaturated fatty acids containing one or two double bond Carbons, such as
eicosanoid acid (20:1) and eicosadienoic acid (20:2), to give a signal at a similar position.
However, only oleic acid (18:1), linoleic acid (18:2) and eicosanoid acid (20:1) were identified
by GC-FID. Furthermore, oleic acid (18:1) is about 20 folds more than eicosanoid acid (20:1)
(Table 5.2), therefore, these HSQC signals are most likely predominated by oleic acid and
linoleic acid. Palmitic acid (C16:0) and stearic acid (C18:0), oleic acid (C18:1) and linoleic
acid (C18:2) are both common to membrane and storage lipids in human body and the
membrane lipids contain a much higher proportion of PUFAs [164]. It is consistent with the
finding that the linoleic acid as an n-6 PUFA is almost 10 times less in LDs than that of whole
cell lipids compared with oleic acids as the whole cell lipids are dominated by membrane
lipids. A high level of C16:0, C18:0 and C18:1 was confirmed by mass spectrometry.
5.5 Conclusion
An excellent agreement was observed between the lipid resonances present in the HR-MAS of
BE(2)M17 cells and the NMR spectra of their isolated LDs, strongly supporting that NMR
visible lipid resonances originate primarily from LDs. A comparison between the 1H NMR
spectra of lipid extracts from the isolated LDs and the whole cell preparations revealed a
number of similarities, particularly in the presence of unsaturated lipids. However, differences
were also detected, in particular a large dissimilarity was seen in the ratio between the
cholesteryl ester and cholesterol peaks.
87
Chapter 6 The size of cytoplasmic
lipid droplets varies between tumour
cell lines of the nervous system

88
6.1 Introduction 1H Nuclear Magnetic Resonance (NMR) spectroscopy, originally an analytical chemistry
technique, is now widely used for non-invasive detection of metabolites both in preclinical and
clinical settings [84, 88]. In particular, NMR spectroscopy (MRS) has gained acceptance in
cancer imaging by improving presurgical diagnostic accuracy and tumor grading [165],
offering guidance for surgical intervention and determining efficacy of therapy [166].
One group of chemical species used in cancer NMR investigation is the 1H NMR detectable
lipids. Lipid NMR resonances have been detected ex vivo from different cancer cells and
tumours [37, 59] and are commonly present in malignant human brain tumours. Preclinical and
clinical observations have shown that lipid signals are related to tumour class, grade and
prognosis [37, 62] suggesting the potential of these signals to serve as a diagnostic tool and a
monitor for effective therapies.
It has become evident that lipid droplets (LD) in the cytoplasm are the main source of the
NMR detectable lipids in situ [50, 77]. A study on a myeloma cell line showed that the
appearance of lipid resonances detected by 1H NMR was associated with formation of
cytoplasmic LD in the presence of lipids in the culture medium [78]. In the past two decades, a
growing body of evidence suggests that 1H NMR lipid signals arise from lipid species that are
associated with several important cellular processes such as cell proliferation, activation,
apoptosis and necrosis [50, 155]. Accumulation of cytoplasmic LD in cells and tissues
undergoing apoptosis or necrosis has been reported, and this accumulation is accompanied with
sharp increase in the 1H NMR lipid signals [12, 37].

89
LDs have been regarded as generic cellular structures storing neutral lipids. However, recent
studies revealed that LDs are dynamic organelles with multiple cellular functions [113, 114].
Lipid accumulation into LDs is a common observation in several human diseases, such as
atherosclerosis [167], diabetes and obesity [168]. Recently, increasing evidence suggests that
LDs are also implicated in other diseases including inflammation [134], viral infections [135]
and cancer [136]. An increased number of LDs displaying size variation have been reported in
human colon [138] and brain tumour tissues [37].
It has been suggested that the NMR detection of lipids depends largely on the mobility of the
detected molecules due to their fast transverse relaxation rate (R2) [50]. Therefore, the question
of whether an increase in NMR lipid signals are due to an increase in overall lipid amount in
these LDs or due to an increase in lipid mobility associated with greater LD size has been
raised [68]. NMR lipid levels are known to be related to grade and survival in brain
tumours[169], but the variation and its relationship to LD characteristics have not been fully
explored in a panel of tumour cell lines. In addition, most studies on LDs using NMR have
exploited the induction of LD accumulation in target cells through various procedures thereby
potentially complicating interpretation of origin of lipid NMR signals. Therefore, it is attractive
to investigate viable and unexposed cells by NMR in order to gain an understanding of the
relationship between the size of LDs and lipid NMR signals for quantitative interpretation of
cellular lipids. In the current study, the LD size and NMR lipid signal were measured in five
nervous system cancer cell lines to examine their relationship.
6.2 Methods
Five nerve system tumour cell lines, BE(2)M17, a human neuroblastoma; DAOY, a human
medullolbastoma; PFSK-1, a human supratentorial primitive neuroectodermal tumor; U87MG,

90
a human glioblastoma and BT4C, a rat glioblastoma were cultured in complete DMEM.
Samples to be investigated with NMR were snap-frozen in liquid nitrogen and stored at -800C
(chapter4.1)
HR-MAS was performed on a Varian 600-MHz (14.1 T) vertical bore spectrometer
(chapter4.7). FIDs were zero filled to 16 K data points prior to Fourier transformation, phased,
referenced to the creatine peak at 3.03 ppm, water suppressed and normalized to the
macromolecular peak at 1.68 ppm for display. The phased data was then transformed back to
the time-domain and the TARQUIN algorithm as described in [20] was used to measure the
lipid quantities by fitting a series of simulated individual lipid signals (similar to Figure 4.5) to
the experimentally acquired data.
The lipid peak variability was demonstrated using at least 3 independent repeats prepared from
each cell line and a relative value of lipid intensity, a ratio of lipid to macromolecular signal,
was used for the normalisation reason so that the final value is comparable in different cell
lines.
6.3 Results
6.3.1 Size of LDs
The Nile red and DAPI co-stained images of five different cells are presented in Figure 6.1.
The lipid droplets appeared as green and the blue stain represents cell nuclei. The size bar
marks a reference for 5 µm. Qualitative microscopy suggested that LD size and number vary
between the five cell lines studied and therefore, LD diameter and number were determined
in three typical cells for each cell line.

91
Figure 6.1 Nile red and DAPI staining of five brain and nerve system tumour cells. LDs
appear as green spots and the cell nuclei are in blue.
The distribution of LD diameters in cell lines is shown in Figure 6.2. BE(2)M17 was the only
cell line that showed LDs larger than 1µm while the largest LD in DAOY cells was 0.4µm.
BE2M17 had the largest LDs while PFSK-1 contained the highest number of LDs. The
middle black line in box-plot (Figure 6.2) representing the median in each cell line was
around 0.2 µm. BE(2)M17 had the biggest in size and the highest in number of outliers
shown as stars and dots in the box-plot. The dots and stars labelled with numbers in Figure
6.2 are outliers to show the number of larger LDs and their distance to the mean value in each
BE(2)M17
DAOY
BT4C
PFSK-1
U87MG

92
cell line. The histogram (Figure 6.3) of the diameter of LDs shows that the mean diameter
was similarly around 0.2 µm for each cell line.
Figure 6.2 Box-plot (B) of the diameters (µm) of lipid droplets to show the distribution and
the number of LDs in five tumour cell lines. The middle black line represents the median and
the box represents a distribution from 25% to 75%. The area between the whiskers
represented the total distribution of all LDs except for the outliers shown as dots (mild
outliers) and stars (extreme outliers).
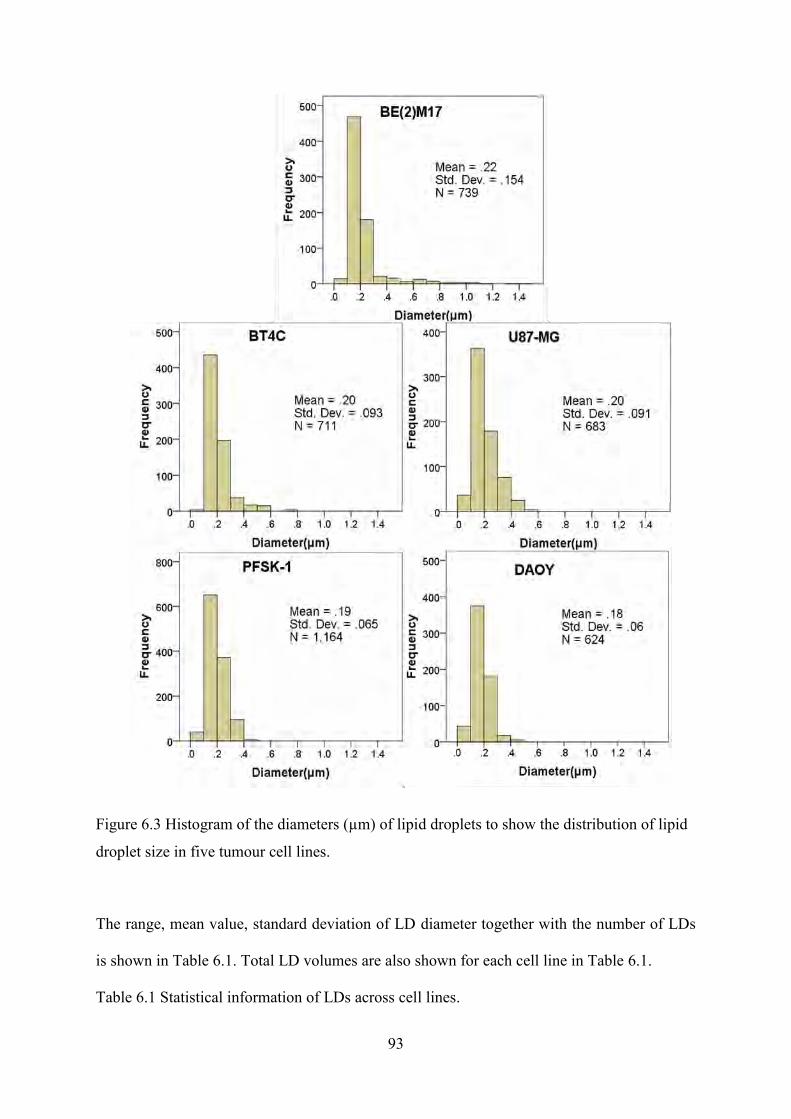
93
Figure 6.3 Histogram of the diameters (µm) of lipid droplets to show the distribution of lipid
droplet size in five tumour cell lines.
The range, mean value, standard deviation of LD diameter together with the number of LDs
is shown in Table 6.1. Total LD volumes are also shown for each cell line in Table 6.1.
Table 6.1 Statistical information of LDs across cell lines.

94
Cell line
range of diameter (µm) / cell line
Diameter (µm) / cell line
number of LDs / cell
Volume (µm
3)
/ cell
BE(2)M17 1.48~0.08 0.22±0.15 246±12 5.11±0.31
BT4C 0.75~0.08 0.20±0.09 237±46 1.89±0.48
U87-MG 0.56~0.07 0.20±0.09 228±103 1.66±0.04
PFSK-1 0.49~0.07 0.19±0.07 388±46 2.00±0.18
DAOY 0.42~0.07 0.18±0.06 208±32 0.82±0.13
6.3.2 1H NMR lipid signal
HR-MAS spectra acquired from different cell types are presented in Figure 6.4. The lipid
resonances are assigned as follows, the protons contributing to the resonances shown in bold:
1–CH3 at 0.9ppm, 2–(CH2) –at 1.3ppm, 3–CH2–CH2–C=O at 1.58ppm, 4 –CH2–CH= at
2.02ppm, 5–CH2–CH2–C=O at 2.2ppm, 6 =CH–CH2–CH= at 2.8ppm‚ 7 –CH=CH– at
5.4ppm. The intensities of the 1.3 and 0.9ppm lipid signals are highest in BE(2)M17. These
lipid signals represent the methylene and methyl group from both saturated and unsaturated
lipids. It should be noted that the 2.8ppm resonance originating from poly unsaturated fatty
acids was detected only in BE(2)M17 cells. Lipid signal intensities are intermediate in BT4C
and U87-MG cells, while PFSK-1 and DAOY showed the lowest signal intensities. The
resonance at 5.4ppm, which arises from unsaturated lipids, is close to the value of the noise in
PFSK-1 and DAOY cells.

95
Figure 6.4 HR-MAS spectra of five nervous system and brain tumour cells.
The assignment of lipid signals are as follows: 1–CH3 at 0.9ppm, 2–(CH2) –at 1.3ppm, 3–CH2–
CH2–C=O at 1.58ppm, 4 –CH2–CH= at 2.02ppm, 5–CH2–CH2–C=O at 2.2ppm, 6 =CH–CH2–
CH= at 2.8ppm‚ 7 –CH=CH– at 5.4ppm.
6.3.3 Correlation between LD size and NMR lipid signal intensity
Plots for the largest LD present in each cell line with the NMR lipid the methyl and methylene
signals are shown in Figure 6.5. Plots of estimated LD volume and the lipid NMR signal
intensities are shown in Figure 6.6. Linear correlations were evident between the size of LDs
BE(2)M17
BT4C
DAOY
PFSK-1
U87-MG
7
1
2
3 4
5
5 4 3 2 1 Chemical shift (ppm)
6

96
and the intensities of lipid NMR signals as well as between LD volume and NMR signal
intensities (P < 0.001 for all four plots). However, the line of best fit does not pass through the
origin implying that no signal is observed from the smallest of the lipid droplets. The lipid
signal intensity was normalised to total MM, the sum of signal intensity from macromolecular
peaks at 0.9, 1.68 and 3.0ppm as referencing to protein signal has been shown to be a good
approach in NMR signal quantification [170].
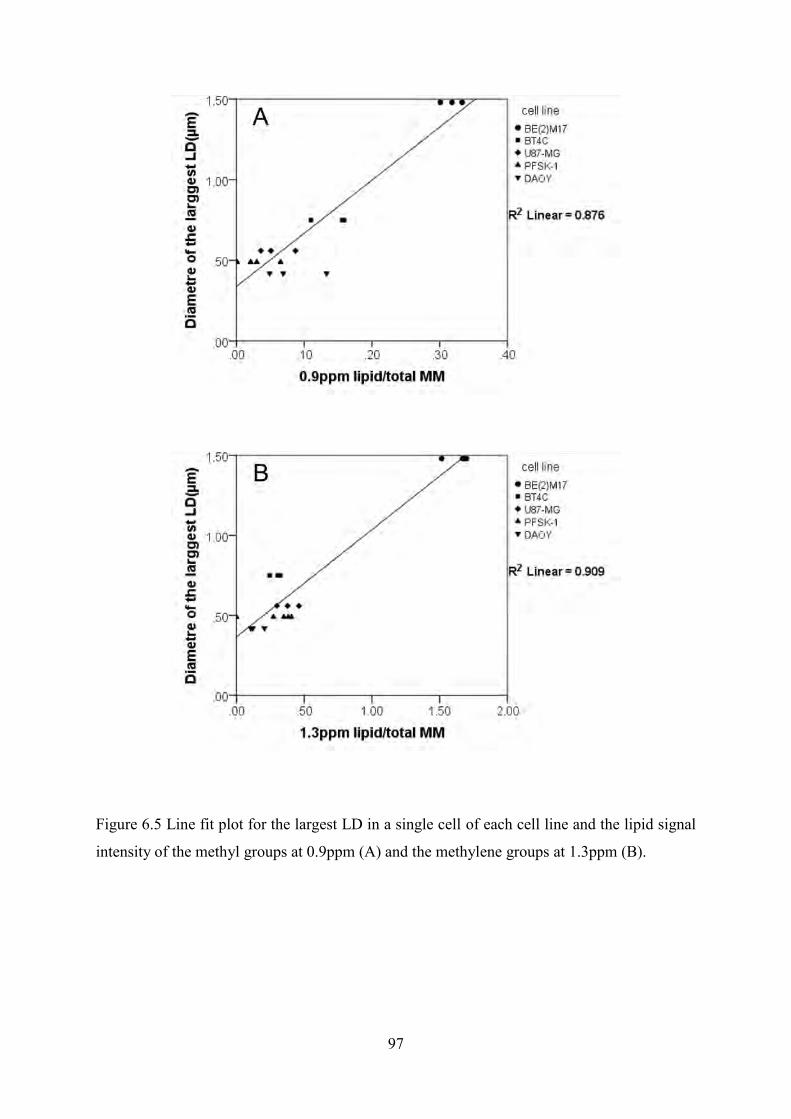
97
Figure 6.5 Line fit plot for the largest LD in a single cell of each cell line and the lipid signal
intensity of the methyl groups at 0.9ppm (A) and the methylene groups at 1.3ppm (B).

98
Figure 6.6 Line fit plot for the sum of total LD volume in each cell and the lipid signal
intensity measured from 0.9ppm, CH3 groups (A) and 1.3ppm, CH2 groups (B)

99
6.4 Discussion
6.4.1 Variations of LDs in five cell lines
Intracellular LDs range in size from the massive droplets of 200µm in diameter, found in
mature adipocytes, to the nascent LDs of only 50 nm in diameter, found in milk-secreting cells
[73]. Growth conditions, such as confluence and serum supply, influence the size of LDs in
cell lines [68]. In the current study, nervous system cancer cells were harvested at log growth
phase approaching confluence. In these cancer cells, an average LD diameter is approximately
0.2µm. The difference between cell types mainly comes in the number and size of LDs with
diameter larger than 0.4µm. These observations indicate that the nervous system cancer cell
lines studied produce LDs of similar diameter, however, some of these cell lines, most notably
BE(2)M17, also contain significantly larger LDs under the culture conditions used.
The biogenesis of LDs remains poorly understood, the emerging proteomic studies of LDs
suggested that LD proteins are the main controllers for the growth of nascent lipid droplets
[111]. Various LD proteins have been identified in the LDs fraction purified from different
tissues and cells [82, 112]. The difference of the LD size and the observation that the
accumulation of LDs in BE(2)M17 cells is more sensitive to the serum supply and over
confluence compared with PFSK-1 and DAOY cells suggests that the lipid metabolism of LDs
in these five cells might be different.
6.4.2 NMR detection of LDs
The qualitative patterns of lipid NMR resonances from all five cell lines (Figure 6.4) are
similar, indicating that the chemical lipid species contributing to the NMR spectra are similar.
Quantitative analysis of lipid peaks using –CH3 and –CH2- resonances shows that in cells
100
containing larger than 0.4 um LDs NMR concentrations of lipids is higher than in those
devoid of large LDs. NMR detected lipid signals have been reported to quantitatively
correlate to LDs measured with phase contrast microscopy [171] and Nile red-stained LDs in
a rat glioblastoma cell line [68]. In order to give narrow NMR lines, molecules must tumble
fast to have long T2 (see section 2.1 for detailed discussion about T2). For example, lactate
with a small molecular weight has a T2 around 150ms[172] and free fatty acids have a T2
round 20ms[173]. LDs exist in numerous types of cells [73], but lipids in LDs may not
generate NMR signal due to their restricted mobility caused by dipolar effect in tiny droplets.
It was proposed that LDs lower than 0.1µm are NMR invisible [68]. LDs in cell lines studied
were larger than 0.07 m, PFSK-1 cells contained more LDs around 0.2µm than any other
cell line, yet the NMR lipid signals from PFSK-1 cells are weaker than in BE(2)M17 cells, a
cell line with lower average LD count per cell than PFSK-1. Thus, the volume of LDs in this
diameter range is a more important determinant of the NMR lipid detectability than the total
number of LDs. This is demonstrated by linear correlation between LD volume and NMR
lipid signal intensities (Figure 6.7). However, the line of best fit does not pass through the
origin, but rather extrapolating to where the lipid signal is zero gives a value on the lipid
droplet size axis of around 0.34m diameter roughly in agreement with Quintero et al[68]. It
should be noted that the HR-MAS spectra in this study were acquired under 6.7 0C. NMR
lipid signal was better detected by HR-MAS at 370C [174], therefore, the limiting droplet size
for NMR lipid detection could be lower.
It should be borne in mind that other macromolecules than lipids, such as polypeptitides and
proteins [175], contribute to the peaks at 0.9 and 1.3 ppm. We observed that the lipid signal
intensity of –CH3 peak (Figure 6.6A) in DAOY cells appears greater than that from –CH2–
(Figure 6.6B). The discrepancy is possibly due to the higher macromolecule contribution to

101
the 0.9ppm peak than by lipids. The relatively poor correlation between LD volume and lipid
signal at 0.9ppm in DAOY and PFSK-1 cells is most likely due to large macromolecular
contribution to this signal as these two cell lines have a relatively higher protein/lipid level
compared with other cell lines (Figure 6.4).
6.5 Conclusion
In conclusion, cytoplasmic lipid droplets exist in large numbers prior to treatment in all the
studied cell lines but the size of the largest droplets varies greatly from one cell line to another.
High NMR lipid signals are associated with the presence of large lipid droplets and these cells
also contain the greatest total volume of lipid. Some cell lines contain very large numbers of
small lipid droplets and are associated with very small NMR lipid signals. The NMR signal
reflects both the total amount of lipid present and the mobility of the lipids within the droplets.
LDs above certain size (here approximately 0.34µm) have a similar rotational freedom for
NMR detection and the total LD volume then becomes the critical factor for NMR signal
intensity.

102
Chapter 7 Lipids in cytoplasmic lipid
droplets and whole cells in nervous
system tumour cell lines

103
7.1 Introduction
Increased biogenesis of cytoplasmic lipid droplets (LDs) is reported in colon adenocarcinoma,
cervical carcinoma, human brain tumour[37] and hepatocarcinoma [176]. LDs are found to be
involved in the proliferation [138] apoptosis and differentiation of cancer cells [136]. Lipid
droplet-specific protein ADRP has been proposed as a potential diagnostic and prognostic
biomarker for renal carcinoma in a recent gene expression study [177]. It is also suggested that
inhibition of LD formation could have an effect on neoplastic cell proliferation [138]. The
commonly found LDs [73] have spherical appearance surrounded by a monolayer of polar
lipids [104] with attached proteins that encircles a hydrophobic core of non-polar lipids [73].
LDs have been regarded as specialized structures to store triacylglycerols, sterol esters and
other neutral lipids. Recently, LDs has been reported to be dynamic intracellular organelles
being involved in lipid metabolism, cell proliferation, apoptosis and necrosis [59, 113, 122].
Nuclear magnetic resonance (NMR) signals from cellular lipids have been detected in brain
tumour cells and tissues [37, 59]. A growing body of clinical and experimental observations
show that the lipid NMR resonances are linked to tumour type, grade [37, 62] and treatment
response [34, 61] suggesting the potential of NMR signals to aid diagnosis and treatment
monitoring. Recent studies show that LDs in the cytoplasm are likely to be the main source of
NMR signals [50, 77]. The absence of prominent lipid resonance in normal brain parenchyma
[50] suggests that LDs, as the main subcellular origin of NMR lipid signal, may play an
important imaging biomarker role for brain tumours.
1H NMR can be used as an analytical chemistry technique to elucidate the chemical nature of
lipid molecules. It was first used to determine the unsaturation and average molecular weight
of natural lipids [178]. Later, the use of 1H NMR has expanded to determine the lipid profile of
104
human tissue [157] and evaluate the lipid composition of human healthy and neoplastic renal
tissues [72]. A study of HepG2 cells elucidated that the surface of lipid droplets is a
phospholipid monolayer containing cholesterol (Chol) with a unique fatty acid composition
[104]. The main feature of LD lipids and their difference compared with whole cell lipids in
cancer cells remains poorly understood.
Lipid species in LDs can be analysed with LD isolation together with various analytical
methods. In this study, LDs isolated from two glial and three neuronal nervous system tumour
cell lines were investigated. The morphology of LDs was assessed by Nile red staining.
Density-gradient ultracentrifugation was used to isolate the LDs from whole cell homogenates.
The lipid composition of different tumour cells was assessed by analysing 1H NMR lipid
signals from lipid extracts of both LD and whole cell lipids. Identifying the constituents of
these LDs can improve our understanding of lipid metabolism in tumour cells and help to
identify potential diagnostic and therapeutic targets.
7.2 Methods
Five nervous system tumour cell lines as described in Chapter 4.1 were maintained in 20 ml
DMEM media. The cells were harvested at around 95% confluence (chapter 4.1). HR-MAS
and liquid-state 1H NMR spectroscopy was performed on a Varian 600-MHz (14.1 T) vertical
bore spectrometer (chapter 4.7).
The lipid extracts spectra were manually phased, baseline corrected and referenced to TMS at
0ppm. Signal intensity of the peaks around 0.9, 1.1, 1.2-1.4, 2.8, 3.4 and 5.4ppm was measured
using the line fitting method from wxNUTs. The group statistical difference was analysed
using Student’s t-test.
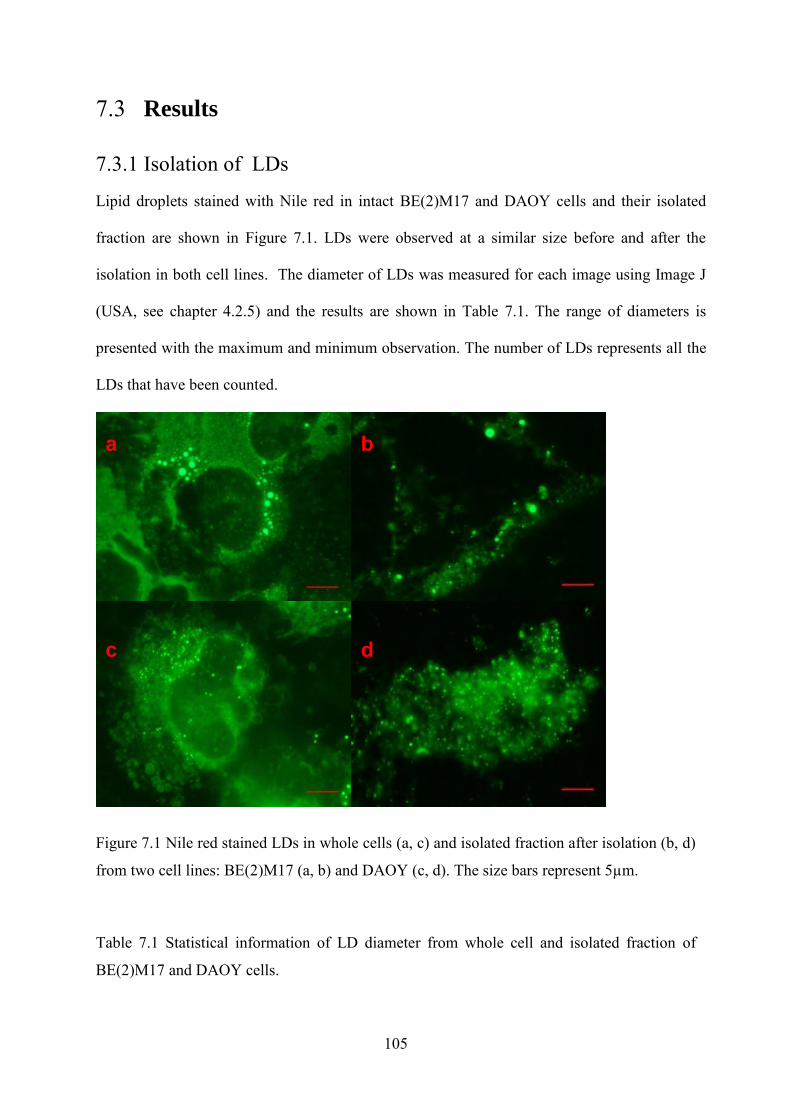
105
7.3 Results
7.3.1 Isolation of LDs
Lipid droplets stained with Nile red in intact BE(2)M17 and DAOY cells and their isolated
fraction are shown in Figure 7.1. LDs were observed at a similar size before and after the
isolation in both cell lines. The diameter of LDs was measured for each image using Image J
(USA, see chapter 4.2.5) and the results are shown in Table 7.1. The range of diameters is
presented with the maximum and minimum observation. The number of LDs represents all the
LDs that have been counted.
Figure 7.1 Nile red stained LDs in whole cells (a, c) and isolated fraction after isolation (b, d)
from two cell lines: BE(2)M17 (a, b) and DAOY (c, d). The size bars represent 5µm.
Table 7.1 Statistical information of LD diameter from whole cell and isolated fraction of
BE(2)M17 and DAOY cells.
a
c d
b

106
The HR-MAS spectra acquired from BE(2)M17 and DAOY cells and their isolated fractions
containing LDs are shown in Figure 7.2. The region from 3.2 to 0.8ppm was plotted to exclude
the huge sucrose peaks in the isolated LD fraction. The spectra were manually phased,
referenced the Cr signal at 3.03ppm, baseline corrected and scaled to the height of the lipid
peak at 0.9ppm. A similarity between the lipid peaks was observed between whole cells and
the isolated LDs in both cell lines.
Chemical shift
a 1
2
3 4 5 6
3.0 2.0 2.5 1.5 1.0ppm
c
b
d

107
Figure 7.2 HR-MAS spectra acquired from BE(2)M17 (a) and DAOY (c) whole cell pellets
and lipid-state 1H NMR spectra acquired from the isolated fraction of BE(2)M17 (b) and
DAOY (d). Spectra were normalised to the maximum point of lipid peaks at 0.9ppm. The
peaks labelled with numbers in the top spectrum are assigned as follows: 1–CH3 at 0.9ppm,
2–(CH2) –at 1.3ppm, 3–CH2–CH2–C=O at 1.58ppm, 4 –CH2–CH= at 2.02ppm, 5–CH2–
CH2–C=O at 2.2ppm, 6 =CH–CH2–CH= at 2.8ppm.
The ratio of lipid signal intensity to macromolecular signal intensity at 0.9ppm for whole cells
and their isolated fractions was shown in Figure 7.3. Each point represents an average value for
each cell line. The error bars represent standard error from at least three independent replicates.
A good linear correlation (R2=0.9169, P=0.005) between the NMR lipid signal from isolated
LDs and that of the whole cells in five cell lines was found.
Figure 7.3 Linear regression of the ratio of lipid/macromolecular at 0.9ppm peaks between
HRMAS spectra and isolated LDs spectra for five cell lines. Each point in the plot represents
one cell line and the error bars represent standard errors.
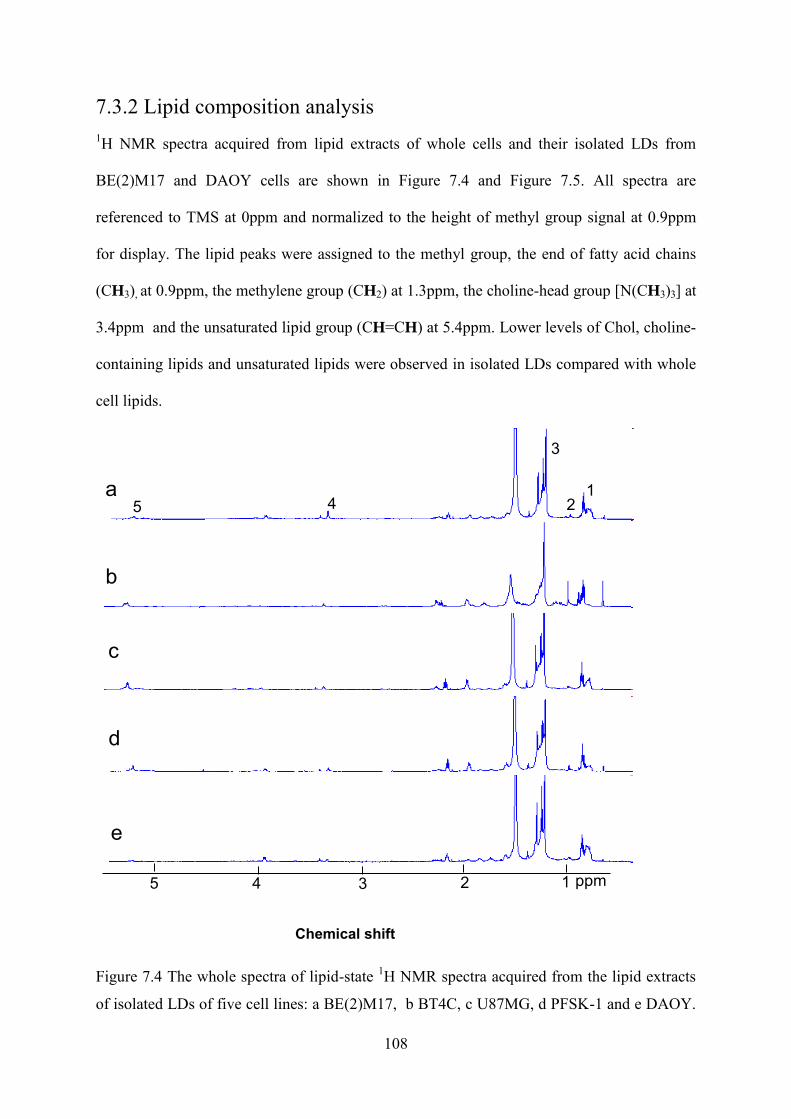
108
7.3.2 Lipid composition analysis 1H NMR spectra acquired from lipid extracts of whole cells and their isolated LDs from
BE(2)M17 and DAOY cells are shown in Figure 7.4 and Figure 7.5. All spectra are
referenced to TMS at 0ppm and normalized to the height of methyl group signal at 0.9ppm
for display. The lipid peaks were assigned to the methyl group, the end of fatty acid chains
(CH3), at 0.9ppm, the methylene group (CH2) at 1.3ppm, the choline-head group [N(CH3)3] at
3.4ppm and the unsaturated lipid group (CH=CH) at 5.4ppm. Lower levels of Chol, choline-
containing lipids and unsaturated lipids were observed in isolated LDs compared with whole
cell lipids.
Chemical shift
Figure 7.4 The whole spectra of lipid-state 1H NMR spectra acquired from the lipid extracts
of isolated LDs of five cell lines: a BE(2)M17, b BT4C, c U87MG, d PFSK-1 and e DAOY.
5 4 3 2 1 ppm
b
a
d
c
e
1 2 4 5
3
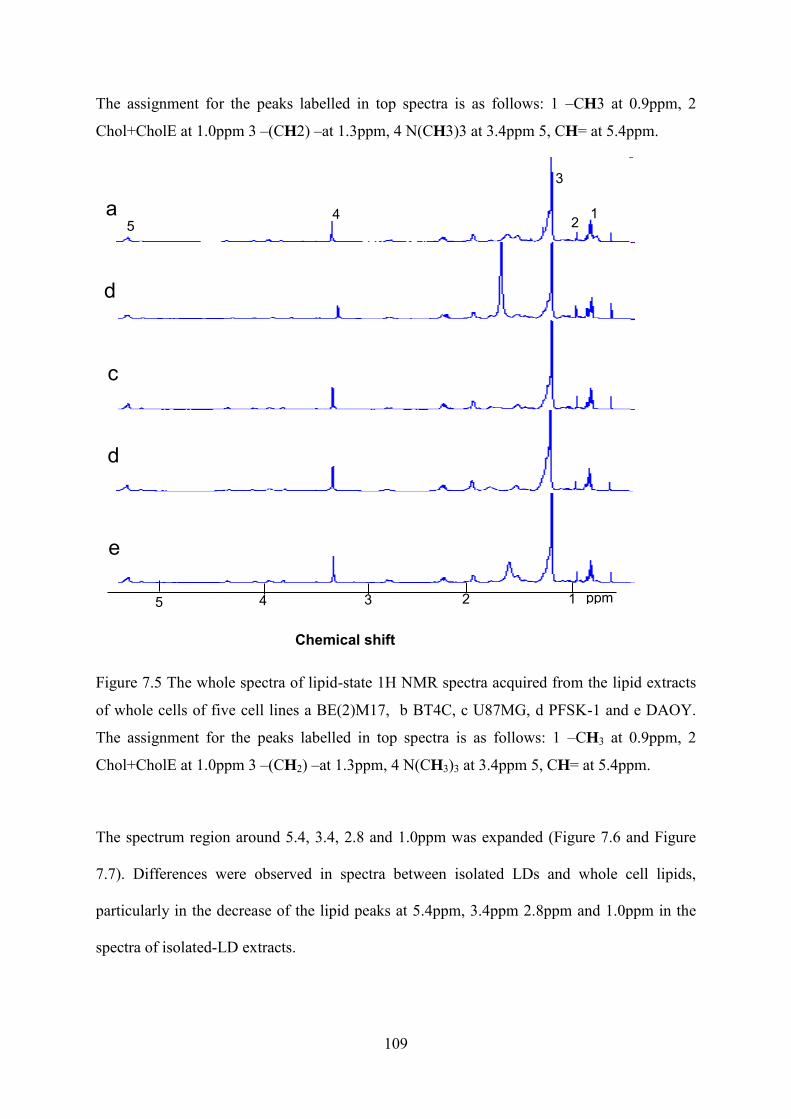
109
The assignment for the peaks labelled in top spectra is as follows: 1 –CH3 at 0.9ppm, 2
Chol+CholE at 1.0ppm 3 –(CH2) –at 1.3ppm, 4 N(CH3)3 at 3.4ppm 5, CH= at 5.4ppm.
Chemical shift
Figure 7.5 The whole spectra of lipid-state 1H NMR spectra acquired from the lipid extracts
of whole cells of five cell lines a BE(2)M17, b BT4C, c U87MG, d PFSK-1 and e DAOY.
The assignment for the peaks labelled in top spectra is as follows: 1 –CH3 at 0.9ppm, 2
Chol+CholE at 1.0ppm 3 –(CH2) –at 1.3ppm, 4 N(CH3)3 at 3.4ppm 5, CH= at 5.4ppm.
The spectrum region around 5.4, 3.4, 2.8 and 1.0ppm was expanded (Figure 7.6 and Figure
7.7). Differences were observed in spectra between isolated LDs and whole cell lipids,
particularly in the decrease of the lipid peaks at 5.4ppm, 3.4ppm 2.8ppm and 1.0ppm in the
spectra of isolated-LD extracts.
5 4 3 2 1 ppm
e
d
4 5
c
1 2
d
a 3
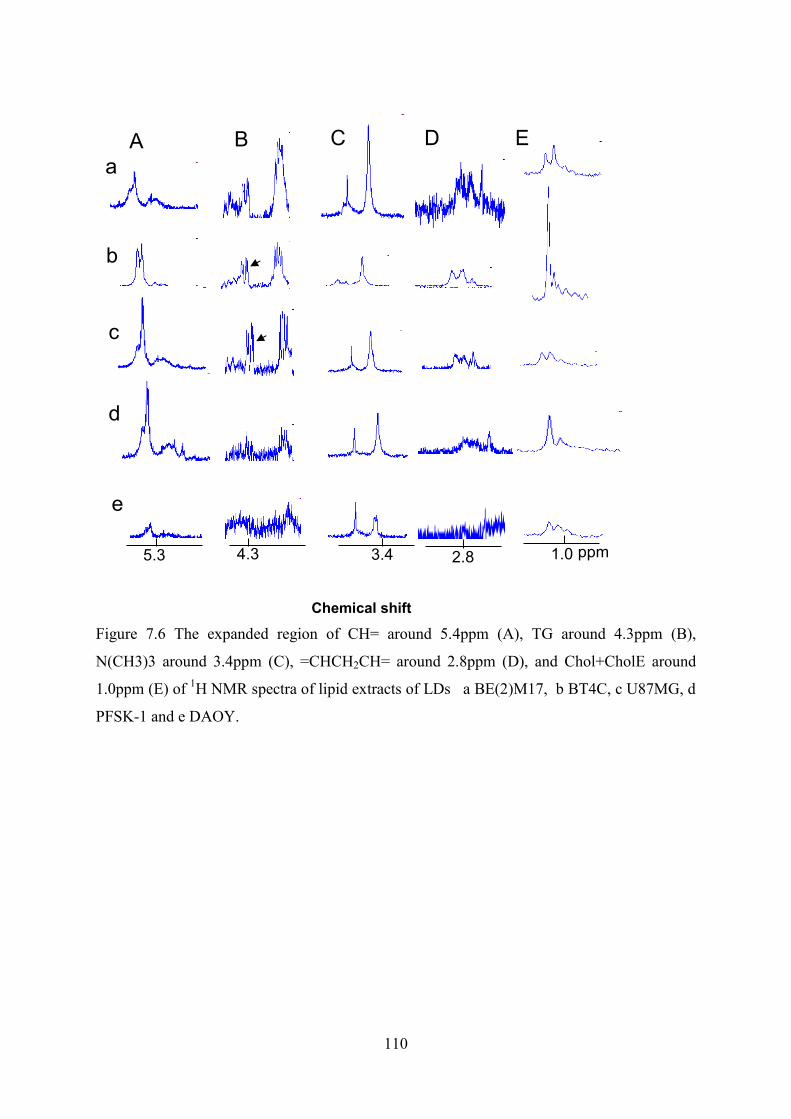
110
Chemical shift
Figure 7.6 The expanded region of CH= around 5.4ppm (A), TG around 4.3ppm (B),
N(CH3)3 around 3.4ppm (C), =CHCH2CH= around 2.8ppm (D), and Chol+CholE around
1.0ppm (E) of 1H NMR spectra of lipid extracts of LDs a BE(2)M17, b BT4C, c U87MG, d
PFSK-1 and e DAOY.
5.3 4.3 3.4 2.8 1.0 ppm
a
b
c
d
e
A B C D E
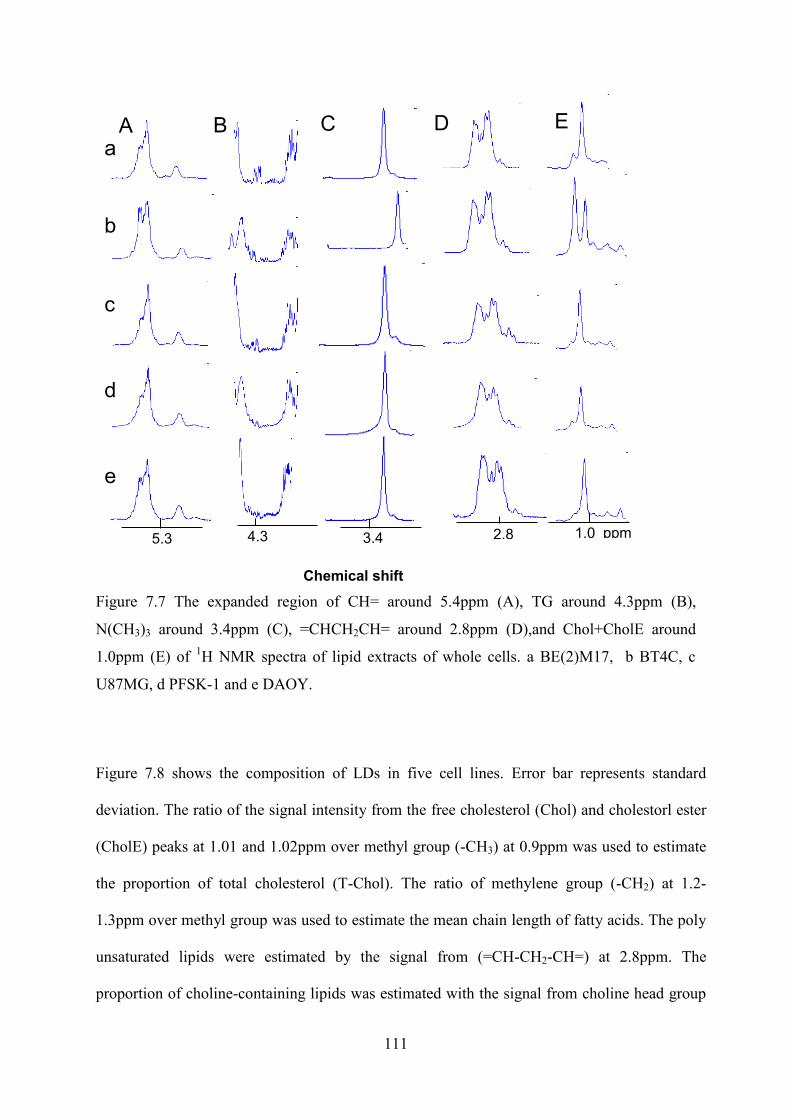
111
Chemical shift
Figure 7.7 The expanded region of CH= around 5.4ppm (A), TG around 4.3ppm (B),
N(CH3)3 around 3.4ppm (C), =CHCH2CH= around 2.8ppm (D),and Chol+CholE around
1.0ppm (E) of 1H NMR spectra of lipid extracts of whole cells. a BE(2)M17, b BT4C, c
U87MG, d PFSK-1 and e DAOY.
Figure 7.8 shows the composition of LDs in five cell lines. Error bar represents standard
deviation. The ratio of the signal intensity from the free cholesterol (Chol) and cholestorl ester
(CholE) peaks at 1.01 and 1.02ppm over methyl group (-CH3) at 0.9ppm was used to estimate
the proportion of total cholesterol (T-Chol). The ratio of methylene group (-CH2) at 1.2-
1.3ppm over methyl group was used to estimate the mean chain length of fatty acids. The poly
unsaturated lipids were estimated by the signal from (=CH-CH2-CH=) at 2.8ppm. The
proportion of choline-containing lipids was estimated with the signal from choline head group
5.3 4.3 3.4 2.8 1.0 ppm
a
b
c
d
e
A B C D E
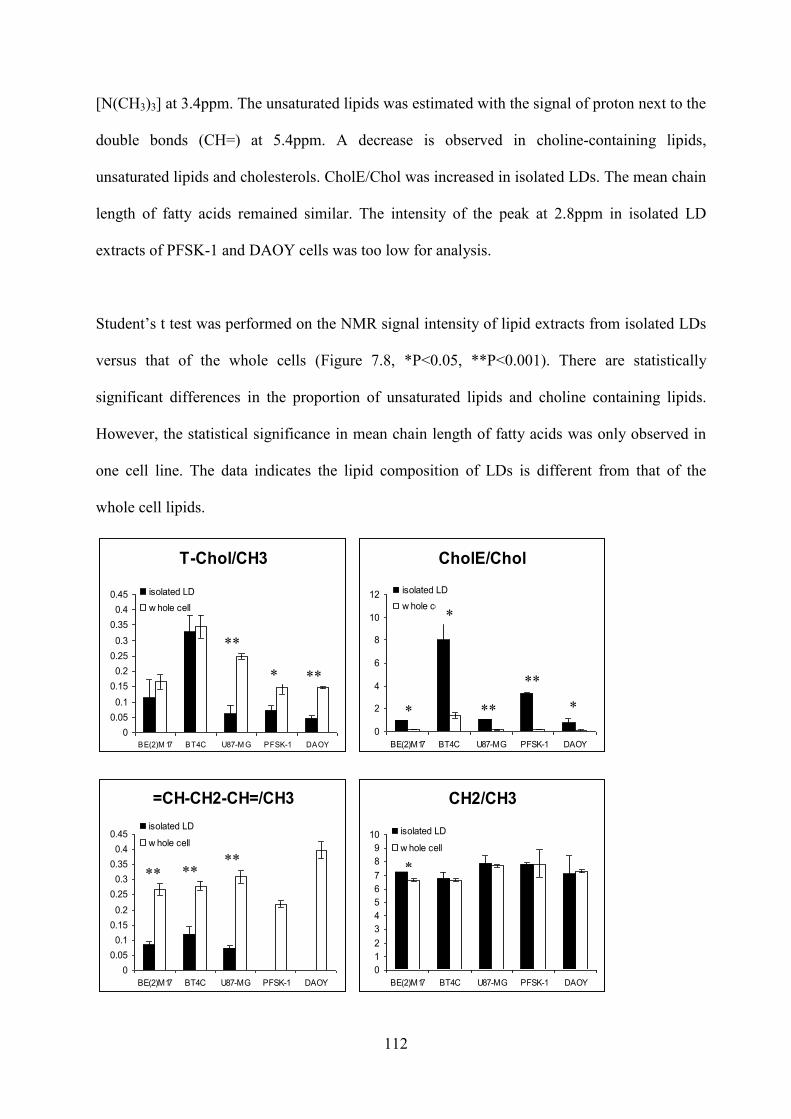
112
[N(CH3)3] at 3.4ppm. The unsaturated lipids was estimated with the signal of proton next to the
double bonds (CH=) at 5.4ppm. A decrease is observed in choline-containing lipids,
unsaturated lipids and cholesterols. CholE/Chol was increased in isolated LDs. The mean chain
length of fatty acids remained similar. The intensity of the peak at 2.8ppm in isolated LD
extracts of PFSK-1 and DAOY cells was too low for analysis.
Student’s t test was performed on the NMR signal intensity of lipid extracts from isolated LDs
versus that of the whole cells (Figure 7.8, *P<0.05, **P<0.001). There are statistically
significant differences in the proportion of unsaturated lipids and choline containing lipids.
However, the statistical significance in mean chain length of fatty acids was only observed in
one cell line. The data indicates the lipid composition of LDs is different from that of the
whole cell lipids.
T-Chol/CH3
00.050.1
0.150.2
0.250.3
0.350.4
0.45
BE(2)M 17 BT4C U87-M G PFSK-1 DAOY
isolated LDw hole cell
CholE/Chol
0
2
4
6
8
10
12
BE(2)M17 BT4C U87-MG PFSK-1 DAOY
isolated LDw hole cell
=CH-CH2-CH=/CH3
00.050.1
0.150.2
0.250.3
0.350.4
0.45
BE(2)M17 BT4C U87-MG PFSK-1 DAOY
isolated LD
w hole cell
CH2/CH3
0123456789
10
BE(2)M17 BT4C U87-MG PFSK-1 DAOY
isolated LD
w hole cell
**
* **
**
**
*
*
*
** ** ** *

113
*P<0.05 **P<0.001
Figure 7.8 Bar plots of the signal intensity of different lipid groups in five cell lines. Black
bars for isolated LDs and white bars for whole cells. The error bars represent standard
deviation.
7.4 Discussion
The similarity of LD diameters in the cytoplasm of cancer cells and in the isolated fraction
shows that the isolation process was successful. Thus, we believe that the 1H NMR spectra
from LDs and their extracts are representative for these intracellular bodies. The
macromolecule peaks at 3.0, 2.2, 2.0 and 1.68ppm were hardly detectable in LD HR-MAS
spectra, but clearly discernible in the whole cell preparations, indicating that these NMR
signals probably arise from soluble cytoplasmic proteins or proteins from other sub-cellular
structures. The macromolecule signal at 0.9ppm showed decreased intensity in both cell lines
after the isolation suggesting that the residual protein signals arise from species associated
with LDs or from microtubule network surrounding LDs. LD lipids account for a small
proportion of whole cell lipids [179]. The similarity of lipid signal patterns between isolated
LDs and whole cells, together with the linear correlation of signal ratios (Figure 7.3), agree
with the proposal that LDs are the main contributors to the cellular 1H NMR lipid signals.
N(CH3)3/CH3
00.10.20.30.40.50.60.70.80.9
BE(2)M17 BT4C U87-MG PFSK-1 DAOY
isolated LD
w hole cell
CH=/CH3
00.10.20.30.40.50.60.70.80.9
BE(2)M17 BT4C U87-MG PFSK-1 DAOY
isolated LD
w hole cell** **
*
* * * * * *
*
114
LDs were thought to be lipids storage depots as excess fatty acids are converted into neutral
lipids and deposited in them. In mammalian cells, the neutral lipid core of LDs are
predominated by triacylglycerols and cholesteryl esters [113]. The fact that LDs are
surrounded by a mono-layer membrane structure [104] means that LDs are expected to
contain a certain amount of phospholipids. Phosphatidylcholine(PC) is found in all the sub-
cellular components of the nervous system [180] and a higher level of PC was suggested to
be correlated with a low degree of differentiation of tumour cells [181]. The lipid signal from
choline-head groups around 3.40ppm in whole cells and at 3.42ppm in LDs found in this
study match PC chemical shift, suggesting that PC is the main component in the choline-
containing lipids also in the nervous system cancer cells.
Unsaturated fatty acids are important structural components that confer membrane fluidity and
selective permeability [182]. The proportion of unsaturated fatty acids is similar to that of the
choline-containing lipids suggesting that unsaturated lipid signal in whole cell extracts mainly
are from plasma membrane and therefore, contribution of LD lipids to the unsaturated lipid
NMR signals detected in HR-MAS spectra from cell preparations is negligible. Recent
evidence shows LDs contain functional fatty acids such as eicosanoids, signalling molecules
synthesized by oxidation of twenty-carbon PUFAs and have key roles in controlling cellular
processes, including cell activation, migration, proliferation and cell apoptosis [131, 132, 183].
High relative concentration of unsaturated lipids compared to the lipids containing a choline-
head in LDs suggests that LDs may contain functional free fatty acids of unsaturated chemical
nature. An increasing number of studies found that LDs were actively involved in many
important cellular processes such as protein synthesis, cell apoptosis and necrosis [37, 59, 122,
153]. The observation of excess unsaturated lipids other than structural ones and the presence
115
of polyunsaturated lipid signal at 2.8ppm (Figure 7.8) argue the possibility that LDs may
provide some key lipidic molecules for these processes.
Cholesterol is the most prevalent steroid in humans. The majority of cellular free cholesterol,
as an essential structural component, is a residue on the plasma membrane [113]. The brain is
the most cholesterol rich organ in the body and the mean concentration of un-esterified
cholesterol in the central nerve system (CNS) is higher than that in any other tissue [184].
All of brain cholesterol is synthesized locally [185], but the cholesterol biosynthesis in
nervous system is still partly understood. Glial and neuronal cells are also implicated to be
capable of cholesterol synthesis [185]. Cholesterol is abundant in the brain. Nerve system
tumour cells used in this study show different levels of cholesterol (Figure 7.6). High
cholesterol levels are observed in glioblastoma cell lines U87-MG and BT4C relative to cell
lines originating from other CNS cells (Figure 7.8) possibly due to their high proliferation
rate. The rapid growth of cancer cells is regulated by the availability of nutrients such as
cholesterol[186].
Normal adult brain contains very small concentration of cholesteryl ester (CholE) that
amounts only to 0.1 to 0.2% of that of total cholesterol [187]. Cholesterol and especially its
estificated form are associated with cell malignancy. The presence of CholE was found to be
correlated with high grade brain tumours while no CholE was observed in normal brain
tissues in a NMR spectroscopy study [25]. A study of U87-MG cells reported that the
inhibition of cholesterol esterification significantly reduced cell proliferation and invasion
indicating the importance of CholE in high grade tumour cell growth [188]. In our study, the
esterification rate of cholesterol was varied from 7.7±5.0% (mean±SD) of total cholesterol in
DAOY to 58.4±4.7% in BT4C. LDs play an important role in intracellular cholesterol
116
regulation as excess cholesterol can be stored in LDs in the form of cholesteryl esters [189].
A higher ratio of CholE to Chol was presented in LDs compared with whole cell lipids.
The multiplet centred at 4.20ppm with a symmetric appearance was attributed to a glycerol
residue from triacylglycerol (TG) according to the literature [25] and the TG spectrum
acquired from standard sample (Sigma, UK). The relative signal intensity of the glycerol
backbone of 4.3ppm (arrowed pointed in Figure 7.6) over methyl group was measured. In
BT4C cells, the ratio of signal intensity was 0.03±0.015 (mean ± SD) in LDs and 0.01±0.003
in whole cell lipids. In U87-MG cells, it was 0.04±0.004 in LDs and 0.03±0.003 in whole cell
lipids. The increase was statistically significant (Student’s t-test, P<0.05) in both cell lines.
This data shows that LDs have a higher TG proportion than whole cell lipids.
7.5 Conclusion
Cytoplasmic LDs are an important component of childhood brain and nervous system tumour
cells which can be imaged using NMR. LDs contain phosphatidylcholine, cholesterol and
cholesterol ester with fatty acid chains being saturated, mono-unsaturated and
polyunsaturated.Their composition is different from the lipid pool of whole cells implicating an
important role of LDs in tumour lipid metabolism.
117
Chapter 8 An increase in
unsaturated lipids of cytoplasmic lipid
droplets in DAOY cells responding to
cisplatin treatment
118
8.1 Introduction
A growing body of evidence show that 1H magnetic resonance spectroscopy (NMR) bears a
promise in detecting the early responses of tumours to therapy. In particular, 1H NMR visible
lipids have been observed in successful cancer treatment [34, 38] indicating a potential
biomarker role in clinical cancer management.
Both cell work in vitro [190] and that using preclinical tumour models [38] have demonstrated
that apoptosis induced by various anti-cancer therapies result in subtle increase in saturated
aliphatic 1H NMR signals as well as unsaturated bis-allylic and vinyl peaks. Increase in 1H
NMR lipids is closely associated with appearance of cytoplasmic lipid droplets (LD) [68], the
principal source of NMR detectable lipids in vivo.
While some studies [81, 191] have reported increase in CH2/CH3 ratio reflecting lengthening of
fatty acyl chain, others[141, 151] have failed to confirm this observation indicating that NMR
lipids do not change chemically during cell death. Several studies have observed an increase in
unsaturated NMR signals during cell death. It was proposed that NMR lipids accumulating
during apoptosis originate from membranous cell structures due to lipolysis and repartitioning
[38], however a recent cell study [192] concluded that de novo lipid synthesis may also
contribute to the accumulation of 1H NMR lipid signals. We have shown in Chapter 5 that LDs
were isolated from nervous system cancer cells for lipid analyses. It was observed that LDs
contain phospholipids, triglyceride, cholesterol and cholesteryl esters with their fatty acid
chains being saturated and unsaturated.
In the current study, two human primitive neuroectodermal tumour cell lines were treated with
cisplatin (see chapter3.6)to examine lipid species both at the whole cell and LD levels. Both
119
1D 1H NMR and 2D HSQC were used to characterise chemical nature of lipid species in
untreated and treated cancer cells. We expect that comparison of chemical nature of lipid both
at whole cell and LD levels may provide vital information for role of lipids in cell death
pathways.
8.2 Methods
DAOY, human medulloblastoma and PFSK-1, human supratentorial primitive
neuroectodermal tumour (ST-PNET) cell lines maintained in 15 ml DMEM with or without
cisplatin (chapter4.1.3). Untreated cells were harvested at around 90% confluence. After
washing with 10ml ice-cold phosphate buffered saline three times, cells were then removed
from the flask using a rubber policeman and centrifuged to form a pellet. Cisplatin-treated and
control cells were removed from the flask first and then washed with ice-cold PBS to collect
the dead cells.
HR-MAS and 2D 1H-13C HSQC on cell pellets were performed on a Bruker 500MHz
spectrometer using a HR-MAS probe (Bruker, German) and 1H NMR spectra of lipid extracts
were recorded on a Varian 600-MHz (14.1 T) vertical bore spectrometer using a HCN probe. A
standard pulse-acquire sequence was used. All spectra were manually phased and referenced to
TMS at 0ppm (chapter4.7).
The spectra were manually phased, referenced to TMS (0ppm) for the extract spectra and
creatine (3.03ppm) for the HR-MAS spectra. The extract spectra were analysed with spectral
analysis software, wxNUTs. The lipid signal intensity was calculated using the line fitting
function provided by wxNUTs which fits a series of peaks to the experimental spectrum and
extracts the signal amplified parameter from the fit. Student’s t test was performed on the

120
treated data versus the untreated one. R was used in the analysis for the HR-MAS spectra. The
signal intensity of the 0.9, 1.3, 2.8 and 5.4ppm regions were measured using integration to
estimate the relative abundance of saturated and unsaturated lipids.
8.3 Results
8.3.1 Survival with cisplatin treatment
Cell survival curve after cisplatin treatment assessed by Alamar blue assay is shown in Figure
8.1. With a 48h treatment at 10µM concentration, the survival rate for DAOY is 5%±0.2%
(mean ± SD) while around 60%±1.1% PFSK-1 cells were left. DAOY showed a good response
to 10µM cisplatin treatment whereas PFSK-1 did not, thus, this concentration was chosen from
subsequent experiments.
Figure 8.1 Cell survival curve of DAOY and PFSK-1 cells after exposed to cisplatin with
indicated concentrations at 48h.
8.3.2 Lipid droplet accumulation with cell death
Cisplatin
0%
50%
100%
0 0.1µM 1µM 10µM 100µM
Log [Concentration(µM)]
Cel
l sur
viva
l DAOY
PFSK-1
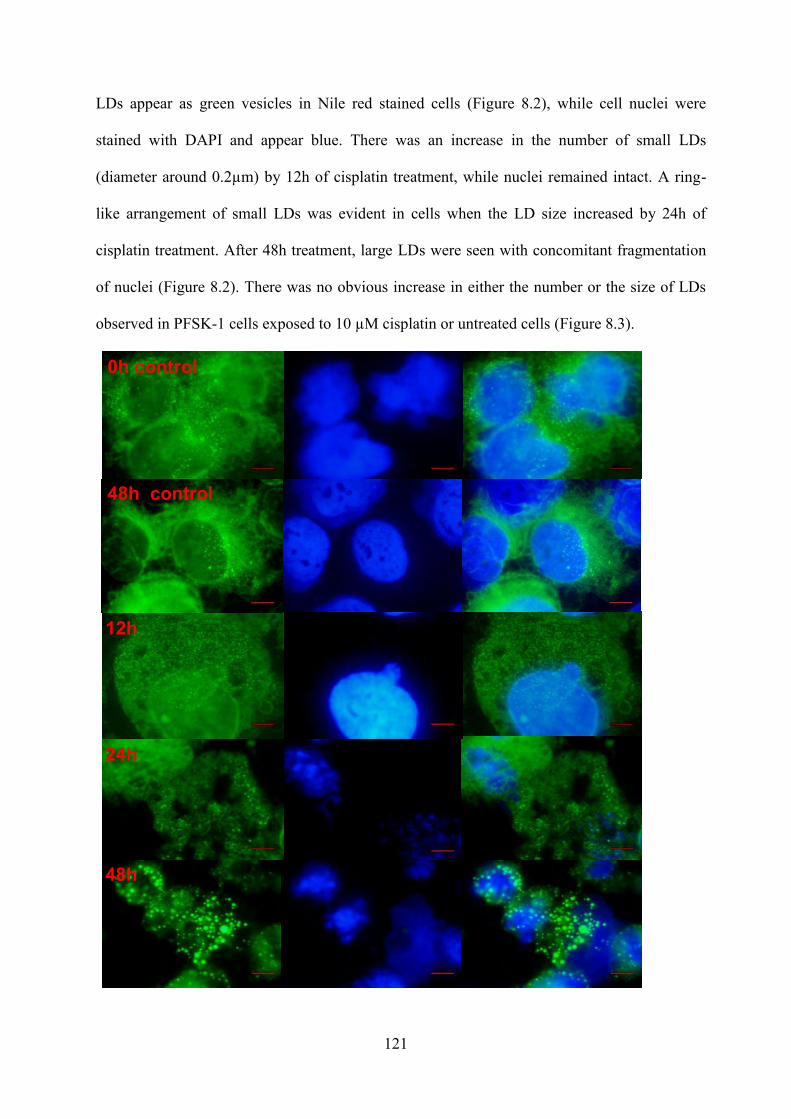
121
LDs appear as green vesicles in Nile red stained cells (Figure 8.2), while cell nuclei were
stained with DAPI and appear blue. There was an increase in the number of small LDs
(diameter around 0.2µm) by 12h of cisplatin treatment, while nuclei remained intact. A ring-
like arrangement of small LDs was evident in cells when the LD size increased by 24h of
cisplatin treatment. After 48h treatment, large LDs were seen with concomitant fragmentation
of nuclei (Figure 8.2). There was no obvious increase in either the number or the size of LDs
observed in PFSK-1 cells exposed to 10 µM cisplatin or untreated cells (Figure 8.3).
0h control
12h
24h
48h
48h control
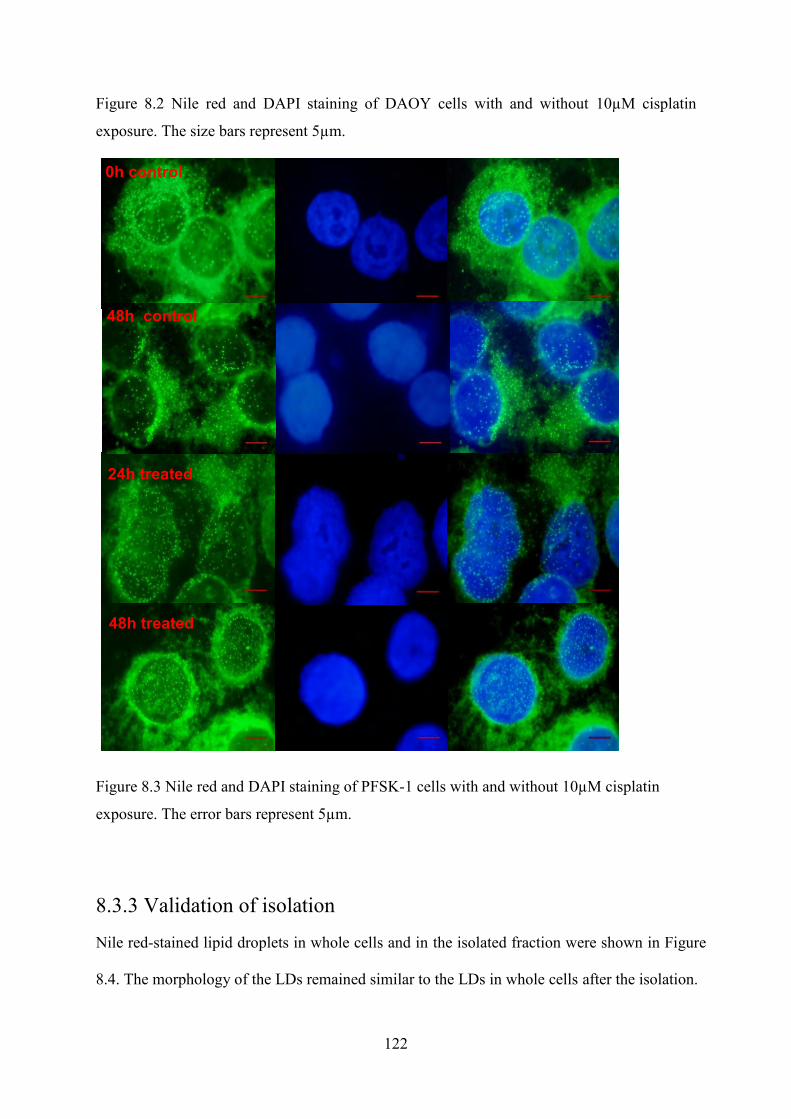
122
Figure 8.2 Nile red and DAPI staining of DAOY cells with and without 10µM cisplatin
exposure. The size bars represent 5µm.
Figure 8.3 Nile red and DAPI staining of PFSK-1 cells with and without 10µM cisplatin
exposure. The error bars represent 5µm.
8.3.3 Validation of isolation
Nile red-stained lipid droplets in whole cells and in the isolated fraction were shown in Figure
8.4. The morphology of the LDs remained similar to the LDs in whole cells after the isolation.
24h treated
48h treated
0h control
48h control

123
Figure 8.4 Nile red stained LDs in whole cell (a, c) and in isolated fractions (b, d) of DAOY
(a, b) and PFSK-1 (c, d). The size bars represent 5µm.
8.3.4 NMR Lipid signal
Lipid signal intensities in 1H HR-MAS spectra of DAOY and PFSK-1 cells, as a function of
cisplatin exposure times, are shown in Figure 8.5. The spectra were normalized to the height of
macromolecule peak at 1.68ppm for display. In DAOY cells, the lipid signal at 0.9, 1.3, 2.8
and 5.4ppm starts to rise with 24 hours of treatment and continues to rise with further treatment
and at 48h the lipid resonance was predominant in the spectra with few visible metabolites. An
increase in peaks from unsaturated lipids (2.8 and 5.4ppm) is evident. There is no obvious
increase in the lipid peaks from the spectra of cisplatin exposed or untreated PFSK-1 cells. The
lipid signal remained similar in all spectra of control cells (Figure 8.6).
c
a
d
b

124
Figure 8.5 HR-MAS spectra from whole cell pellets of DAOY (A) and PFSK-1 (B) with and
without cisplatin exposure. The assignment for peaks labelled with numbers are as
follows:1–CH3 at 0.9ppm, 2–(CH2) –at 1.3ppm, 3–CH2–CH2–C=O at 1.58ppm, 4 –CH2–
CH= at 2.02ppm, 5–CH2–CH2–C=O at 2.2ppm, 6 =CH–CH2–CH= at 2.8ppm‚ 7 –CH=CH–
at 5.4ppm.

125
Chemical shift
Figure 8.6 HR-MAS spectra from whole cell pellets of control cells: DAOY (A) and PFSK-1
(B). The assignment for peaks labelled with numbers is as follows: 1–CH3 at 0.9ppm, 2–
(CH2) –at 1.3ppm.
The lipid signal intensity measured with R was plotted in Figure 8.7. Lipid peaks at 0.9ppm,
1.3ppm, 2.8ppm and 5.4ppm were normalised to signal intensity from integration of the
1.68ppm macromolecule (MM) peak. The lipid signal was raised after 24h and 48h treatment
in treated DAOY cells. There is an increase in the ratios of CH2/CH3 and CH=/CH3 in treated
DAOY cells.
5 4 1ppm3 2
DAOY control
0h
24h
48h
PFSK-1 control
5 4 1ppm3 2
0h
24h
48h 12
12
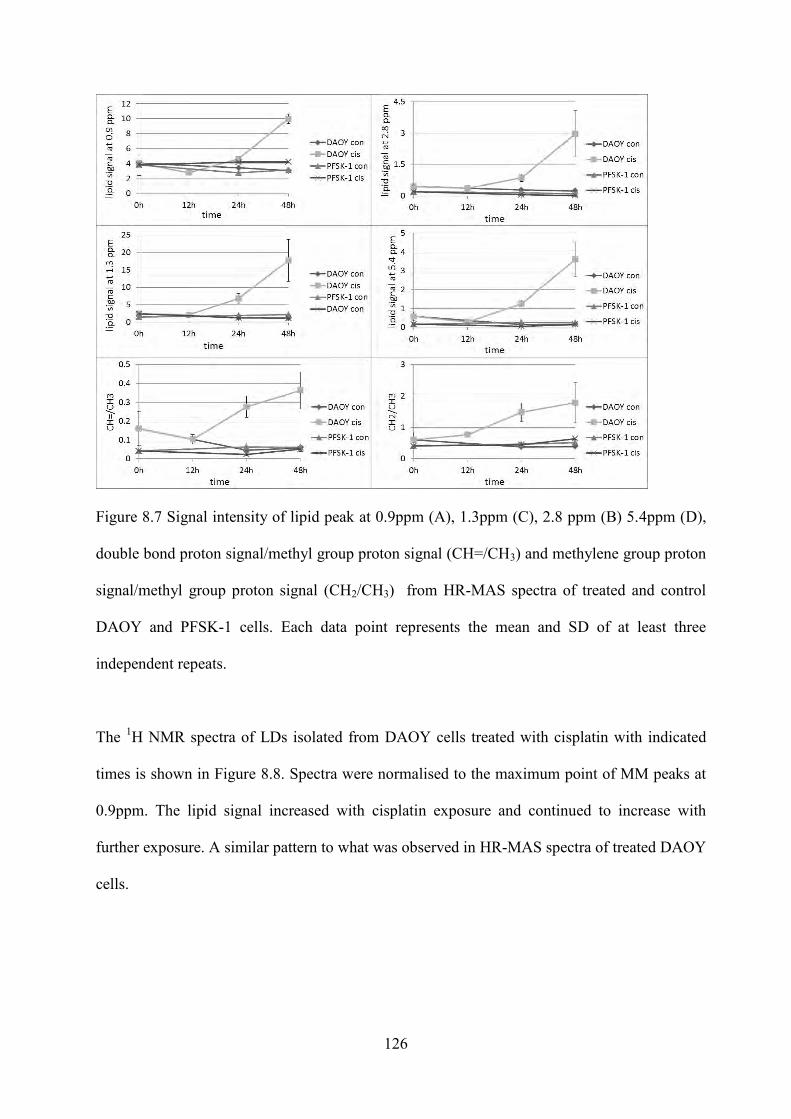
126
Figure 8.7 Signal intensity of lipid peak at 0.9ppm (A), 1.3ppm (C), 2.8 ppm (B) 5.4ppm (D),
double bond proton signal/methyl group proton signal (CH=/CH3) and methylene group proton
signal/methyl group proton signal (CH2/CH3) from HR-MAS spectra of treated and control
DAOY and PFSK-1 cells. Each data point represents the mean and SD of at least three
independent repeats.
The 1H NMR spectra of LDs isolated from DAOY cells treated with cisplatin with indicated
times is shown in Figure 8.8. Spectra were normalised to the maximum point of MM peaks at
0.9ppm. The lipid signal increased with cisplatin exposure and continued to increase with
further exposure. A similar pattern to what was observed in HR-MAS spectra of treated DAOY
cells.

127
Figure 8.8 Liquid-state 1H NMR spectrum from the isolated fraction of cisplatin exposed
DAOY cells. Spectra were normalised to the maximum point of MM peak at 0.9ppm.
Structural assignments are made as following:: 1 CH3 at 0.9ppm, 2 CH2 at 1.3ppm, 3
CH2CH2CO at 1.58ppm , 4 CH2CH=CH at 2.02ppm, 5 CH2COOH at 2.2ppm, 6
=CHCH2CH= at 2.8ppm.
The 1H NMR spectra of lipid extracts from isolated LDs and whole cells untreated or cisplatin-
treated with the indicated time is shown in Figure 8.9 and Figure 8.10. The spectra were
manually phased, referenced to TMS at 0ppm and normalised to the height of the methyl peak
at 0.9ppm for dispaly. The regions around 5.4, 3.4 and 1.3ppm were expanded to show the
variation of the signals from the protons in CH=, N (CH3)3 and CH2 groups. The CH2 signal
raised from unsaturated fatty acids was pointed by black arrows.
1 2
3 4 5 6
0h
12h
24h
48h
2.5 2.0 1.5 1.0 Chemical shift (ppm)

128
Figure 8.9 1H NMR spectra of lipid extracts from LDs of DAOY cells exposed to cisplatin
with indicated times. whole spectrum (A) and the expansion for peaks at 1.3ppm (B), 3.4ppm
(C) and 5.4ppm (D). Arrows show the increased signal of methylene groups from unsaturated
lipids.
24h
48h
5 4 3 2 1ppm
0h A
B C D
Chemical shift (ppm)
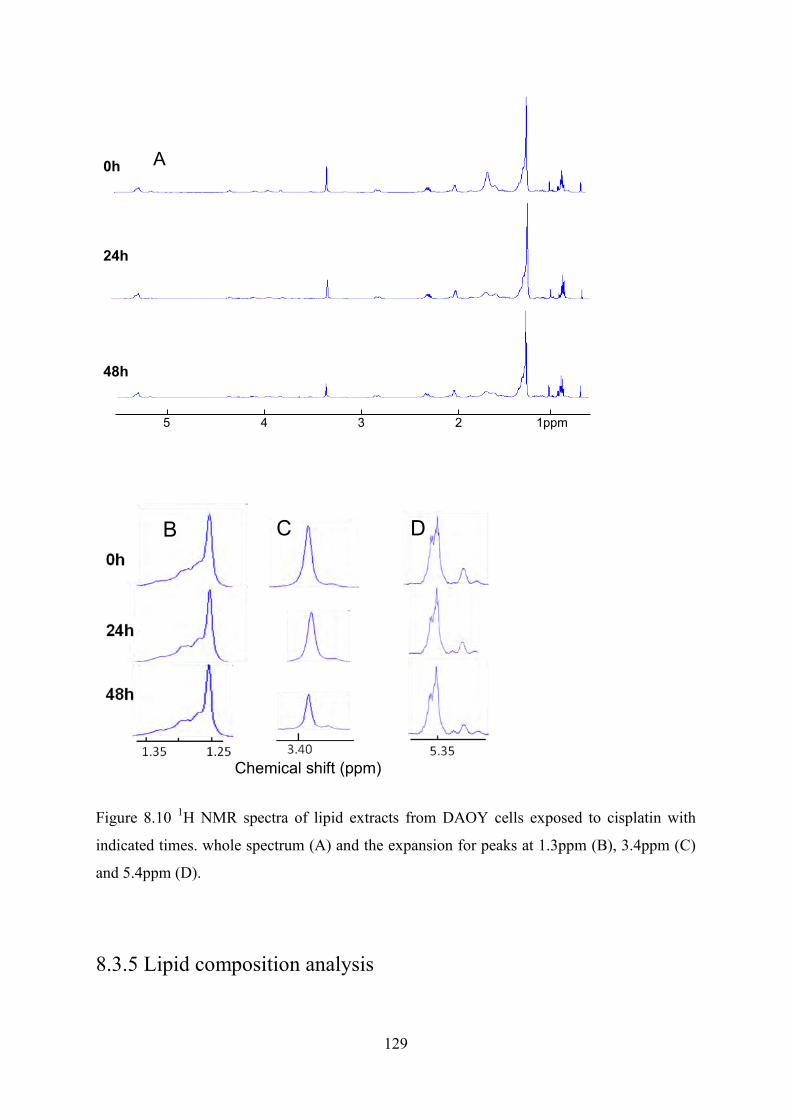
129
Figure 8.10 1H NMR spectra of lipid extracts from DAOY cells exposed to cisplatin with
indicated times. whole spectrum (A) and the expansion for peaks at 1.3ppm (B), 3.4ppm (C)
and 5.4ppm (D).
8.3.5 Lipid composition analysis
24h
48h
0h
5 4 3 2 1ppm
A
B C D
Chemical shift (ppm)
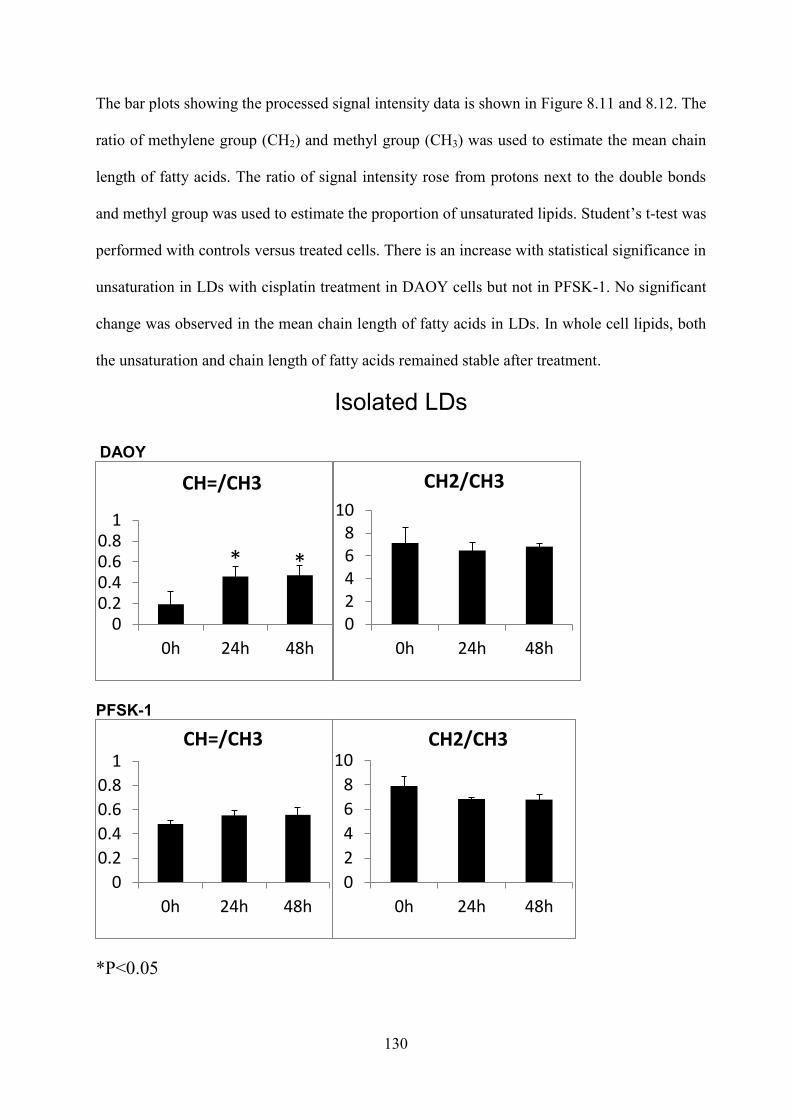
130
The bar plots showing the processed signal intensity data is shown in Figure 8.11 and 8.12. The
ratio of methylene group (CH2) and methyl group (CH3) was used to estimate the mean chain
length of fatty acids. The ratio of signal intensity rose from protons next to the double bonds
and methyl group was used to estimate the proportion of unsaturated lipids. Student’s t-test was
performed with controls versus treated cells. There is an increase with statistical significance in
unsaturation in LDs with cisplatin treatment in DAOY cells but not in PFSK-1. No significant
change was observed in the mean chain length of fatty acids in LDs. In whole cell lipids, both
the unsaturation and chain length of fatty acids remained stable after treatment.
Isolated LDs
DAOY
PFSK-1
*P<0.05
00.20.40.60.8
1
0h 24h 48h
CH=/CH3
* *
02468
10
0h 24h 48h
CH2/CH3
0
0.2
0.4
0.6
0.8
1
0h 24h 48h
CH=/CH3
0
2
4
6
8
10
0h 24h 48h
CH2/CH3

131
Figure 8.11 The ratio of signal intensity of different lipid groups from the lipids extracted
from isolated LDs of DAOY and PFSK-1 cells with and without cisplatin exposure. The error
bars represent standard deviation.
Whole cell
DAOY
PFSK-1
Figure 8.12 The ratio of signal intensity of different lipid groups from the lipids extracted
from DAOY and PFSK-1 cells with and without cisplatin exposure. The error bars represent
standard deviation.
8.3.6 HSQC
0
2
4
6
8
10
0h 24h 48h
CH2/CH3
0
0.2
0.4
0.6
0.8
1
0h 24h 48h
CH=/CH3
02468
10
0h 24h 48h
CH2/CH3
00.20.40.60.8
1
0h 24h 48h
CH=/CH3
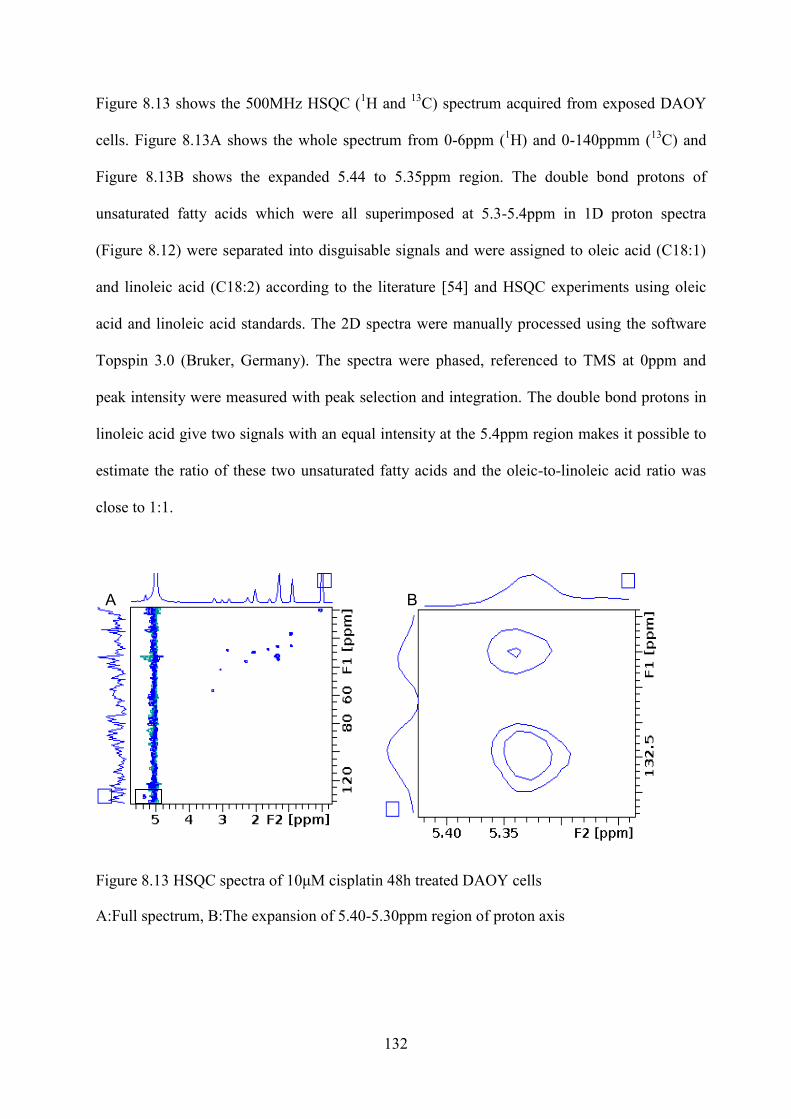
132
Figure 8.13 shows the 500MHz HSQC (1H and 13C) spectrum acquired from exposed DAOY
cells. Figure 8.13A shows the whole spectrum from 0-6ppm (1H) and 0-140ppmm (13C) and
Figure 8.13B shows the expanded 5.44 to 5.35ppm region. The double bond protons of
unsaturated fatty acids which were all superimposed at 5.3-5.4ppm in 1D proton spectra
(Figure 8.12) were separated into disguisable signals and were assigned to oleic acid (C18:1)
and linoleic acid (C18:2) according to the literature [54] and HSQC experiments using oleic
acid and linoleic acid standards. The 2D spectra were manually processed using the software
Topspin 3.0 (Bruker, Germany). The spectra were phased, referenced to TMS at 0ppm and
peak intensity were measured with peak selection and integration. The double bond protons in
linoleic acid give two signals with an equal intensity at the 5.4ppm region makes it possible to
estimate the ratio of these two unsaturated fatty acids and the oleic-to-linoleic acid ratio was
close to 1:1.
Figure 8.13 HSQC spectra of 10μM cisplatin 48h treated DAOY cells
A:Full spectrum, B:The expansion of 5.40-5.30ppm region of proton axis
A B
133
8.4 Discussion
8.4.1 Cell death and LD accumulation
LD accumulation was a common feature frequently observed in tumour cells [193] and tissues
[37] undergoing apoptosis and necrosis. LDs were proposed to be actively involved in
important cellular processes including cell death [153]. DAOY and PFSK-1 are both primitive
neuroectodermal tumour cells with a similar appearance of LDs without treatment. Most of
their diameters of LDs are less than 0.5µm (Figure 8.2). DAOY underwent apoptosis (Figure
8.2) while PFSK-1 could still becomeover-confluent with intact nuclei (Figure 8.3) after 10µM
cisplatin exposure. LDs in apoptotic DAOY can accumulate to 1.5µm after 48h treatment
while no obvious increase in LD size was observed in PFSK-1 cells suggesting that it is
possible to use LD accumulation as an indicator for cancer cell death.
8.4.2 1H NMR of isolated LDs from treated DAOY cells
An early study suggested that the increased lipid signal in cell death was possibly originated
from the apoptotic cell membrane due to the increased membrane fluidity[80]. However, the
hypothesis was questioned by the anisotropic motion of fatty acid chains located in a
membrane bilayer. More recent evidence showed these lipid signals are associated with the
presence of cytoplasmic lipid droplets [68] and most likely originated from a non-membrane
source of lipid [38]. An increase in NMR visible lipids [71] and LDs [141] has been shown in
cancer cells undergoing apoptosis after treated with chemotherapeutic drugs. In this study,
DAOY cells with varied size of LDs induced by cisplatin treatment were assessed. The NMR
lipid signal rose with the accumulation of LDs, which supports the contention that the lipid
signal in cell death is due to the accumulated lipids in LDs.

134
8.4.3 Lipid composition analysis
Phosphatidylcholine (PC) is predominant in phospholipids in mammals and also the main
component of cell membrane in brain tumour cells. The proton signal from –N(CH3)3 moiety
around 3.3ppm is mainly raised from PC according to literature [157] and spiking experiment
with standard PC sample (P3556, sigma, UK). A decrease of choline-containing lipid was
observed in both whole cell and LD lipids indicate a reduced level of PC possibly due to the
cisplatin exposure. Less phospholipid was detected after cisplatin exposure and the relative
decrease is possibly due to a smaller surface to volume ratio of bigger LDs with neutral lipids
accumulated into their core.
From the lipid signal intensity analysis (Figure 8.12), the mean chain length of fatty acid
estimated with the ratio of –CH2 group over –CH3 showed no obvious change in both whole
cell and LD lipid after cisplatin exposure except for a slight decrease in LD lipids of 24h
treated DAOY cells. This observation suggests the length of fatty acid probably remained
stable in viable and dying cells.
The unsaturation of fatty acid estimated with the ratio of CH= to CH3 is significantly
increased in LDs of apoptotic DAOY cells (Figure 8.11) but not whole cell lipids indicating a
unique role for lipids of LDs in cell death that is different to membrane lipids. The
accumulation of mono-unsaturated fatty acids occurred in LDs isolated from apoptotic
DAOY cells but not in the non-responding PFSK-1 (Figure 8.11) suggests the accumulation
is closely associated with cell kill and could be utilized as a promising indicator and a
potential target for effective therapy. Fatty acids accumulation in cell proliferation [194] and
apoptosis [80] was reported in previous studies. Our result further confirms that the
accumulation of fatty acids induced by effective drug treatment occurs in cytoplasmic LDs
and some of these accumulated fatty acids are unsaturated.

135
In spectra of drug-exposed DAOY cells, the PUFA signal of the peak at 2.8ppm started to rise
up in 24h and continue to rise with further treatment and the same increase was reported in a
study of gliomas under gene-therapy [38]. PUFAs are thought to be naturally occurring anti-
cancer agents. In human glioma, PUFA may stimulate tumour regression and apoptosis and has
been introduced to cancer therapy [195, 196]. It is not known yet whether any of these lipid-
based approaches to cancer therapy will show selectivity for malignant cells. But
polyunsaturated fatty acid supplementation may make certain forms of cancer treatment more
effective [28]. Enrichment with polyunsaturated fatty acids makes cancer cells more
susceptible to lipid peroxidation and increase lipid radical formation in response to oxidant
stress and photodynamic therapy and more sensitive to drug treatment. In addition, the immune
response in cancer can be improved by manipulating the lipid levels in dendritic cells [13].
Therefore, these accumulated PUFAs after cisplatin exposure could be either simply an end
product of cell collapse or functional lipid mediators actively involved in cell death pathway.
There is hardly any PUFA signal presented in isolated LDs (Figure 8.8) and their lipid
extracts (Figure 8.9). The predominant unsaturated fatty acids accumulated in LDs of
apoptotic DAOY cells are mono-unsaturated. The absence of PUFA signal is most likely due
to the difficulty to extract them into a sufficient amount for detection.
The current results from HR-MAS indicate an increase in fatty acid chain length estimated
from CH2 to CH3 ratio in agreement with several recent studies [81, 197]. In DAOY cells the
CH2 to CH3 ratio is 3 fold greater at 48 hour of cisplatin exposure than before it. Unexpectedly,
the respective ratio determined in extracts of LDs from the same cells does not change, an
observation pointing to different origin of lipid species determined by NMR. There is no
136
obvious explanation for this discrepancy in our data, however, it should be borne in mind that
in cell preparations non-lipid macromolecules contribute to both aliphatic peaks [175].
Furthermore, it is possible that some UFAs, especially PUFAs with long aliphatic chain fatty
acids, were lost in the extraction procedure.
HSQC spectroscopy identified oleic acid and linoleic acid as the two major UFAs
accumulating during cisplatin-induced cell death in DAOY cells (Figure 8.13). The increase of
unsaturated lipid peaks in isolated LD spectra (Figure 8.8) suggests these fatty acids are likely
to be located in cytoplasmic LDs.
8.5 Conclusion
The increase in 1H NMR detected lipids in cisplatin exposed DAOY cells was associated
with the accumulation of LDs and occurred before DNA fragmentation. Isolation and
extraction of LDs shows that there is an increase in unsaturated fatty acids in these LDs
during drug treatment. A more detailed understanding of the changes in LD architecture can
be obtained by isolating the LDs from cells furthering our understanding of the role of lipids
in cell stress and death and identifying them as a potentially important NMR-detectable
target for novel therapy.

137
Chapter 9 An in vitro metabonomic
study detects increase UDP-GlcNAc
and UDP-GalNAc in early phase of
cisplatin treatment in brain tumour
cells

138
9.1 Introduction
O-linked β-N-acetylglucosamine glycosylation (O-GlcNAcylation) is the post-translational
glycosylation of proteins with O-linked β-N-acetylglucosamine (O-GlcNAc) [198], with
around one thousand such modified proteins being identified to date[199, 200]. O-
GlcNAcylation has been shown to be important in a number of biological processes and
diseases including cell stress [201], transcription [202], diabetes [203] and neurodegeneration
[204]. However, few studies have investigated the role of O-GlcNAcylation in cancer
progression and treatment, but a recent report demonstrates an increase in O-GlcNAcylation
in breast tumour metastasis compared with their primary tissues, suggesting that O-
GlcNAcylation may be a potential target for therapeutic agents [205].
The biosynthesis of O-GlcNAc begins with intracellular glucose, with 2-5% entering the
hexosamine biosynthesis pathway (HBP, Figure 9.1). The direct donor of O-GlcNAc is
UDP-N-acetylglucosamine (UDP-GlcNAc) [206]. Recently the detection of molecules in the
HBP by 1H magnetic resonance spectroscopy (1H NMR), including UDP-GlcNAc and
Uridine diphospho-N-acetylgalactosamine (UDP-GalNAc) has been demonstrated from liver
tissues [207] and intact tumour cells. In addition to UDP-GlcNAc, 1H NMR can detect a
number of metabolites which have been shown to change in response to cell growth arrest
[69] or early events of cell death [208] making this a promising technique for monitoring
cancer cell treatment.
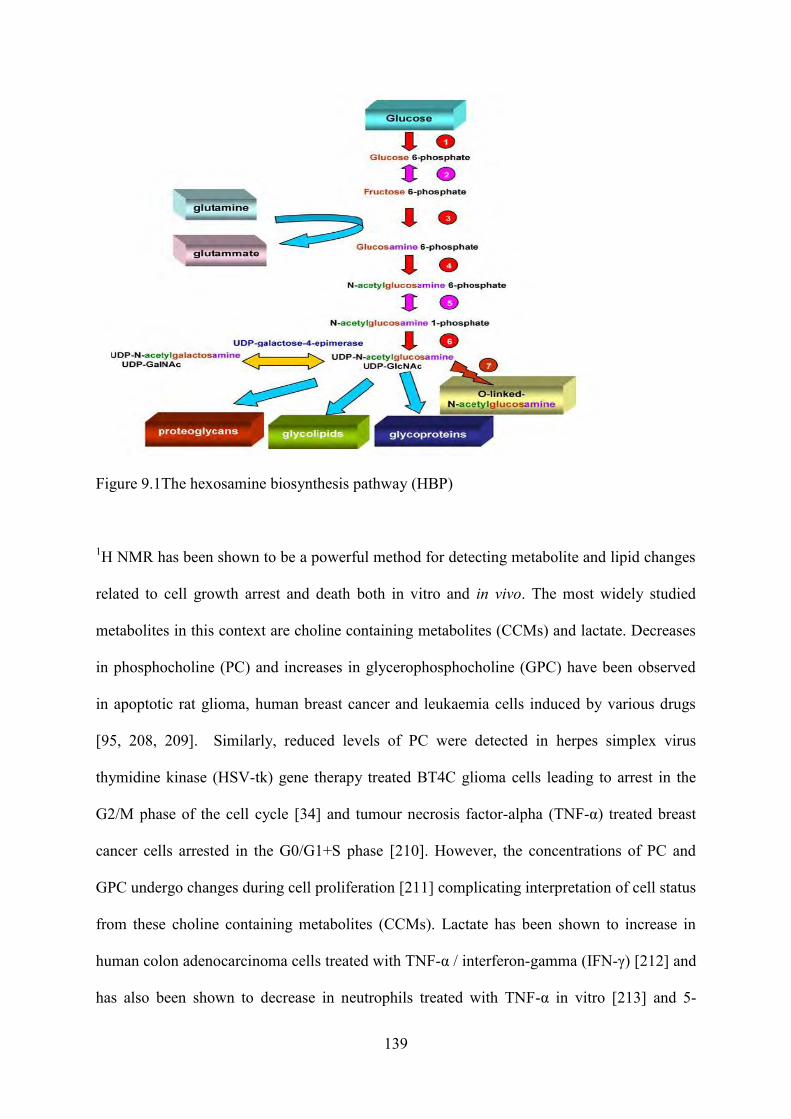
139
Figure 9.1The hexosamine biosynthesis pathway (HBP)
1H NMR has been shown to be a powerful method for detecting metabolite and lipid changes
related to cell growth arrest and death both in vitro and in vivo. The most widely studied
metabolites in this context are choline containing metabolites (CCMs) and lactate. Decreases
in phosphocholine (PC) and increases in glycerophosphocholine (GPC) have been observed
in apoptotic rat glioma, human breast cancer and leukaemia cells induced by various drugs
[95, 208, 209]. Similarly, reduced levels of PC were detected in herpes simplex virus
thymidine kinase (HSV-tk) gene therapy treated BT4C glioma cells leading to arrest in the
G2/M phase of the cell cycle [34] and tumour necrosis factor-alpha (TNF-α) treated breast
cancer cells arrested in the G0/G1+S phase [210]. However, the concentrations of PC and
GPC undergo changes during cell proliferation [211] complicating interpretation of cell status
from these choline containing metabolites (CCMs). Lactate has been shown to increase in
human colon adenocarcinoma cells treated with TNF-α / interferon-gamma (IFN-γ) [212] and
has also been shown to decrease in neutrophils treated with TNF-α in vitro [213] and 5-
140
fluorouracil treated fibrosarcoma in vivo [214]. These observations reflect the involvement of
glycolysis, and hence the production of lactate, for the production of adenosine triphosphate
(ATP) in cells with a high proliferative capability as well as during the cell death process. In
addition to CCM and lactate, a number of 1H NMR detectable metabolites such as taurine,
glycine, alanine, succinate and glutamate have been observed to undergo changes in cisplatin
treated apoptotic BT4C cells [69]. Therefore, a number of endogenous metabolites may have
potential for treatment monitoring by 1H NMR.
Particular attention has also been paid to 1H NMR detected lipids as imaging biomarkers for
cancer treatment response. 1H NMR-observable lipids are often prominent in malignant
tumours, in some cases reflecting hypoxia [154]. In addition, in response to cytotoxic
treatment, both saturated and unsaturated lipids have been shown to increase in responding
tumours [34, 38, 141]. Accumulation of 1H NMR visible lipids has been demonstrated in
apoptotic cells [80, 191] and tumours in vivo [38] and has been correlated with the increase in
cytoplasmic lipid droplets [50, 59].
In the present study we have examined 1H NMR metabolite profiles of two glioma cell lines
and two neural tumour cell lines, with differing sensitivities to cisplatin. Cell survival and
death was assessed with Alamar Blue assay[215] and DAPI-staining[216]. We show that in
the responding cells, UDP-GlcNAc and UDP-GalNAc, in parallel with 1H NMR detected
lipids, increase with cisplatin exposure before or at the onset of the microscopic signs of
evolving cell death. To the authors’ knowledge, this study is the first to report the
concentration of UDP-N-acetylglucosamine in intact tumour cells exposed to a
chemotherapeutic agent.

141
9.2 Methods
BT4C, rat glioblastoma, U87-MG, human glioblastoma, DAOY, human medulloblastoma
and PFSK-1, human supratentorial primitive neuroectodermal tumour (ST-PNET) cell lines
were maintained in 15 ml DMEM with or without cisplatin exposure (chapter4.1).
Metabolite extraction was performed on all four cell lines with and without cisplatin exposure
for assignment purposes. A dual phase methanol-chloroform extraction protocol was used to
extract cell metabolites for 1H NMR. The upper water phase was collected and dried in a
vacuum centrifuge at room temperature.
HR-MAS was performed with Varian 600-MHz spectrometer to measure the alteration of
UDP-GlcNAc and UDP-GlaNAc with treatment. At least three independent preparations
were assessed for each time point of each cell line.
Statistical total correlation spectroscopy (STOCSY)[217] has been used to generate a pseudo-
two-dimensional NMR spectrum that displays the correlation among the intensities of the
various peaks across the whole sample.
Dried metabolite extracts were resuspended in 600µl D2O containing 5µl 10mM TMS.
10mM UDP-GlcNAc and UDP-GalNAc (Sigma Aldrich, Dorset, UK) solution was made
with D2O and the pH was adjusted to 7.0 with 0.01M hydrochloric acid and 0.01M sodium
hydroxide. 10µl of the compound solution was added into cell extracts for spiking
experiments. 1H NMR spectra of cell extracts were recorded on a Varian 600-MHz
spectrometer.
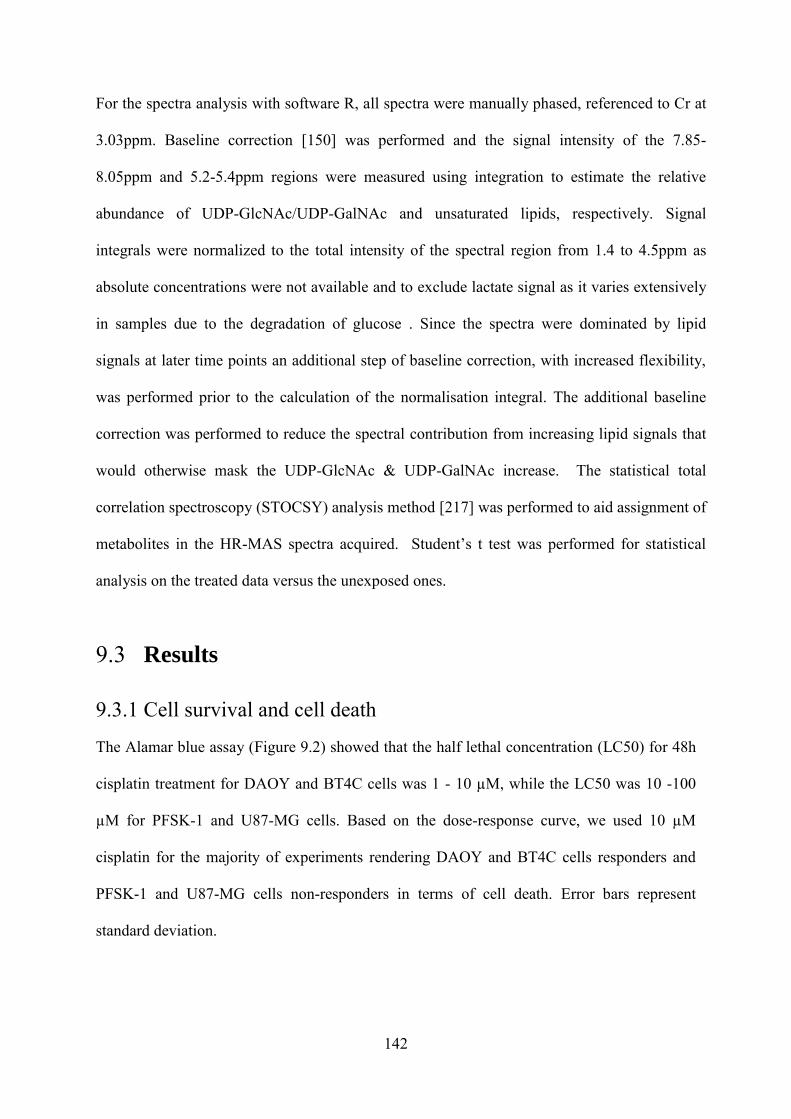
142
For the spectra analysis with software R, all spectra were manually phased, referenced to Cr at
3.03ppm. Baseline correction [150] was performed and the signal intensity of the 7.85-
8.05ppm and 5.2-5.4ppm regions were measured using integration to estimate the relative
abundance of UDP-GlcNAc/UDP-GalNAc and unsaturated lipids, respectively. Signal
integrals were normalized to the total intensity of the spectral region from 1.4 to 4.5ppm as
absolute concentrations were not available and to exclude lactate signal as it varies extensively
in samples due to the degradation of glucose . Since the spectra were dominated by lipid
signals at later time points an additional step of baseline correction, with increased flexibility,
was performed prior to the calculation of the normalisation integral. The additional baseline
correction was performed to reduce the spectral contribution from increasing lipid signals that
would otherwise mask the UDP-GlcNAc & UDP-GalNAc increase. The statistical total
correlation spectroscopy (STOCSY) analysis method [217] was performed to aid assignment of
metabolites in the HR-MAS spectra acquired. Student’s t test was performed for statistical
analysis on the treated data versus the unexposed ones.
9.3 Results
9.3.1 Cell survival and cell death
The Alamar blue assay (Figure 9.2) showed that the half lethal concentration (LC50) for 48h
cisplatin treatment for DAOY and BT4C cells was 1 - 10 µM, while the LC50 was 10 -100
µM for PFSK-1 and U87-MG cells. Based on the dose-response curve, we used 10 µM
cisplatin for the majority of experiments rendering DAOY and BT4C cells responders and
PFSK-1 and U87-MG cells non-responders in terms of cell death. Error bars represent
standard deviation.
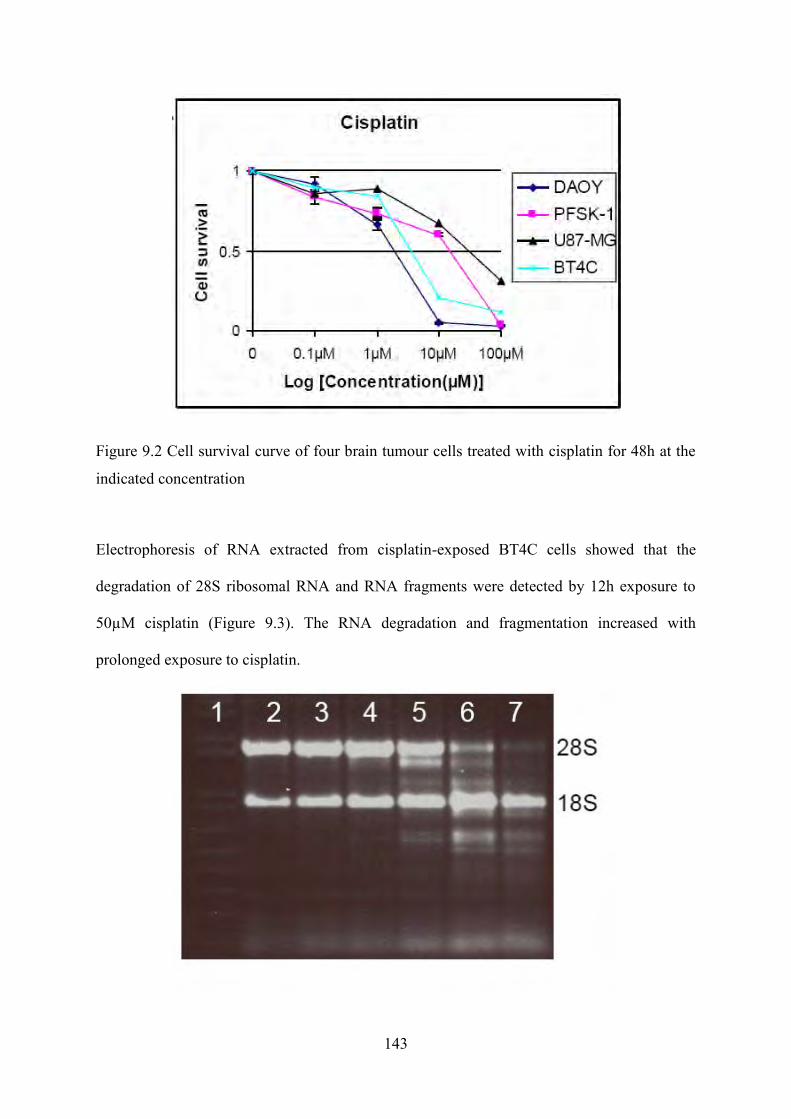
143
Figure 9.2 Cell survival curve of four brain tumour cells treated with cisplatin for 48h at the
indicated concentration
Electrophoresis of RNA extracted from cisplatin-exposed BT4C cells showed that the
degradation of 28S ribosomal RNA and RNA fragments were detected by 12h exposure to
50µM cisplatin (Figure 9.3). The RNA degradation and fragmentation increased with
prolonged exposure to cisplatin.

144
Figure 9.3 total-RNA of 50 µM cisplatin treated BT4C cells 1:1kb Plus DNA Ladder, 2: 0h,
3-7: 3h, 6h, 12h, 24h and 48h exposed cells.
Nuclei of neural tumour cells (DAOY, PFSK-1) were larger than those in glioma cells (BT4C
and U87-MG) prior to cisplatin treatment (Figure 9.4). Interestingly, morphological changes
of nuclei in responders of each cell group were much different. Nuclear fragmentation was
detected in DAPI stained DAOY cells by 24h of treatment while nuclei in PFSK-1 cells
remained intact until 48h of treatment. In BT4C cells nuclear condensation and/or swelling
was evident by 48h exposure to 10µM-cisplatin while nuclei in U87-MG cells remained
unchanged. DAOY and BT4C showed evidence for apoptosis in response to cisplatin, but
PFSK-1 and U87-MG did not.

145
Figure 9.4 DAPI-stained cell nuclei with 10µM cisplatin treatment of DAOY(a), BT4C(b),
PFSK-1(c) and U87-MG(d) at the following exposure time: 0h (i), 24h (ii) and 48h (iii). The
size bar represents 10µm.
9.3.2 HR-MAS peak assignment
The peaks at 7.98, 5.98, 5.5 and 2.09ppm were tentatively assigned to UDP-GlcNAc and
UDP-GalNAc according to the literature [207, 218]. The assignment was confirmed by
spiking cell extracts (Figure 9.5) both with pure UDP-GlcNAc and UDP-GalNAc and
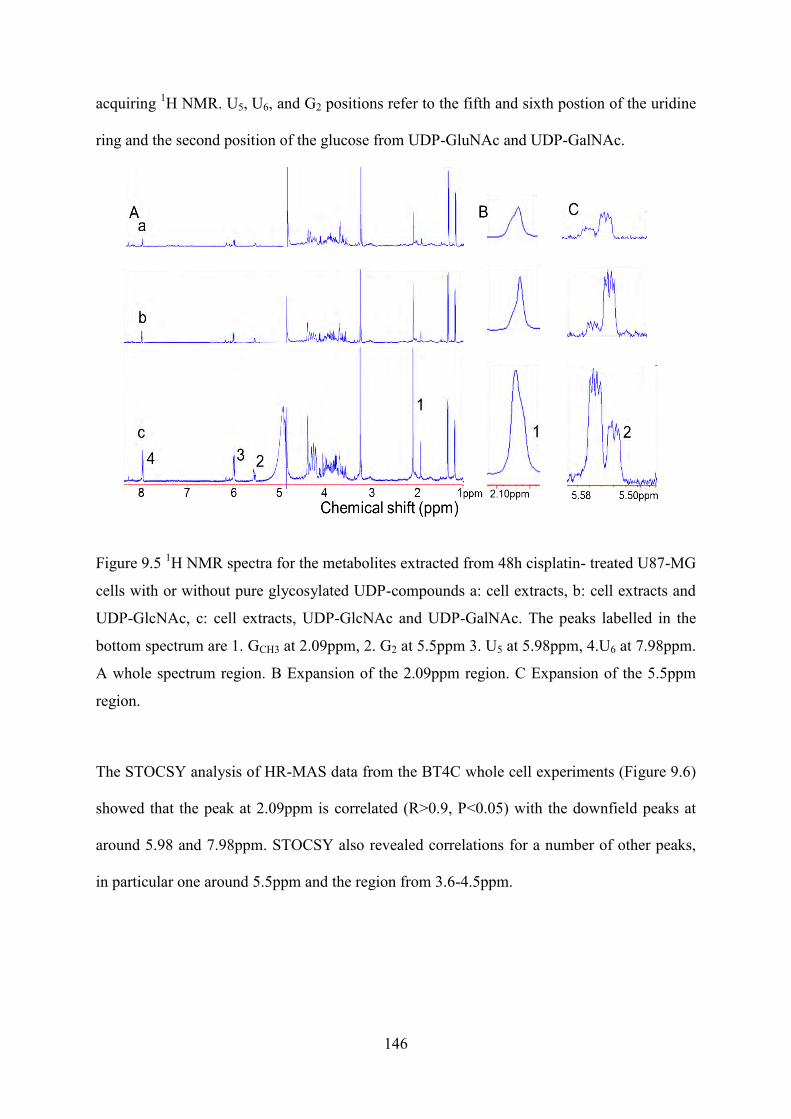
146
acquiring 1H NMR. U5, U6, and G2 positions refer to the fifth and sixth postion of the uridine
ring and the second position of the glucose from UDP-GluNAc and UDP-GalNAc.
Figure 9.5 1H NMR spectra for the metabolites extracted from 48h cisplatin- treated U87-MG
cells with or without pure glycosylated UDP-compounds a: cell extracts, b: cell extracts and
UDP-GlcNAc, c: cell extracts, UDP-GlcNAc and UDP-GalNAc. The peaks labelled in the
bottom spectrum are 1. GCH3 at 2.09ppm, 2. G2 at 5.5ppm 3. U5 at 5.98ppm, 4.U6 at 7.98ppm.
A whole spectrum region. B Expansion of the 2.09ppm region. C Expansion of the 5.5ppm
region.
The STOCSY analysis of HR-MAS data from the BT4C whole cell experiments (Figure 9.6)
showed that the peak at 2.09ppm is correlated (R>0.9, P<0.05) with the downfield peaks at
around 5.98 and 7.98ppm. STOCSY also revealed correlations for a number of other peaks,
in particular one around 5.5ppm and the region from 3.6-4.5ppm.

147
Figure 9.6 STOCSY analysis of all HR-MAS spectra acquired from BT4C cells. Peaks
represent highly correlated spectral regions (the circled points).
The TOCSY spectra of cell extracts and pure UDP-GlcNAc+UDP-GalNAc confirmed the J-
coupling between 7.98ppm with 5.98ppm, 5.5ppm and the signals in 4.5ppm region
(highlighted with rectangles in Figure 9.7). These analytic results are in good agreement with
the 1H NMR spectra of pure UDP-GlcNAc and UDP-GalNAc.
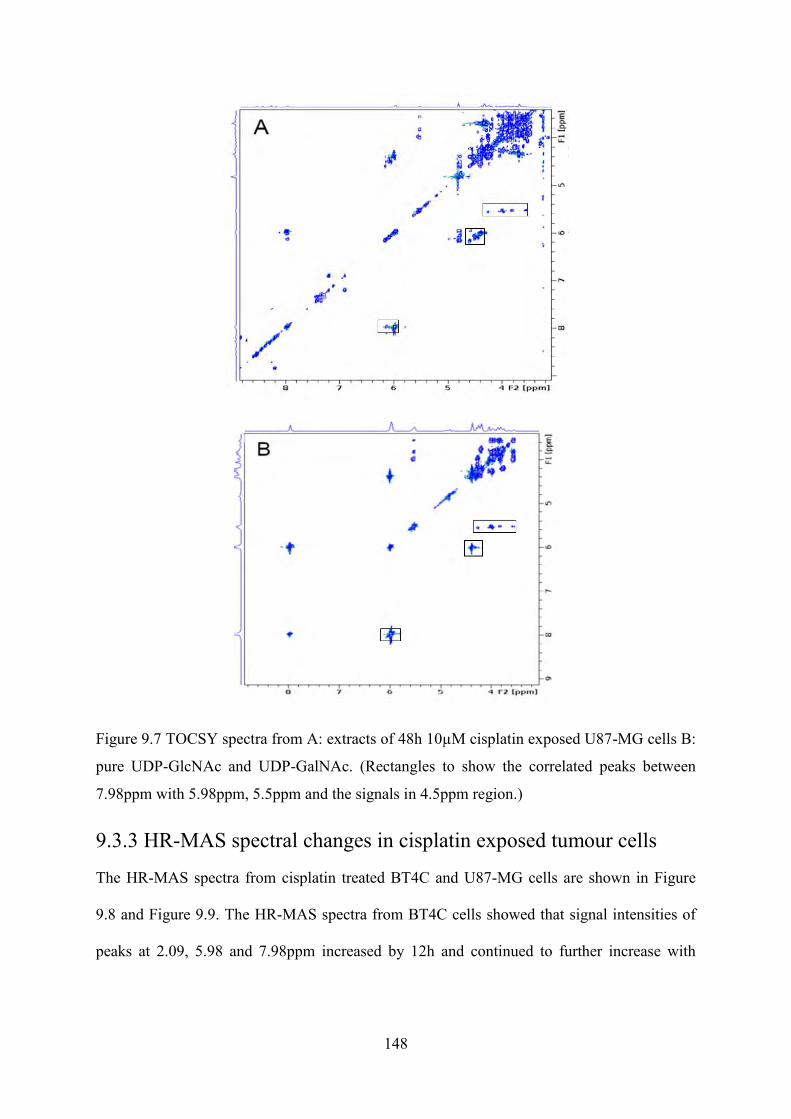
148
Figure 9.7 TOCSY spectra from A: extracts of 48h 10µM cisplatin exposed U87-MG cells B:
pure UDP-GlcNAc and UDP-GalNAc. (Rectangles to show the correlated peaks between
7.98ppm with 5.98ppm, 5.5ppm and the signals in 4.5ppm region.)
9.3.3 HR-MAS spectral changes in cisplatin exposed tumour cells
The HR-MAS spectra from cisplatin treated BT4C and U87-MG cells are shown in Figure
9.8 and Figure 9.9. The HR-MAS spectra from BT4C cells showed that signal intensities of
peaks at 2.09, 5.98 and 7.98ppm increased by 12h and continued to further increase with

149
time. However, in non-responding U87-MG cells, the signals at 2.09, 5,5, 5.98 and 7.98ppm
peaks remained unchanged with cisplatin treatment.
Figure 9.8 HR-MAS spectra of a responder, 50 µM cisplatin treated BT4C cells. In the 0h spectra represent the peaks as follows 1,CH3 at 0.9ppm. 2,CH2 at 1.2ppm. 3,CH2CH2CO at 1.58ppm. 4,GCH3 at 2.09ppm. 5,=CHCH2CH= at 2.8ppm. 6,Creatine at 3.03ppm. 7,CH= at
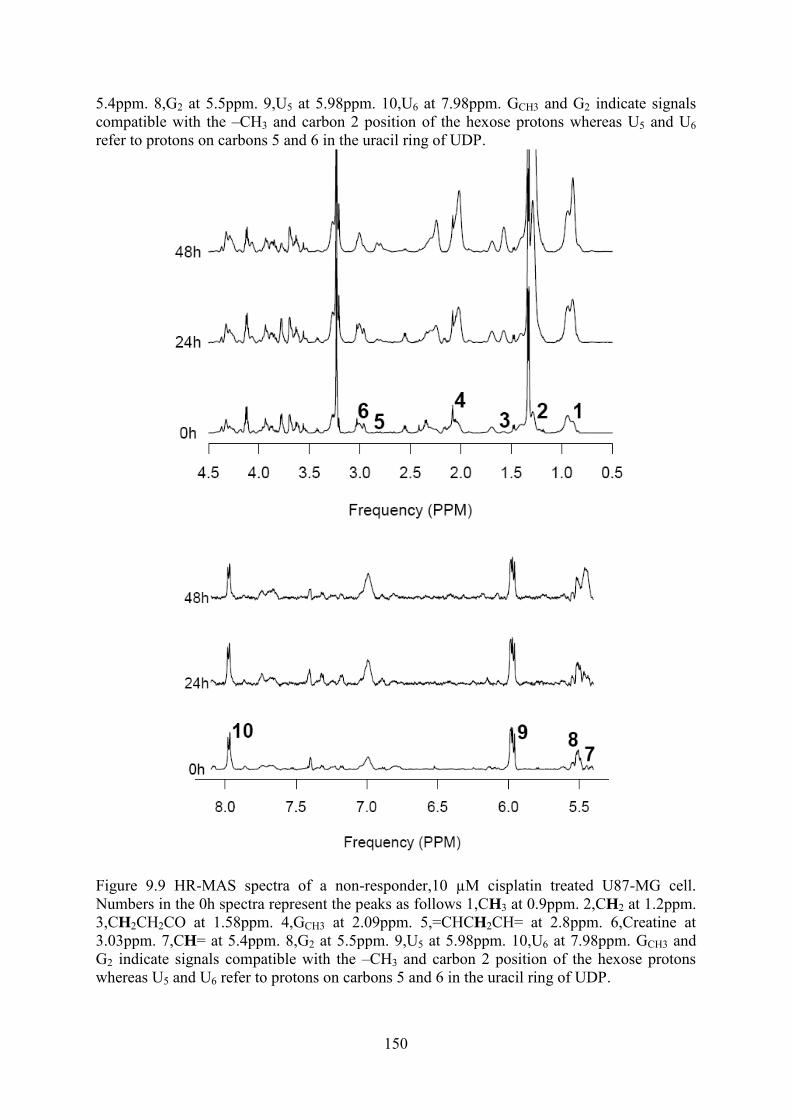
150
5.4ppm. 8,G2 at 5.5ppm. 9,U5 at 5.98ppm. 10,U6 at 7.98ppm. GCH3 and G2 indicate signals compatible with the –CH3 and carbon 2 position of the hexose protons whereas U5 and U6 refer to protons on carbons 5 and 6 in the uracil ring of UDP.
Figure 9.9 HR-MAS spectra of a non-responder,10 µM cisplatin treated U87-MG cell. Numbers in the 0h spectra represent the peaks as follows 1,CH3 at 0.9ppm. 2,CH2 at 1.2ppm. 3,CH2CH2CO at 1.58ppm. 4,GCH3 at 2.09ppm. 5,=CHCH2CH= at 2.8ppm. 6,Creatine at 3.03ppm. 7,CH= at 5.4ppm. 8,G2 at 5.5ppm. 9,U5 at 5.98ppm. 10,U6 at 7.98ppm. GCH3 and G2 indicate signals compatible with the –CH3 and carbon 2 position of the hexose protons whereas U5 and U6 refer to protons on carbons 5 and 6 in the uracil ring of UDP.
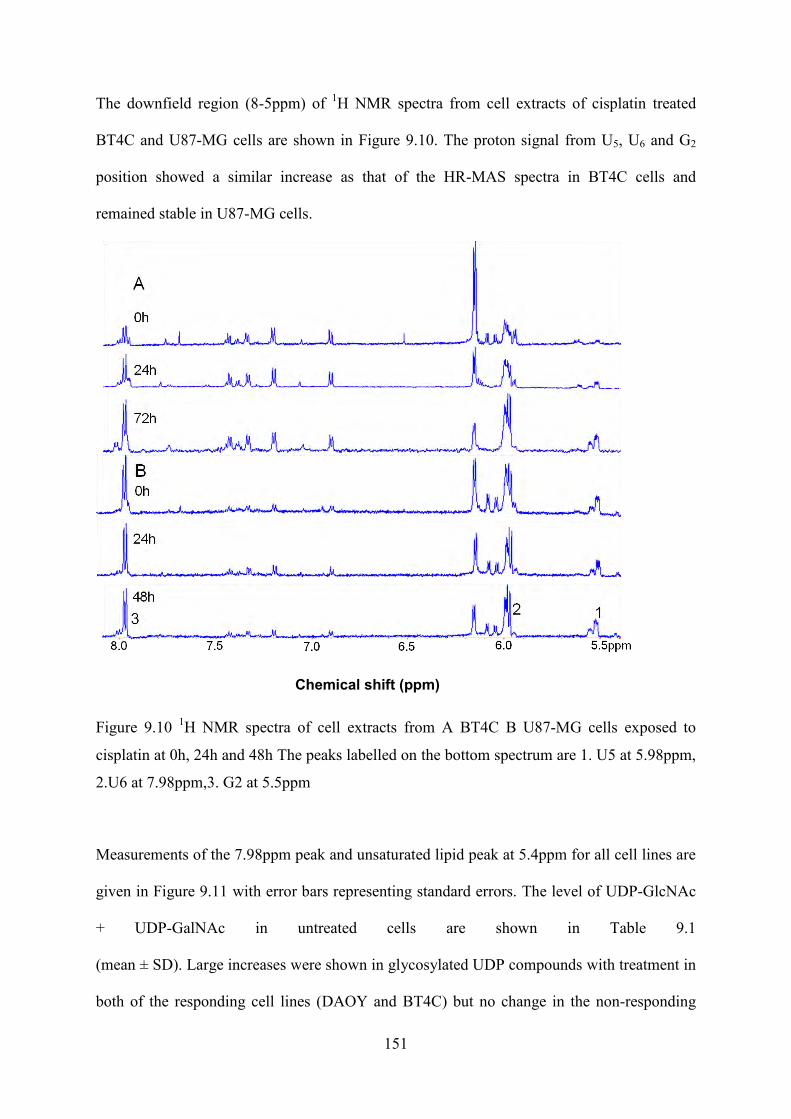
151
The downfield region (8-5ppm) of 1H NMR spectra from cell extracts of cisplatin treated
BT4C and U87-MG cells are shown in Figure 9.10. The proton signal from U5, U6 and G2
position showed a similar increase as that of the HR-MAS spectra in BT4C cells and
remained stable in U87-MG cells.
Chemical shift (ppm)
Figure 9.10 1H NMR spectra of cell extracts from A BT4C B U87-MG cells exposed to
cisplatin at 0h, 24h and 48h The peaks labelled on the bottom spectrum are 1. U5 at 5.98ppm,
2.U6 at 7.98ppm,3. G2 at 5.5ppm
Measurements of the 7.98ppm peak and unsaturated lipid peak at 5.4ppm for all cell lines are
given in Figure 9.11 with error bars representing standard errors. The level of UDP-GlcNAc
+ UDP-GalNAc in untreated cells are shown in Table 9.1
(mean ± SD). Large increases were shown in glycosylated UDP compounds with treatment in
both of the responding cell lines (DAOY and BT4C) but no change in the non-responding

152
U87-MG and PFSK-1 cells (Figure 9.11). In BT4C cells, UDP-GlcNAc and UDP-GalNAc
started to increase by 12 hours of exposure and continued to increase with further exposure.
In DAOY cells, the concentrations of UDP-GlcNAc and UDP-GalNAc were the highest of
all four cell lines prior to treatment and the increase started to show a statistical difference
(Student’s t-test, p=0.03) by 24h exposure coinciding with the initiation of morphological
changes in the cell nuclei. Proton NMR-detected lipids at 5.4ppm increased extensively with
cisplatin treatment in both BT4C and DAOY cells up to 24h (Figure 9.11). There was a
smaller increase in 1H NMR detected lipids in U87-MG cells at 24h but PFSK-1 cells showed
no significant increase in lipids up to that time point. The lipids increased significantly in all
cell lines at 48h and in DAOY the HR-MAS spectra acquired at 48 hours were dominated by
lipid peaks with hardly any metabolite peaks visible.
Table 9.1 The level of UDP-GlcNAc + UDP-GalNAc in untreated cells
cell line DAOY PFSK-1 BT4C U87-MG
UDP-GluNAc+UDP-GalNAc 0.024 ± 0.005 0.012 ± 0.002 0.006 ± 0.001 0.021 ± 0.002

153
Figure 9.11 Measurement of HR-MAS spectra. A, the UDP-GlcNAc and UDP-GalNAc peak
at 7.98ppm. B, the lipid peak at 5.3ppm at 0h, 12h, 24h and 48h treatment with 10µM
cisplatin. The error bars represent standard errors. *P<0.05 **P<0.001
The HR-MAS spectra of treated and untreated BT4C cells were plotted in Figure 9.12 to show
there is no obvious increase in the over-confluence BT4C cells after 48h culture.
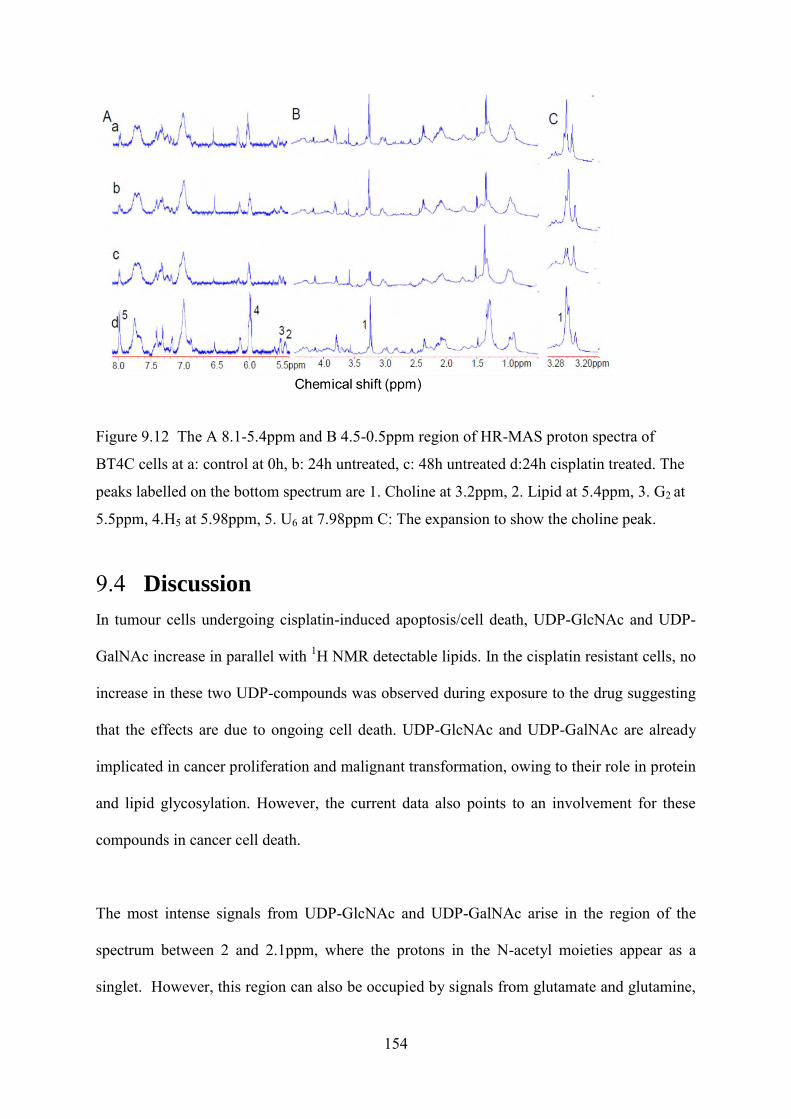
154
Figure 9.12 The A 8.1-5.4ppm and B 4.5-0.5ppm region of HR-MAS proton spectra of
BT4C cells at a: control at 0h, b: 24h untreated, c: 48h untreated d:24h cisplatin treated. The
peaks labelled on the bottom spectrum are 1. Choline at 3.2ppm, 2. Lipid at 5.4ppm, 3. G2 at
5.5ppm, 4.H5 at 5.98ppm, 5. U6 at 7.98ppm C: The expansion to show the choline peak.
9.4 Discussion
In tumour cells undergoing cisplatin-induced apoptosis/cell death, UDP-GlcNAc and UDP-
GalNAc increase in parallel with 1H NMR detectable lipids. In the cisplatin resistant cells, no
increase in these two UDP-compounds was observed during exposure to the drug suggesting
that the effects are due to ongoing cell death. UDP-GlcNAc and UDP-GalNAc are already
implicated in cancer proliferation and malignant transformation, owing to their role in protein
and lipid glycosylation. However, the current data also points to an involvement for these
compounds in cancer cell death.
The most intense signals from UDP-GlcNAc and UDP-GalNAc arise in the region of the
spectrum between 2 and 2.1ppm, where the protons in the N-acetyl moieties appear as a
singlet. However, this region can also be occupied by signals from glutamate and glutamine,

155
potentially making assignment ambiguous. To confirm the correct assignment of these
resonances two approaches were taken: firstly the aqueous fraction of cell extracts was spiked
with solutions of UDP-GlcNAc and UDP-GalNAc. Signals originating from these solutions
were found to be co-resonant with signals present in the extract spectra (Figure 9.5).
Secondly, a STOCSY analysis was performed using the HR-MAS spectra from BT4C.
Strong correlations were found between the primary resonances of UDP-GlcNAc and UDP-
GalNAc (Figure 9.6). These approaches confirm that the resonances at 2.09, 5.5, 5.98 and
7.98ppm originate from a combination of UDP-GlcNAc and UDP-GalNAc.
Although UDP-GlcNAc and UDP-GalNAc are stereo-isomers, it is still possible to
differentiate between them using 1D 1H NMR. From the aqueous extract data, sufficient
resolution was available to distinguish between UDP-GlcNAc and UDP-GalNAc based on
two well resolved resonances at 5.5ppm [207] and the 2.09ppm which had an asymmetric
appearance In all extract spectra where resonances at 2.09 ppm were visible, the peaks from
UDP-GlcNAc and UDP-GalNAc were estimated to be present at a similar ratio of 3:2.
UDP-GlcNAc and UDP-GalNAc are synthesised in the cell cytoplasm and are the end
products of the HBP. They are both important donor molecules for glycosylation reactions
taking place in the nucleus, cytoplasm, endoplasmic reticulum or in the Golgi complex [201,
219, 220]. Glycosylation is a crucial post-transcriptional modification for many functional
proteins, proteoglycans and lipids [199, 204] determining three dimensional structures of
these macromolecules. Diabetes, cardiac myopathy and severe injury from trauma are found
to be associated with transient or prolonged hyperglycemias leading to an increase of glucose
uptake in mammalian cells followed with a accelerated flux in the HBP and increased protein
O-glycosylation [201, 221]. This indicates the important role of UDP-GlcNAc and UDP-

156
GalNAc in cellular response to stressful conditions. Proteins involved in apoptotic pathways
such as ERK, PKC and Bcl-2 have been reported to have their activity or expression levels
altered in response to the increased O-GlcNAc formation [221].
UDP-GlcNAc and UDP-GalNAc have been reported to inhibit differentiation of human colon
cancer cells [222] and correlate with the degree of proliferation in malignant breast cells
[223]. The level of UDP-GlcNAc was found to be a critical factor in the production of β1,6-
branched oligosaccharides which have been thought to be closely associated with tumour
progression and metastasis [224]. In contrast, very little is known about UDP-GlcNAc and
UDP-GalNAc in the response of cancer cells to treatment. Our study is the first to indicate a
role for glycosylated UDPs in cancer cell death. There are some reports in the literature of O-
glycosylated compounds, but not directly with glycosylated UDPs. It has been shown in
colon cancer cells (HT29) that mitotic arrest by means of microtubule-destablising agents
causes an increase in O-GlcNAc [225]. This compound has the N-acetyl signal, but not the
UDP part seen in the low-field range of the 1H NMR. Similarly, reports have been published
that the N-acetyl signal from either N-acetyl groups of glycoproteins [226] or N-
acetylhexoseamines [227] is detectable in vivo either in a solid tumour or cystic fluid. These
studies have demonstrated the presence of O-linked acetyl compounds in cancer cells or
tumours, but not indicated any specific function for these compounds.
Until recently little attention has been paid to the downfield side of the 1H NMR in the
context of cancer treatment response monitoring. Using HR-MAS of ex vivo specimens from
untreated and HSV-tk gene therapy treated BT4C gliomas, numerous peaks in the downfield
part of the spectrum were detected. These peaks were tentatively assigned as adenine, uridine
and cytosine nucleotides based on the chemical shifts[190]. The assignment of a doublet at

157
7.95ppm to UDP was confirmed by spiking experiments of tumour extracts in conjunction
with 1H and 31P NMR [190].
The early increase in UDP-GlcNAc and UDP-GalNAc in response to cisplatin treatment
response could be caused by a decrease in utilisation, an increase in production or a
combination of both. The degradation of 28S ribosomal RNA, a signature of apoptosis [228,
229] and associated with the inhibition of protein synthesis [230], was evident by 12 hours of
cisplatin treatment (Figure 9.2). Under these conditions there is likely to be less protein and
lipid glycosylation with a concomitant increase in UDP-GlcNAc and UDP-GalNAc.
Decreased utilisation of UDP-GlcNAc & UDP-GalNAc may also result directly from reduced
activity of O-linked UDP-N-acetylglucosamine:polypeptide-N-acetylglucosaminyl
transferase (OGT). OGT catalyzes the addition of O-GlcNAc from UDP-GlcNAc to proteins
and is located predominantly within the nucleus as determined by immunofluorescence and
subcellular fractionation [204]. The destruction of the nucleus after cisplatin treatment is
likely to result in a decreased activity of OGT. The increase of UDP-GlcNAc and UDP-
GalNAc could also be due to an increase in their synthesis. It is known that glycosylated
UDPs are needed to change the antigenicity of dying cancer cells to attract macrophages for
clearance of dying cells, similar to externalisation of PtdSer [231]. Furthermore, UDP-
GlcNAc and UDP-GalNAc levels could be elevated as a result of the increased cellular
glucose uptake which is known to occur under conditions of cell stress and has been
associated with an increase in their synthesis [201, 204].
Recent evidence from T98G and A172 human glioblastoma cells, indicates that cell growth
arrest without cell death does not cause an increase in either UDP-GlcNAc or UDP-GalNAc
[218]. We determined the level of these two metabolites in over-confluent BT4C cells and

158
found no increase in UDP-GlcNAc or UDP-GalNAc (Figure 9.12). Our data indicates that
UDP-GlcNAc and UDP-GalNAc are early 1H NMR detectable indices of positive treatment
response in brain tumour cells rather than markers of proliferation inhibition.
In our study, the increase of UDP-GlcNAc and UDP-GalNAc was found to be closely
correlated with the increase in 1H NMR detectable lipids in responding cells. It has
previously been reported that, in the hepatic cell line HepG2, HBP flux promotes
endoplasmic reticulum stress and intracellular neutral lipids accumulation [231]. In turn, the
concentration of UDP-GlcNAc within cells is proposed to be modulated by the availability of
fatty acids [232, 233]. These observations show that there is a close association of lipid levels
with hexosamine biosynthesis. The modest lipid increase in 1H NMR lipids in U87-MG cells
is likely to be due to the growth pattern of this cell line with focally high cell density [59], but
without effective overall growth inhibition.
9.5 Conclusion
UDP-GlcNAc and UDP-GalNAc are increased early in cancer cells which are responding to
treatment and are potential candidates for treatment response monitoring by in vivo 1H NMR.
The observation that these glycosylated UDP compounds increase in association with 1H NMR
lipids may also provide mechanistic information about cell death processes, in particular to the
biogenesis of lipid droplets, a hallmark process in the apoptotic cell death that renders cell
lipids 1H NMR detectable.

159
Chapter 10 Conclusion

160
10.1 Contribution of LDs to NMR lipid signal
An NMR lipid signal at 0.9 and 1.3ppm can be observed in brain tumour patients but not
normal brains. There is an increase of these lipid signals with treatment response. These
observations indicate the biomarker value of these NMR lipid signals in the clinic. NMR lipid
signals were frequently observed in cancer tissues and cells. The clarification of their origin is
therefore critical to explore the full potential of NMR application in both clinical and
experimental settings.
Two types of sub-cellular origin, the cytoplamic LDs and membrane micro-domains, are under
controversy ever since the first proposal of the membrane origin of NMR mobile lipid signal,
which is challenged by the isotropic mobility of membrane lipids. Later, a similar lipid signal
of intact tumour cells was reported in isolated detergent-resistant membrane domains further
suggesting the possible contribution of plasma membrane micro-domains to the NMR lipid
signal. But, the difference between the segments of a broken membrane and an intact cell
membrane was not taken into consideration. To the best of the author’s knowledge, in this
study it is the first time that NMR spectra acquired from isolated LDs has been presented. The
morphology of LDs after isolation was assessed. The diameter of LDs in isolated fraction
remained similar to that of the whole cells. The similarity of lipid signals between isolated LDs
and whole cells found in five different cell lines supports the LD origin of NMR lipid signal.
LD lipids only account for a small proportion of whole cell lipids in untreated cells. The
massive membrane lipids can easily mask any difference seen in by LDs. Therefore, the
correlation observed between lipid signal intensity and size of LDs in a panel of untreated
tumour cells excludes a predominant contribution from membrane lipids to NMR lipid signal.

161
The NMR lipid signal is frequently observed in apoptosis and necrosis in vivo and in vitro.
Both of these pathophysiological processes have a common feature of membrane turnover and
collapse, which has been used to explain the increased membrane lipid mobility to make the
NMR lipid detection possible. However, the observation of NMR lipid signal in either over-
confluent cells or rapidly proliferated malignant cells with intact membrane casts doubt on this
hypothesis and favours the LD origin proposal. In this study, LD accumulation was evident
with cisplatin exposure. The increase in lipid signal from the LDs isolated from cisplatin
exposed cells with bigger LDs confirms that LDs are the main contributors to these NMR lipid
signals. The absence of PUFA signal in the spectra of isolated LDs which was presented in
whole cell spectra is most likely due to the difficulty to isolate and extract them into a
sufficient amount for detection.
All in all, this study confirms LDs are the main contributors of NMR lipid signals. They are
possibly the only contributor in untreated tumour cells that have been assessed.
10.2 LDs in the progression of cancer cells
LDs were long regarded as simply lipid storage depots. Recently, they have been recognised as
a dynamic cellular organelle with diverse biological functions especially in lipid metabolism.
In this study, the lipid content of LDs was analysed and the results show that LDs contain
phosphatidylcholine, cholesterol and cholesterol ester with fatty acid chains being saturated,
mono-unsaturated and polyunsaturated. The composition of LDs was found to be different
between different types of tumour cells. The composition of LD lipids is different to that of the
whole cell lipids, especially in the poly-unsaturated lipids. These observations indicate the
composition of LD lipids might be cell type-specific. Lipid metabolism in LDs is probably
162
regulated in a manner which is different to that of the whole cell, suggesting a dynamic and
unique role of LDs in tumour cell biology.
LD abnormalities are characteristic of many conditions such as obesity, diabetes,
atherosclerosis and liver disease, therefore previous studies of LD accumulation were focused
on adipocytes, hepatocytes and blood cells. The varied-sized LDs in different nervous system
and brain tumour cells indicated a varied ability to accumulate LDs which might be important
to the tumorigenesis and development.
The increase of unsaturated lipids after effective treatment was observed in LDs but not in
whole cell lipids. The changes in lipid composition especially in unsaturated lipids reveal the
significance of LDs in tumour cell death. An improved understanding in the lipid composition
in LDs with and without treatment could identify useful therapeutic targets for cancer therapy.
10.3 Early detection of treatment response with NMR
spectroscopy
Tumour responses to treatment assessed from imaging measurements of reduction in tumour
size might take weeks and not occur in some cases even with a positive response. In this study,
the changes of lipids and metabolites were observed as early as 12h treatment in cisplatin
responding cells prior to the nuclei change showing the potential of these metabolites and
lipids to be used as promising markers for an early detection of treatment response.
It has been reported that the lipid signal in vitro studies correlates well with the lipid signal
acquired from tumour patients supporting that NMR is a non-invasive method that can be used
163
to study the metabolism of cells and tissues as well as to monitor the level of metabolites and
lipids in vivo. The cellular response to treatment was detected by NMR as alterations in
metabolites and lipids specific to cell death rather than growth inhibition. These data
demonstrates that NMR is a powerful tool that can be used in clinical trials of new drugs to
assess the drug efficacy and select the most effective therapy at an early stage of treatment.
UDP-GlcNAc and UDP-GalNAc are important donors of cellular glycosylation and is reported
to be associated with cell survival in stressful conditions. It is the first time that their
involvement in cancer cell death has been demonstrated implicating the important role of
glycosylation in cancers. UDP-GlcNAc and UDP-GalNAc increased early in cancer cells
which are responding to treatment implicating their role as potential candidates for treatment
response monitoring by 1H NMR.
10.4 Summary
Overall, it has been shown that LDs can be isolated from tumour cells in a sufficient quantity
for NMR analysis. LDs are important cellular organelles actively involved in tumour
development. NMR visible lipids and some of the metabolites are important bio-makers to
indicate cell type and cell death in brain tumour cell lines.
10.5 Future work
10.5.1 LD component analysis
LD accumulation was observed in cancer cells undergoing growth inhibition and cell death. A
difference in the increased level of the accumulated lipids was observed. However, it is unclear
whether the composition of these lipids is different. The study of the composition of these

164
accumulated lipids under different growth status may provide useful information for the
effective killing of cancer cells and may provide selective markers for cancer cell death.
LDs are found to be important in intracellular protein management and delivery. Recent studies
have uncovered many examples of LDs recruiting proteins from other cellular organelles. A
proteomic study on the isolated LDs with mass spectrometry can possibly reveal the role of
LDs in biological systems.
10.5.2 Investigation on cancer cell survival
UDP-GlcNAc and UDP-GalNA, the end products of the hexosamine biosynthesis pathway
(HBP) were found to be involved in cancer cell death. Glutamine is the main supplier of the
amine moiety in the biosynthesis of UDP-GlcNAc and UDP-GalNA. A study on the supply of
glutamine, the intracellular level of these UDP compounds and cell survival can possibly
reveal the association between cancer cell survival and the HBP pathway.
Cisplatin is the only drug that has been tested in this study. The inclusion of different drugs and
other treatments can assess the full potential of certain lipids and metabolites to be used as
markers for effective cancer therapies.

165
References
1. Christie, W.W. and Han, X., Lipid analysis: Isolation, separation, identification and
lipidomic analysis (Fourth edition). Oily Press Lipid Library Series No. 24, 2010. 2. Wenk, M.R., The emerging field of lipidomics. Nat Rev Drug Discov, 2005. 4(7): p.
594-610. 3. Fahy, E., et al., A comprehensive classification system for lipids. J. Lipid Res., 2005.
46(5): p. 839-862. 4. Watson, A.D., Thematic review series: Systems Biology Approaches to Metabolic and
Cardiovascular Disorders. Lipidomics: a global approach to lipid analysis in biological systems. Journal of Lipid Research, 2006. 47(10): p. 2101-2111.
5. Beermann, C., et al., Short term effects of dietary medium-chain fatty acids and n-3 long-chain polyunsaturated fatty acids on the fat metabolism of healthy volunteers. Lipids in Health and Disease, 2003. 2(1): p. 10.
6. Siegel, G., et al., eds. Basic Neurochemistry: Molecular, Cellular and Medical Aspects 7th edition. Academic Press. 2005.
7. Ramsey, R.B. and Davison, A.N., Steryl esters and their relationship to normal and diseased human central nervous system. Journal of Lipid Research, 1974. 15(3): p. 249-255.
8. O'Brien, J.S. and Sampson, E.L., Lipid composition of the normal human brain: gray matter, white matter, and myelin. J Lipid Res, 1965. 6(4): p. 537-44.
9. Cohen, L., Lipids in cancer: An introduction. Lipids, 1992. 27(10): p. 791-792. 10. Kumaraguruparan, R., et al., Tissue lipid peroxidation and antioxidant status in
patients with adenocarcinoma of the breast. Clinica Chimica Acta, 2002. 325(1-2): p. 165-170.
11. Zengin, E., et al., Alterations in lipid peroxidation and antioxidant status in different types of intracranial tumors within their relative peritumoral tissues. Clinical Neurology and Neurosurgery, 2009. 111(4): p. 345-351.
12. Di Vito, M., et al., 1H NMR-visible mobile lipid domains correlate with cytoplasmic lipid bodies in apoptotic T-lymphoblastoid cells. Biochim Biophys Acta, 2001. 1530(1): p. 47-66.
13. Herber, D.L., et al., Lipid accumulation and dendritic cell dysfunction in cancer. Nature Medicine, 2010. 16(8): p. 880-886.
14. Hirsch, H.A., et al., A Transcriptional Signature and Common Gene Networks Link Cancer with Lipid Metabolism and Diverse Human Diseases. 2010. 17(4): p. 348-361.
15. Oskouian, B. and Saba, J., Cancer treatment strategies targeting sphingolipid metabolism. Adv Exp Med Biol, 2010. 688: p. 185-205.
16. Linkous, A., G. , Yazlovitskaya, E.M., and Hallahan, D.E., Cytosolic Phospholipase A2 and Lysophospholipids in Tumor Angiogenesis. J Natl Cancer Inst, 2010. 102(18): p. 1398-412.
17. Hotze, A.C.G., et al., Supramolecular Iron Cylinder with Unprecedented DNA Binding Is a Potent Cytostatic and Apoptotic Agent without Exhibiting Genotoxicity. 2008. 15(12): p. 1258.
18. Mannechez, A., et al., Proton NMR visible mobile lipid signals in sensitive and multidrug-resistant K562 cells are modulated by rafts. Cancer Cell Int, 2005. 5(1): p. 2.

166
19. Reynier, M., et al., Differences in Lipid Characteristics of Undifferentiated and Enterocytic-differentiated HT29 Human Colonic Cells. Cancer Research, 1991. 51(4): p. 1270-1277.
20. Sauane, M., et al., Ceramide plays a prominent role in MDA-7/IL-24-induced cancer-specific apoptosis. Journal of Cellular Physiology, 2010. 222(3): p. 546-555.
21. Louis, D., et al., The 2007 WHO Classification of Tumours of the Central Nervous System. Acta Neuropathologica, 2007. 114(2): p. 97-109.
22. Shiu, R.P.C. and Paterson, J.A., Alteration of Cell Shape, Adhesion, and Lipid Accumulation in Human Breast Cancer Cells (T-47D) by Human Prolactin and Growth Hormone. Cancer Research, 1984. 44(3): p. 1178-1186.
23. Chang, B.H.-J. and Chan, L., Regulation of Triglyceride Metabolism. III. Emerging role of lipid droplet protein ADFP in health and disease. Am J Physiol Gastrointest Liver Physiol, 2007. 292(6): p. G1465-1468.
24. Slagel, D.E., Dittmer, J.C., and Wilson, C.B., Lipid composition of human glial tumour and adjacent brain. J Neurochem, 1967. 14(7): p. 789-98.
25. Tugnoli, V., et al., Characterization of lipids from human brain tissues by multinuclear magnetic resonance spectroscopy. Biopolymers, 2001. 62(6): p. 297-306.
26. Kökog, et al., Tissue lipid composition of human gliomas and meningiomas. Cancer Letters, 1992. 65(2): p. 169-171.
27. Burns, C.P. and Spector, A.A., Effects of lipids on cancer therapy. Nutr Rev, 1990. 48(6): p. 233-40.
28. Burns, C.P. and Spector, A.A., Biochemical effects of lipids on cancer therapy. The Journal of Nutritional Biochemistry, 1994. 5(3): p. 114-123.
29. Hawkins, R.A., Sangster, K., and Arends, M.J., Apoptotic death of pancreatic cancer cells induced by polyunsaturated fatty acids varies with double bond number and involves an oxidative mechanism. J Pathol, 1998. 185(1): p. 61-70.
30. Scheim, D.E., Cytotoxicity of unsaturated fatty acids in fresh human tumor explants: concentration thresholds and implications for clinical efficacy. Lipids in Health and Disease, 2009. 8: p. 54.
31. Miyake, J., Benadiba, M., and Colquhoun, A., Gamma-linolenic acid inhibits both tumour cell cycle progression and angiogenesis in the orthotopic C6 glioma model through changes in VEGF, Flt1, ERK1/2, MMP2, cyclin D1, pRb, p53 and p27 protein expression. Lipids in Health and Disease, 2009. 8(1): p. 8.
32. Bakshi, A., et al., Gamma-linolenic acid therapy of human gliomas. Nutrition, 2003. 19(4): p. 305-9.
33. Das, U.N., Gamma-linolenic acid therapy of human glioma-a review of in vitro, in vivo, and clinical studies. Med Sci Monit, 2007. 13(7): p. RA119-31.
34. Hakumaki, J.M., et al., 1H MRS detects polyunsaturated fatty acid accumulation during gene therapy of glioma: implications for the in vivo detection of apoptosis. Nature Medicine, 1999. 5(11): p. 1323-7.
35. Huuse, E., et al., Monitoring the Effect of Docetaxel Treatment in MCF7 Xenografts Using Multimodal In Vivo and Ex Vivo Magnetic Resonance Methods, Histopathology, and Gene Expression. Transl Oncol. , 2010. 3(4): p. 252-63.
36. Glunde, K., et al., Magnetic Resonance Spectroscopy in Metabolic and Molecular Imaging and Diagnosis of Cancer. Chemical Reviews, 2009. 110(5): p. 3043-3059.
37. Opstad, K.S., et al., An investigation of human brain tumour lipids by high-resolution magic angle spinning 1H MRS and histological analysis. NMR in Biomedicine, 2008. 21(7): p. 677-85.
167
38. Griffin, J.L., et al., Assignment of 1H Nuclear Magnetic Resonance Visible Polyunsaturated Fatty Acids in BT4C Gliomas Undergoing Ganciclovir-Thymidine Kinase Gene Therapy-induced Programmed Cell Death. Cancer Research, 2003. 63(12): p. 3195-3201.
39. Wu, H., et al., High-throughput tissue extraction protocol for NMR- and MS-based metabolomics. Anal Biochem, 2008. 372(2): p. 204-12.
40. Greenspan, P., Mayer, E.P., and Fowler, S.D., Nile red: a selective fluorescent stain for intracellular lipid droplets. J Cell Biol, 1985. 100(3): p. 965-73.
41. Johanna, S., et al., Live Cell Multicolor Imaging of Lipid Droplets with a New Dye, LD540. Traffic, 2009. 10(11): p. 1579-1584.
42. Griffiths, W.J., et al., Metabolomics and metabolite profiling: past heroes and future developments. Eur J Mass Spectrom (Chichester, Eng), 2007. 13(1): p. 45-50.
43. Robertson, D.G., Metabonomics in Toxicology: A Review. Toxicological Sciences, 2005. 85(2): p. 809-822.
44. Rabi, I., et al., A New Method of Measuring Nuclear Magnetic Moment. Physical Review 1938. 53: p. 318.
45. Bottomley, P.A., Human in vivo NMR spectroscopy in diagnostic medicine: clinical tool or research probe? Radiology, 1989. 170(1): p. 1-15.
46. Lauterbur, P.C., Image Formation by Induced Local Interactions: Examples Employing Nuclear Magnetic Resonance. Nature, 1973. 242(5394): p. 190-191.
47. van der Graaf, M., In vivo magnetic resonance spectroscopy: basic methodology and clinical applications. European Biophysics Journal, 2010. 39(4): p. 527-540.
48. Callot, V., et al., 1H MR spectroscopy of human brain tumours: a practical approach. European Journal of Radiology, 2008. 67(2): p. 268-274.
49. Chu, S.C., et al., Bulk magnetic susceptibility shifts in NMR studies of compartmentalized samples: use of paramagnetic reagents. Magn Reson Med, 1990. 13(2): p. 239-62.
50. Hakumaki, J.M. and Kauppinen, R.A., 1H NMR visible lipids in the life and death of cells. Trends Biochemical Sciences, 2000. 25(8): p. 357-62.
51. Silverstein, Bassler, and Morrill, eds. Spectrometric Identification of organic Compounds 4th Ed
1981, John Wiley & Sons. 52. Govindaraju, V., Young, K., and Maudsley, A.A., Proton NMR chemical shifts and
coupling constants for brain metabolites. NMR Biomed, 2000. 13(3): p. 129-53. 53. Willker, W. and Leibfritz, D., Assignment of mono- and polyunsaturated fatty acids in
lipids of tissues and body fluids. Magnetic Resonance in Chemistry, 1998. 36(S1): p. S79-S84.
54. Tesiram, Y.A., Saunders, D., and Towner, R.A., Chemical speciation by selective heteronuclear single-quantum coherence spectroscopy: determination of double-bond quantity in unsaturated fatty acid compounds. NMR in Biomedicine, 2008. 21(4): p. 345-356.
55. Singer, S., et al., 1H-NMR detectable fatty acyl chain unsaturation in excised leiomyosarcoma correlate with grade and mitotic activity. J Clin Invest, 1996. 98(2): p. 244-50.
56. Lazareff, J.A., et al., Pediatric Low-grade Gliomas: Prognosis with Proton Magnetic Resonance Spectroscopic Imaging. Neurosurgery, 1998. 43(4): p. 809-817.
57. Taylor, J.S., et al., Clinical value of proton magnetic resonance spectroscopy for differentiating recurrent or residual brain tumor from delayed cerebral necrosis. International Journal of Radiation Oncology*Biology*Physics, 1996. 36(5): p. 1251-1261.
168
58. Sibtain, N.A., Howe, F.A., and Saunders, D.E., The clinical value of proton magnetic resonance spectroscopy in adult brain tumours. Clinical Radiology, 2007. 62(2): p. 109-119.
59. Barba, I., Cabanas, M.E., and Arus, C., The relationship between nuclear magnetic resonance-visible lipids, lipid droplets, and cell proliferation in cultured C6 cells. Cancer Research, 1999. 59(8): p. 1861-8.
60. Negendank, W. and Sauter, R., Intratumoral lipids in 1H MRS in vivo in brain tumors: experience of the Siemens cooperative clinical trial. Anticancer Res., 1996. 16(3B): p. 1533-8.
61. Liimatainen, T., et al., Monitoring of gliomas in vivo by diffusion MRI and 1H MRS during gene therapy-induced apoptosis: interrelationships between water diffusion and mobile lipids. NMR in Biomedicine, 2009. 22(3): p. 272.
62. Negendank, W.G., et al., Proton magnetic resonance spectroscopy in patients with glial tumors: a multicenter study. J Neurosurg, 1996. 84(3): p. 449-58.
63. Kuesel, A., et al., Mobile lipid accumulation in necrotic tissue of high grade astrocytomas. Anticancer Res, 1996. 16(3B): p. 1485-9.
64. Sijens, P.E., et al., 1H MR Spectroscopy Detection of Lipids and Lactate in Metastatic Brain Tumors. NMR in Biomedicine, 1996. 9(2): p. 65-71.
65. Opstad, K.S., et al., Differentiation of metastases from high-grade gliomas using short echo time 1H spectroscopy. Journal of Magnetic Resonance Imaging, 2004. 20(2): p. 187-192.
66. Huschtscha, L.I., et al., Characteristics of cancer cell death after exposure to cytotoxic drugs in vitro. Br J Cancer, 1996. 73(1): p. 54-60.
67. Podoprigora, A., Pronin, I., and Fadeeva, L., Proton magnetic resonance spectroscopy in diagnostics of tumorous and nontumorous lesions in brain. Zh Vopr Neirokhir Im N N Burdenko, 2000(3): p. 17-20.
68. Quintero, M., Cabanas, M.E., and Arus, C., A possible cellular explanation for the NMR-visible mobile lipid (ML) changes in cultured C6 glioma cells with growth. BBA-Biochimica et Biophysica Acta, 2007. 1771(1): p. 31-44.
69. Mirbahai, L., et al., 1H magnetic resonance spectroscopy metabolites as biomarkers for cell cycle arrest and cell death in rat glioma cells. The International Journal of Biochemistry & Cell Biology, 2010. 43(7): p. 990-1001.
70. Fil'chenkov, A.A., Mikhailenko, V.M., and Zavelevich, M.P., Detection of early apoptotic changes in cells in vitro using nuclear magnetic resonance spectroscopy. Ukr Biokhim Zh, 2007. 79(4): p. 76-81.
71. Brisdelli, F., et al., Two-step formation of 1H NMR visible mobile lipids during apoptosis of paclitaxel-treated K562 cells. Biochemical Pharmacology, 2003. 65(8): p. 1271-1280.
72. Tugnoli, V., Trinchero, A., and Tosi, M.R., Evaluation of the lipid composition of human healthy and neoplastic renal tissues. International Journal of Biochemistry, 2004. 53(4): p. 169-82.
73. Murphy, D.J., The biogenesis and functions of lipid bodies in animals, plants and microorganisms. Progress in Lipid Research, 2001. 40(5): p. 325-438.
74. Mountford, C.E. and Wright, L.C., Organization of lipids in the plasma membranes of malignant and stimulated cells: a new model. Trends Biochem Sci, 1988. 13(5): p. 172-7.
75. Ferretti, A., et al., High-resolution proton NMR measures mobile lipids associated with Triton-resistant membrane domains in haematopoietic K562 cells lacking or expressing caveolin-1. Eur Biophys J, 2003. 32(2): p. 83-95.
169
76. Khandelia, H., et al., Triglyceride blisters in lipid bilayers: implications for lipid droplet biogenesis and the mobile lipid signal in cancer cell membranes. PLoS One, 2010. 5(9): p. e12811.
77. Remy, C., et al., Evidence That Mobile Lipids Detected in Rat Brain Glioma by 1H Nuclear Magnetic Resonance Correspond to Lipid Droplets. Cancer Research, 1997. 57(3): p. 407-414.
78. Callies, R., et al., The appearance of neutral lipid signals in the 1H NMR spectra of a myeloma cell line correlates with the induced formation of cytoplasmic lipid droplets. Magnetic Resonance in Medicine, 1993. 29(4): p. 546-550.
79. Quintero, M., Cabanas, M.E., and Arus, C., 13C-labelling studies indicate compartmentalized synthesis of triacylglycerols in C6 rat glioma cells. Biochim Biophys Acta, 2010. 1801(7): p. 693-701.
80. Blankenberg, F.G., et al., Detection of apoptotic cell death by proton nuclear magnetic resonance spectroscopy. Blood, 1996. 87(5): p. 1951-1956.
81. Blankenberg, F.G., et al., Quantitative Analysis of Apoptotic Cell Death Using Proton Nuclear Magnetic Resonance Spectroscopy. Blood, 1997. 89(10): p. 3778-3786.
82. Cermelli, S., et al., The lipid-droplet proteome reveals that droplets are a protein-storage depot. Curr Biol, 2006. 16(18): p. 1783-95.
83. Hoult, D.I., et al., Observation of tissue metabolites using 31P nuclear magnetic resonance. Nature, 1974. 252(5481): p. 285-287.
84. Wilson, M., et al., A quantitative comparison of metabolite signals as detected by in vivo MRS with ex vivo1H HR-MAS for childhood brain tumours. NMR in Biomedicine, 2009. 22(2): p. 213-219.
85. Hollingworth, W., et al., A systematic literature review of magnetic resonance spectroscopy for the characterization of brain tumors. AJNR Am J Neuroradiol, 2006. 27(7): p. 1404-11.
86. Devos, A., et al., Classification of brain tumours using short echo time 1H MR spectra. Journal of Magnetic Resonance, 2004. 170(1): p. 164-175.
87. Kirov, I., et al., Characterizing 'mild' in traumatic brain injury with proton MR spectroscopy in the thalamus: Initial findings. Brain Injury, 2007. 21(11): p. 1147-1154.
88. Davison, J.E., et al., Magnetic resonance spectroscopy in the diagnostic evaluation of brainstem lesions in Alexander disease. J Child Neurol, 2011. 26(3): p. 356-60.
89. Bonavita, S., Di Salle, F., and Tedeschi, G., Proton MRS in neurological disorders. Eur J Radiol, 1999. 30(2): p. 125-31.
90. Sankar, T., et al., Prospective serial proton MR spectroscopic assessment of response to tamoxifen for recurrent malignant glioma. J Neurooncol, 2008. 90(1): p. 63-76.
91. Preul, M.C., et al., Magnetic resonance spectroscopy guided brain tumor resection: differentiation between recurrent glioma and radiation change in two diagnostically difficult cases. Can J Neurol Sci, 1998. 25(1): p. 13-22.
92. Calvar, J.A., et al., Characterization of brain tumors by MRS, DWI and Ki-67 labeling index. J Neurooncol, 2005. 72(3): p. 273-80.
93. Davies, N.P., et al., Non-invasive detection of glycine as a biomarker of malignancy in childhood brain tumours using in-vivo1H MRS at 1.5 Tesla confirmed by ex-vivo high-resolution magic-angle spinning NMR. NMR in Biomedicine, 2008. 23(1): p. 80-87.
94. Sitter, B., et al., High-resolution magic angle spinning MRS of breast cancer tissue. NMR Biomed, 2002. 15(5): p. 327-37.

170
95. Griffin, J.L., et al., High-resolution magic angle spinning 1H NMR spectroscopy and reverse transcription-PCR analysis of apoptosis in a rat glioma. Anal Chem, 2006. 78(5): p. 1546-52.
96. Lenz, E.M. and Wilson, I.D., Analytical strategies in metabonomics. J Proteome Res, 2007. 6(2): p. 443-58.
97. Peet, A.C., et al., 1H MRS identifies specific metabolite profiles associated with MYCN-amplified and non-amplified tumour subtypes of neuroblastoma cell lines. NMR in Biomedicine, 2007. 20(7): p. 692-700.
98. Davies, N.P., et al., Identification and characterisation of childhood cerebellar tumours by in vivo proton MRS. NMR in Biomedicine, 2008. 21(8): p. 908-918.
99. Skog, J., et al., Glioblastoma microvesicles transport RNA and proteins that promote tumour growth and provide diagnostic biomarkers. Nat Cell Biol, 2008. 10(12): p. 1470-1476.
100. Luthra, R., et al., Gene expression profiling of localized esophageal carcinomas: association with pathologic response to preoperative chemoradiation. J Clin Oncol, 2006. 24(2): p. 259-67.
101. Musacchio, T., et al., 1H NMR Detection of Mobile Lipids as a Marker for Apoptosis: The Case of Anticancer Drug-Loaded Liposomes and Polymeric Micelles. Molecular Pharmaceutics, 2009. 6(6): p. 1876-1882.
102. Choi, C., et al., 2-hydroxyglutarate detection by magnetic resonance spectroscopy in IDH-mutated patients with gliomas. Nat Med, 2012. 18(4): p. 624-9.
103. Fawcett, R., The cell. 1966, Philadelphia W.B. Saunders. 104. Tauchi-Sato, K., et al., The Surface of Lipid Droplets Is a Phospholipid Monolayer
with a Unique Fatty Acid Composition. Journal of Biological Chemistry, 2002. 277(46): p. 44507-44512.
105. Schittmayer, M. and Birner-Gruenberger, R., Functional proteomics in lipid research: Lipases, lipid droplets and lipoproteins. Journal of Proteomics, 2009. 72(6): p. 1006-1018.
106. Mancone, C., et al., Proteomic analysis of human very low-density lipoprotein by two-dimensional gel electrophoresis and MALDI-TOF/TOF. Proteomics, 2007. 7(1): p. 143-54.
107. Rezaee, F., et al., Proteomic analysis of high-density lipoprotein. Proteomics, 2006. 6(2): p. 721-30.
108. Wolins, N.E., Brasaemle, D.L., and Bickel, P.E., A proposed model of fat packaging by exchangeable lipid droplet proteins. FEBS Letters, 2006. 580(23): p. 5484-5491.
109. Granneman, J.G., et al., Perilipin controls lipolysis by regulating the interactions of AB-hydrolase containing 5 (Abhd5) and adipose triglyceride lipase (Atgl). J Biol Chem, 2009. 284(50): p. 34538-44.
110. Gao, J. and Serrero, G., Adipose differentiation related protein (ADRP) expressed in transfected COS-7 cells selectively stimulates long chain fatty acid uptake. J Biol Chem, 1999. 274(24): p. 16825-30.
111. Le Lay, S., et al., Cholesterol-induced caveolin targeting to lipid droplets in adipocytes: a role for caveolar endocytosis. Traffic, 2006. 7(5): p. 549-61.
112. Bartz, R., et al., Dynamic activity of lipid droplets: protein phosphorylation and GTP-mediated protein translocation. J Proteome Res, 2007. 6(8): p. 3256-65.
113. Martin, S. and Parton, R.G., Lipid droplets: a unified view of a dynamic organelle. Nature Reviews Molecular Cell Biology 2006. 7(5): p. 373-8.
114. Zehmer, J.K., et al., A role for lipid droplets in inter-membrane lipid traffic. PROTEOMICS, 2009. 9(4): p. 914-921.
171
115. Umlauf, E., et al., Association of stomatin with lipid bodies. J Biol Chem, 2004. 279(22): p. 23699-709.
116. Stein, O. and Stein, Y., Lipid synthesis, intracellular transport, storage, and secretion. I. Electron microscopic radioautographic study of liver after injection of tritiated palmitate or glycerol in fasted and ethanol-treated rats. J Cell Biol, 1967. 33(2): p. 319-39.
117. Robenek, H., et al., Compartmentalization of proteins in lipid droplet biogenesis. Biochimica et Biophysica Acta (BBA) - Molecular and Cell Biology of Lipids, 2009. 1791(6): p. 408-418.
118. Kuerschner, L., Moessinger, C., and Thiele, C., Imaging of lipid biosynthesis: how a neutral lipid enters lipid droplets. Traffic, 2008. 9(3): p. 338-52.
119. Waltermann, M., et al., Mechanism of lipid-body formation in prokaryotes: how bacteria fatten up. Mol Microbiol, 2005. 55(3): p. 750-63.
120. Olofsson, S.-O., et al., Lipid droplets as dynamic organelles connecting storage and efflux of lipids. Biochimica et Biophysica Acta (BBA) - Molecular and Cell Biology of Lipids, 2009. 1791(6): p. 448-458.
121. Miura, S., et al., Functional conservation for lipid storage droplet association among Perilipin, ADRP, and TIP47 (PAT)-related proteins in mammals, Drosophila, and Dictyostelium. J Biol Chem, 2002. 277(35): p. 32253-7.
122. Finstad, H.S., et al., Cell proliferation, apoptosis and accumulation of lipid droplets in U937-1 cells incubated with eicosapentaenoic acid. Biochemical Journal, 1998. 336 ( Pt 2): p. 451-9.
123. Guo, Y., et al., Functional genomic screen reveals genes involved in lipid-droplet formation and utilization. Nature, 2008. 453(7195): p. 657-661.
124. Listenberger, L.L., et al., Triglyceride accumulation protects against fatty acid-induced lipotoxicity. Proc Natl Acad Sci U S A, 2003. 100(6): p. 3077-82.
125. Walther, T.C. and Farese Jr, R.V., The life of lipid droplets. Biochimica et Biophysica Acta (BBA) - Molecular and Cell Biology of Lipids, 2009. 1791(6): p. 459-466.
126. Stemberger, B.H., Walsh, R.M., and Patton, S., Morphometric evaluation of lipid droplet associations with secretory vesicles, mitochondria and other components in the lactating cell. Cell Tissue Res, 1984. 236(2): p. 471-5.
127. Blanchette-Mackie, E.J. and Scow, R.O., Movement of lipolytic products to mitochondria in brown adipose tissue of young rats: an electron microscope study. J Lipid Res, 1983. 24(3): p. 229-44.
128. Shaw, C.S., Jones, D.A., and Wagenmakers, A.J., Network distribution of mitochondria and lipid droplets in human muscle fibres. Histochem Cell Biol, 2008. 129(1): p. 65-72.
129. Jagerstrom, S., et al., Lipid droplets interact with mitochondria using SNAP23. Cell Biol Int, 2009. 33(9): p. 934-40.
130. Zerial, M. and McBride, H., Rab proteins as membrane organizers. Nat Rev Mol Cell Biol, 2001. 2(2): p. 107-17.
131. Yaqoob, P., Fatty acids as gatekeepers of immune cell regulation. Trends in Immunology, 2003. 24(12): p. 639.
132. Wymann, M.P. and Schneiter, R., Lipid signalling in disease. Nature Reviews Molecular Cell Biology, 2008. 9(2): p. 162.
133. Plotkowski, M.C., et al., Lipid body mobilization in the ExoU-induced release of inflammatory mediators by airway epithelial cells. Microb Pathog, 2008. 45(1): p. 30-7.
172
134. Bozza, P.T., Magalhães, K.G., and Weller, P.F., Leukocyte lipid bodies -- Biogenesis and functions in inflammation. Biochimica et Biophysica Acta (BBA) - Molecular and Cell Biology of Lipids, 2009. 1791(6): p. 540-551.
135. Miyanari, Y., et al., The lipid droplet is an important organelle for hepatitis C virus production. Nat Cell Biol, 2007. 9(9): p. 1089-1097.
136. Than, N.G., et al., Lipid droplet and milk lipid globule membrane associated placental protein 17b (PP17b) is involved in apoptotic and differentiation processes of human epithelial cervical carcinoma cells. European Journal of Biochemistry, 2003. 270(6): p. 1176-1188.
137. Yu, W., et al., Co-compartmentalization of MAP kinases and cytosolic phospholipase A2 at cytoplasmic arachidonate-rich lipid bodies. Am J Pathol, 1998. 152(3): p. 759-69.
138. Accioly, M.T., et al., Lipid bodies are reservoirs of cyclooxygenase-2 and sites of prostaglandin-E2 synthesis in colon cancer cells. Cancer Res, 2008. 68(6): p. 1732-40.
139. Ohsaki, Y., et al., Biogenesis of cytoplasmic lipid droplets: From the lipid ester globule in the membrane to the visible structure. Biochimica et Biophysica Acta (BBA) - Molecular and Cell Biology of Lipids, 2009. 1791(6): p. 399-407.
140. Yu, W., Cassara, J., and Weller, P.F., Phosphatidylinositide 3-kinase localizes to cytoplasmic lipid bodies in human polymorphonuclear leukocytes and other myeloid-derived cells. Blood, 2000. 95(3): p. 1078-85.
141. Schmitz, J.E., et al., 1H MRS-visible lipids accumulate during apoptosis of lymphoma cells in vitro and in vivo. Magnetic Resonance in Medicine, 2005. 54(1): p. 43-50.
142. Milkevitch, M., et al., Increases in NMR-visible lipid and glycerophosphocholine during phenylbutyrate-induced apoptosis in human prostate cancer cells. Biochim Biophys Acta, 2005. 1734(1): p. 1-12.
143. Franke, W.W., Hergt, M., and Grund, C., Rearrangement of the vimentin cytoskeleton during adipose conversion: formation of an intermediate filament cage around lipid globules. Cell, 1987. 49(1): p. 131-41.
144. Welte, M.A., Fat on the move: intracellular motion of lipid droplets. Biochem Soc Trans, 2009. 37(Pt 5): p. 991-6.
145. Hood, L.F. and Patton, S., Isolation and characterization of intracellular lipid droplets from bovine mammary tissue. J Dairy Sci, 1973. 56(7): p. 858-63.
146. Weller, P.F., et al., Cytoplasmic lipid bodies of human eosinophils. Subcellular isolation and analysis of arachidonate incorporation. American Journal of Pathology, 1991. 138(1): p. 141-8.
147. Pohl, L. and Eckle, M., Sodium 3-Trimethylsilyltetradeuteriopropionate, a New Water-Soluble Standard for 1H-NMR. Angewandte Chemie International Edition in English, 1969. 8(5): p. 381-381.
148. Raiford, D.S., Fisk, C.L., and Becker, E.D., Calibration of methanol and ethylene glycol nuclear magnetic resonance thermometers. Analytical Chemistry, 1979. 51(12): p. 2050-2051.
149. Reynolds, G., et al., An algorithm for the automated quantitation of metabolites in in vitro NMR signals. Magn Reson Med, 2006. 56(6): p. 1211-9.
150. Xi, Y. and Rocke, D.M., Baseline correction for NMR spectroscopic metabolomics data analysis. BMC Bioinformatics, 2008. 9: p. 324.
151. Mirbahai, L., et al., Lipid biomarkers of glioma cell growth arrest and cell death detected by 1H magic angle spinning MRS. NMR in Biomedicine, 2012: p. n/a-n/a.
152. Liu, P., et al., Chinese hamster ovary K2 cell lipid droplets appear to be metabolic organelles involved in membrane traffic. J Biol Chem, 2004. 279(5): p. 3787-92.
173
153. Coffey, C.M., et al., Reovirus outer capsid protein micro1 induces apoptosis and associates with lipid droplets, endoplasmic reticulum, and mitochondria. Journal of Virology, 2006. 80(17): p. 8422-38.
154. Zoula, S., et al., Pimonidazole binding in C6 rat brain glioma: relation with lipid droplet detection. Br J Cancer, 2003. 88(9): p. 1439-44.
155. Kuesel, A.C., et al., 1H MRS of high grade astrocytomas: Mobile lipid accumulation in necrotic tissue. NMR in Biomedicine, 1994. 7(3): p. 149-155.
156. Laprie, A., et al., Longitudinal multivoxel MR spectroscopy study of pediatric diffuse brainstem gliomas treated with radiotherapy. Int J Radiat Oncol Biol Phys, 2005. 62(1): p. 20-31.
157. Tugnoli, V., et al., 1H-NMR and 13C-NMR lipid profiles of human renal tissues. Biopolymers, 2003. 72(2): p. 86-95.
158. Subramanian, A., et al., NMR spectroscopic identification of cholesterol esters, plasmalogen and phenolic glycolipids as fingerprint markers of human intracranial tuberculomas. NMR Biomed, 2008. 21(3): p. 272-88.
159. Gottschalk, M., et al., Metabolomic studies of human lung carcinoma cell lines using in vitro 1H NMR of whole cells and cellular extracts. NMR in Biomedicine, 2008. 21(8): p. 809-819.
160. Tosi, M.R. and Tugnoli, V., Cholesteryl esters in malignancy. Clin Chim Acta, 2005. 359(1-2): p. 27-45.
161. Goluszko, P. and Nowicki, B., Membrane cholesterol: a crucial molecule affecting interactions of microbial pathogens with mammalian cells. Infect Immun, 2005. 73(12): p. 7791-6.
162. Lange, Y., et al., Regulation of endoplasmic reticulum cholesterol by plasma membrane cholesterol. J Lipid Res, 1999. 40(12): p. 2264-70.
163. Martin, S. and Parton, R.G., Caveolin, cholesterol, and lipid bodies. Semin Cell Dev Biol, 2005. 16(2): p. 163-74.
164. Gibney, M.J., Introduction to human nutrition (Second edition). A John Wiley & Sons, Ltd., Publication, 2009.
165. Majos, C., et al., Proton magnetic resonance spectroscopy ((1)H MRS) of human brain tumours: assessment of differences between tumour types and its applicability in brain tumour categorization. Eur Radiol, 2003. 13(3): p. 582-91.
166. Lichy, M.P., et al., Follow-up gliomas after radiotherapy: 1H MR spectroscopic imaging for increasing diagnostic accuracy. Neuroradiology, 2005. 47(11): p. 826-34.
167. Weller, R.O., Clark, R.A., and Oswald, W.B., Stages in the formation and metabolism in intracellular lipid droplets in atherosclerosis. An electron microscopical and biochemical study. J Atheroscler Res, 1968. 8(2): p. 249-63.
168. Greenberg, A.S., et al., The role of lipid droplets in metabolic disease in rodents and humans. The Journal of Clinical Investigation, 2011. 121(6): p. 2102-2110.
169. Wilson, M., et al., Magnetic resonance spectroscopy metabolite profiles predict survival in paediatric brain tumours. European Journal of Cancer, 2012(0).
170. Bayet-Robert, M., et al., Quantitative two-dimensional HRMAS 1H-NMR spectroscopy-based metabolite profiling of human cancer cell lines and response to chemotherapy. Magnetic Resonance in Medicine, 2010. 63(5): p. 1172-1183.
171. Perez, Y., et al., Measurement by nuclear magnetic resonance diffusion of the dimensions of the mobile lipid compartment in C6 cells. Cancer Res, 2002. 62(20): p. 5672-7.
172. Jouvensal, L., Carlier, P.G., and Bloch, G., Low visibility of lactate in excised rat muscle using double quantum proton spectroscopy. Magn Reson Med, 1997. 38(5): p. 706-11.

174
173. Sun, X. and Moreira, R.G., Correlation between NMR proton relaxation time and free fatty acids and total polar materials of degraded soybean oils. Journal of food processing and preservation., 1996. 20(2): p. 157-167.
174. Valverde-Saubi, D., et al., Short-term temperature effect on the HRMAS spectra of human brain tumor biopsies and their pattern recognition analysis. MAGMA, 2010. 23(4): p. 203-15.
175. Kauppinen, R.A., et al., Detection of thymosin beta 4 in situ in a guinea pig cerebral cortex preparation using 1H NMR spectroscopy. Journal of Biological Chemistry, 1992. 267(14): p. 9905-9910.
176. Dvorak, A.M., et al., Ultrastructural Localization of Prostaglandin Endoperoxide Synthase (Cyclooxygenase) to Isolated, Purified Fractions of Guinea Pig Peritoneal Macrophage and Line 10 Hepatocarcinoma Cell Lipid Bodies. International Archives of Allergy and Immunology, 1993. 101(2): p. 136-142.
177. Yao, M., et al., Gene expression analysis of renal carcinoma: adipose differentiation-related protein as a potential diagnostic and prognostic biomarker for clear-cell renal carcinoma. J Pathol, 2005. 205(3): p. 377-87.
178. Johnson, L.F. and Shoolery, J.N., Determination of Unsaturation and Average Molecular Weight of Natural Fats by Nuclear Magnetic Resonance. Analytical Chemistry, 1962. 34(9): p. 1136-1139.
179. Andreyev, A.Y., et al., Subcellular organelle lipidomics in TLR-4-activated macrophages. Journal of Lipid Research, 2010. 51(9): p. 2785-97.
180. Ansell, G.B., The metabolism of phosphatidylcholine in brain tissue. Biochemical Journal, 1972. 128(1): p. 6P-8P.
181. Sonnevald, U., et al., MRS evaluation of brain metabolites of extract from cell culture. International journal of oncology, 1993(2): p. 545-555.
182. Uauy, R., et al., Role of essential fatty acids in the function of the developing nervous system. Lipids, 1996. 31 Suppl: p. S167-76.
183. Bozza, P.T. and Viola, J.P.B., Lipid droplets in inflammation and cancer. Prostaglandins, Leukotrienes and Essential Fatty Acids, 2010. 82(4-6): p. 243-250.
184. Dietschy, J.M. and Turley, S.D., Thematic review series: Brain Lipids. Cholesterol metabolism in the central nervous system during early development and in the mature animal. Journal of Lipid Research, 2004. 45(8): p. 1375-1397.
185. Korade, Z. and Kenworthy, A.K., Lipid rafts, cholesterol, and the brain. Neuropharmacology, 2008. 55(8): p. 1265.
186. Coleman, P.S., Membrane Cholesterol and Tumor Bioenergeticsa. Annals of the New York Academy of Sciences, 1986. 488(1): p. 451-467.
187. Alling, C. and Svennerholm, L., Concentration and fatty acid composition of cholesterol esters of normal human brain. Journal of Neurochemistry, 1969. 16(5): p. 751.
188. Paillasse, M.R., et al., Signaling through cholesterol esterification: a new pathway for the cholecystokinin 2 receptor involved in cell growth and invasion. Journal of Lipid Research, 2009. 50(11): p. 2203-2211.
189. van Meer, G., Caveolin, cholesterol, and lipid droplets? Journal of Cell Biology, 2001. 152(5): p. F29-34.
190. Lehtimäki, K.K., et al., Metabolite Changes in BT4C Rat Gliomas Undergoing Ganciclovir-Thymidine Kinase Gene Therapy-induced Programmed Cell Death as Studied by 1H NMR Spectroscopy in Vivo, ex Vivo, and in Vitro. J Biol Chem., 2003. 278(46): p. 45915-45923.
191. Al-Saffar, N.M.S., et al., Apoptosis is associated with triacylglycerol accumulation in Jurkat T-cells. Br J Cancer, 2002. 86(6): p. 963-970.
175
192. Boren, J. and Brindle, K.M., Apoptosis-induced mitochondrial dysfunction causes cytoplasmic lipid droplet formation. Cell Death and Differentiation, 2012.
193. Delikatny, E.J., et al., Nuclear Magnetic Resonance-visible Lipids Induced by Cationic Lipophilic Chemotherapeutic Agents Are Accompanied by Increased Lipid Droplet Formation and Damaged Mitochondria. Cancer Research, 2002. 62(5): p. 1394-1400.
194. Veale, M.F., et al., The generation of 1H-NMR-detectable mobile lipid in stimulated lymphocytes: relationship to cellular activation, the cell cycle, and phosphatidylcholine-specific phospholipase C. Biochem Biophys Res Commun, 1997. 239(3): p. 868-74.
195. Berquin, I.M., Edwards, I.J., and Chen, Y.Q., Multi-targeted therapy of cancer by omega-3 fatty acids. Cancer Lett, 2008. 269(2): p. 363-77.
196. Cockbain, A.J., Toogood, G.J., and Hull, M.A., Omega-3 polyunsaturated fatty acids for the treatment and prevention of colorectal cancer. Gut, 2012. 61(1): p. 135-149.
197. Shih, C.M., et al., Detection of apoptosis and necrosis in normal human lung cells using 1H NMR spectroscopy. Annals of the New York Academy of Sciences 2005. 1042: p. 488-96.
198. Butkinaree, C., Park, K., and Hart, G.W., O-linked beta-N-acetylglucosamine (O-GlcNAc): Extensive crosstalk with phosphorylation to regulate signaling and transcription in response to nutrients and stress. Biochim Biophys Acta, 2010. 1800(2): p. 96-106.
199. Torres, C.R. and Hart, G.W., Topography and polypeptide distribution of terminal N-acetylglucosamine residues on the surfaces of intact lymphocytes. Evidence for O-linked GlcNAc. J Biol Chem, 1984. 259(5): p. 3308-17.
200. Copeland, R.J., Bullen, J.W., and Hart, G.W., Cross-talk between GlcNAcylation and phosphorylation: roles in insulin resistance and glucose toxicity. Am J Physiol Endocrinol Metab, 2008. 295(1): p. E17-28.
201. Zachara, N.E. and Hart, G.W., O-GlcNAc a sensor of cellular state: the role of nucleocytoplasmic glycosylation in modulating cellular function in response to nutrition and stress. Biochim Biophys Acta 2004. 1673(1-2): p. 13-28.
202. Love, D.C. and Hanover, J.A., The hexosamine signaling pathway: deciphering the "O-GlcNAc code". Sci STKE, 2005. 2005(312): p. re13.
203. Vosseller, K., et al., Elevated nucleocytoplasmic glycosylation by O-GlcNAc results in insulin resistance associated with defects in Akt activation in 3T3-L1 adipocytes. Proc Natl Acad Sci U S A, 2002. 99(8): p. 5313-8.
204. Zachara, N.E. and Hart, G.W., Cell signaling, the essential role of O-GlcNAc! Biochim Biophys Acta, 2006. 1761(5-6): p. 599-617.
205. Gu, Y., et al., GlcNAcylation plays an essential role in breast cancer metastasis. Cancer Res, 2010. 70(15): p. 6344-51.
206. Hart, G.W., Housley, M.P., and Slawson, C., Cycling of O-linked beta-N-acetylglucosamine on nucleocytoplasmic proteins. Nature, 2007. 446(7139): p. 1017-22.
207. Coen, M., et al., Mechanistic aspects and novel biomarkers of responder and non-responder phenotypes in galactosamine-induced hepatitis. J Proteome Res, 2009. 8(11): p. 5175-87.
208. Lutz, N.W., From metabolic to metabolomic NMR spectroscopy of apoptotic cells. Metabolomics, 2005. 1(3): p. 251-268.
209. Meisamy, S., et al., Neoadjuvant chemotherapy of locally advanced breast cancer: predicting response with in vivo 1H MR spectroscopy--a pilot study at 4 T. Radiology, 2004. 233(2): p. 424-31.

176
210. Bogin, L., et al., TNF-induced modulations of phospholipid metabolism in human breast cancer cells. Biochim Biophys Acta, 1998. 1392(2-3): p. 217-32.
211. Podo, F., Tumour phospholipid metabolism. NMR Biomed, 1999. 12(7): p. 413-39. 212. Lutz, N.W., Tome, M.E., and Cozzone, P.J., Early changes in glucose and
phospholipid metabolism following apoptosis induction by IFN-gamma/TNF-alpha in HT-29 cells. FEBS Lett, 2003. 544(1-3): p. 123-8.
213. Nunn, A.V., et al., Characterisation of secondary metabolites associated with neutrophil apoptosis. FEBS Lett, 1996. 392(3): p. 295-8.
214. Aboagye, E.O., et al., Detection of tumor response to chemotherapy by 1H nuclear magnetic resonance spectroscopy: effect of 5-fluorouracil on lactate levels in radiation-induced fibrosarcoma 1 tumors. Cancer Res, 1998. 58(5): p. 1063-7.
215. Antczak, C., et al., High-throughput identification of inhibitors of human mitochondrial peptide deformylase. J Biomol Screen, 2007. 12(4): p. 521-35.
216. Kapuscinski, J., DAPI: a DNA-specific fluorescent probe. Biotech Histochem, 1995. 70(5): p. 220-33.
217. Cloarec, O., et al., Statistical Total Correlation Spectroscopy:An Exploratory Approach for Latent Biomarker Identification from Metabolic 1H NMR Data Sets. Anal Biochem, 2005. 77(5): p. 1282.
218. Grande, S., et al., Glycosidic intermediates identified in 1H MR spectra of intact tumour cells may contribute to the clarification of aspects of glycosylation pathways. NMR Biomed, 2010. 24(1): p. 68-79.
219. Lau, K.S., et al., Complex N-glycan number and degree of branching cooperate to regulate cell proliferation and differentiation. Cell, 2007. 129(1): p. 123-34.
220. Kolset, S.O., Prydz, K., and Pejler, G., Intracellular proteoglycans. Biochem J, 2004. 379(Pt 2): p. 217-27.
221. Chatham, J.C., et al., Hexosamine Biosynthesis and Protein O-Glycosylation: the First Line of Defense Against Stress, Ischemia, and Trauma. Shock, 2008. 29(4): p. 431-440 10.1097/SHK.0b013e3181598bad.
222. Stan-Lotter, H. and Bragg, P.D., Loss of protection by nucleotides against proteolysis and thiol modification in the isolated alpha-subunit from F1 ATPase of Escherichia coli mutant uncA401. Biochem J, 1984. 224(1): p. 145-51.
223. Slawson, C., Pidala, J., and Potter, R., Increased N-acetyl-beta-glucosaminidase activity in primary breast carcinomas corresponds to a decrease in N-acetylglucosamine containing proteins. Biochim Biophys Acta, 2001. 1537(2): p. 147-57.
224. Sasai, K., et al., UDP-GlcNAc concentration is an important factor in the biosynthesis of β1,6-branched oligosaccharides: regulation based on the kinetic properties of N-acetylglucosaminyltransferase V. Glycobiology, 2002. 12(2): p. 119-127.
225. Haltiwanger, R.S. and Philipsberg, G.A., Mitotic Arrest with Nocodazole Induces Selective Changes in the Level of O-Linked N-Acetylglucosamine and Accumulation of Incompletely Processed N-Glycans on Proteins from HT29 Cells. J Biol Chem, 1997. 272(13): p. 8752-8758.
226. Kolwijck, E., et al., N-acetyl resonances in in vivo and in vitro NMR spectroscopy of cystic ovarian tumors. NMR in Biomedicine, 2009. 22(10): p. 1093.
227. Santhosh, K., et al., Metabolite signature of developmental foregut cyst on in vivo and in vitro 1H MR spectroscopy. J Magn Reson Imaging 2008. 28(2): p. 493.
228. Samali, A., et al., The ability to cleave 28S ribosomal RNA during apoptosis is a cell-type dependent trait unrelated to DNA fragmentation. Cell Death Differ, 1997. 4(4): p. 289-93.
177
229. King, K.L., et al., 28S ribosome degradation in lymphoid cell apoptosis: evidence for caspase and Bcl-2-dependent and -independent pathways. Cell Death Differ, 2000. 7(10): p. 994-1001.
230. Nadano, D. and Sato, T.-A., Caspase-3-dependent and -independent Degradation of 28 S Ribosomal RNA May Be Involved in the Inhibition of Protein Synthesis during Apoptosis Initiated by Death Receptor Engagement. J Biol Chem, 2000. 275(18): p. 13967-13973.
231. Sage, A.T., et al., Hexosamine biosynthesis pathway flux promotes endoplasmic reticulum stress, lipid accumulation, and inflammatory gene expression in hepatic cells. Am J Physiol Endocrinol Metab, 2010. 298(3): p. E499-511.
232. Wells, L., Vosseller, K., and Hart, G.W., A role for N-acetylglucosamine as a nutrient sensor and mediator of insulin resistance. Cell Mol Life Sci, 2003. 60(2): p. 222-8.
233. Hawkins, M., et al., Role of the glucosamine pathway in fat-induced insulin resistance. J Clin Invest, 1997. 99(9): p. 2173-82.

178
Appendix: Publications based on this
thesis

1694 Mol. BioSyst., 2012, 8, 1694–1700 This journal is c The Royal Society of Chemistry 2012
Cite this: Mol. BioSyst., 2012, 8, 1694–1700
The lipid composition of isolated cytoplasmic lipid droplets from a
human cancer cell line, BE(2)M17w
Xiaoyan Pan,ab
Martin Wilson,ab
Carmel McConville,aMarie-Anne Brundler,
c
Theodoros N. Arvanitis,bd
John P. Shockcor,eJulian L. Griffin,
e
Risto A. Kauppinenfand Andrew C. Peet*
ab
Received 24th November 2011, Accepted 16th March 2012
DOI: 10.1039/c2mb05485j
1H nuclear magnetic resonance spectroscopy (NMR) resonances from lipids in tumours are
associated with tumour grade and treatment response. The origin of these NMR signals is mainly
considered to be cytoplasmic lipid droplets (LDs). Techniques exist for isolating LDs but little is
known about their composition and its relationship to NMR signals. In this work,
density-gradient ultracentrifugation was performed on homogenised human cancer cells to isolate
LDs. 1H NMR was performed on whole cells, isolated LDs and their extracts. Heteronuclear
single quantum coherence spectroscopy (HSQC) and liquid chromatography mass spectroscopy
(LC-MS) were performed on lipid extracts of LDs. Staining and microscopy were used to
characterize isolated LDs. An excellent agreement in chemical shift and relative signal intensity
was observed between lipid resonances in cells and isolated LD spectra supporting that
NMR-visible lipids originate primarily from LDs. Isolated LDs showed high concentrations of
unsaturated lipids, a oleic-to-linoleic acid ratio greater than two and a cholesteryl ester (ChE)-to-
cholesterol (Ch) ratio close to unity. These ratios were several-fold greater than respective ratios
in whole cells, demonstrating isolation is important to characterize LD composition. LDs contain
a specific group of lipid species that are likely to contribute to the 1H NMR spectrum of cells.
Introduction
Proton nuclear magnetic resonance spectroscopy (NMR) allows
the direct detection and quantification of specific lipid species
in situ. The resonances of lipids have been observed in 1H NMR
spectra of cultured brain tumour cells and tissues both in vivo and
ex vivo. The origin of these lipid signals was first thought to be
from globular plasma membrane microdomains,1,2 but more
recent direct evidence suggests that the NMR signals are also
likely to be from mobile lipid droplets (LDs) in the cytoplasm.3–5
Initially, the function of these droplets was thought to be solely
the storage of excess fatty acids present in the cytoplasm.
However, recent research has revealed that LDs dynamically
interact with other cell compartments and participate in several
cellular processes such as membrane trafficking, lipolysis and
phospholipid recycling.6,7
The accumulation of intracellular LDs has been implicated
with important cellular processes such as proliferation, apoptosis
and necrosis.8–11 There is evidence showing the presence of LDs
in necrotic regions of brain tumours5,9 and hypoxic-necrotic
tumour stroma of a C6 glioma.12 It has been shown that
modifications of intracellular LDs are correlated with cell growth
and growth arrest.13 Many clinical studies have suggested that
the resonance signals from mobile lipids can be used as potential
markers in the differential diagnosis and grading of brain
tumours.14,15 These lipid signals may also be predictive of
treatment response.16 These findings associate LDs with the
cell cycle, malignancy and cell death and consequently are an
attractive topic for cancer research. The elucidation of their
composition and biochemical features is vital to the under-
standing of their function in these cell processes and may
provide novel information related to cell biology.
High resolution 1H NMR spectra of cell lipids can provide
information on the number and type of chemical entities of a
molecule and has been widely used in the analysis of lipid
structure and composition.17,18 The standard method to obtain
a Cancer Sciences, Institute of Child Health, University ofBirmingham, Whittall Street, Birmingham, B4 6NH, UK.E-mail: [email protected]; Fax: 0121-333-8241;Tel: 0121-333-8234
bDepartment of Oncology, Birmingham Children’s Hospital NHSFoundation Trust, Birmingham, UK
cDepartment of Histology, Birmingham Children’s Hospital NHSFoundation Trust, Birmingham, UK
dSchool of Electronic, Electrical and Computer Engineering,University of Birmingham, Birmingham, UK
eDepartment of Biochemistry, University of Cambridge, Cambridge,UK & MRC Human Nutrition Research, Cambridge, UK
fClinical Research and Imaging Centre and School of Psychology,University of Bristol, Bristol, UKw Electronic supplementary information (ESI) available. See DOI:10.1039/c2mb05485j
MolecularBioSystems
Dynamic Article Links
www.rsc.org/molecularbiosystems PAPER
Dow
nloa
ded
by U
nive
rsity
of
Oxf
ord
on 0
9 M
ay 2
012
Publ
ishe
d on
20
Apr
il 20
12 o
n ht
tp://
pubs
.rsc
.org
| do
i:10.
1039
/C2M
B05
485J
View Online / Journal Homepage / Table of Contents for this issue

This journal is c The Royal Society of Chemistry 2012 Mol. BioSyst., 2012, 8, 1694–1700 1695
high resolution NMR spectra of lipids from cells and tissue is
to perform a chemical extraction of the tissue prior to the
acquisition of data in the liquid state. The resonances of lipids
in NMR spectra from cell extracts are usually dominated by
membrane lipids which can mask the signals from sub-cellular
compartments, such as LDs. It is therefore desirable to isolate
the LDs in order to eliminate the signals from membrane
lipids. Isolation of LDs from human cell lines has been
performed previously.19 A commonly used method is density
gradient ultracentrifugation,20,21 but to the best of our knowledge,1HNMR analysis of isolated LDs from tumour cells has not been
reported earlier.
This paper presents the 1H NMR spectra acquired from
isolated LDs of a human neuroblastoma cell line, chemical
analyses of lipid using gas chromatography with mass spectro-
metry (GC-MS) and provides new insights to the investigation
of these highly dynamic organelles separated from tumour cells.
Methods
Cell culture and harvest
BE(2)M17, a human neuroblastoma cell line, was cultured in
75 cm2 flasks with filter-vented caps (IWAKI, UK) and
maintained in 20 ml Dulbecco’s modified Eagles medium
(DMEM F:12), without L-glutamine (GIBCO, Invitrogen
Corporation, UK) supplemented with 10% (v/v) foetal calf
serum (PAA, UK), 1% 200 mM L-glutamine (100x) (GIBCO,
Invitrogen Corporation, UK), and 1% MEM non-essential
amino acid solution (100x) (Sigma Aldrich, UK). The cells
were incubated at 37 1C in a humidified atmosphere (5% CO2,
95% air) and harvested at around 90% confluence. After
washing with 10 ml ice-cold phosphate buffered saline (Invitrogen
Ltd., Paisley, UK) 3 times, cells were then removed from the flask
using a 25 cm cell scraper (Corning, UK) and centrifuged at 250 g
for 6min to form a pellet. Samples to be investigated by NMR
spectroscopy were snap-frozen in liquid nitrogen and stored
at �80 1C.
High-resolution magic angle spinning NMR (HR-MAS)
Prior to HR-MAS, frozen cells were defrosted, and 36 ml,containing about 10 � 106 cells was pipetted into a wide-
mouthed zirconium oxide sample tube (Varian Inc, Palo Alto,
CA, USA); 4 mL 10 mmol L�1 trimethylsilylproprionate d4
(TSP) in D2O was added as a chemical shift standard. HR-MAS
was performed on a Varian 600-MHz (14.1 T) vertical bore
spectrometer using a 4 mm gHX nanoprobe (Varian NMR Inc)
with a three channel Inova console running VNMRj software.
The rotor temperature was 6.7 1C as determined by calibration
using methanol.22 A rotor speed of 2500 Hz was used for all
experiments. The pulse sequence used for lipid investigation
consisted of a single 901 pulse preceded by a 1s duration water
presaturation pulse. The receiver bandwidth was 7200 Hz with
16 K complex points in the free induction decay. A total of
256 averages were acquired with a repetition time of 3.3 s giving a
14 min acquisition time. Spectra were manually phased, referenced
to TSP at 0 ppm and normalised to the maximum point within the
chemical shift range of 0.8–0.9 ppm.
Isolation of LDs
A protocol developed by Weller and co-workers was used to
isolate LDs (17–19). Briefly, 40–60 million cells were ground in
600 ml deionised water or D2O using Dounce grinder (clearance
0.0005–0.0025 inch, Sigma Aldrich, UK) and the homogenate
was centrifuged at 2000 g at 4 1C for 10 min. The supernatant was
adjusted to 18.46% sucrose (600 ml in total), topped with the same
volume of deionised water or D2O and centrifuged at 142000 g
for 120 min at 4 1C (Optima TLX Ultracentrifuge, Beckman).
After ultracentrifugation, the sample was separated into three
fractions, the upper isolated fraction, the middle sucrose fraction
and the pellet. To control the sucrose contamination, only the top
300 ml of two preparations was combined into one sample for
subsequent NMR analyses.
Oil red O and haematoxylin staining
10 ml of the isolated fraction were aliquoted onto a microscopy
slide and dried overnight. Saturated Oil Red O (MERCK
KGaA, Darmstadt, Germany) in 70% ethanol was applied to
the slides for 20 min, and then washed in running water. After
haematoxylin staining, slides were mounted with aqueous
mounting medium and observed with a Nikon Eclipse E600
under 100X oil objective lens. Pictures were taken by a
DXM1200F digital camera.
Nile red and DAPI staining
Cells were spun and stained with 4 mg ml�1 Nile red in PBS
(made from 1 mg ml�1 Nile red stock solution in acetone,
Sigma-Aldrich, Dorset, UK) for about 15 min under dark
conditions. 10 ml of the isolated fraction were aliquoted onto a
slide, dried for 2 h and stained with 4 mg ml�1 Nile red in 70%
ethanol for about 15 min. After Nile red staining, cells were
stained with 0.4 ug/ml DAPI for 15 min. The slides were
visualized with a Nikon Eclipse E600 microscope using 100X
objective lens and images were taken using a DXM1200 digital
camera. The green fluorescence of Nile red was observed with
a FITC (B-2A) filter set, with excitation wave length of
465–495 nm and emission wave length 550 nm. DAPI UV
(UV-2A) filter with excitation wavelength of 340–380 nm was
used to detect DAPI stained nuclei. LD sizes were measured
using the image analysis program ImageJ (National Institute
of Health, USA) and presented as mean value � standard
deviation and distribution. The resolution limit of light microscopy
is 200 nm. An Inter Pixel Stepping (IPS) technique was used by the
camera (DXM1200 digital camera, Nikon) and ACT-1 software to
increase the resolution of captured images by a factor 9.
Transmission electron microscopy
The isolated LD fraction was dropped onto a 300 mesh copper
electron microscopy grid with formvar coating. A 2% aqueous
uranyl acetate solution was applied to the sample for 1 min.
After the staining, the grid was observed using JEOL 1200EX
TEM (Jeol Ltd, Tokyo, Japan) with 120 K amplification.
Lipid extraction
A dual phased methanol-chloroform extraction protocol was
used to prepare the lipids for NMR analysis23 from both cells
and isolated lipid droplets. For the cell extracts, 20–40 million
Dow
nloa
ded
by U
nive
rsity
of
Oxf
ord
on 0
9 M
ay 2
012
Publ
ishe
d on
20
Apr
il 20
12 o
n ht
tp://
pubs
.rsc
.org
| do
i:10.
1039
/C2M
B05
485J
View Online

1696 Mol. BioSyst., 2012, 8, 1694–1700 This journal is c The Royal Society of Chemistry 2012
cells were ground and sonicated in methanol (400 ml)/deionisedwater (85 ml). 200 ml chloroform was added to the homogenates
twice to form a dual-phase. For the isolated fraction, methanol
and chloroform was added directly into the sample. The lower
chloroform phase was collected and dried overnight in a fume
hood. At least three independent preparations were used for
isolation and extraction.
Liquid-state1H NMR spectroscopy
Lipid extracts were resuspended in 600 ml deuterated chloroform
containing 0.03% (v/v) TMS (Sigma Aldrich, Dorset, UK).1H-NMR spectra of cell extracts and the isolated LDs suspended
in D2Owere recorded on a Varian 600-MHz (14.1 T) vertical bore
spectrometer using a HCN probe. A standard pulse and acquire
sequence was used which consisted of a single 900 pulse preceded
by one second of water presaturation. The acquisition was of 16 K
complex points at a sampling frequency of 7200 Hz. All spectra
were manually phased, referenced to TSP at 0 ppm and normalised
to the maximum point within the range of 0.8–0.9 ppm. NMR
spectra were assigned with reference to the Human Metabolome
Database. Spectra were acquired from standards, including
phosphatidylcholine (P3556, sigma), triglyceride (D2157, sigma),
oleic acid (O1008, sigma) and linoleic acid (L1376, sigma) to
confirm the assignments.
HSQC
A phase-sensitive gradient enhanced 2D 1H-13C HSQC was
also performed on the lipid extracts on a Bruker DRX
500MHz spectrometer using a cryoprobe at 25 1C. 1024 points
were acquired in F2 for 256 increments in F1 domain with spectral
widths of 13 ppm and 166 ppm respectively. 144 averages were
acquired resulting in a total experiment time of approximately 17 h.
Data was zero-filled to twice the original length andmultiplied by a
sine function prior to Fourier transformation.
Characterisation of isolated LDs by mass spectrometry
Lipid extracts were dissolved in 200 ml of chloroform/methanol
(1 : 1 v/v): half was used for gas chromatography with flame-
ionization detector (GC-FID) analysis of total fatty acids and
half for liquid chromatography mass spectroscopy (LC-MS)
analysis of intact lipids. For the GC-FID analysis 50 ml of D-25
tridecanoic acid (200 mM in chloroform), 650 ml of chloroform/
methanol (1 : 1 v/v) and 250 ml BF3/methanol (Sigma-Aldrich)
was added to the extract and the vials were incubated at 80 1C
for 90 min. 500 ml H2O and 1 ml hexane were added and each
vial vortex mixed. The organic layer was evaporated to dryness
before reconstitution in 100 ml hexane for analysis. The deriva-tised organic metabolites were injected in a Focus gas chroma-
tography (GC) and the column eluent was introduced into a
flame-ionization detector (FID, Thermo Electron Corporation).
The column used was ZB-WAX (Phenomenex; 30 m� 0.25 mm
ID � 0.25 mm; 100% polyethylene glycol). The initial column
temperature was 60 1C and was held for 2 min. This was
increased by 15 1C min_1 to 150 1C then increased at a rate
of 3 1C min_1 to 230 1C. This final temperature was held for
10 min. Peaks were assigned using Food Industry FAME Mix
(Restek 6098) solution. Fatty acids are also assigned according
to retention time matching to reference FAME standards
(FAME standard mix, Fish oil FAME standard mix and
microbial FAME standard mix, Sigma-Aldrich).
For LC-MS 5 ml of each sample was analysed on a Waters
Q-Tof Ultima mass spectrometer combined with an Acquity
Ultra Performance Liquid Chromatography (HPLC). The
sample was injected onto a 1.7 mm bridged ethyl hybrid C8
column (2.1 � 100 mm; Waters Corporation) held at 65 1C.
The binary solvent system (flow rate 0.200 ml min�1) included
A. HPLC grade water (1% 1 M NH4Ac, 0.1% HCOOH) and
B. LC/MS grade acetonitrile/isopropanol 5 : 2 (1% 1 M
NH4Ac, 0.1% HCOOH). The gradient started from 65%
A/35% B, reached 100% B in 6 min and remained there for
the next 7 min. The data was collected over the mass range of
m/z 100–1400 with a scan duration of 0.5 s and an interscan
delay of 0.1 s. The source temperature was set at 100 1C and
nitrogen was used as desolvation gas (600 L h�1) at 300 1C.
The voltages of the sampling cone and capillary were 40 V and
3 kV, respectively and collision energy 5 V. Reserpine (50 mg L�1)was used as the lock spray reference compound (10 ml min�1; 10 s
scan frequency).
To assign the lipid species present, a representative sample
for each strain was analysed by tandem mass spectrometry
(MS/MS). MS/MS runs were performed using ESI+ mode
and collision energies of 18, 20, 24, 30 V and a mass range of
80 to 1100 m/z. Other conditions were as described above.
Statistical analyses
Data on diameter of LDs are presented as mean � STD, the
range of maximum and minimum and the number of measured
LDs. Student’s t-test was performed as whole cell lipids versus
isolated LDs.
Results
LDs from BE(2)M17 cells
Nile red staining (Fig. 1A) illustrated that there were a
considerable number of cytoplasmic LDs inside the cells,
which tended to localise near to the cell membrane. The bars
represent 10 mm in Fig. 1A–C and 100 nm in Fig. 1D. The
mean diameter of these LDs with Nile red staining (Fig. 1B)
inside BE(2)M17 cells was 0.23 � 0.14 mm (1.55–0.12 mm, n =
257) whereas in the isolated fraction it was 0.22 � 0.17 mm(1.23–0.10 mm, n=79). The diameter of isolated LDs with Oil red
O staining (Fig. 1c) was 0.22 � 0.05 mm (0.47–0.17 mm, n = 52).
The diameter of BE(2)M17 cells was approximately 10 to 20 mm.
Membranes can be visualised with Oil red O and haematoxylin
staining, appearing as annular structures easily distinguishable
from LDs. Fig. 1C and S1 shows membrane structures were
absent from the isolated fraction and the middle sucrose fraction
although they could be visualized in other fractions. In addition,
the transmission electronmicroscopy (Fig. 1D) shows the existence
of LDs and the absence of membrane structures in the isolated
fraction, in accordance with Fig. 1C.
1H NMR spectra of lipids
Fig. 2 shows the liquid-state 1H NMR spectrum acquired
directly from the isolated LDs together with the HR-MAS
spectrum of intact cells. The region between 0.5 ppm to 3.5 ppm
Dow
nloa
ded
by U
nive
rsity
of
Oxf
ord
on 0
9 M
ay 2
012
Publ
ishe
d on
20
Apr
il 20
12 o
n ht
tp://
pubs
.rsc
.org
| do
i:10.
1039
/C2M
B05
485J
View Online

This journal is c The Royal Society of Chemistry 2012 Mol. BioSyst., 2012, 8, 1694–1700 1697
has been plotted to exclude signals from sucrose. Metabolites and
lipid peaks were observed in both spectra and the lipid peaks
were assigned according to previously published values.3,24 An
attempt was also made to remove sucrose, which gives large
number of NMR peaks around 3.5–5.5 ppm, using dialysis and
ultrafiltration, but the concentration of LDs was not high enough
for detection of lipid resonances in the 1HNMR spectrum due to
the breakdown and loss of LDs in the processes.
Fig. 3 shows the liquid-state 1H NMR spectra from lipid
extracts in CDCl3 of (A) isolated LDs and (B) whole cells. A
HR-MAS spectrum from intact cells is also shown for comparison.
Chemical shifts of the peaks were found to be consistent with those
given in the literature24–26 and assignments were made accordingly
(Table 1). Lipid peaks are better resolved in the liquid state spectra
allowing the assignment of molecules such as cholesterol (Ch) and
cholesterol ester (ChE). Some shifts in peak positions were evident
as compared with the HR-MAS data, an effect that is due to
different solvents and experimental conditions. The residual
water peak exhibits a larger shift from around 4.95 ppm in the
HR-MAS to 1.6–1.7 ppm in the extracted samples, which is
primarily due to solvent differences.
Fig. 4 shows an expansion of the three spectra showing a
clear separation between the ChE and Ch peaks at 1.01 and
0.99 ppm.18 A higher ChE-to-Ch ratio was present in the
isolated LDs (1.25 � 0.54, n = 3) compared to the whole cell
extract (0.22 � 0.03, n = 3) and there is a statistically
significant difference between the two groups (p o 0.05).
Some more prominent singlet peaks at 1.28, 1.33 and
2.17 ppm in the isolated fraction extracts were observed relative
to the whole cell extracts (Fig. 4A and B). In HR-MAS data
(Fig. 4C) these peaks are not observed, as they merged with
near co-resonant metabolites.
HSQC spectra of extracted lipids
Fig. 5 shows the 5.45 to 5.25 ppm region of the 500 MHz
HSQC (1H and 13C) spectra of the lipid extracts from isolated
LDs and whole cells. The double bond protons of unsaturated
fatty acids which were all superimposed at 5.3–5.4 ppm in 1D
proton spectra (Fig. 3) were separated into distinguishable
signals and were assigned to oleic acid (18 : 1) and linoleic acid
(18 : 2) according to HSQC experiments using oleic acid and
linoleic acid standards (Fig. S2). The 2D spectra were manu-
ally processed and the signal intensity was measured using
standard Bruker software. The double bond protons in linoleic
acid give two signals with an equal intensity at the 5.4 ppm
region which makes it possible to estimate the ratio of these
two unsaturated fatty acids. The oleic-to-linoleic acid ratio
was 1 : 0.42 in isolated LDs and 1 : 4 in whole cell lipids. These
Fig. 1 Nile red and DAPI staining (A) of BE(2)M17 cells, Nile red
staining (B), Oil red O and haematoxylin staining (C) and Negative
staining followed by TEM (D) of the isolated fraction.
Fig. 2 A: Liquid-state 1H NMR spectrum from the isolated lipid
droplet fraction and B: HR-MAS spectrum from intact cells. Struc-
tural assignments are made with the potential parent molecules listed
in brackets: 1 CH3(Ch,ChE) at 0.7 ppm, 2 CH3(L,Ch) at 0.9 ppm,
3 CH3(Ch,ChE),CH2(Ch,ChE) at1.0 ppm 4 CH2(L,Ch) at 1.2–1.3 ppm,
5 CH2CH2CO(L) at 1.6 ppm, 6 CH2CH = CH(L) at 2.0 ppm,
7 CH2COO(L) at 2.3 ppm, 8 = CHCH2CH= at 2.8 ppm, 9 N(CH3)3(PC) at 3.3 ppm Ch, cholesterol; ChE, cholesteryl ester; L, lipid; PC,
phosphatidylcholine.
Fig. 3 Liquid-state 1H NMR spectra vertically scaled to the resonance
intensity at 0.9 ppm of the chloroform component from a methanol
chloroform extraction of A: the isolated lipid droplet fraction and B:
whole cells. C: the HR-MAS spectrum from intact cells is given for
comparison. Structural assignments are made with the possible parent
molecules listed in brackets: 1 CH3(Ch,ChE) at 0.7 ppm, 2 CH3(L,Ch)
at 0.9 ppm, 3 CH3(Ch,ChE),CH2(Ch,ChE) at 1.0 ppm 4 CH2(L,Ch) at
1.2–1.3 ppm, 5 CH2CH2CO(L) at 1.6 ppm, 6 CH2CH = CH(L) at
2.0 ppm, 7 CH2COO(L) at 2.3 ppm, 8 =CHCH2CH= at 2.8 ppm,
9 N(CH3)3 (PtdCho) at 3.3–3.4 ppm, 10 CH2OCOR,CH2OPO2 at
4.0–4.5 ppm, 11 CHOCOR(L) at 5.2 ppm, 12 HC = CH(L,Ch) at
5.4 ppm, 13 H2O. Ch, cholesterol; ChE, cholesteryl ester; Cho, choline
residue; L, lipid; PC, phosphatidylcholine.
Dow
nloa
ded
by U
nive
rsity
of
Oxf
ord
on 0
9 M
ay 2
012
Publ
ishe
d on
20
Apr
il 20
12 o
n ht
tp://
pubs
.rsc
.org
| do
i:10.
1039
/C2M
B05
485J
View Online
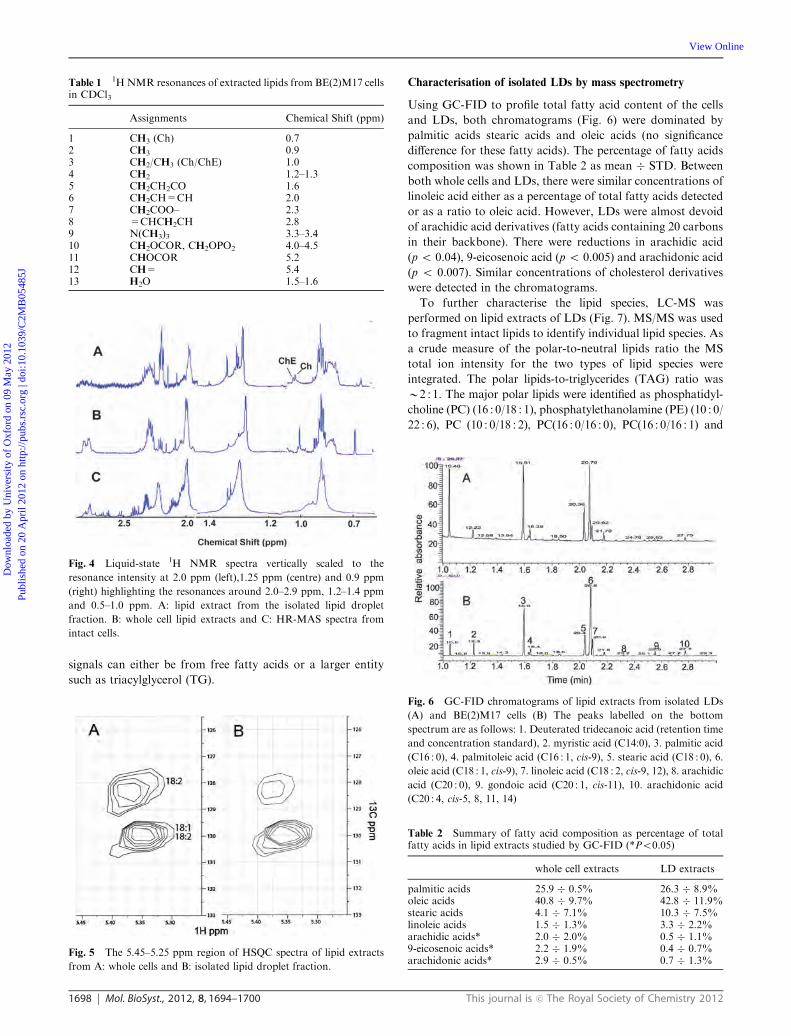
1698 Mol. BioSyst., 2012, 8, 1694–1700 This journal is c The Royal Society of Chemistry 2012
signals can either be from free fatty acids or a larger entity
such as triacylglycerol (TG).
Characterisation of isolated LDs by mass spectrometry
Using GC-FID to profile total fatty acid content of the cells
and LDs, both chromatograms (Fig. 6) were dominated by
palmitic acids stearic acids and oleic acids (no significance
difference for these fatty acids). The percentage of fatty acids
composition was shown in Table 2 as mean � STD. Between
both whole cells and LDs, there were similar concentrations of
linoleic acid either as a percentage of total fatty acids detected
or as a ratio to oleic acid. However, LDs were almost devoid
of arachidic acid derivatives (fatty acids containing 20 carbons
in their backbone). There were reductions in arachidic acid
(p o 0.04), 9-eicosenoic acid (p o 0.005) and arachidonic acid
(p o 0.007). Similar concentrations of cholesterol derivatives
were detected in the chromatograms.
To further characterise the lipid species, LC-MS was
performed on lipid extracts of LDs (Fig. 7). MS/MS was used
to fragment intact lipids to identify individual lipid species. As
a crude measure of the polar-to-neutral lipids ratio the MS
total ion intensity for the two types of lipid species were
integrated. The polar lipids-to-triglycerides (TAG) ratio was
B2 : 1. The major polar lipids were identified as phosphatidyl-
choline (PC) (16 : 0/18 : 1), phosphatylethanolamine (PE) (10 : 0/
22 : 6), PC (10 : 0/18 : 2), PC(16 : 0/16 : 0), PC(16 : 0/16 : 1) and
Fig. 4 Liquid-state 1H NMR spectra vertically scaled to the
resonance intensity at 2.0 ppm (left),1.25 ppm (centre) and 0.9 ppm
(right) highlighting the resonances around 2.0–2.9 ppm, 1.2–1.4 ppm
and 0.5–1.0 ppm. A: lipid extract from the isolated lipid droplet
fraction. B: whole cell lipid extracts and C: HR-MAS spectra from
intact cells.
Fig. 5 The 5.45–5.25 ppm region of HSQC spectra of lipid extracts
from A: whole cells and B: isolated lipid droplet fraction.
Fig. 6 GC-FID chromatograms of lipid extracts from isolated LDs
(A) and BE(2)M17 cells (B) The peaks labelled on the bottom
spectrum are as follows: 1. Deuterated tridecanoic acid (retention time
and concentration standard), 2. myristic acid (C14:0), 3. palmitic acid
(C16 : 0), 4. palmitoleic acid (C16 : 1, cis-9), 5. stearic acid (C18 : 0), 6.
oleic acid (C18 : 1, cis-9), 7. linoleic acid (C18 : 2, cis-9, 12), 8. arachidic
acid (C20 : 0), 9. gondoic acid (C20 : 1, cis-11), 10. arachidonic acid
(C20 : 4, cis-5, 8, 11, 14)
Table 1 1H NMR resonances of extracted lipids from BE(2)M17 cellsin CDCl3
Assignments Chemical Shift (ppm)
1 CH3 (Ch) 0.72 CH3 0.93 CH2/CH3 (Ch/ChE) 1.04 CH2 1.2–1.35 CH2CH2CO 1.66 CH2CH=CH 2.07 CH2COO– 2.38 =CHCH2CH 2.89 N(CH3)3 3.3–3.410 CH2OCOR, CH2OPO2 4.0–4.511 CHOCOR 5.212 CH= 5.413 H2O 1.5–1.6
Table 2 Summary of fatty acid composition as percentage of totalfatty acids in lipid extracts studied by GC-FID (*Po0.05)
whole cell extracts LD extracts
palmitic acids 25.9 � 0.5% 26.3 � 8.9%oleic acids 40.8 � 9.7% 42.8 � 11.9%stearic acids 4.1 � 7.1% 10.3 � 7.5%linoleic acids 1.5 � 1.3% 3.3 � 2.2%arachidic acids* 2.0 � 2.0% 0.5 � 1.1%9-eicosenoic acids* 2.2 � 1.9% 0.4 � 0.7%arachidonic acids* 2.9 � 0.5% 0.7 � 1.3%
Dow
nloa
ded
by U
nive
rsity
of
Oxf
ord
on 0
9 M
ay 2
012
Publ
ishe
d on
20
Apr
il 20
12 o
n ht
tp://
pubs
.rsc
.org
| do
i:10.
1039
/C2M
B05
485J
View Online
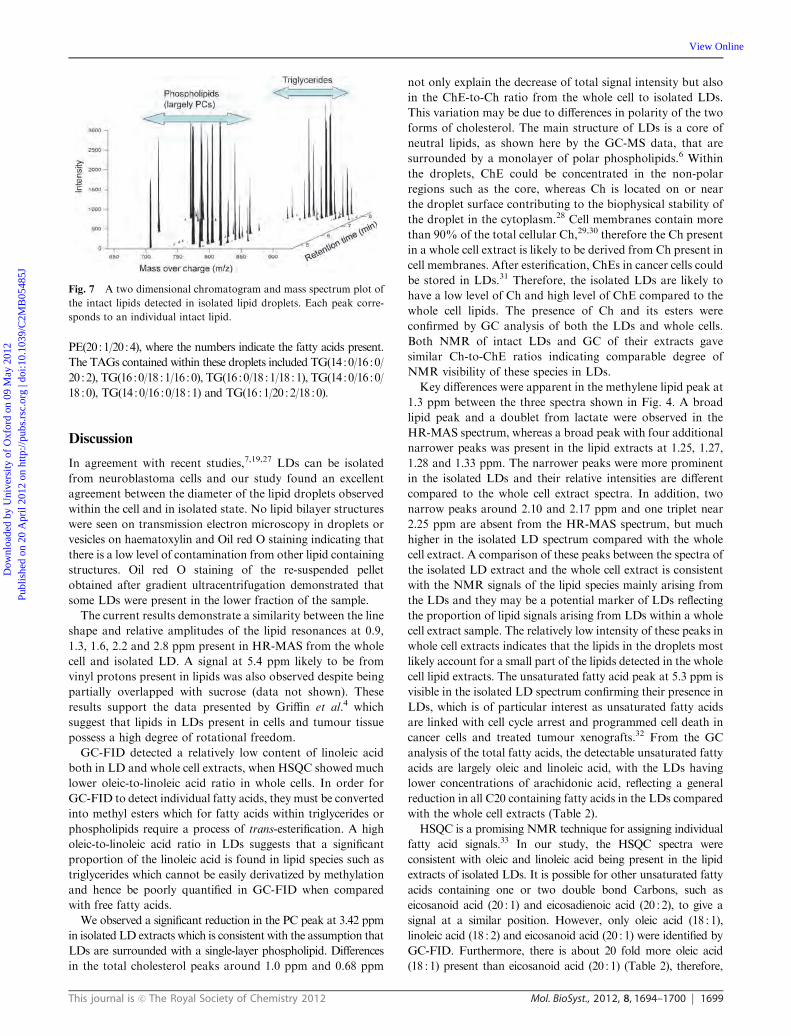
This journal is c The Royal Society of Chemistry 2012 Mol. BioSyst., 2012, 8, 1694–1700 1699
PE(20 :1/20 :4), where the numbers indicate the fatty acids present.
The TAGs contained within these droplets included TG(14 :0/16 :0/
20 :2), TG(16 :0/18 :1/16 :0), TG(16 :0/18 :1/18 :1), TG(14 :0/16 :0/
18 :0), TG(14 :0/16 :0/18 :1) and TG(16 :1/20 :2/18 :0).
Discussion
In agreement with recent studies,7,19,27 LDs can be isolated
from neuroblastoma cells and our study found an excellent
agreement between the diameter of the lipid droplets observed
within the cell and in isolated state. No lipid bilayer structures
were seen on transmission electron microscopy in droplets or
vesicles on haematoxylin and Oil red O staining indicating that
there is a low level of contamination from other lipid containing
structures. Oil red O staining of the re-suspended pellet
obtained after gradient ultracentrifugation demonstrated that
some LDs were present in the lower fraction of the sample.
The current results demonstrate a similarity between the line
shape and relative amplitudes of the lipid resonances at 0.9,
1.3, 1.6, 2.2 and 2.8 ppm present in HR-MAS from the whole
cell and isolated LD. A signal at 5.4 ppm likely to be from
vinyl protons present in lipids was also observed despite being
partially overlapped with sucrose (data not shown). These
results support the data presented by Griffin et al.4 which
suggest that lipids in LDs present in cells and tumour tissue
possess a high degree of rotational freedom.
GC-FID detected a relatively low content of linoleic acid
both in LD and whole cell extracts, when HSQC showed much
lower oleic-to-linoleic acid ratio in whole cells. In order for
GC-FID to detect individual fatty acids, they must be converted
into methyl esters which for fatty acids within triglycerides or
phospholipids require a process of trans-esterification. A high
oleic-to-linoleic acid ratio in LDs suggests that a significant
proportion of the linoleic acid is found in lipid species such as
triglycerides which cannot be easily derivatized by methylation
and hence be poorly quantified in GC-FID when compared
with free fatty acids.
We observed a significant reduction in the PC peak at 3.42 ppm
in isolated LD extracts which is consistent with the assumption that
LDs are surrounded with a single-layer phospholipid. Differences
in the total cholesterol peaks around 1.0 ppm and 0.68 ppm
not only explain the decrease of total signal intensity but also
in the ChE-to-Ch ratio from the whole cell to isolated LDs.
This variation may be due to differences in polarity of the two
forms of cholesterol. The main structure of LDs is a core of
neutral lipids, as shown here by the GC-MS data, that are
surrounded by a monolayer of polar phospholipids.6 Within
the droplets, ChE could be concentrated in the non-polar
regions such as the core, whereas Ch is located on or near
the droplet surface contributing to the biophysical stability of
the droplet in the cytoplasm.28 Cell membranes contain more
than 90% of the total cellular Ch,29,30 therefore the Ch present
in a whole cell extract is likely to be derived from Ch present in
cell membranes. After esterification, ChEs in cancer cells could
be stored in LDs.31 Therefore, the isolated LDs are likely to
have a low level of Ch and high level of ChE compared to the
whole cell lipids. The presence of Ch and its esters were
confirmed by GC analysis of both the LDs and whole cells.
Both NMR of intact LDs and GC of their extracts gave
similar Ch-to-ChE ratios indicating comparable degree of
NMR visibility of these species in LDs.
Key differences were apparent in the methylene lipid peak at
1.3 ppm between the three spectra shown in Fig. 4. A broad
lipid peak and a doublet from lactate were observed in the
HR-MAS spectrum, whereas a broad peak with four additional
narrower peaks was present in the lipid extracts at 1.25, 1.27,
1.28 and 1.33 ppm. The narrower peaks were more prominent
in the isolated LDs and their relative intensities are different
compared to the whole cell extract spectra. In addition, two
narrow peaks around 2.10 and 2.17 ppm and one triplet near
2.25 ppm are absent from the HR-MAS spectrum, but much
higher in the isolated LD spectrum compared with the whole
cell extract. A comparison of these peaks between the spectra of
the isolated LD extract and the whole cell extract is consistent
with the NMR signals of the lipid species mainly arising from
the LDs and they may be a potential marker of LDs reflecting
the proportion of lipid signals arising from LDs within a whole
cell extract sample. The relatively low intensity of these peaks in
whole cell extracts indicates that the lipids in the droplets most
likely account for a small part of the lipids detected in the whole
cell lipid extracts. The unsaturated fatty acid peak at 5.3 ppm is
visible in the isolated LD spectrum confirming their presence in
LDs, which is of particular interest as unsaturated fatty acids
are linked with cell cycle arrest and programmed cell death in
cancer cells and treated tumour xenografts.32 From the GC
analysis of the total fatty acids, the detectable unsaturated fatty
acids are largely oleic and linoleic acid, with the LDs having
lower concentrations of arachidonic acid, reflecting a general
reduction in all C20 containing fatty acids in the LDs compared
with the whole cell extracts (Table 2).
HSQC is a promising NMR technique for assigning individual
fatty acid signals.33 In our study, the HSQC spectra were
consistent with oleic and linoleic acid being present in the lipid
extracts of isolated LDs. It is possible for other unsaturated fatty
acids containing one or two double bond Carbons, such as
eicosanoid acid (20 : 1) and eicosadienoic acid (20 : 2), to give a
signal at a similar position. However, only oleic acid (18 : 1),
linoleic acid (18 : 2) and eicosanoid acid (20 : 1) were identified by
GC-FID. Furthermore, there is about 20 fold more oleic acid
(18 : 1) present than eicosanoid acid (20 : 1) (Table 2), therefore,
Fig. 7 A two dimensional chromatogram and mass spectrum plot of
the intact lipids detected in isolated lipid droplets. Each peak corre-
sponds to an individual intact lipid.
Dow
nloa
ded
by U
nive
rsity
of
Oxf
ord
on 0
9 M
ay 2
012
Publ
ishe
d on
20
Apr
il 20
12 o
n ht
tp://
pubs
.rsc
.org
| do
i:10.
1039
/C2M
B05
485J
View Online

1700 Mol. BioSyst., 2012, 8, 1694–1700 This journal is c The Royal Society of Chemistry 2012
these HSQC signals are most likely predominated by oleic acid
and linoleic acid. Palmitic acid (16 : 0) and stearic acid (18 : 0),
oleic acid (18 : 1) and linoleic acid (18 : 2) are all common to
membrane and storage lipids in the human body and the
membrane lipids contain a much higher proportion of poly-
unsaturated fatty acids (PUFAs).34 This is consistent with the
finding that the linoleic acid, an n-6 PUFA, is present at an
almost 10 times lower concentration in LDs than in whole cell
lipid extracts relative to oleic acids. A high level of 16 : 0, 18 : 0
and 18 : 1 was confirmed by LC-MS.
In conclusion, the lipid resonances in the HR-MAS of
BE(2)M17 cells are consistent with the NMR spectra of their
isolated LDs, which supports that NMR visible lipid resonances
originate primarily from LDs. Analysis using 1H NMR and
LC-MS revealed a number of similarities between the isolated
LDs and the whole cell preparations, particularly in terms of the
presence of unsaturated lipids. However, differences were also
detected, in particular a large dissimilarity was seen in the ratio
between the ChE and Ch peaks in lipid extracts studies.
Acknowledgements
NMR experiments were carried out in the Henry Wellcome
Building for Biomolecular NMR Spectroscopy at the University
of Birmingham and we are grateful for the support of the staff at
this facility. The work was partly funded by the Medical
Research Council, UK (Grant G0601327), and the Andrew
McCartney Trust Fund for Brain Tumour Research.
References
1 C. E. Mountford and L. C. Wright, Trends Biochem. Sci., 1988, 13,172–177.
2 A. Ferretti, A. Knijn, C. Raggi and M. Sargiacomo, Eur Biophys J,2003, 32, 83–95.
3 J. M. Hakumaki and R. A. Kauppinen, Trends Biochem. Sci.,2000, 25, 357–362.
4 J. L. Griffin, K. K. Lehtimaki, P. K. Valonen, O. H. Grohn,M. I. Kettunen, S. Yla-Herttuala, A. Pitkanen, J. K. Nicholsonand R. A. Kauppinen, Cancer Res, 2003, 63, 3195–3201.
5 C. Remy, N. Fouilhe, I. Barba, E. Sam-Lai, H. Lahrech,M.-G. Cucurella, M. Izquierdo, A. Moreno, A. Ziegler,R. Massarelli, M. Decorps and C. Arus, Cancer Res, 1997, 57,407–414.
6 S. Martin and R. G. Parton, Nat. Rev. Mol. Cell Biol., 2006, 7,373–378.
7 P. Liu, Y. Ying, Y. Zhao, D. I. Mundy, M. Zhu andR. G. Anderson, J. Biol. Chem., 2004, 279, 3787–3792.
8 H. S. Finstad, C. A. Drevon, M. A. Kulseth, A. V. Synstad,E. Knudsen and S. O. Kolset, Biochem J, 1998, 336(Pt 2), 451–459.
9 K. S. Opstad, B. A. Bell, J. R. Griffiths and F. A. Howe, NMRBiomed., 2008, 21, 677–685.
10 I. Barba, M. E. Cabanas and C. Arus, Cancer Res, 1999, 59,1861–1868.
11 C. M. Coffey, A. Sheh, I. S. Kim, K. Chandran, M. L. Nibert andJ. S. Parker, J. Virol., 2006, 80, 8422–8438.
12 S. Zoula, P. F. Rijken, J. P. Peters, R. Farion, B. P. Van derSanden, A. J. Van der Kogel, M. Decorps and C. Remy, Br. J.Cancer, 2003, 88, 1439–1444.
13 M. Quintero, M. E. Cabanas and C. Arus, Biochim. Biophys. Acta,Mol. Cell Biol. Lipids, 2007, 1771, 31.
14 Z. G. Qi, Y. X. Li, Y. Wang, D. Y. Geng, K. C. Li, T. Z. Shen andX. R. Chen, Chin Med J (Engl), 2008, 121, 2415–2419.
15 A. C. Kuesel, G. R. Sutherland, W. Halliday and I. C. P. Smith,NMR Biomed., 1994, 7, 149.
16 A. Laprie, A. Pirzkall, D. A. Haas-Kogan, S. Cha, A. Banerjee,T. P. Le, Y. Lu, S. Nelson and T. R. McKnight, Int. J. Radiat.Oncol., Biol., Phys., 2005, 62, 20–31.
17 V. Tugnoli, G. Bottura, G. Fini, A. Reggiani, A. Tinti,A. Trinchero and M. R. Tosi, Biopolymers, 2003, 72, 86–95.
18 V. Tugnoli, M. R. Tosi, A. Tinti, A. Trinchero, G. Bottura andG. Fini, Biopolymers, 2001, 62, 297–306.
19 P. F. Weller, R. A. Monahan-Earley, H. F. Dvorak andA. M. Dvorak, Am J Pathol, 1991, 138, 141–148.
20 S. Miura, J. W. Gan, J. Brzostowski, M. J. Parisi, C. J. Schultz,C. Londos, B. Oliver and A. R. Kimmel, J. Biol. Chem., 2002, 277,32253–32257.
21 W. Yu, J. Cassara and P. F. Weller, Blood, 2000, 95, 1078–1085.22 Q. Teng, Springer Science, 2005, ch. 4.3.1.23 H. Wu, A. D. Southam, A. Hines andM. R. Viant, Anal. Biochem.,
2008, 372, 204–212.24 M. Gottschalk, G. Ivanova, D. M. Collins, A. Eustace, O. C. R
and D. F. Brougham, NMR Biomed., 2008, 21, 809–819.25 M. R. Tosi and V. Tugnoli, Clin. Chim. Acta, 2005, 359, 27–45.26 J. L. Griffin, K. K. Lehtimaki, P. K. Valonen, O. H. J. Grohn,
M. I. Kettunen, S. Yla-Herttuala, A. Pitkanen, J. K. Nicholsonand R. A. Kauppinen, Cancer Research, 2003, 63, 3195–3201.
27 K. Tauchi-Sato, S. Ozeki, T. Houjou, R. Taguchi and T. Fujimoto,J. Biol. Chem., 2002, 277, 44507–44512.
28 L. F. Hood and S. Patton, J. Dairy Sci., 1973, 56, 858–863.29 P. Goluszko and B. Nowicki, Infect. Immun., 2005, 73, 7791–7796.30 Y. Lange, J. Ye, M. Rigney and T. L. Steck, J Lipid Res, 1999, 40,
2264–2270.31 S. Martin and R. G. Parton, Semin. Cell Dev. Biol., 2005, 16,
163–174.32 J. M. Hakumaki, H. Poptani, A. M. Sandmair, S. Yla-Herttuala
and R. A. Kauppinen, Nat. Med., 1999, 5, 1323–1327.33 Y. A. Tesiram, D. Saunders and R. A. Towner, NMR Biomed.,
2008, 21, 345–356.34 M. J. Gibney, (A John Wiley & Sons, Ltd., Publication), 2009.
Dow
nloa
ded
by U
nive
rsity
of
Oxf
ord
on 0
9 M
ay 2
012
Publ
ishe
d on
20
Apr
il 20
12 o
n ht
tp://
pubs
.rsc
.org
| do
i:10.
1039
/C2M
B05
485J
View Online
The following two articles have been removed from the electronic copy of this thesis due to copyright restrictions.
2012 The size of cytoplasmic lipid droplets varies between tumour cell lines of the nervous
system and can be probed by the 1H NMR lipid signal.
Xiaoyan Pan, Martin Wilson, Carmel McConville, Theodoros N Arvanitis, Risto A
Kauppinen and Andrew C Peet Magnetic Resonance Materials in Physics, Biology and
Medicine
2011 An in vitro metabonomic study detects increases in UDP-GlcNAc and UDP-GalNAc, as
early phase markers of cisplatin treatment response in brain tumour cells, X. Pan, M. Wilson,
L. Mirbahai, C. McConville, T. N. Arvanitis, J.L. Griffin, R. A. Kauppinen and and A.C.
Peet, Journal of Proteome Research