Embed Size (px)
Citation preview
Liquefaction Vulnerability Study:
Lower Wairau Plains
Prepared for:
Marlborough District Council
Prepared by:
Omer Atlaf, Liam Wotherspoon, Rolando Orense
University of Auckland
Version 1.0
May 2021
i
SUMMARY
This report summarises the development of liquefaction vulnerability maps for the Lower
Wairau Plains in Marlborough based on the ‘Planning and engineering guidance for potentially
liquefaction-prone land’ (MBIE/MfE/EQC 2017). The methodology and datasets that were used
are summarised in this report and a suite of maps of liquefaction vulnerability categories
presented.
Data availability defined the level of assessment detail that was appropriate across the region
based on the guidance. At the highest level, this was based on geological, groundwater and
seismic hazard data. Geomorphological and basin groundwater geological models were used
to further refine this high-level assessment.
The most detailed assessment was based on a cone penetration test (CPT) dataset, and in
combination with the seismic hazard and groundwater data provided a quantitative liquefaction
assessment for a range of earthquake shaking return period scenarios. Due to the low density
of CPT soundings across the region, this approach could not be used to provide more refined
liquefaction vulnerability categories. For geomorphic zones where CPT data was available,
potential classifications if additional investigations were undertaken are discussed.
Liquefaction vulnerability category maps for Level A and Level B assessments are presented.
The age of deposits across the Wairau Plains and the relatively shallow depth to groundwater
means much of the area is classified as Liquefaction damage is possible. The surrounding hills
are classified as Very low liquefaction vulnerability and areas with deeper groundwater along
the edge of the plains are classified as Liquefaction damage is unlikely. The changes in
classification between Level A and B are discussed, in particular, the areas where the
liquefaction vulnerability of the soil profile is likely dominated by the performance of gravels
and where the profile is dominated by the performance of sand and silt deposits. Some alluvial
deposits in the plains dominated by gravel are classified as Low liquefaction vulnerability, with
investigations in this area suggesting an absence of loose sandy deposits. Combining these
multiple approaches, regional liquefaction-induced ground damage maps are developed for the
Lower Wairau Plains for different levels of investigation detail.
ii
TABLE OF CONTENTS
Summary ..................................................................................................................................... i
Table of Contents ....................................................................................................................... ii
1 Introduction ........................................................................................................................ 1
1.1 Scope of work.............................................................................................................. 1
2 Methodology ....................................................................................................................... 3
2.1 Level A assessment ..................................................................................................... 6
2.2 Level B assessment ..................................................................................................... 7
2.3 Level C assessment ..................................................................................................... 7
3 Ground Conditions ............................................................................................................. 9
3.1 Geology ....................................................................................................................... 9
3.2 Geomorphology ......................................................................................................... 10
3.2.1 Rapaura Formation............................................................................................. 10
3.2.2 Dillions Point Formation.................................................................................... 12
3.2.3 Speargrass Formation......................................................................................... 13
3.2.4 Hillersden Gravel ............................................................................................... 13
3.2.5 Colluvium deposits ............................................................................................ 13
3.2.6 Marlborough Schist ............................................................................................ 13
3.3 Groundwater .............................................................................................................. 15
4 Seismic Hazard ................................................................................................................. 17
5 Observations from 2016 Kaikōura Earthquake ................................................................ 20
6 Basic Desktop Assessment ............................................................................................... 22
7 Level B Liquefaction Vulnerabilty Assessment ............................................................... 26
7.1 Geomorphology-based screening .............................................................................. 26
7.1.1 Lower elevation overbank gravel, Sand and silt flood plains ............................ 27
7.1.2 Active floodplain alluivial gravel, sand and silt ................................................ 27
7.1.3 Mid-elevation overbank gravel, sand and silt .................................................... 27
7.1.4 Higher elevation overbank gravel, sand and silt ................................................ 28
7.1.5 Alluvial fan gravel, sand and silt ....................................................................... 28
7.1.6 Proximal alluvial gravel, sand and silt ............................................................... 28
7.1.7 Paleo-channels ................................................................................................... 28
7.1.8 Swamps .............................................................................................................. 28
7.1.9 Recent alluvial deposits ..................................................................................... 29
iii
7.1.10 Lagoon deposits ................................................................................................. 29
7.1.11 Beach ridges ....................................................................................................... 29
7.1.12 Other deposits: ................................................................................................... 30
7.1.13 Summary of geomorphological screening ......................................................... 30
7.2 Basin geological model ............................................................................................. 34
7.3 Geotechnical investigation data screening ................................................................ 38
7.3.1 Mid-elevation overbank gravel, sand and silt .................................................... 40
7.3.2 High-elevation overbank gravel, sand and silt ................................................... 41
7.3.3 Recent alluvial gravel, sand and silt .................................................................. 42
7.3.4 Speargrass Formation glacial outwash gravel, sand and silt.............................. 43
7.3.5 Alluvial fan gravel, sand and silt ....................................................................... 44
7.4 Summary ................................................................................................................... 46
8 CPT-based Assessment..................................................................................................... 51
8.1 Paleochannels with alluvial sand and silt .................................................................. 56
8.2 Proximal alluvial gravel, sand, and silt ..................................................................... 57
8.3 Low elevation overbank sand and silt ....................................................................... 58
8.4 Mid elevation overbank gravel, sand and silt ............................................................ 60
8.5 Recent alluvial sand and silt ...................................................................................... 62
8.6 Regional scenario maps ............................................................................................. 64
8.7 Summary ................................................................................................................... 69
9 Lateral spreading vulnerabilty .......................................................................................... 70
10 References ..................................................................................................................... 72
Appendix A .............................................................................................................................. 75
Explanation of assigning precise categories following Level B assessment (extracted from
MBIE/MfE/EQC 2017) ......................................................................................................... 75
Appendix B .............................................................................................................................. 76
Details of different degrees of liquefaction-induced ground damage .................................. 76
1
1 INTRODUCTION
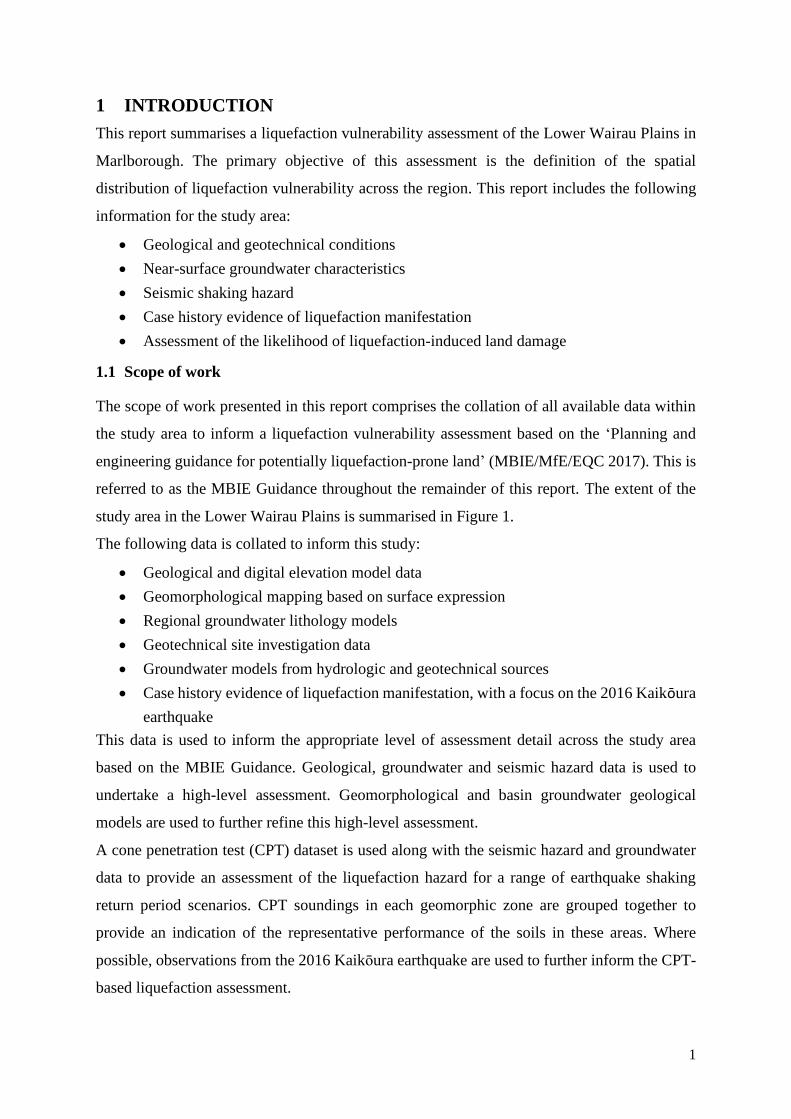
This report summarises a liquefaction vulnerability assessment of the Lower Wairau Plains in
Marlborough. The primary objective of this assessment is the definition of the spatial
distribution of liquefaction vulnerability across the region. This report includes the following
information for the study area:
• Geological and geotechnical conditions
• Near-surface groundwater characteristics
• Seismic shaking hazard
• Case history evidence of liquefaction manifestation
• Assessment of the likelihood of liquefaction-induced land damage
1.1 Scope of work
The scope of work presented in this report comprises the collation of all available data within
the study area to inform a liquefaction vulnerability assessment based on the ‘Planning and
engineering guidance for potentially liquefaction-prone land’ (MBIE/MfE/EQC 2017). This is
referred to as the MBIE Guidance throughout the remainder of this report. The extent of the
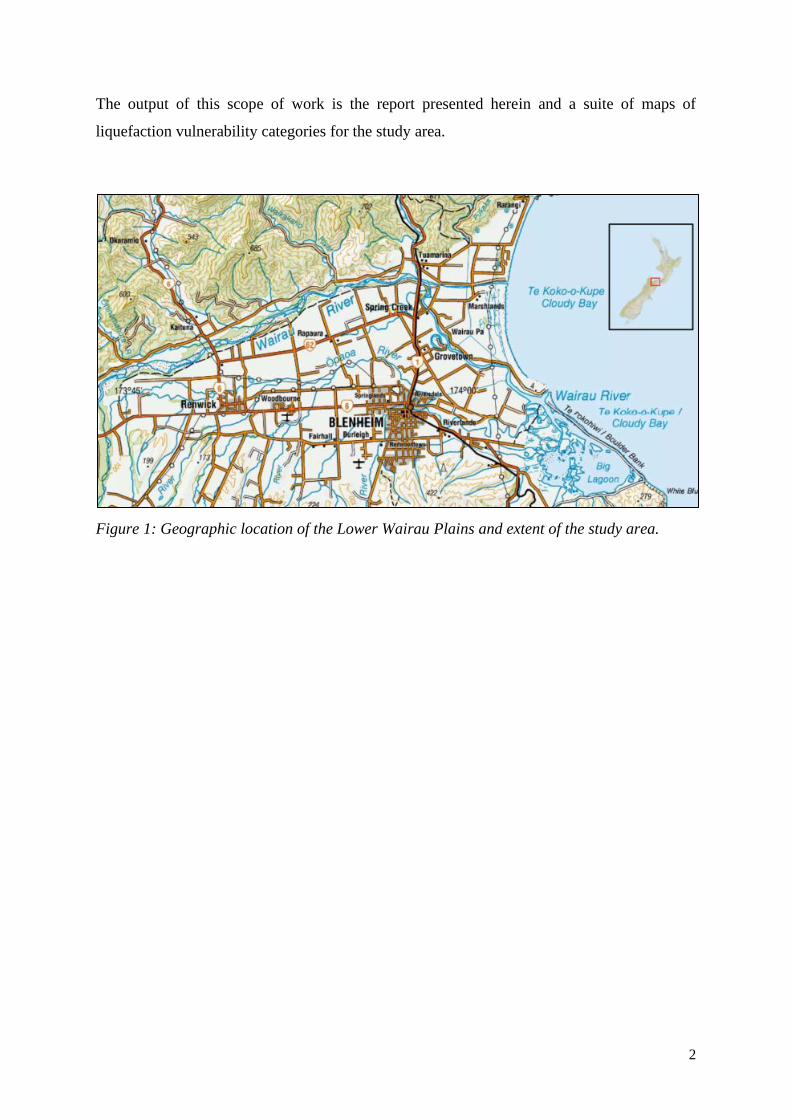
study area in the Lower Wairau Plains is summarised in Figure 1.
The following data is collated to inform this study:
• Geological and digital elevation model data
• Geomorphological mapping based on surface expression
• Regional groundwater lithology models
• Geotechnical site investigation data
• Groundwater models from hydrologic and geotechnical sources
• Case history evidence of liquefaction manifestation, with a focus on the 2016 Kaikōura
earthquake
This data is used to inform the appropriate level of assessment detail across the study area
based on the MBIE Guidance. Geological, groundwater and seismic hazard data is used to
undertake a high-level assessment. Geomorphological and basin groundwater geological
models are used to further refine this high-level assessment.
A cone penetration test (CPT) dataset is used along with the seismic hazard and groundwater
data to provide an assessment of the liquefaction hazard for a range of earthquake shaking
return period scenarios. CPT soundings in each geomorphic zone are grouped together to
provide an indication of the representative performance of the soils in these areas. Where
possible, observations from the 2016 Kaikōura earthquake are used to further inform the CPT-
based liquefaction assessment.
2
The output of this scope of work is the report presented herein and a suite of maps of
liquefaction vulnerability categories for the study area.
Figure 1: Geographic location of the Lower Wairau Plains and extent of the study area.
3
2 METHODOLOGY
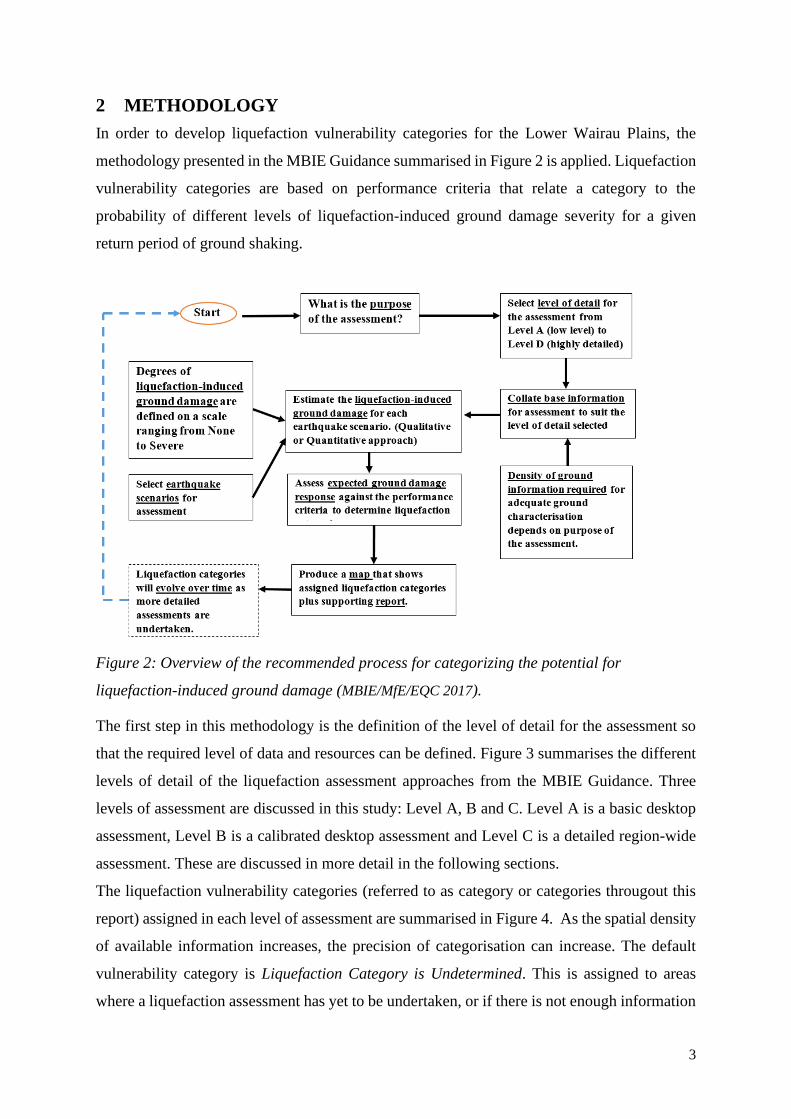
In order to develop liquefaction vulnerability categories for the Lower Wairau Plains, the
methodology presented in the MBIE Guidance summarised in Figure 2 is applied. Liquefaction
vulnerability categories are based on performance criteria that relate a category to the
probability of different levels of liquefaction-induced ground damage severity for a given
return period of ground shaking.
Figure 2: Overview of the recommended process for categorizing the potential for
liquefaction-induced ground damage (MBIE/MfE/EQC 2017).
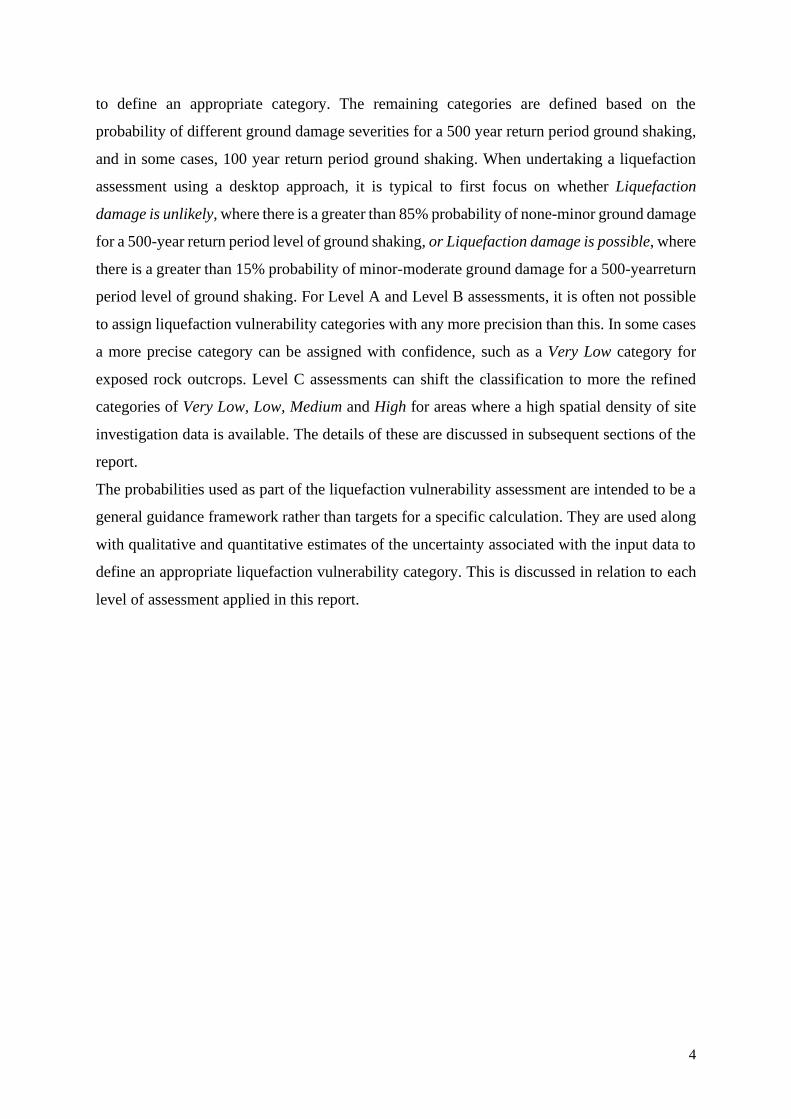
The first step in this methodology is the definition of the level of detail for the assessment so
that the required level of data and resources can be defined. Figure 3 summarises the different
levels of detail of the liquefaction assessment approaches from the MBIE Guidance. Three
levels of assessment are discussed in this study: Level A, B and C. Level A is a basic desktop
assessment, Level B is a calibrated desktop assessment and Level C is a detailed region-wide
assessment. These are discussed in more detail in the following sections.
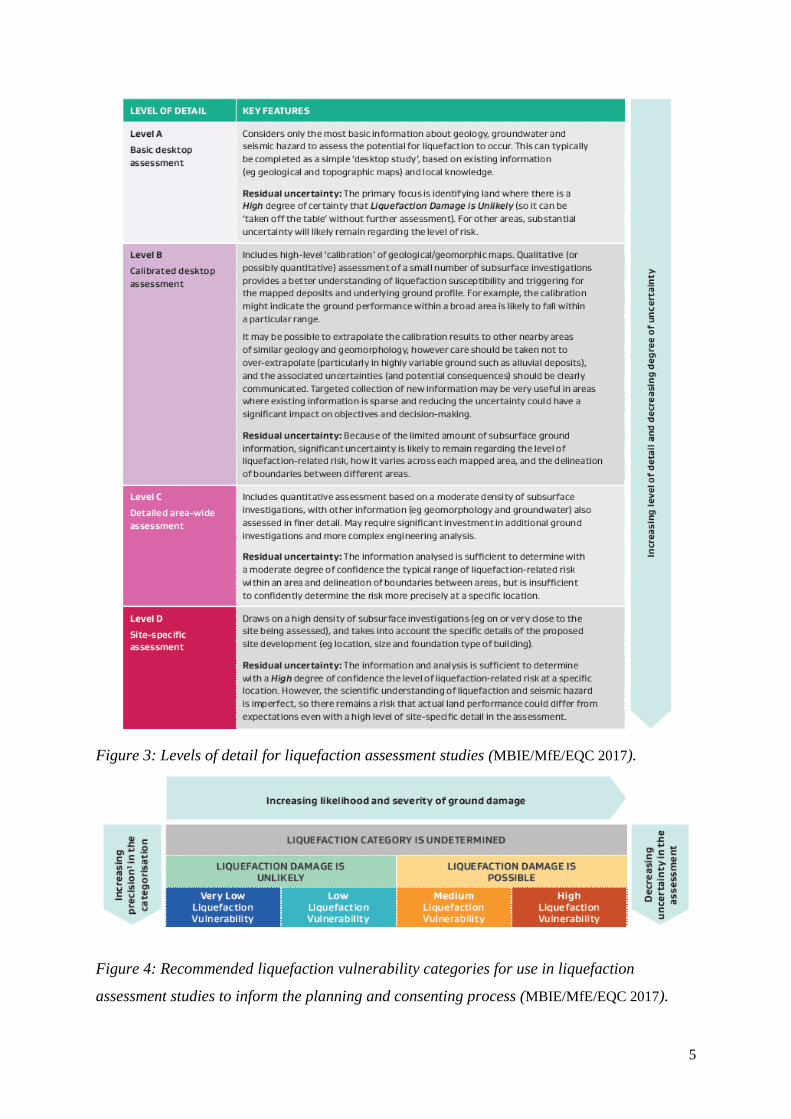
The liquefaction vulnerability categories (referred to as category or categories througout this
report) assigned in each level of assessment are summarised in Figure 4. As the spatial density
of available information increases, the precision of categorisation can increase. The default
vulnerability category is Liquefaction Category is Undetermined. This is assigned to areas
where a liquefaction assessment has yet to be undertaken, or if there is not enough information
4
to define an appropriate category. The remaining categories are defined based on the
probability of different ground damage severities for a 500 year return period ground shaking,
and in some cases, 100 year return period ground shaking. When undertaking a liquefaction
assessment using a desktop approach, it is typical to first focus on whether Liquefaction
damage is unlikely, where there is a greater than 85% probability of none-minor ground damage
for a 500-year return period level of ground shaking, or Liquefaction damage is possible, where
there is a greater than 15% probability of minor-moderate ground damage for a 500-yearreturn
period level of ground shaking. For Level A and Level B assessments, it is often not possible
to assign liquefaction vulnerability categories with any more precision than this. In some cases
a more precise category can be assigned with confidence, such as a Very Low category for
exposed rock outcrops. Level C assessments can shift the classification to more the refined
categories of Very Low, Low, Medium and High for areas where a high spatial density of site
investigation data is available. The details of these are discussed in subsequent sections of the
report.
The probabilities used as part of the liquefaction vulnerability assessment are intended to be a
general guidance framework rather than targets for a specific calculation. They are used along
with qualitative and quantitative estimates of the uncertainty associated with the input data to
define an appropriate liquefaction vulnerability category. This is discussed in relation to each
level of assessment applied in this report.
5
Figure 3: Levels of detail for liquefaction assessment studies (MBIE/MfE/EQC 2017).
Figure 4: Recommended liquefaction vulnerability categories for use in liquefaction
assessment studies to inform the planning and consenting process (MBIE/MfE/EQC 2017).
6
2.1 Level A assessment
The Level A assessment is a basic desktop study that utilises surface geology, groundwater and
seismic hazard characteristics to classify the liquefaction-induced ground damage potential.
One of the primary focuses of this assessment is to identify land where Liquefaction damage
is unlikely so that it can be removed from further assessment. Where there is enough confidence
in the available data, the remaining areas can be classified as Liquefaction damage is possible.
Areas where there is not enough information to determine an appropriate category can be
classified as Liquefaction category is undetermined.
Potentially liquefiable deposits can be defined based on the classification by Youd & Perkins
(1978) and other researchers (Pyke 2003, Youd et al. 2001). This geology-based classification
considers the regional seismic hazard and the depth to groundwater in conjunction with the age
and depositional processes that formed the soil deposits. A semi-quantitative screening criteria
illustrated in Table 1 is used in the MBIE Guidance to identify geological units where
liquefaction-induced ground damage is unlikely to occur. A soil deposit of the specified type
may be assigned a liquefaction vulnerability category of Liquefaction damage is unlikely if the
500-year return period peak ground acceleration (PGA) is less than the value listed, or if the
depth to groundwater is greater than the value listed. The listed PGA values correspond to a
moment magnitude (Mw) 7.5 earthquake. When using this table for screening purposes,
earthquake scenarios with different moment magnitudes may be scaled using the magnitude
scaling factor (MSF) proposed by Idriss and Boulanger (2008):
𝑀𝑆𝐹 = 6.9 exp (−𝑀𝑤
4) − 0.058 up to a maximum value of 1.8.
For regions where the design moment magnitude is less than 7.5, the limits for a Mw7.5 in
Table 1 is multiplied by the MSF to get the limits for an equivalent earthquake.
7
Table 1: Semi-quantitative screening criteria for identifying land where liquefaction-induced
ground damage is unlikely based on a Mw7.5 earthquake (MBIE/MfE/EQC 2017).
Type of soil deposits
A Liquefaction Vulnerability category of
Liquefaction damage is unlikely can be assigned
if either of these conditions are met:
Design peak ground
acceleration (PGA) for the
500-year intensity of
earthquake shaking
Depth to
groundwater
Late Holocene age
Current river channels and their
historical floodplains, marshes and
estuaries, reclamation fills
< 0.1 g > 8 m
Holocene age
Less than 11,000 years old
< 0.3 g > 6 m
Latest Pleistocene age
Between 11,000 and 15,000 years old
< 0.3 g > 4 m
2.2 Level B assessment
The Level B assessment is a calibrated desktop assessment, where the details from the Level
A assessment are further refined using additional datasets that can further clarify the subsurface
characteristics and potential land performance. Qualitative assessment using simple screening
criteria based on geomorphology can identify areas where there is potential for liquefaction
induced ground damage to occur, or the landform suggests it may have occurred. Any other
regional information on subsurface deposits can inform the calibration of the liquefaction
vulnerability categories, such as subsurface investigation data or models derived from this data.
2.3 Level C assessment
The Level C assessment is a detailed area-wide assessment based on cone penetration test
(CPT) soundings and applies a quantitative approach. These CPT soundings from across the
region are used to estimate the degree of liquefaction-induced ground damage for a range of
peak ground accelerations (PGA) and earthquake magnitudes that are representative of the
seismic hazard across the region.
CPT data and the seismic hazard and the groundwater data discussed in the Level A assessment
are used to estimate where liquefaction is expected to trigger (occur) within the soil profile of
a particular site. The combined effect of this triggering throughout the soil profile is used to
estimate the severity of liquefaction-induced land damage at the ground surface.
One of the key aspects of a quantitative liquefaction assessment is understanding the correlation
between the results of liquefaction analysis and the ground damage that is likely to occur. As
outlined in the MBIE Guidance, when assigning liquefaction vulnerability categories for an
8
area-wide hazard assessment it is important to account for the uncertainties within the
assessment, and the potential consequences of over-estimating or under-estimating the
liquefaction vulnerability.
When there is not a high enough spatial density of CPT soundings from across a region to
inform an overall Level C assessment, the outputs can be used to classify small areas where
the density of investigations is adequate. These outputs can also be fed back into the calibrated
desktop assessment if the level of certainty is not high enough to inform the Very Low – High
vulnerability categories.
Observations from the 2016 Kaikōura earthquake are used in this report to assess the CPT-
based liquefaction assessment. The work of Ogden (2018) highlights locations where these
CPT based methods are able and unable to predict the manifestation in the Kaikōura
earthquake. The CPT based classification is discussed in the context of these observations of
the performance of soil profiles in the region.
9
3 GROUND CONDITIONS
3.1 Geology
The Lower Wairau Plains are located in the north-east of the South Island of New Zealand in
the region of Marlborough. The region is intersected by many active crustal faults such as the
Wairau, Awatere, and Clarence Faults (Rattenbury et al. 2006). The Lower Wairau Plains are
predominantly flat to gently undulating alluvial plains, underlain by Holocene age marine and
estuarine silts and sands of the Dillons Point Formation, and alluvial gravels and sands of the
Rapaura Formation. The soils of the Dillons Point Formation are observed to vary significantly
in their composition and degree of consolidation, varying between loose sands and soft silts to
very dense sands and very dense clayey silts (MDC 2012). The alluvial sediments to the eastern
margin of the Wairau Plains are inter-fingered with lagoonal muds and coastal sands, silts, and
gravels which reflect coastline progradation and marine regression following the mid-Holocene
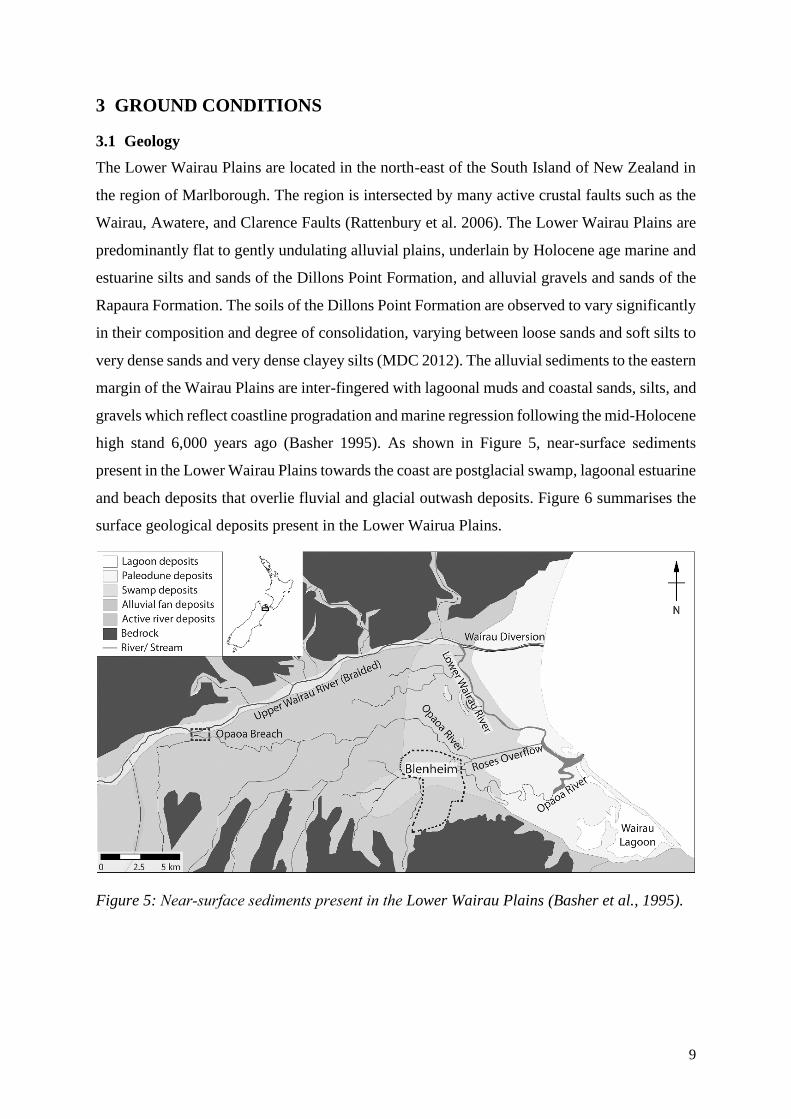
high stand 6,000 years ago (Basher 1995). As shown in Figure 5, near‐surface sediments
present in the Lower Wairau Plains towards the coast are postglacial swamp, lagoonal estuarine
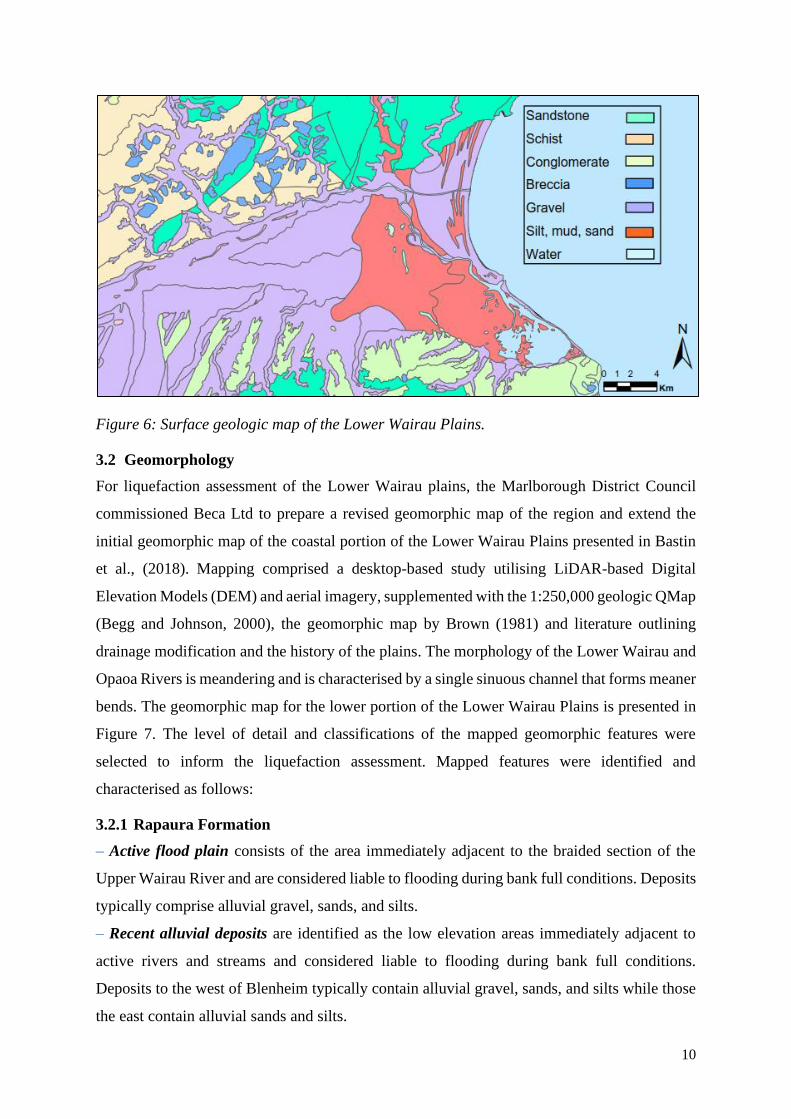
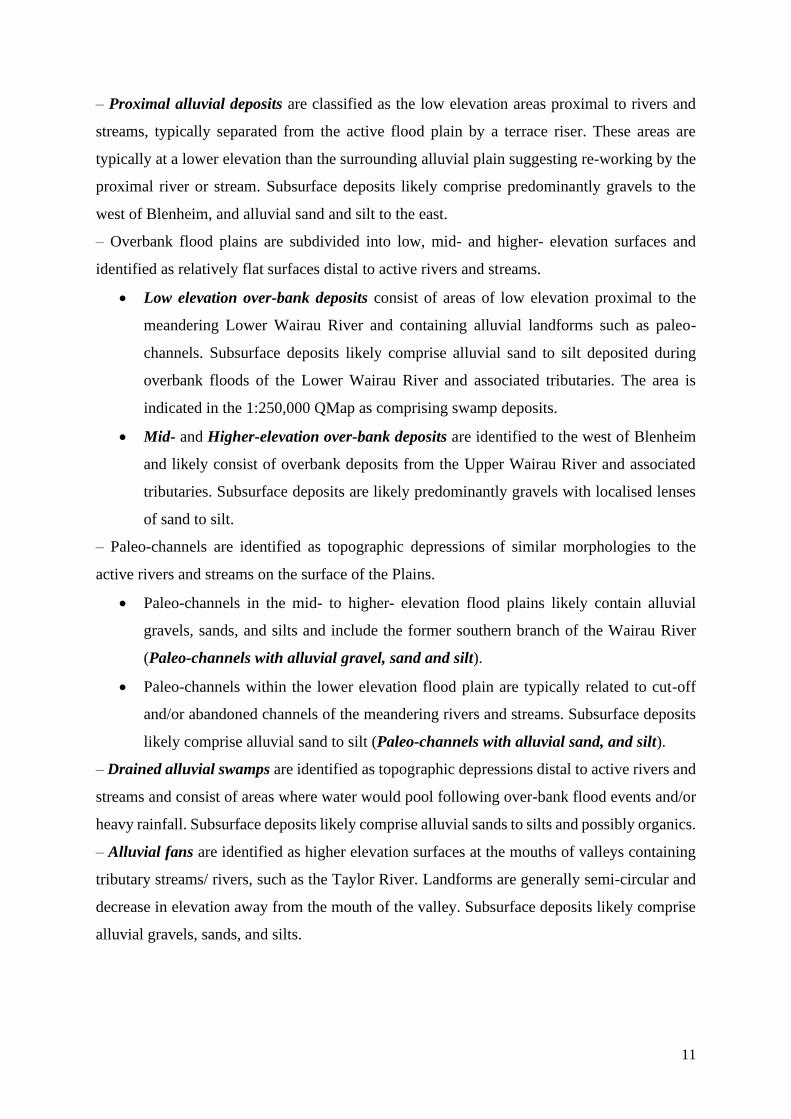
and beach deposits that overlie fluvial and glacial outwash deposits. Figure 6 summarises the
surface geological deposits present in the Lower Wairua Plains.
Figure 5: Near‐surface sediments present in the Lower Wairau Plains (Basher et al., 1995).
10
Figure 6: Surface geologic map of the Lower Wairau Plains.
3.2 Geomorphology
For liquefaction assessment of the Lower Wairau plains, the Marlborough District Council
commissioned Beca Ltd to prepare a revised geomorphic map of the region and extend the
initial geomorphic map of the coastal portion of the Lower Wairau Plains presented in Bastin
et al., (2018). Mapping comprised a desktop-based study utilising LiDAR-based Digital
Elevation Models (DEM) and aerial imagery, supplemented with the 1:250,000 geologic QMap
(Begg and Johnson, 2000), the geomorphic map by Brown (1981) and literature outlining
drainage modification and the history of the plains. The morphology of the Lower Wairau and
Opaoa Rivers is meandering and is characterised by a single sinuous channel that forms meaner
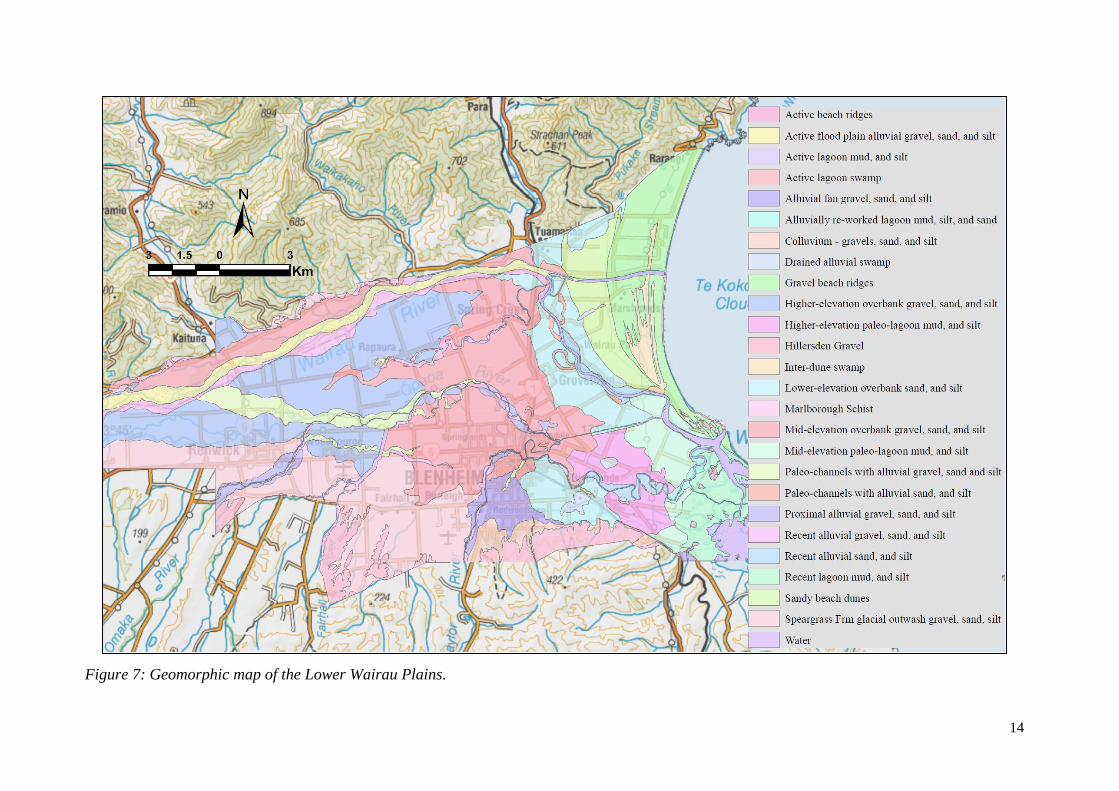
bends. The geomorphic map for the lower portion of the Lower Wairau Plains is presented in
Figure 7. The level of detail and classifications of the mapped geomorphic features were
selected to inform the liquefaction assessment. Mapped features were identified and
characterised as follows:
3.2.1 Rapaura Formation
– Active flood plain consists of the area immediately adjacent to the braided section of the
Upper Wairau River and are considered liable to flooding during bank full conditions. Deposits
typically comprise alluvial gravel, sands, and silts.
– Recent alluvial deposits are identified as the low elevation areas immediately adjacent to
active rivers and streams and considered liable to flooding during bank full conditions.
Deposits to the west of Blenheim typically contain alluvial gravel, sands, and silts while those
the east contain alluvial sands and silts.
11
– Proximal alluvial deposits are classified as the low elevation areas proximal to rivers and
streams, typically separated from the active flood plain by a terrace riser. These areas are
typically at a lower elevation than the surrounding alluvial plain suggesting re-working by the
proximal river or stream. Subsurface deposits likely comprise predominantly gravels to the
west of Blenheim, and alluvial sand and silt to the east.
– Overbank flood plains are subdivided into low, mid- and higher- elevation surfaces and
identified as relatively flat surfaces distal to active rivers and streams.
• Low elevation over-bank deposits consist of areas of low elevation proximal to the
meandering Lower Wairau River and containing alluvial landforms such as paleo-
channels. Subsurface deposits likely comprise alluvial sand to silt deposited during
overbank floods of the Lower Wairau River and associated tributaries. The area is
indicated in the 1:250,000 QMap as comprising swamp deposits.
• Mid- and Higher-elevation over-bank deposits are identified to the west of Blenheim
and likely consist of overbank deposits from the Upper Wairau River and associated
tributaries. Subsurface deposits are likely predominantly gravels with localised lenses
of sand to silt.
– Paleo-channels are identified as topographic depressions of similar morphologies to the
active rivers and streams on the surface of the Plains.
• Paleo-channels in the mid- to higher- elevation flood plains likely contain alluvial
gravels, sands, and silts and include the former southern branch of the Wairau River
(Paleo-channels with alluvial gravel, sand and silt).
• Paleo-channels within the lower elevation flood plain are typically related to cut-off
and/or abandoned channels of the meandering rivers and streams. Subsurface deposits
likely comprise alluvial sand to silt (Paleo-channels with alluvial sand, and silt).
– Drained alluvial swamps are identified as topographic depressions distal to active rivers and
streams and consist of areas where water would pool following over-bank flood events and/or
heavy rainfall. Subsurface deposits likely comprise alluvial sands to silts and possibly organics.
– Alluvial fans are identified as higher elevation surfaces at the mouths of valleys containing
tributary streams/ rivers, such as the Taylor River. Landforms are generally semi-circular and
decrease in elevation away from the mouth of the valley. Subsurface deposits likely comprise
alluvial gravels, sands, and silts.
12
3.2.2 Dillions Point Formation
– Dune/ beach ridges
• Active beach ridges are identified along the current coastline and are primarily
composed of well sorted fine to coarse gravel.
• Gravel beach ridges are recognised as raised linear landforms orientated parallel to the
existing coastline and extending approximately 5.5 km inland from the active coastline.
Brown (1981) indicates that the deposits comprise well sorted fine to coarse gravel.
• Inter-dune swamps are identified in topographic depressions between the gravel beach
ridges and locally contain standing water. Subsurface deposits likely comprise sand to
silt.
• Sandy beach dunes consisting of linear landforms orientated parallel to the existing
coastline are identified from approximately 5.5 to 7 km inland in the area north of the
Wairau Lagoon. The features exhibit less prominent topography than the gravel ridges
and likely consist of well graded sand to silt.
– Lagoon deposits
• Active lagoon deposits are identified in the aerial imagery as areas of mud to silt within
the Wairau Lagoon. These areas may be underwater during high tide and/or storm
events.
• Recent lagoon deposits are identified as vegetated low elevation areas immediately
adjacent to the Wairau Lagoon. The aerial imagery indicates that the vegetation
comprises short grasses typical of marshy settings. Subsurface deposits likely comprise
loosely consolidated mud to silt.
• Mid-elevation paleo-lagoon deposits are identified as low elevation areas immediately
inland from the Wairau Lagoon where beach ridges/ dunes were not observed.
Subsurface deposits likely comprise mud to silt.
• Higher-elevation paleo-lagoon deposits are identified further inland from the existing
Wairau Lagoon and adjacent to the Sandy beach dune deposits. Paleo-channels crosscut
the surficial deposits suggesting that the deposits are overlain by alluvial silts.
• Alluvially re-worked lagoon deposits are identified on the inside of meander-bends of
the Lower Wairau River where the river intersects the recent lagoon deposits.
Landforms including scrollbars suggest the deposits have been alluvially re-worked.
• Active lagoon swamps are identified as topographic depressions within the recent
lagoon deposits and locally contain standing water. Subsurface deposits likely contain
muds to silts with accumulations of organics possible.
13
3.2.3 Speargrass Formation
This formation is identified as a relatively flat surface on the Plains that is separated from the
Rapaura Formation by a degradational terrace. Extents of the surface were inferred from areas
of consistent elevations and from the lack of evidence of recent fluvial re-working, such as
paleo-channels.
3.2.4 Hillersden Gravel
These are present on the higher hillslopes in the south-east of the study area, as indicated in the
geologic map of the region (Begg and Johnson, 2000). Deposits consist of Neogene poorly
sorted and poorly bedded channelized greywacke conglomerate with lenses of sandstone and
sandy siltstone. Deposits are identified from the mapped distribution in the geologic map and
from the ‘rolling’ topography.
3.2.5 Colluvium deposits
These deposits are inferred from a step change in topography at the base of hillslopes and
within valleys along the northern margin of the Plains. These deposits likely comprise gravel,
sand, and silt washed off the surrounding hillslopes.
3.2.6 Marlborough Schist
Marlborough Schist is indicated in the geologic map of the region (Begg and Johnson, 2000)
as present on the hillslopes along the northern margin of the valley. The unit comprises
basement rock of dominantly pelitic schist derived from quartzofeldspathic sandstone and
mudstone.
14
Figure 7: Geomorphic map of the Lower Wairau Plains.
15
3.3 Groundwater
The study of Davidson & Wilson (2011) provides a thorough description of the groundwater
regime of the Lower Wairau Plains. Similarly, the groundwater model developed by Ogden
(2018) indicates that GWD was approximately 2 m below ground level for much of the coastal
parts of the plains and flows from west to east.
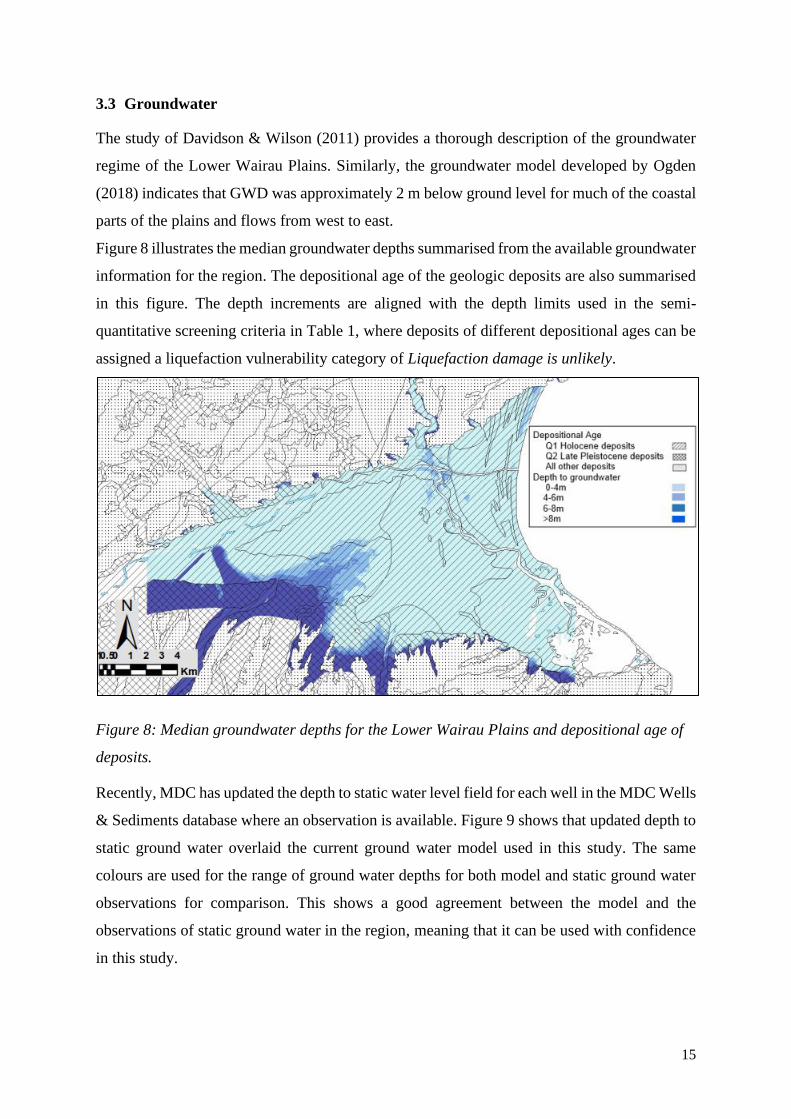
Figure 8 illustrates the median groundwater depths summarised from the available groundwater
information for the region. The depositional age of the geologic deposits are also summarised
in this figure. The depth increments are aligned with the depth limits used in the semi-
quantitative screening criteria in Table 1, where deposits of different depositional ages can be
assigned a liquefaction vulnerability category of Liquefaction damage is unlikely.
Figure 8: Median groundwater depths for the Lower Wairau Plains and depositional age of
deposits.
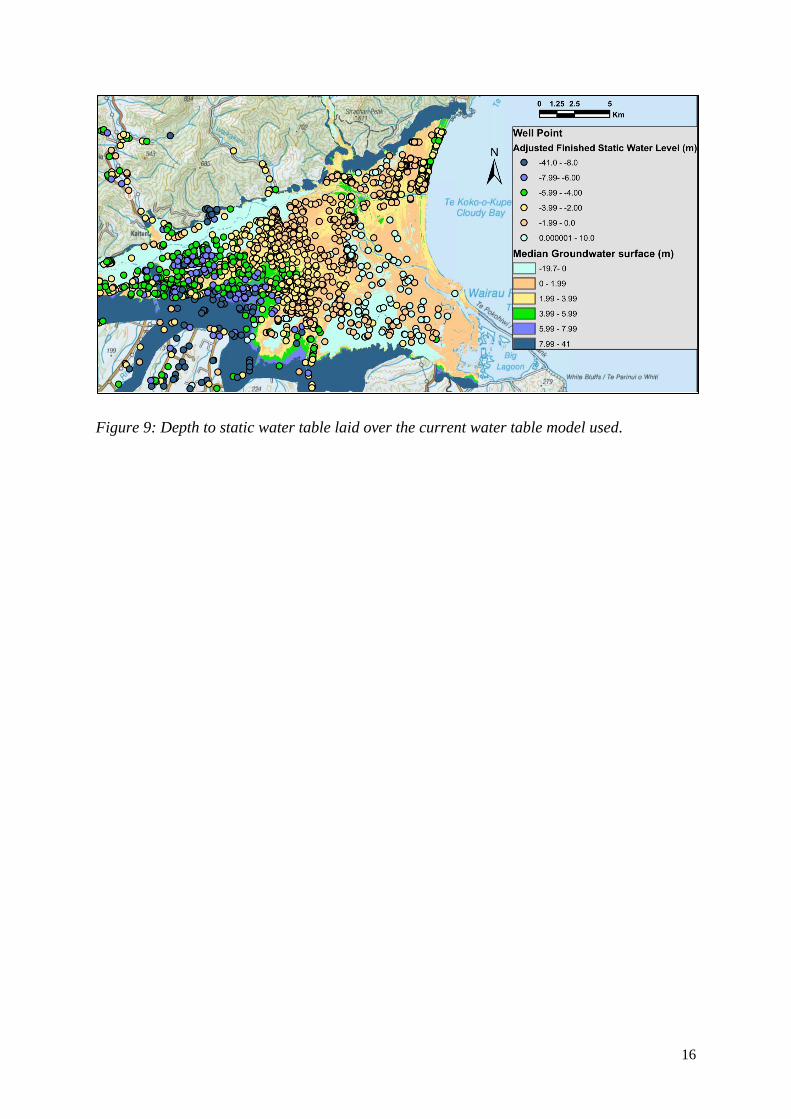
Recently, MDC has updated the depth to static water level field for each well in the MDC Wells
& Sediments database where an observation is available. Figure 9 shows that updated depth to
static ground water overlaid the current ground water model used in this study. The same
colours are used for the range of ground water depths for both model and static ground water
observations for comparison. This shows a good agreement between the model and the
observations of static ground water in the region, meaning that it can be used with confidence
in this study.
16
Figure 9: Depth to static water table laid over the current water table model used.
17
4 SEISMIC HAZARD
The plate boundary between the Pacific and Australian plates passes through the Marlborough
region, and consequently, this region is an area of high seismicity. The Marlborough region
consists of a series of northwest-tilted blocks forming mountain ranges, hills and drowned
valleys separated by major translucent faults such as Wairau, Awatere and Clarence Faults,
each of which can give rise to frequent seismic events. The Wairau Fault, which is a branch of
Alpine Fault, divides Marlborough into two regions with divergent geological structures. The
Wairau Plains are bounded by north-east trending mountain ranges (Richmond and Kaikoura
Ranges) reflecting uplift along the Wairau and Awatere Faults which are part of the
Marlborough Fault Zone (MFZ). This is a zone of north-east trending transpressional faulting
associated with the offshore transition of the plate boundary (Rattenbury et al. 2006). The
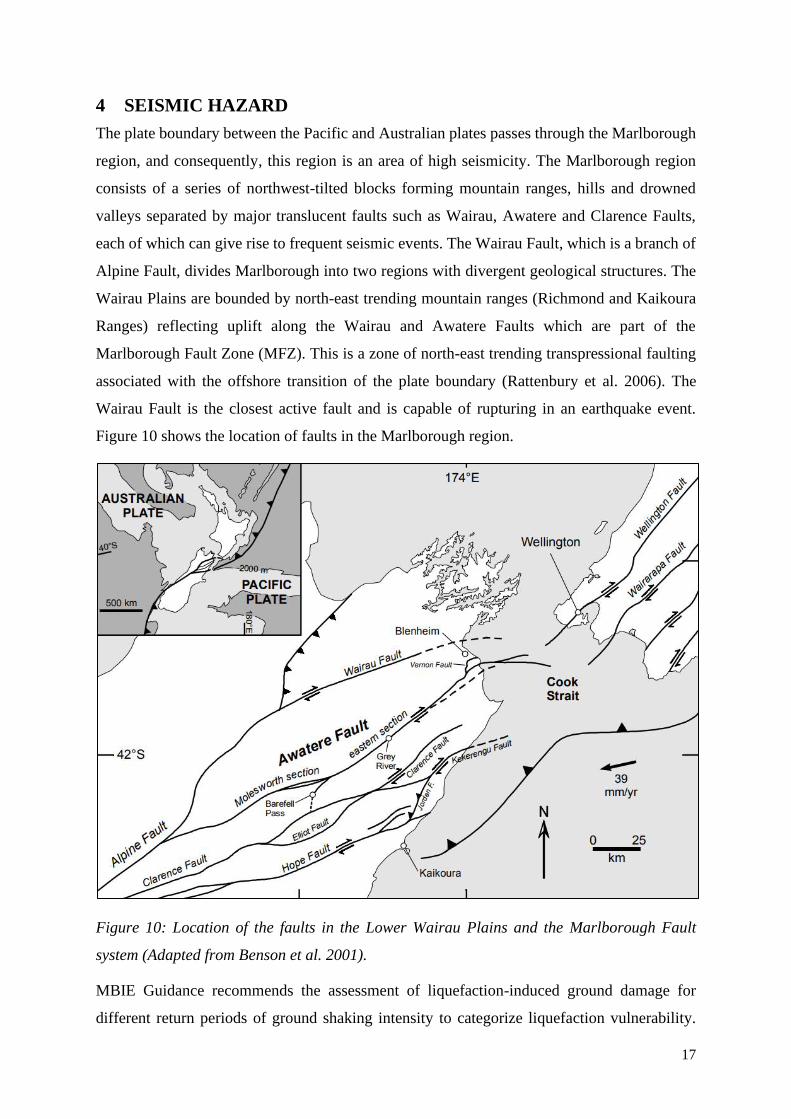
Wairau Fault is the closest active fault and is capable of rupturing in an earthquake event.
Figure 10 shows the location of faults in the Marlborough region.
Figure 10: Location of the faults in the Lower Wairau Plains and the Marlborough Fault
system (Adapted from Benson et al. 2001).
MBIE Guidance recommends the assessment of liquefaction-induced ground damage for
different return periods of ground shaking intensity to categorize liquefaction vulnerability.
18
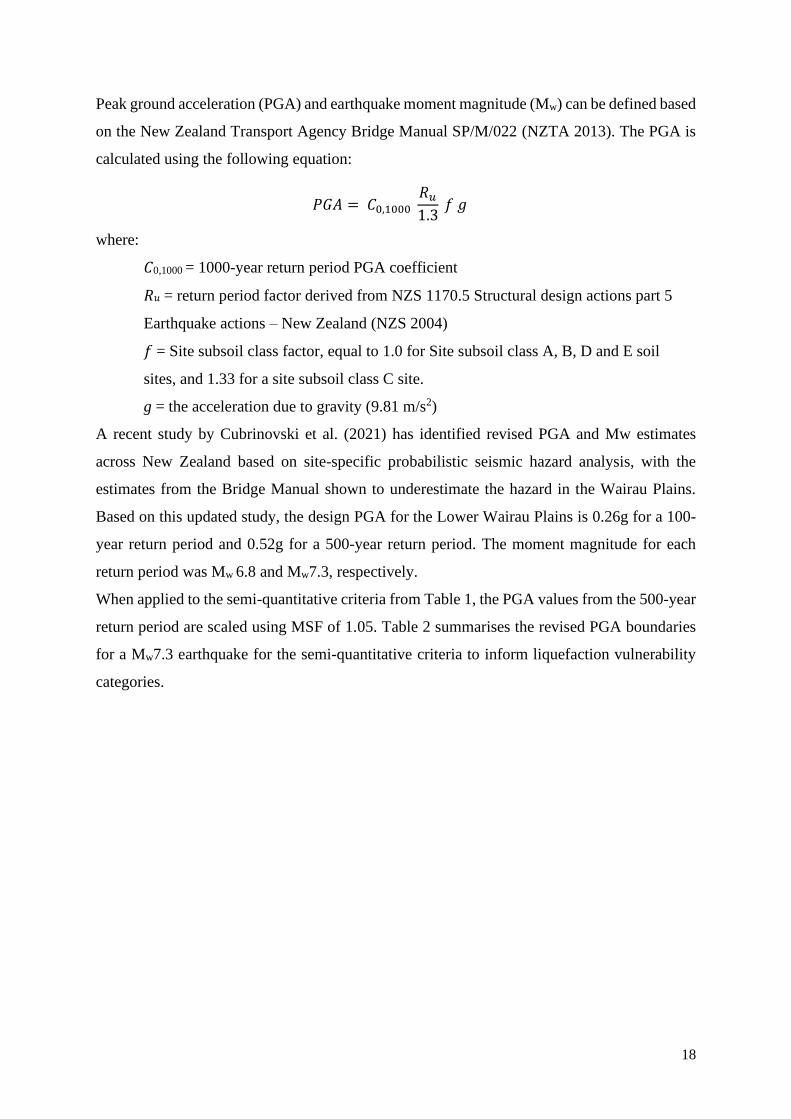
Peak ground acceleration (PGA) and earthquake moment magnitude (Mw) can be defined based
on the New Zealand Transport Agency Bridge Manual SP/M/022 (NZTA 2013). The PGA is
calculated using the following equation:
𝑃𝐺𝐴 = 𝐶0,1000 𝑅𝑢
1.3 𝑓 𝑔
where:
𝐶0,1000 = 1000-year return period PGA coefficient
𝑅𝑢 = return period factor derived from NZS 1170.5 Structural design actions part 5
Earthquake actions – New Zealand (NZS 2004)
𝑓 = Site subsoil class factor, equal to 1.0 for Site subsoil class A, B, D and E soil
sites, and 1.33 for a site subsoil class C site.
g = the acceleration due to gravity (9.81 m/s2)
A recent study by Cubrinovski et al. (2021) has identified revised PGA and Mw estimates
across New Zealand based on site-specific probabilistic seismic hazard analysis, with the
estimates from the Bridge Manual shown to underestimate the hazard in the Wairau Plains.
Based on this updated study, the design PGA for the Lower Wairau Plains is 0.26g for a 100-
year return period and 0.52g for a 500-year return period. The moment magnitude for each
return period was Mw 6.8 and Mw7.3, respectively.
When applied to the semi-quantitative criteria from Table 1, the PGA values from the 500-year
return period are scaled using MSF of 1.05. Table 2 summarises the revised PGA boundaries
for a Mw7.3 earthquake for the semi-quantitative criteria to inform liquefaction vulnerability
categories.
19
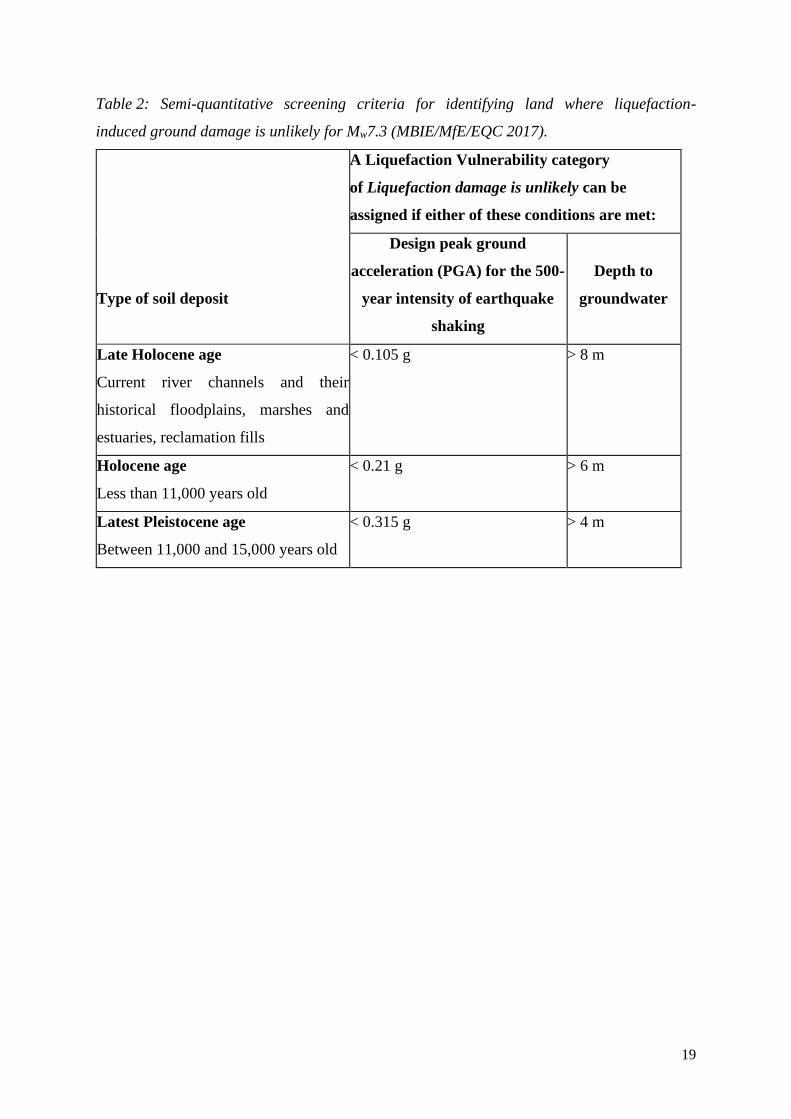
Table 2: Semi-quantitative screening criteria for identifying land where liquefaction-
induced ground damage is unlikely for Mw7.3 (MBIE/MfE/EQC 2017).
Type of soil deposit
A Liquefaction Vulnerability category
of Liquefaction damage is unlikely can be
assigned if either of these conditions are met:
Design peak ground
acceleration (PGA) for the 500-
year intensity of earthquake
shaking
Depth to
groundwater
Late Holocene age
Current river channels and their
historical floodplains, marshes and
estuaries, reclamation fills
< 0.105 g > 8 m
Holocene age
Less than 11,000 years old
< 0.21 g > 6 m
Latest Pleistocene age
Between 11,000 and 15,000 years old
< 0.315 g > 4 m
20
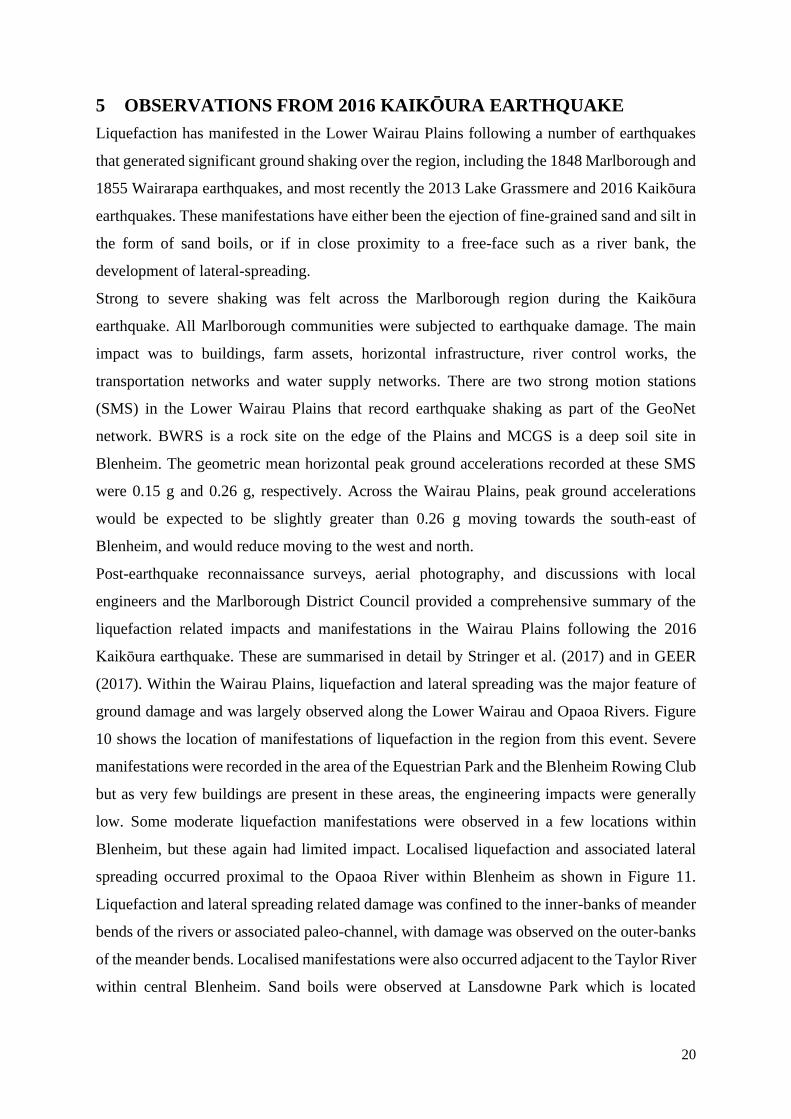
5 OBSERVATIONS FROM 2016 KAIKŌURA EARTHQUAKE
Liquefaction has manifested in the Lower Wairau Plains following a number of earthquakes
that generated significant ground shaking over the region, including the 1848 Marlborough and
1855 Wairarapa earthquakes, and most recently the 2013 Lake Grassmere and 2016 Kaikōura
earthquakes. These manifestations have either been the ejection of fine-grained sand and silt in
the form of sand boils, or if in close proximity to a free-face such as a river bank, the
development of lateral-spreading.
Strong to severe shaking was felt across the Marlborough region during the Kaikōura
earthquake. All Marlborough communities were subjected to earthquake damage. The main
impact was to buildings, farm assets, horizontal infrastructure, river control works, the
transportation networks and water supply networks. There are two strong motion stations
(SMS) in the Lower Wairau Plains that record earthquake shaking as part of the GeoNet
network. BWRS is a rock site on the edge of the Plains and MCGS is a deep soil site in
Blenheim. The geometric mean horizontal peak ground accelerations recorded at these SMS
were 0.15 g and 0.26 g, respectively. Across the Wairau Plains, peak ground accelerations
would be expected to be slightly greater than 0.26 g moving towards the south-east of
Blenheim, and would reduce moving to the west and north.
Post-earthquake reconnaissance surveys, aerial photography, and discussions with local
engineers and the Marlborough District Council provided a comprehensive summary of the
liquefaction related impacts and manifestations in the Wairau Plains following the 2016
Kaikōura earthquake. These are summarised in detail by Stringer et al. (2017) and in GEER
(2017). Within the Wairau Plains, liquefaction and lateral spreading was the major feature of
ground damage and was largely observed along the Lower Wairau and Opaoa Rivers. Figure
10 shows the location of manifestations of liquefaction in the region from this event. Severe
manifestations were recorded in the area of the Equestrian Park and the Blenheim Rowing Club
but as very few buildings are present in these areas, the engineering impacts were generally
low. Some moderate liquefaction manifestations were observed in a few locations within
Blenheim, but these again had limited impact. Localised liquefaction and associated lateral
spreading occurred proximal to the Opaoa River within Blenheim as shown in Figure 11.
Liquefaction and lateral spreading related damage was confined to the inner-banks of meander
bends of the rivers or associated paleo-channel, with damage was observed on the outer-banks
of the meander bends. Localised manifestations were also occurred adjacent to the Taylor River
within central Blenheim. Sand boils were observed at Lansdowne Park which is located
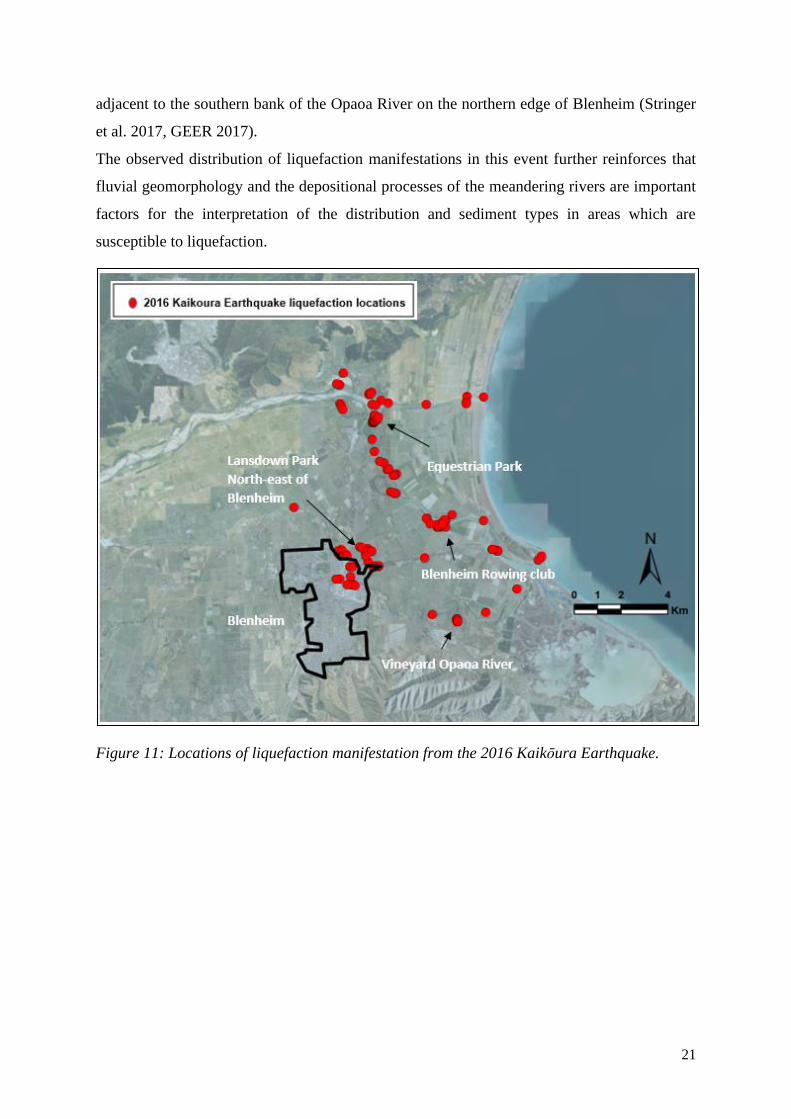
21
adjacent to the southern bank of the Opaoa River on the northern edge of Blenheim (Stringer
et al. 2017, GEER 2017).
The observed distribution of liquefaction manifestations in this event further reinforces that
fluvial geomorphology and the depositional processes of the meandering rivers are important
factors for the interpretation of the distribution and sediment types in areas which are
susceptible to liquefaction.
Figure 11: Locations of liquefaction manifestation from the 2016 Kaikōura Earthquake.
22
6 BASIC DESKTOP ASSESSMENT
In this section liquefaction vulnerability categories are defined using the Level A calibration
approach based on geological maps, groundwater and seismic hazard for the Lower Wairau
Plains following the MBIE Guidance.
A geological desktop assessment is undertaken based on published national and regional
surface geological maps and reports to characterise liquefaction. Q-Maps developed by GNS
Science are used to create geological layers for the Lower Wairau Plains. The output of this
initial assessment is a geology-based liquefaction vulnerability map illustrating areas in the
Lower Wairau Plains with deposits for which Liquefaction damage is possible and Liquefaction
damage is unlikely. Where rock outcrops are present, a Very Low liquefaction vulnerability
category is assigned. The primary aim of this initial screening is to identify geological units
that are fundamentally not susceptible to liquefaction.
By considering the regional seismic hazard and depth to groundwater, in conjunction with the
depositional process and the age of soil deposits, the semi-quantitative screening criteria in
Table 2 is used to identify geological units where significant liquefaction-induced ground
damage is unlikely to occur. A soil deposit of the specified type is assigned a liquefaction
vulnerability category of Liquefaction damage is unlikely if the 500-year peak ground
acceleration (PGA) is less than the limit for the age of that deposit, or if the depth to
groundwater is greater than the limit presented.
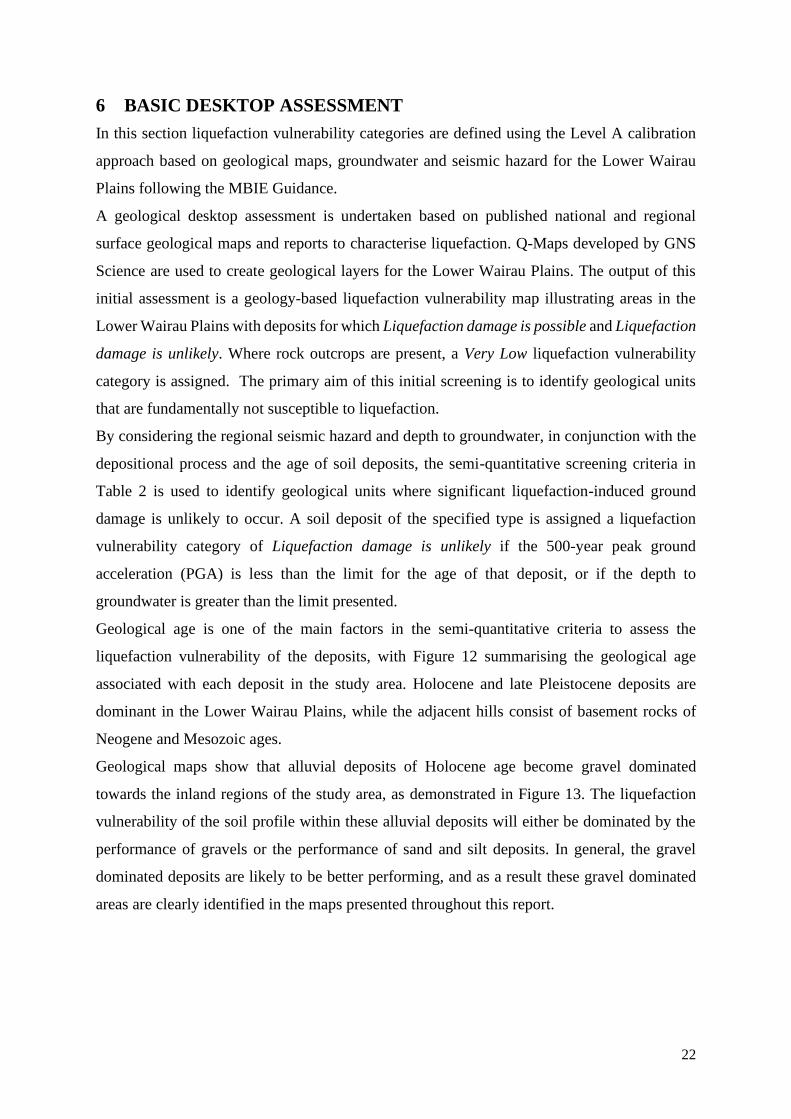
Geological age is one of the main factors in the semi-quantitative criteria to assess the
liquefaction vulnerability of the deposits, with Figure 12 summarising the geological age
associated with each deposit in the study area. Holocene and late Pleistocene deposits are
dominant in the Lower Wairau Plains, while the adjacent hills consist of basement rocks of
Neogene and Mesozoic ages.
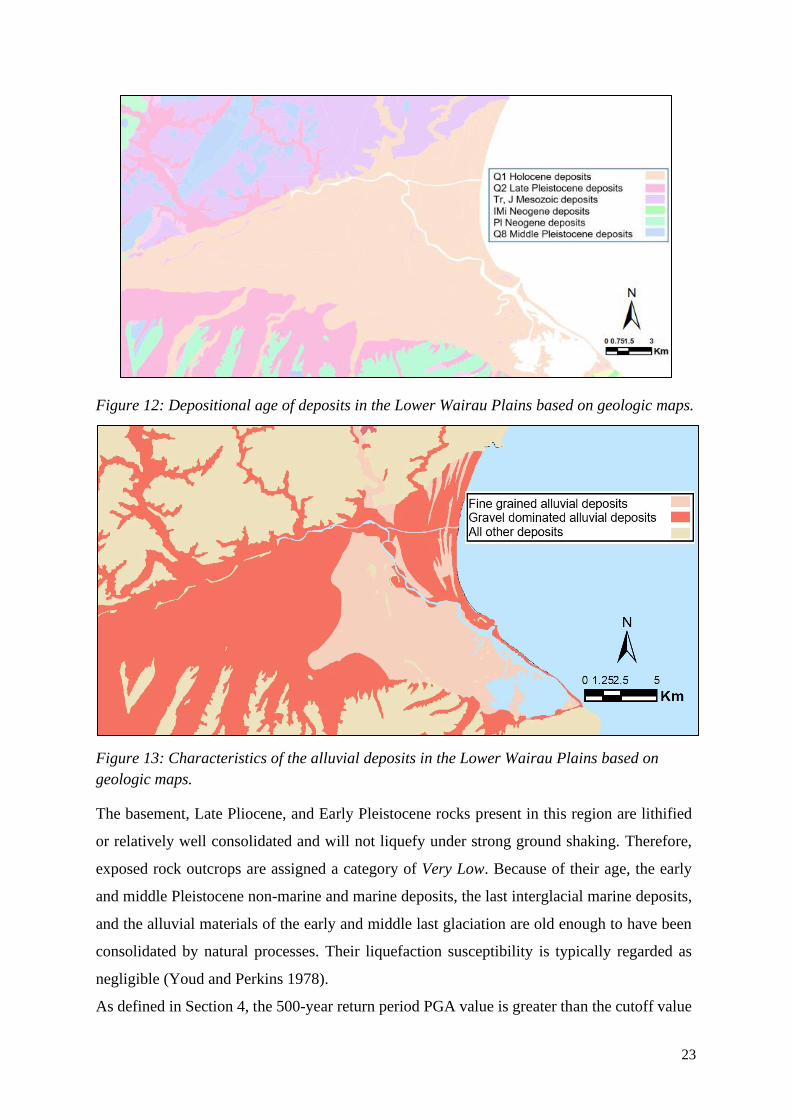
Geological maps show that alluvial deposits of Holocene age become gravel dominated
towards the inland regions of the study area, as demonstrated in Figure 13. The liquefaction
vulnerability of the soil profile within these alluvial deposits will either be dominated by the
performance of gravels or the performance of sand and silt deposits. In general, the gravel
dominated deposits are likely to be better performing, and as a result these gravel dominated
areas are clearly identified in the maps presented throughout this report.
23
Figure 12: Depositional age of deposits in the Lower Wairau Plains based on geologic maps.
Figure 13: Characteristics of the alluvial deposits in the Lower Wairau Plains based on
geologic maps.
The basement, Late Pliocene, and Early Pleistocene rocks present in this region are lithified
or relatively well consolidated and will not liquefy under strong ground shaking. Therefore,
exposed rock outcrops are assigned a category of Very Low. Because of their age, the early
and middle Pleistocene non-marine and marine deposits, the last interglacial marine deposits,
and the alluvial materials of the early and middle last glaciation are old enough to have been
consolidated by natural processes. Their liquefaction susceptibility is typically regarded as
negligible (Youd and Perkins 1978).
As defined in Section 4, the 500-year return period PGA value is greater than the cutoff value
24
for Late Pleistocene deposits. As a result, the depth to groundwater is the governing criteria
for the liquefaction vulnerability categorisation of deposits of this age. Late Pleistocene
deposits with groundwater deeper than 4 m are assigned a category of Liquefaction damage is
unlikely using the semi-quantitative criteria presented in Table 2.
The remaining deposits in the study region are of Holocene age and include alluvial deposits
of fine-grained silts and sands that are present in the Lower Wairau Plains. The nature of the
deposits means that Liquefaction damage is possible is an appropriate categorisation.
Holocene gravel-dominated deposits are also assigned a Liquefaction damage is possible
categorisation. There is likely to be better ground performance in these areas compared to other
alluvial deposits. Most gravelly soils are relatively well-drained, but drainage can be impeded
if their voids are filled with finer particles or if they are surrounded by layers of less pervious
soils. As discussed in MBIE Guidance, large-scale geological maps might not identify small
pockets of potentially susceptible soils within larger geological units (e.g., infilled river
channels). This means that there is still potential for localised areas of more severe liquefaction-
induced ground damage to occur within these areas.
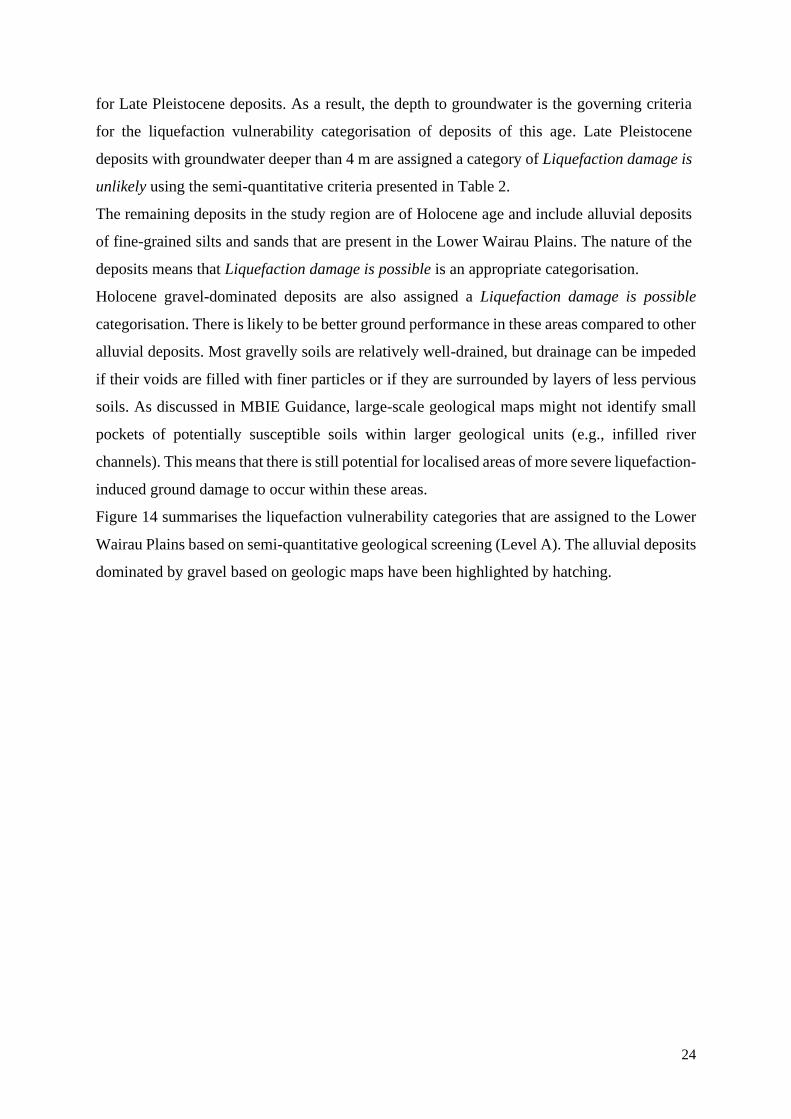
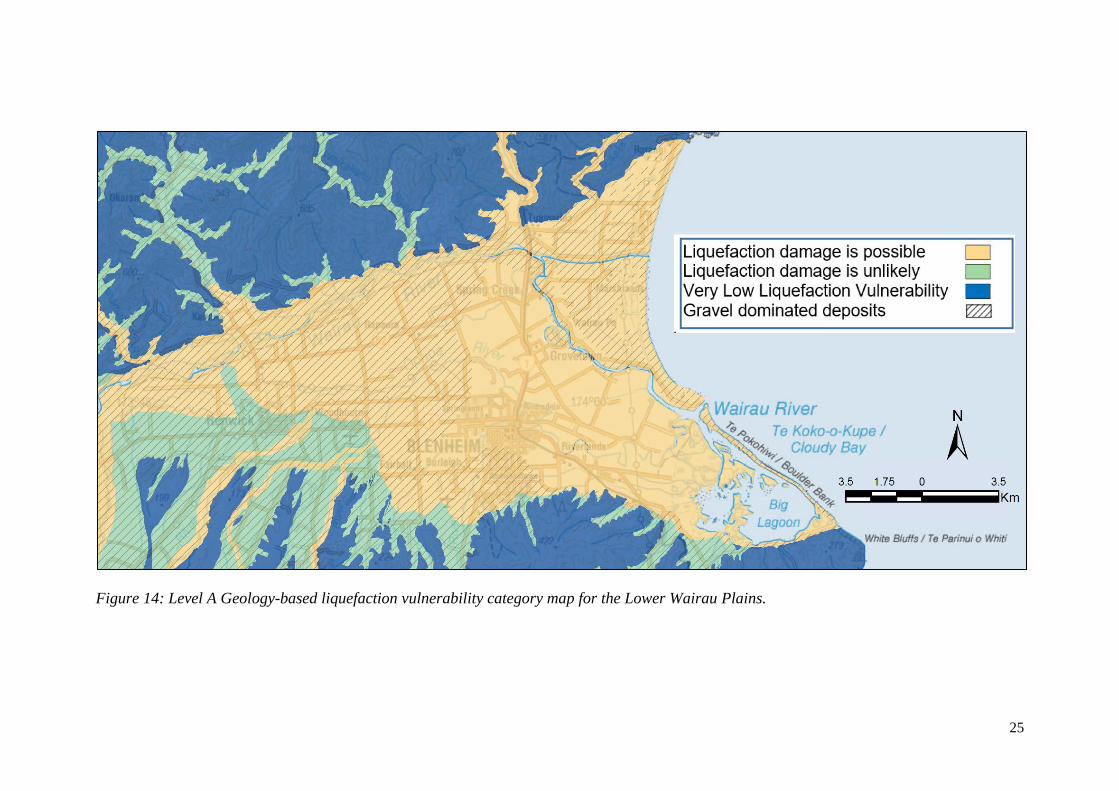
Figure 14 summarises the liquefaction vulnerability categories that are assigned to the Lower
Wairau Plains based on semi-quantitative geological screening (Level A). The alluvial deposits
dominated by gravel based on geologic maps have been highlighted by hatching.
25
Figure 14: Level A Geology-based liquefaction vulnerability category map for the Lower Wairau Plains.
26
7 LEVEL B LIQUEFACTION VULNERABILTY ASSESSMENT
In this section, the liquefaction vulnerability categories from the Level A assessment are
combined with other datasets in an effort to further refine this categorisation. First, the surface
geomorphology of the Lower Wairau Plains presented in Section 3.2 are assessed. Second,
details of the subsurface stratigraphy are assessed using a lithology model of the Wairau Plains
developed for groundwater modelling. And finally, high-level ‘calibration’ of geological maps
with available geotechnical investigation data, including boreholes, CPTs and well logs for
each geomorphic zone is summarised. This approach straddles the Level A and Level B
assessment levels. Qualitative assessment provides a better understanding of liquefaction
susceptibility and triggering for the mapped deposits and underlying ground profile. It will
reduce the uncertainty in areas where existing information is sparse by using the targeted
collection of new information.
As significant uncertainty lies regarding the level of related risk, how it varies across each
mapped area and the delineation of boundaries between areas, updates on the geology-based
liquefaction map is only suggested in areas with a good density of geotechnical investigations
as these provide a better understanding of liquefaction susceptibility for the mapped deposits.
For example, deposits that were categorised as Liquefaction damage is unlikely in the Level A
assessment is assigned a liquefaction vulnerability category of Low where a thick layer of
gravel is present from surface as indicated by geotechnical investigations.. Suggestions are
made for each geomorphic zone where a good density of geotechnical investigations are present
regarding the liquefaction potential. This section highlights some areas where more robust
geotechnical screening with more data needs to be undertaken Although the lithologic model
only covers the central and coastal regions of the Plains, it provides an additional check in this
level of assessment for thick gravel layers from the surface and confidence in the regions where
a more precise liquefaction vulnerability can be suggested.
7.1 Geomorphology-based screening
In addition to surface geologic information, detailed geomorphic characteristics can be used to
refine the evaluation of the liquefaction potential of soil deposits. Previous studies have shown
that river migration promotes the formation and preservation of fluvial deposits prone to
liquefaction, and geomorphic interpretation is a useful tool to assess liquefaction vulnerability
for a region. During the Canterbury earthquake sequence, liquefaction and liquefaction-
induced ground deformation were primarily concentrated near modern waterways and areas
underlain by Holocene fluvial deposits with shallow water tables (< 1 to 2 m) (Wotherspoon et
27
al. 2012, Grace 2015, Bastin et al. 2017). Similarly, a comparison of observed liquefaction
manifestation in Whakatane following the Edgecumbe earthquake with local geomorphology
highlighted the importance of geomorphic setting and fluvial formations in the assessment of
liquefaction (Mellsop 2017, Bastin et al. 2019). Liquefaction manifestation in historical events
have shown that young, unconsolidated point-bar and paleo-channel deposits are highly
susceptible to liquefaction, and thus are likely to liquefy during future events.
The geomorphology of the Lower Wairau Plains discussed in Section 3.2 is assessed in this
section in conjunction with the potential for liquefaction manifestation using literature related
to the performance of typical geomorphological formations in recent earthquakes.
7.1.1 Lower elevation overbank gravel, Sand and silt flood plains
Low elevation overbank gravel, sand and silt deposits cover a large portion of the Lower
Wairau Plains. These deposits mainly consist of fine-grained sand grading to silt. High
groundwater location, low elevation and material characteristics mean these deposits are
typically highly susceptible to liquefaction. Surface manifestations were observed in these
areas following the 2016 Kaikōura earthquake.
7.1.2 Active floodplain alluivial gravel, sand and silt
The active floodplain of the Wairau River avulsed across the Wairau Plains prior to European
settlement, as reflected by the many active and paleo-river channels that transect the surface of
the plains. These gravels dominated Holocene deposits typically have less susceptibility to
liquefaction than finer grained sand and silts.
7.1.3 Mid-elevation overbank gravel, sand and silt
There is high variability in content for these deposits in the Lower Wairau plains. Deposits
which are distal to the river and are typically dominated by silts. The limited deposition on the
outer bank and predominance of silts in these deposits typically result in lower liquefaction
susceptibilities of the underlying sediments. No manifestation of liquefaction was observed in
the 2016 Kaikōura earthquake in these areas. Ground water depth increases from east to west
and also the Gravel content increases from low to mid-elevation floodplain deposits making
these deposits typically highly dependent on other data in addition to formation to suggest
liquefaction susceptibility. Therefore “less susceptibility is considered for these deposits in the
Lower Wairau Plains.
28
7.1.4 Higher elevation overbank gravel, sand and silt
Subsurface deposits for these formations are predominately gravel and ground water depth is
deep from mid to higher elevation deposits making these deposits low susceptible to
liquefaction.
7.1.5 Alluvial fan gravel, sand and silt
Alluvial fan deposits are present in the southern part of the Wairau Plains. These are well-
sorted floodplain gravel deposits. These are a build-up of Wairau River sediments and
possesses a sloping high elevation profile with good drainage. As a result, these deposits
typically have less susceptibility to liquefaction.
7.1.6 Proximal alluvial gravel, sand and silt
These deposits comprise of fine-grained sand grading to silt. They are found in the meandering
Opawa and Wairau River in adjacent deposits. These deposits are geologically young,
unconsolidated and saturated, and thus are typically highly susceptible to liquefaction.
7.1.7 Paleo-channels
A paleo-channel is a remnant of an inactive river or stream channel that has been filled or
buried by younger sediment. These depoits are shown in two formation types i.e., Paleo-
channels with alluvial gravel, sand and silts and Paleo-channels with alluvial sand and silt. The
sediments that the old channel is cut into or buried are mostly unconsolidated. Paleo-channels
deposits are present across the lower portion of the plains and reflect channel avulsion and
bank-overtopping flood events before the settlement of the area. These deposits are
geologically young, unconsolidated and saturated, making them typically highly susceptible to
liquefaction.
7.1.8 Swamps
Swamps generally form distal to the river in areas where standing water remains following
flood events (Fryirs and Brierley, 2012). These are shown as inter-dune swamp and active
lagoon swamp in Figure 7 and are comprised of mainly silts with layers of peat and mud. These
consist of flat to undulating terraces and floodplains of both Wairau and Opawa Rivers
underlain by Holocene sand and silt deposits which makes them typically highly susceptible to
liquefaction. During the 2010-11 Canterbury earthquake sequence areas of swamp deposits in
Christchurch had significant liquefaction manifestation impacts, whereas CPT based
assessments suggested they were less susceptible.
29
7.1.9 Recent alluvial deposits
These deposits are shown as two types in Figure 7 i.e., recent alluvial gravel, sand and silt
deposits and recent alluvial sand and silt deposits. These are late Holocene deposits that are
unconsolidated and saturated and typically have a high liquefaction potential.
7.1.10 Lagoon deposits
These deposits are shown as six types in Figure 7:
• Active lagoon mud and silt,
• Mid-elevation paleo-lagoon depoits
• Higher elevation paleo-lagoon deposits
• Alluvially re-worked lagoon mud, silt and sand
• Paleo-lagoon mud and sily and
• Recent lagoon mud and silt
Lagoons are formed at the tidal mouth of a large river, where the river transitions into a marine
environment. The deposits from the mainland to the estuary in the northeast towards shoreline
and lagoon are silty and gravelly in nature and have high liquefaction potential. Paleo-lagoon
have similar soil characteristics and comprise of saturated fine-grained alluvial soils with some
gravel content, meaning they are typically highly susceptible to liquefaction. Highly visible
and immediate effects of liquefaction were observed in the Avon Heathcote Estuary, which is
an intertidal estuary east of Christchurch city forming lagoon deposits, during the 2011
Canterbury earthquake sequence.
7.1.11 Beach ridges
These depoits are shown in three types in Figure 7:
• Active beach ridge,
• Gravel beach ridges and
• Sandy beach ridges
Holocene paleo beach ridge deposits are present in the Lower Wairau Plains and form a series
of undulating gravel ridges near the coast. These consist of shallow, well-drained soils that
formed from semi-consolidated interbedded sandy and loamy sedimentary beds. Gravel beach
ridges are present towards the shoreline are dominated by gravel deposits. Generally, these
deposits typically have low liquefaction potential as they are a gravel dominated material, and
due to their depositional characteristics, as they are compacted by wave action. Other beach
ridge formations formations are composed of sand as well as sediment worked from underlying
beach material. The beach ridges display a progressive change in orientation, with the younger
ridges parallel to the coast and the older ridges parallel to the Wairau River. Sediment derived
30
from the south (Awatere River and White Bluffs) is responsible for the development of the
gravel ridges since the Wairau River does not transport gravel to the coast. Due to these
depositional characteristics, these formations are typically less susceptible to liquefaction.
7.1.12 Other deposits:
Other deposits which are less susceptible to liquefaction are:
• Hillersden Gravel are higher elevation Neogene aged poorly graded gravelly deposits.
• Marlborough Schist derived from basement rocks of dominantly schist.
• Colluvium deposits that are gravel dominated.
• Speargrass Formation are well-sorted floodplain gravel deposits.
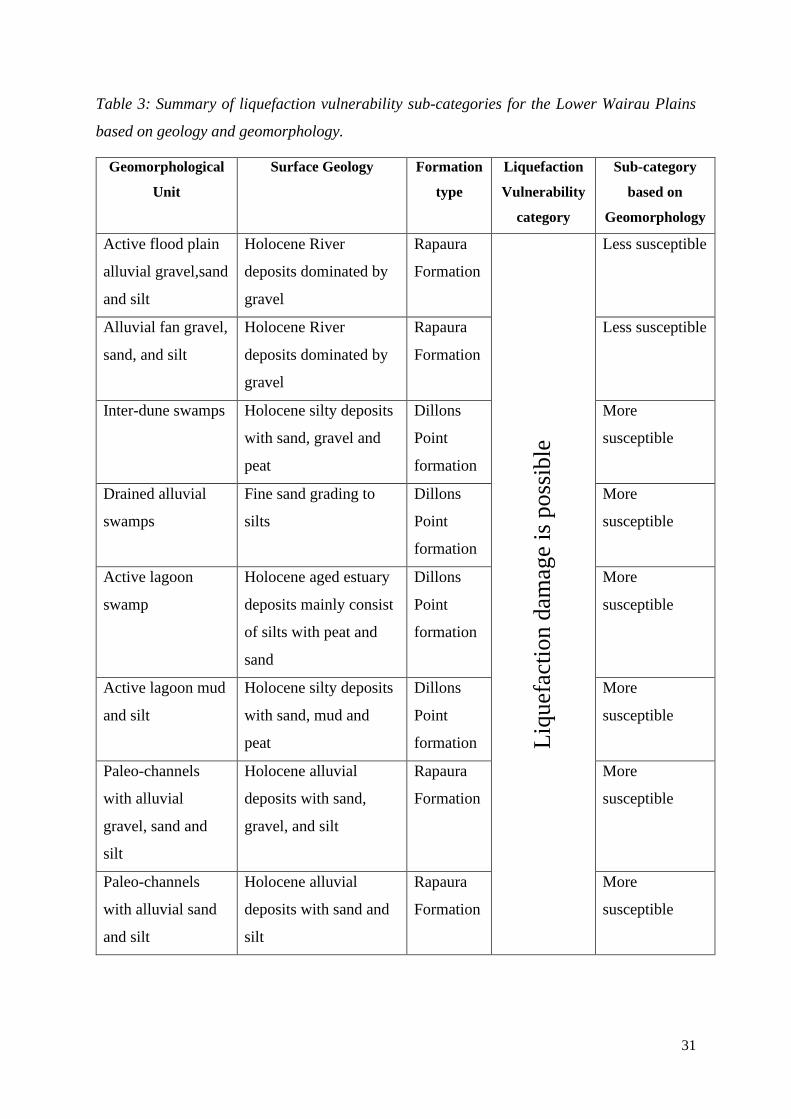
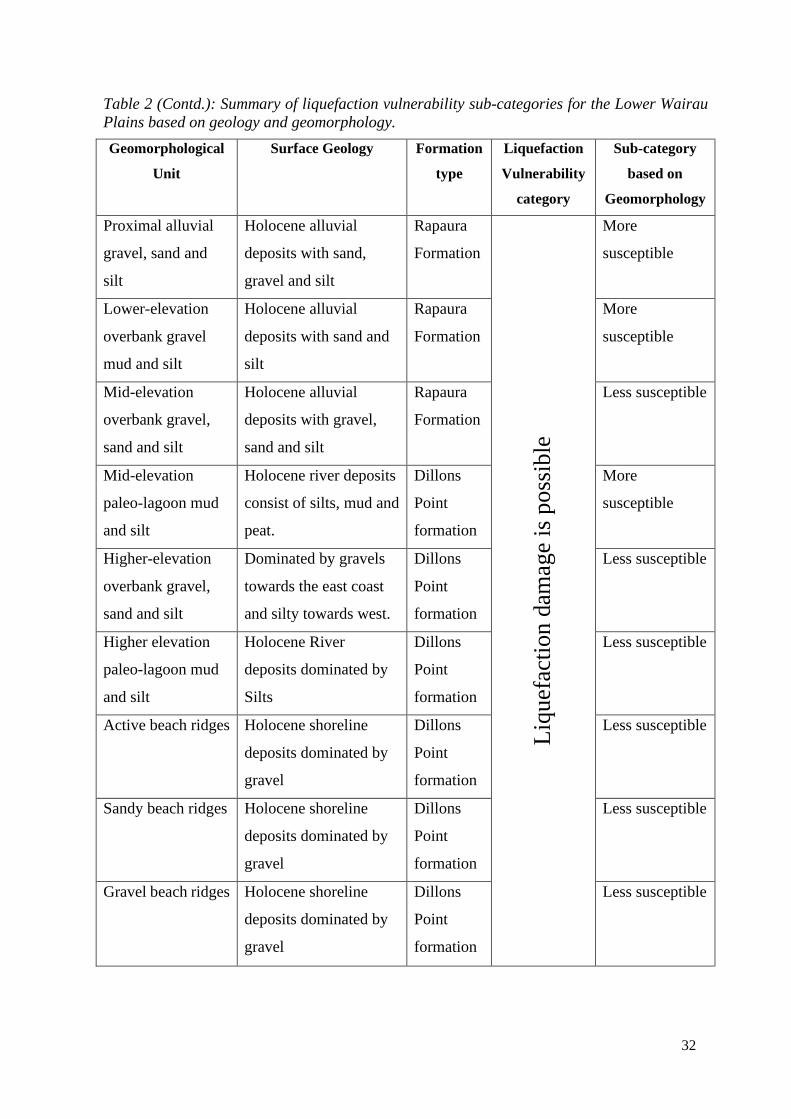
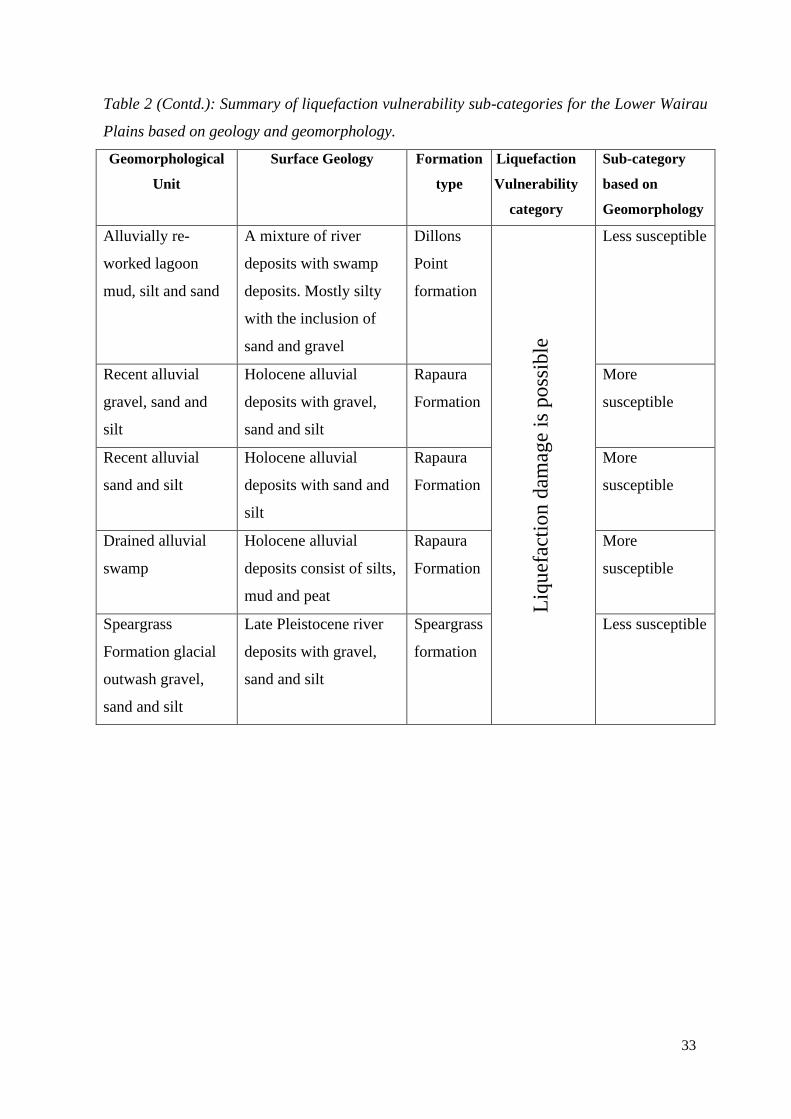
7.1.13 Summary of geomorphological screening
Based on the available geomorphological data, new sub-categories of less susceptible and more
susceptible are assigned, sitting within the Liquefaction damage is possible category. This
additional sub-categorisation can be used to guide the locations of future geotechnical site
investigation to potentially refine classifications based on an increased density of site
investigation data in these units. Table 3 summarises details of the sub-categorisation and
Figure 15 summarises these sub-categories for the Lower Wairau Plains. Rapaura Formation
deposits consists of alluvial gravel, sand and silt. These deposits are categorised based on
elevation and nature of dominating deposits. Overbank alluvial deposits which are Mid- and
High-elevation likely to have predominately gravel and deep water tables which makes them
less susceptible. Lower elevation overbank alluvial deposits are dominated by sand and silt and
are assigned More susceptible. Active flood plains and alluvial fans are assigned Less
susceptible while recent, paleo and proximal alluvial deposits are assigned More susceptible
within this formation. All deposits with beach ridges are assigned Less susceptible as they are
well sorted alluvial material and highly compacted along the shore. Lagoon deposits are
assigned More susceptible as these are generally overlain by alluvial sands and silts. Although
some deposits have organic material and mud these can still be prone to liquefaction and has
been seen in past earthquakes. Speargrass Formation deposits which are gravel dominated and
originate from adjacent rock deposits in the region are assigned Less susceptible.
31
Table 3: Summary of liquefaction vulnerability sub-categories for the Lower Wairau Plains
based on geology and geomorphology.
Geomorphological
Unit
Surface Geology Formation
type
Liquefaction
Vulnerability
category
Sub-category
based on
Geomorphology
Active flood plain
alluvial gravel,sand
and silt
Holocene River
deposits dominated by
gravel
Rapaura
Formation
Liq
uef
acti
on d
amag
e is
poss
ible
Less susceptible
Alluvial fan gravel,
sand, and silt
Holocene River
deposits dominated by
gravel
Rapaura
Formation
Less susceptible
Inter-dune swamps Holocene silty deposits
with sand, gravel and
peat
Dillons
Point
formation
More
susceptible
Drained alluvial
swamps
Fine sand grading to
silts
Dillons
Point
formation
More
susceptible
Active lagoon
swamp
Holocene aged estuary
deposits mainly consist
of silts with peat and
sand
Dillons
Point
formation
More
susceptible
Active lagoon mud
and silt
Holocene silty deposits
with sand, mud and
peat
Dillons
Point
formation
More
susceptible
Paleo-channels
with alluvial
gravel, sand and
silt
Holocene alluvial
deposits with sand,
gravel, and silt
Rapaura
Formation
More
susceptible
Paleo-channels
with alluvial sand
and silt
Holocene alluvial
deposits with sand and
silt
Rapaura
Formation
More
susceptible
32
Table 2 (Contd.): Summary of liquefaction vulnerability sub-categories for the Lower Wairau
Plains based on geology and geomorphology.
Geomorphological
Unit
Surface Geology Formation
type
Liquefaction
Vulnerability
category
Sub-category
based on
Geomorphology
Proximal alluvial
gravel, sand and
silt
Holocene alluvial
deposits with sand,
gravel and silt
Rapaura
Formation
Liq
uef
acti
on d
amag
e is
poss
ible
More
susceptible
Lower-elevation
overbank gravel
mud and silt
Holocene alluvial
deposits with sand and
silt
Rapaura
Formation
More
susceptible
Mid-elevation
overbank gravel,
sand and silt
Holocene alluvial
deposits with gravel,
sand and silt
Rapaura
Formation
Less susceptible
Mid-elevation
paleo-lagoon mud
and silt
Holocene river deposits
consist of silts, mud and
peat.
Dillons
Point
formation
More
susceptible
Higher-elevation
overbank gravel,
sand and silt
Dominated by gravels
towards the east coast
and silty towards west.
Dillons
Point
formation
Less susceptible
Higher elevation
paleo-lagoon mud
and silt
Holocene River
deposits dominated by
Silts
Dillons
Point
formation
Less susceptible
Active beach ridges Holocene shoreline
deposits dominated by
gravel
Dillons
Point
formation
Less susceptible
Sandy beach ridges Holocene shoreline
deposits dominated by
gravel
Dillons
Point
formation
Less susceptible
Gravel beach ridges Holocene shoreline
deposits dominated by
gravel
Dillons
Point
formation
Less susceptible
33
Table 2 (Contd.): Summary of liquefaction vulnerability sub-categories for the Lower Wairau
Plains based on geology and geomorphology.
Geomorphological
Unit
Surface Geology Formation
type
Liquefaction
Vulnerability
category
Sub-category
based on
Geomorphology
Alluvially re-
worked lagoon
mud, silt and sand
A mixture of river
deposits with swamp
deposits. Mostly silty
with the inclusion of
sand and gravel
Dillons
Point
formation
Liq
uef
acti
on
dam
age
is p
oss
ible
Less susceptible
Recent alluvial
gravel, sand and
silt
Holocene alluvial
deposits with gravel,
sand and silt
Rapaura
Formation
More
susceptible
Recent alluvial
sand and silt
Holocene alluvial
deposits with sand and
silt
Rapaura
Formation
More
susceptible
Drained alluvial
swamp
Holocene alluvial
deposits consist of silts,
mud and peat
Rapaura
Formation
More
susceptible
Speargrass
Formation glacial
outwash gravel,
sand and silt
Late Pleistocene river
deposits with gravel,
sand and silt
Speargrass
formation
Less susceptible
34
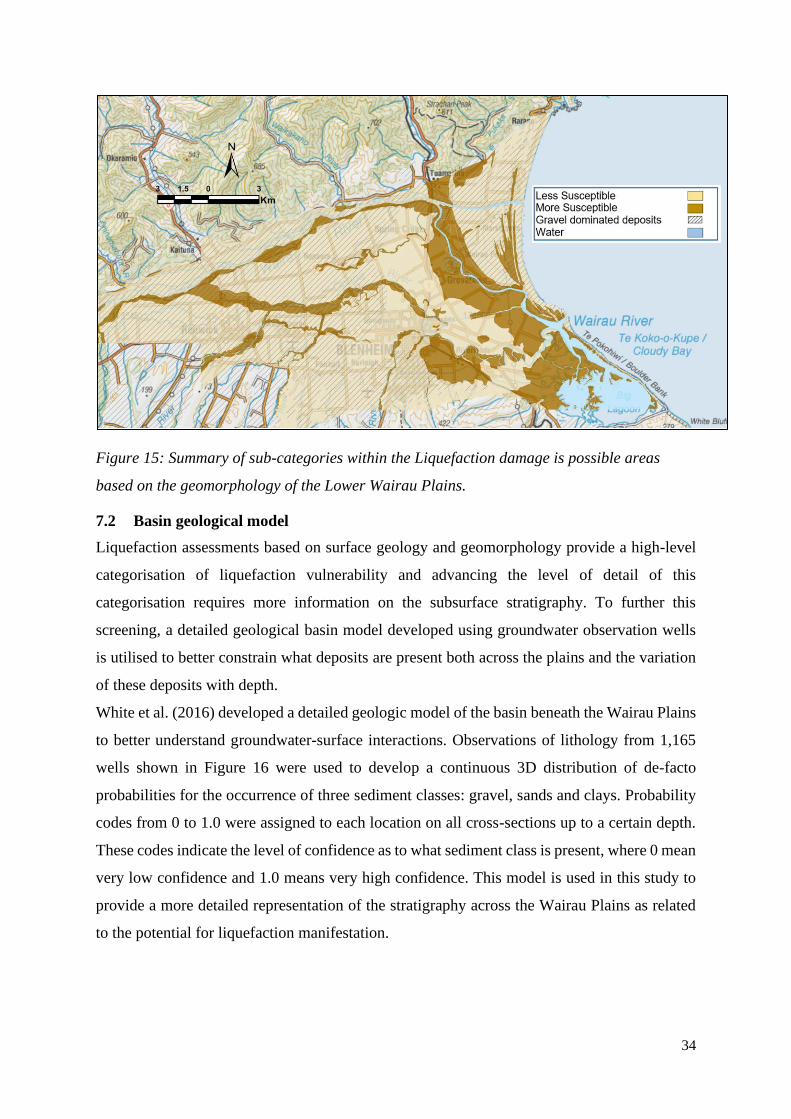
Figure 15: Summary of sub-categories within the Liquefaction damage is possible areas
based on the geomorphology of the Lower Wairau Plains.
7.2 Basin geological model
Liquefaction assessments based on surface geology and geomorphology provide a high-level
categorisation of liquefaction vulnerability and advancing the level of detail of this
categorisation requires more information on the subsurface stratigraphy. To further this
screening, a detailed geological basin model developed using groundwater observation wells
is utilised to better constrain what deposits are present both across the plains and the variation
of these deposits with depth.
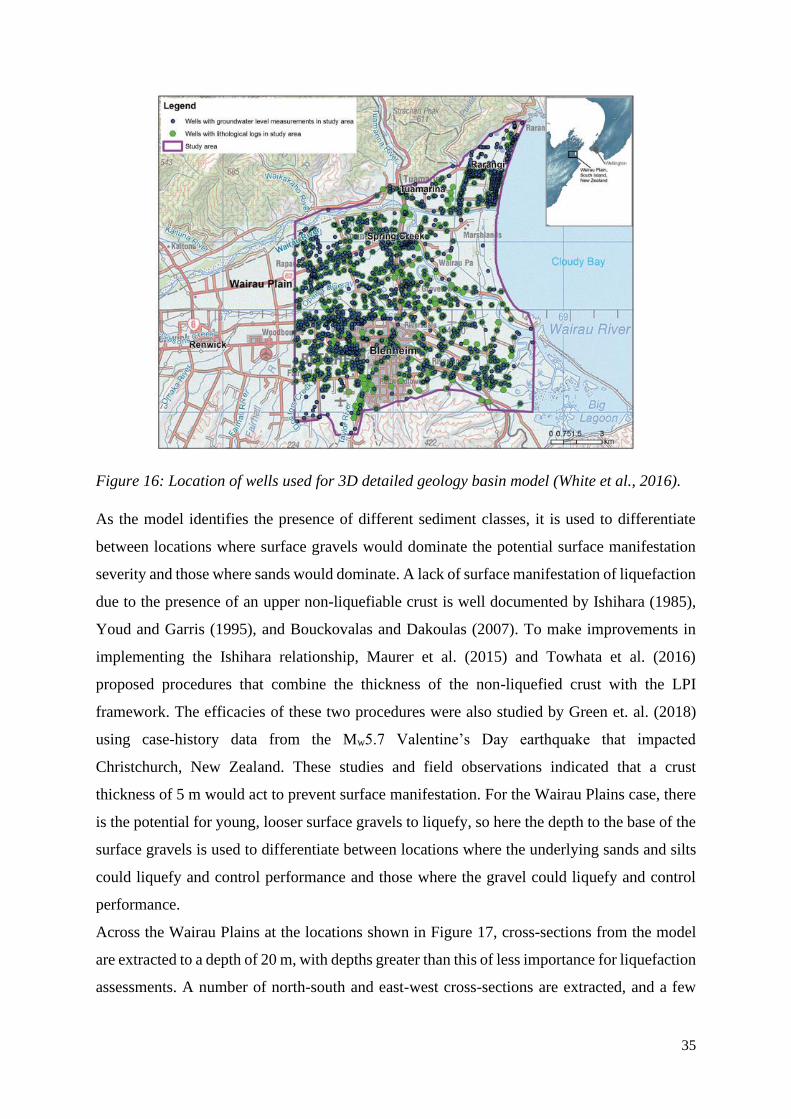
White et al. (2016) developed a detailed geologic model of the basin beneath the Wairau Plains
to better understand groundwater-surface interactions. Observations of lithology from 1,165
wells shown in Figure 16 were used to develop a continuous 3D distribution of de-facto
probabilities for the occurrence of three sediment classes: gravel, sands and clays. Probability
codes from 0 to 1.0 were assigned to each location on all cross-sections up to a certain depth.
These codes indicate the level of confidence as to what sediment class is present, where 0 mean
very low confidence and 1.0 means very high confidence. This model is used in this study to
provide a more detailed representation of the stratigraphy across the Wairau Plains as related
to the potential for liquefaction manifestation.
35
Figure 16: Location of wells used for 3D detailed geology basin model (White et al., 2016).
As the model identifies the presence of different sediment classes, it is used to differentiate
between locations where surface gravels would dominate the potential surface manifestation
severity and those where sands would dominate. A lack of surface manifestation of liquefaction
due to the presence of an upper non-liquefiable crust is well documented by Ishihara (1985),
Youd and Garris (1995), and Bouckovalas and Dakoulas (2007). To make improvements in
implementing the Ishihara relationship, Maurer et al. (2015) and Towhata et al. (2016)
proposed procedures that combine the thickness of the non-liquefied crust with the LPI
framework. The efficacies of these two procedures were also studied by Green et. al. (2018)
using case-history data from the Mw5.7 Valentine’s Day earthquake that impacted
Christchurch, New Zealand. These studies and field observations indicated that a crust
thickness of 5 m would act to prevent surface manifestation. For the Wairau Plains case, there
is the potential for young, looser surface gravels to liquefy, so here the depth to the base of the
surface gravels is used to differentiate between locations where the underlying sands and silts
could liquefy and control performance and those where the gravel could liquefy and control
performance.
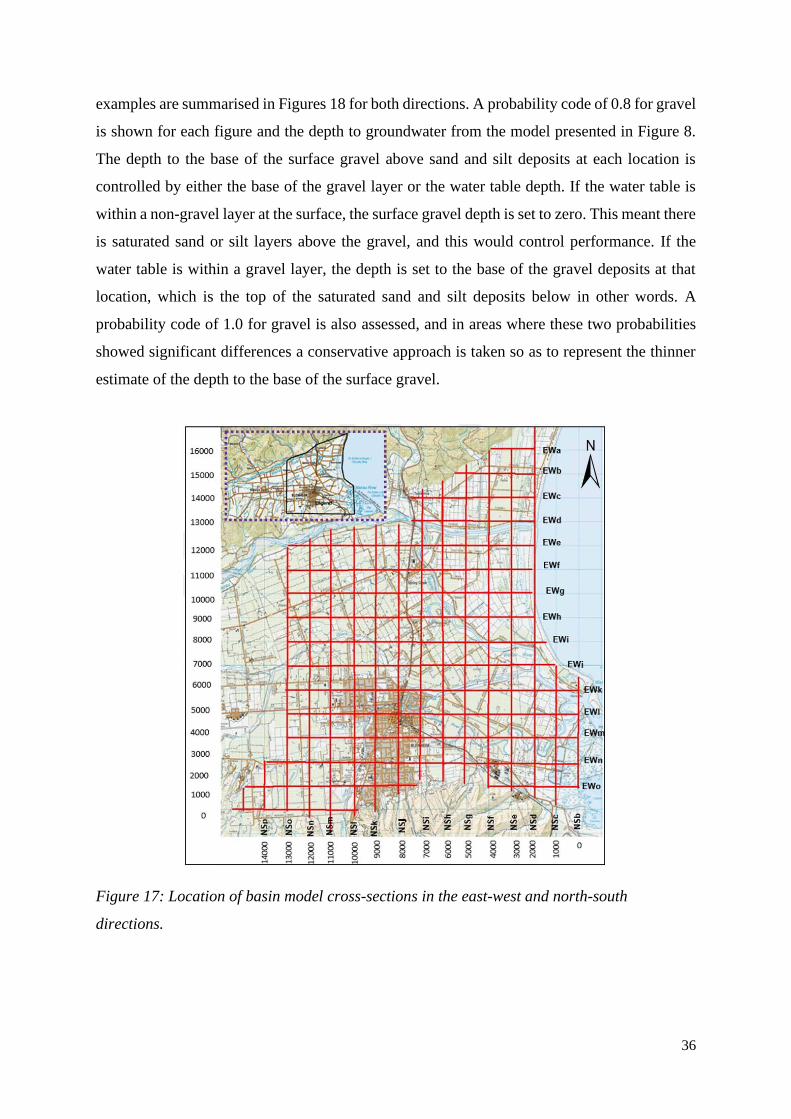
Across the Wairau Plains at the locations shown in Figure 17, cross-sections from the model
are extracted to a depth of 20 m, with depths greater than this of less importance for liquefaction
assessments. A number of north-south and east-west cross-sections are extracted, and a few
36
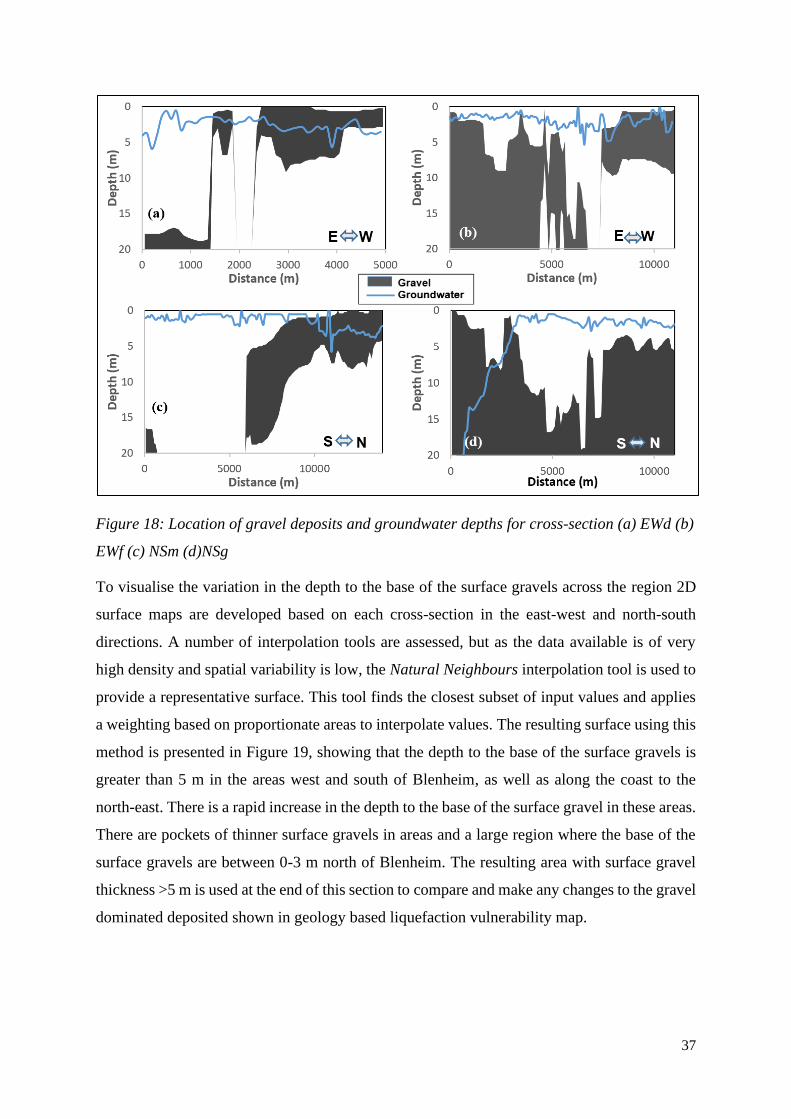
examples are summarised in Figures 18 for both directions. A probability code of 0.8 for gravel
is shown for each figure and the depth to groundwater from the model presented in Figure 8.
The depth to the base of the surface gravel above sand and silt deposits at each location is
controlled by either the base of the gravel layer or the water table depth. If the water table is
within a non-gravel layer at the surface, the surface gravel depth is set to zero. This meant there
is saturated sand or silt layers above the gravel, and this would control performance. If the
water table is within a gravel layer, the depth is set to the base of the gravel deposits at that
location, which is the top of the saturated sand and silt deposits below in other words. A
probability code of 1.0 for gravel is also assessed, and in areas where these two probabilities
showed significant differences a conservative approach is taken so as to represent the thinner
estimate of the depth to the base of the surface gravel.
Figure 17: Location of basin model cross-sections in the east-west and north-south
directions.
37
Figure 18: Location of gravel deposits and groundwater depths for cross-section (a) EWd (b)
EWf (c) NSm (d)NSg
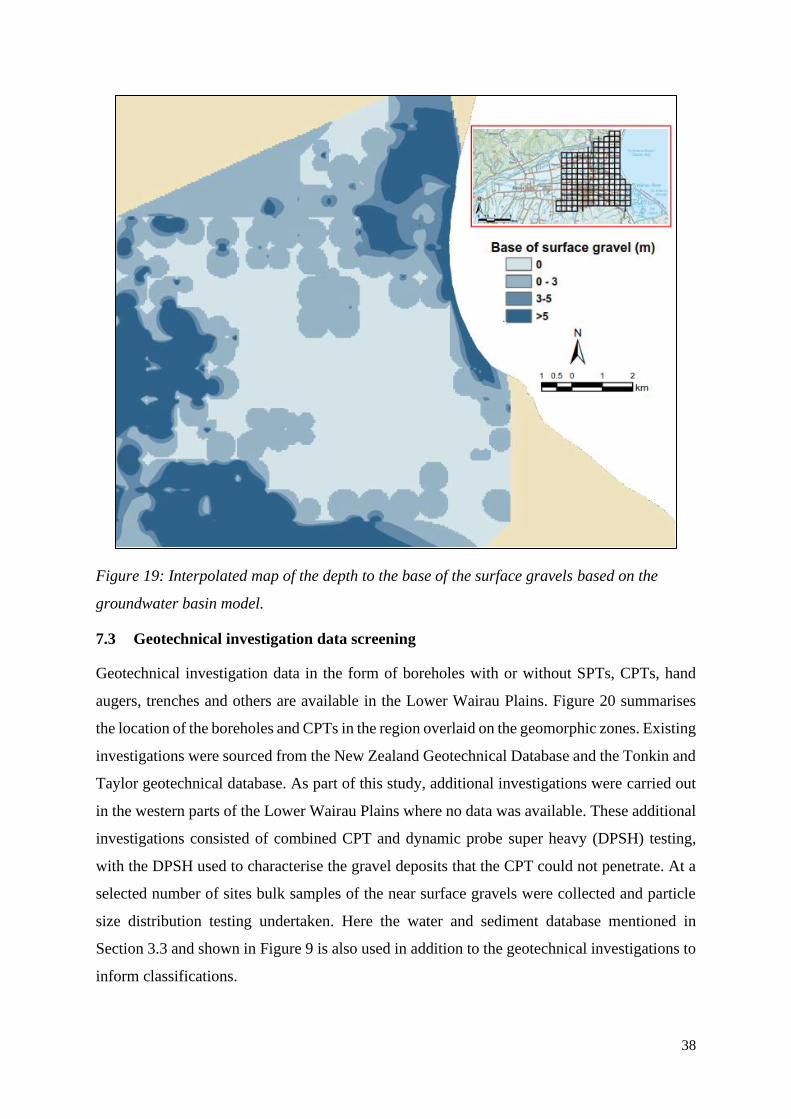
To visualise the variation in the depth to the base of the surface gravels across the region 2D
surface maps are developed based on each cross-section in the east-west and north-south
directions. A number of interpolation tools are assessed, but as the data available is of very
high density and spatial variability is low, the Natural Neighbours interpolation tool is used to
provide a representative surface. This tool finds the closest subset of input values and applies
a weighting based on proportionate areas to interpolate values. The resulting surface using this
method is presented in Figure 19, showing that the depth to the base of the surface gravels is
greater than 5 m in the areas west and south of Blenheim, as well as along the coast to the
north-east. There is a rapid increase in the depth to the base of the surface gravel in these areas.
There are pockets of thinner surface gravels in areas and a large region where the base of the
surface gravels are between 0-3 m north of Blenheim. The resulting area with surface gravel
thickness >5 m is used at the end of this section to compare and make any changes to the gravel
dominated deposited shown in geology based liquefaction vulnerability map.
38
Figure 19: Interpolated map of the depth to the base of the surface gravels based on the
groundwater basin model.
7.3 Geotechnical investigation data screening
Geotechnical investigation data in the form of boreholes with or without SPTs, CPTs, hand
augers, trenches and others are available in the Lower Wairau Plains. Figure 20 summarises
the location of the boreholes and CPTs in the region overlaid on the geomorphic zones. Existing
investigations were sourced from the New Zealand Geotechnical Database and the Tonkin and
Taylor geotechnical database. As part of this study, additional investigations were carried out
in the western parts of the Lower Wairau Plains where no data was available. These additional
investigations consisted of combined CPT and dynamic probe super heavy (DPSH) testing,
with the DPSH used to characterise the gravel deposits that the CPT could not penetrate. At a
selected number of sites bulk samples of the near surface gravels were collected and particle
size distribution testing undertaken. Here the water and sediment database mentioned in
Section 3.3 and shown in Figure 9 is also used in addition to the geotechnical investigations to
inform classifications.
39
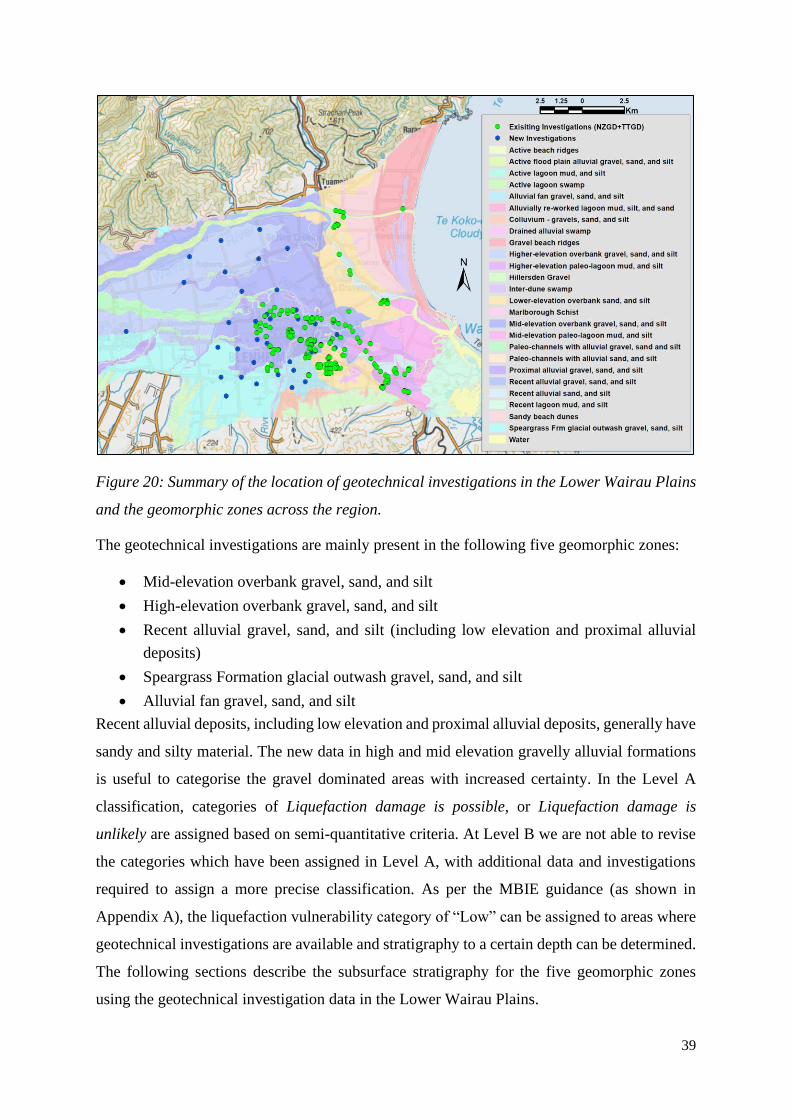
Figure 20: Summary of the location of geotechnical investigations in the Lower Wairau Plains
and the geomorphic zones across the region.
The geotechnical investigations are mainly present in the following five geomorphic zones:
• Mid-elevation overbank gravel, sand, and silt
• High-elevation overbank gravel, sand, and silt
• Recent alluvial gravel, sand, and silt (including low elevation and proximal alluvial
deposits)
• Speargrass Formation glacial outwash gravel, sand, and silt
• Alluvial fan gravel, sand, and silt
Recent alluvial deposits, including low elevation and proximal alluvial deposits, generally have
sandy and silty material. The new data in high and mid elevation gravelly alluvial formations
is useful to categorise the gravel dominated areas with increased certainty. In the Level A
classification, categories of Liquefaction damage is possible, or Liquefaction damage is
unlikely are assigned based on semi-quantitative criteria. At Level B we are not able to revise
the categories which have been assigned in Level A, with additional data and investigations
required to assign a more precise classification. As per the MBIE guidance (as shown in
Appendix A), the liquefaction vulnerability category of “Low” can be assigned to areas where
geotechnical investigations are available and stratigraphy to a certain depth can be determined.
The following sections describe the subsurface stratigraphy for the five geomorphic zones
using the geotechnical investigation data in the Lower Wairau Plains.
40
7.3.1 Mid-elevation overbank gravel, sand and silt
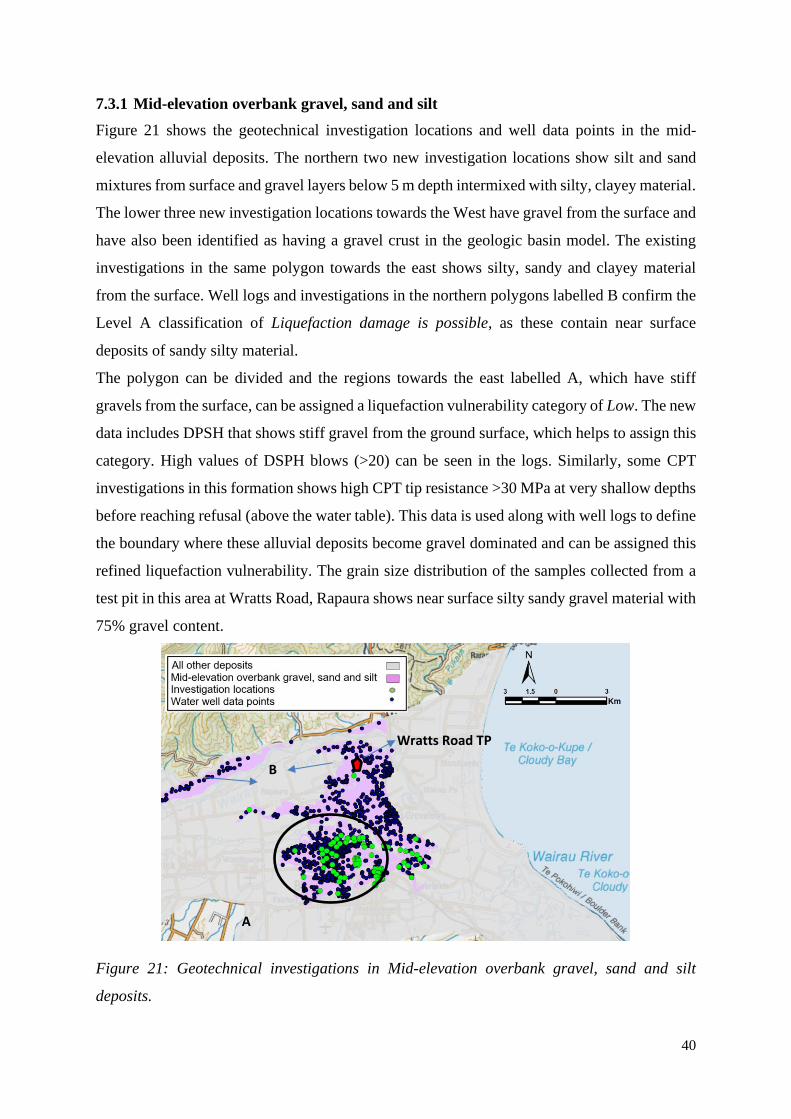
Figure 21 shows the geotechnical investigation locations and well data points in the mid-
elevation alluvial deposits. The northern two new investigation locations show silt and sand
mixtures from surface and gravel layers below 5 m depth intermixed with silty, clayey material.
The lower three new investigation locations towards the West have gravel from the surface and
have also been identified as having a gravel crust in the geologic basin model. The existing
investigations in the same polygon towards the east shows silty, sandy and clayey material
from the surface. Well logs and investigations in the northern polygons labelled B confirm the
Level A classification of Liquefaction damage is possible, as these contain near surface
deposits of sandy silty material.
The polygon can be divided and the regions towards the east labelled A, which have stiff
gravels from the surface, can be assigned a liquefaction vulnerability category of Low. The new
data includes DPSH that shows stiff gravel from the ground surface, which helps to assign this
category. High values of DSPH blows (>20) can be seen in the logs. Similarly, some CPT
investigations in this formation shows high CPT tip resistance >30 MPa at very shallow depths
before reaching refusal (above the water table). This data is used along with well logs to define
the boundary where these alluvial deposits become gravel dominated and can be assigned this
refined liquefaction vulnerability. The grain size distribution of the samples collected from a
test pit in this area at Wratts Road, Rapaura shows near surface silty sandy gravel material with
75% gravel content.
Figure 21: Geotechnical investigations in Mid-elevation overbank gravel, sand and silt
deposits.
A
Wratts Road TP
B
41
7.3.2 High-elevation overbank gravel, sand and silt
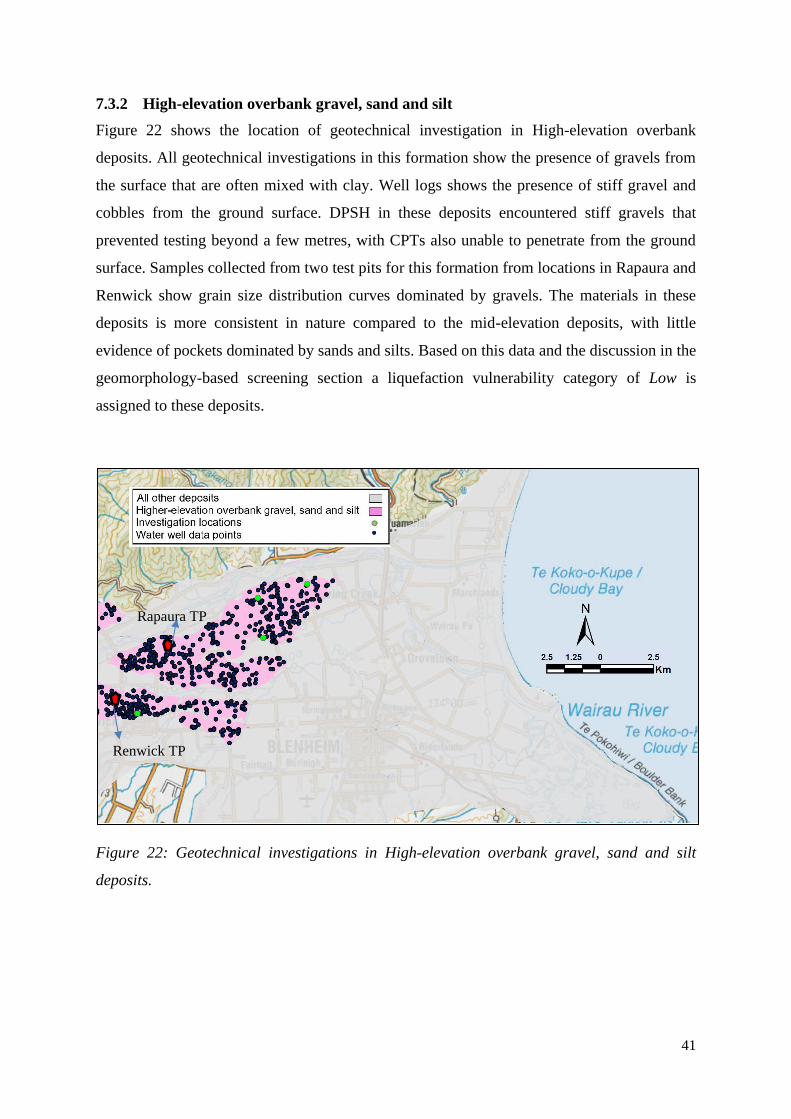
Figure 22 shows the location of geotechnical investigation in High-elevation overbank
deposits. All geotechnical investigations in this formation show the presence of gravels from
the surface that are often mixed with clay. Well logs shows the presence of stiff gravel and
cobbles from the ground surface. DPSH in these deposits encountered stiff gravels that
prevented testing beyond a few metres, with CPTs also unable to penetrate from the ground
surface. Samples collected from two test pits for this formation from locations in Rapaura and
Renwick show grain size distribution curves dominated by gravels. The materials in these
deposits is more consistent in nature compared to the mid-elevation deposits, with little
evidence of pockets dominated by sands and silts. Based on this data and the discussion in the
geomorphology-based screening section a liquefaction vulnerability category of Low is
assigned to these deposits.
Figure 22: Geotechnical investigations in High-elevation overbank gravel, sand and silt
deposits.
Rapaura TP
Renwick TP
42
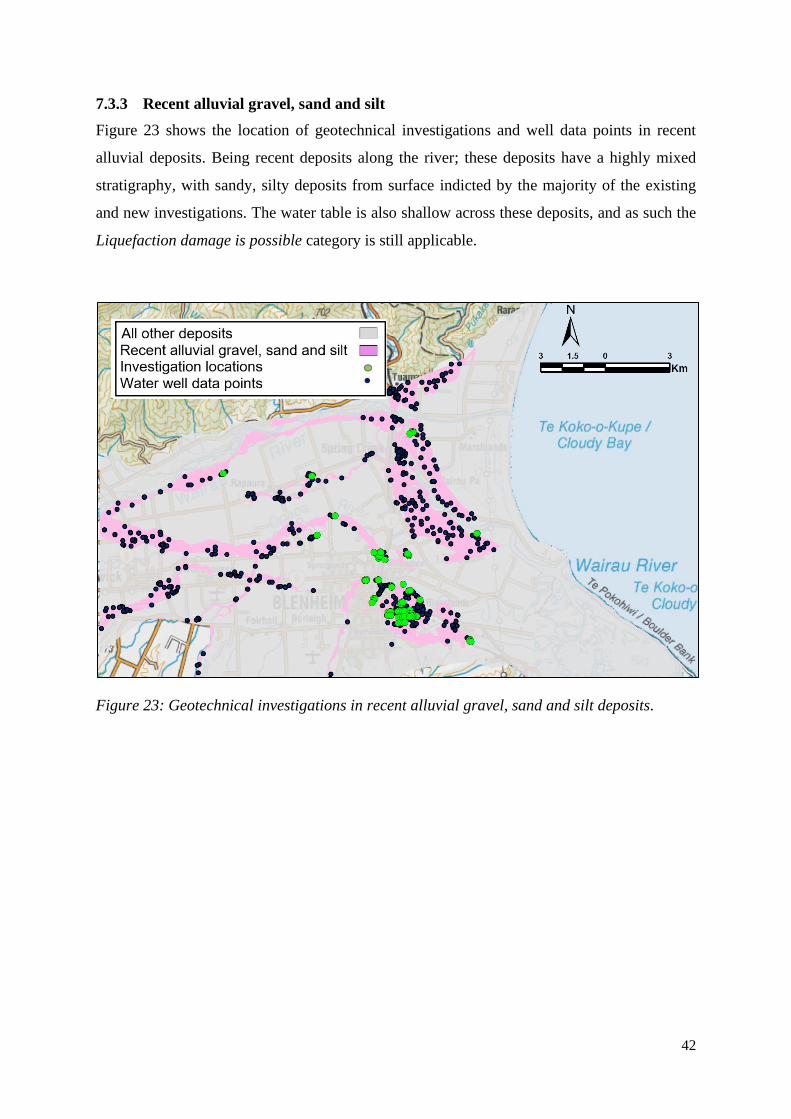
7.3.3 Recent alluvial gravel, sand and silt
Figure 23 shows the location of geotechnical investigations and well data points in recent
alluvial deposits. Being recent deposits along the river; these deposits have a highly mixed
stratigraphy, with sandy, silty deposits from surface indicted by the majority of the existing
and new investigations. The water table is also shallow across these deposits, and as such the
Liquefaction damage is possible category is still applicable.
Figure 23: Geotechnical investigations in recent alluvial gravel, sand and silt deposits.
43
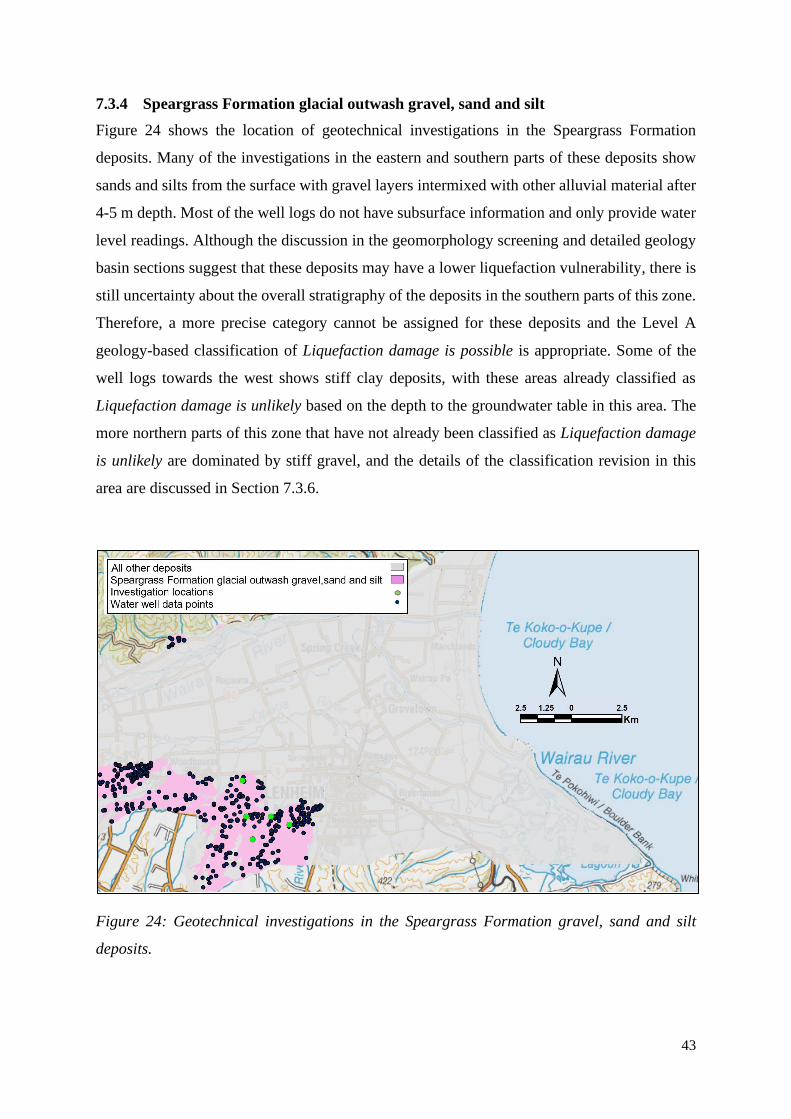
7.3.4 Speargrass Formation glacial outwash gravel, sand and silt
Figure 24 shows the location of geotechnical investigations in the Speargrass Formation
deposits. Many of the investigations in the eastern and southern parts of these deposits show
sands and silts from the surface with gravel layers intermixed with other alluvial material after
4-5 m depth. Most of the well logs do not have subsurface information and only provide water
level readings. Although the discussion in the geomorphology screening and detailed geology
basin sections suggest that these deposits may have a lower liquefaction vulnerability, there is
still uncertainty about the overall stratigraphy of the deposits in the southern parts of this zone.
Therefore, a more precise category cannot be assigned for these deposits and the Level A
geology-based classification of Liquefaction damage is possible is appropriate. Some of the
well logs towards the west shows stiff clay deposits, with these areas already classified as
Liquefaction damage is unlikely based on the depth to the groundwater table in this area. The
more northern parts of this zone that have not already been classified as Liquefaction damage
is unlikely are dominated by stiff gravel, and the details of the classification revision in this
area are discussed in Section 7.3.6.
Figure 24: Geotechnical investigations in the Speargrass Formation gravel, sand and silt
deposits.
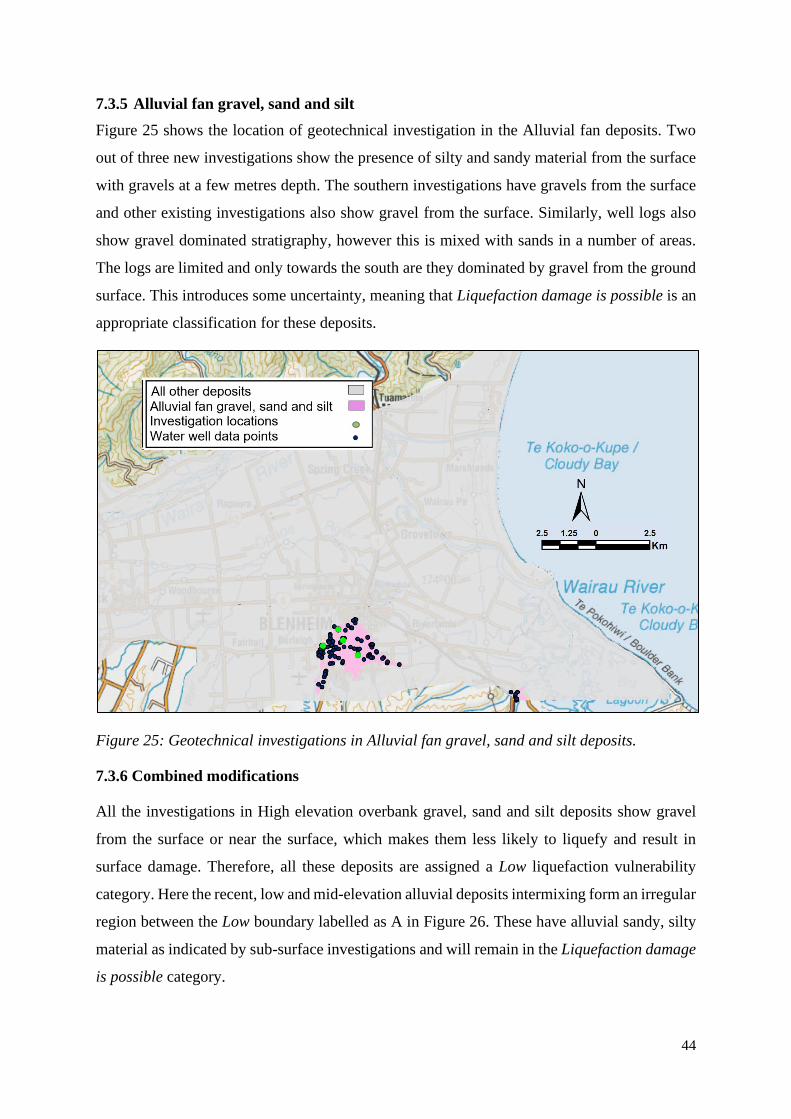
44
7.3.5 Alluvial fan gravel, sand and silt
Figure 25 shows the location of geotechnical investigation in the Alluvial fan deposits. Two
out of three new investigations show the presence of silty and sandy material from the surface
with gravels at a few metres depth. The southern investigations have gravels from the surface
and other existing investigations also show gravel from the surface. Similarly, well logs also
show gravel dominated stratigraphy, however this is mixed with sands in a number of areas.
The logs are limited and only towards the south are they dominated by gravel from the ground
surface. This introduces some uncertainty, meaning that Liquefaction damage is possible is an
appropriate classification for these deposits.
Figure 25: Geotechnical investigations in Alluvial fan gravel, sand and silt deposits.
7.3.6 Combined modifications
All the investigations in High elevation overbank gravel, sand and silt deposits show gravel
from the surface or near the surface, which makes them less likely to liquefy and result in
surface damage. Therefore, all these deposits are assigned a Low liquefaction vulnerability
category. Here the recent, low and mid-elevation alluvial deposits intermixing form an irregular
region between the Low boundary labelled as A in Figure 26. These have alluvial sandy, silty
material as indicated by sub-surface investigations and will remain in the Liquefaction damage
is possible category.
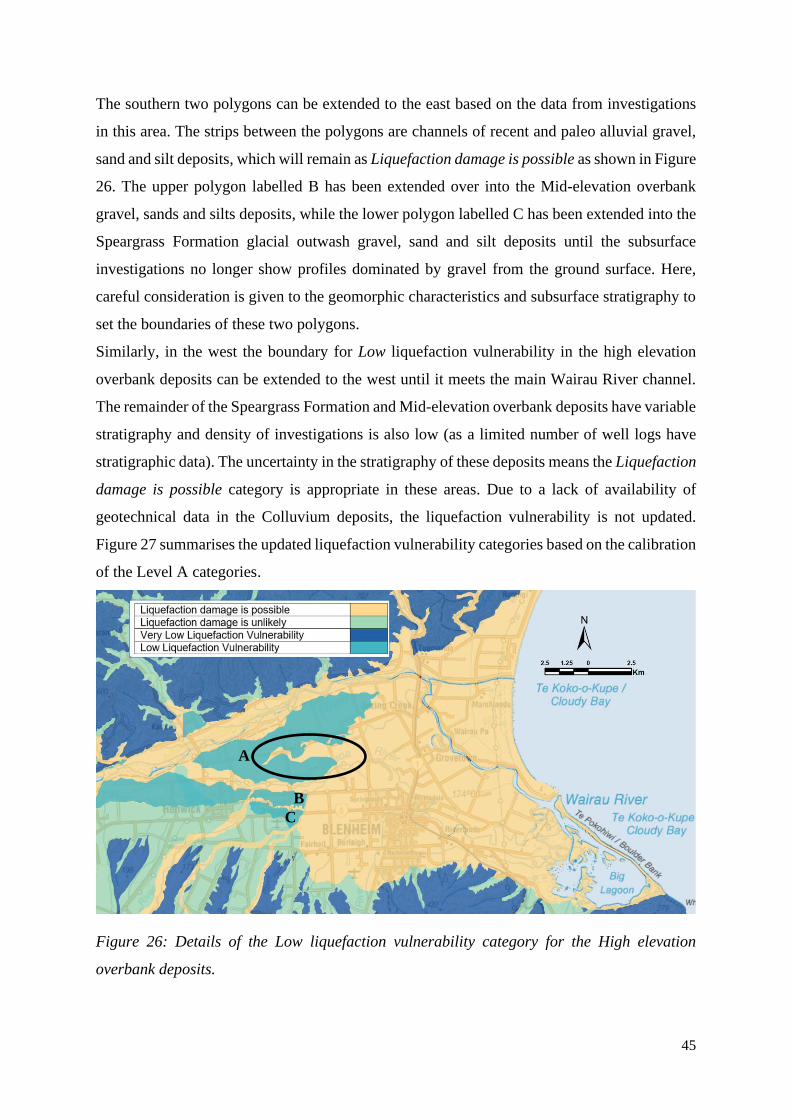
45
The southern two polygons can be extended to the east based on the data from investigations
in this area. The strips between the polygons are channels of recent and paleo alluvial gravel,
sand and silt deposits, which will remain as Liquefaction damage is possible as shown in Figure
26. The upper polygon labelled B has been extended over into the Mid-elevation overbank
gravel, sands and silts deposits, while the lower polygon labelled C has been extended into the
Speargrass Formation glacial outwash gravel, sand and silt deposits until the subsurface
investigations no longer show profiles dominated by gravel from the ground surface. Here,
careful consideration is given to the geomorphic characteristics and subsurface stratigraphy to
set the boundaries of these two polygons.
Similarly, in the west the boundary for Low liquefaction vulnerability in the high elevation
overbank deposits can be extended to the west until it meets the main Wairau River channel.
The remainder of the Speargrass Formation and Mid-elevation overbank deposits have variable
stratigraphy and density of investigations is also low (as a limited number of well logs have
stratigraphic data). The uncertainty in the stratigraphy of these deposits means the Liquefaction
damage is possible category is appropriate in these areas. Due to a lack of availability of
geotechnical data in the Colluvium deposits, the liquefaction vulnerability is not updated.
Figure 27 summarises the updated liquefaction vulnerability categories based on the calibration
of the Level A categories.
Figure 26: Details of the Low liquefaction vulnerability category for the High elevation
overbank deposits.
A
B
C
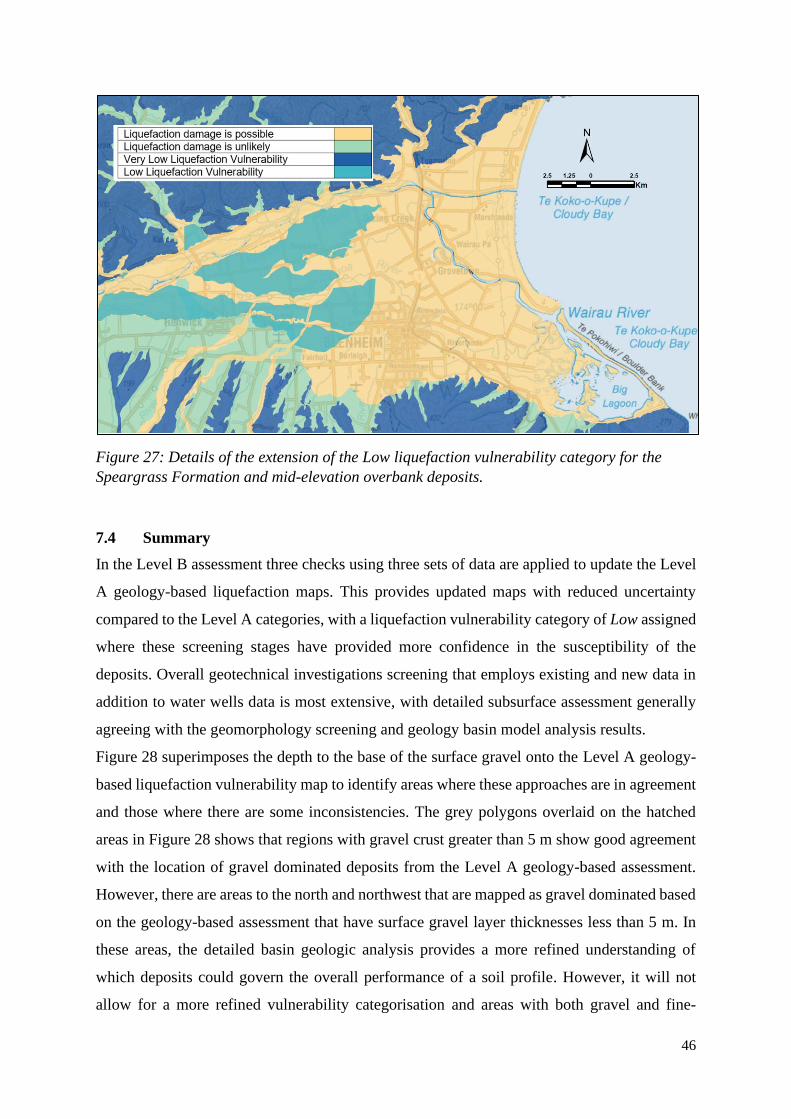
46
Figure 27: Details of the extension of the Low liquefaction vulnerability category for the
Speargrass Formation and mid-elevation overbank deposits.
7.4 Summary
In the Level B assessment three checks using three sets of data are applied to update the Level
A geology-based liquefaction maps. This provides updated maps with reduced uncertainty
compared to the Level A categories, with a liquefaction vulnerability category of Low assigned
where these screening stages have provided more confidence in the susceptibility of the
deposits. Overall geotechnical investigations screening that employs existing and new data in
addition to water wells data is most extensive, with detailed subsurface assessment generally
agreeing with the geomorphology screening and geology basin model analysis results.
Figure 28 superimposes the depth to the base of the surface gravel onto the Level A geology-
based liquefaction vulnerability map to identify areas where these approaches are in agreement
and those where there are some inconsistencies. The grey polygons overlaid on the hatched
areas in Figure 28 shows that regions with gravel crust greater than 5 m show good agreement
with the location of gravel dominated deposits from the Level A geology-based assessment.
However, there are areas to the north and northwest that are mapped as gravel dominated based
on the geology-based assessment that have surface gravel layer thicknesses less than 5 m. In
these areas, the detailed basin geologic analysis provides a more refined understanding of
which deposits could govern the overall performance of a soil profile. However, it will not
allow for a more refined vulnerability categorisation and areas with both gravel and fine-
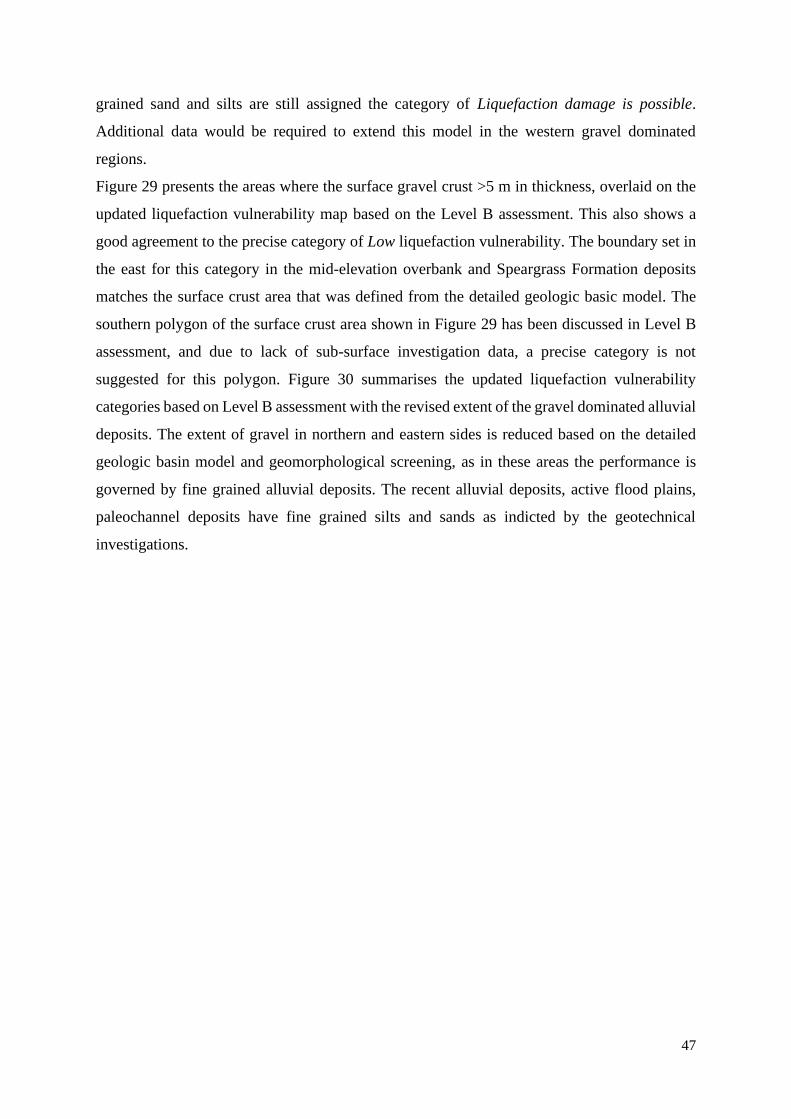
47
grained sand and silts are still assigned the category of Liquefaction damage is possible.
Additional data would be required to extend this model in the western gravel dominated
regions.
Figure 29 presents the areas where the surface gravel crust >5 m in thickness, overlaid on the
updated liquefaction vulnerability map based on the Level B assessment. This also shows a
good agreement to the precise category of Low liquefaction vulnerability. The boundary set in
the east for this category in the mid-elevation overbank and Speargrass Formation deposits
matches the surface crust area that was defined from the detailed geologic basic model. The
southern polygon of the surface crust area shown in Figure 29 has been discussed in Level B
assessment, and due to lack of sub-surface investigation data, a precise category is not
suggested for this polygon. Figure 30 summarises the updated liquefaction vulnerability
categories based on Level B assessment with the revised extent of the gravel dominated alluvial
deposits. The extent of gravel in northern and eastern sides is reduced based on the detailed
geologic basin model and geomorphological screening, as in these areas the performance is
governed by fine grained alluvial deposits. The recent alluvial deposits, active flood plains,
paleochannel deposits have fine grained silts and sands as indicted by the geotechnical
investigations.
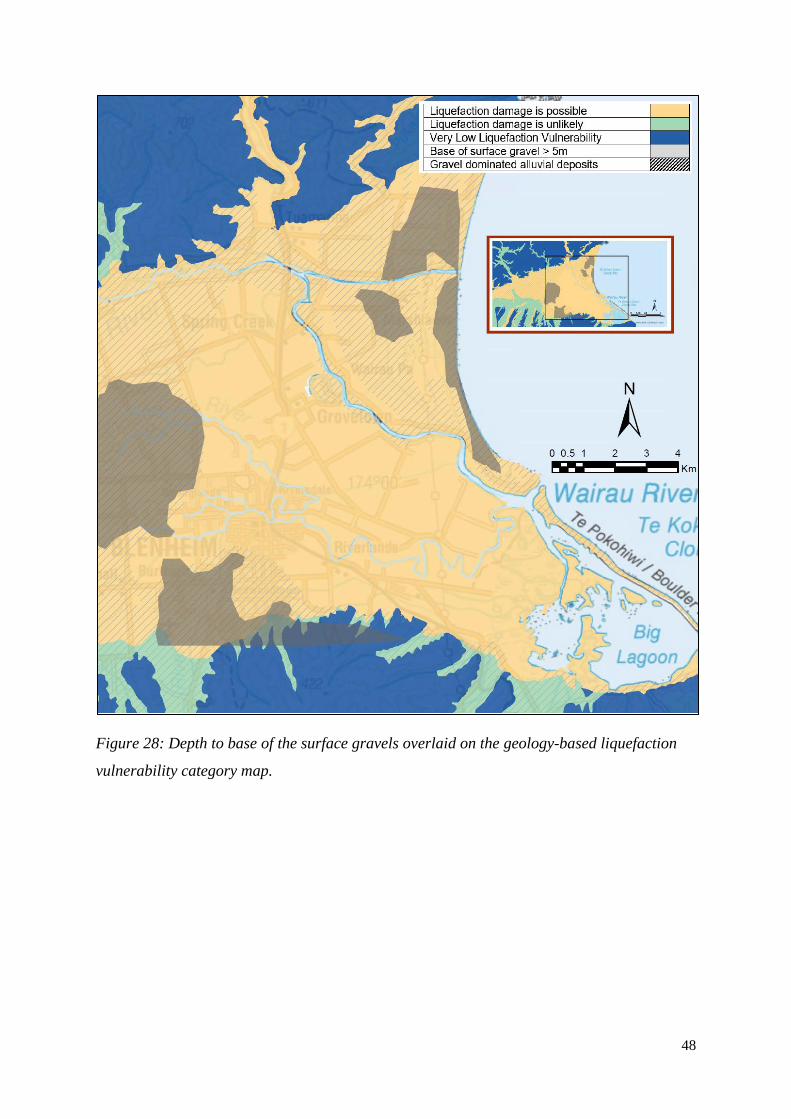
48
Figure 28: Depth to base of the surface gravels overlaid on the geology-based liquefaction
vulnerability category map.
49
Figure 29: Summary of liquefaction vulnerability category map for the Lower Wairau Plains and base of gravel greater than 5 m.
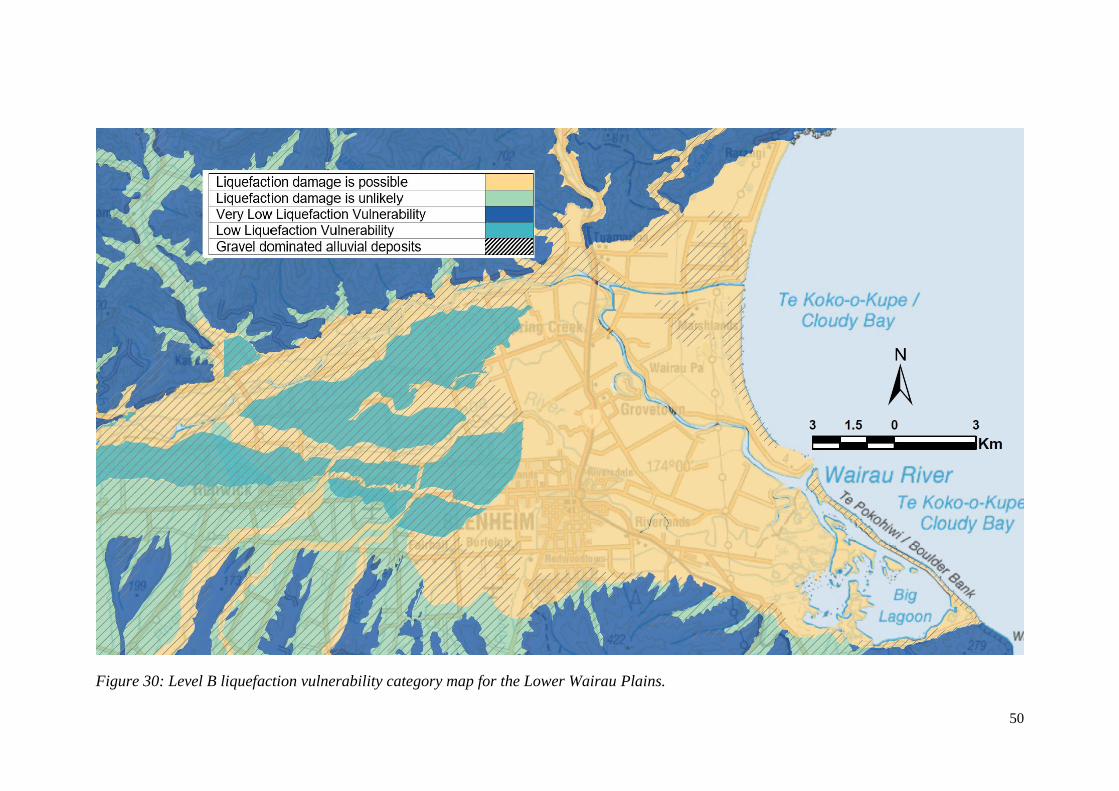
50
Figure 30: Level B liquefaction vulnerability category map for the Lower Wairau Plains.
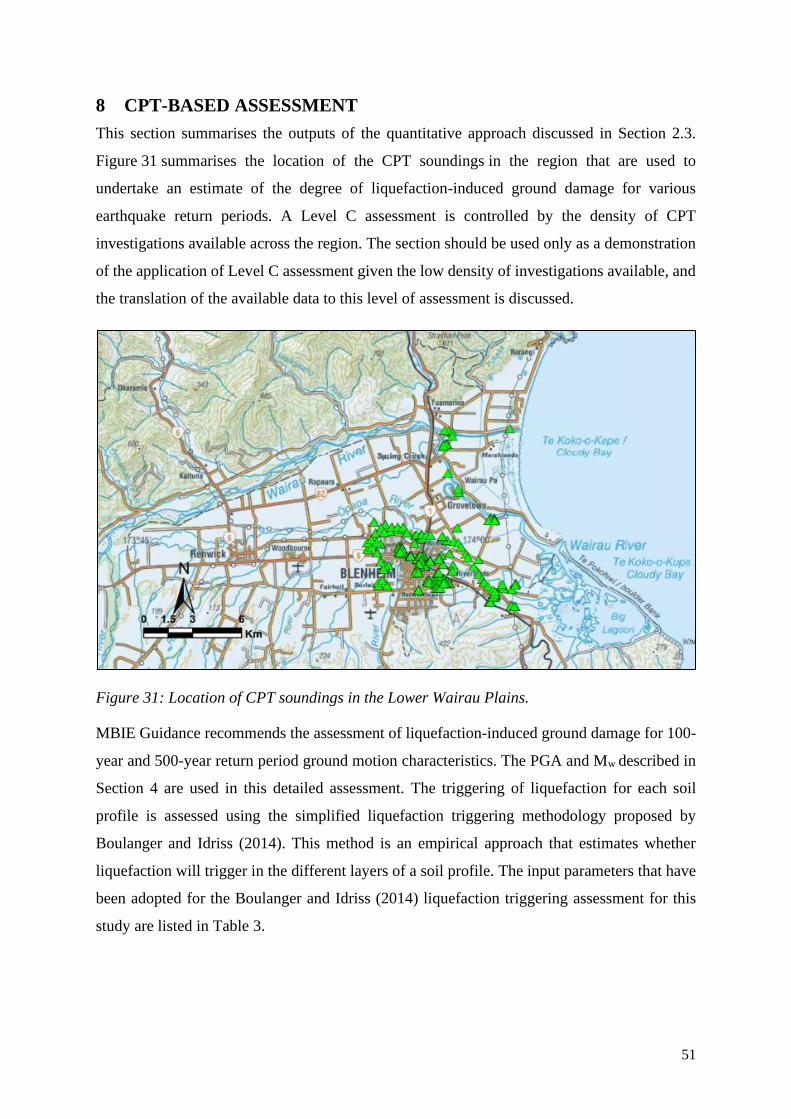
51
8 CPT-BASED ASSESSMENT
This section summarises the outputs of the quantitative approach discussed in Section 2.3.
Figure 31 summarises the location of the CPT soundings in the region that are used to
undertake an estimate of the degree of liquefaction-induced ground damage for various
earthquake return periods. A Level C assessment is controlled by the density of CPT
investigations available across the region. The section should be used only as a demonstration
of the application of Level C assessment given the low density of investigations available, and
the translation of the available data to this level of assessment is discussed.
Figure 31: Location of CPT soundings in the Lower Wairau Plains.
MBIE Guidance recommends the assessment of liquefaction-induced ground damage for 100-
year and 500-year return period ground motion characteristics. The PGA and Mw described in
Section 4 are used in this detailed assessment. The triggering of liquefaction for each soil
profile is assessed using the simplified liquefaction triggering methodology proposed by
Boulanger and Idriss (2014). This method is an empirical approach that estimates whether
liquefaction will trigger in the different layers of a soil profile. The input parameters that have
been adopted for the Boulanger and Idriss (2014) liquefaction triggering assessment for this
study are listed in Table 3.
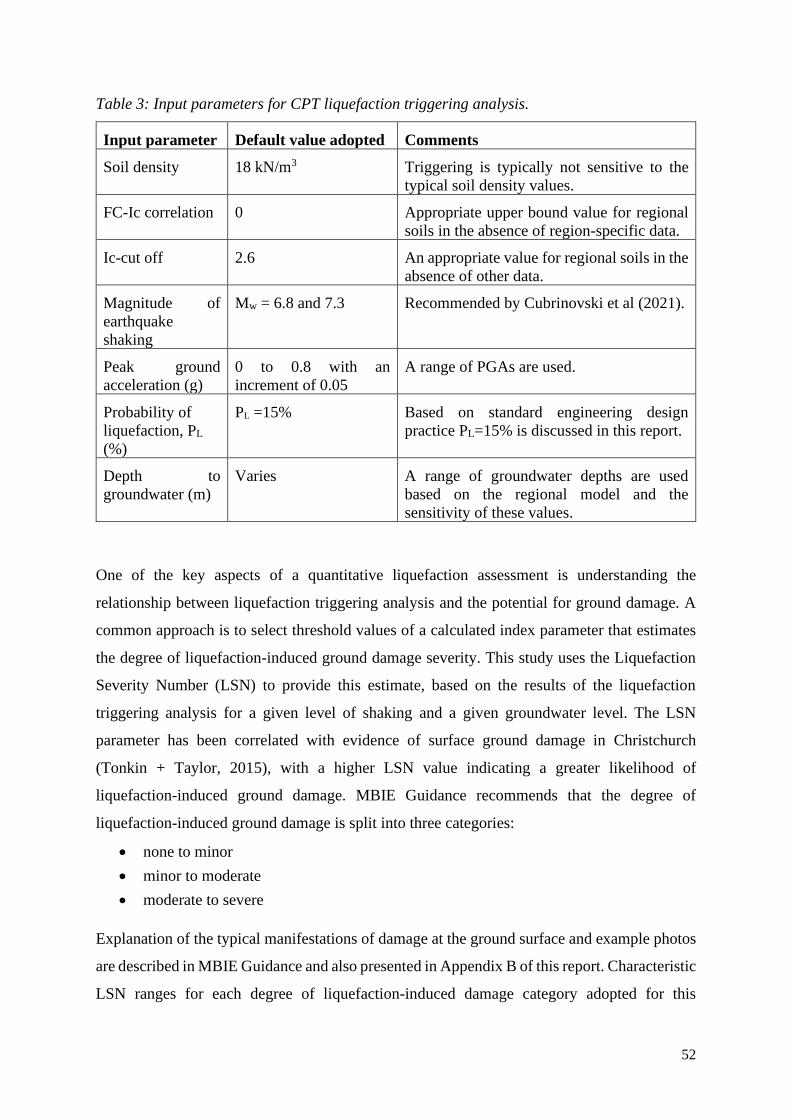
52
Table 3: Input parameters for CPT liquefaction triggering analysis.
Input parameter Default value adopted Comments
Soil density 18 kN/m3 Triggering is typically not sensitive to the
typical soil density values.
FC-Ic correlation 0 Appropriate upper bound value for regional
soils in the absence of region-specific data.
Ic-cut off 2.6 An appropriate value for regional soils in the
absence of other data.
Magnitude of
earthquake
shaking
Mw = 6.8 and 7.3 Recommended by Cubrinovski et al (2021).
Peak ground
acceleration (g)
0 to 0.8 with an
increment of 0.05
A range of PGAs are used.
Probability of
liquefaction, PL
(%)
PL =15% Based on standard engineering design
practice PL=15% is discussed in this report.
Depth to
groundwater (m)
Varies A range of groundwater depths are used
based on the regional model and the
sensitivity of these values.
One of the key aspects of a quantitative liquefaction assessment is understanding the
relationship between liquefaction triggering analysis and the potential for ground damage. A
common approach is to select threshold values of a calculated index parameter that estimates
the degree of liquefaction-induced ground damage severity. This study uses the Liquefaction
Severity Number (LSN) to provide this estimate, based on the results of the liquefaction
triggering analysis for a given level of shaking and a given groundwater level. The LSN
parameter has been correlated with evidence of surface ground damage in Christchurch
(Tonkin + Taylor, 2015), with a higher LSN value indicating a greater likelihood of
liquefaction-induced ground damage. MBIE Guidance recommends that the degree of
liquefaction-induced ground damage is split into three categories:
• none to minor
• minor to moderate
• moderate to severe
Explanation of the typical manifestations of damage at the ground surface and example photos
are described in MBIE Guidance and also presented in Appendix B of this report. Characteristic
LSN ranges for each degree of liquefaction-induced damage category adopted for this
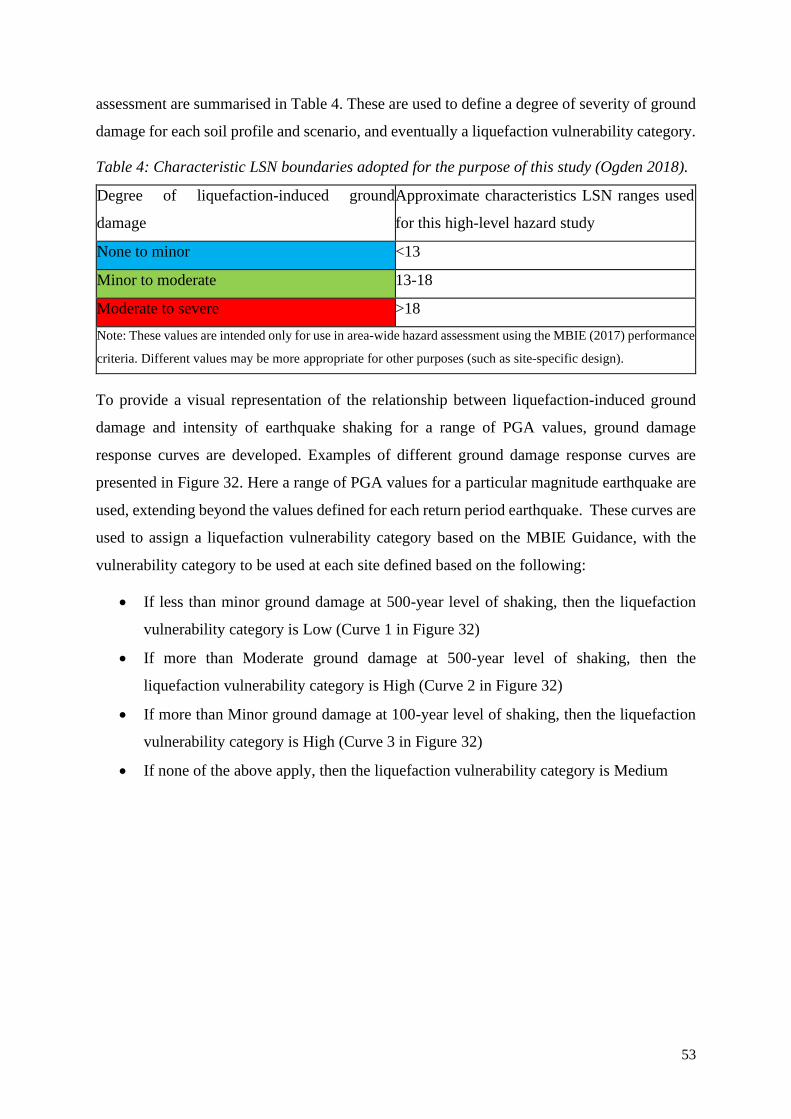
53
assessment are summarised in Table 4. These are used to define a degree of severity of ground
damage for each soil profile and scenario, and eventually a liquefaction vulnerability category.
Table 4: Characteristic LSN boundaries adopted for the purpose of this study (Ogden 2018).
Degree of liquefaction-induced ground
damage
Approximate characteristics LSN ranges used
for this high-level hazard study
None to minor <13
Minor to moderate 13-18
Moderate to severe >18
Note: These values are intended only for use in area-wide hazard assessment using the MBIE (2017) performance
criteria. Different values may be more appropriate for other purposes (such as site-specific design).
To provide a visual representation of the relationship between liquefaction-induced ground
damage and intensity of earthquake shaking for a range of PGA values, ground damage
response curves are developed. Examples of different ground damage response curves are
presented in Figure 32. Here a range of PGA values for a particular magnitude earthquake are
used, extending beyond the values defined for each return period earthquake. These curves are
used to assign a liquefaction vulnerability category based on the MBIE Guidance, with the
vulnerability category to be used at each site defined based on the following:
• If less than minor ground damage at 500-year level of shaking, then the liquefaction
vulnerability category is Low (Curve 1 in Figure 32)
• If more than Moderate ground damage at 500-year level of shaking, then the
liquefaction vulnerability category is High (Curve 2 in Figure 32)
• If more than Minor ground damage at 100-year level of shaking, then the liquefaction
vulnerability category is High (Curve 3 in Figure 32)
• If none of the above apply, then the liquefaction vulnerability category is Medium
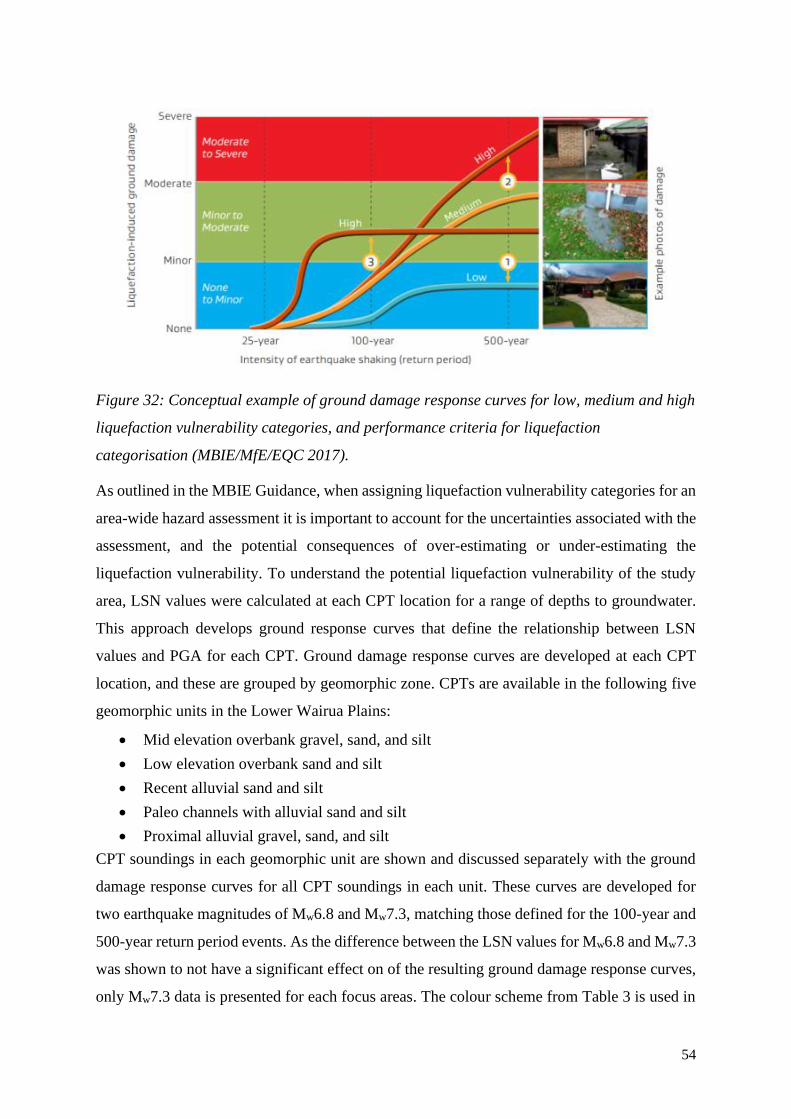
54
Figure 32: Conceptual example of ground damage response curves for low, medium and high
liquefaction vulnerability categories, and performance criteria for liquefaction
categorisation (MBIE/MfE/EQC 2017).
As outlined in the MBIE Guidance, when assigning liquefaction vulnerability categories for an
area-wide hazard assessment it is important to account for the uncertainties associated with the
assessment, and the potential consequences of over-estimating or under-estimating the
liquefaction vulnerability. To understand the potential liquefaction vulnerability of the study
area, LSN values were calculated at each CPT location for a range of depths to groundwater.
This approach develops ground response curves that define the relationship between LSN
values and PGA for each CPT. Ground damage response curves are developed at each CPT
location, and these are grouped by geomorphic zone. CPTs are available in the following five
geomorphic units in the Lower Wairua Plains:
• Mid elevation overbank gravel, sand, and silt
• Low elevation overbank sand and silt
• Recent alluvial sand and silt
• Paleo channels with alluvial sand and silt
• Proximal alluvial gravel, sand, and silt
CPT soundings in each geomorphic unit are shown and discussed separately with the ground
damage response curves for all CPT soundings in each unit. These curves are developed for
two earthquake magnitudes of Mw6.8 and Mw7.3, matching those defined for the 100-year and
500-year return period events. As the difference between the LSN values for Mw6.8 and Mw7.3
was shown to not have a significant effect on of the resulting ground damage response curves,
only Mw7.3 data is presented for each focus areas. The colour scheme from Table 3 is used in
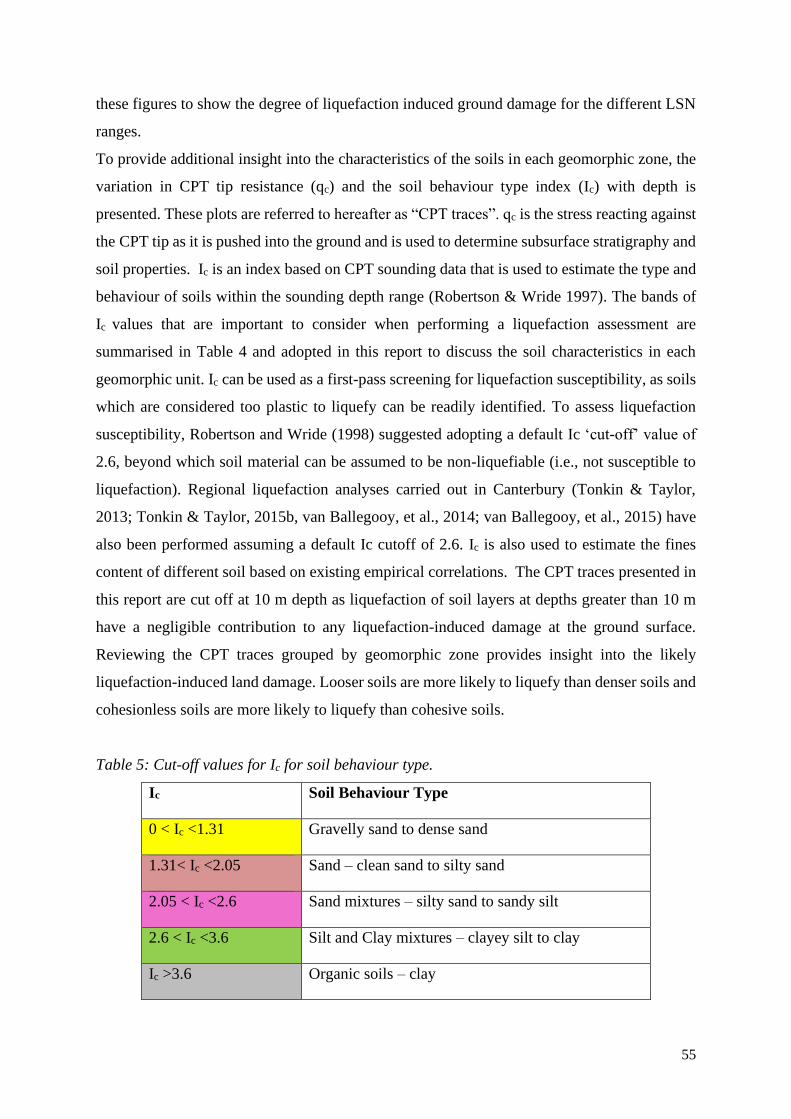
55
these figures to show the degree of liquefaction induced ground damage for the different LSN
ranges.
To provide additional insight into the characteristics of the soils in each geomorphic zone, the
variation in CPT tip resistance (qc) and the soil behaviour type index (Ic) with depth is
presented. These plots are referred to hereafter as “CPT traces”. qc is the stress reacting against
the CPT tip as it is pushed into the ground and is used to determine subsurface stratigraphy and
soil properties. Ic is an index based on CPT sounding data that is used to estimate the type and
behaviour of soils within the sounding depth range (Robertson & Wride 1997). The bands of
Ic values that are important to consider when performing a liquefaction assessment are
summarised in Table 4 and adopted in this report to discuss the soil characteristics in each
geomorphic unit. Ic can be used as a first-pass screening for liquefaction susceptibility, as soils
which are considered too plastic to liquefy can be readily identified. To assess liquefaction
susceptibility, Robertson and Wride (1998) suggested adopting a default Ic ‘cut-off’ value of
2.6, beyond which soil material can be assumed to be non-liquefiable (i.e., not susceptible to
liquefaction). Regional liquefaction analyses carried out in Canterbury (Tonkin & Taylor,
2013; Tonkin & Taylor, 2015b, van Ballegooy, et al., 2014; van Ballegooy, et al., 2015) have
also been performed assuming a default Ic cutoff of 2.6. Ic is also used to estimate the fines
content of different soil based on existing empirical correlations. The CPT traces presented in
this report are cut off at 10 m depth as liquefaction of soil layers at depths greater than 10 m
have a negligible contribution to any liquefaction-induced damage at the ground surface.
Reviewing the CPT traces grouped by geomorphic zone provides insight into the likely
liquefaction-induced land damage. Looser soils are more likely to liquefy than denser soils and
cohesionless soils are more likely to liquefy than cohesive soils.
Table 5: Cut-off values for Ic for soil behaviour type.
Ic Soil Behaviour Type
0 < Ic <1.31 Gravelly sand to dense sand
1.31< Ic <2.05 Sand – clean sand to silty sand
2.05 < Ic <2.6 Sand mixtures – silty sand to sandy silt
2.6 < Ic <3.6 Silt and Clay mixtures – clayey silt to clay
Ic >3.6 Organic soils – clay
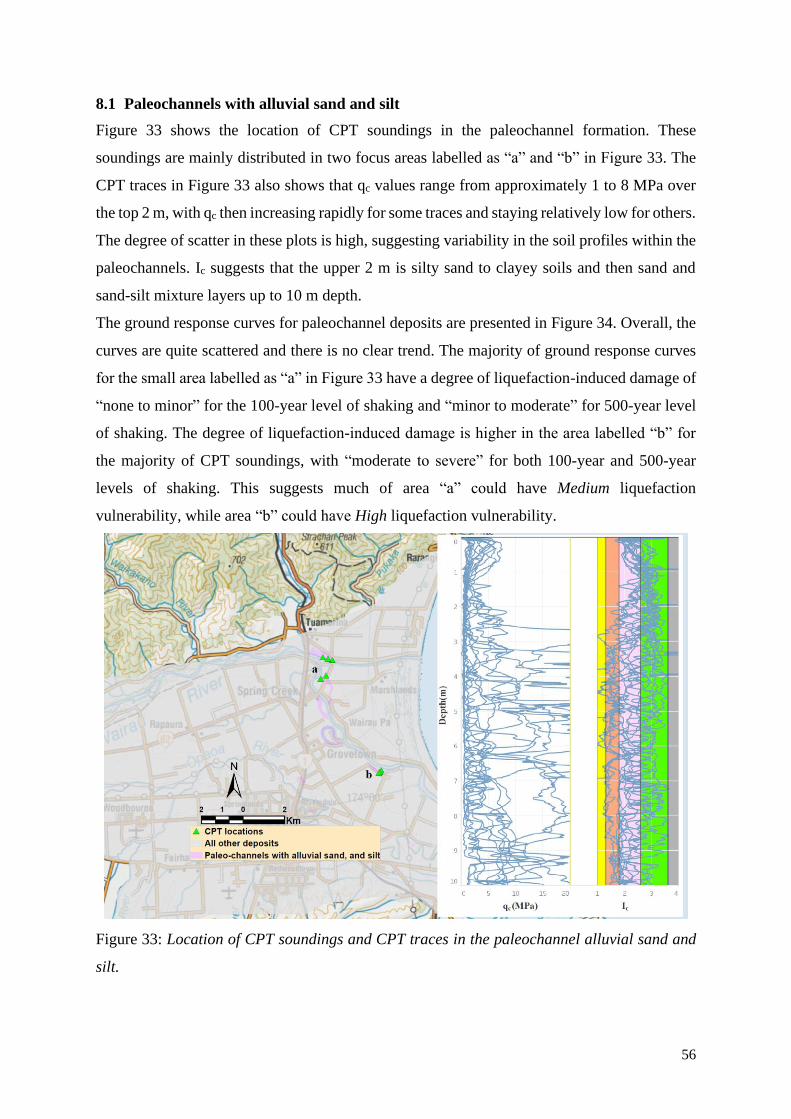
56
8.1 Paleochannels with alluvial sand and silt
Figure 33 shows the location of CPT soundings in the paleochannel formation. These
soundings are mainly distributed in two focus areas labelled as “a” and “b” in Figure 33. The
CPT traces in Figure 33 also shows that qc values range from approximately 1 to 8 MPa over
the top 2 m, with qc then increasing rapidly for some traces and staying relatively low for others.
The degree of scatter in these plots is high, suggesting variability in the soil profiles within the
paleochannels. Ic suggests that the upper 2 m is silty sand to clayey soils and then sand and
sand-silt mixture layers up to 10 m depth.
The ground response curves for paleochannel deposits are presented in Figure 34. Overall, the
curves are quite scattered and there is no clear trend. The majority of ground response curves
for the small area labelled as “a” in Figure 33 have a degree of liquefaction-induced damage of
“none to minor” for the 100-year level of shaking and “minor to moderate” for 500-year level
of shaking. The degree of liquefaction-induced damage is higher in the area labelled “b” for
the majority of CPT soundings, with “moderate to severe” for both 100-year and 500-year
levels of shaking. This suggests much of area “a” could have Medium liquefaction
vulnerability, while area “b” could have High liquefaction vulnerability.
Figure 33: Location of CPT soundings and CPT traces in the paleochannel alluvial sand and
silt.
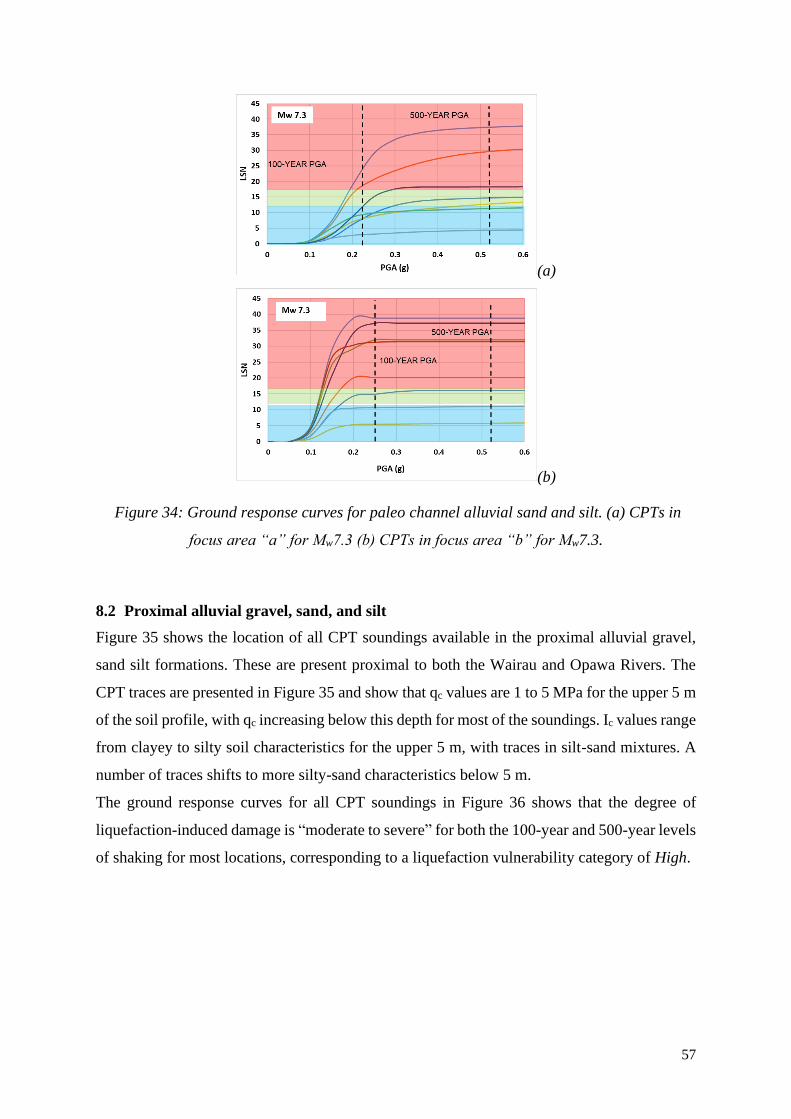
57
(a)
(b)
Figure 34: Ground response curves for paleo channel alluvial sand and silt. (a) CPTs in
focus area “a” for Mw7.3 (b) CPTs in focus area “b” for Mw7.3.
8.2 Proximal alluvial gravel, sand, and silt
Figure 35 shows the location of all CPT soundings available in the proximal alluvial gravel,
sand silt formations. These are present proximal to both the Wairau and Opawa Rivers. The
CPT traces are presented in Figure 35 and show that qc values are 1 to 5 MPa for the upper 5 m
of the soil profile, with qc increasing below this depth for most of the soundings. Ic values range
from clayey to silty soil characteristics for the upper 5 m, with traces in silt-sand mixtures. A
number of traces shifts to more silty-sand characteristics below 5 m.
The ground response curves for all CPT soundings in Figure 36 shows that the degree of
liquefaction-induced damage is “moderate to severe” for both the 100-year and 500-year levels
of shaking for most locations, corresponding to a liquefaction vulnerability category of High.
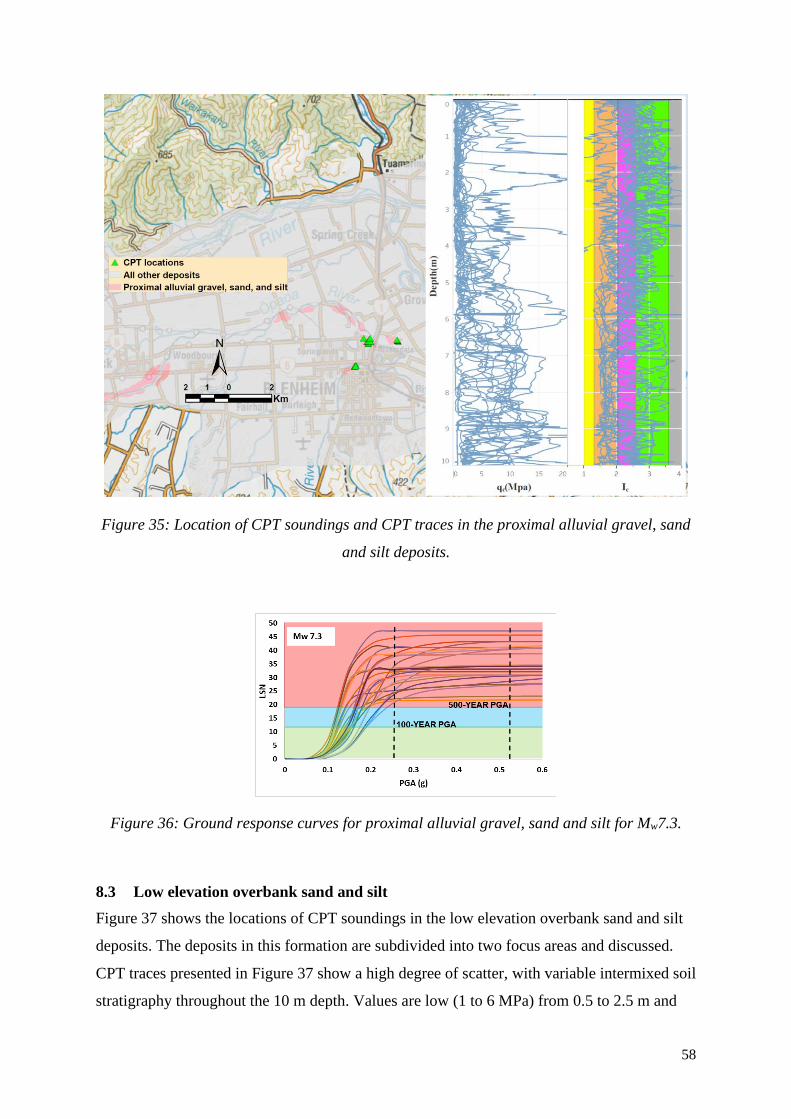
58
Figure 35: Location of CPT soundings and CPT traces in the proximal alluvial gravel, sand
and silt deposits.
Figure 36: Ground response curves for proximal alluvial gravel, sand and silt for Mw7.3.
8.3 Low elevation overbank sand and silt
Figure 37 shows the locations of CPT soundings in the low elevation overbank sand and silt
deposits. The deposits in this formation are subdivided into two focus areas and discussed.
CPT traces presented in Figure 37 show a high degree of scatter, with variable intermixed soil
stratigraphy throughout the 10 m depth. Values are low (1 to 6 MPa) from 0.5 to 2.5 m and
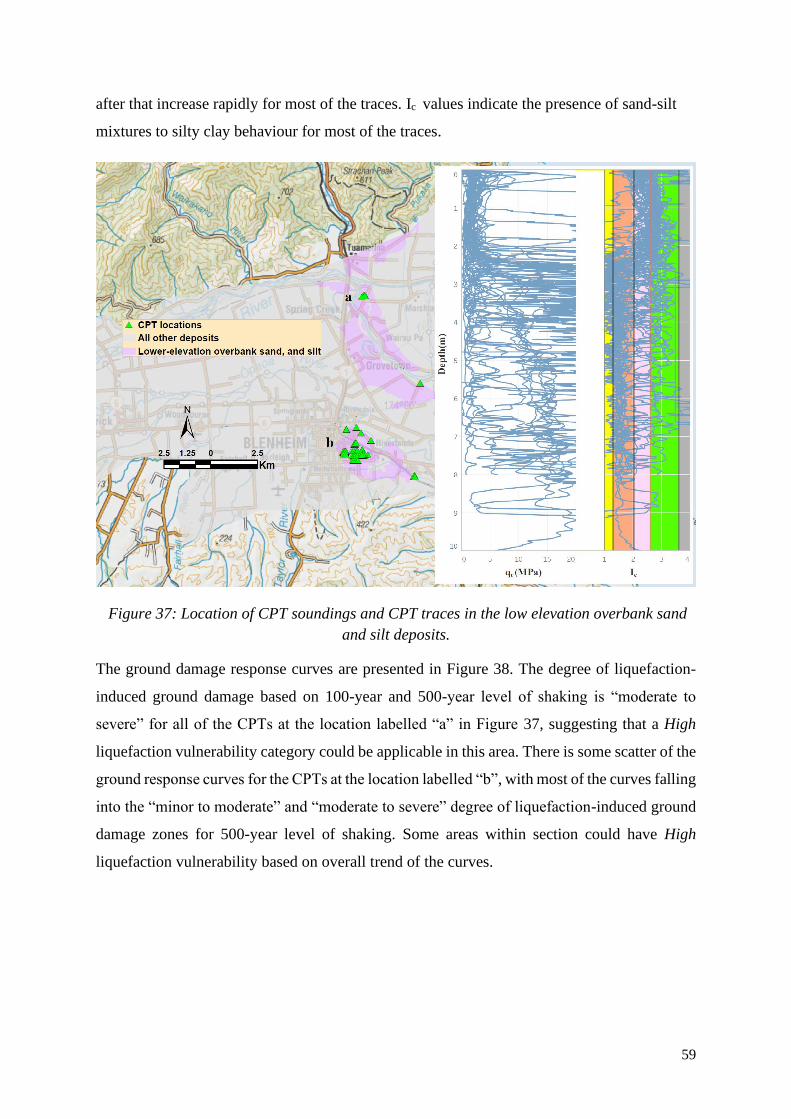
59
after that increase rapidly for most of the traces. Ic values indicate the presence of sand-silt
mixtures to silty clay behaviour for most of the traces.
Figure 37: Location of CPT soundings and CPT traces in the low elevation overbank sand
and silt deposits.
The ground damage response curves are presented in Figure 38. The degree of liquefaction-
induced ground damage based on 100-year and 500-year level of shaking is “moderate to
severe” for all of the CPTs at the location labelled “a” in Figure 37, suggesting that a High
liquefaction vulnerability category could be applicable in this area. There is some scatter of the
ground response curves for the CPTs at the location labelled “b”, with most of the curves falling
into the “minor to moderate” and “moderate to severe” degree of liquefaction-induced ground
damage zones for 500-year level of shaking. Some areas within section could have High
liquefaction vulnerability based on overall trend of the curves.
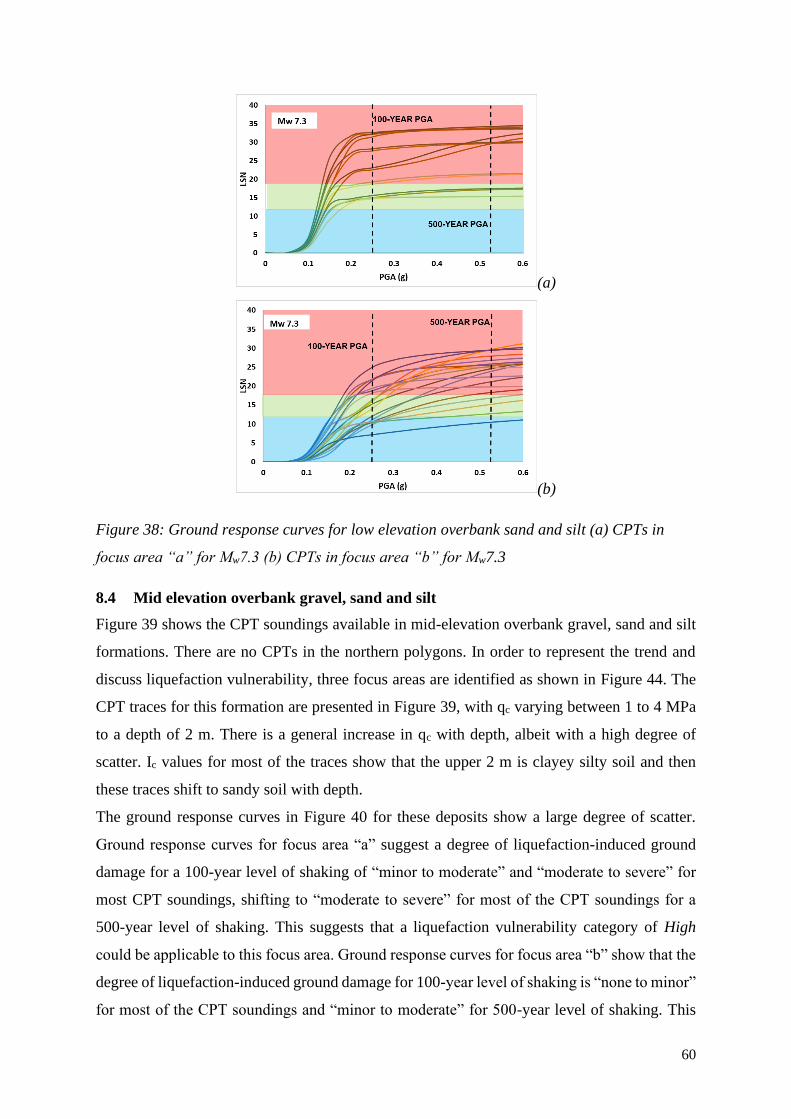
60
(a)
(b)
Figure 38: Ground response curves for low elevation overbank sand and silt (a) CPTs in
focus area “a” for Mw7.3 (b) CPTs in focus area “b” for Mw7.3
8.4 Mid elevation overbank gravel, sand and silt
Figure 39 shows the CPT soundings available in mid-elevation overbank gravel, sand and silt
formations. There are no CPTs in the northern polygons. In order to represent the trend and
discuss liquefaction vulnerability, three focus areas are identified as shown in Figure 44. The
CPT traces for this formation are presented in Figure 39, with qc varying between 1 to 4 MPa
to a depth of 2 m. There is a general increase in qc with depth, albeit with a high degree of
scatter. Ic values for most of the traces show that the upper 2 m is clayey silty soil and then
these traces shift to sandy soil with depth.
The ground response curves in Figure 40 for these deposits show a large degree of scatter.
Ground response curves for focus area “a” suggest a degree of liquefaction-induced ground
damage for a 100-year level of shaking of “minor to moderate” and “moderate to severe” for
most CPT soundings, shifting to “moderate to severe” for most of the CPT soundings for a
500-year level of shaking. This suggests that a liquefaction vulnerability category of High
could be applicable to this focus area. Ground response curves for focus area “b” show that the
degree of liquefaction-induced ground damage for 100-year level of shaking is “none to minor”
for most of the CPT soundings and “minor to moderate” for 500-year level of shaking. This
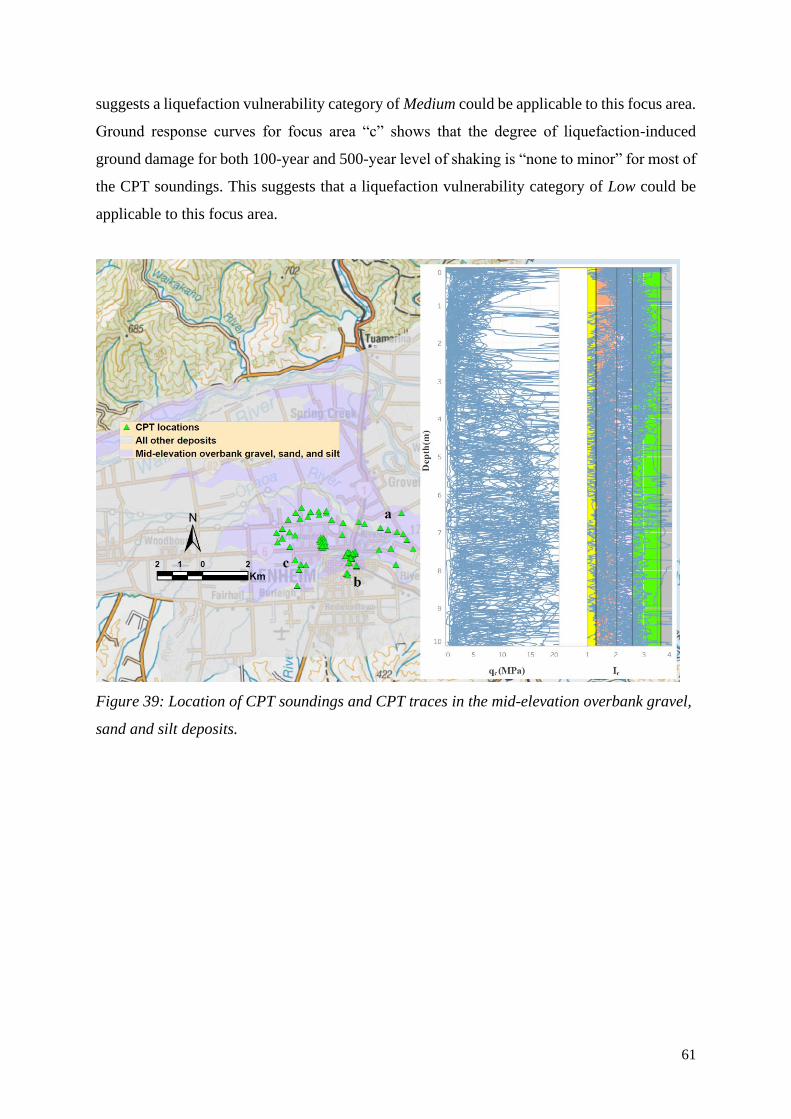
61
suggests a liquefaction vulnerability category of Medium could be applicable to this focus area.
Ground response curves for focus area “c” shows that the degree of liquefaction-induced
ground damage for both 100-year and 500-year level of shaking is “none to minor” for most of
the CPT soundings. This suggests that a liquefaction vulnerability category of Low could be
applicable to this focus area.
Figure 39: Location of CPT soundings and CPT traces in the mid-elevation overbank gravel,
sand and silt deposits.
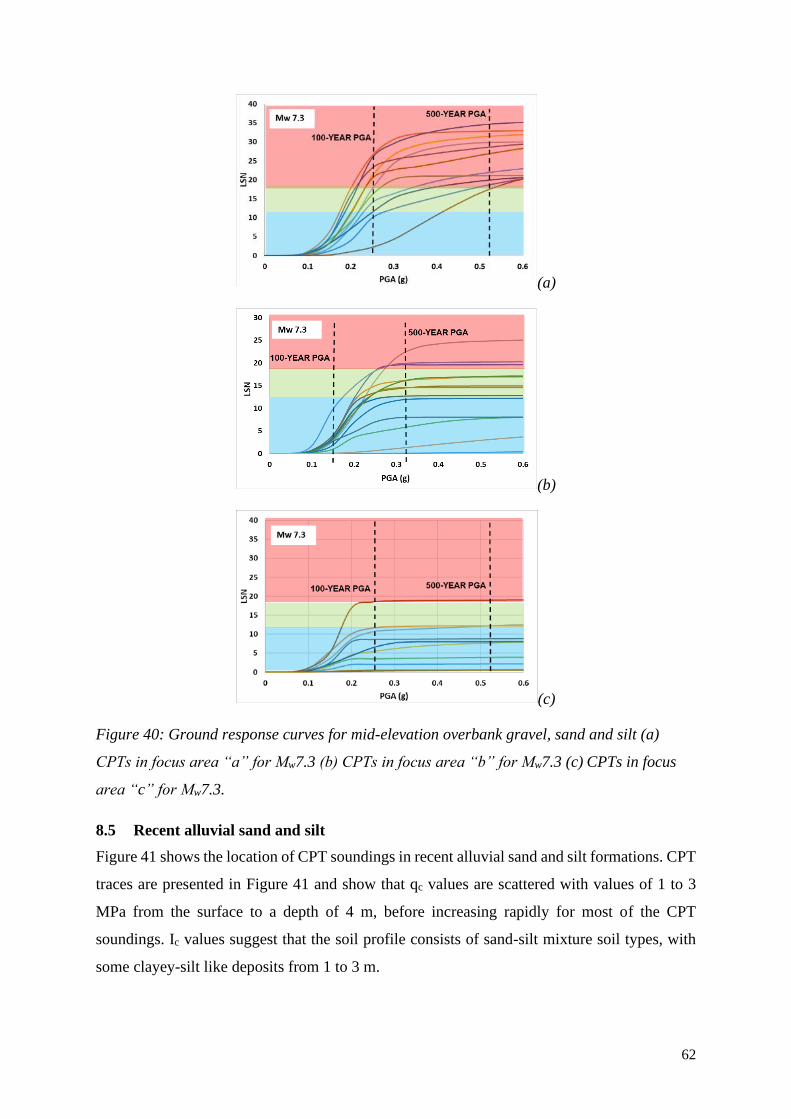
62
(a)
(b)
(c)
Figure 40: Ground response curves for mid-elevation overbank gravel, sand and silt (a)
CPTs in focus area “a” for Mw7.3 (b) CPTs in focus area “b” for Mw7.3 (c) CPTs in focus
area “c” for Mw7.3.
8.5 Recent alluvial sand and silt
Figure 41 shows the location of CPT soundings in recent alluvial sand and silt formations. CPT
traces are presented in Figure 41 and show that qc values are scattered with values of 1 to 3
MPa from the surface to a depth of 4 m, before increasing rapidly for most of the CPT
soundings. Ic values suggest that the soil profile consists of sand-silt mixture soil types, with
some clayey-silt like deposits from 1 to 3 m.
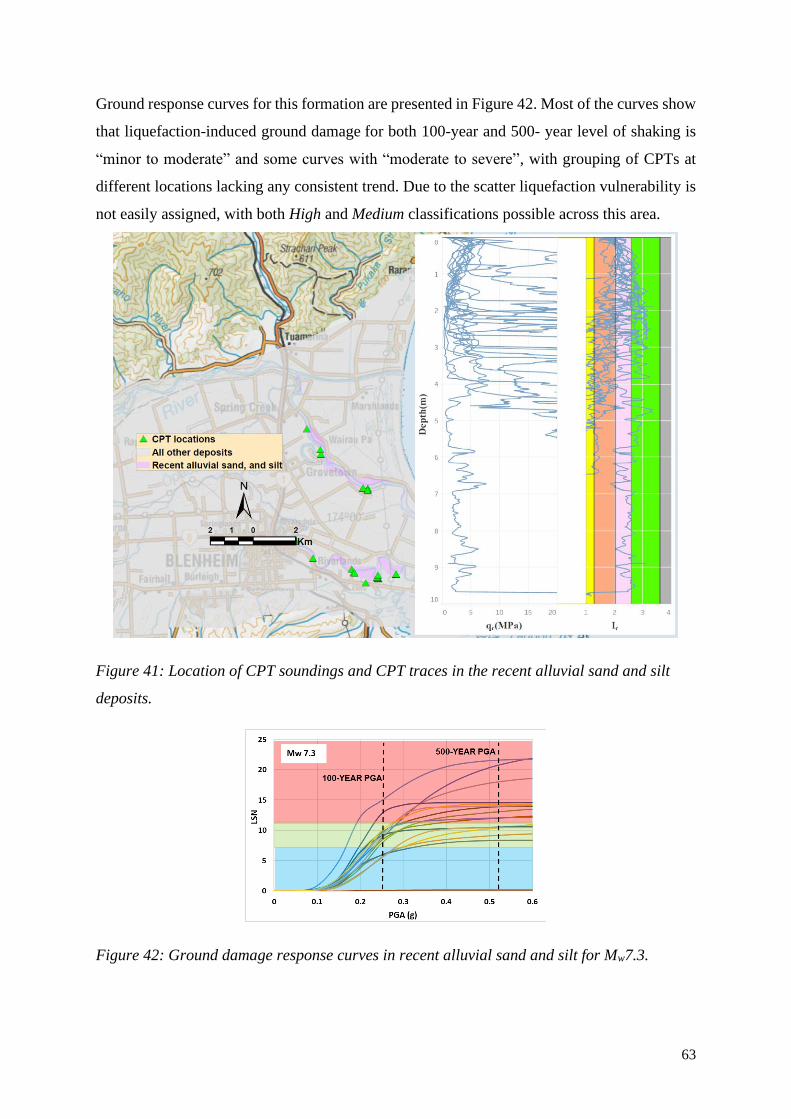
63
Ground response curves for this formation are presented in Figure 42. Most of the curves show
that liquefaction-induced ground damage for both 100-year and 500- year level of shaking is
“minor to moderate” and some curves with “moderate to severe”, with grouping of CPTs at
different locations lacking any consistent trend. Due to the scatter liquefaction vulnerability is
not easily assigned, with both High and Medium classifications possible across this area.
Figure 41: Location of CPT soundings and CPT traces in the recent alluvial sand and silt
deposits.
Figure 42: Ground damage response curves in recent alluvial sand and silt for Mw7.3.
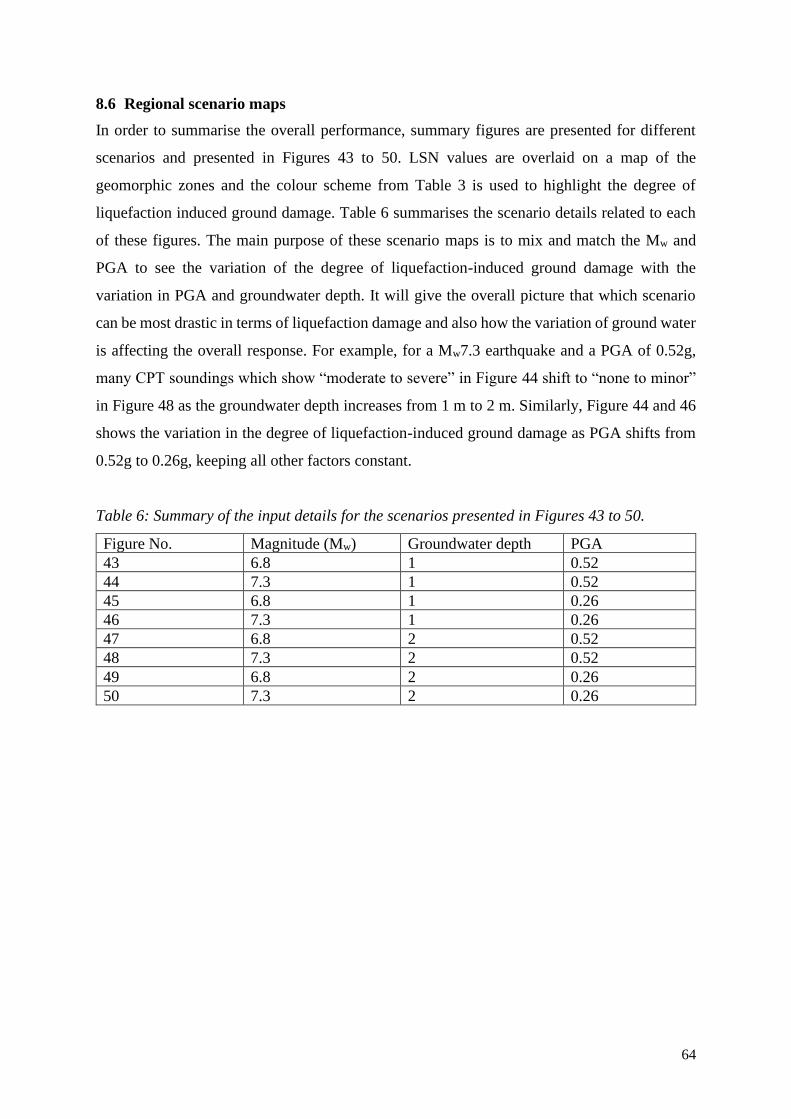
64
8.6 Regional scenario maps
In order to summarise the overall performance, summary figures are presented for different
scenarios and presented in Figures 43 to 50. LSN values are overlaid on a map of the
geomorphic zones and the colour scheme from Table 3 is used to highlight the degree of
liquefaction induced ground damage. Table 6 summarises the scenario details related to each
of these figures. The main purpose of these scenario maps is to mix and match the Mw and
PGA to see the variation of the degree of liquefaction-induced ground damage with the
variation in PGA and groundwater depth. It will give the overall picture that which scenario
can be most drastic in terms of liquefaction damage and also how the variation of ground water
is affecting the overall response. For example, for a Mw7.3 earthquake and a PGA of 0.52g,
many CPT soundings which show “moderate to severe” in Figure 44 shift to “none to minor”
in Figure 48 as the groundwater depth increases from 1 m to 2 m. Similarly, Figure 44 and 46
shows the variation in the degree of liquefaction-induced ground damage as PGA shifts from
0.52g to 0.26g, keeping all other factors constant.
Table 6: Summary of the input details for the scenarios presented in Figures 43 to 50.
Figure No. Magnitude (Mw) Groundwater depth PGA
43 6.8 1 0.52
44 7.3 1 0.52
45 6.8 1 0.26
46 7.3 1 0.26
47 6.8 2 0.52
48 7.3 2 0.52
49 6.8 2 0.26
50 7.3 2 0.26
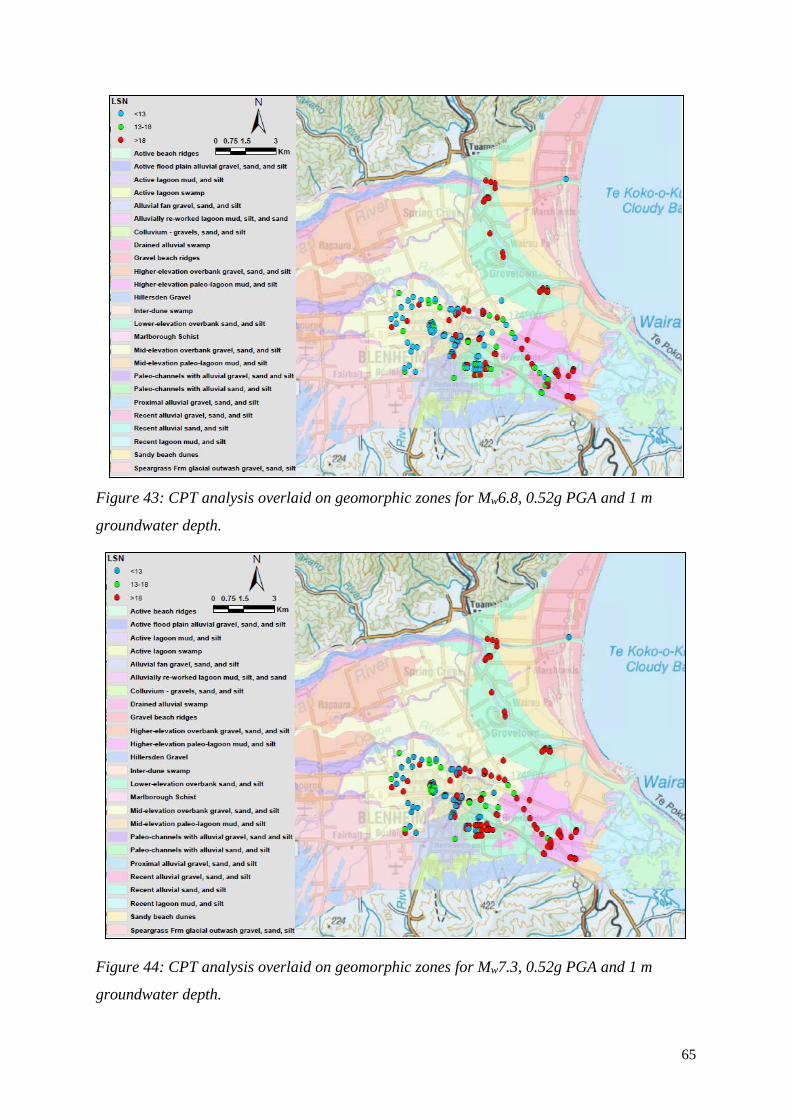
65
Figure 43: CPT analysis overlaid on geomorphic zones for Mw6.8, 0.52g PGA and 1 m
groundwater depth.
Figure 44: CPT analysis overlaid on geomorphic zones for Mw7.3, 0.52g PGA and 1 m
groundwater depth.
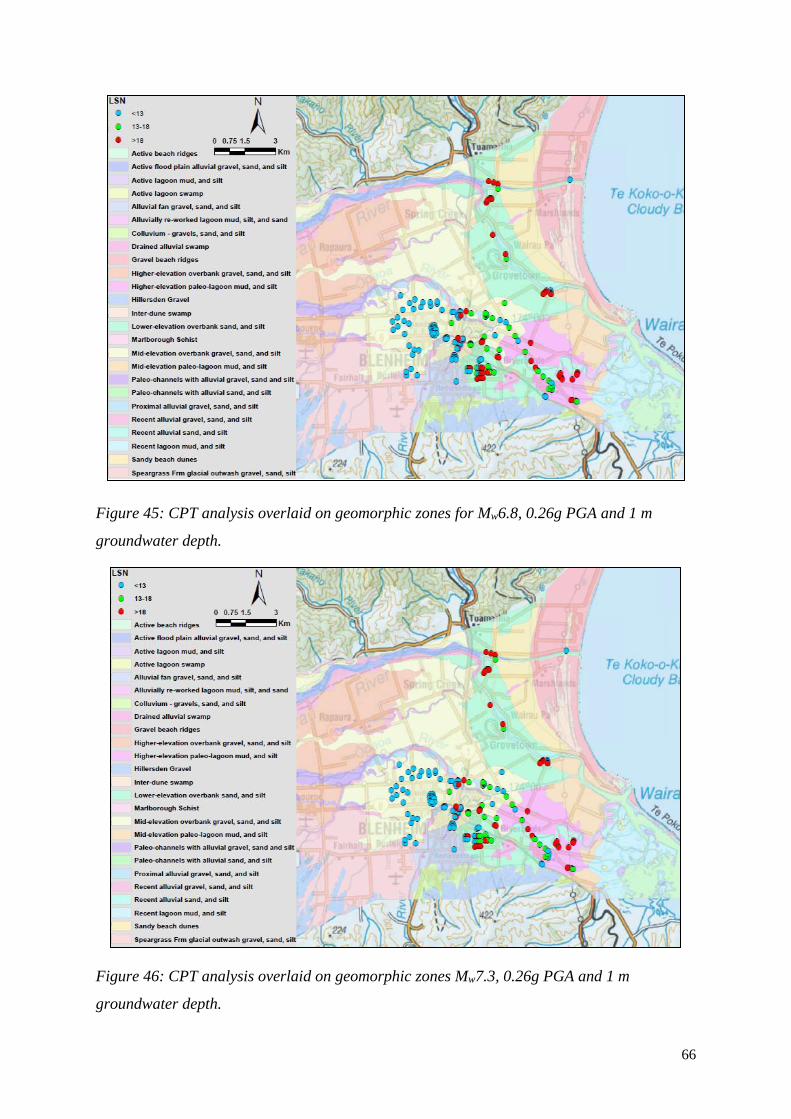
66
Figure 45: CPT analysis overlaid on geomorphic zones for Mw6.8, 0.26g PGA and 1 m
groundwater depth.
Figure 46: CPT analysis overlaid on geomorphic zones Mw7.3, 0.26g PGA and 1 m
groundwater depth.
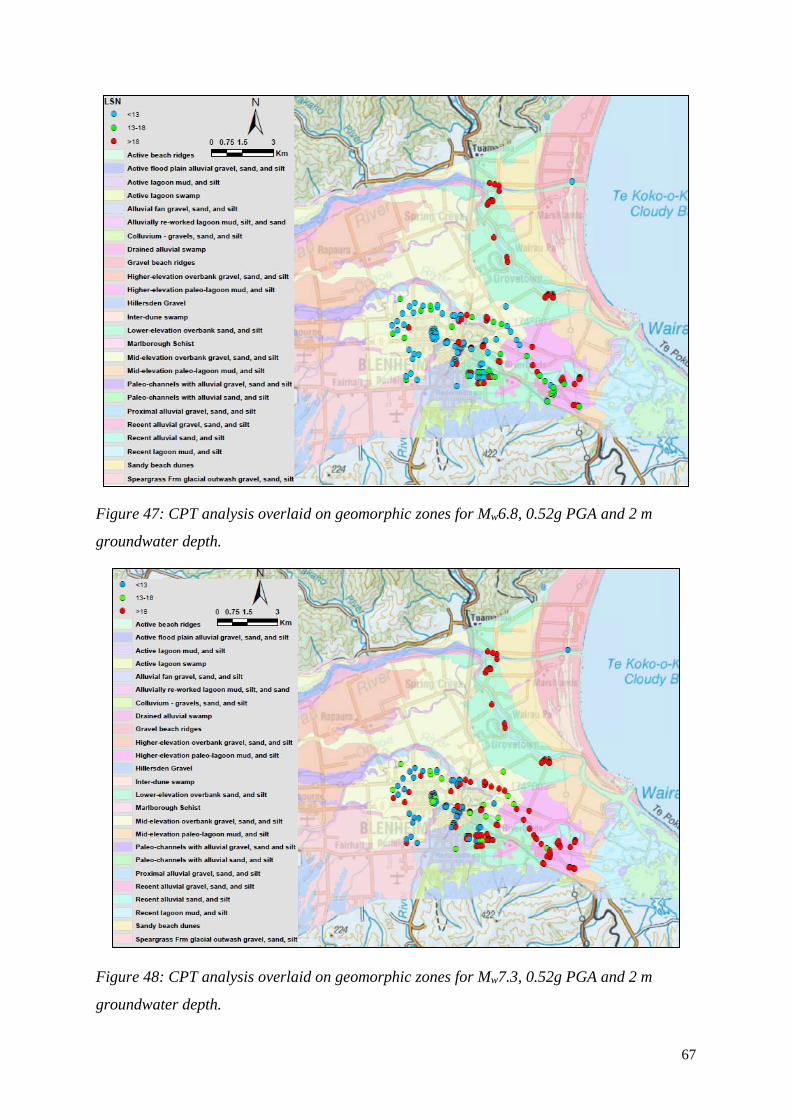
67
Figure 47: CPT analysis overlaid on geomorphic zones for Mw6.8, 0.52g PGA and 2 m
groundwater depth.
Figure 48: CPT analysis overlaid on geomorphic zones for Mw7.3, 0.52g PGA and 2 m
groundwater depth.
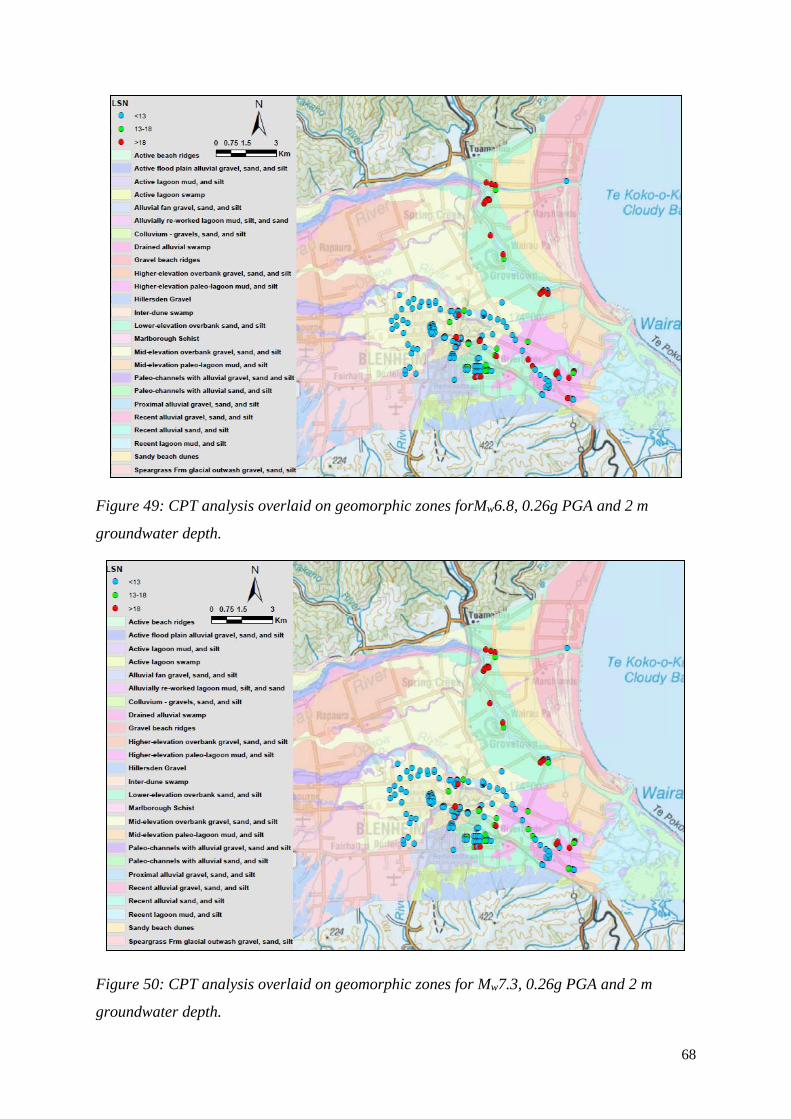
68
Figure 49: CPT analysis overlaid on geomorphic zones forMw6.8, 0.26g PGA and 2 m
groundwater depth.
Figure 50: CPT analysis overlaid on geomorphic zones for Mw7.3, 0.26g PGA and 2 m
groundwater depth.
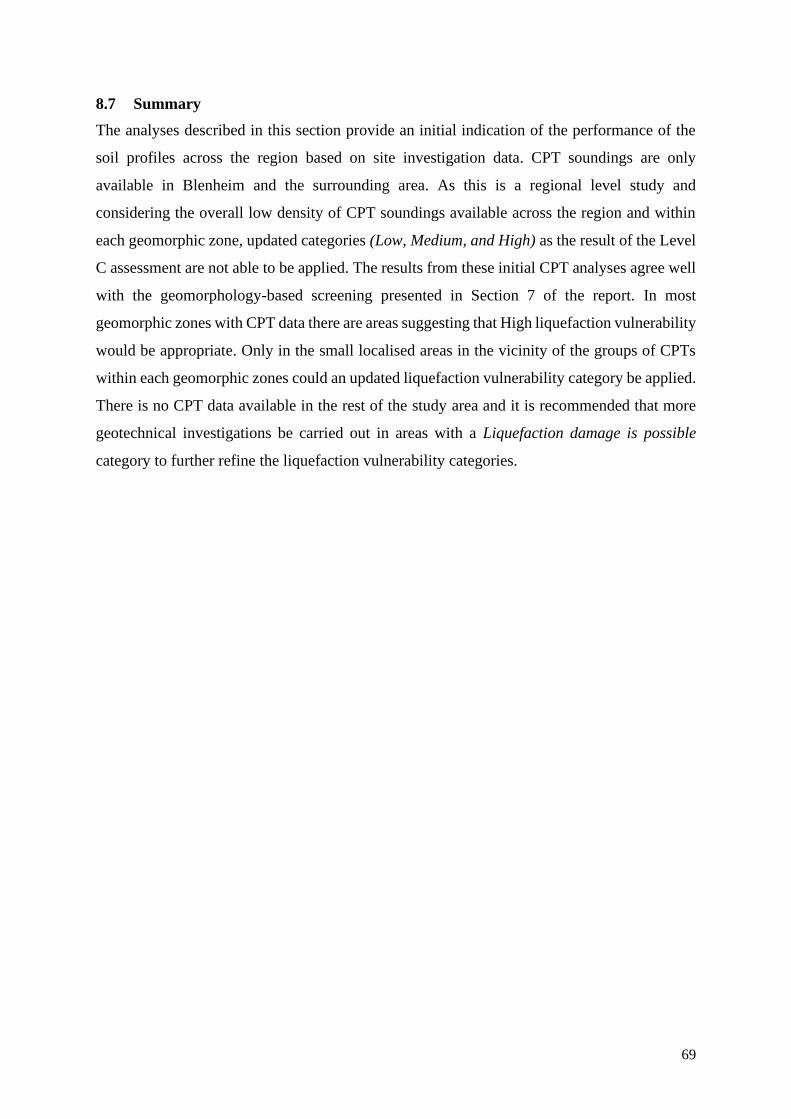
69
8.7 Summary
The analyses described in this section provide an initial indication of the performance of the
soil profiles across the region based on site investigation data. CPT soundings are only
available in Blenheim and the surrounding area. As this is a regional level study and
considering the overall low density of CPT soundings available across the region and within
each geomorphic zone, updated categories (Low, Medium, and High) as the result of the Level
C assessment are not able to be applied. The results from these initial CPT analyses agree well
with the geomorphology-based screening presented in Section 7 of the report. In most
geomorphic zones with CPT data there are areas suggesting that High liquefaction vulnerability
would be appropriate. Only in the small localised areas in the vicinity of the groups of CPTs
within each geomorphic zones could an updated liquefaction vulnerability category be applied.
There is no CPT data available in the rest of the study area and it is recommended that more
geotechnical investigations be carried out in areas with a Liquefaction damage is possible
category to further refine the liquefaction vulnerability categories.
70
9 LATERAL SPREADING VULNERABILTY
Observations from previous earthquakes demonstrate that liquefaction-induced lateral
spreading can cause significant damage to buildings, infrastructure and the environment.
Therefore, consideration of the potential for lateral spreading should be applied when
undertaking a liquefaction vulnerability assessment.
Lateral spreading can cause disproportional damage to urban infrastructure, over and above,
that from the vertical settlement effects of liquefaction alone. However, lateral spreading is
very difficult to accurate quantify and/or predict with any high degree of certainty, being a
highly complex process dependent upon multiple variables including:
• The elevation difference between the base of the free-face (i.e., a road cutting, old
terrace or a riverbank) and the elevation of the land at the point of interest;
• The distance (L) from the base of the free face to the point of interest;
• The earthquake ground motions including Peak Ground Accelerations (PGA) and
earthquake magnitude (Mw);
• The thickness, relative density and location of liquefying layers within the soil profile;
and
• Additional topographic and geological boundary conditions.
When considering the potential for lateral spreading adjacent to a free-face, the Planning and
engineering guidance for potentially liquefaction-prone land (MBIE/MfE/EQC, 2017) notes
that “It is less likely (but not impossible) for lateral spreading to occur if there is no liquefied
soil within a depth of 2H of the ground surface (where H is the height of the free-face.
However, with the information available for this study it is difficult to accurately define the
free face height (H).
Severe lateral spreading was observed as a result of the Kaikōura earthquake along the Opaoa
River which greatly impacted the adjacent land and the cross-sectional characteristics of the
river. The latter was identified by MDC and locals through observing flooding in the sections
of the Opaoa River close to the Blenheim Township during smaller rainfall events than those
prior to the Kaikōura earthquake.
Ogden (2018) identified by thorough investigation of lateral spreading manifestations in the
region and predictions that for lateral-spreading no one measurement or prediction tool can be
used to comprehensively model or estimate the potential effects. For example, the extent of
lateral spreading along the Opaoa River is dependent on several factors that are inferred from
CPT 𝑞𝑐 and 𝐼𝐶 traces and river cross-sections The study by Ogden (2018) also highlighted that
71
the simplified liquefaction procedures provided a reasonable estimation of liquefaction
vulnerability evaluated against observations in relatively uniform profiles comprising fine-
grained non-plastic deposits. However, there was a substantial proportion of sites at which
there was computed over-prediction from the simplified methods. Potential inaccuracies in the
ground motion and groundwater surfaces that were developed for the region could account for
a small proportion of the false positive predictions. However, the largest source of over-
prediction was found at sites with significant degrees of interlayering present in the subsurface
profile.
In the absence of evidence to provide region specific guidance, the MBIE guidance is
applicable for the Lower Wairau Plains. This guidance suggests that there should be particular
attention given to land within 100 m of a free face with a height less than 2 m, and 200 m for
a free face greater than 2 m.
72
10 REFERENCES
Basher, L.R., Lynn, I.H. & Whitehouse, I.E. (1995). Geomorphology of the Wairau Plains:
implications for floodplain management planning. Landcare Research Science Series No. 11,
Manaaki Whenua Press, Lincoln, 42p
Bastin, S. H., Ogden, M., Wotherspoon, L. M., van Ballegooy, S., Green, R. A. & Stringer,
M. (2018). Geomorphological influences on the distribution of liquefaction in the Wairau
plains, New Zealand, following the 2016 Kaikōura earthquake. Bulletin of the Seismological
Society of America, 108(3B), 1683-1694.
Bastin, S., van Ballegooy, S., Mellsop, N. & Wotherspoon, L. (2020). Liquefaction case
histories from the 1987 Edgecumbe earthquake, New Zealand–Insights from an extensive
CPT dataset and paleo-liquefaction trenching. Engineering Geology, 271, 105404.
Bastin, S.H., van Ballegooy, S. & Wotherspoon, L. (2017). Cross-Checking Liquefaction
Hazard Assessments with Liquefaction Observations from New Zealand Earthquakes and
Paleo-liquefaction Trenching Proc. 20th NZGS Geotechnical Symposium.
Benson, A., Hill, N., Little, T. & Van Dissen, (2001). Paleoseismicity, rates of active
deformation, and structure of the Lake Jasper pull-apart basin, Awatere Fault, New Zealand.
EQC research report 97/262. School of Earth Sciences, Victoria University of Wellington.
Bouckovalas, G. & Dakoulas, P. (2007). Liquefaction performance of shallow foundation in
presence of a soil crust, Earthquake Geotechnical Engineering, Chapter 11, 245-276
Boulanger, R. W. & Idriss, I. M. (2014). CPT and SPT based liquefaction triggering
procedures. Report No. UCD/CGM.-14, 1.
Cubrinovski, M., Bradley, B.A., Wentz, F. & Balachandra, A. (2021). Re-evaluation of New
Zealand seismic hazard for geotechnical assessment and design, Bulletin of the New Zealand
Society for Earthquake Engineering, accepted for publication.
Davidson, P. & Wilson, S. (2011). Groundwaters of Marlborough. New Zealand:
Marlborough District Council.
Fryirs, K. and G. Brierley (2012). Geomorphic Analysis of River Systems: An Approach to
Reading the Landscape, John Wiley & Sons, Chichester, United Kingdom.
GEER (2017). Geotechnical Reconnaissance of the 2016 Mw 7.8 Kaikoura, New Zealand
Earthquake. Version 1: 10 June 2017, Report of the National Science Foundation -
Sponsored Geotechnical Extreme Events Reconnaissance (GEER) Team.
Grace, K. T. (2015). Meander loop migration and liquefaction susceptibility: liquefaction
along the Heathcote River during the 2010-11 Canterbury earthquake sequence. MSc Thesis,
University of Canterbury, New Zealand
Green, R. A., Maurer, B. W. & van Ballegooy, S. (2018). The influence of the non-liquefied
crust on the severity of surficial liquefaction manifestations: Case history from the 2016
Valentine’s Day earthquake in New Zealand. In Geotechnical Earthquake Engineering and
Soil Dynamics V: Liquefaction Triggering, Consequences, and Mitigation (pp. 21-32).
Reston, VA: American Society of Civil Engineers.
Ishihara, K., Acacio, A. A. & Towhata, I. K. U. O. (1993). Liquefaction-induced ground
damage in Dagupan in the July 16, 1990 Luzon earthquake. Soils and Foundations, 33(1),
133-154.
73
Maurer, B.W., Green, R.A. & Taylor, O.-D.S. (2015). Moving Towards an Improved Index for
Assessing Liquefaction Hazard: Lessons from Historical Data, Soils and Foundations, JGS,
55(4), 778-787.
Marlborough District Council MDC (2012). Blenheim urban growth study geotechnical
evaluation. Marlborough New Zealand
MBIE/MfE/EQC. (2017). Planning and engineering guidance for potentially liquefaction-
prone land. Wellington: MBIE/MfE
Mellsop, N. (2017). Liquefaction Case Histories from the 1987 Edgecumbe Earthquake –
Insights from an Extensive CPT Dataset, Direct Push Cross Hole Shear and Compression
Wave Velocity (VSVP) Testing and Paleo-liquefaction Trenching. ME Thesis, University of
Auckland.
NZ Transport Agency (2013): Bridge Manual (SP/M/022), Version 3.
Ogden, M. (2018). Assessment of Liquefaction from New Zealand Case Histories: With
insights from liquefaction -induced land damage, over the Lower Wairau Plains, caused by
the 2016 Kaikoura earthquake. Master’s Thesis, University of Auckland, New Zealand
Pyke R. (2003). Discussion of liquefaction resistance of soils: Summary report from the 1996
NCEER and 1998 NCEER/NSF workshops on evaluation of liquefaction resistance of
soil. Journal of Geotechnical and Geoenvironmental Engineering, American Society of Civil
Engineers, 129(3): 283-284.
Rattenbury, M. S., Townsend, D. B. & Johnston, M. R. (2006). Geology of the Kaikoura
Area, 1: 250 000 Geological Map 13. GNS Science, Lower Hutt, New Zealand.
Robertson, P. K. & Wride, C. E. (1997). Cyclic liquefaction and its evaluation based on SPT
and CPT: Seismic Short Course on Evaluation and Mitigation of Earthquake Induced
Liquefaction Hazards. In NCEER Workshop, San Francisco, CA.
Robertson, P. K. & Wride, C. E. (1998). Evaluating cyclic liquefaction potential using the
cone penetration test. Canadian geotechnical journal, 35(3), 442-459.
Stringer, M., Beyzaei, C., Cubrinovski, M., Bray, J., Riemer, M., Jacka, M. & Wentz, F.
(2015). Liquefaction characteristics of Christchurch silty soils: Gainsborough Reserve. In 6th
Int. conf. on earthquake geotechnical engineering, Christchurch.
Towhata, I., Yasuda, S., Yoshida, K., Motohashi, A., Sato, S. & Arai, M. (2016).
“Qualification of residential land from the viewpoint of liquefaction vulnerability,” Soil
Dynamics and Earthquake Engineering, 91, 260-271.
Tonkin & Taylor (2013). Liquefaction Vulnerability Study. Report prepared for the
Earthquake Commission, New Zealand., Auckland
Tonkin + Taylor (2015). Cantebury Earthquake Sequence: Increased liquefaction
vulnerability methodology. Retrieved from The Earthquake Commission:
http://www.eqc.govt.nz/ILV-engineering-assessment-methodology
Van Ballegooy, S., Lacrosse, V., Simpson, J. & Malan, P. (2015). Comparison of CPT-based
simplified liquefaction assessment methodologies based on Canterbury Geotechnical Dataset.
In Proc. Of the 12th Australia New Zealand Conference on Geomechanics (pp. 618-625).
74
Van Ballegooy, S., Malan, P., Lacrosse, V., Jacka, M. E., Cubrinovski, M., Bray, J. D. &
Cowan, H. (2014). Assessment of liquefaction-induced land damage for residential
Christchurch. Earthquake Spectra, 30(1), 31-55.
White, P. A., Tschritter, C. & Davidson, P. (2016). Groundwater-surface water interaction in
a coastal aquifer system, Wairau Plain, Marlborough, New Zealand. Journal of Hydrology
(New Zealand), 55(1), 25.
Wotherspoon, L.M., Pender, M..J. & Orense, R.P. (2012). Relationship between observed
liquefaction at Kaiapoi following the 2010 Darfield earthquake and former channels of the
Waimakariri River, Engineering Geology, 125: 45-55.
Youd T.L. & Perkins DM. (1978). Mapping liquefaction-induced ground
failure potential, Journal of the Soil Mechanics and Foundations Division, 104(4): 433-4
Youd, T. L. & Idriss, I. M. (2001). Liquefaction resistance of soils: summary report from the
1996 NCEER and 1998 NCEER/NSF workshops on evaluation of liquefaction resistance of
soils. Journal of geotechnical and geoenvironmental engineering, 127(4), 297-313.
Youd, T.L. & Garris, C.T. (1995). Liquefaction-induced ground surface disruption, ASCE
Journal of Geotechnical Engineering, 121 (11), 805 – 809
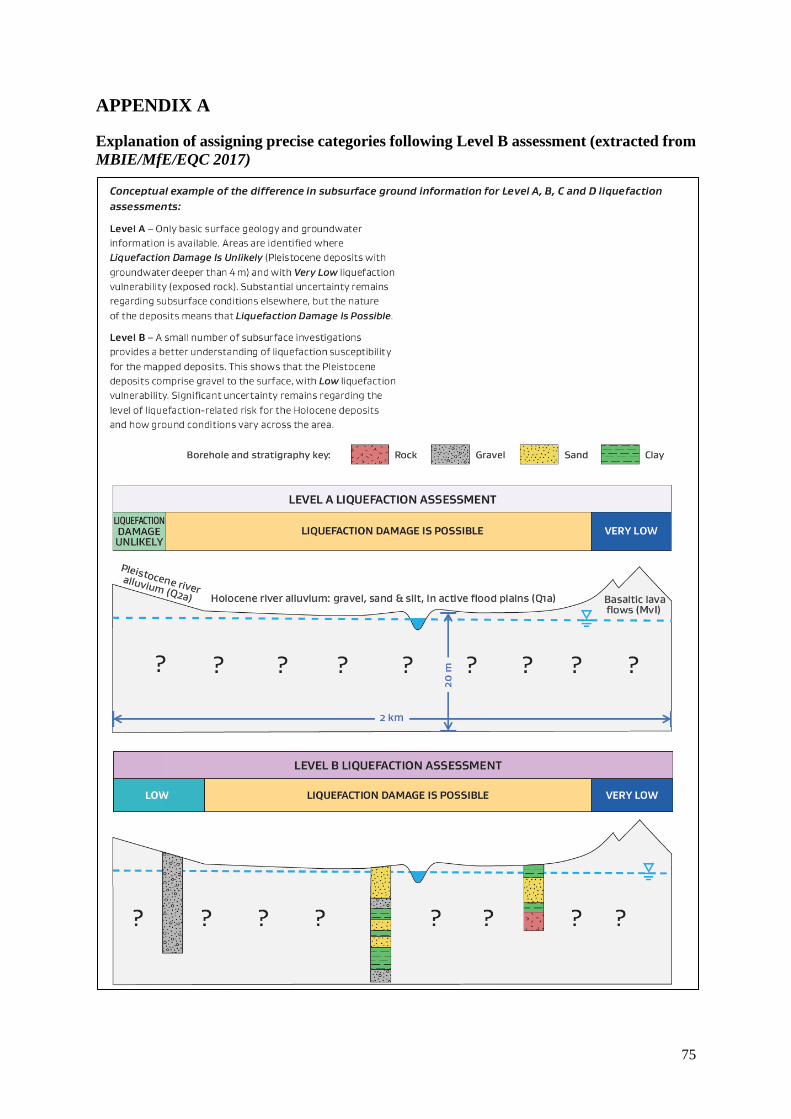
75
APPENDIX A
Explanation of assigning precise categories following Level B assessment (extracted from
MBIE/MfE/EQC 2017)
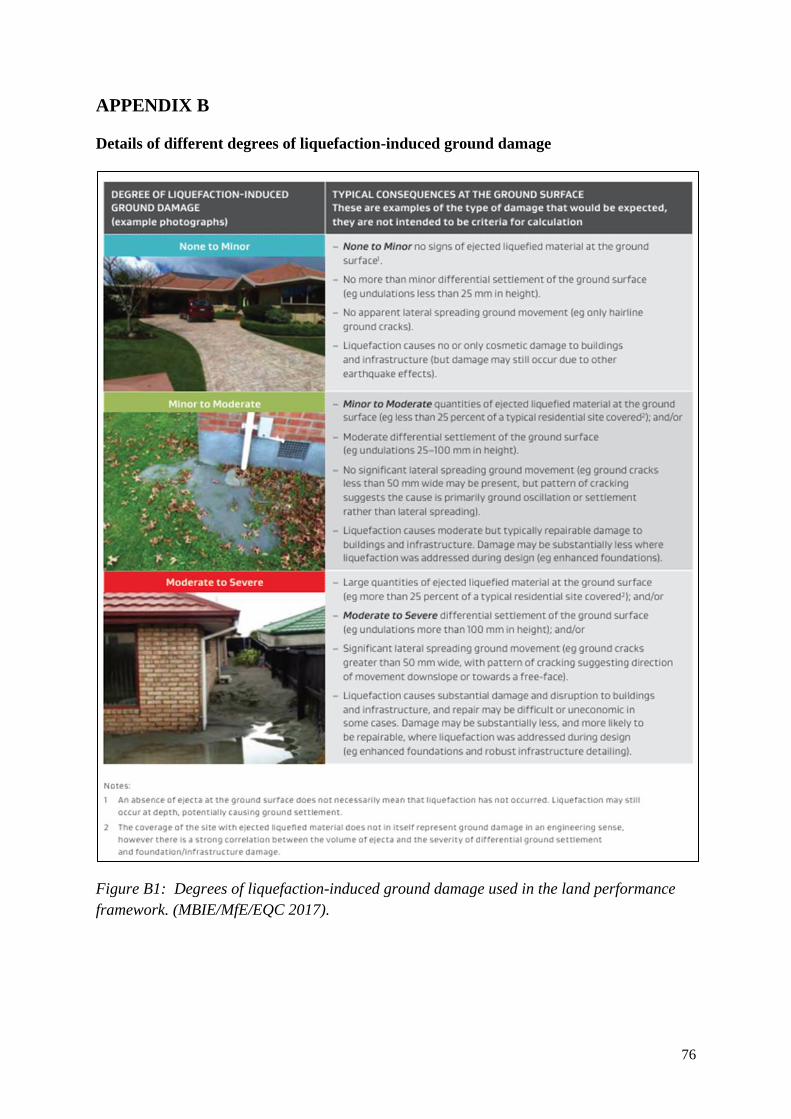
76
APPENDIX B
Details of different degrees of liquefaction-induced ground damage
Figure B1: Degrees of liquefaction-induced ground damage used in the land performance
framework. (MBIE/MfE/EQC 2017).