Embed Size (px)
Citation preview
i
LIQUIDITY AND PROFITABILITY STUDY OF STATE OWNED
COMMERCIAL BANKS (SCBs), PRIVATE COMMERCIAL BANKS
(PCBs) AND FOREIGN COMMERCIAL BANKS (FCBs)
- BANGLADESH PERSPECTIVE
by
Mohammad Mokter Hossain
A project study submitted in partial fulfillment of the requirements for the
degree of Professional Master in Banking and Finance
Examination Committee: Dr. Sundar Venkatesh (Chairperson)
Dr. Winai Wongsurawat
Dr. Markus Freiburghaus (External Expert)
Nationality: Bangladeshi
Previous Degree: Master of Business Administration
University of Dhaka
Dhaka, Bangladesh
Scholarship Donor: Central Bank of Bangladesh
Asian Institute of Technology
School of Management
Thailand
May 2012

ii
ACHNOWLEDGEMENT
In preparing this paper I needed to take assistance directly and indirectly from a number of
valued persons. Firstly I must thank specially my respectable supervisor Dr. Markus Freiburghaus for providing his valuable advices and direction in preparing my paper. I also
thank the personnel of the Bangladesh Bank Library, Statistics and Research Department of
Bangladesh Bank for their kind help in getting my required data and information. I also
extend my thanks to Mr. Mohammad Masuduzzaman, Joint Director, Research Department,
Bangladesh Bank in providing me the practical and empirical knowledge about liquidity
management. A special note of gratitude must be extended to my nearest friends who helped
me a lot in providing their advices and in making my paper done.
iii
ABSTRACT
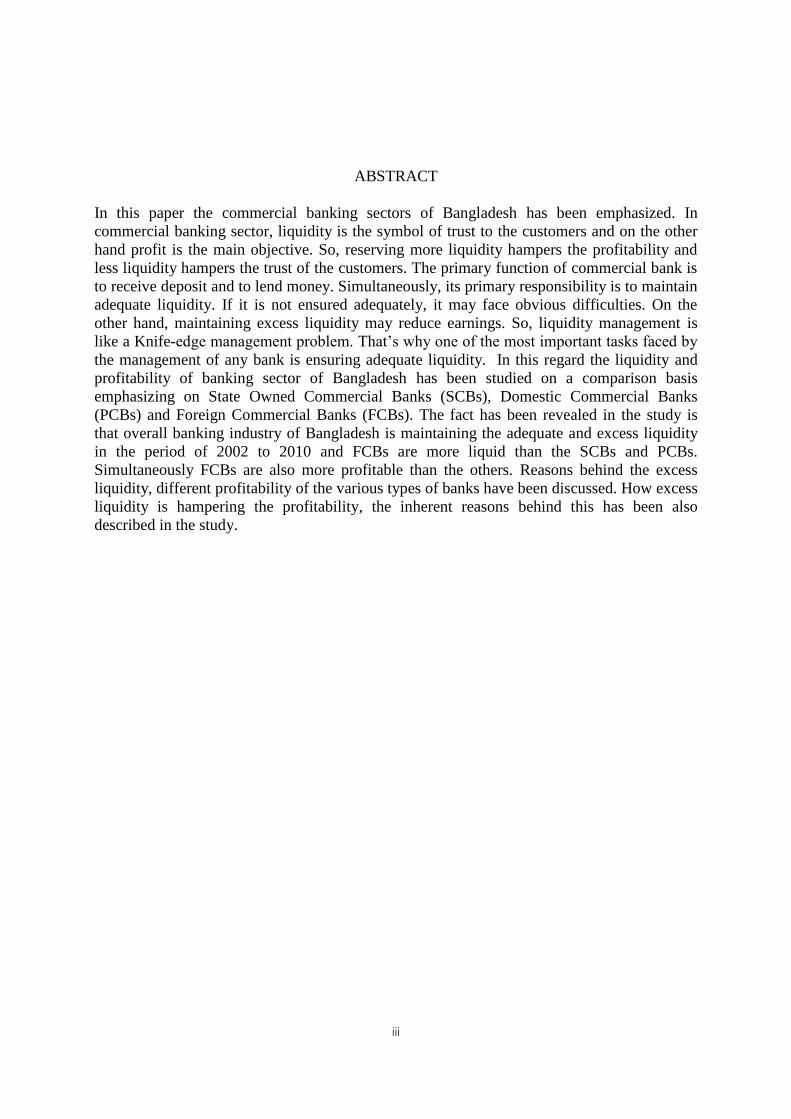
In this paper the commercial banking sectors of Bangladesh has been emphasized. In
commercial banking sector, liquidity is the symbol of trust to the customers and on the other
hand profit is the main objective. So, reserving more liquidity hampers the profitability and
less liquidity hampers the trust of the customers. The primary function of commercial bank is
to receive deposit and to lend money. Simultaneously, its primary responsibility is to maintain
adequate liquidity. If it is not ensured adequately, it may face obvious difficulties. On the
other hand, maintaining excess liquidity may reduce earnings. So, liquidity management is
like a Knife-edge management problem. That’s why one of the most important tasks faced by
the management of any bank is ensuring adequate liquidity. In this regard the liquidity and
profitability of banking sector of Bangladesh has been studied on a comparison basis
emphasizing on State Owned Commercial Banks (SCBs), Domestic Commercial Banks
(PCBs) and Foreign Commercial Banks (FCBs). The fact has been revealed in the study is
that overall banking industry of Bangladesh is maintaining the adequate and excess liquidity
in the period of 2002 to 2010 and FCBs are more liquid than the SCBs and PCBs.
Simultaneously FCBs are also more profitable than the others. Reasons behind the excess
liquidity, different profitability of the various types of banks have been discussed. How excess
liquidity is hampering the profitability, the inherent reasons behind this has been also
described in the study.
iv
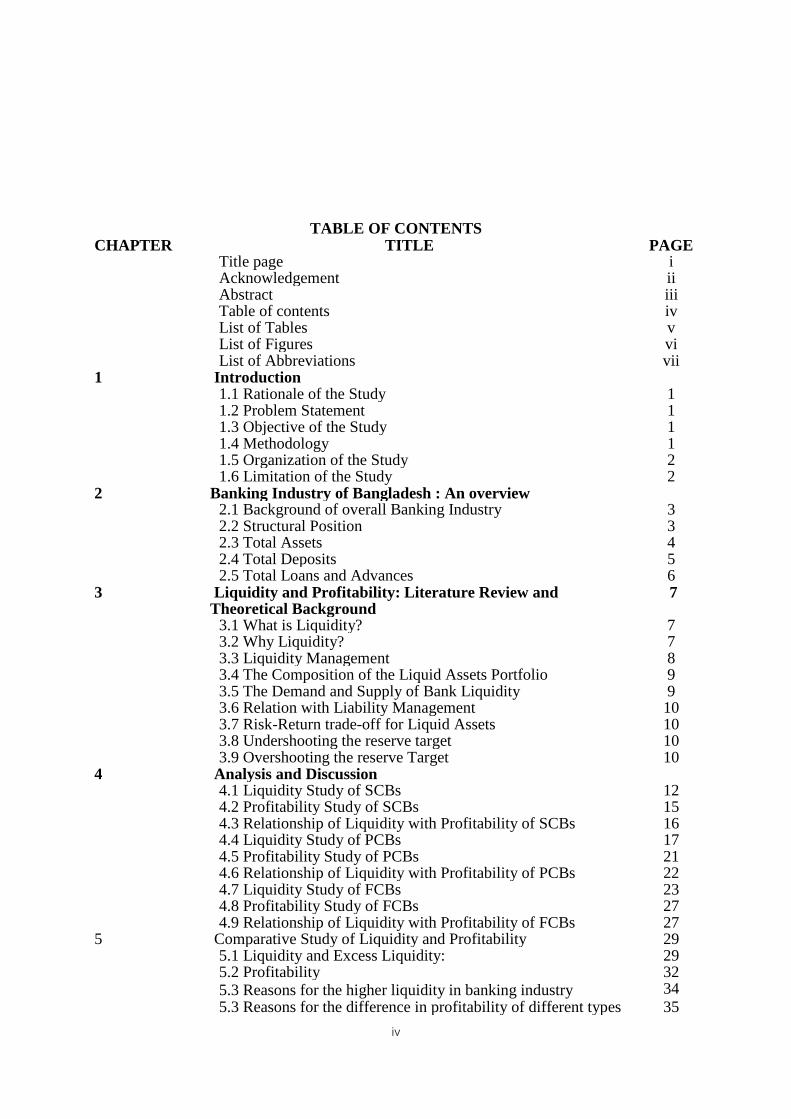
TABLE OF CONTENTS
CHAPTER TITLE PAGE Title page i Acknowledgement ii Abstract iii Table of contents iv List of Tables v List of Figures vi List of Abbreviations vii 1 Introduction 1.1 Rationale of the Study 1 1.2 Problem Statement 1 1.3 Objective of the Study 1 1.4 Methodology 1 1.5 Organization of the Study 2 1.6 Limitation of the Study 2 2 Banking Industry of Bangladesh : An overview 2.1 Background of overall Banking Industry 3 2.2 Structural Position 3 2.3 Total Assets 4 2.4 Total Deposits 5 2.5 Total Loans and Advances 6 3 Liquidity and Profitability: Literature Review and Theoretical Background
7
3.1 What is Liquidity? 7 3.2 Why Liquidity? 7 3.3 Liquidity Management 8 3.4 The Composition of the Liquid Assets Portfolio 9 3.5 The Demand and Supply of Bank Liquidity 9 3.6 Relation with Liability Management 10 3.7 Risk-Return trade-off for Liquid Assets 10 3.8 Undershooting the reserve target 10 3.9 Overshooting the reserve Target 10 4 Analysis and Discussion 4.1 Liquidity Study of SCBs 12 4.2 Profitability Study of SCBs 15 4.3 Relationship of Liquidity with Profitability of SCBs 16 4.4 Liquidity Study of PCBs 17 4.5 Profitability Study of PCBs 21 4.6 Relationship of Liquidity with Profitability of PCBs 22 4.7 Liquidity Study of FCBs 23 4.8 Profitability Study of FCBs 27 4.9 Relationship of Liquidity with Profitability of FCBs 27 5 Comparative Study of Liquidity and Profitability 29 5.1 Liquidity and Excess Liquidity: 29 5.2 Profitability 32 5.3 Reasons for the higher liquidity in banking industry 34
5.3 Reasons for the difference in profitability of different types 35
v
of banks. 5.4 Correlation Coefficients of liquidity and profitability 36 6 Conclusion 38 Appendixes 39 References 41
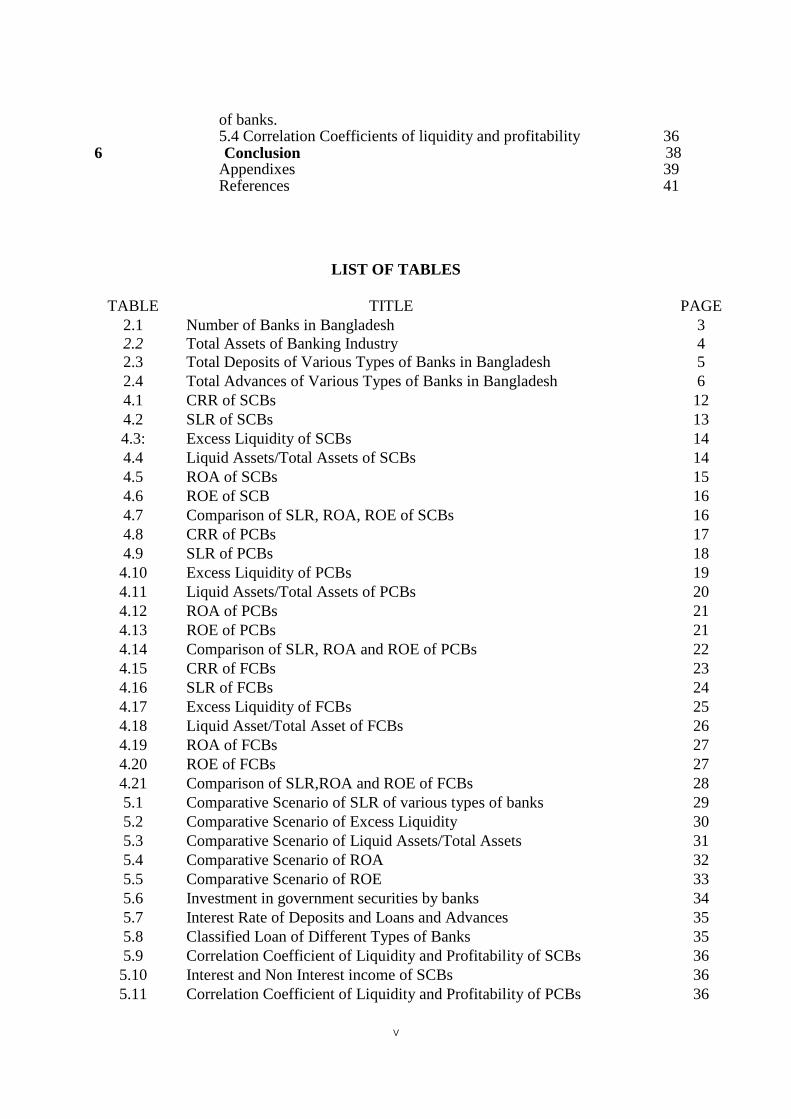
LIST OF TABLES
TABLE TITLE PAGE
2.1 Number of Banks in Bangladesh 3
2.2 Total Assets of Banking Industry 4
2.3 Total Deposits of Various Types of Banks in Bangladesh 5
2.4 Total Advances of Various Types of Banks in Bangladesh 6
4.1 CRR of SCBs 12
4.2 SLR of SCBs 13
4.3: Excess Liquidity of SCBs 14
4.4 Liquid Assets/Total Assets of SCBs 14
4.5 ROA of SCBs 15
4.6 ROE of SCB 16
4.7 Comparison of SLR, ROA, ROE of SCBs 16
4.8 CRR of PCBs 17
4.9 SLR of PCBs 18
4.10 Excess Liquidity of PCBs 19
4.11 Liquid Assets/Total Assets of PCBs 20
4.12 ROA of PCBs 21
4.13 ROE of PCBs 21
4.14 Comparison of SLR, ROA and ROE of PCBs 22
4.15 CRR of FCBs 23
4.16 SLR of FCBs 24
4.17 Excess Liquidity of FCBs 25
4.18 Liquid Asset/Total Asset of FCBs 26
4.19 ROA of FCBs 27
4.20 ROE of FCBs 27
4.21 Comparison of SLR,ROA and ROE of FCBs 28
5.1 Comparative Scenario of SLR of various types of banks 29
5.2 Comparative Scenario of Excess Liquidity 30
5.3 Comparative Scenario of Liquid Assets/Total Assets 31
5.4 Comparative Scenario of ROA 32
5.5 Comparative Scenario of ROE 33
5.6 Investment in government securities by banks 34
5.7 Interest Rate of Deposits and Loans and Advances 35
5.8 Classified Loan of Different Types of Banks 35
5.9 Correlation Coefficient of Liquidity and Profitability of SCBs 36
5.10 Interest and Non Interest income of SCBs 36
5.11 Correlation Coefficient of Liquidity and Profitability of PCBs 36

vi
5.12 Interest and non interest income of PCBs 37
5.13 Correlation Coefficient of Liquidity and Profitability of FCBs 37
5.14 Interest and non interest income of FCBs 37
vii
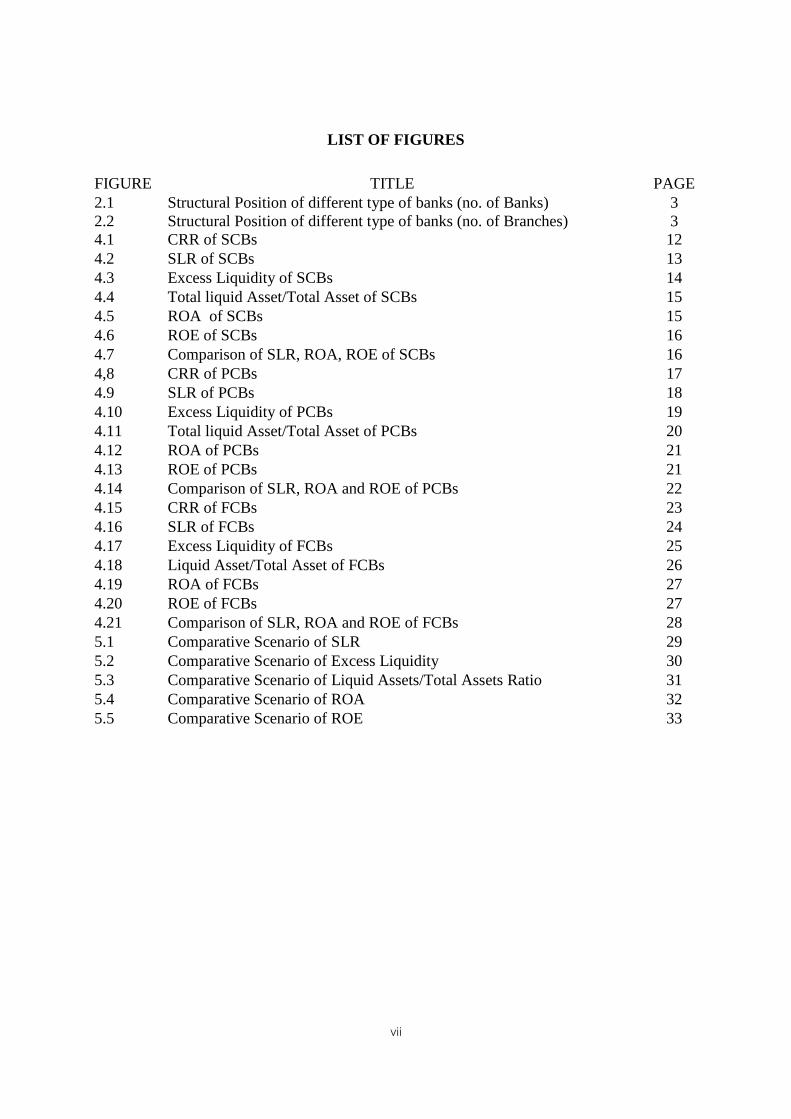
LIST OF FIGURES
FIGURE TITLE PAGE
2.1 Structural Position of different type of banks (no. of Banks) 3
2.2 Structural Position of different type of banks (no. of Branches) 3
4.1 CRR of SCBs 12
4.2 SLR of SCBs 13
4.3 Excess Liquidity of SCBs 14
4.4 Total liquid Asset/Total Asset of SCBs 15
4.5 ROA of SCBs 15
4.6 ROE of SCBs 16
4.7 Comparison of SLR, ROA, ROE of SCBs 16
4,8 CRR of PCBs 17
4.9 SLR of PCBs 18
4.10 Excess Liquidity of PCBs 19
4.11 Total liquid Asset/Total Asset of PCBs 20
4.12 ROA of PCBs 21
4.13 ROE of PCBs 21
4.14 Comparison of SLR, ROA and ROE of PCBs 22
4.15 CRR of FCBs 23
4.16 SLR of FCBs 24
4.17 Excess Liquidity of FCBs 25
4.18 Liquid Asset/Total Asset of FCBs 26
4.19 ROA of FCBs 27
4.20 ROE of FCBs 27
4.21 Comparison of SLR, ROA and ROE of FCBs 28
5.1 Comparative Scenario of SLR 29
5.2 Comparative Scenario of Excess Liquidity 30
5.3 Comparative Scenario of Liquid Assets/Total Assets Ratio 31
5.4 Comparative Scenario of ROA 32
5.5 Comparative Scenario of ROE 33
viii
LIST OF ABBREVIATIONS
BB Bangladesh Bank
BDT Bangladesh Taka
CRR Cash Reserve Requirement
FCB Foreign Commercial Bank
PCB Private Commercial Bank
PD Primary Dealer
ROA Return on Assets
ROE Return on Equity
SCB State owned Commercial Bank
SLR Statutory Liquidity Requirement
1
CHAPTER 1
INTRODUCTION
1.1 Rationale of the Study
Banking sector plays an important role in the economy of a country. In choosing the topic of
this study the importance of the banking sector has been considered.
Since, capital market of Bangladesh is not developed enough. So, banking sector is playing
important role for supply of credit to industry, agriculture and service sectors. To ensure the
increment of self dependency through investing in the domestic production sectors, a sound
banking sector is one of the most important challenges.
Maintaining the sound liquidity position is one of the significant indicators of better
performance of a bank. Without ensuring the adequate liquidity the banking sector will fail to
hold its current leading position in mobilizing resources and allocating funds in profitable
ends in the economy. So, the topic “Liquidity and Profitability study of State Owned
Commercial Banks (SCBs), Private Commercial Banks (PCBs) and Foreign Commercial
Banks (FCBs) - Bangladesh Perspective” will cover the relevant field to have a look in the
liquidity and profitability position of banking sector as an indicator of the performance of the
overall banking industry.
1.2 Problem Statement
What are the liquidity positions of SCBs, PCBs and FCBs? Are they maintaining adequate
liquidity?
What type of banks is making more profit? What are the main reasons behind making more
profits? Is there any impact of liquidity on profit of different types of banks?
1.3 Objective of the Study
To have a look in profitability and liquidity position of the SCBs, PCBs and FCBs is the main
target of this study. The liquidity and profitability position of these sectors of the banking
industry has been evaluated in a comparative mode. To determine the profitability position of
the SCBs, PCBs and FCBs in relation to the liquidity is the supplementary objective of the
study. To reveal some inherent reasons for the profit differentials among the SCBs, PCBs and
FCBs through the study is a part of the objective.
1.4 Methodology
For the study both primary and secondary data has been used.
Collection of Primary Data: Assessment of existing literature as well as of discussions with
some experts associated with the Liquidity and Treasury managers of commercial banks.
Collection of Secondary Data: The secondary data has been collected from different sources-
Bangladesh Bank, published research journals, published books, websites, etc.
2
1.5 Organization of the Study
The Study will be organized into six chapters
The first chapter covers rational of the study, problem statement, methodology and limitation
of the study.
The second chapter draws a picture of banking industry of Bangladesh.
The third chapter draws a literature review and theoretical background about the liquidity and
profitability of banks.
The fourth and fifth chapters analyze the liquidity and profitability scenario of SCBs, PCBs
and FCBs in individual and comparative mode. Reasons behind the excess liquidity, different
profitability of the various types of banks have been discussed here. How excess liquidity is
hampering the profitability, the inherent reasons behind this has been also described in this
chapter.
The last chapter draws a conclusion liquidity and profitability scenario of various types of
banks.
1.6 Limitation of the Study
The main problem faced in preparing the paper was the inadequacy and lack of availability of
required data. Having no practical knowledge regarding the liquidity management in the
banking sector was another problem, because the theoretical and practical scenario may not be
identical in all the time. And the extent of knowledge is not sufficient enough to prepare the
paper in a professional way. Subject to these problems, the study is not out of shortcomings.
This paper only reveals the liquidity and profitability position of the banking industry, but
nothing is highlighted regarding the management of the liquidity due to the above mentioned
shortfalls.
3
CHAPTER 2
BANKING INDUSTRY OF BANGLADESH: AN OVERVIEW
2.1 Background of overall Banking Industry
After liberation in 1971, the banks operating in Bangladesh (except those operated abroad)
were nationalized. These banks were merged and grouped into 6 commercial banks. The two
government owned specialized banks have been renamed as Bangladesh Krishi Bank and
Bangladesh Shilpa Bank. After that few banks were given to the private sectors. Foreign
banks were allowed to operate in Bangladesh. Many private sector commercial banks were
permitted to operate in Bangladesh in 1980s and 2000s.
All such banks operating in Bangladesh with different paid-up capital and reserves having a
minimum on aggregate value of Taka 0.5 million and conducting their affairs to the
satisfaction of the Bangladesh Bank (Central Bank of Bangladesh)have been declared as
scheduled banks in term of Section 37(a) of Bangladesh Bank order 1972. Now in term of 13
of Bank Company Act, 1991, the minimum aggregate value is Taka 4 billion.
Currently in total 47 banks are in operation in the banking industry in different ownership.
Among these 47, 04 are the State Owned Commercial Banks (SCBs), 05 are specialized banks
and 39 are Private Commercial Banks (PCBs). Out of 39 PCBs, 23 are conventional and 07
Islamic domestic Private Commercial Banks and the rest 09 are the foreign commercial
Banks. (BB (2010)
2.2 Structural Position of the Banking Industry
Before going to the main issue of study it is needed to highlight on the structural position of
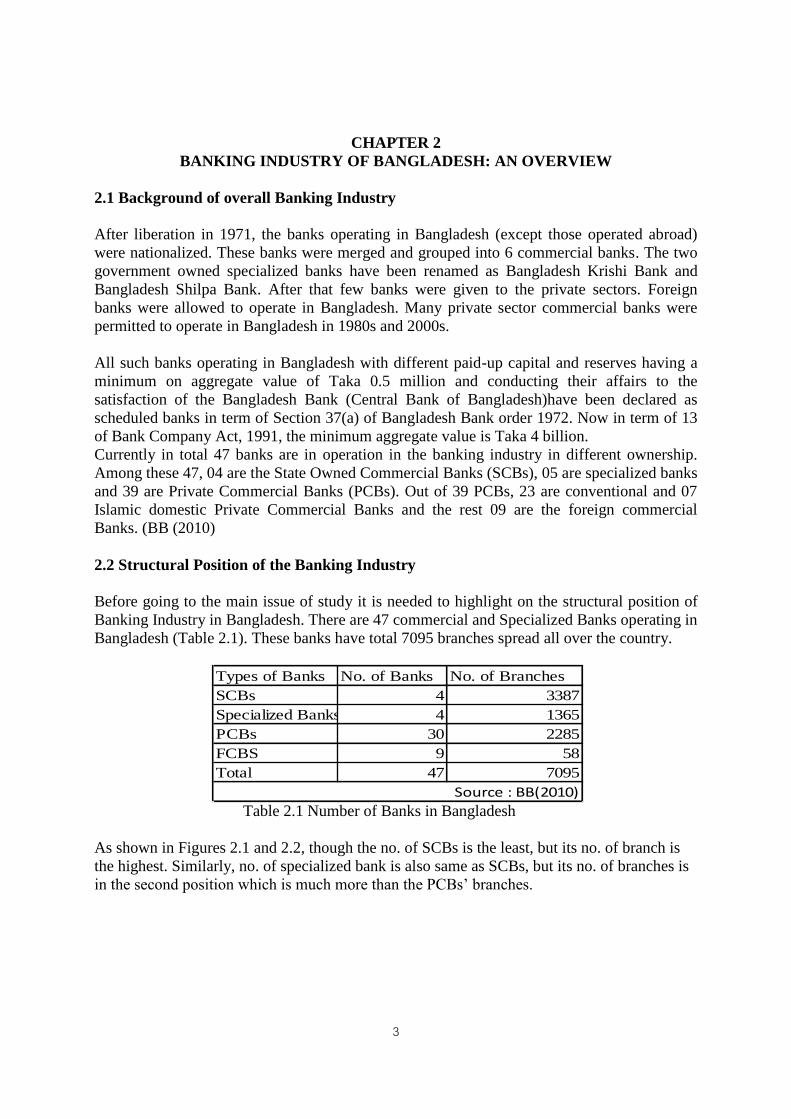
Banking Industry in Bangladesh. There are 47 commercial and Specialized Banks operating in
Bangladesh (Table 2.1). These banks have total 7095 branches spread all over the country.
Table 2.1 Number of Banks in Bangladesh
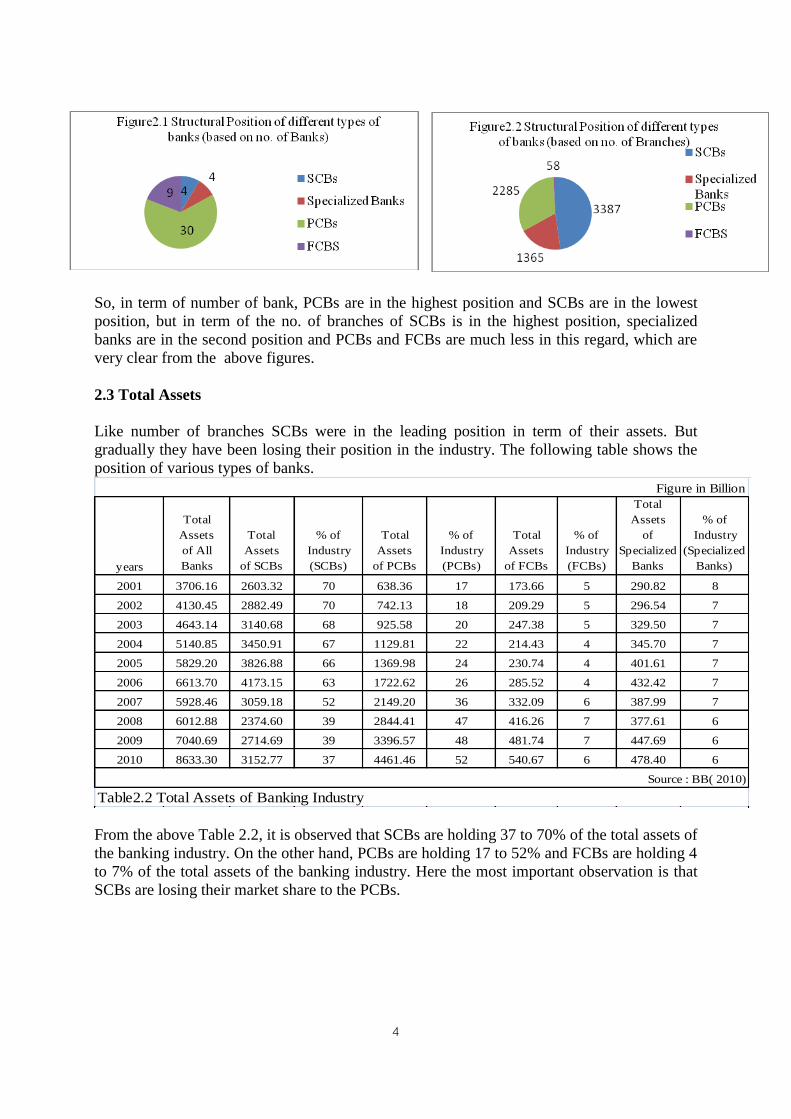
As shown in Figures 2.1 and 2.2, though the no. of SCBs is the least, but its no. of branch is
the highest. Similarly, no. of specialized bank is also same as SCBs, but its no. of branches is
in the second position which is much more than the PCBs’ branches.
Types of Banks No. of Banks No. of Branches
SCBs 4 3387
Specialized Banks 4 1365
PCBs 30 2285
FCBS 9 58
Total 47 7095
Source : BB(2010)
4
So, in term of number of bank, PCBs are in the highest position and SCBs are in the lowest
position, but in term of the no. of branches of SCBs is in the highest position, specialized
banks are in the second position and PCBs and FCBs are much less in this regard, which are
very clear from the above figures.
2.3 Total Assets
Like number of branches SCBs were in the leading position in term of their assets. But
gradually they have been losing their position in the industry. The following table shows the
position of various types of banks.
years
Total
Assets
of All
Banks
Total
Assets
of SCBs
% of
Industry
(SCBs)
Total
Assets
of PCBs
% of
Industry
(PCBs)
Total
Assets
of FCBs
% of
Industry
(FCBs)
Total
Assets
of
Specialized
Banks
% of
Industry
(Specialized
Banks)
2001 3706.16 2603.32 70 638.36 17 173.66 5 290.82 8
2002 4130.45 2882.49 70 742.13 18 209.29 5 296.54 7
2003 4643.14 3140.68 68 925.58 20 247.38 5 329.50 7
2004 5140.85 3450.91 67 1129.81 22 214.43 4 345.70 7
2005 5829.20 3826.88 66 1369.98 24 230.74 4 401.61 7
2006 6613.70 4173.15 63 1722.62 26 285.52 4 432.42 7
2007 5928.46 3059.18 52 2149.20 36 332.09 6 387.99 7
2008 6012.88 2374.60 39 2844.41 47 416.26 7 377.61 6
2009 7040.69 2714.69 39 3396.57 48 481.74 7 447.69 6
2010 8633.30 3152.77 37 4461.46 52 540.67 6 478.40 6
Source : BB( 2010)
Figure in Billion
Table2.2 Total Assets of Banking Industry
From the above Table 2.2, it is observed that SCBs are holding 37 to 70% of the total assets of
the banking industry. On the other hand, PCBs are holding 17 to 52% and FCBs are holding 4
to 7% of the total assets of the banking industry. Here the most important observation is that
SCBs are losing their market share to the PCBs.
5
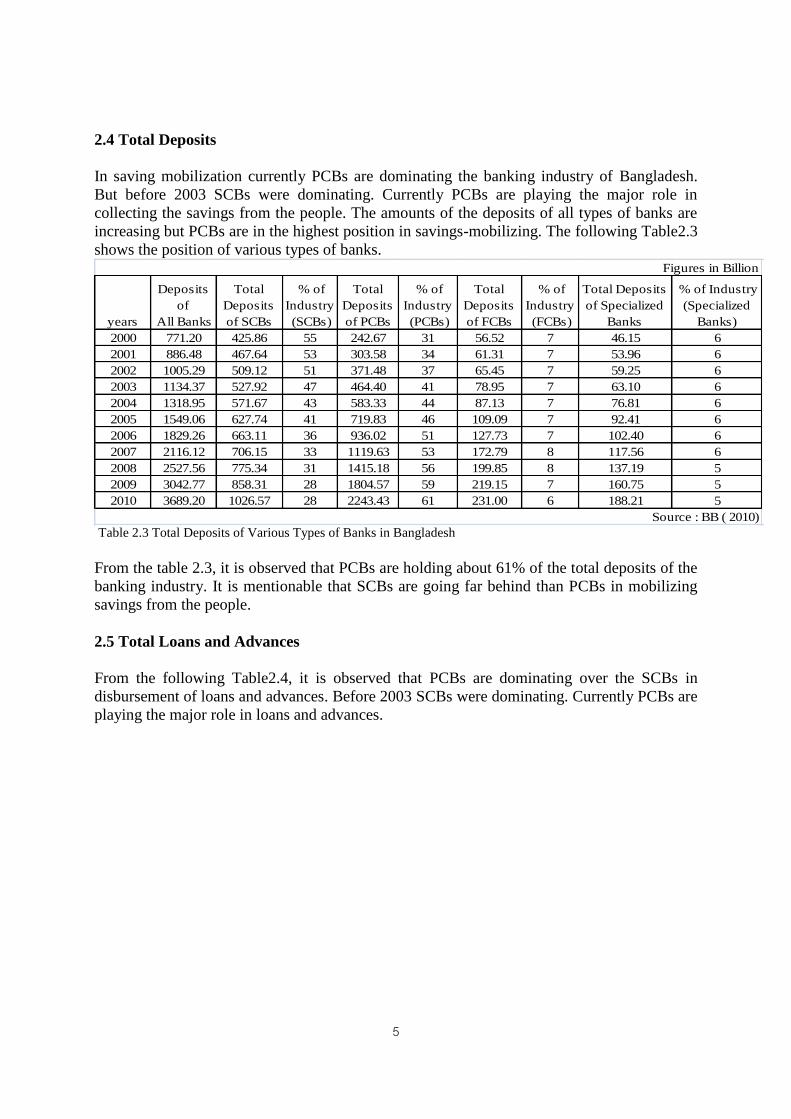
2.4 Total Deposits
In saving mobilization currently PCBs are dominating the banking industry of Bangladesh.
But before 2003 SCBs were dominating. Currently PCBs are playing the major role in
collecting the savings from the people. The amounts of the deposits of all types of banks are
increasing but PCBs are in the highest position in savings-mobilizing. The following Table2.3
shows the position of various types of banks.
years
Deposits
of
All Banks
Total
Deposits
of SCBs
% of
Industry
(SCBs)
Total
Deposits
of PCBs
% of
Industry
(PCBs)
Total
Deposits
of FCBs
% of
Industry
(FCBs)
Total Deposits
of Specialized
Banks
% of Industry
(Specialized
Banks)
2000 771.20 425.86 55 242.67 31 56.52 7 46.15 6
2001 886.48 467.64 53 303.58 34 61.31 7 53.96 6
2002 1005.29 509.12 51 371.48 37 65.45 7 59.25 6
2003 1134.37 527.92 47 464.40 41 78.95 7 63.10 6
2004 1318.95 571.67 43 583.33 44 87.13 7 76.81 6
2005 1549.06 627.74 41 719.83 46 109.09 7 92.41 6
2006 1829.26 663.11 36 936.02 51 127.73 7 102.40 6
2007 2116.12 706.15 33 1119.63 53 172.79 8 117.56 6
2008 2527.56 775.34 31 1415.18 56 199.85 8 137.19 5
2009 3042.77 858.31 28 1804.57 59 219.15 7 160.75 5
2010 3689.20 1026.57 28 2243.43 61 231.00 6 188.21 5
Figures in Billion
Source : BB ( 2010)
Table 2.3 Total Deposits of Various Types of Banks in Bangladesh
From the table 2.3, it is observed that PCBs are holding about 61% of the total deposits of the
banking industry. It is mentionable that SCBs are going far behind than PCBs in mobilizing
savings from the people.
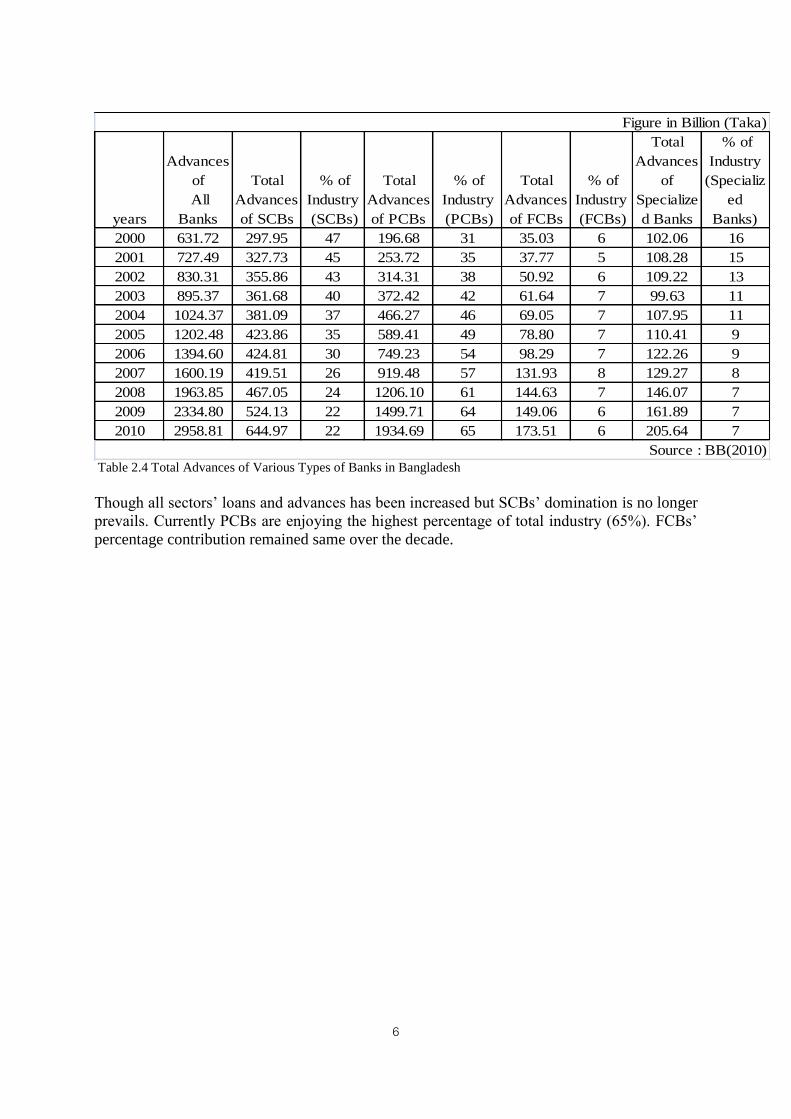
2.5 Total Loans and Advances
From the following Table2.4, it is observed that PCBs are dominating over the SCBs in
disbursement of loans and advances. Before 2003 SCBs were dominating. Currently PCBs are
playing the major role in loans and advances.
6
years
Advances
of
All
Banks
Total
Advances
of SCBs
% of
Industry
(SCBs)
Total
Advances
of PCBs
% of
Industry
(PCBs)
Total
Advances
of FCBs
% of
Industry
(FCBs)
Total
Advances
of
Specialize
d Banks
% of
Industry
(Specializ
ed
Banks)
2000 631.72 297.95 47 196.68 31 35.03 6 102.06 16
2001 727.49 327.73 45 253.72 35 37.77 5 108.28 15
2002 830.31 355.86 43 314.31 38 50.92 6 109.22 13
2003 895.37 361.68 40 372.42 42 61.64 7 99.63 11
2004 1024.37 381.09 37 466.27 46 69.05 7 107.95 11
2005 1202.48 423.86 35 589.41 49 78.80 7 110.41 9
2006 1394.60 424.81 30 749.23 54 98.29 7 122.26 9
2007 1600.19 419.51 26 919.48 57 131.93 8 129.27 8
2008 1963.85 467.05 24 1206.10 61 144.63 7 146.07 7
2009 2334.80 524.13 22 1499.71 64 149.06 6 161.89 7
2010 2958.81 644.97 22 1934.69 65 173.51 6 205.64 7
Source : BB(2010)
Figure in Billion (Taka)
Table 2.4 Total Advances of Various Types of Banks in Bangladesh
Though all sectors’ loans and advances has been increased but SCBs’ domination is no longer
prevails. Currently PCBs are enjoying the highest percentage of total industry (65%). FCBs’
percentage contribution remained same over the decade.
7
CHAPTER 3
LIQUIDITY AND PROFITABILITY: LITERATURE REVIEWS AND A
THEORICAL BACKGROUND
The recent economic crisis has underlined the importance of liquidity management in banking
sector. In response, regulators are evaluating the existing liquidity position and trying to
devise new liquidity standards with the aim of making the financial system more stable and
resilient. There is a general sense that banks do not fully appreciate the importance of
liquidity risk management. That is why Basel Committee on Banking Supervision
(BCBS2010) tried to fix common measures and standards for facing liquidity risk by the
banks.
Bordereau, E. and Graham, C. (2010) in their paper “The Impact of Liquidity on Bank
Profitability” analyze the impact of liquid asset holdings on bank profitability for a sample of
large U.S. and Canadian banks (1997 to 2009). Results indicate that profitability has been
improved for banks (In US and Canada) that hold more liquid assets, however, there is a point
at which holding further liquid assets diminishes a banks’ profitability, all else equal. The
paper also found that this relationship varies depending on a bank’s business model and the
state of the economy.
A model has been developed by Morris and Shin (2010) where a bank’s credit risk is
decomposed into insolvency risk (the conditional probability of default due to deterioration of
asset quality if there is no run by short‐term creditors) and illiquid risk (the probability of a
default due to a run when the institution would otherwise have been solvent). The model
provides a formula for “illiquidity risk” and the authors show that an increase in the liquidity
ratio of a bank decreases the probability of an “illiquid” default.
Bourke (1989) finds some evidence of a positive relationship between liquid assets and bank
profitability for 90 banks in Europe, North America and Australia from 1972 to 1981, while
Molyneux and Thornton (1992) and Goddard, et al (2004) find mixed evidence of a negative
relationship between the two variables for European banks in the late 1980s and mid‐1990s,
respectively.
Mujere.M, and Younus.S (2009) in their paper “ An analysis of interest rate spread in banking
sector” showed that The statutory reserves requirements(SLR) and the high NSD certificate
interest rates leads to higher interest rate spreads in the banking sector in Bangladesh.
3.1 What is Liquidity?
In general liquidity means the ease with which an asset can be converted into cash. In banking
sector liquidity means the ability of the banks to meet up the claim of the deposit holders or
any other client in cash instantly with minimum cost. So having the adequate amount of cash
and near cash assets with the banks indicates better liquidity position of banks.
3.2 Why Liquidity?
The economics and finance literature analyze four possible reasons for firms to hold liquid
assets; the transaction motive (Miller and Orr 1966), the precautionary motive (Opler,
8
Pinkowitz, Stulz, and Williamson 1999), the tax motive (Foley, Hartzell, Titman, and Twite
2007) and finally the agency motive (Jensen 1986).
One of the most important tasks faced by the management of any bank is ensuring adequate
liquidity. A bank is considered to be liquid if it has ready access to immediately spendable
funds at reasonable cost at precisely the time those funds are needed. This suggests that a
liquid bank either has the right amount of immediately spendable funds on hand where they
are required of can quickly raise liquid funds by borrowing or by selling assets.
Lack of adequate liquidity is often one of the first signs that a bank is in serious financial
trouble. The troubled bank usually begins to lose deposits, which erodes its supply of cash and
forces the institution to dispose of its more liquid assets. Other banks become increasingly
reluctant to lend the troubled bank any funds without additional security or higher rate of
interest, which further reduces the earnings of the problem institution and threatens it with
failure.
Many banks assume that liquid funds can be borrowed virtually without limit any time they
are needed. Therefore, they see little need to store liquidity in the form easily marketed stable-
price assets. The enormous cash shortages experienced in recent years by banks in trouble
make clear that liquidity needs cannot be ignored. Liquidity management is far more
important than ever before, because a bank can be closed if it cannot raise enough liquidity
even though, technically, it may still be solvent. Moreover, the competence of a bank’s
liquidity managers is an important barometer of a management’s overall effectiveness in
achieving the bank’s long-term goals.
3.3 Liquidity Management
A liquid asset can be turned into cash quickly and at low cost with little or no loss in principal
value. The ultimate liquid asset is cash, of course. Although it is obvious that a Financial
Institution’s (FI’s) liquidity risk can be reduced by holding large amounts of assets such as
cash, treasury bills and other money market instruments. FIs usually face a return or interest
earnings penalty from doing this. Because of their high liquidity and low default risks, such
assets often bear low returns reflecting their essentially risk free nature.
Holding relatively small amount of liquid assets exposes FI to enhance illiquidity and risk of
bank run. Excess illiquidity can result in and FI’s inability to meet required payments on
liability claims and, at extreme, insolvency and can even lead to contagious effects that
negatively impact other FIs. Consequently, regulators have often imposed minimum liquid
asset reserve requirement on FIs. In general, these requirements differ in nature and scope for
various FIs and even according to country. The requirements depend on the illiquidity risk
exposure perceived for the FI’s type and other regulatory objectives that relate to minimum
liquid asset requirement. Especially, regulators often set minimum liquid asset requirements
for at least two additional reasons than simply ensuring that FIs can meet expected and
unexpected liability withdrawals. The other two reasons relate to monetary policy and
taxation.
3.3.1 Monetary Policy Reasons
Many countries set minimum liquid asset reserve requirements to strengthen their monetary
policy. Specifically, setting a minimum ratio of liquid reserve assets to deposits limits the
9
ability of banks and bank-related institutions to expand lending and enhances the central
bank’s ability to control the money supply. In this context requiring depository institutions to
holds minimum ratios liquid assets to deposits allow the central bank to gain greater control
over deposit growth and thus over the money supply (of which bank deposits are a highly
significant portion) as part to its overall macro control objectives.
3.3.2 Taxation Reason
Another reason for requiring minimums on FI liquid asset holdings is to force FIs to invest in
government financial claims rather than private sector financial claims. That is, a minimum
required liquid asset reserve requirement tax is an indirect way for governments to raise
additional “taxes” from FIs. Having banks hold cash in the vault or cash reserves at the central
bank (when no interest rate compensation is paid) requires banks to transfer a resource to the
central bank. This tax or cost effect is increased if inflation creates the purchasing power
value of those balances.
3.4 The Composition of the Liquid Assets Portfolio
The composition of a bank’s asset portfolio, especially cash and government securities is
determined partly by earnings considerations and partly by the type of minimum liquid asset
reserve requirements that the central bank imposes. So there two segments of the liquid assets
of a bank. These two are as follows:
3.4.1 Liquid Asset Ratio
A minimum ratio of liquid assets total assets set by the central bank. In many countries, like
UK, reserve ratios have historically been imposed to encompass both cash and liquid
government securities such as treasury bills. By contrast, the minimum liquid asset
requirements for banks in the United States have been based and have excluded government
securities. As a result government securities are less useful because they are not counted as
part of the reserves held by banks and at the same time yield lower promised returns than
loans do.
3.4.2 Buffer Reserve
These are the non-reserve assets that can be quickly turned into cash. In times crisis, when
significant drains on cash reserves occur, these securities can be turned into cash quickly and
with very little loss of principal value because of the deep nature of the market in which these
assets are traded. These assets are shown in the Balance Sheet as Balance with other Banks
and Financial Institutions, Money at call and short notice and other short term investments.
In Bangladesh according to the Bangladesh Bank direction the scheduled banks have to
maintain the Cash balance with Bangladesh Bank of 6% of the deposits (Total of Demand and
Time Deposits) as Cash Reserve Requirement (CRR) and also have to maintain (except
specialized and Islamic banks) the liquid assets to total assets of 19% of the deposits amount
as Statutory Liquidity Reserve (SLR), but for the Islamic banks this ratio is only 11.5%.
10
3.5 The Demand and Supply of Bank Liquidity
A bank’s need for liquidity immediately spendable funds can be viewed within a demand-
supply framework. What activities give rise to the demand for liquidity inside a bank? And
what sources can the bank rely upon to supply liquidity when spendable funds are needed?
These various sources of liquidity demand and supply come together to determine each bank’s
net liquidity position at any moment in time. That net liquidity position at time is as follows:
A bank’s Liquidity Position (L ) Services = (Incoming deposits (inflows)+ Revenue from the
sale of non deposit assets +Customer loan repayment + Sale of bank assets + Borrowing from
money market)- (Deposit withdrawals (outflows) + Volume of acceptable loan request +
Repayment of bank borrowings + Other operating expenses + Dividend payments to bank
stockholders.
When the bank’s total demand for liquidity exceeds its total supply of liquidity, management
must prepare for a liquidity deficit, deciding when and where to raise additional liquid funds.
On the other hand, if at any point in time the total supply off liquidity to the bank exceeds all
of its liquidity demands, management must prepare for a liquidity surplus, deciding when and
where to profitably invest surplus liquid funds until they are needed to cover future liquidity
demands.
3.6 Relation with Liability Management
Liquidity and liability management are closely related. One aspect of liquidity risk control is
the buildup of a prudential level of liquid assets. Another aspect is the management of the
banks’ liability structure to reduce the need for large amounts of liquid assets to meet liability
withdrawals. Excessive use of purchased funds in the liability structure can result, however, in
a liquidity crisis if investors lose confidence in the bank and refuse to over such funds.
Unfortunately, constructing a low-cost, low-withdrawal-risk liability portfolio is more
difficult than it sounds. This is true because those liabilities or sources of bank funds that are
the most subject to withdrawal risk are often the least costly to the bank. That is, a bank must
trade off the benefits of attracting liabilities at a low funding cost with a high chance of
withdrawal against liabilities with a high funding cost and low liquidity.
3.7 Risk-Return trade-off for Liquid Assets
In optimizing its holdings of liquid assets, a bank must trade the benefit of cash immediacy
for lower returns. In addition, the bank manager’s choice is one of constrained optimization in
the sense that liquid asset reserve requirements imposed by regulators set a minimum bound
on the level to which liquid reserve assets can fall in the balance sheet.
3.8 Undershooting the Reserve Target
This situation occurs when at the end of the reserve maintenance period it is found that the
bank holds the liquid assets less than the required minimum reserve ratio. If the reserve
shortfall exceeds required percent, the bank is liable to explicit and implicit penalty interest
rate charge equal to the central bank’s discount rate plus a 2 percent markup the implicit
charges can include more frequent monitoring, examinations and surveillance if bank
regulator’s view the inadequate reserve amount as a reflection of an unsafe and unsound
11
practice by the bank’s manager. Such a view is likely to be taken only if the bank consistently
undershoots its reserve targets.
3.9 Overshooting the Reserve Target
This situation occurs when at the end of the reserve maintenance period it is found that the
bank holds the liquid assets in excess of the minimum required ratio. The cost of overshooting
depends on whether the bank perceives its prudent level of reserves to meet expected and
unexpected deposit withdrawals to be higher or lower than the regulatory-imposed minimum
reserve amount. The excess reserve-either cash or on deposit on central bank-earns no interest
and could have been lent out at the bank lending rate. In contrast, if the bank manager
perceives that the regulatory required minimum level of reserves is lower than it need for
expected and unexpected deposit withdrawal exposure, the bank overshoots the required
minimum reserve target. This policy maintains the bank’s liquidity position at a prudently
adequate level. In choosing to overshoot the target, the manager must consider the least cost
instrument in which to hold such reserves.
So, liquidity management is like a knife-edge management problem. Because holding too
many liquid assets penalize a bank’s earnings and, thus, its stockholders. A bank manager
who holds excessive amounts of liquid assets is unlikely to survive long; similarly, a manager
who undershoots the reserve target faces enhanced risk of liquidity crisis and regulatory
intervention. Again, such a manager’s tenure at bank may be relatively short. Avoiding the
cost of excessive overshooting or undershooting made more difficult for the banks because
the exact minimum required reserve target is not known until two days before the end of the
reserve maintenance period. This makes the optimal management of the reserve position of a
bank similar to a complex dynamic control problem with a moving target.
12
CHAPTER 4
ANALYSIS AND DISCUSSION
4.1: Liquidity Study of SCBs
Cash Reserve Requirement (CRR), Statutory Liquidity Reserve (SLR), excess liquidity and
liquid assets have been used as indicators of liquidity.
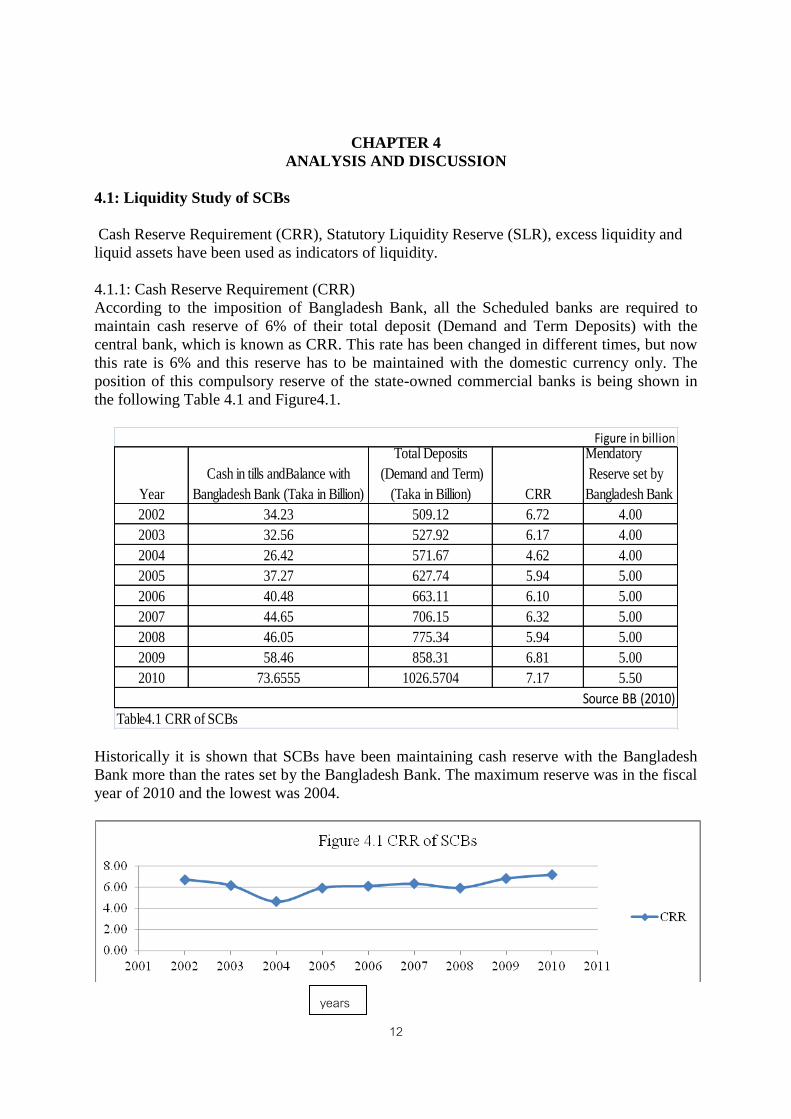
4.1.1: Cash Reserve Requirement (CRR)
According to the imposition of Bangladesh Bank, all the Scheduled banks are required to
maintain cash reserve of 6% of their total deposit (Demand and Term Deposits) with the
central bank, which is known as CRR. This rate has been changed in different times, but now
this rate is 6% and this reserve has to be maintained with the domestic currency only. The
position of this compulsory reserve of the state-owned commercial banks is being shown in
the following Table 4.1 and Figure4.1.
Year
Cash in tills andBalance with
Bangladesh Bank (Taka in Billion)
Total Deposits
(Demand and Term)
(Taka in Billion) CRR
Mendatory
Reserve set by
Bangladesh Bank
2002 34.23 509.12 6.72 4.00
2003 32.56 527.92 6.17 4.00
2004 26.42 571.67 4.62 4.00
2005 37.27 627.74 5.94 5.00
2006 40.48 663.11 6.10 5.00
2007 44.65 706.15 6.32 5.00
2008 46.05 775.34 5.94 5.00
2009 58.46 858.31 6.81 5.00
2010 73.6555 1026.5704 7.17 5.50
Figure in billion
Source BB (2010)
Table4.1 CRR of SCBs
Historically it is shown that SCBs have been maintaining cash reserve with the Bangladesh
Bank more than the rates set by the Bangladesh Bank. The maximum reserve was in the fiscal
year of 2010 and the lowest was 2004.
years
13
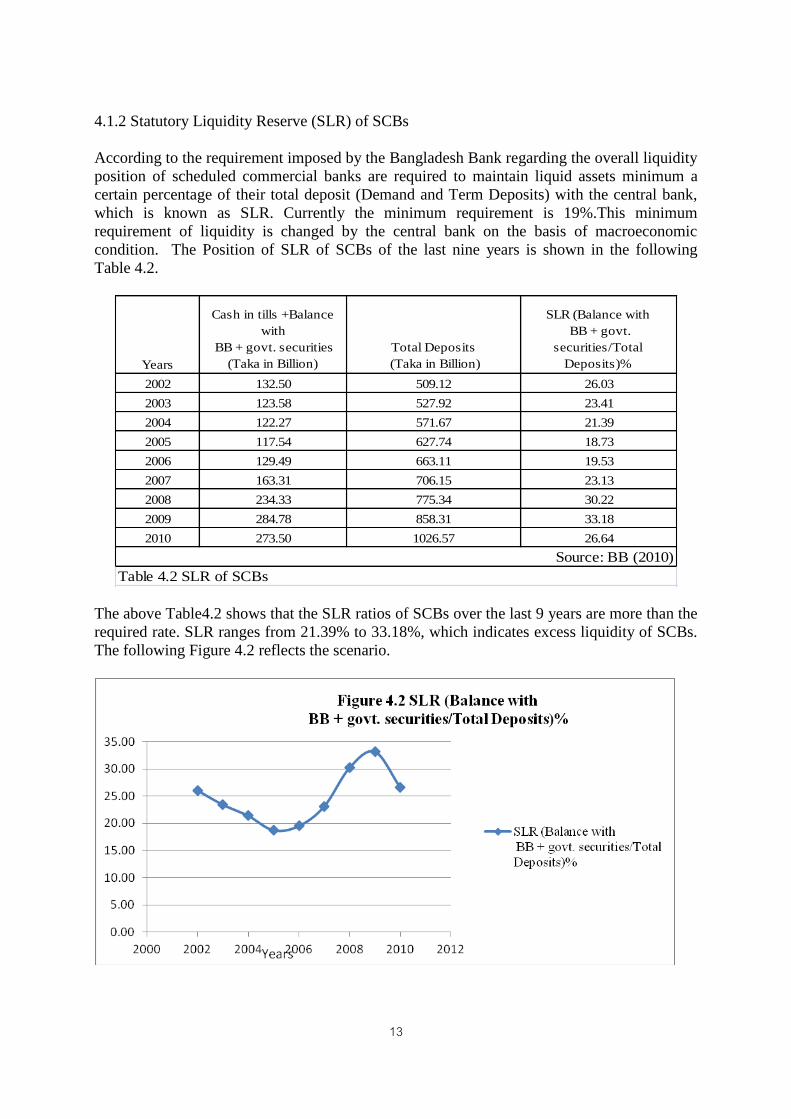
4.1.2 Statutory Liquidity Reserve (SLR) of SCBs
According to the requirement imposed by the Bangladesh Bank regarding the overall liquidity
position of scheduled commercial banks are required to maintain liquid assets minimum a
certain percentage of their total deposit (Demand and Term Deposits) with the central bank,
which is known as SLR. Currently the minimum requirement is 19%.This minimum
requirement of liquidity is changed by the central bank on the basis of macroeconomic
condition. The Position of SLR of SCBs of the last nine years is shown in the following
Table 4.2.
Years
Cash in tills +Balance
with
BB + govt. securities
(Taka in Billion)
Total Deposits
(Taka in Billion)
SLR (Balance with
BB + govt.
securities/Total
Deposits)%
2002 132.50 509.12 26.03
2003 123.58 527.92 23.41
2004 122.27 571.67 21.39
2005 117.54 627.74 18.73
2006 129.49 663.11 19.53
2007 163.31 706.15 23.13
2008 234.33 775.34 30.22
2009 284.78 858.31 33.18
2010 273.50 1026.57 26.64
Source: BB (2010)
Table 4.2 SLR of SCBs
The above Table4.2 shows that the SLR ratios of SCBs over the last 9 years are more than the
required rate. SLR ranges from 21.39% to 33.18%, which indicates excess liquidity of SCBs.
The following Figure 4.2 reflects the scenario.
14
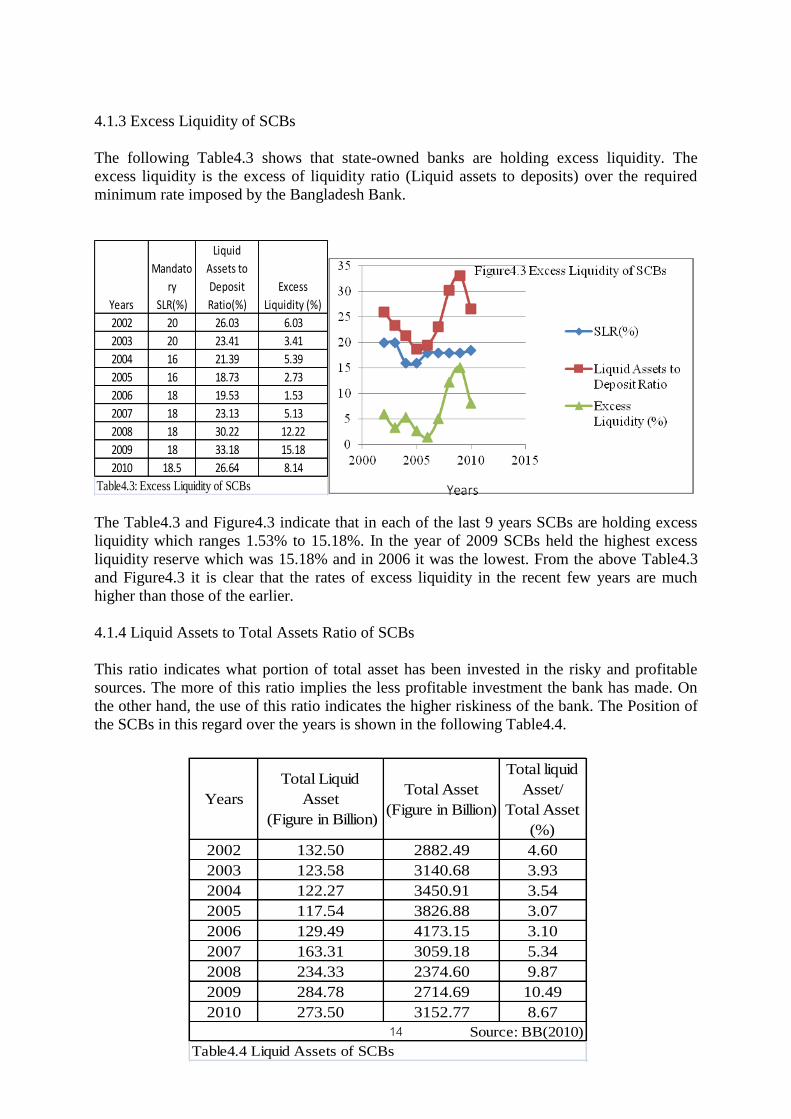
4.1.3 Excess Liquidity of SCBs
The following Table4.3 shows that state-owned banks are holding excess liquidity. The
excess liquidity is the excess of liquidity ratio (Liquid assets to deposits) over the required
minimum rate imposed by the Bangladesh Bank.
Years
Mandato
ry
SLR(%)
Liquid
Assets to
Deposit
Ratio(%)
Excess
Liquidity (%)
2002 20 26.03 6.03
2003 20 23.41 3.41
2004 16 21.39 5.39
2005 16 18.73 2.73
2006 18 19.53 1.53
2007 18 23.13 5.13
2008 18 30.22 12.22
2009 18 33.18 15.18
2010 18.5 26.64 8.14
Table4.3: Excess Liquidity of SCBs
The Table4.3 and Figure4.3 indicate that in each of the last 9 years SCBs are holding excess
liquidity which ranges 1.53% to 15.18%. In the year of 2009 SCBs held the highest excess
liquidity reserve which was 15.18% and in 2006 it was the lowest. From the above Table4.3
and Figure4.3 it is clear that the rates of excess liquidity in the recent few years are much
higher than those of the earlier.
4.1.4 Liquid Assets to Total Assets Ratio of SCBs
This ratio indicates what portion of total asset has been invested in the risky and profitable
sources. The more of this ratio implies the less profitable investment the bank has made. On
the other hand, the use of this ratio indicates the higher riskiness of the bank. The Position of
the SCBs in this regard over the years is shown in the following Table4.4.
Years
Total Liquid
Asset
(Figure in Billion)
Total Asset
(Figure in Billion)
Total liquid
Asset/
Total Asset
(%)
2002 132.50 2882.49 4.60
2003 123.58 3140.68 3.93
2004 122.27 3450.91 3.54
2005 117.54 3826.88 3.07
2006 129.49 4173.15 3.10
2007 163.31 3059.18 5.34
2008 234.33 2374.60 9.87
2009 284.78 2714.69 10.49
2010 273.50 3152.77 8.67
Source: BB(2010)
Table4.4 Liquid Assets of SCBs
15
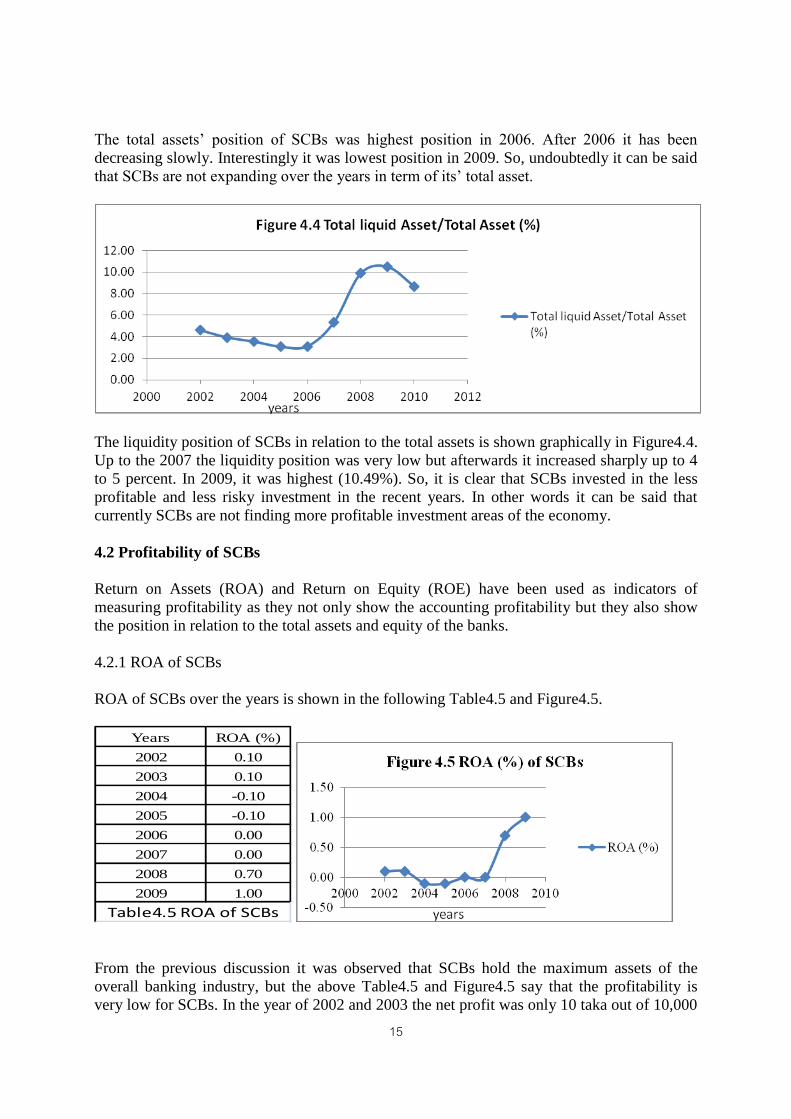
The total assets’ position of SCBs was highest position in 2006. After 2006 it has been
decreasing slowly. Interestingly it was lowest position in 2009. So, undoubtedly it can be said
that SCBs are not expanding over the years in term of its’ total asset.
The liquidity position of SCBs in relation to the total assets is shown graphically in Figure4.4.
Up to the 2007 the liquidity position was very low but afterwards it increased sharply up to 4
to 5 percent. In 2009, it was highest (10.49%). So, it is clear that SCBs invested in the less
profitable and less risky investment in the recent years. In other words it can be said that
currently SCBs are not finding more profitable investment areas of the economy.
4.2 Profitability of SCBs
Return on Assets (ROA) and Return on Equity (ROE) have been used as indicators of
measuring profitability as they not only show the accounting profitability but they also show
the position in relation to the total assets and equity of the banks.
4.2.1 ROA of SCBs
ROA of SCBs over the years is shown in the following Table4.5 and Figure4.5.
Years ROA (%)
2002 0.10
2003 0.10
2004 -0.10
2005 -0.10
2006 0.00
2007 0.00
2008 0.70
2009 1.00
Table4.5 ROA of SCBs
From the previous discussion it was observed that SCBs hold the maximum assets of the
overall banking industry, but the above Table4.5 and Figure4.5 say that the profitability is
very low for SCBs. In the year of 2002 and 2003 the net profit was only 10 taka out of 10,000
16
taka of their total assets, and in 2004 and 2005 it was 10 taka loss for the same amount for the
same amount of total assets. In the year of 2006 and 2007 the net profit was nil. In the last two
years that is in 2008 and 2009, ROA was quite significant.
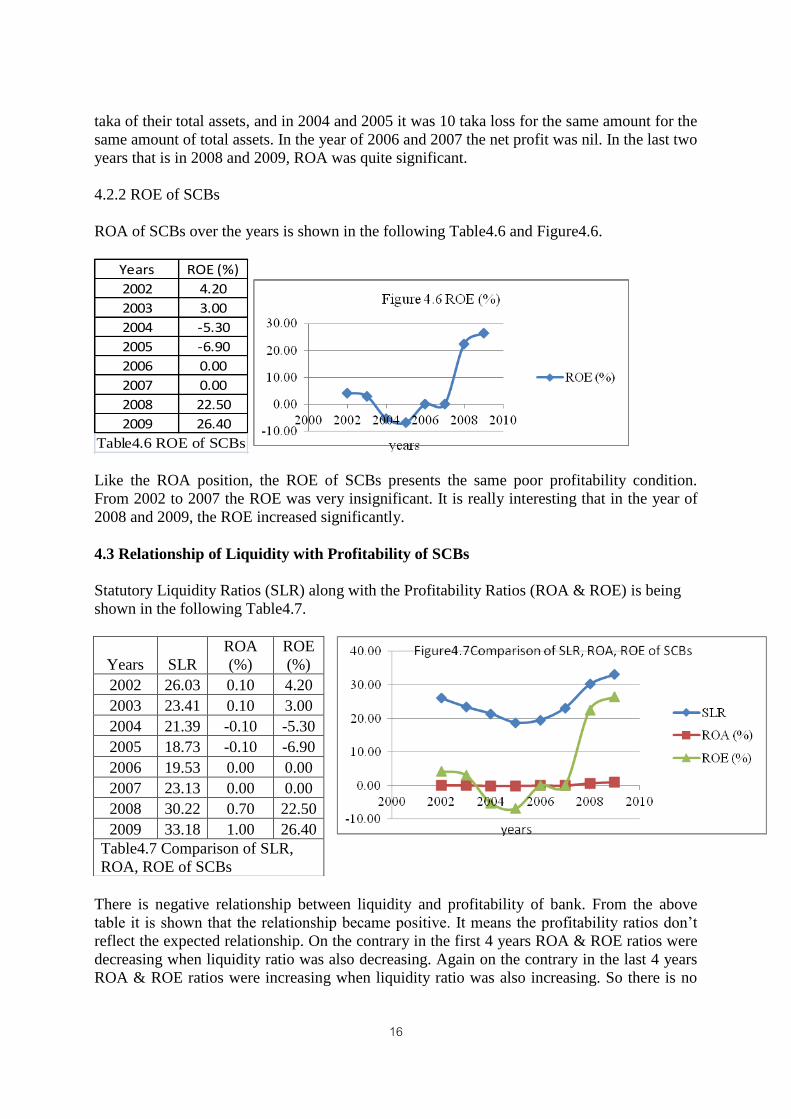
4.2.2 ROE of SCBs
ROA of SCBs over the years is shown in the following Table4.6 and Figure4.6.
Years ROE (%)
2002 4.20
2003 3.00
2004 -5.30
2005 -6.90
2006 0.00
2007 0.00
2008 22.50
2009 26.40
Table4.6 ROE of SCBs
Like the ROA position, the ROE of SCBs presents the same poor profitability condition.
From 2002 to 2007 the ROE was very insignificant. It is really interesting that in the year of
2008 and 2009, the ROE increased significantly.
4.3 Relationship of Liquidity with Profitability of SCBs
Statutory Liquidity Ratios (SLR) along with the Profitability Ratios (ROA & ROE) is being
shown in the following Table4.7.
There is negative relationship between liquidity and profitability of bank. From the above
table it is shown that the relationship became positive. It means the profitability ratios don’t
reflect the expected relationship. On the contrary in the first 4 years ROA & ROE ratios were
decreasing when liquidity ratio was also decreasing. Again on the contrary in the last 4 years
ROA & ROE ratios were increasing when liquidity ratio was also increasing. So there is no
Years SLR
ROA
(%)
ROE
(%)
2002 26.03 0.10 4.20
2003 23.41 0.10 3.00
2004 21.39 -0.10 -5.30
2005 18.73 -0.10 -6.90
2006 19.53 0.00 0.00
2007 23.13 0.00 0.00
2008 30.22 0.70 22.50
2009 33.18 1.00 26.40
Table4.7 Comparison of SLR,
ROA, ROE of SCBs
17
systematic relation between the liquidity positions with the profitability as the theory
suggests.
In last 8 years the SLR ratios of SCBs were more than the required rates set by the
Bangladesh Bank. Each of these years SCBs were maintaining excess liquidity. The
profitability position of SCBs was very poor in these years, but in the latest couple of years
this ratio is improving. The liquidity position and the profitability of SCBS show no
systematic relation.
4.4: Liquidity Study of PCBs
Like the SCBs Private commercial Banks have to maintain a certain percentage liquid assets
of their total deposits (Time and Demand) with Bangladesh Bank.
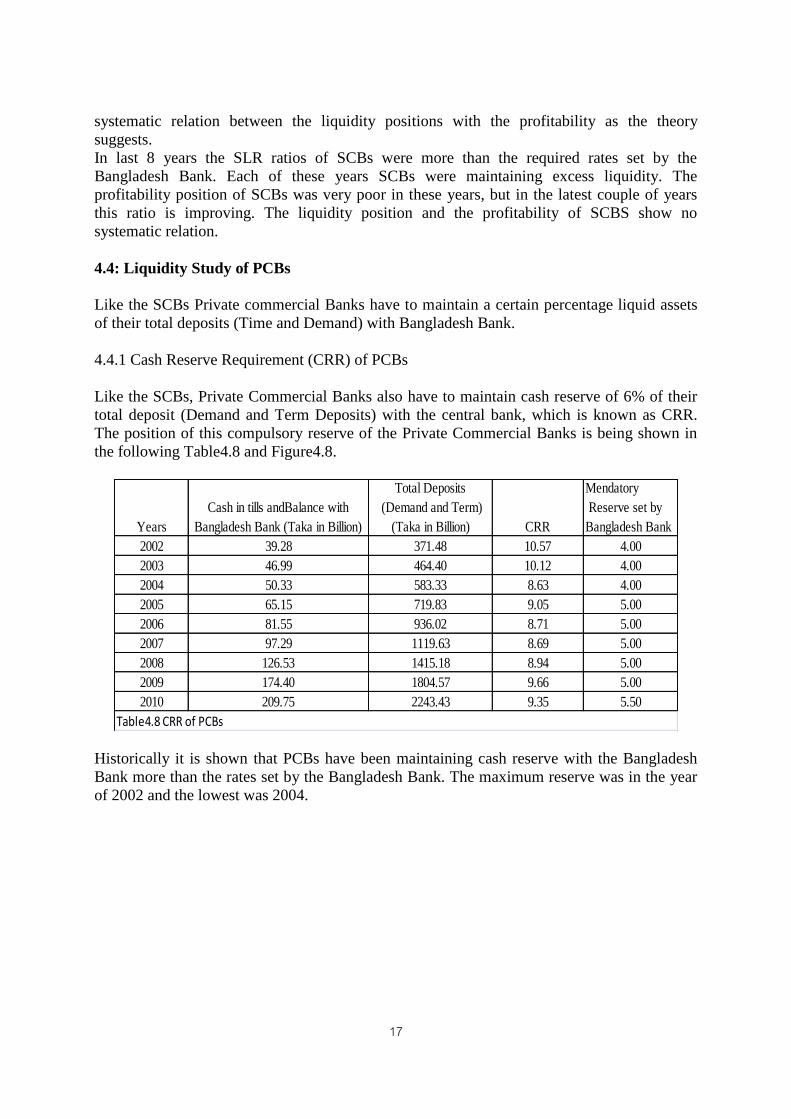
4.4.1 Cash Reserve Requirement (CRR) of PCBs
Like the SCBs, Private Commercial Banks also have to maintain cash reserve of 6% of their
total deposit (Demand and Term Deposits) with the central bank, which is known as CRR.
The position of this compulsory reserve of the Private Commercial Banks is being shown in
the following Table4.8 and Figure4.8.
Years
Cash in tills andBalance with
Bangladesh Bank (Taka in Billion)
Total Deposits
(Demand and Term)
(Taka in Billion) CRR
Mendatory
Reserve set by
Bangladesh Bank
2002 39.28 371.48 10.57 4.00
2003 46.99 464.40 10.12 4.00
2004 50.33 583.33 8.63 4.00
2005 65.15 719.83 9.05 5.00
2006 81.55 936.02 8.71 5.00
2007 97.29 1119.63 8.69 5.00
2008 126.53 1415.18 8.94 5.00
2009 174.40 1804.57 9.66 5.00
2010 209.75 2243.43 9.35 5.50
Table4.8 CRR of PCBs
Historically it is shown that PCBs have been maintaining cash reserve with the Bangladesh
Bank more than the rates set by the Bangladesh Bank. The maximum reserve was in the year
of 2002 and the lowest was 2004.
18
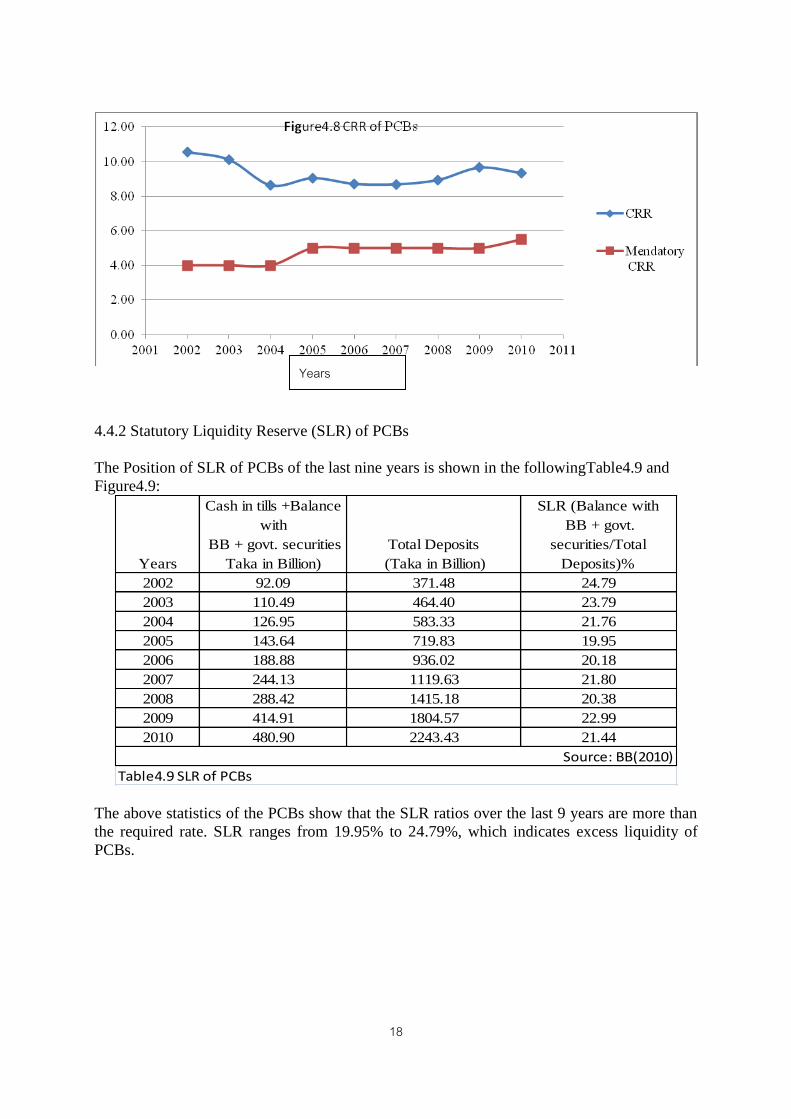
4.4.2 Statutory Liquidity Reserve (SLR) of PCBs
The Position of SLR of PCBs of the last nine years is shown in the followingTable4.9 and
Figure4.9:
Years
Cash in tills +Balance
with
BB + govt. securities
Taka in Billion)
Total Deposits
(Taka in Billion)
SLR (Balance with
BB + govt.
securities/Total
Deposits)%
2002 92.09 371.48 24.79
2003 110.49 464.40 23.79
2004 126.95 583.33 21.76
2005 143.64 719.83 19.95
2006 188.88 936.02 20.18
2007 244.13 1119.63 21.80
2008 288.42 1415.18 20.38
2009 414.91 1804.57 22.99
2010 480.90 2243.43 21.44
Source: BB(2010)
Table4.9 SLR of PCBs
The above statistics of the PCBs show that the SLR ratios over the last 9 years are more than
the required rate. SLR ranges from 19.95% to 24.79%, which indicates excess liquidity of
PCBs.
Years
19
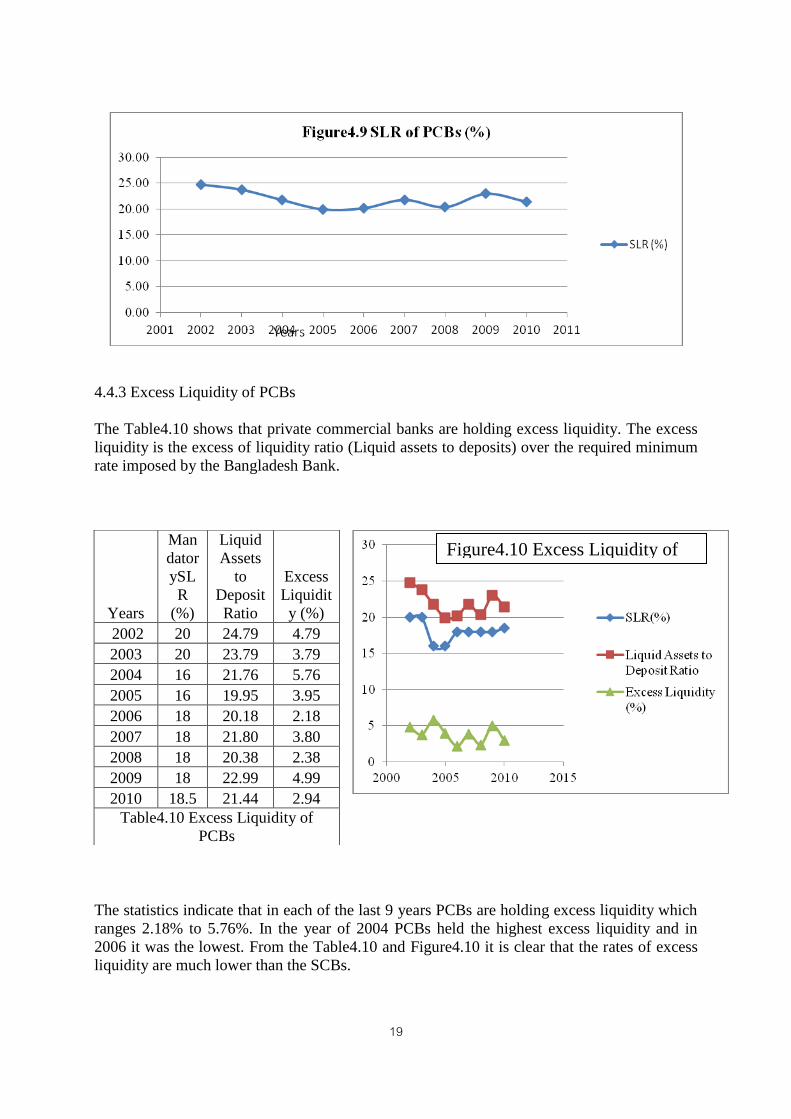
4.4.3 Excess Liquidity of PCBs
The Table4.10 shows that private commercial banks are holding excess liquidity. The excess
liquidity is the excess of liquidity ratio (Liquid assets to deposits) over the required minimum
rate imposed by the Bangladesh Bank.
The statistics indicate that in each of the last 9 years PCBs are holding excess liquidity which
ranges 2.18% to 5.76%. In the year of 2004 PCBs held the highest excess liquidity and in
2006 it was the lowest. From the Table4.10 and Figure4.10 it is clear that the rates of excess
liquidity are much lower than the SCBs.
Years
Man
dator
ySL
R
(%)
Liquid
Assets
to
Deposit
Ratio
Excess
Liquidit
y (%)
2002 20 24.79 4.79
2003 20 23.79 3.79
2004 16 21.76 5.76
2005 16 19.95 3.95
2006 18 20.18 2.18
2007 18 21.80 3.80
2008 18 20.38 2.38
2009 18 22.99 4.99
2010 18.5 21.44 2.94
Table4.10 Excess Liquidity of
PCBs
Figure4.10 Excess Liquidity of
PCBs
20
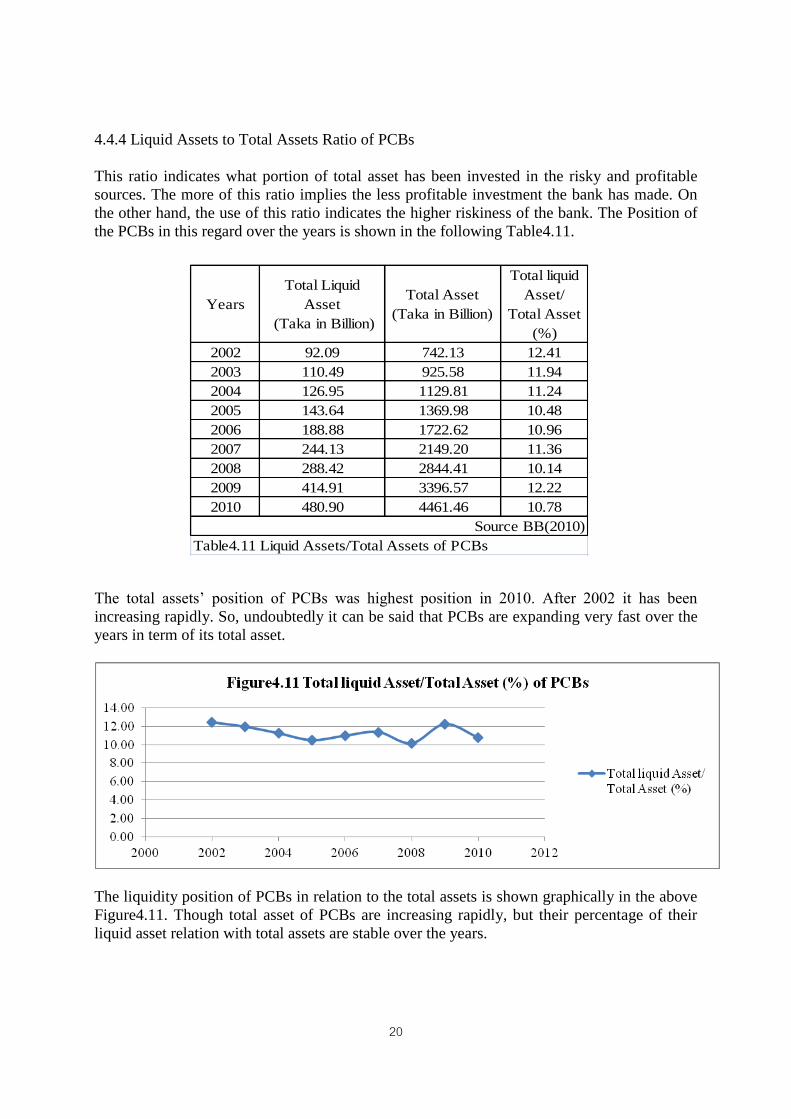
4.4.4 Liquid Assets to Total Assets Ratio of PCBs
This ratio indicates what portion of total asset has been invested in the risky and profitable
sources. The more of this ratio implies the less profitable investment the bank has made. On
the other hand, the use of this ratio indicates the higher riskiness of the bank. The Position of
the PCBs in this regard over the years is shown in the following Table4.11.
The total assets’ position of PCBs was highest position in 2010. After 2002 it has been
increasing rapidly. So, undoubtedly it can be said that PCBs are expanding very fast over the
years in term of its total asset.
The liquidity position of PCBs in relation to the total assets is shown graphically in the above
Figure4.11. Though total asset of PCBs are increasing rapidly, but their percentage of their
liquid asset relation with total assets are stable over the years.
Years
Total Liquid
Asset
(Taka in Billion)
Total Asset
(Taka in Billion)
Total liquid
Asset/
Total Asset
(%)
2002 92.09 742.13 12.41
2003 110.49 925.58 11.94
2004 126.95 1129.81 11.24
2005 143.64 1369.98 10.48
2006 188.88 1722.62 10.96
2007 244.13 2149.20 11.36
2008 288.42 2844.41 10.14
2009 414.91 3396.57 12.22
2010 480.90 4461.46 10.78
Source BB(2010)
Table4.11 Liquid Assets/Total Assets of PCBs
21
4.5 Profitability of PCBs
Like SCBs, Return on Assets (ROA) and Return on Equity (ROE) have been used as
profitability indicators for PCBs.
4.5.1 ROA of PCBs
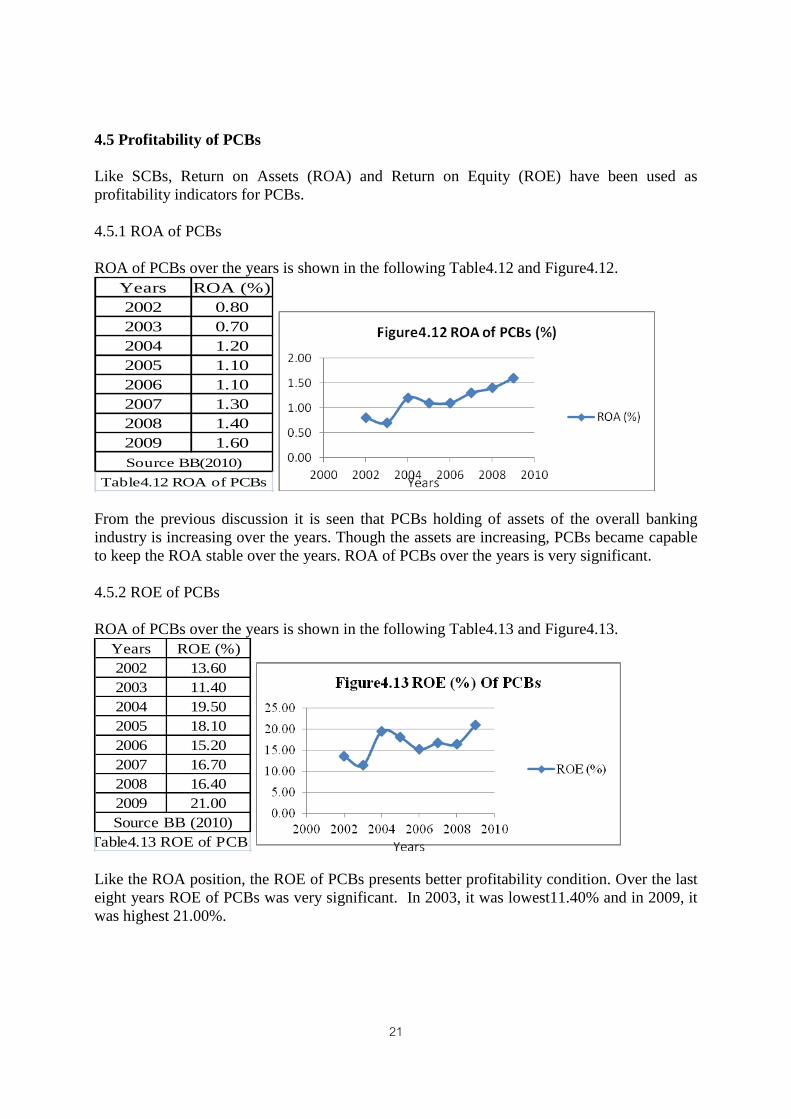
ROA of PCBs over the years is shown in the following Table4.12 and Figure4.12.
Years ROA (%)
2002 0.80
2003 0.70
2004 1.20
2005 1.10
2006 1.10
2007 1.30
2008 1.40
2009 1.60
Source BB(2010)
Table4.12 ROA of PCBs
From the previous discussion it is seen that PCBs holding of assets of the overall banking
industry is increasing over the years. Though the assets are increasing, PCBs became capable
to keep the ROA stable over the years. ROA of PCBs over the years is very significant.
4.5.2 ROE of PCBs
ROA of PCBs over the years is shown in the following Table4.13 and Figure4.13.
Years ROE (%)
2002 13.60
2003 11.40
2004 19.50
2005 18.10
2006 15.20
2007 16.70
2008 16.40
2009 21.00
Source BB (2010)
Table4.13 ROE of PCBs
Like the ROA position, the ROE of PCBs presents better profitability condition. Over the last
eight years ROE of PCBs was very significant. In 2003, it was lowest11.40% and in 2009, it
was highest 21.00%.
22
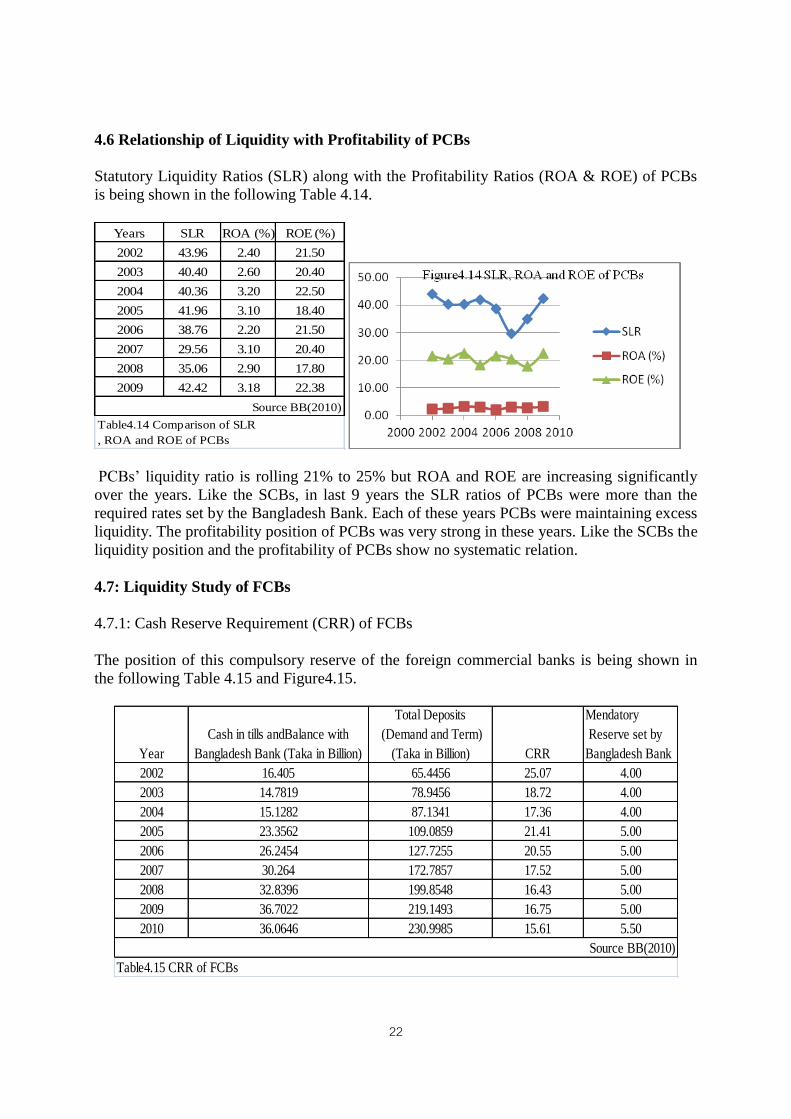
4.6 Relationship of Liquidity with Profitability of PCBs
Statutory Liquidity Ratios (SLR) along with the Profitability Ratios (ROA & ROE) of PCBs
is being shown in the following Table 4.14.
Years SLR ROA (%) ROE (%)
2002 43.96 2.40 21.50
2003 40.40 2.60 20.40
2004 40.36 3.20 22.50
2005 41.96 3.10 18.40
2006 38.76 2.20 21.50
2007 29.56 3.10 20.40
2008 35.06 2.90 17.80
2009 42.42 3.18 22.38
Source BB(2010)
Table4.14 Comparison of SLR
, ROA and ROE of PCBs
PCBs’ liquidity ratio is rolling 21% to 25% but ROA and ROE are increasing significantly
over the years. Like the SCBs, in last 9 years the SLR ratios of PCBs were more than the
required rates set by the Bangladesh Bank. Each of these years PCBs were maintaining excess
liquidity. The profitability position of PCBs was very strong in these years. Like the SCBs the
liquidity position and the profitability of PCBs show no systematic relation.
4.7: Liquidity Study of FCBs
4.7.1: Cash Reserve Requirement (CRR) of FCBs
The position of this compulsory reserve of the foreign commercial banks is being shown in
the following Table 4.15 and Figure4.15.
Year
Cash in tills andBalance with
Bangladesh Bank (Taka in Billion)
Total Deposits
(Demand and Term)
(Taka in Billion) CRR
Mendatory
Reserve set by
Bangladesh Bank
2002 16.405 65.4456 25.07 4.00
2003 14.7819 78.9456 18.72 4.00
2004 15.1282 87.1341 17.36 4.00
2005 23.3562 109.0859 21.41 5.00
2006 26.2454 127.7255 20.55 5.00
2007 30.264 172.7857 17.52 5.00
2008 32.8396 199.8548 16.43 5.00
2009 36.7022 219.1493 16.75 5.00
2010 36.0646 230.9985 15.61 5.50
Source BB(2010)
Table4.15 CRR of FCBs
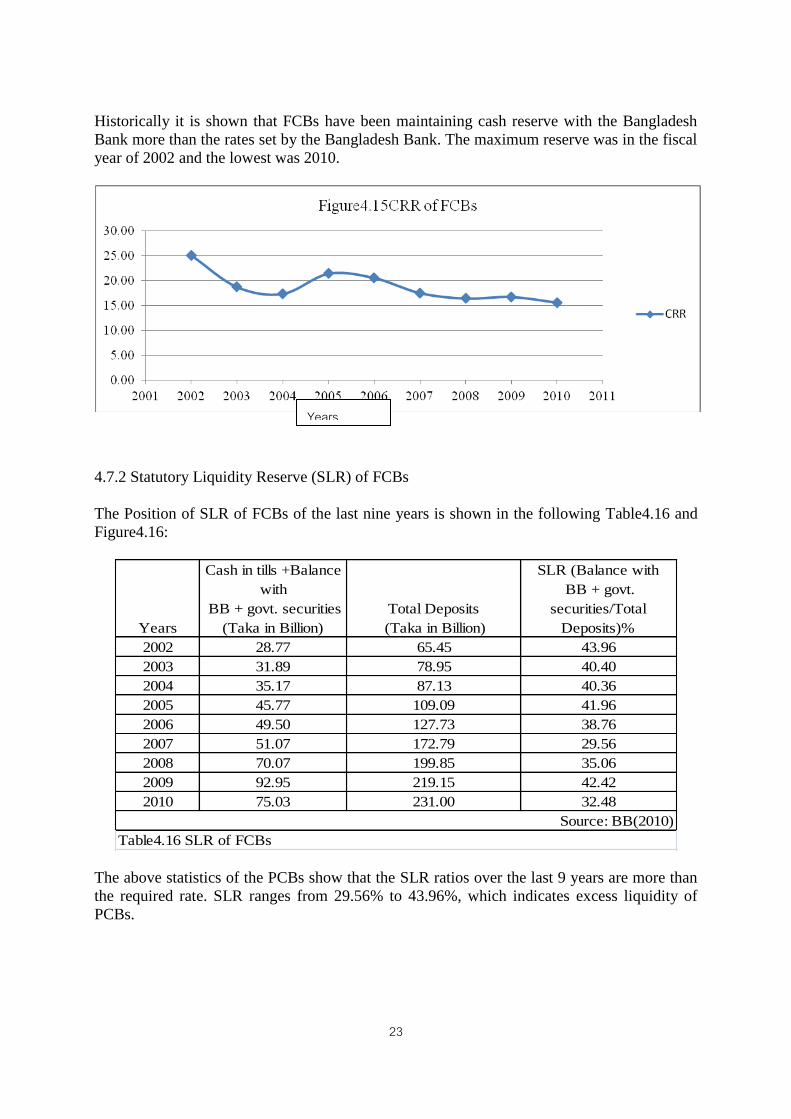
23
Historically it is shown that FCBs have been maintaining cash reserve with the Bangladesh
Bank more than the rates set by the Bangladesh Bank. The maximum reserve was in the fiscal
year of 2002 and the lowest was 2010.
4.7.2 Statutory Liquidity Reserve (SLR) of FCBs
The Position of SLR of FCBs of the last nine years is shown in the following Table4.16 and
Figure4.16:
Years
Cash in tills +Balance
with
BB + govt. securities
(Taka in Billion)
Total Deposits
(Taka in Billion)
SLR (Balance with
BB + govt.
securities/Total
Deposits)%
2002 28.77 65.45 43.96
2003 31.89 78.95 40.40
2004 35.17 87.13 40.36
2005 45.77 109.09 41.96
2006 49.50 127.73 38.76
2007 51.07 172.79 29.56
2008 70.07 199.85 35.06
2009 92.95 219.15 42.42
2010 75.03 231.00 32.48
Source: BB(2010)
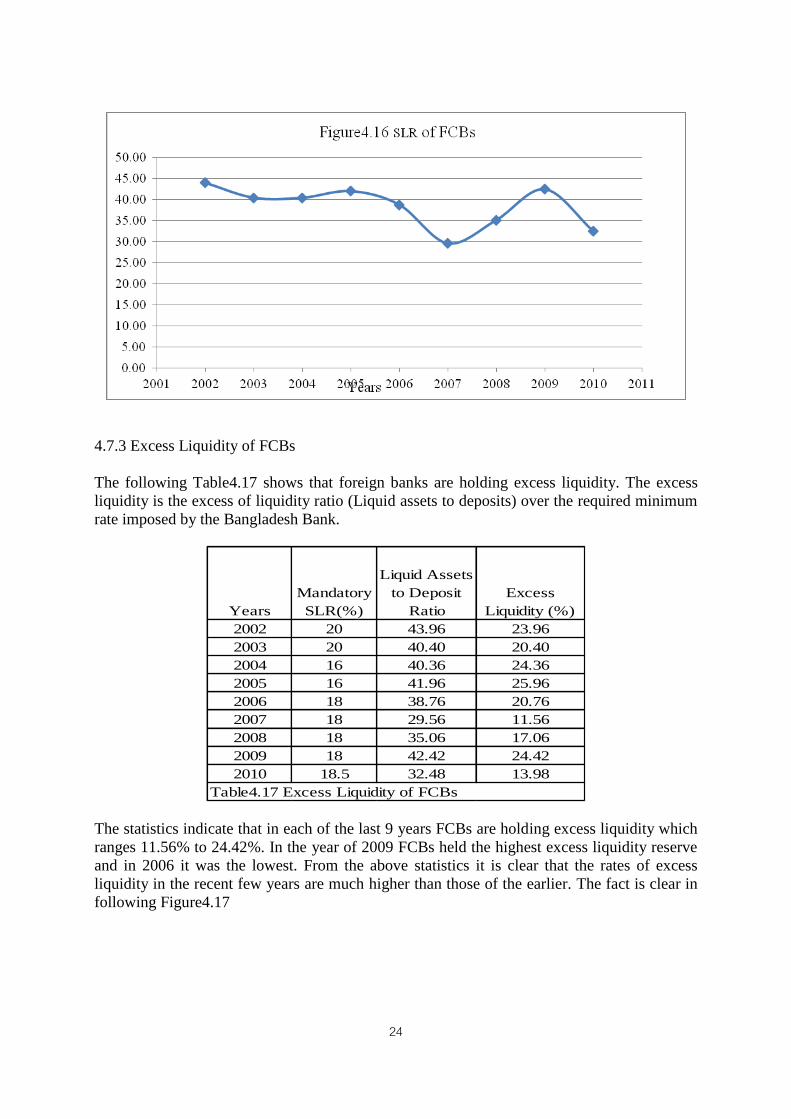
Table4.16 SLR of FCBs
The above statistics of the PCBs show that the SLR ratios over the last 9 years are more than
the required rate. SLR ranges from 29.56% to 43.96%, which indicates excess liquidity of
PCBs.
Years
24
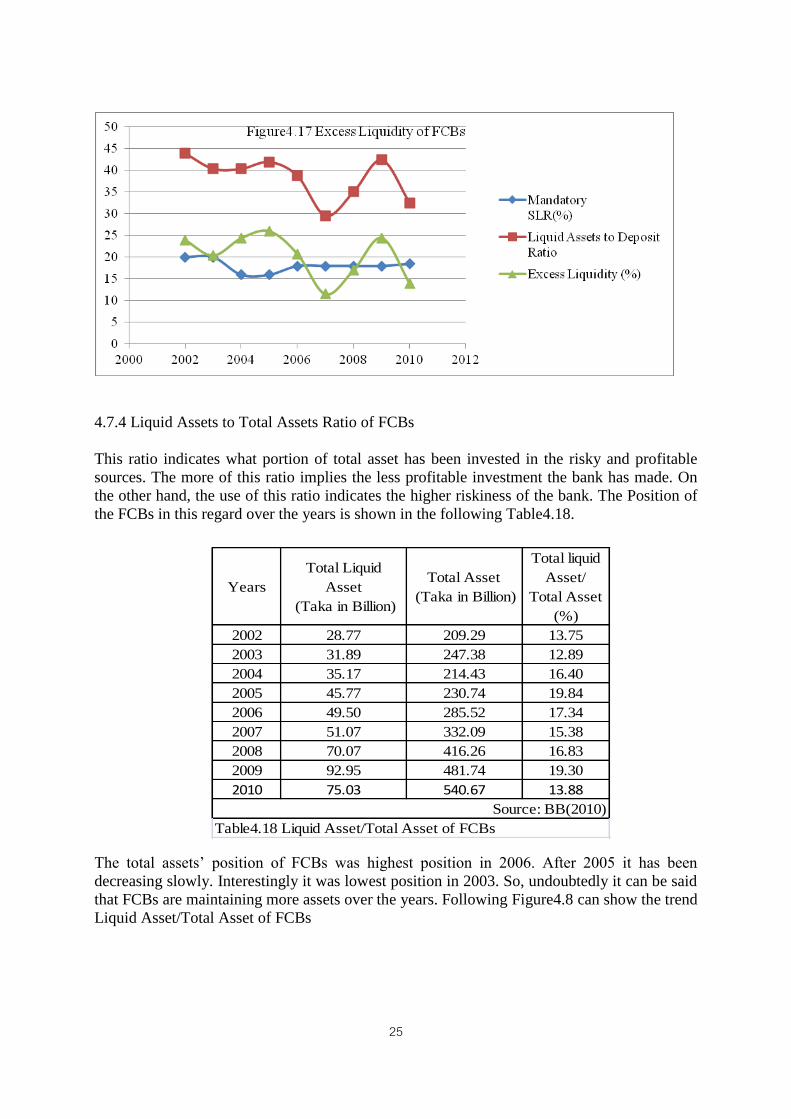
4.7.3 Excess Liquidity of FCBs
The following Table4.17 shows that foreign banks are holding excess liquidity. The excess
liquidity is the excess of liquidity ratio (Liquid assets to deposits) over the required minimum
rate imposed by the Bangladesh Bank.
Years
Mandatory
SLR(%)
Liquid Assets
to Deposit
Ratio
Excess
Liquidity (%)
2002 20 43.96 23.96
2003 20 40.40 20.40
2004 16 40.36 24.36
2005 16 41.96 25.96
2006 18 38.76 20.76
2007 18 29.56 11.56
2008 18 35.06 17.06
2009 18 42.42 24.42
2010 18.5 32.48 13.98
Table4.17 Excess Liquidity of FCBs
The statistics indicate that in each of the last 9 years FCBs are holding excess liquidity which
ranges 11.56% to 24.42%. In the year of 2009 FCBs held the highest excess liquidity reserve
and in 2006 it was the lowest. From the above statistics it is clear that the rates of excess
liquidity in the recent few years are much higher than those of the earlier. The fact is clear in
following Figure4.17
25
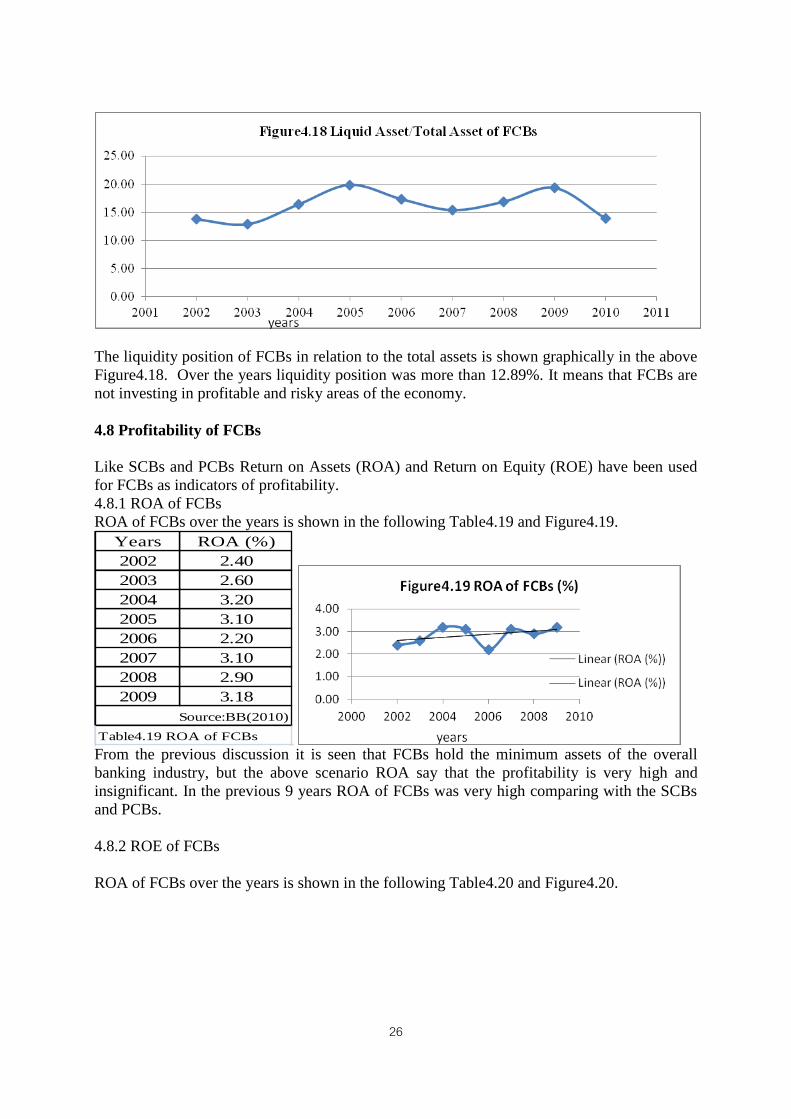
4.7.4 Liquid Assets to Total Assets Ratio of FCBs
This ratio indicates what portion of total asset has been invested in the risky and profitable
sources. The more of this ratio implies the less profitable investment the bank has made. On
the other hand, the use of this ratio indicates the higher riskiness of the bank. The Position of
the FCBs in this regard over the years is shown in the following Table4.18.
The total assets’ position of FCBs was highest position in 2006. After 2005 it has been
decreasing slowly. Interestingly it was lowest position in 2003. So, undoubtedly it can be said
that FCBs are maintaining more assets over the years. Following Figure4.8 can show the trend
Liquid Asset/Total Asset of FCBs
Years
Total Liquid
Asset
(Taka in Billion)
Total Asset
(Taka in Billion)
Total liquid
Asset/
Total Asset
(%)
2002 28.77 209.29 13.75
2003 31.89 247.38 12.89
2004 35.17 214.43 16.40
2005 45.77 230.74 19.84
2006 49.50 285.52 17.34
2007 51.07 332.09 15.38
2008 70.07 416.26 16.83
2009 92.95 481.74 19.30
2010 75.03 540.67 13.88
Source: BB(2010)
Table4.18 Liquid Asset/Total Asset of FCBs
26
The liquidity position of FCBs in relation to the total assets is shown graphically in the above
Figure4.18. Over the years liquidity position was more than 12.89%. It means that FCBs are
not investing in profitable and risky areas of the economy.
4.8 Profitability of FCBs
Like SCBs and PCBs Return on Assets (ROA) and Return on Equity (ROE) have been used
for FCBs as indicators of profitability.
4.8.1 ROA of FCBs
ROA of FCBs over the years is shown in the following Table4.19 and Figure4.19.
Years ROA (%)
2002 2.40
2003 2.60
2004 3.20
2005 3.10
2006 2.20
2007 3.10
2008 2.90
2009 3.18
Source:BB(2010)
Table4.19 ROA of FCBs From the previous discussion it is seen that FCBs hold the minimum assets of the overall
banking industry, but the above scenario ROA say that the profitability is very high and
insignificant. In the previous 9 years ROA of FCBs was very high comparing with the SCBs
and PCBs.
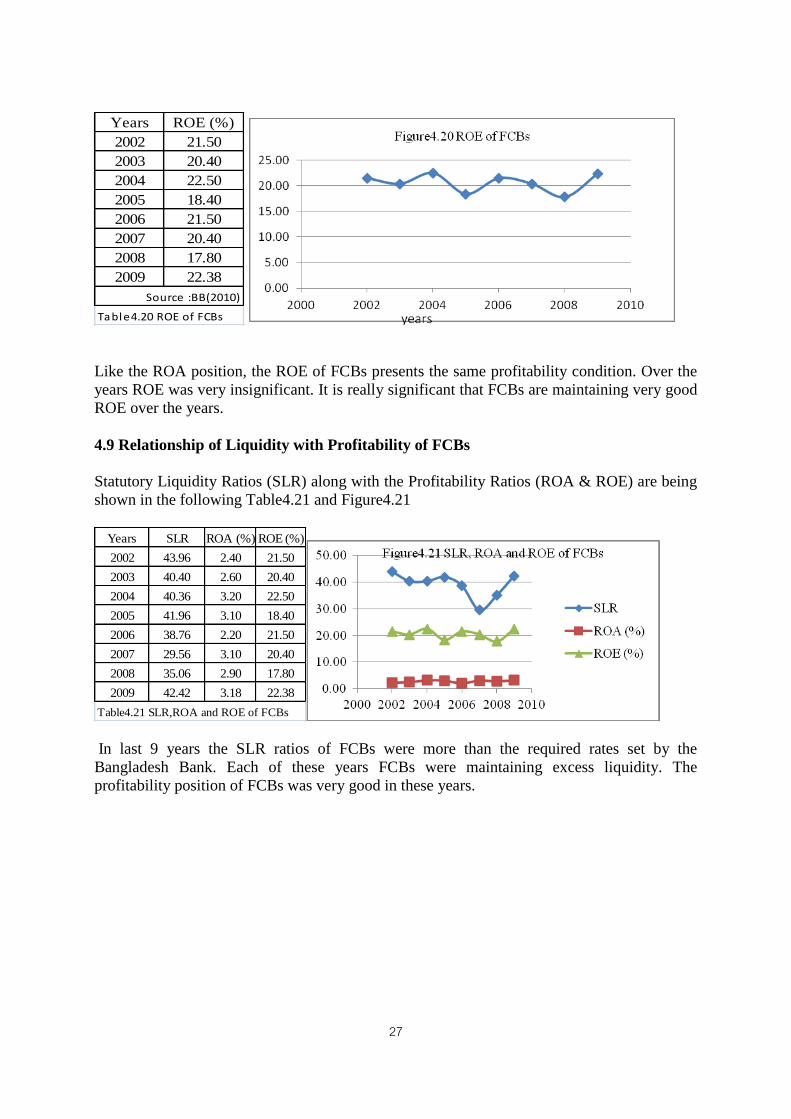
4.8.2 ROE of FCBs
ROA of FCBs over the years is shown in the following Table4.20 and Figure4.20.
27
Years ROE (%)
2002 21.50
2003 20.40
2004 22.50
2005 18.40
2006 21.50
2007 20.40
2008 17.80
2009 22.38
Source :BB(2010)
Table4.20 ROE of FCBs
Like the ROA position, the ROE of FCBs presents the same profitability condition. Over the
years ROE was very insignificant. It is really significant that FCBs are maintaining very good
ROE over the years.
4.9 Relationship of Liquidity with Profitability of FCBs
Statutory Liquidity Ratios (SLR) along with the Profitability Ratios (ROA & ROE) are being
shown in the following Table4.21 and Figure4.21
Years SLR ROA (%) ROE (%)
2002 43.96 2.40 21.50
2003 40.40 2.60 20.40
2004 40.36 3.20 22.50
2005 41.96 3.10 18.40
2006 38.76 2.20 21.50
2007 29.56 3.10 20.40
2008 35.06 2.90 17.80
2009 42.42 3.18 22.38
Table4.21 SLR,ROA and ROE of FCBs
In last 9 years the SLR ratios of FCBs were more than the required rates set by the
Bangladesh Bank. Each of these years FCBs were maintaining excess liquidity. The
profitability position of FCBs was very good in these years.
28
CHAPTER 5
COMPARATIVE STUDY OF LIQUIDITY AND PROFITABILITY
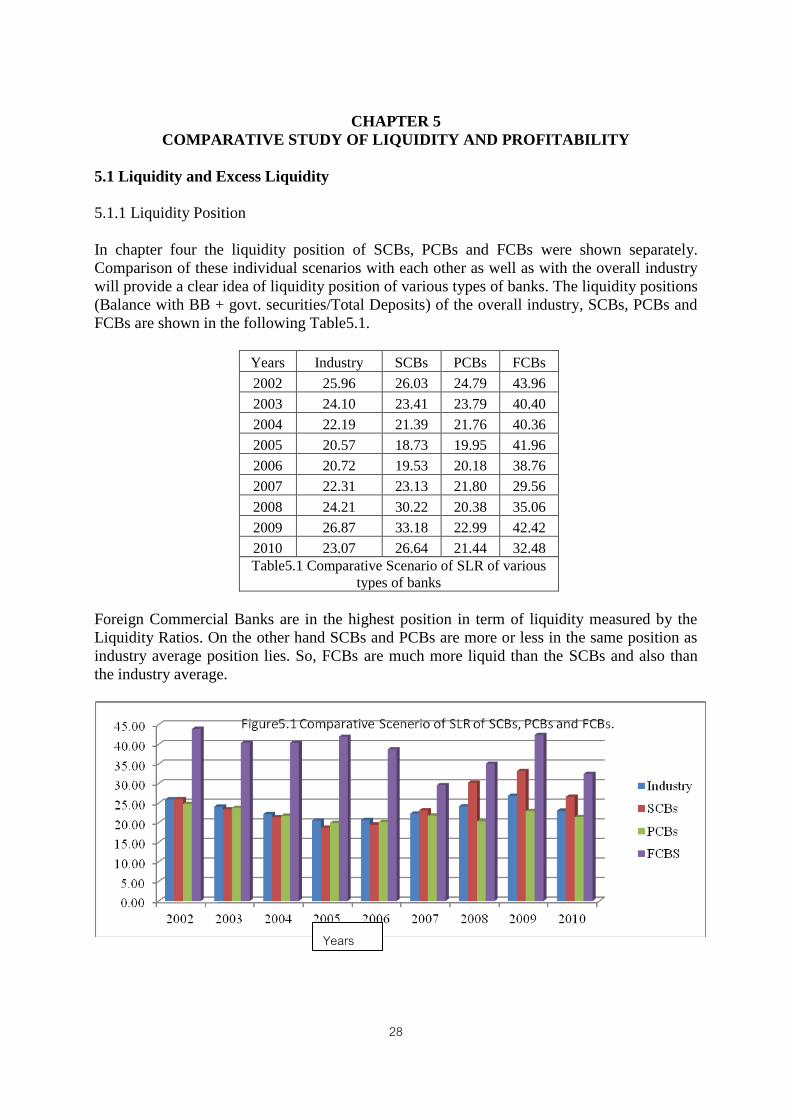
5.1 Liquidity and Excess Liquidity
5.1.1 Liquidity Position
In chapter four the liquidity position of SCBs, PCBs and FCBs were shown separately.
Comparison of these individual scenarios with each other as well as with the overall industry
will provide a clear idea of liquidity position of various types of banks. The liquidity positions
(Balance with BB + govt. securities/Total Deposits) of the overall industry, SCBs, PCBs and
FCBs are shown in the following Table5.1.
Years Industry SCBs PCBs FCBs
2002 25.96 26.03 24.79 43.96
2003 24.10 23.41 23.79 40.40
2004 22.19 21.39 21.76 40.36
2005 20.57 18.73 19.95 41.96
2006 20.72 19.53 20.18 38.76
2007 22.31 23.13 21.80 29.56
2008 24.21 30.22 20.38 35.06
2009 26.87 33.18 22.99 42.42
2010 23.07 26.64 21.44 32.48
Table5.1 Comparative Scenario of SLR of various
types of banks
Foreign Commercial Banks are in the highest position in term of liquidity measured by the
Liquidity Ratios. On the other hand SCBs and PCBs are more or less in the same position as
industry average position lies. So, FCBs are much more liquid than the SCBs and also than
the industry average.
Years
29
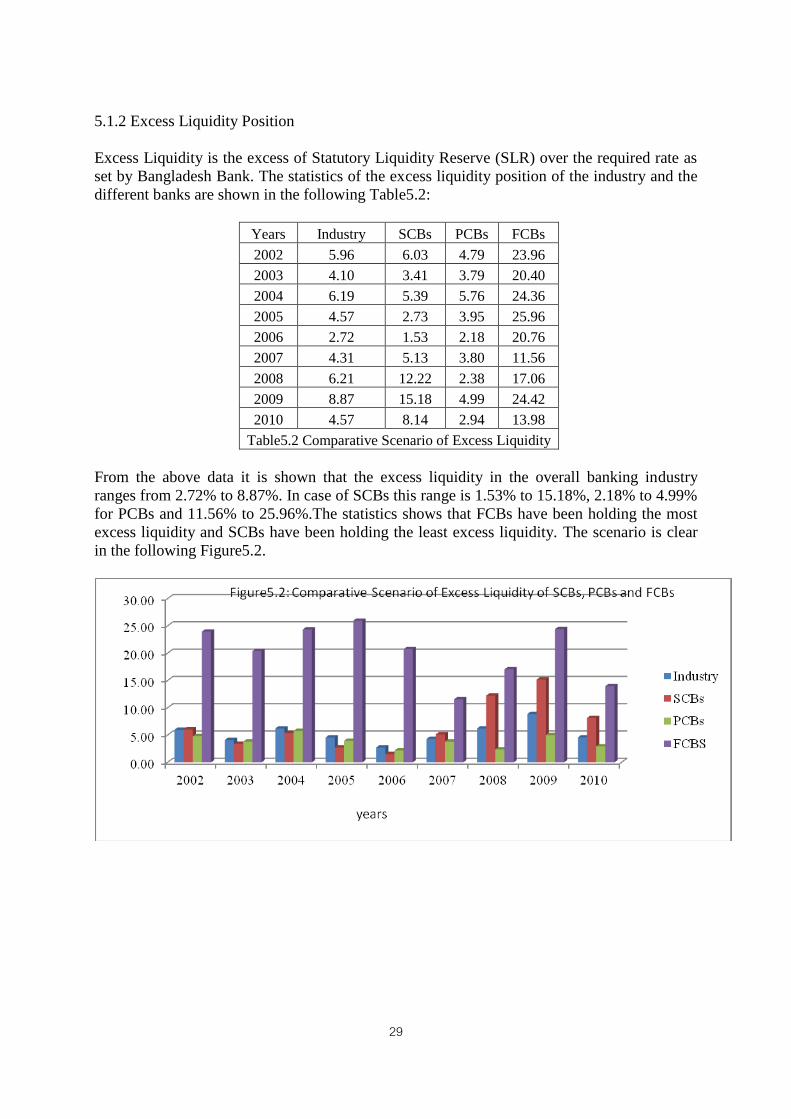
5.1.2 Excess Liquidity Position
Excess Liquidity is the excess of Statutory Liquidity Reserve (SLR) over the required rate as
set by Bangladesh Bank. The statistics of the excess liquidity position of the industry and the
different banks are shown in the following Table5.2:
Years Industry SCBs PCBs FCBs
2002 5.96 6.03 4.79 23.96
2003 4.10 3.41 3.79 20.40
2004 6.19 5.39 5.76 24.36
2005 4.57 2.73 3.95 25.96
2006 2.72 1.53 2.18 20.76
2007 4.31 5.13 3.80 11.56
2008 6.21 12.22 2.38 17.06
2009 8.87 15.18 4.99 24.42
2010 4.57 8.14 2.94 13.98
Table5.2 Comparative Scenario of Excess Liquidity
From the above data it is shown that the excess liquidity in the overall banking industry
ranges from 2.72% to 8.87%. In case of SCBs this range is 1.53% to 15.18%, 2.18% to 4.99%
for PCBs and 11.56% to 25.96%.The statistics shows that FCBs have been holding the most
excess liquidity and SCBs have been holding the least excess liquidity. The scenario is clear
in the following Figure5.2.

30
5.1.3 Liquid Assets/Total Assets position
Position of Liquid Assets/Total Assets position of the SCBs, PCBs and FCBs comparing with
the banking industry is shown in the following Table5.3.
Years Industry SCBs PCBs FCBS
2002 6.32 4.60 12.41 13.75
2003 5.89 3.93 11.94 12.89
2004 5.69 3.54 11.24 16.40
2005 5.47 3.07 10.48 19.84
2006 5.73 3.10 10.96 17.34
2007 7.96 5.34 11.36 15.38
2008 10.18 9.87 10.14 16.83
2009 11.61 10.49 12.22 19.30
Table5.3 Comparative Scenario of Liquid
Assets/Total Assets
Here it is observed that a liquid asset has become very significant in the year of 2008 and
2009. PCBs and FCBs kept more liquid assets than SCBs. The scenario is clear in the
following Figure5.3.
years
31
5.2 Profitability
Like the previous chapters the ROA and ROE ratios have been used as the indicators of
profitability for determining the comparative scenario of different types of banks comparing
with the industry.
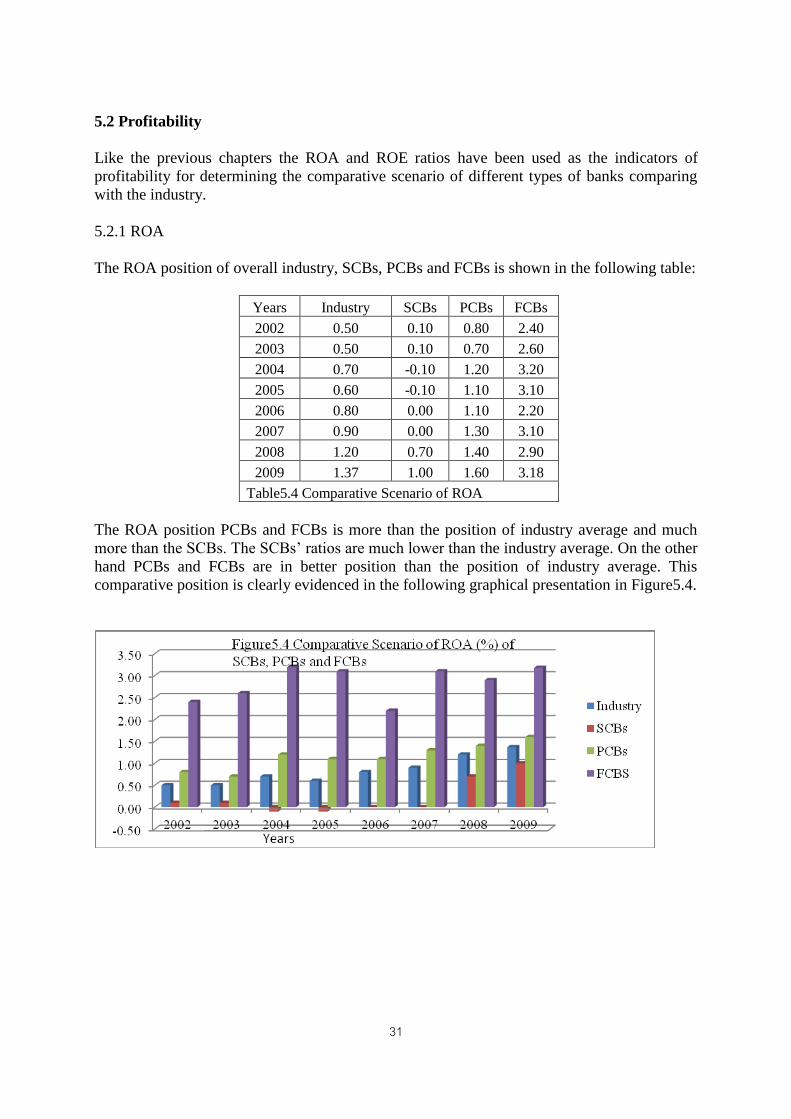
5.2.1 ROA
The ROA position of overall industry, SCBs, PCBs and FCBs is shown in the following table:
Years Industry SCBs PCBs FCBs
2002 0.50 0.10 0.80 2.40
2003 0.50 0.10 0.70 2.60
2004 0.70 -0.10 1.20 3.20
2005 0.60 -0.10 1.10 3.10
2006 0.80 0.00 1.10 2.20
2007 0.90 0.00 1.30 3.10
2008 1.20 0.70 1.40 2.90
2009 1.37 1.00 1.60 3.18
Table5.4 Comparative Scenario of ROA
The ROA position PCBs and FCBs is more than the position of industry average and much
more than the SCBs. The SCBs’ ratios are much lower than the industry average. On the other
hand PCBs and FCBs are in better position than the position of industry average. This
comparative position is clearly evidenced in the following graphical presentation in Figure5.4.
32
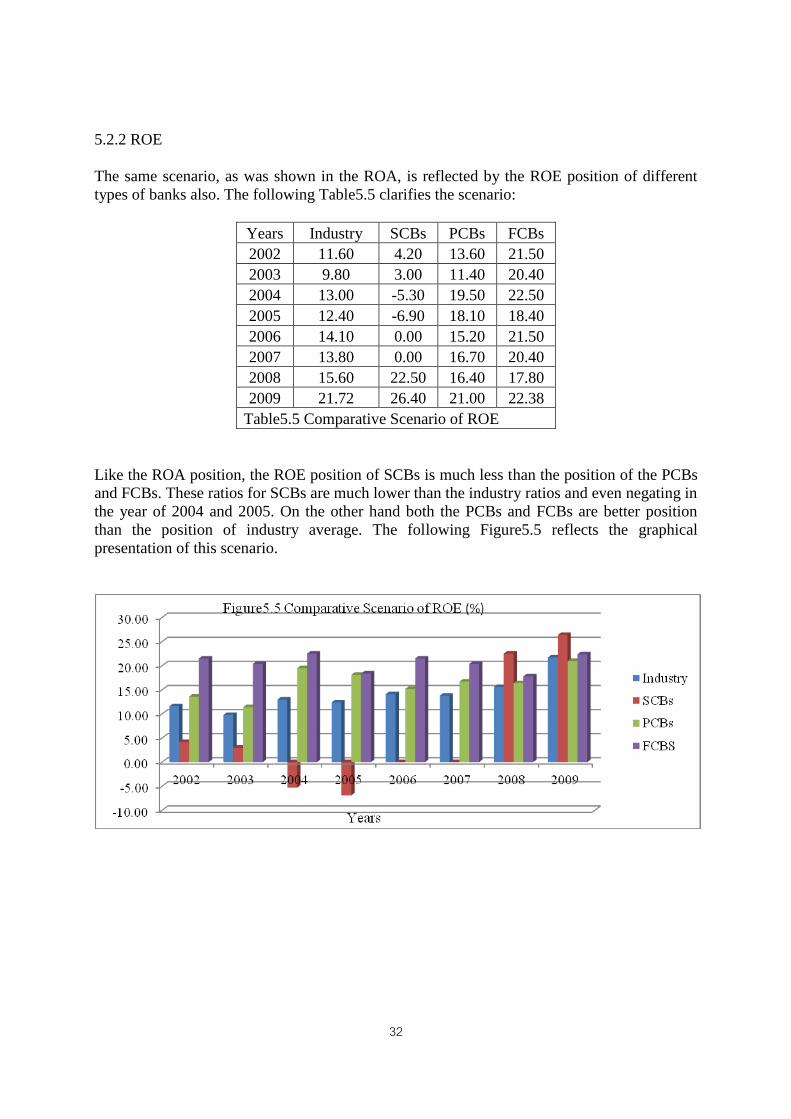
5.2.2 ROE
The same scenario, as was shown in the ROA, is reflected by the ROE position of different
types of banks also. The following Table5.5 clarifies the scenario:
Years Industry SCBs PCBs FCBs
2002 11.60 4.20 13.60 21.50
2003 9.80 3.00 11.40 20.40
2004 13.00 -5.30 19.50 22.50
2005 12.40 -6.90 18.10 18.40
2006 14.10 0.00 15.20 21.50
2007 13.80 0.00 16.70 20.40
2008 15.60 22.50 16.40 17.80
2009 21.72 26.40 21.00 22.38
Table5.5 Comparative Scenario of ROE
Like the ROA position, the ROE position of SCBs is much less than the position of the PCBs
and FCBs. These ratios for SCBs are much lower than the industry ratios and even negating in
the year of 2004 and 2005. On the other hand both the PCBs and FCBs are better position
than the position of industry average. The following Figure5.5 reflects the graphical
presentation of this scenario.
33
5.3 Reasons for the Higher Liquidity in Banking Industry
In the analysis section it has been observed that banking industry of Bangladesh has enjoyed
higher liquidity in the years of 2002-2010. The main reasons for this higher liquidity are as
follows.
5.3.1 More investment in government securities
Bangladesh Bank changed the SLR time to time which made banks bound to increase the
holding of government securities. On the other hand devolvement on Primary Dealers (Banks
and non bank financial institution that are authorized to underwrite the government securities)
has increased a lot. That is why investment in government securities by the banks has
increased over the years compare to their deposits. Table5.6 clarifies the fact.
Years 2004 2005 2006 2007 2008 2009 2010
Govt. Securities/
Total Deposits (%) 13.57 13.14 9.99 11.32 16.37 17.46 17.26
Source BB(2010)
Table5.6 Investment in government securities by banks
5.3.2 Lower scope of secondary trading of government securities
Though PDs (Primary Dealers) are holding more government securities than their mandatory
requirement, they cannot sell them in the secondary market. As a result in spite of having
government securities PDs maintain more liquid assets as cash for meeting up the depositors
demand.
5.3.3 Non-competitive nature of the banking system
The banking sector of Bangladesh is not so competitive and the structure permits the banks to
have power to set mark-up lending rates. Always the bank set their lending and deposit rate by
themselves. As a result banks especially the PCBs and FCBs are earning better and they do
not like to face liquidity crisis and maintaining more liquidity.
5.4 Reasons for the difference in profitability of different types of banks.
In theoretical discussion it was discussed that more liquidity shows less profitability. But
interestingly it is seen that though PCBs and FCBs maintaining the more liquidity, they are
more profitable. Reasons behind this reverse relationship are:
5.4.1 Interest rate-wise differences of deposits and loans and advances of different types of
banks.
In absolute figure SCBs are playing the most vital role in deposit collection, loan
disbursement or the total assets in the overall banking industry. So, their percentage position
of the total deposit and loans and advances collection is significant. But in interest margin
SCBs are far behind from the PCBs and FCBs.
34
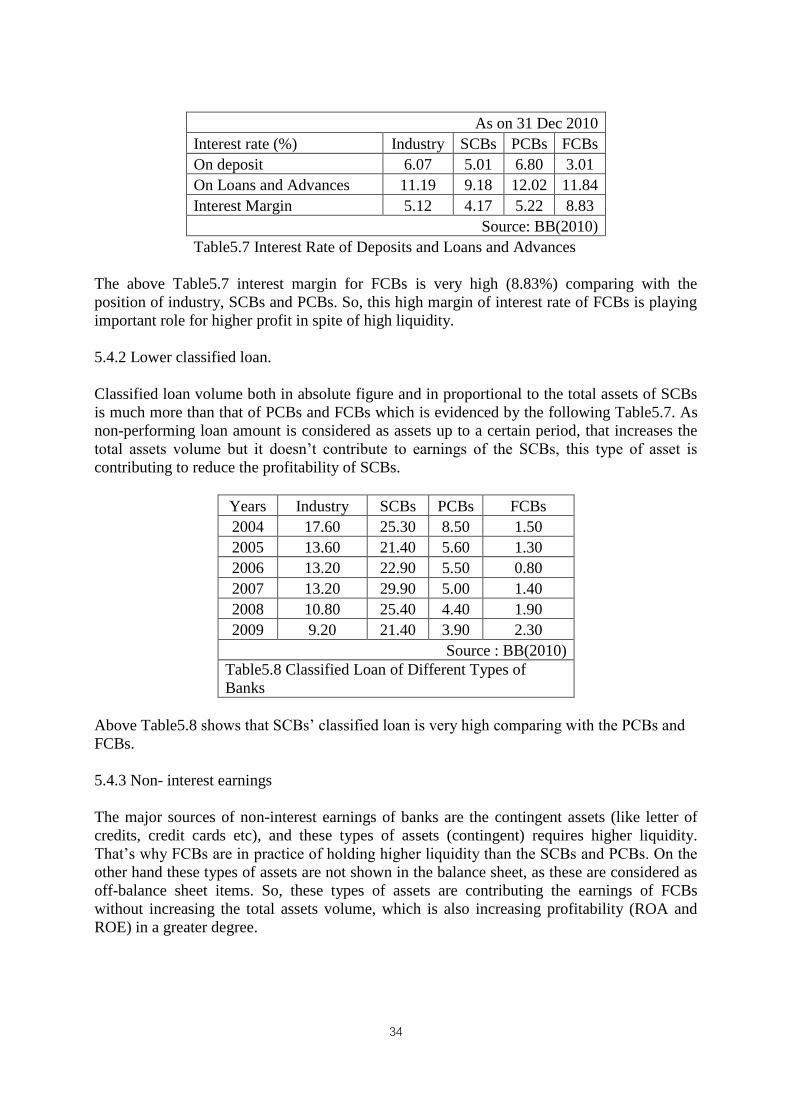
As on 31 Dec 2010
Interest rate (%) Industry SCBs PCBs FCBs
On deposit 6.07 5.01 6.80 3.01
On Loans and Advances 11.19 9.18 12.02 11.84
Interest Margin 5.12 4.17 5.22 8.83
Source: BB(2010)
Table5.7 Interest Rate of Deposits and Loans and Advances
The above Table5.7 interest margin for FCBs is very high (8.83%) comparing with the
position of industry, SCBs and PCBs. So, this high margin of interest rate of FCBs is playing
important role for higher profit in spite of high liquidity.
5.4.2 Lower classified loan.
Classified loan volume both in absolute figure and in proportional to the total assets of SCBs
is much more than that of PCBs and FCBs which is evidenced by the following Table5.7. As
non-performing loan amount is considered as assets up to a certain period, that increases the
total assets volume but it doesn’t contribute to earnings of the SCBs, this type of asset is
contributing to reduce the profitability of SCBs.
Years Industry SCBs PCBs FCBs
2004 17.60 25.30 8.50 1.50
2005 13.60 21.40 5.60 1.30
2006 13.20 22.90 5.50 0.80
2007 13.20 29.90 5.00 1.40
2008 10.80 25.40 4.40 1.90
2009 9.20 21.40 3.90 2.30
Source : BB(2010)
Table5.8 Classified Loan of Different Types of
Banks
Above Table5.8 shows that SCBs’ classified loan is very high comparing with the PCBs and
FCBs.
5.4.3 Non- interest earnings
The major sources of non-interest earnings of banks are the contingent assets (like letter of
credits, credit cards etc), and these types of assets (contingent) requires higher liquidity.
That’s why FCBs are in practice of holding higher liquidity than the SCBs and PCBs. On the
other hand these types of assets are not shown in the balance sheet, as these are considered as
off-balance sheet items. So, these types of assets are contributing the earnings of FCBs
without increasing the total assets volume, which is also increasing profitability (ROA and
ROE) in a greater degree.
35
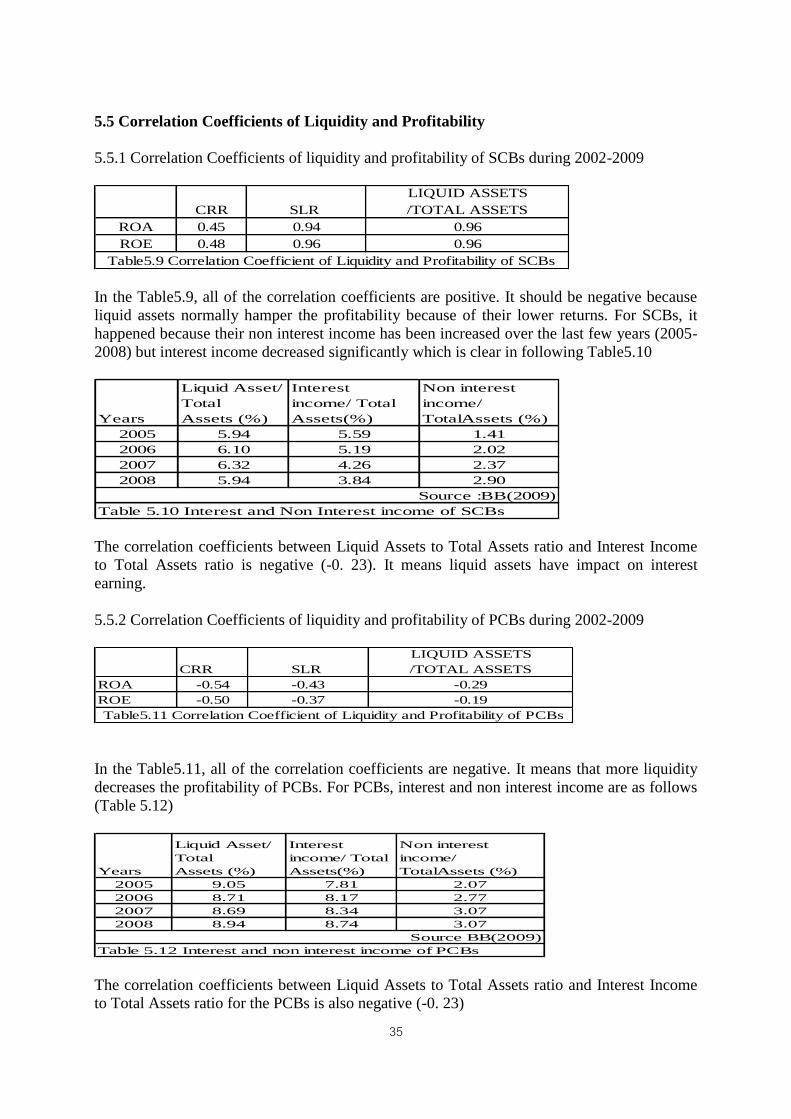
5.5 Correlation Coefficients of Liquidity and Profitability
5.5.1 Correlation Coefficients of liquidity and profitability of SCBs during 2002-2009
CRR SLR
LIQUID ASSETS
/TOTAL ASSETS
ROA 0.45 0.94 0.96
ROE 0.48 0.96 0.96
Table5.9 Correlation Coefficient of Liquidity and Profitability of SCBs
In the Table5.9, all of the correlation coefficients are positive. It should be negative because
liquid assets normally hamper the profitability because of their lower returns. For SCBs, it
happened because their non interest income has been increased over the last few years (2005-
2008) but interest income decreased significantly which is clear in following Table5.10
Years
Liquid Asset/
Total
Assets (%)
Interest
income/ Total
Assets(%)
Non interest
income/
TotalAssets (%)
2005 5.94 5.59 1.41
2006 6.10 5.19 2.02
2007 6.32 4.26 2.37
2008 5.94 3.84 2.90
Source :BB(2009)
Table 5.10 Interest and Non Interest income of SCBs
The correlation coefficients between Liquid Assets to Total Assets ratio and Interest Income
to Total Assets ratio is negative (-0. 23). It means liquid assets have impact on interest
earning.
5.5.2 Correlation Coefficients of liquidity and profitability of PCBs during 2002-2009
CRR SLR
LIQUID ASSETS
/TOTAL ASSETS
ROA -0.54 -0.43 -0.29
ROE -0.50 -0.37 -0.19
Table5.11 Correlation Coefficient of Liquidity and Profitability of PCBs
In the Table5.11, all of the correlation coefficients are negative. It means that more liquidity
decreases the profitability of PCBs. For PCBs, interest and non interest income are as follows
(Table 5.12)
Years
Liquid Asset/
Total
Assets (%)
Interest
income/ Total
Assets(%)
Non interest
income/
TotalAssets (%)
2005 9.05 7.81 2.07
2006 8.71 8.17 2.77
2007 8.69 8.34 3.07
2008 8.94 8.74 3.07
Source BB(2009)
Table 5.12 Interest and non interest income of PCBs
The correlation coefficients between Liquid Assets to Total Assets ratio and Interest Income
to Total Assets ratio for the PCBs is also negative (-0. 23)
36
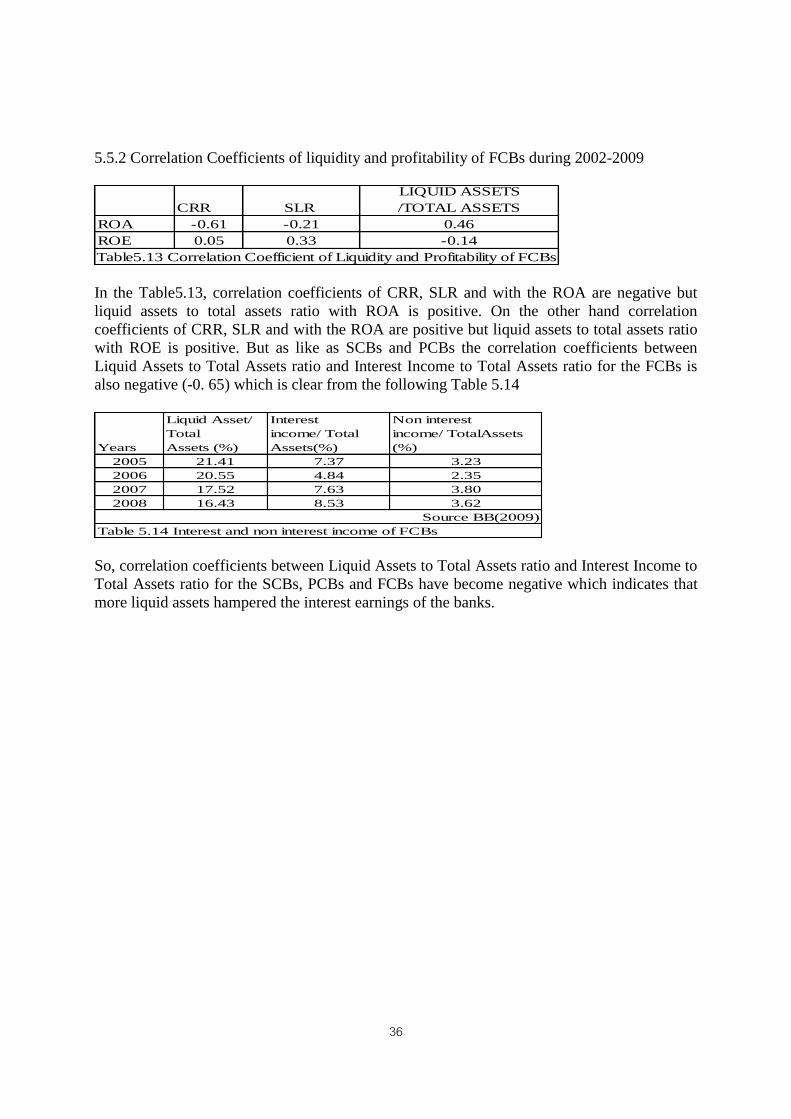
5.5.2 Correlation Coefficients of liquidity and profitability of FCBs during 2002-2009
CRR SLR
LIQUID ASSETS
/TOTAL ASSETS
ROA -0.61 -0.21 0.46
ROE 0.05 0.33 -0.14
Table5.13 Correlation Coefficient of Liquidity and Profitability of FCBs
In the Table5.13, correlation coefficients of CRR, SLR and with the ROA are negative but
liquid assets to total assets ratio with ROA is positive. On the other hand correlation
coefficients of CRR, SLR and with the ROA are positive but liquid assets to total assets ratio
with ROE is positive. But as like as SCBs and PCBs the correlation coefficients between
Liquid Assets to Total Assets ratio and Interest Income to Total Assets ratio for the FCBs is
also negative (-0. 65) which is clear from the following Table 5.14
Years
Liquid Asset/
Total
Assets (%)
Interest
income/ Total
Assets(%)
Non interest
income/ TotalAssets
(%)
2005 21.41 7.37 3.23
2006 20.55 4.84 2.35
2007 17.52 7.63 3.80
2008 16.43 8.53 3.62
Source BB(2009)
Table 5.14 Interest and non interest income of FCBs
So, correlation coefficients between Liquid Assets to Total Assets ratio and Interest Income to
Total Assets ratio for the SCBs, PCBs and FCBs have become negative which indicates that
more liquid assets hampered the interest earnings of the banks.
37
CHAPTER 6
CONCLUSION
In this work it has been focused to find out the liquidity and profitability study of different
banking sectors of Bangladesh. In observation it is seen that the overall banking industry of
Bangladesh is much liquid in the years of 2002 to 2009. On average, all the banks (SCBs,
PCBs and FCBs) are maintaining more liquidity reserve than the central bank’s requirement.
FCBs are maintaining more liquidity than SCBs and PCBs. Reasons behind this higher
liquidity by banking industry are i) More investment in government securities by banks ii)
Lower scope of secondary trading of government securities iii) Non-competitive nature of the
banking system.
In term of profitability SCBs are in the poorest condition. After maintaining the more
liquidity, the FCBs are also more profitable than the SCBs. PCBs’ position is moderate in
liquidity and profitability. FCBs are profitable than PCBs and SCBs due to the facts that i)
their weighted average net interest spread is more than that of other types of banks ii) their
non-performing assets are much less than others iii) their non interest income is higher than
SCBs and PCBs.
The correlation between Liquid Asset to Total Assets ratio and ROA for the various types of
banks did not show the same relationship. It is positive for SCBs and FCBs, negative for
PCBs. These differences occurred due to non interest income. Non-interest income over the
last few years (2005 to 2008) increased a lot and this helped to boost up the profitability for
SCBs. When correlation coefficients between Liquid Assets to Total Assets ratio and Interest
Income to Total Assets ratio have been calculated, the result showed negative relationship for
all types of banks.
The scope of the study was confined to only a limited area. Further study should be conducted
on the sensitivity of banks’ liquidity on profitability. Considering all factors that influence
liquidity, an effort should be made to construct a model that will enable to determine or give
an indication of the optimal liquidity position for the banking system.
38
REFERENCES
1. Bangladesh Bank. (various years).: Annual Report. Bangladesh Bank.
_____. (various years). Economic Trends. Bangladesh Bank.
_____. (various years). Scheduled Bank Statistics. Bangladesh Bank.
2. Bordeleau, E. and Graham, C. (2010):” The Impact of Liquidity on Bank Profitability”
Bank of Canada Working Paper 2010‐11.
3. BCBS (2010): “Basel III: International framework for liquidity risk measurement,
standards and monitoring”, Bank for International Settlements. December 2010.
4. Foley, F., Hartzell, J., Titman, S., and Twite, G. (2007): “Why do firms hold so much
cash? A tax based explanation” Journal of Financial Economics 86
5. Jensen, M., (1986): “Agency costs of free cash flow, corporate finance and takeovers”
American Economic Review 76
6. Miller, M., and Orr, D. (1966): “A model of the demand for money by firms”,
Quarterly Journal of Economics 80
7. Molyneux, P., and Thornton, J. (1992): “Determinants of European bank profitability:
A note” Journal of Banking and Finance, 16.
8. Morris, S., and Shin, H. Song. (2010): “Illiquidity Component of Credit Risk”,
Working Paper,Princeton University.
9. Mujere and Younus : An analysis of interest rate spread in banking sector (2009)
10. Opler, T., Pinkowitz, L., Stulz R., and Williamson, R. (1999): “The determinants and
implications of corporate cash holdings” Journal of Financial Economics 52, 3‐46
11. Statistics Department, Bangladesh Bank
12. Research Department, Bangladesh Bank
39
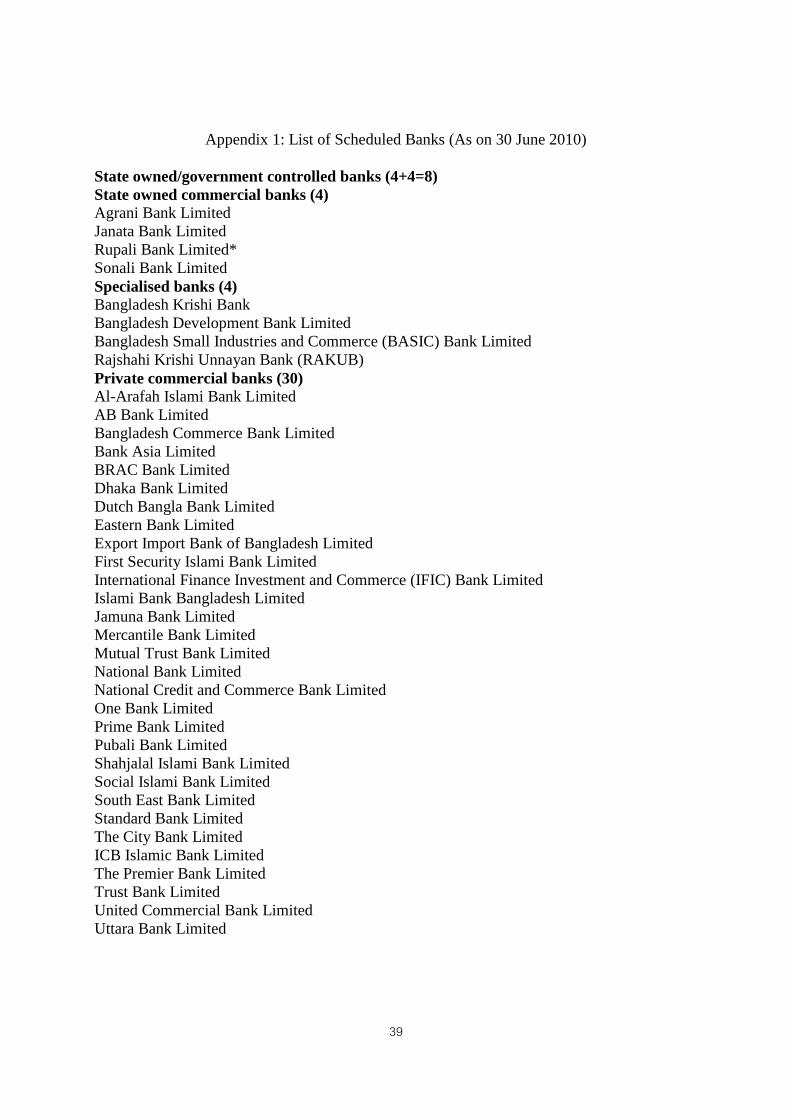
Appendix 1: List of Scheduled Banks (As on 30 June 2010)
State owned/government controlled banks (4+4=8)
State owned commercial banks (4)
Agrani Bank Limited
Janata Bank Limited
Rupali Bank Limited*
Sonali Bank Limited
Specialised banks (4)
Bangladesh Krishi Bank
Bangladesh Development Bank Limited
Bangladesh Small Industries and Commerce (BASIC) Bank Limited
Rajshahi Krishi Unnayan Bank (RAKUB)
Private commercial banks (30)
Al-Arafah Islami Bank Limited
AB Bank Limited
Bangladesh Commerce Bank Limited
Bank Asia Limited
BRAC Bank Limited
Dhaka Bank Limited
Dutch Bangla Bank Limited
Eastern Bank Limited
Export Import Bank of Bangladesh Limited
First Security Islami Bank Limited
International Finance Investment and Commerce (IFIC) Bank Limited
Islami Bank Bangladesh Limited
Jamuna Bank Limited
Mercantile Bank Limited
Mutual Trust Bank Limited
National Bank Limited
National Credit and Commerce Bank Limited
One Bank Limited
Prime Bank Limited
Pubali Bank Limited
Shahjalal Islami Bank Limited
Social Islami Bank Limited
South East Bank Limited
Standard Bank Limited
The City Bank Limited
ICB Islamic Bank Limited
The Premier Bank Limited
Trust Bank Limited
United Commercial Bank Limited
Uttara Bank Limited

40
Foreign commercial banks (9)
Bank Alfalah Limited
Citibank N.A
Commercial Bank of Ceylon
Habib Bank Limited
National Bank of Pakistan
Standard Chartered Bank
State Bank of India
The Hongkong and Shanghai Banking Corporation Limited
Woori Bank