Embed Size (px)
Citation preview
THE JOURNAL OF FINANCE • VOL. LXIX, NO. 4 • AUGUST 2014
Liquidity Measurement Problems in Fast,Competitive Markets: Expensive and Cheap
Solutions
CRAIG W. HOLDEN and STACEY JACOBSEN∗
ABSTRACT
Do fast, competitive markets yield liquidity measurement problems when using thepopular Monthly Trade and Quote (MTAQ) database? Yes. MTAQ yields distortedmeasures of spreads, trade location, and price impact compared with the expensiveDaily Trade and Quote (DTAQ) database. These problems are driven by (1) withdrawnquotes, (2) second (versus millisecond) time stamps, and (3) other causes, includingcanceled quotes. The expensive solution, using DTAQ, is first-best. For financiallyconstrained researchers, the cheap solution—using MTAQ with our new InterpolatedTime technique, adjusting for withdrawn quotes, and deleting economically nonsen-sical states—is second-best. These solutions change research inferences.
TWENTY-FIRST CENTURY EQUITY markets have become much faster (Jain (2005),Hendershott and Moulton (2011), Angel, Harris, and Spatt (2011, AHS)) andmore competitive (AHS). On the speed dimension, AHS document a radicalincrease in the frequency of bid-ask quote updates. They report a nearly 20-foldincrease in the frequency of quote updates for stocks in the S&P 500 from 0.17per second in May 2003 to 3.3 per second in October 2009. Similarly, Chordia,Roll, and Subrahmanyam (2012) report a 33-fold increase in the value-weightedfrequency of trades in New York Stock Exchange (NYSE) stocks from 0.13 persecond in January 2003 to 4.3 per second in June 2008. On the competitiondimension, AHS document that the NYSE’s market share in NYSE-listed stockshas dropped from 80% in February 2005 to 25% in February 2009 and thatNASDAQ’s market share in NASDAQ-listed stocks has dropped from 53% inApril 2005 to 30% in April 2009. Correspondingly, Wolfe (2010) documentsthat the NYSE’s information share (i.e., its percentage contribution to pricediscovery) in Dow Jones Industrial Average stocks has dropped from a range of91% to 95% in 2004 to a range of 8% to 53% in 2008. This shift from dominantplayers to many relatively coequal players means that, while it was once fine
∗Craig W. Holden is at the Kelley School of Business, Indiana University. Stacey Jacobsen isat the Cox School of Business, Southern Methodist University. We thank Jim Upson for helpfulinstitutional and DTAQ comments. We thank Campbell Harvey (the Editor), an anonymous As-sociate Editor, an anonymous referee, Ekkehart Boehmer, Charles Collver, Terrence Hendershott,Bob Jennings, Hung-Neng Lai, Qin Lei, Bill Maxwell, Darius Miller, Pamela Moulton, MaureenO’Hara, Kumar Venkataraman, and seminar participants at Indiana University and SouthernMethodist University. We are solely responsible for any errors.
DOI: 10.1111/jofi.12127
1747
1748 The Journal of Finance R©
for researchers analyzing NYSE trading to rely on NYSE quotes only (e.g.,Chordia, Roll, and Subrahmanyam (2000, 2001, 2002)), doing so is no longersufficient. Researchers examining recent years (2009 and thereafter) must useNational Best Bid and Offer (NBBO) quotes, where the national best bid (offer)is the highest bid (lowest offer) across all U.S. exchanges and market makers.
In this paper, we ask whether the liquidity of today’s fast, competitive U.S.equity markets can be accurately measured using NYSE’s Monthly Trade andQuote (MTAQ) database. MTAQ is the most popular intraday database for aca-demic research in U.S. equities. It provides intraday trade and quote data time-stamped to the second. For a three to four times larger price,1 the NYSE alsosells a second database: the Daily Trade And Quote (DTAQ) database. DTAQand MTAQ are identical, except for two critical differences.2 First, DTAQ addsa “NBBO” file containing most3 of the official NBBO quotes from the SecuritiesIndustries Processors (SIPs).4 Second, all trades, quotes, and NBBO quotesin DTAQ are time-stamped to the millisecond (i.e., 1/1,000th of a second). Infast markets, the millisecond time stamp might well be important in matchingtrades and quotes and the official NBBO quotes may contain fewer errors thanthe raw quotes.
Our sample is 100 randomly selected firms from April 1, 2008 to June 30,2008. This period is prior to the severe phase of the financial crisis that startedin mid-September 2008.5 We obtain data on 34 million trades and 351 millionquotes.
We find large differences between liquidity measures computed from MTAQand DTAQ. For MTAQ, when compared to DTAQ, we find that: (1) the percenteffective spread is 54% larger, (2) the percent quoted spread goes negative37 times more often, (3) the percent quoted spread is 47% smaller, (4) theeffective spread is greater than the quoted spread 15% more often, (5) tradesoutside the NBBO happen eight times more often, (6) the percent realizedspread is 12% larger, and (7) the percent price impact is 109% larger.
To determine why we observe these liquidity measurement problems, weconduct a three-way decomposition that examines three possible factors: (1)withdrawn quotes, where an exchange or market maker momentarily quotesnothing, (2) millisecond versus second time stamps of trades and quotes, and
1 For pricing details, see www.nyxdata.com/Data-Products/Daily-TAQ or the Wharton ResearchData Services (WRDS) website.
2 There are two additional differences that are not critical for our purposes. First, DTAQ addssome extra quote condition fields. Second, DTAQ data can be downloaded the next day as opposedto on a monthly cycle for MTAQ.
3 The NBBO file is incomplete by itself. Construction of the Complete Official NBBO requirescombining the NBBO file and the Quote file. See footnote 24 for details.
4 There are two SIPs. The Consolidated Tape Association (CTA) covers all NYSE-listed (“Tape A”)and American Stock Exchange- and regional-listed (“Tape B”) securities and the Unlisted TradingPrivileges (UTP) Committee covers all NASDAQ (“Tape C”) securities.
5 During our sample period, the Volatility Index (VIX) ranged from 19 to 25, which is the samerange that it had been in for the prior 12 months. During the severe phase of the financial crisisfrom mid-September 2008 to December 2008, the VIX ranged from 55 to 80.
Liquidity Measurement Problems in Fast, Competitive Markets 1749
(3) other causes. The last category includes canceled quotes where a limit sell(buy) setting the current ask (bid) is canceled and the exchange or marketmaker’s quote is updated in the DTAQ NBBO file, but not in MTAQ. We findthat each of these three factors is a statistically and economically significantsource of liquidity measurement problems.
All three factors imply that MTAQ contains errors relative to DTAQ, whichwe attempt to capture with a simple errors-in-variables model. We model theMTAQ NBBO as being the DTAQ NBBO plus errors. Simulated trades aregenerated relative to the DTAQ NBBO with no errors. We compute the liquiditymeasures using the same trade prices but different NBBOs. We find that oursimple errors-in-variables model can generate in a simulation nearly all of theliquidity measure differences between DTAQ and MTAQ with the same signas the actual liquidity measure differences and with most of the magnitudesbeing roughly similar. This is strong evidence that the actual liquidity measuredifferences are driven by errors in the MTAQ NBBO that are not present inthe DTAQ NBBO.
Next, we examine possible solutions. One possible solution is to purchase theexpensive DTAQ database. With this database, one can construct the CompleteOfficial NBBO, which we use as our benchmark.6 Our empirical results showthat this benchmark is credible as it yields a much lower frequency of negativequoted spreads and trades outside the NBBO than any MTAQ alternative thatwe consider. It is our first-best solution.
What if a researcher is financially constrained to using the relatively cheapMTAQ database? We consider several possible solutions. One possibility is toadjust for withdrawn quotes. When an exchange or market maker temporar-ily withdraws their bid and/or ask quote, MTAQ records the bid and/or theask price as either zero or missing.7 In this case, the researcher’s correct ad-justment is to set the bid and/or the ask quote for that exchange or marketmaker to missing, rather than throwing the current bid and/or ask quote awayand using the prior bid and/or ask quote for that exchange or market maker.Correct adjustment avoids using stale quotes, which the three-way decomposi-tion shows is a major source of liquidity measure differences. Since withdrawnquotes are directly observable and adjusting for withdrawn quotes eliminatesa major problem, researchers using MTAQ should always adjust for withdrawnquotes.8
6 In certain instances, when a single exchange has both the best bid and the best offer, theofficial SIP NBBO quote is recorded in the DTAQ Quotes file and not in the DTAQ NBBO file.We construct the Complete Official NBBO data set of official SIP NBBO quotes by adding thesesingle-exchange NBBO quotes from the DTAQ Quotes file to the DTAQ NBBO file. See footnote 24for a description of the construction of the Complete Official NBBO.
7 The DTAQ Quote file does not make any adjustment (same as the MTAQ Quote file), but theDTAQ NBBO file does adjust appropriately. So, using the DTAQ Complete Official NBBO correctlydeals with withdrawn quotes.
8 Although withdrawn quotes are directly observable, we are the first (to our knowledge) toaddress them, to document their substantial importance, and to recommend a fix for them.
1750 The Journal of Finance R©
Taking the adjustment for withdrawn quotes as given, we consider additionalpossible MTAQ solutions. First, we consider quote timing rules. One quotetiming rule is Prior Second as recommended by Henker and Wang (2006), whichmatches a trade to the NBBO quotes that are in-force in the prior second. Asecond quote timing rule is Same Second as recommended by Bessembinder(2003) and Peterson and Sirri (2003), which matches a trade to the NBBOquotes that are in-force during the same second. We introduce a third andpotentially more accurate quote timing rule, which we call Interpolated Time.This rule uses the ordering of trades and quotes within a second to make aneducated guess about the millisecond in which the events occurred and thenmatches each trade at the inferred millisecond to the NBBO quotes inferred tohave been in-force in the prior millisecond.
Finally, we consider deleting NBBO quotes during economically nonsensicalstates and deleting any trades that occur under those states. The NBBO of amarket is defined as being “crossed” if the national best bid is greater thanthe national best offer. Similarly, the NBBO of a market is defined as being“locked” if the national best bid is equal to the national best offer. We conjecturethat many of these nonsensical states arise as a result of quotes that havebeen canceled, but no quote update has been recorded. Therefore, we deleteNBBO quotes whenever the NBBO is crossed or locked because, in marketmicrostructure theory, the offer price must always be greater than the bidprice.9 We also delete any trades that occur while the NBBO is crossed or lockedbecause, if there are no legitimate NBBO quotes to benchmark the trade, then itis impossible to compute several standard liquidity measures for those trades,to type the trade as a buy or sell, to compute the Probability of Informed trading(PIN) using those trades, etc. For example, we would delete the NBBO quotesand trades for as long as the National Best Bid quoted by the Chicago StockExchange (CHX) is greater than or equal to the National Best Offer quoted bythe National Stock Exchange. With many competitive players, it is importantto address crosses and locks between exchanges/market makers, not just withina given exchange/market maker (e.g., when NYSE bid ≥ NYSE offer).
In addition to adjusting for withdrawn quotes, we find that the best overallMTAQ solution is to use our new Interpolated Time technique and to deleteNBBO quotes and trades when the NBBO is crossed or locked. The combi-nation of all three techniques goes the furthest distance possible in reducingliquidity measurement problems. Specifically, MTAQ with all three techniques,when compared to MTAQ with no adjustments, has the following benefits: (1)the percent quoted spread difference (relative to DTAQ) is completely elimi-nated, (2) the percent effective spread difference is reduced by 91%, (3) theoutside-the-NBBO difference is reduced by 90%, (4) the crossed NBBO abso-lute difference is reduced 97%, and (5) the percent price impact difference is
9 There are three well-established reasons why the offer price must always be greater thanthe bid price: (1) adverse selection (Glosten and Milgrom (1985), Kyle (1985), Easley and O’Hara(1987)), (2) order processing costs (Roll (1984)), and (3) compensation for bearing inventory risk(Amihud and Mendelson (1980), Ho and Stoll (1981, 1983)).
Liquidity Measurement Problems in Fast, Competitive Markets 1751
reduced by 97%. Despite these important improvements, significant liquid-ity measurement problems remain. Thus, we conclude that using MTAQ withthese three techniques is second-best and not as good as the first-best solutionof using DTAQ.
A complete, commented SAS file to implement our MTAQ recommendationsis available on our individual web sites.10 The September 2013 version of thisprogram is provided in the Internet Appendix that accompanies this article.11
The SAS code does the following: downloads MTAQ data from WRDS, ap-plies these three techniques (adjusts for withdrawn quotes, uses interpolatedtime, and eliminates NBBO quotes and trades when the market is crossedor locked), and computes standard liquidity measures (time-weighted percentquoted spread, volume-weighted percent effective spread, volume-weightedpercent realized spread, and volume-weighted percent price impact).
Next, we consider whether different methods yield different research infer-ences. We first reexamine the analysis of Hendershott and Moulton (2011, HM).They conduct an event study around the NYSE’s Hybrid Market reform, whichsignificantly increased the exchange’s automation and speed. HM match tradesto NYSE quotes only, which is sufficient because the NYSE still held a domi-nant market share during the 2006 to 2007 Hybrid reform period. We replicatethe HM study in three ways: (i) using the “conventional” MTAQ method (NBBOacross all markets, no adjustments for withdrawn quotes, etc.); (ii) using thefirst-best DTAQ approach; and (iii) using the second-best adjusted MTAQ ap-proach. We find that using our first- and second-best solutions yields the iden-tical inference that HM find using NYSE quotes only, namely, an increase inpercent effective spreads around the event date. By contrast, using the con-ventional MTAQ method yields an incorrect inference, namely, no change inpercent effective spreads, because the spread measures are so noisy that theyhave large standard errors. Although HM find the same result using NYSEquotes only, that is no longer a viable approach. Thus, we demonstrate that,among the approaches that include all markets (important for the competitivemarkets of 2009 and forward), the conventional MTAQ method yields a flawedinference, while the first-best DTAQ and second-best adjusted MTAQ methodsyield correct inference.
Next, we examine exchange performance based on relative effective spreadrankings. We find that MTAQ with no adjustments yields different rank-ings from DTAQ the majority of the time and yields biased conclusions aboutwhich exchanges have superior versus inferior performance. Further, we findthat using our second-best solution reduces the frequency of rankings dif-ferent from DTAQ and reduces the bias about exchange performance, butfalls short of using our first-best solution. Finally, we conduct a firm trad-ing costs sort that is common in the corporate finance and asset pricing
10 See www.kelley.iu.edu/cholden and www.cox.smu.edu/web/sjacobsen. We appreciate any feed-back on the SAS code and plan to update it over time.
11 The Internet Appendix is located in the online version of this article on the Journal of Financeweb site.
1752 The Journal of Finance R©
literature. We find that using MTAQ with no adjustments, the majority ofdollar effective spread quintiles differ from our first-best solution, whereas us-ing our second-best solution, the vast majority are the same as the first-bestsolution.
Regarding research that studies 2008 and years thereafter and that is basedon NBBO quotes using MTAQ with no adjustments, our 2008 evidence leadsus to conclude that any estimates of the quoted spread, effective spread, real-ized spread, price impact, frequency of trades outside the NBBO, frequency oflocked and crossed markets, and buy/sell classification are likely to be stronglybiased, whereas estimates of depth and absolute order imbalance are likely tobe unbiased. The decline of the NYSE and NASDAQ’s market shares through2008 means that using only NYSE or NASDAQ quotes to study 2009 and lateris no longer an option.
Looking to the future, we consider what happens when the trading processaccelerates into microseconds (10−6 seconds) in the late 2010s and nanoseconds(10−9 seconds) in the 2020s. If bid and offer update messages could travelarbitrarily fast, then it would be possible to maintain a common NBBO forall economic agents in all locations. However, bid and offer update messagescannot travel faster than the speed of light (186,282 miles per second) and sohigh-speed traders face immutable lag times in receiving bid and offer updatesfrom remotely located exchanges. As a replacement for the NBBO, we propose aRelative Best Bid and Offer (RBBO) that accounts for the theoretical minimumlag time in communicating at the speed of light and is different for each marketcenter.
The paper is organized as follows. Section I describes the institutional setting.Section II describes the liquidity measures. Section III describes the data. Sec-tion IV presents the overall liquidity measure differences. Section V presentsa three-way decomposition of the liquidity measure differences. Section VI de-velops a simple errors-in-variables model to test how well simulated liquiditymeasure differences match actual liquidity measure differences. Section VIIdiscusses alternative solutions. Section VIII presents empirical results for al-ternative MTAQ solutions. Sections IX and X analyze whether methodologyaffects research inferences. Specifically, Section IX analyzes the case of HybridMarket reform and Section X analyzes order routing decisions. Section XI an-alyzes the impact on other research areas. Section XII discusses the ultimatebreakdown of the NBBO and our proposed replacement concept of RBBOs.Section XIII concludes.
I. The Institutional Setting
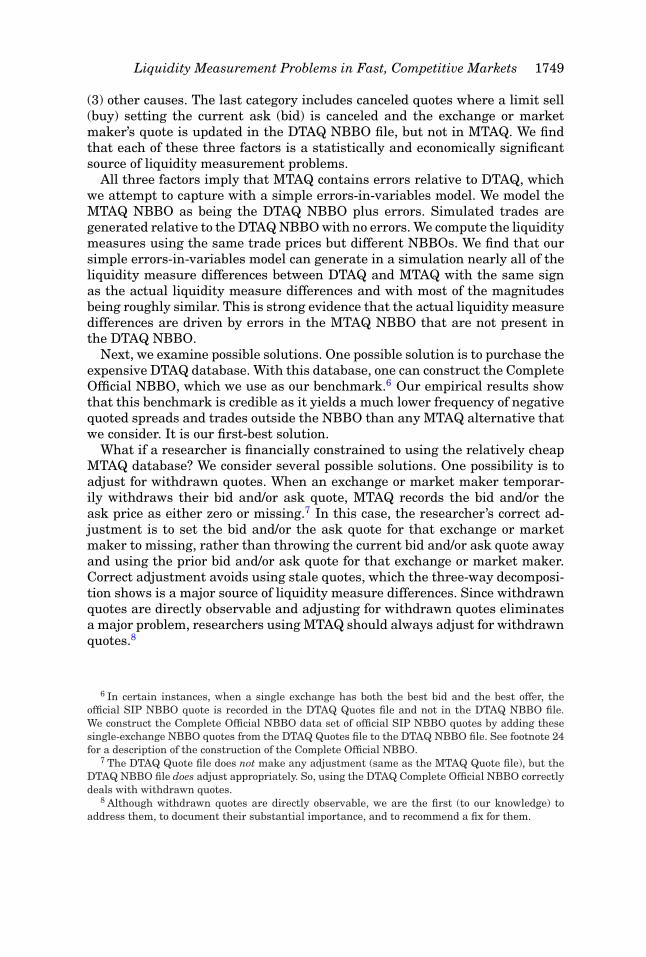
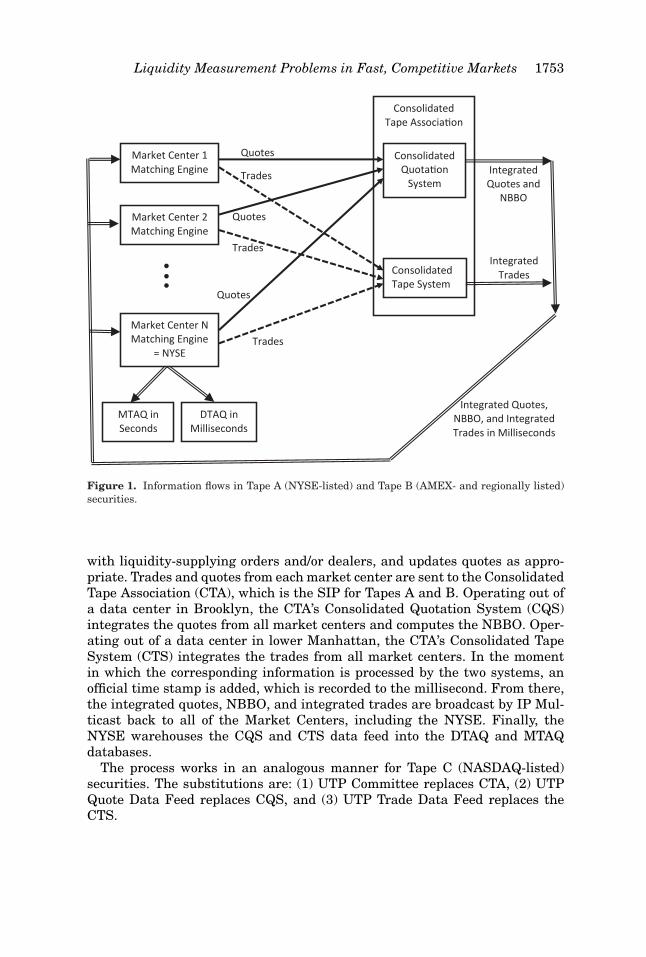
Figure 1 illustrates the information flows in Tape A (NYSE-listed) and TapeB (AMEX- and regionally listed) securities. On the left side, we see that thereare N market centers, where a market center is defined as an exchange, mar-ket maker, or broker-dealer. For convenience, we designate the Nth marketcenter as the NYSE. Each market center has a matching engine that arrangestrades by matching and/or recording matches of liquidity-demanding orders
Liquidity Measurement Problems in Fast, Competitive Markets 1753
. . .
Integrated Quotes and
NBBO
Consolidated Tape Associa on
Market Center 1Matching Engine
Consolidated Tape System
Quotes
Trades
Quotes
Quotes
Trades
Trades
Market Center 2Matching Engine
Integrated Trades
DTAQ in Milliseconds
MTAQ in Seconds
Market Center NMatching Engine
= NYSE
Integrated Quotes, NBBO, and Integrated Trades in Milliseconds
Consolidated Quota on
System
●●●
Figure 1. Information flows in Tape A (NYSE-listed) and Tape B (AMEX- and regionally listed)securities.
with liquidity-supplying orders and/or dealers, and updates quotes as appro-priate. Trades and quotes from each market center are sent to the ConsolidatedTape Association (CTA), which is the SIP for Tapes A and B. Operating out ofa data center in Brooklyn, the CTA’s Consolidated Quotation System (CQS)integrates the quotes from all market centers and computes the NBBO. Oper-ating out of a data center in lower Manhattan, the CTA’s Consolidated TapeSystem (CTS) integrates the trades from all market centers. In the momentin which the corresponding information is processed by the two systems, anofficial time stamp is added, which is recorded to the millisecond. From there,the integrated quotes, NBBO, and integrated trades are broadcast by IP Mul-ticast back to all of the Market Centers, including the NYSE. Finally, theNYSE warehouses the CQS and CTS data feed into the DTAQ and MTAQdatabases.
The process works in an analogous manner for Tape C (NASDAQ-listed)securities. The substitutions are: (1) UTP Committee replaces CTA, (2) UTPQuote Data Feed replaces CQS, and (3) UTP Trade Data Feed replaces theCTS.
1754 The Journal of Finance R©
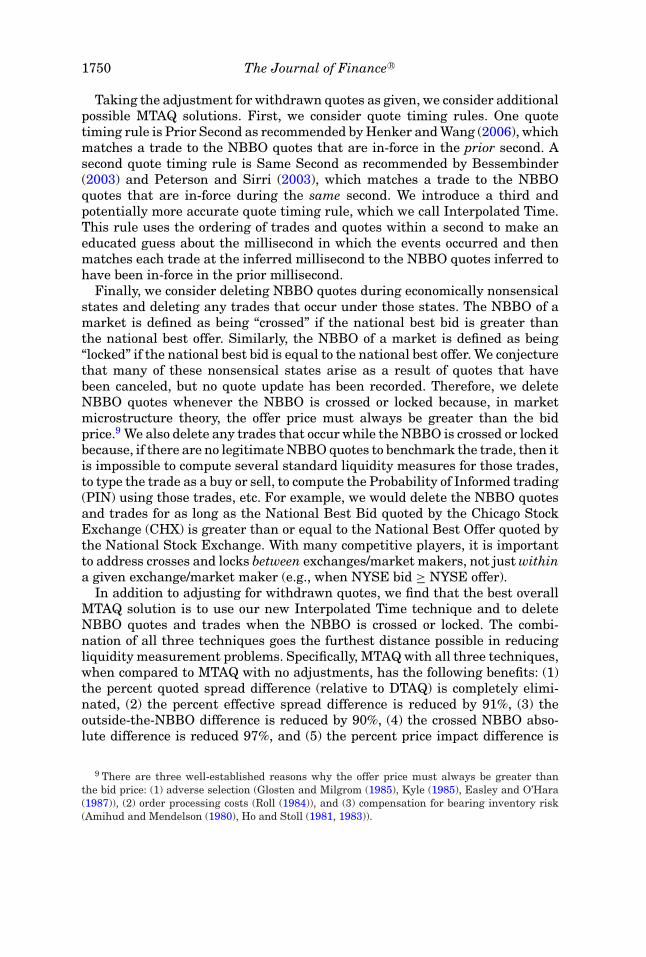
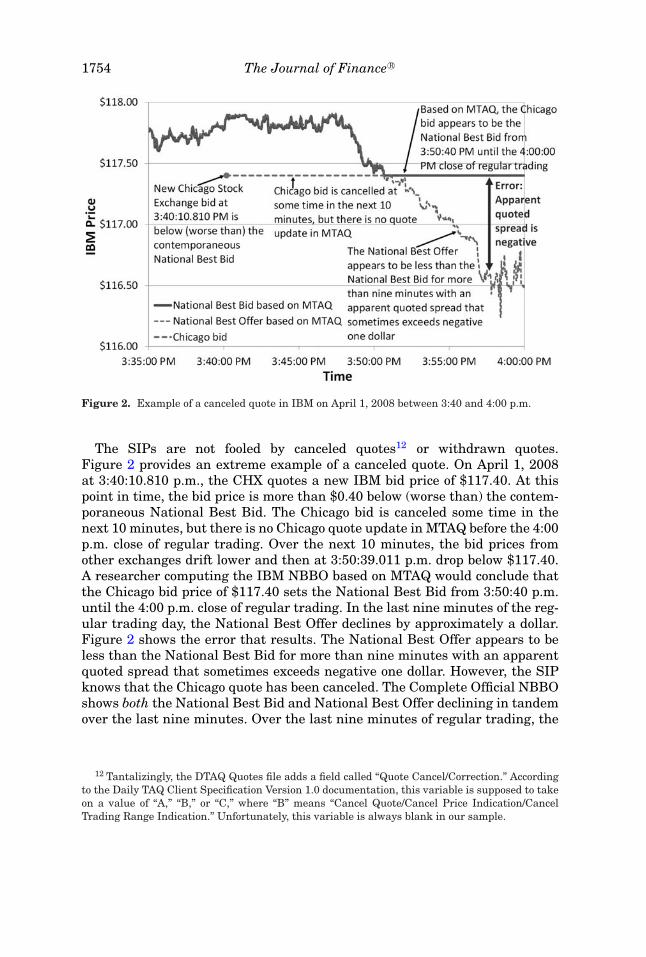
Figure 2. Example of a canceled quote in IBM on April 1, 2008 between 3:40 and 4:00 p.m.
The SIPs are not fooled by canceled quotes12 or withdrawn quotes.Figure 2 provides an extreme example of a canceled quote. On April 1, 2008at 3:40:10.810 p.m., the CHX quotes a new IBM bid price of $117.40. At thispoint in time, the bid price is more than $0.40 below (worse than) the contem-poraneous National Best Bid. The Chicago bid is canceled some time in thenext 10 minutes, but there is no Chicago quote update in MTAQ before the 4:00p.m. close of regular trading. Over the next 10 minutes, the bid prices fromother exchanges drift lower and then at 3:50:39.011 p.m. drop below $117.40.A researcher computing the IBM NBBO based on MTAQ would conclude thatthe Chicago bid price of $117.40 sets the National Best Bid from 3:50:40 p.m.until the 4:00 p.m. close of regular trading. In the last nine minutes of the reg-ular trading day, the National Best Offer declines by approximately a dollar.Figure 2 shows the error that results. The National Best Offer appears to beless than the National Best Bid for more than nine minutes with an apparentquoted spread that sometimes exceeds negative one dollar. However, the SIPknows that the Chicago quote has been canceled. The Complete Official NBBOshows both the National Best Bid and National Best Offer declining in tandemover the last nine minutes. Over the last nine minutes of regular trading, the
12 Tantalizingly, the DTAQ Quotes file adds a field called “Quote Cancel/Correction.” Accordingto the Daily TAQ Client Specification Version 1.0 documentation, this variable is supposed to takeon a value of “A,” “B,” or “C,” where “B” means “Cancel Quote/Cancel Price Indication/CancelTrading Range Indication.” Unfortunately, this variable is always blank in our sample.
Liquidity Measurement Problems in Fast, Competitive Markets 1755
time-weighted average of the dollar quoted spread13 is −44.7 cents based onMTAQ versus 1.5 cents based on DTAQ.
A key distinction is that withdrawn quotes are directly observable, whereascanceled quotes are not. According to the NYSE TAQ User Guide,14 when abid and/or ask quote is withdrawn during normal market hours, the bid and/orask price are set equal to zero or missing. A withdrawn quote can be one-sided,where the bid (ask) is withdrawn, but the ask (bid) is still valid, or two-sided,where both the bid and ask are withdrawn. A withdrawn quote is recorded asa regular quote update in MTAQ. The researcher can properly account for awithdrawn bid and/or ask quote by treating that particular bid and/or ask quoteas missing until a new bid and/or ask quote is displayed by that exchange ormarket maker. By contrast, we do not directly observe canceled quotes becauseby definition a canceled quote is when the limit order underlying a bid or askquote is canceled, but no quote update is recorded in MTAQ. In other words,it is an error in the MTAQ data set. The existence of canceled quotes can onlybe inferred indirectly in extreme cases, such as in Figure 2. In this case, it isobvious that the CHX bid price of $117.40 was canceled at some point becausewe see such an extreme outcome, namely, that the apparent quoted spreadexceeds negative one dollar. But, when using MTAQ, we do not know whenthe quote was canceled because there is no quote update recorded in MTAQ.While the indirect inference is obvious in extreme cases, it is not clear when orif a quote has been canceled in moderate cases. Since a canceled quote is notdirectly observable, nor can it be reliably inferred in a moderate case, there isno cure for this problem. Since we cannot cure the problem, it will turn out thatthe only thing we can do is treat its worst symptom, namely, by throwing outall cases of NBBO crossed and locked markets.
II. Liquidity Measures
The liquidity measures that we analyze are standard measures of marketquality. Our first category of liquidity measures evaluates trade location. Specif-ically, we determine the percentage of trades that are at, inside, and outsidethe NBBO and the percentage of trades that occur when a market is experienc-ing the economically nonsensical conditions of being crossed or locked. The kth
trade at price Pk is considered At the NBBO when Pk = Ak or Pk = Bk, whereAk is the National Best Ask and Bk is the National Best Bid assigned to thekth trade by a particular technique. A trade is considered Inside the NBBOwhen Ak > Pk > Bk and Outside the NBBO when Pk > Ak or Pk < Bk. The morea particular technique misaligns trades and quotes, the more the apparentpercentage of Outside the NBBO trades will be elevated and so we focus onthis metric, rather than At the NBBO or Inside the NBBO. A market observesa Crossed NBBO when the National Best Ask is strictly less than the NationalBest Bid, Ak < Bk, and the market observes a Locked NBBO when the National
13 See equation (2) below.14 The NYSE TAQ User Guide can be found on the WRDS website.
1756 The Journal of Finance R©
Best Ask is equal to the National Best Bid, Ak = Bk. A crossed market is a moresevere condition than a locked market because the former represents an arbi-trage opportunity, whereas the latter does not. Thus, we focus on the frequencyof a crossed market.
Our second category of liquidity measures evaluates the quoted and effectivespread. For a given time interval s, the dollar and percent quoted spread aredefined as
Dollar Quoted Spreads = As − Bs, (1)
Percent Quoted Spreads = As − Bs
Ms, (2)
where As is the National Best Ask and Bs is the National Best Bid as-signed to time interval s by a particular technique and Ms is the midpoint,which is the average of Bs and As. Aggregating over the sample period, astock’s Dollar (Percent) Quoted Spread is the time-weighted average of Dol-lar (Percent) Quoted Spreads computed over all time intervals. For a givenstock, the dollar and percent effective spread on the kth trade is definedas
Dollar Effective Spreadk = 2Dk(Pk − Mk), (3)
Percent Effective Spreadk = 2Dk(Pk − Mk)Mk
, (4)
where Dk is an indicator variable that equals +1 if the kth trade is a buyand −1 if the kth trade is a sell and Mk is the midpoint of the NBBO quotesassigned to the kth trade by a particular technique. Aggregating over the sam-ple period, a stock’s Dollar (Percent) Effective Spread is the dollar-volume-weighted average of Dollar (Percent) Effective Spreadk computed over alltrades.
Our third category of liquidity measures considers the realized spread andprice impact. The dollar realized spread is the temporary component of thedollar effective spread. For a given stock, the dollar realized spread on the kth
trade is defined as
Dollar Realized Spreadk = 2Dk(Pk − Mk+5), (5)
Percent Realized Spreadk = 2Dk(Pk − Mk+5)Mk
, (6)
where Mk+5 is the midpoint five minutes after the midpoint Mk. Aggregatingover the sample period, a stock’s Dollar (Percent) Realized Spread is the dollar-volume-weighted average of the Dollar (Percent) Realized Spreadk computedover all trades. The dollar price impact is the permanent component of the
Liquidity Measurement Problems in Fast, Competitive Markets 1757
dollar effective spread. For a given stock, the dollar price impact on the kth
trade is defined as
Dollar Price Impactk = 2Dk(Mk+5 − Mk), (7)
Percent Price Impactk = 2Dk(Mk+5 − Mk)Mk
. (8)
Aggregating over the sample period, the Dollar (Percent) Price Impact is thedollar-volume-weighted average of Dollar (Percent) Price Impactk computedover all trades.
There are three popular trade-typing conventions for determining whether agiven trade is a liquidity-demander “buy” or liquidity-demander “sell,” which,in turn, determines whether Dk is +1 or −1. Using the Lee and Ready (1991,LR) convention, a trade is a buy when Pk > Mk, a sell when Pk < Mk, and thetick test is used when Pk = Mk. The tick test specifies that a trade is a buy(sell) if the most recent prior trade at a different price was at a lower (higher)price than Pk. Using the Ellis, Michaely, and O’Hara (2000, EMO) convention,a trade is a buy when Pk = Ak, a sell when Pk = Bk, and the tick test is usedotherwise. Using the Chakrabarty et al. (2006, CLNV) convention, a trade isa buy when Pk ∈ [0.3Bk + 0.7Ak, Ak], a sell when Pk ∈ [Bk, 0.7Bk + 0.3Ak], andthe tick test is used otherwise.15 We consider three versions of dollar realizedspread and three versions of dollar price impact based on these three trade-typing conventions.
Our fourth category of liquidity measures evaluates dollar and share bid andask depth. The dollar (share) ask depth is the dollar (share) amount availableat the best ask quote from the exchange or market maker with the largest sizequoted at that price. In the benchmark DTAQ NBBO, depth is also the largestsize based on price priority and then size priority. The dollar (share) bid depthis computed analogously.
Our final liquidity measure is absolute order imbalance, defined as
Absolute Order Imbalance =∣∣∣∣ Buys − SellsBuys + Sells
∣∣∣∣ , (9)
where Buys and Sells are the number of buys and number of sells, respec-tively, based on a particular technique and based on the three trade-typingconventions. Easley et al. (2008) and Kaul, Lei, and Stoffman (2008) show thatabsolute order imbalance is an alternative measure of the Probability of In-formed trading (PIN). Absolute order imbalance has two advantages over PIN.It can be computed over relatively short periods of time and it does not havethe numerical overflow problems that are often encountered when computingthe PIN log-likelihood function using large numbers of buys or sells per period.
15 The economic rationale for the three conventions only makes sense in normal markets(when the National Best Offer is greater than the National Best Bid). If the market is locked orcrossed, then we ignore the three different rules and apply the tick test exclusively using all threeconventions.
1758 The Journal of Finance R©
III. Data
We use the DTAQ and MTAQ data sets. Because of the high price of theDTAQ data, we purchase a limited sample from April 1, 2008 to June 30, 2008.Due to computational limitations, we select a random sample of traded stocks.Following the methodology of Hasbrouck (2009), a stock must meet five criteriato be eligible: (1) it must be a common stock; (2) it must be present on the TAQmaster file for the first and last date of the sample period; (3) it must have aprimary listing on the NYSE, AMEX, or NASDAQ; (4) it cannot change primaryexchange, ticker symbol, or CUSIP code during the sample period; and (5) itmust be listed in the Center for Research in Security Prices (CRSP) database.
Starting with eligible firms, we first divide them into five quintiles basedon number of trades per day, and then randomly select 20 firms from eachquintile. This yields a random sample of 100 traded stocks, which results in34 million trades and 351 million quotes over the sample period. In the basecase of MTAQ with no adjustments, we then apply the following screens tothe trade and quote data. Only quotes/trades during normal market hours(quotes between 9:00 a.m. and 4:00 p.m. and trades between 9:30 a.m. and 4:00p.m.) are considered. For each exchange or market maker, we delete cases inwhich the bid of one exchange or market maker is greater than or equal tothe ask of the same exchange or market maker. If the quoted spread is greaterthan $5.00 and the bid (ask) price is less (greater) than the previous midpoint− $2.50 (previous midpoint + $2.50), then the bid (ask) is not considered. Thequote condition must be normal, which excludes cases in which trading hasbeen halted.16 We delete bid (ask) quotes that have a bid (ask) price or bid (ask)size that is set to zero or a missing value.
When we consider withdrawn quotes, we slightly alter the screens describedabove. First, we delete cases in which the bid of one exchange or market makeris greater than or equal to the ask of the same exchange or market maker onlyif both the bid and the ask are greater than zero. Specifically, if an observationis crossed because the bid > 0 and the ask = 0, we assume that the bid is validand the ask has been withdrawn. Second, we delete cases in which the quotedspread is greater than $5.00 only if both the bid and the ask are greater thanzero. Therefore, if the spread is greater than $5.00 because the bid = 0 andthe ask > 0, we assume that the ask is valid and the bid has been withdrawn.Third, when a bid (ask) price or bid (ask) size equals zero or a missing value,we assume that the bid (ask) quote has been withdrawn and set it to missing.See the Internet Appendix for a more detailed description of our data screeningprocess.
We calculate the NBBO across all exchanges and across all market makers forany given millisecond in DTAQ or second in MTAQ. If there are multiple quoteupdates from a given exchange or market maker within a given millisecond(second), then the last quote update within that millisecond (second) is what we
16 In DTAQ, we exclude quotes with nonnormal quote conditions (A, B, H, O, R, and W). Similarly,in MTAQ, we exclude quotes with nonnormal quote conditions (4, 7, 9, 11, 13, 14, 15, 19, 20, 27,and 28).
Liquidity Measurement Problems in Fast, Competitive Markets 1759
take to be in-force from that exchange or market maker.17 For DTAQ, we matchtrades and quotes with a one millisecond lag (i.e., a given trade is matched tothe NBBO that was in-force one millisecond earlier).
IV. Overall Liquidity Measure Differences
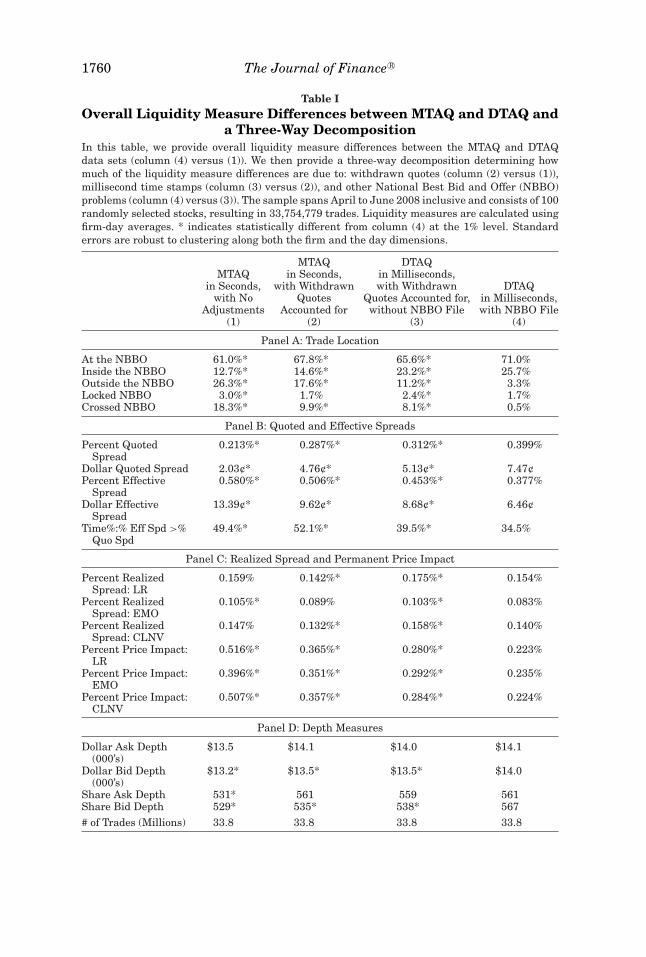
Table I reports the overall liquidity measure differences between MTAQ andDTAQ. Liquidity measures are calculated using firm-day averages. Asterisksrepresent differences between MTAQ and DTAQ that are statistically signif-icant at the 1% level. T-tests are calculated using standard errors that arerobust to clustering along both the firm and the day dimension as describedin Thompson (2011).18 The key comparison is between column (1), which re-ports liquidity measures based on MTAQ in seconds with no adjustments (i.e.,the standard way that most researchers currently compute them), and column(4), which reports liquidity measures based on DTAQ in milliseconds with theNBBO file.
Panel A reports trade location statistics. The frequency of Outside the NBBOtrades is 26.3% for MTAQ versus 3.3% for DTAQ, which is eight times largerusing MTAQ. The frequency of Crossed NBBO is 18.3% versus 0.5%. Sincea crossed NBBO is equivalent to a negative quoted spread, this implies thatPercent Quoted Spread goes negative 37 times more often. Both differencesare statistically significantly at the 1% level. Both differences are economicallyimportant because frequent trades outside the NBBO using MTAQ suggestthat trading is expensive and a frequently crossed NBBO would represent afrequent opportunity to make arbitrage profits.
Panel B reports quoted and effective spreads. The Percent Quoted Spread is0.213% for MTAQ versus 0.399% for DTAQ, which is 47% lower using MTAQ.The lower Percent Quoted Spread is consistent with the higher frequency ofa crossed NBBO because a crossed NBBO yields a negative percent quotedspread. The Dollar Quoted Spread is 73% lower using MTAQ. The PercentEffective Spread is 0.580% for MTAQ versus 0.377% for DTAQ, which is 54%higher using MTAQ. The Dollar Effective Spread is more than twice as large us-ing MTAQ and the Percent Effective Spread is greater than the Percent QuotedSpread 15% more often.
To summarize the results in Panels C and D, using MTAQ: (1) Percent Real-ized Spread is 3% to 27% larger using all three conventions, (2) Percent PriceImpact is 68% to 131% larger using all three conventions, and (3) the dollardepth and share depth measures show very minimal differences. To summarizethe table, there are large overall differences in liquidity measures, includingOutside the NBBO, Crossed NBBO, Percent (Dollar) Quoted Spread, Percent(Dollar) Effective Spread, frequency with which the Percent Effective Spread is
17 For the Interpolated Time technique described in Section VII, all quotes within a second areutilized.
18 Unless otherwise stated, all significance tests throughout this paper are based on standarderrors that are robust to clustering along both the firm and the day dimensions.
1760 The Journal of Finance R©
Table IOverall Liquidity Measure Differences between MTAQ and DTAQ and
a Three-Way DecompositionIn this table, we provide overall liquidity measure differences between the MTAQ and DTAQdata sets (column (4) versus (1)). We then provide a three-way decomposition determining howmuch of the liquidity measure differences are due to: withdrawn quotes (column (2) versus (1)),millisecond time stamps (column (3) versus (2)), and other National Best Bid and Offer (NBBO)problems (column (4) versus (3)). The sample spans April to June 2008 inclusive and consists of 100randomly selected stocks, resulting in 33,754,779 trades. Liquidity measures are calculated usingfirm-day averages. * indicates statistically different from column (4) at the 1% level. Standarderrors are robust to clustering along both the firm and the day dimensions.
MTAQ DTAQMTAQ in Seconds, in Milliseconds,
in Seconds, with Withdrawn with Withdrawn DTAQwith No Quotes Quotes Accounted for, in Milliseconds,
Adjustments Accounted for without NBBO File with NBBO File(1) (2) (3) (4)
Panel A: Trade Location
At the NBBO 61.0%* 67.8%* 65.6%* 71.0%Inside the NBBO 12.7%* 14.6%* 23.2%* 25.7%Outside the NBBO 26.3%* 17.6%* 11.2%* 3.3%Locked NBBO 3.0%* 1.7% 2.4%* 1.7%Crossed NBBO 18.3%* 9.9%* 8.1%* 0.5%
Panel B: Quoted and Effective Spreads
Percent QuotedSpread
0.213%* 0.287%* 0.312%* 0.399%
Dollar Quoted Spread 2.03¢* 4.76¢* 5.13¢* 7.47¢Percent Effective
Spread0.580%* 0.506%* 0.453%* 0.377%
Dollar EffectiveSpread
13.39¢* 9.62¢* 8.68¢* 6.46¢
Time%:% Eff Spd >%Quo Spd
49.4%* 52.1%* 39.5%* 34.5%
Panel C: Realized Spread and Permanent Price Impact
Percent RealizedSpread: LR
0.159% 0.142%* 0.175%* 0.154%
Percent RealizedSpread: EMO
0.105%* 0.089% 0.103%* 0.083%
Percent RealizedSpread: CLNV
0.147% 0.132%* 0.158%* 0.140%
Percent Price Impact:LR
0.516%* 0.365%* 0.280%* 0.223%
Percent Price Impact:EMO
0.396%* 0.351%* 0.292%* 0.235%
Percent Price Impact:CLNV
0.507%* 0.357%* 0.284%* 0.224%
Panel D: Depth Measures
Dollar Ask Depth(000’s)
$13.5 $14.1 $14.0 $14.1
Dollar Bid Depth(000’s)
$13.2* $13.5* $13.5* $14.0
Share Ask Depth 531* 561 559 561Share Bid Depth 529* 535* 538* 567# of Trades (Millions) 33.8 33.8 33.8 33.8
Liquidity Measurement Problems in Fast, Competitive Markets 1761
greater than the Percent Quoted Spread, Percent Realized Spread, and PercentPrice Impact.
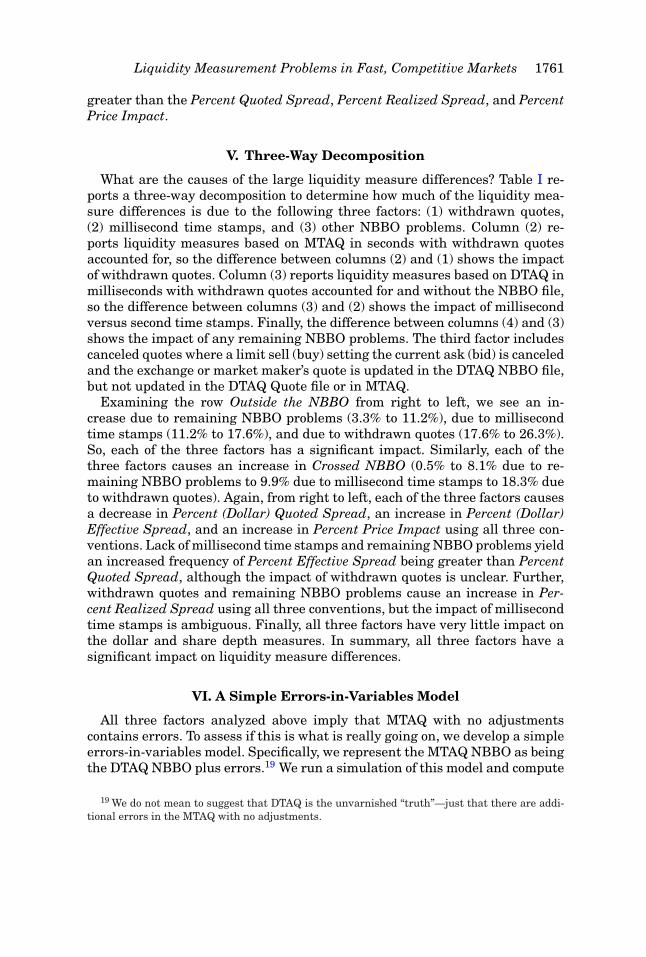
V. Three-Way Decomposition
What are the causes of the large liquidity measure differences? Table I re-ports a three-way decomposition to determine how much of the liquidity mea-sure differences is due to the following three factors: (1) withdrawn quotes,(2) millisecond time stamps, and (3) other NBBO problems. Column (2) re-ports liquidity measures based on MTAQ in seconds with withdrawn quotesaccounted for, so the difference between columns (2) and (1) shows the impactof withdrawn quotes. Column (3) reports liquidity measures based on DTAQ inmilliseconds with withdrawn quotes accounted for and without the NBBO file,so the difference between columns (3) and (2) shows the impact of millisecondversus second time stamps. Finally, the difference between columns (4) and (3)shows the impact of any remaining NBBO problems. The third factor includescanceled quotes where a limit sell (buy) setting the current ask (bid) is canceledand the exchange or market maker’s quote is updated in the DTAQ NBBO file,but not updated in the DTAQ Quote file or in MTAQ.
Examining the row Outside the NBBO from right to left, we see an in-crease due to remaining NBBO problems (3.3% to 11.2%), due to millisecondtime stamps (11.2% to 17.6%), and due to withdrawn quotes (17.6% to 26.3%).So, each of the three factors has a significant impact. Similarly, each of thethree factors causes an increase in Crossed NBBO (0.5% to 8.1% due to re-maining NBBO problems to 9.9% due to millisecond time stamps to 18.3% dueto withdrawn quotes). Again, from right to left, each of the three factors causesa decrease in Percent (Dollar) Quoted Spread, an increase in Percent (Dollar)Effective Spread, and an increase in Percent Price Impact using all three con-ventions. Lack of millisecond time stamps and remaining NBBO problems yieldan increased frequency of Percent Effective Spread being greater than PercentQuoted Spread, although the impact of withdrawn quotes is unclear. Further,withdrawn quotes and remaining NBBO problems cause an increase in Per-cent Realized Spread using all three conventions, but the impact of millisecondtime stamps is ambiguous. Finally, all three factors have very little impact onthe dollar and share depth measures. In summary, all three factors have asignificant impact on liquidity measure differences.
VI. A Simple Errors-in-Variables Model
All three factors analyzed above imply that MTAQ with no adjustmentscontains errors. To assess if this is what is really going on, we develop a simpleerrors-in-variables model. Specifically, we represent the MTAQ NBBO as beingthe DTAQ NBBO plus errors.19 We run a simulation of this model and compute
19 We do not mean to suggest that DTAQ is the unvarnished “truth”—just that there are addi-tional errors in the MTAQ with no adjustments.
1762 The Journal of Finance R©
the same liquidity measures as above. The goal of this calibration test is to seewhether we can reverse engineer the observed results in Table I. That is, can asimple error-in-variables model yield simulated liquidity measure differencesthat have the same sign as the actual liquidity measure differences in Table I?Even more challenging, can the model yield simulated liquidity measures thatare roughly of the same magnitude as the actual liquidity measures in Table I?If so, then the results would bolster our confidence that we truly understandthe problem.
Let NBOik, NBBi
k,ODik, andBDi
k be the National Best Offer, National BestBid, Offer Depth, and Bid Depth, respectively, in-force at the time of the kth
trade as computed from the ith data set, where i = M refers to MTAQ and i = Drefers to DTAQ. The DTAQ NBBO is assumed to be measured with no errorbased on the midpoint plus or minus the half-spread,
NBODk = Mk + 0.5∗Sk, (10)
NBBDk = Mk − 0.5∗Sk, (11)
where Mk is the midpoint and Sk is a random spread at the time of the kth trade;Sk is assumed to have a positive mean (E[Sk] > 0), but occasional negativespreads (crossed markets) are permitted. We assume that the MTAQ NBBO isthe DTAQ NBBO plus errors as given by
NBOMk = NBOD
k + εOk , (12)
NBBMk = NBBD
k + εBk , (13)
ODMk = ODD
k + εODk , (14)
BDMk = BDD
k + εBDk , (15)
where εOk , εB
k , εODk , and εBD
k are independent errors. Price priority tends to censorthe way that individual exchange errors translate into NBBO errors.20 There-fore, we assume that the mean of the NBO error is negative (i.e.,E[εO
k ] < 0),and in the mirror image case, that the mean of the NBB error is positive(i.e.,E[εB
k ] > 0). Price priority has no influence on depth errors, so we assumethat these errors have zero mean (i.e.,E[εOD
k ] = E[εBDk ] = 0).
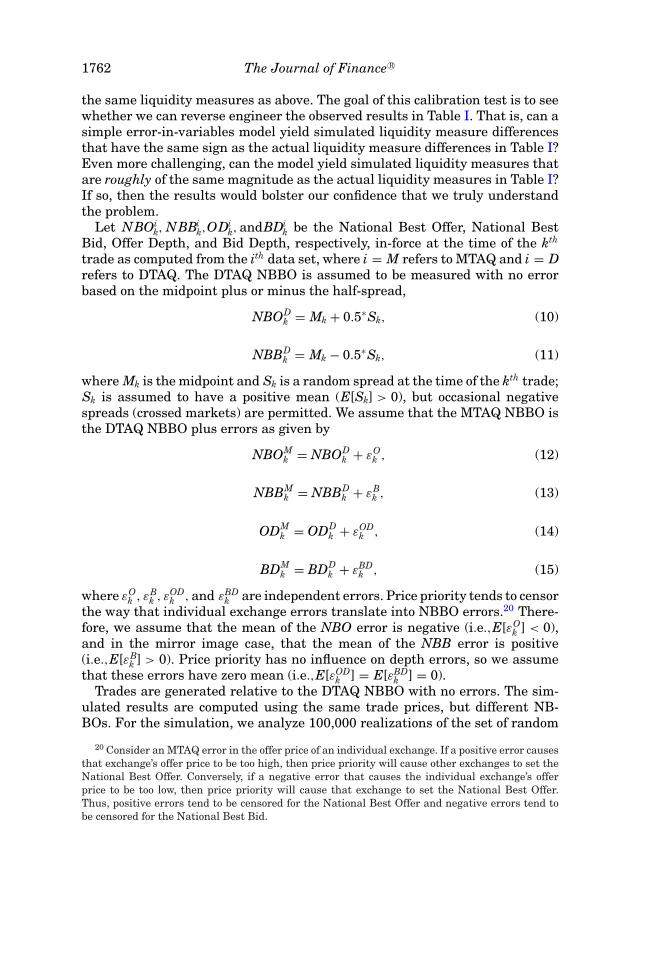
Trades are generated relative to the DTAQ NBBO with no errors. The sim-ulated results are computed using the same trade prices, but different NB-BOs. For the simulation, we analyze 100,000 realizations of the set of random
20 Consider an MTAQ error in the offer price of an individual exchange. If a positive error causesthat exchange’s offer price to be too high, then price priority will cause other exchanges to set theNational Best Offer. Conversely, if a negative error that causes the individual exchange’s offerprice to be too low, then price priority will cause that exchange to set the National Best Offer.Thus, positive errors tend to be censored for the National Best Offer and negative errors tend tobe censored for the National Best Bid.
Liquidity Measurement Problems in Fast, Competitive Markets 1763
Table IIActual versus Simulated Liquidity Measures for MTAQ and DTAQ
In this table, we provide actual and simulated liquidity measure differences between the MTAQand DTAQ data sets. The simulation is based on a simple errors-in-variables model, where theMTAQ NBBO is the DTAQ NBBO plus errors. Trades are generated relative to the DTAQ NBBOwith no errors. The simulated results are computed using the same trade prices, but differentNBBOs. The simulation draws 100,000 realizations for the set of random variables. The actualresults are based on a data sample that spans April to June 2008 inclusive and consists of 100randomly selected stocks, resulting in 33,754,779 trades.
MTAQ DTAQ MTAQ DTAQActual Actual Simulated Simulated
(1) (2) (3) (4)
Panel A: Trade Location
At the NBBO 61.0% 71.0% 47.9% 70.3%Inside the NBBO 12.7% 25.7% 27.9% 26.4%Outside the NBBO 26.3% 3.3% 24.1% 3.3%Locked NBBO 3.0% 1.7% 1.9% 1.7%Crossed NBBO 18.3% 0.5% 21.7% 0.5%
Panel B: Quoted and Effective Spreads
Percent Quoted Spread 0.213% 0.399% 0.150% 0.377%Dollar Quoted Spread 2.03¢ 7.47¢ 3.00¢ 7.55¢Percent Effective Spread 0.580% 0.377% 0.518% 0.278%Dollar Effective Spread 13.39¢ 6.46¢ 10.38¢ 5.57¢Time%:% Eff Spd >% Quo Spd 49.4% 34.5% 17.6% 3.1%
Panel C: Realized Spread and Permanent Price Impact
Percent Realized Spread: LR 0.159% 0.154% 0.086% 0.104%Percent Realized Spread: EMO 0.105% 0.083% 0.096% 0.104%Percent Realized Spread: CLNV 0.147% 0.140% 0.089% 0.104%Percent Price Impact: LR 0.516% 0.223% 0.432% 0.174%Percent Price Impact: EMO 0.396% 0.235% 0.193% 0.174%Percent Price Impact: CLNV 0.507% 0.224% 0.388% 0.174%
Panel D: Depth Measures
Dollar Ask Depth (000’s) $13.5 $14.1 $11.2 $11.2Dollar Bid Depth (000’s) $13.2 $14.0 $11.2 $11.2Share Ask Depth 531 561 560 560Share Bid Depth 529 567 560 560
# of Trades (Millions) 33.8 33.8 33.8 33.8
variables. Further details of the simple model are discussed in the InternetAppendix for this paper.
Table II provides actual versus simulated liquidity measures for MTAQ andDTAQ.21 In Panel A, Outside the NBBO, Locked NBBO, and Crossed NBBOhave the same sign (MTAQ > DTAQ) for the simulated results as the actual
21 For convenience, columns (1) and (2) in Table II reproduce columns (1) and (4) in Table I.
1764 The Journal of Finance R©
results, and the magnitudes are roughly similar as well.22 In Panel B, PercentQuoted Spread and Dollar Quoted Spread have the same sign (MTAQ < DTAQ),Percent Effective Spread and Dollar Effective Spread, and percent of time thatPercent Effective Spread is greater than Percent Quoted Spread have the samesign (MTAQ > DTAQ), and all but the last of these magnitudes are roughlysimilar.23 In Panel C, Percent Realized Spread has the opposite sign for all threeconventions (MTAQ < DTAQ), Percent Price Impact has the same sign for allthree conventions (MTAQ > DTAQ), and many of the magnitudes are roughlysimilar. In Panel D, all of the dollar and share depth measures have the samesign (MTAQ = DTAQ) and the magnitudes are roughly similar. Essentially,depth levels are unbiased.
In summary, we find that a simple errors-in-variables model can generatenearly all of the simulated liquidity measure differences between DTAQ andMTAQ with the same sign as the actual liquidity measure differences and withmost of the magnitudes being roughly similar. This is strong evidence that theactual liquidity measure differences are driven by errors in the MTAQ NBBOthat are not present in the DTAQ NBBO.
VII. Alternative Solutions
Now we turn to possible solutions to eliminate or mitigate the liquidity mea-sure differences. One possible solution is to purchase the expensive DTAQdatabase, which includes the NBBO file. This allows researchers to constructthe Complete Official NBBO.24 Table I shows that DTAQ with the NBBO filehas the lowest frequency of Crossed NBBO (which potentially represents ar-bitrage opportunities) at 0.5% and the lowest frequency of Outside the NBBO(which is elevated when there is a misalignment of trade and quotes) at 3.3%.25
Hence, DTAQ with the NBBO file is very credible as the best representation
22 By reverse engineering, a large majority of the probability of the offer error and the bid erroris on zero. This is necessary in order to generate reasonable values for Outside the NBBO andCrossed NBBO.
23 By reverse engineering, the nonzero realizations of the offer errors and the bid errors arerelatively large in absolute value. This is necessary to generate the large differences in PercentEffective Spread and Dollar Effective Spread. See the Internet Appendix for this paper for moredetails.
24 In certain instances, when a single exchange has both the best bid and the best offer, thenthe official SIP NBBO quote is recorded in the DTAQ Quotes file, not in the DTAQ NBBO file.When this happens, the field “National BBO Ind” is set equal to 1 (for NYSE, AMEX, and regionalstocks) or else the field “NASDAQ BBO Ind” is set equal to 4 (for NASDAQ stocks). The DTAQNBBO file is therefore incomplete because it is missing these records. We construct the CompleteOfficial NBBO by adding these single-exchange NBBO quotes from the DTAQ Quotes file to theDTAQ NBBO file. Specifically, we interweave these records by Symbol, Date, Time, and SequenceNumber.
25 The Internet Appendix considers matching DTAQ trades to NBBO quotes that are lagged by100 milliseconds versus by one millisecond. We find that the differences between a 100 millisecondlag and a one millisecond lag are very small. We recommend a one millisecond lag (e.g., matchinga DTAQ trade to the NBBO that is in-force one millisecond earlier).
Liquidity Measurement Problems in Fast, Competitive Markets 1765
of the market. By definition, purchasing the DTAQ database completely elimi-nates any differences compared to itself. So, this is our first-best solution.
In the event a researcher is financially constrained to using the relativelycheap MTAQ database, we next consider several alternative approaches tomitigate the differences in liquidity measures. One solution is to adjust forwithdrawn quotes. The MTAQ Quotes file often shows a zero or a missingvalue as the bid price, ask price, bid depth, or ask depth. Current researchpractice treats a zero or missing value in the quote as an error and throws thequote away.26 In this case, the prior quote by that exchange or market makeris still considered to be valid and might enter the NBBO.
To characterize the frequency of a prior quote before a zero or missing valuequote entering the NBBO, we examined 10 stocks on April 1, 2008 and treatedthe zero or missing value quote as an error. We identify 9,553 instances inwhich the prior quote before the zero or missing value quote set the NBBOout of a total of 63,818 NBBO quotes. These prior quotes set the NBBO fora time-weighted median of 10.7% of the trading day, which is equivalent to42 minutes per trading day.
However, the NYSE (2008), page 26 TAQ 3 Users Guide, says that a zeroin the bid and/or the ask price represents an exchange or market maker with-drawing their previously established bid and/or ask quote. Under this inter-pretation, there is a moment during which there is no bid and/or ask quotefor that exchange or market maker and thus the prior bid and/or ask quote isinvalid. Thus, the correct approach is to treat the bid and/or ask quote for thatexchange or market maker as missing until a new bid and/or ask quote is madeby that exchange or market maker. The large differences between columns (2)and (1) in Table I show that failing to correctly treat withdrawn quotes is amajor source of liquidity measure differences. Since researchers can directlyobserve instances in which the quoted bid and/or ask price is zero or missingand since correct treatment of withdrawn quotes eliminates a major problem,researchers using MTAQ should always do so.
Taking the adjustment for withdrawn quotes as given, we consider addi-tional possible MTAQ solutions. In particular, we consider three quote timingtechniques: (1) Prior Second, (2) Same Second, and (3) Interpolated Time. PriorSecond matches a trade in second s to the calculated NBBO quotes that arein-force in the prior second s−1. Same Second matches a trade in second s tothe calculated NBBO quotes that are in-force during the same second s.27
26 To document current research practices, we surveyed all articles published in the Journal ofFinance (JF), Journal of Financial Economics (JFE), and Review of Financial Studies (RFS) from2006 to 2011 and identified 28 articles that used MTAQ data and none that used DTAQ data. Fourarticles explicitly state that they delete quotes that contain a zero or missing value. The other24 articles do not explicitly say what they do about such quotes, but presumably they filter suchobservations out as well, since allowing an ask price equal to zero to be treated as valid would havea large effect on the NBBO. None of the 28 articles mentions treating a quote containing a zero ormissing value as a withdrawn quote.
27 In the JF-JFE-RFS survey described earlier, we find significant variation in the quote timingtechniques used. Seven articles use Prior Second, three articles use Same Second, five articles usethe quote five seconds earlier, and the rest provide no information on quote timing.
1766 The Journal of Finance R©
We introduce a new, potentially more accurate, quote timing method that wecall Interpolated Time. Suppose that the MTAQ data set lists I trades and Jquotes as occurring in second s. We do not know in which millisecond thosetrades or quotes occurred, but we do know the order of the trades and the orderof the quotes in MTAQ.28 Interpolated Time takes advantage of that orderingto make an educated guess about in which millisecond each event happenedthrough a process of simple interpolation. Specifically, we assume a priori thattrades and quotes are each uniformly distributed over the second. Based on thisassumption, the ith trade in second s is assigned an interpolated trade time of
s + 2i − 12I
, i = 1, 2, . . . , I. (16)
This formula assigns a time gap of 1I of a second between each trade, a time gap
of 12I of a second from the beginning of the second s to the first trade, and a time
gap of 12I of a second from the last trade to the end of the second s. Similarly,
the jth quote in second s is assigned an interpolated quote time of
s + 2 j − 12J
, j = 1, 2, . . . , J. (17)
Similarly, this formula assigns a time gap of 1J of a second between each quote,
a time gap of 12J of a second from the beginning of the second s to the first
quote, and a time gap of 12J of a second from the last quote to the end of the
second s. The jth quote is presumed to have occurred at the interpolated quotetime and the usual NBBO computation across all exchanges and all marketmakers is updated at that time. The ith trade is presumed to have occurredat the interpolated trade time and is matched to the NBBO quotes that werein-force one millisecond earlier.
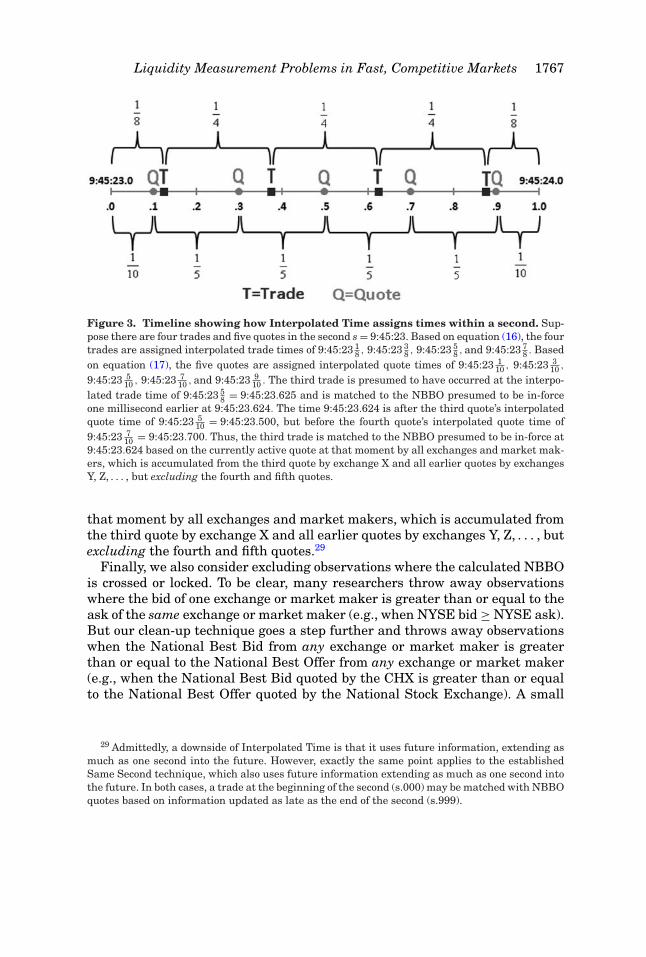
Figure 3 provides a timeline illustrating how Interpolated Time assignstimes within the second s = 9:45:23 in the case of I = 4 trades and J = 5quotes. Applying equation (16), the four trades are assigned interpolated tradetimes of 9:45:23 1
8 , 9:45:23 38 , 9:45:23 5
8 , and 9:45:23 78 . Applying equation (17),
the five quotes are assigned interpolated quote times of 9:45:23 110 , 9:45:23 3
10 ,
9:45:23 510 , 9:45:23 7
10 , and 9:45:23 910 . Consider the third trade. It is presumed
to have occurred at the interpolated trade time of 9:45:23 58 = 9:45:23.625 and
it is matched to the NBBO presumed to be in-force one millisecond earlier at9:45:23.624. The time 9:45:23.624 is after the third quote’s interpolated quotetime of 9:45:23 5
10 = 9:45:23.500, but before the fourth quote’s interpolated quotetime of 9:45:23 7
10 = 9:45:23.700. Thus, the third trade is matched to the NBBOpresumed to be in-force at 9:45:23.624 based on the currently active quote at
28 The order of the trade records and the order of the quote records are identical in DTAQ andMTAQ.
Liquidity Measurement Problems in Fast, Competitive Markets 1767
Figure 3. Timeline showing how Interpolated Time assigns times within a second. Sup-pose there are four trades and five quotes in the second s = 9:45:23. Based on equation (16), the fourtrades are assigned interpolated trade times of 9:45:23 1
8 , 9:45:23 38 , 9:45:23 5
8 , and 9:45:23 78 . Based
on equation (17), the five quotes are assigned interpolated quote times of 9:45:23 110 , 9:45:23 3
10 ,
9:45:23 510 , 9:45:23 7
10 , and 9:45:23 910 . The third trade is presumed to have occurred at the interpo-
lated trade time of 9:45:23 58 = 9:45:23.625 and is matched to the NBBO presumed to be in-force
one millisecond earlier at 9:45:23.624. The time 9:45:23.624 is after the third quote’s interpolatedquote time of 9:45:23 5
10 = 9:45:23.500, but before the fourth quote’s interpolated quote time of9:45:23 7
10 = 9:45:23.700. Thus, the third trade is matched to the NBBO presumed to be in-force at9:45:23.624 based on the currently active quote at that moment by all exchanges and market mak-ers, which is accumulated from the third quote by exchange X and all earlier quotes by exchangesY, Z, . . . , but excluding the fourth and fifth quotes.
that moment by all exchanges and market makers, which is accumulated fromthe third quote by exchange X and all earlier quotes by exchanges Y, Z, . . . , butexcluding the fourth and fifth quotes.29
Finally, we also consider excluding observations where the calculated NBBOis crossed or locked. To be clear, many researchers throw away observationswhere the bid of one exchange or market maker is greater than or equal to theask of the same exchange or market maker (e.g., when NYSE bid ≥ NYSE ask).But our clean-up technique goes a step further and throws away observationswhen the National Best Bid from any exchange or market maker is greaterthan or equal to the National Best Offer from any exchange or market maker(e.g., when the National Best Bid quoted by the CHX is greater than or equalto the National Best Offer quoted by the National Stock Exchange). A small
29 Admittedly, a downside of Interpolated Time is that it uses future information, extending asmuch as one second into the future. However, exactly the same point applies to the establishedSame Second technique, which also uses future information extending as much as one second intothe future. In both cases, a trade at the beginning of the second (s.000) may be matched with NBBOquotes based on information updated as late as the end of the second (s.999).
1768 The Journal of Finance R©
minority of researchers exclude NBBO crossed and/or locked markets.30 Therationale for excluding NBBO locked and crossed markets is that, according tomarket microstructure theory, the offer price must always be greater than thebid price. As described in Section I, we conjecture that NBBO computations thatyield locked or crossed markets are often caused by quotes that are canceledbut no revision has been made to the quotes database.31
VIII. Empirical Results for Alternative MTAQ Solutions
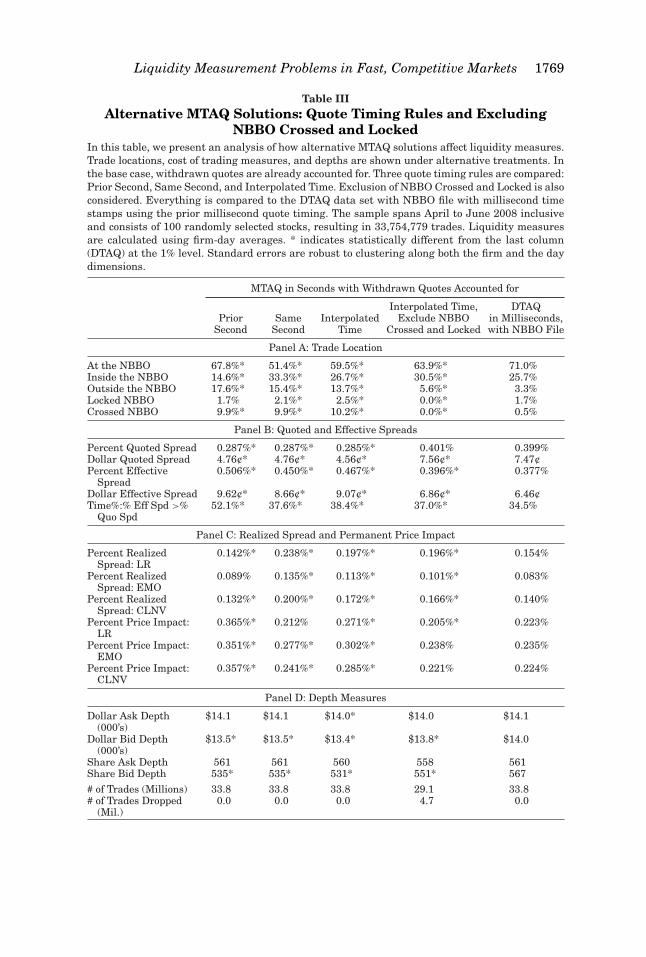
Table III reports liquidity measure differences for alternative MTAQ solu-tions. With withdrawn quotes already accounted for, we analyze MTAQ usingthree quote timing rules (Prior Second, Same Second, and Interpolated Time)and also add the exclusion of NBBO crossed and locked cases to InterpolatedTime. DTAQ results are also reported for comparison.
A. Trade Location
In Panel A, Outside the NBBO is highest using Prior Second (17.6%), declinesusing Same Second (15.4%), declines further using Interpolated Time (13.7%),and declines even further when also Excluding NBBO Crossed and Locked(5.6%). The latter is the closest that researchers can get to DTAQ (with a 3.3%Outside the NBBO) using MTAQ, but the remaining difference is still signifi-cant. Also, in Panel A, Crossed NBBO stays the same using Prior Second andSame Second (9.9%), increases slightly using Interpolated Time (10.2%), anddrops to 0.0% by definition when also Excluding NBBO Crossed and Locked.The latter is the closest that researchers can get to DTAQ (with a 0.5% CrossedNBBO) using MTAQ, but again the remaining difference is still significant.
B. Quoted and Effective Spreads
In Panel B, Percent Quoted Spread is nearly the same using the three quotetiming rules, ranging from 0.285% to 0.287%. All of these values are signif-icantly lower than DTAQ (0.399%). Intuitively, these large differences arerelated to the frequency of negative quoted spreads under crossed marketsand zero quoted spreads under locked markets. Excluding NBBO Crossed andLocked (0.401%) gets researchers very close to DTAQ and the difference isinsignificant.
The Percent Effective Spread is close using the three quote timing rules,ranging from 0.450% to 0.506%. All of these values are significantly higher than
30 In the JF-JFE-RFS survey described earlier, 10 articles out of the 28 that use MTAQ dataexplicitly mention that they drop all observations where the same exchange is crossed and/or locked.Only two articles explicitly state that they delete NBBO crossed and/or locked observations.
31 In the Internet Appendix, we analyze an additional possible solution called Duration LimitControl (DLC). This technique, which is proposed by Jain, Upson, and Wood (2008), drops all quotesolder than a one-minute duration when computing the NBBO. We find that DLC does better thannothing, but worse than the alternatives. Thus, we conclude that DLC should not be used.
Liquidity Measurement Problems in Fast, Competitive Markets 1769
Table IIIAlternative MTAQ Solutions: Quote Timing Rules and Excluding
NBBO Crossed and LockedIn this table, we present an analysis of how alternative MTAQ solutions affect liquidity measures.Trade locations, cost of trading measures, and depths are shown under alternative treatments. Inthe base case, withdrawn quotes are already accounted for. Three quote timing rules are compared:Prior Second, Same Second, and Interpolated Time. Exclusion of NBBO Crossed and Locked is alsoconsidered. Everything is compared to the DTAQ data set with NBBO file with millisecond timestamps using the prior millisecond quote timing. The sample spans April to June 2008 inclusiveand consists of 100 randomly selected stocks, resulting in 33,754,779 trades. Liquidity measuresare calculated using firm-day averages. * indicates statistically different from the last column(DTAQ) at the 1% level. Standard errors are robust to clustering along both the firm and the daydimensions.
MTAQ in Seconds with Withdrawn Quotes Accounted for
Interpolated Time, DTAQPrior Same Interpolated Exclude NBBO in Milliseconds,
Second Second Time Crossed and Locked with NBBO File
Panel A: Trade Location
At the NBBO 67.8%* 51.4%* 59.5%* 63.9%* 71.0%Inside the NBBO 14.6%* 33.3%* 26.7%* 30.5%* 25.7%Outside the NBBO 17.6%* 15.4%* 13.7%* 5.6%* 3.3%Locked NBBO 1.7% 2.1%* 2.5%* 0.0%* 1.7%Crossed NBBO 9.9%* 9.9%* 10.2%* 0.0%* 0.5%
Panel B: Quoted and Effective Spreads
Percent Quoted Spread 0.287%* 0.287%* 0.285%* 0.401% 0.399%Dollar Quoted Spread 4.76¢* 4.76¢* 4.56¢* 7.56¢* 7.47¢Percent Effective
Spread0.506%* 0.450%* 0.467%* 0.396%* 0.377%
Dollar Effective Spread 9.62¢* 8.66¢* 9.07¢* 6.86¢* 6.46¢Time%:% Eff Spd >%
Quo Spd52.1%* 37.6%* 38.4%* 37.0%* 34.5%
Panel C: Realized Spread and Permanent Price Impact
Percent RealizedSpread: LR
0.142%* 0.238%* 0.197%* 0.196%* 0.154%
Percent RealizedSpread: EMO
0.089% 0.135%* 0.113%* 0.101%* 0.083%
Percent RealizedSpread: CLNV
0.132%* 0.200%* 0.172%* 0.166%* 0.140%
Percent Price Impact:LR
0.365%* 0.212% 0.271%* 0.205%* 0.223%
Percent Price Impact:EMO
0.351%* 0.277%* 0.302%* 0.238% 0.235%
Percent Price Impact:CLNV
0.357%* 0.241%* 0.285%* 0.221% 0.224%
Panel D: Depth Measures
Dollar Ask Depth(000’s)
$14.1 $14.1 $14.0* $14.0 $14.1
Dollar Bid Depth(000’s)
$13.5* $13.5* $13.4* $13.8* $14.0
Share Ask Depth 561 561 560 558 561Share Bid Depth 535* 535* 531* 551* 567
# of Trades (Millions) 33.8 33.8 33.8 29.1 33.8# of Trades Dropped
(Mil.)0.0 0.0 0.0 4.7 0.0
1770 The Journal of Finance R©
DTAQ (0.377%). Intuitively, this is due to the higher variability of the quotemidpoint due to NBBO errors in MTAQ. Excluding NBBO Crossed and Locked(0.396%) gets researchers relatively close to DTAQ, yet the difference is stillsignificant. The Dollar Quoted Spread and Dollar Effective Spread results arequalitatively similar to their Percent counterparts. The percentage of the timethat Percent Effective Spread is greater than Percent Quoted Spread is highestusing Prior Second (52.1%), declines using Same Second (37.6%), increasesslightly with Interpolated Time (38.4%), and declines when also ExcludingNBBO Crossed and Locked (37.0%). The latter is the closest to DTAQ (34.5%)using MTAQ, but the remaining difference is still significant.
C. Realized Spread and Price Impact
Panel C reports Percent Realized Spread and Percent Price Impact us-ing three trade-typing conventions: (1) Lee and Ready (1991, LR), (2) Ellis,Michaely, and O’Hara (2000, EMO), and (3) Chakrabarty et al. (2006, CLNV).All three versions of Percent Realized Spread are largest using Same Secondand decline using Interpolated Time. When NBBO crossed and locked tradesare excluded, Percent Realized Spread decreases under all three trade-typingconventions. All three versions of Percent Realized Spread are the lowest usingPrior Second, but Prior Second is still significantly different from DTAQ fortwo of the three trade-typing conventions. All three versions of Percent PriceImpact are the largest using Prior Second, decline using Same Second (withLR being insignificantly different), increase using Interpolated Time, and de-cline to the lowest when also Excluding NBBO Crossed and Locked (with twoversions being insignificantly different). Intuitively, the differences in PercentRealized Spread and Percent Price Impact across alternative MTAQ solutionsare primarily due to differences in trade typing as they impact the buy/sellindicator Dk for the kth trade. Overall, none of the MTAQ alternatives does verywell for Percent Realized Spread, but Interpolated Time and Excluding NBBOCrossed and Locked does the best for Percent Price Impact.
D. Depth
In Panel D, Dollar Ask Depth (in thousands) is nearly constant across allMTAQ alternatives and insignificantly different from DTAQ in all but onecase. The Dollar Bid Depth (in thousands) is close using the three quote timingrules ($13.4 to $13.5) and significantly different from DTAQ. It is higher whenExcluding NBBO Crossed and Locked ($13.8) and, though statistically differ-ent, it is close in economic value to DTAQ ($14.0). The Share Ask Depth andShare Bid Depth results are qualitatively similar to their Dollar counterparts.Overall, the depth differences are relatively minimal.
In summary of Table III, Interpolated Time and Exclude NBBO Crossedand Locked is the best MTAQ solution with regard to Outside the NBBO,Crossed NBBO, Percent (Dollar) Quoted Spread, and Percent (Dollar) EffectiveSpread, percent of the time Percent Effective Spread is greater than Percent
Liquidity Measurement Problems in Fast, Competitive Markets 1771
Quoted Spread and Dollar (Share) Bid Depth, and is equivalent to the otheralternatives for Dollar (Share) Ask Depth. However, this method fares less wellon Percent Realized Spread, where Prior Second is the best, and Percent PriceImpact, where Interpolated Time alone is the best.
Overall, if a researcher is financially constrained to using only MTAQ data,then the best MTAQ solution is to account for withdrawn quotes, use Interpo-lated Time, and Exclude NBBO Crossed and Locked.32 However, this is stilla second-best solution, not a first-best. It is significantly different from DTAQwith regard to Outside the NBBO, Crossed NBBO, and Percent (Dollar) Effec-tive Spread, and percent of the time Percent Effective Spread is greater thanPercent Quoted Spread, Percent Realized Spread, Percent Price Impact, andDollar (Share) Bid Depth.
E. By Trade Frequency
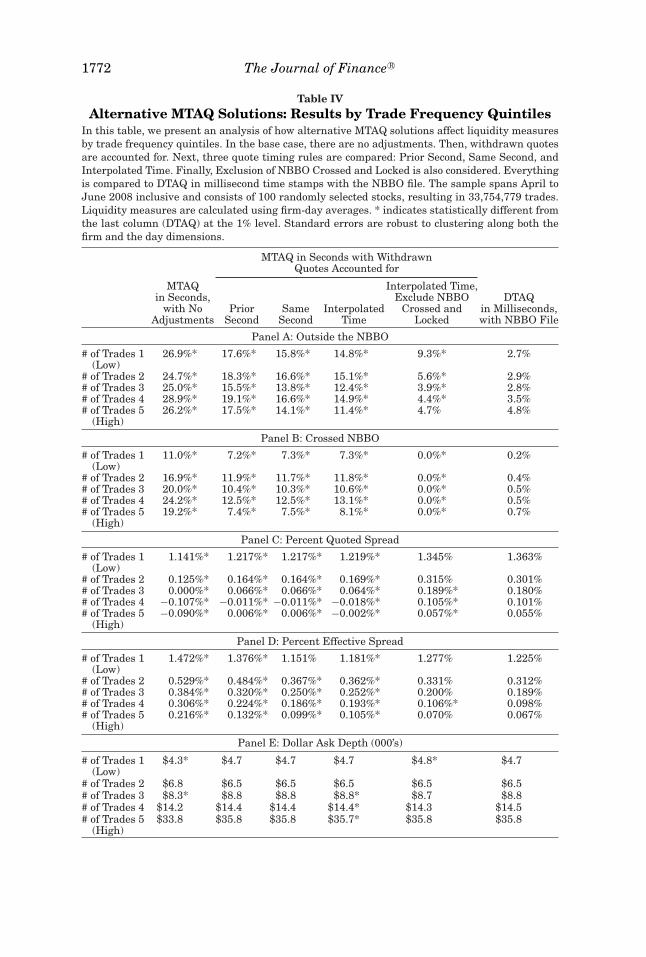
Table IV examines the robustness of the results in Table III by breakingout trade frequency quintiles based on the number of trades per day, wherequintile 1 is the lowest and quintile 5 is the highest. Panels A and B break outOutside the NBBO and Crossed NBBO by trade frequency quintiles. Withineach column, Outside the NBBO is relatively similar across trade frequencyquintiles, whereas Crossed NBBO varies modestly in a hump-shaped patternthat peaks at quintile 4. Across columns, Interpolated Time and ExcludingNBBO Crossed and Locked yields the lowest values for all quintiles among theMTAQ alternatives, but they are still significantly different from the DTAQvalues (with one exception).
Panels C and D break out Percent Quoted Spread and Percent EffectiveSpread by trade frequency quintiles. Within each column, they decrease nearlymonotonically. In the first four columns, Percent Quoted Spread crosses overinto negative values in the higher quintiles. Across columns, Interpolated Timeand Excluding NBBO Crossed and Locked yields values closest to DTAQ forall quintiles among the MTAQ alternatives and all values are strictly positive.The values for Percent Quoted Spread in the two lowest quintiles are not sta-tistically different from DTAQ values; the values for Percent Effective Spreadare not statistically different from DTAQ values in all but one trade quintile.
Panel E breaks out Dollar Ask Depth by trade frequency quintiles. Withineach column, depth increases monotonically. Across columns, there is very littledifference among the MTAQ alternatives and compared to DTAQ.
To summarize, in the first four panels, Interpolated Time and ExcludingNBBO Crossed and Locked yields values closest to DTAQ for all quintilesamong the MTAQ alternatives and eliminates negative values, but the val-ues are still significantly different from DTAQ in most cases. In the fifthpanel, depth is largely the same among the MTAQ alternatives and DTAQ.
32 The Internet Appendix considers excluding regional exchanges. We find that doing so helpsreduce liquidity measure differences relative to DTAQ, but excluding NBBO crossed and lockedtrades does better.
1772 The Journal of Finance R©
Table IVAlternative MTAQ Solutions: Results by Trade Frequency Quintiles
In this table, we present an analysis of how alternative MTAQ solutions affect liquidity measuresby trade frequency quintiles. In the base case, there are no adjustments. Then, withdrawn quotesare accounted for. Next, three quote timing rules are compared: Prior Second, Same Second, andInterpolated Time. Finally, Exclusion of NBBO Crossed and Locked is also considered. Everythingis compared to DTAQ in millisecond time stamps with the NBBO file. The sample spans April toJune 2008 inclusive and consists of 100 randomly selected stocks, resulting in 33,754,779 trades.Liquidity measures are calculated using firm-day averages. * indicates statistically different fromthe last column (DTAQ) at the 1% level. Standard errors are robust to clustering along both thefirm and the day dimensions.
MTAQ in Seconds with WithdrawnQuotes Accounted for
MTAQ Interpolated Time,in Seconds, Exclude NBBO DTAQ
with No Prior Same Interpolated Crossed and in Milliseconds,Adjustments Second Second Time Locked with NBBO File
Panel A: Outside the NBBO
# of Trades 1(Low)
26.9%* 17.6%* 15.8%* 14.8%* 9.3%* 2.7%
# of Trades 2 24.7%* 18.3%* 16.6%* 15.1%* 5.6%* 2.9%# of Trades 3 25.0%* 15.5%* 13.8%* 12.4%* 3.9%* 2.8%# of Trades 4 28.9%* 19.1%* 16.6%* 14.9%* 4.4%* 3.5%# of Trades 5
(High)26.2%* 17.5%* 14.1%* 11.4%* 4.7% 4.8%
Panel B: Crossed NBBO
# of Trades 1(Low)
11.0%* 7.2%* 7.3%* 7.3%* 0.0%* 0.2%
# of Trades 2 16.9%* 11.9%* 11.7%* 11.8%* 0.0%* 0.4%# of Trades 3 20.0%* 10.4%* 10.3%* 10.6%* 0.0%* 0.5%# of Trades 4 24.2%* 12.5%* 12.5%* 13.1%* 0.0%* 0.5%# of Trades 5
(High)19.2%* 7.4%* 7.5%* 8.1%* 0.0%* 0.7%
Panel C: Percent Quoted Spread
# of Trades 1(Low)
1.141%* 1.217%* 1.217%* 1.219%* 1.345% 1.363%
# of Trades 2 0.125%* 0.164%* 0.164%* 0.169%* 0.315% 0.301%# of Trades 3 0.000%* 0.066%* 0.066%* 0.064%* 0.189%* 0.180%# of Trades 4 −0.107%* −0.011%* −0.011%* −0.018%* 0.105%* 0.101%# of Trades 5
(High)−0.090%* 0.006%* 0.006%* −0.002%* 0.057%* 0.055%
Panel D: Percent Effective Spread
# of Trades 1(Low)
1.472%* 1.376%* 1.151% 1.181%* 1.277% 1.225%
# of Trades 2 0.529%* 0.484%* 0.367%* 0.362%* 0.331% 0.312%# of Trades 3 0.384%* 0.320%* 0.250%* 0.252%* 0.200% 0.189%# of Trades 4 0.306%* 0.224%* 0.186%* 0.193%* 0.106%* 0.098%# of Trades 5
(High)0.216%* 0.132%* 0.099%* 0.105%* 0.070% 0.067%
Panel E: Dollar Ask Depth (000’s)
# of Trades 1(Low)
$4.3* $4.7 $4.7 $4.7 $4.8* $4.7
# of Trades 2 $6.8 $6.5 $6.5 $6.5 $6.5 $6.5# of Trades 3 $8.3* $8.8 $8.8 $8.8* $8.7 $8.8# of Trades 4 $14.2 $14.4 $14.4 $14.4* $14.3 $14.5# of Trades 5
(High)$33.8 $35.8 $35.8 $35.7* $35.8 $35.8
Liquidity Measurement Problems in Fast, Competitive Markets 1773
Thus, the conclusion that we draw from Table III, that the best MTAQ so-lution is to account for withdrawn quotes, use Interpolated Time, and ex-clude NBBO crossed and locked, is found in Table IV to be robust by tradefrequency.
F. Trade Classification
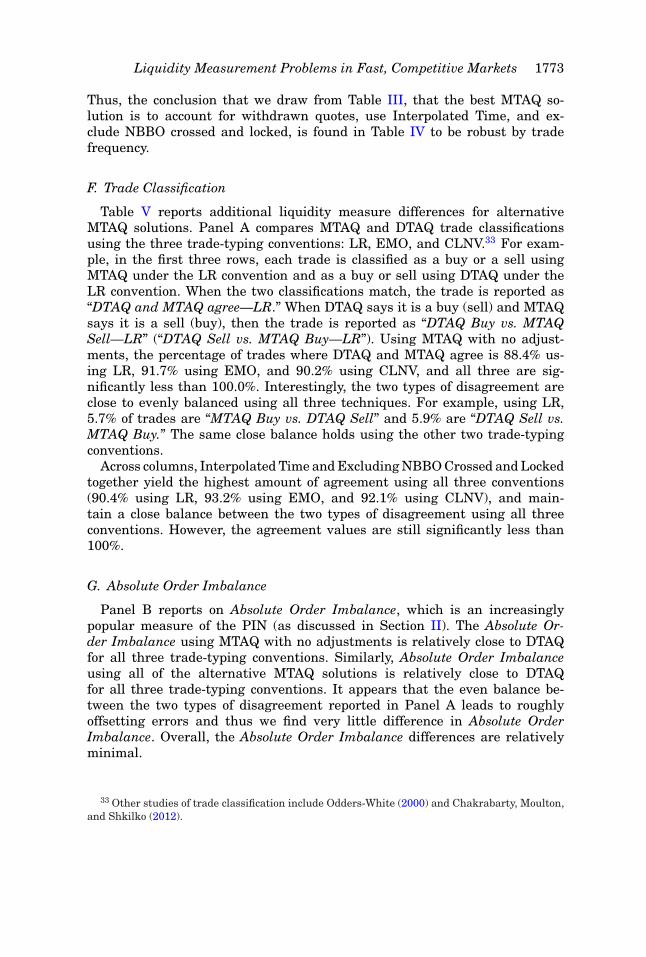
Table V reports additional liquidity measure differences for alternativeMTAQ solutions. Panel A compares MTAQ and DTAQ trade classificationsusing the three trade-typing conventions: LR, EMO, and CLNV.33 For exam-ple, in the first three rows, each trade is classified as a buy or a sell usingMTAQ under the LR convention and as a buy or sell using DTAQ under theLR convention. When the two classifications match, the trade is reported as“DTAQ and MTAQ agree—LR.” When DTAQ says it is a buy (sell) and MTAQsays it is a sell (buy), then the trade is reported as “DTAQ Buy vs. MTAQSell—LR” (“DTAQ Sell vs. MTAQ Buy—LR”). Using MTAQ with no adjust-ments, the percentage of trades where DTAQ and MTAQ agree is 88.4% us-ing LR, 91.7% using EMO, and 90.2% using CLNV, and all three are sig-nificantly less than 100.0%. Interestingly, the two types of disagreement areclose to evenly balanced using all three techniques. For example, using LR,5.7% of trades are “MTAQ Buy vs. DTAQ Sell” and 5.9% are “DTAQ Sell vs.MTAQ Buy.” The same close balance holds using the other two trade-typingconventions.
Across columns, Interpolated Time and Excluding NBBO Crossed and Lockedtogether yield the highest amount of agreement using all three conventions(90.4% using LR, 93.2% using EMO, and 92.1% using CLNV), and main-tain a close balance between the two types of disagreement using all threeconventions. However, the agreement values are still significantly less than100%.
G. Absolute Order Imbalance
Panel B reports on Absolute Order Imbalance, which is an increasinglypopular measure of the PIN (as discussed in Section II). The Absolute Or-der Imbalance using MTAQ with no adjustments is relatively close to DTAQfor all three trade-typing conventions. Similarly, Absolute Order Imbalanceusing all of the alternative MTAQ solutions is relatively close to DTAQfor all three trade-typing conventions. It appears that the even balance be-tween the two types of disagreement reported in Panel A leads to roughlyoffsetting errors and thus we find very little difference in Absolute OrderImbalance. Overall, the Absolute Order Imbalance differences are relativelyminimal.
33 Other studies of trade classification include Odders-White (2000) and Chakrabarty, Moulton,and Shkilko (2012).
1774 The Journal of Finance R©
Tab
leV
Alt
ern
ativ
eM
TA
QS
olu
tion
s:T
rad
eC
lass
ifica
tion
and
Ab
solu
teO
rder
Imb
alan
ceR
esu
lts
Inth
ista
ble,
we
pres
ent
trad
ecl
assi
fica
tion
diff
eren
ces
betw
een
DT
AQ
and
MT
AQ
and
Abs
olu
teO
rder
Imba
lan
ceu
nde
ral
tern
ativ
eM
TA
Qso
luti
ons
and
DT
AQ
.In
the
base
case
,th
ere
are
no
adju
stm
ents
.Th
en,w
ith
draw
nqu
otes
are
acco
un
ted
for.
Nex
t,th
ree
quot
eti
min
gru
les
are
com
pare
d:P
rior
Sec
ond,
Sam
eS
econ
d,an
dIn
terp
olat
edT
ime.
Fin
ally
,Exc
lusi
onof
NB
BO
Cro
ssed
and
Loc
ked
isal
soco
nsi
dere
d.E
very
thin
gis
com
pare
dto
DT
AQ
inm
illi
seco
nds
wit
hth
eN
BB
Ofi
le.T
he
sam
ple
span
sA
pril
toJu
ne
2008
incl
usi
vean
dco
nsi
sts
of10
0ra
ndo
mly
sele
cted
stoc
ks,r
esu
ltin
gin
33,7
54,7
79tr
ades
.All
mea
sure
sar
eca
lcu
late
du
sin
gfi
rm-d
ayav
erag
es.I
nP
anel
A,*
for
“DT
AQ
and
MT
AQ
agre
e”in
dica
tes
stat
isti
call
ydi
ffer
ent
from
100%
and
*fo
r“D
TA
QB
uy
vs.M
TA
QS
ell”
and
“DT
AQ
Sel
lvs
.MT
AQ
Bu
y”in
dica
tes
stat
isti
call
ydi
ffer
ent
from
0%.I
nP
anel
B,*
indi
cate
sst
atis
tica
lly
diff
eren
tfr
omth
ela
stco
lum
n(D
TA
Q)
atth
e1%
leve
l.S
tan
dard
erro
rsar
ero
bust
tocl
ust
erin
gal
ong
both
the
firm
and
the
day
dim
ensi
ons.
MT
AQ
inS
econ
dsw
ith
Wit
hdr
awn
Qu
otes
Acc
oun
ted
for
MT
AQ
Inte
rpol
ated
Tim
e,in
Sec
onds
,E
xclu
deN
BB
OD
TA
Qw
ith
No
Pri
orS
ame
Inte
rpol
ated
Cro
ssed
and
inM
illi
seco
nds
,A
dju
stm
ents
Sec
ond
Sec
ond
Tim
eL
ocke
dw
ith
NB
BO
Fil
e
Pan
elA
:Tra
deC
lass
ifica
tion
Dif
fere
nce
sbe
twee
nD
TA
Qan
dM
TA
Q
DT
AQ
and
MT
AQ
agre
e—L
R88
.4%
*89
.4%
*83
.5%
*89
.5%
*90
.4%
*D
TA
QB
uy
vs.M
TA
QS
ell—
LR
5.7%
*5.
5%*
8.9%
*5.
8%*
5.3%
*D
TA
QS
ellv
s.M
TA
QB
uy—
LR
5.9%
*5.
1%*
7.6%
*4.
7%*
4.2%
*D
TA
Qan
dM
TA
Qag
ree—
EM
O91
.7%
*92
.2%
*88
.6%
*92
.7%
*93
.2%
*D
TA
QB
uy
vs.M
TA
QS
ell—
EM
O4.
1%*
4.1%
*6.
0%*
3.9%
*3.
6%*
DT
AQ
Sel
lvs.
MT
AQ
Bu
y—E
MO
4.2%
*3.
7%*
5.4%
*3.
4%*
3.2%
*D
TA
Qan
dM
TA
Qag
ree—
CL
NV
90.2
%*
91.1
%*
86.8
%*
91.4
%*
92.1
%*
DT
AQ
Bu
yvs
.MT
AQ
Sel
l—C
LN
V4.
8%*
4.6%
*7.
0%*
4.6%
*4.
2%*
DT
AQ
Sel
lvs.
MT
AQ
Bu
y—C
LN
V4.
9%*
4.3%
*6.
2%*
4.0%
*3.
7%*
Pan
elB
:Abs
olu
teO
rder
Imba
lan
ce
Abs
olu
teO
rder
Imba
lan
ce:L
R12
.6%
13.0
%*
13.7
%*
12.8
%13
.9%
*12
.6%
Abs
olu
teO
rder
Imba
lan
ce:E
MO
11.2
%11
.4%
*10
.7%
10.7
%*
11.4
%*
11.0
%A
bsol
ute
Ord
erIm
bala
nce
:CL
NV
12.0
%*
12.4
%12
.2%
12.0
%*
12.7
%*
12.2
%
#of
Trad
es(M
illi
ons)
33.8
33.8
33.8
33.8
29.1
33.8
#of
Trad
esD
ropp
ed(M
illi
ons)
0.0
0.0
0.0
0.0
4.7
0.0
Liquidity Measurement Problems in Fast, Competitive Markets 1775
IX. Does Methodology Affect Research Inference?Case 1: Hybrid Market Reform
This section examines whether the three different methods we consider(MTAQ with no adjustments,34 DTAQ, and MTAQ with our recommended ad-justments) yield different research inferences. In particular, we reexamine theanalysis of HM, who conduct an event study around NYSE’s Hybrid Marketreform, which significantly increased the exchange’s automation and speed.
We select the HM study because implementation of the Hybrid Market iswhen the NYSE converted a significant fraction of its floor trading to electronictrading. HM find that floor trading declined from 17% of NYSE trading pre-Hybrid to 9% post-Hybrid and that the average time to execute a market orderdeclined from 10 seconds pre-Hybrid to one second post-Hybrid.
Hybrid Market implementation was rolled out stock-by-stock over October2006 to January 2007. HM analyze a sample of 400 stocks listed on the NYSEbefore and after each individual stock’s switch to Hybrid. They also comparethese NYSE stocks to 400 stocks listed on NASDAQ that are matched by sizeand price. This allows them to compute a difference-in-difference of Percent Ef-fective Spread, which controls for any time trends unrelated to Hybrid Marketimplementation. HM generously make their list of NYSE stocks, the Hybridevent date for each individual stock, and their list of matching NASDAQ stocksavailable online.35
HM match trades to NYSE quotes only, not to NBBO quotes. By focusingon NYSE-only trades and quotes, HM may well have sidestepped the mostegregious withdrawn/canceled quote problems, if they were a bigger problemon other exchanges. It was sufficient for HM to have used NYSE quotes onlybecause, during this period, NYSE still held a dominant position,36 even thoughit had already started its downward slide.
We replicate the HM study in three ways, all of which are different fromwhat HM did: (i) using the “conventional” MTAQ methods (NBBO across allmarkets, no adjustments for withdrawn quotes, etc.); (ii) using the first-bestDTAQ approach; and (iii) using the second-best adjusted MTAQ approach.Table VI reports results for these three methods and reproduces the originalHM results. Panel A reports Percent Effective Spread of the NYSE stocks overthe 20 days preceding Hybrid activation (pre-Hybrid) and the 20 days immedi-ately following Hybrid activation (post-Hybrid). The change in Percent EffectiveSpread using MTAQ with no adjustments is 0.7 basis points, but this change isinsignificant (p-value = 0.1971).37 By contrast, using both the DTAQ first-best
34 In other words, the standard way MTAQ is used in the literature. This includes all of thestandard screens described in Section III.
35 See http://www.hotelschool.cornell.edu/research/facultybios/research-papers/p-moulton-research.html.
36 Specifically, AHS report that, during this period, NYSE’s market share was 55% and Wolfe(2010) reports that, during this period, NYSE’s information share (i.e., percentage contribution toprice discovery) in Dow Jones Industrial Average stocks ranged from 74% to 88%.
37 We follow HM and calculate equal-weighted effective spreads and t-statistics using nonclus-tered standard errors.
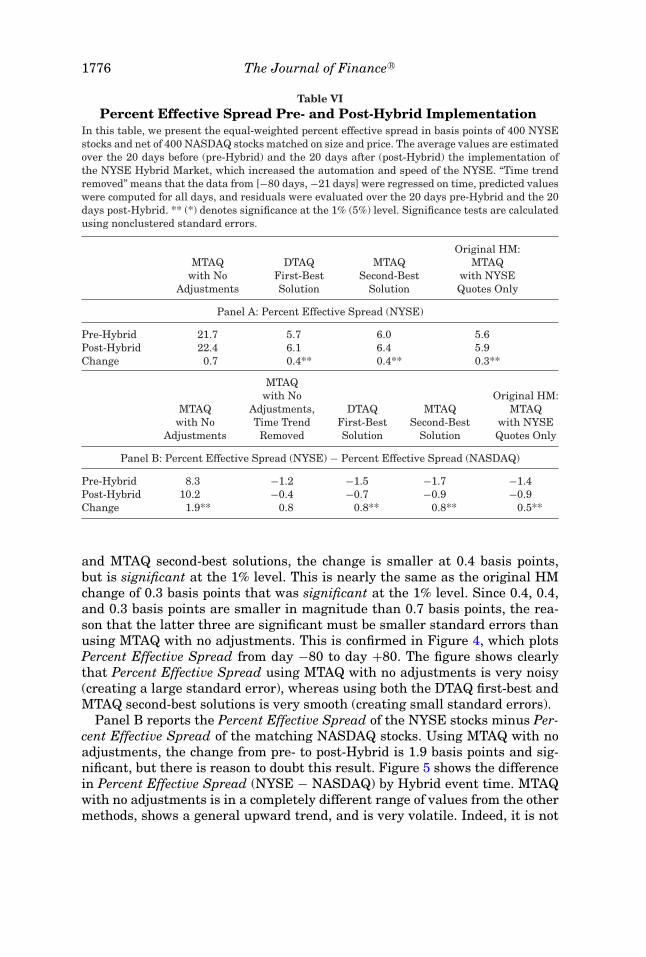
1776 The Journal of Finance R©
Table VIPercent Effective Spread Pre- and Post-Hybrid Implementation
In this table, we present the equal-weighted percent effective spread in basis points of 400 NYSEstocks and net of 400 NASDAQ stocks matched on size and price. The average values are estimatedover the 20 days before (pre-Hybrid) and the 20 days after (post-Hybrid) the implementation ofthe NYSE Hybrid Market, which increased the automation and speed of the NYSE. “Time trendremoved” means that the data from [−80 days, −21 days] were regressed on time, predicted valueswere computed for all days, and residuals were evaluated over the 20 days pre-Hybrid and the 20days post-Hybrid. ** (*) denotes significance at the 1% (5%) level. Significance tests are calculatedusing nonclustered standard errors.
Original HM:MTAQ DTAQ MTAQ MTAQ
with No First-Best Second-Best with NYSEAdjustments Solution Solution Quotes Only
Panel A: Percent Effective Spread (NYSE)
Pre-Hybrid 21.7 5.7 6.0 5.6Post-Hybrid 22.4 6.1 6.4 5.9Change 0.7 0.4** 0.4** 0.3**
MTAQwith No Original HM:
MTAQ Adjustments, DTAQ MTAQ MTAQwith No Time Trend First-Best Second-Best with NYSE
Adjustments Removed Solution Solution Quotes Only
Panel B: Percent Effective Spread (NYSE) − Percent Effective Spread (NASDAQ)
Pre-Hybrid 8.3 −1.2 −1.5 −1.7 −1.4Post-Hybrid 10.2 −0.4 −0.7 −0.9 −0.9Change 1.9** 0.8 0.8** 0.8** 0.5**
and MTAQ second-best solutions, the change is smaller at 0.4 basis points,but is significant at the 1% level. This is nearly the same as the original HMchange of 0.3 basis points that was significant at the 1% level. Since 0.4, 0.4,and 0.3 basis points are smaller in magnitude than 0.7 basis points, the rea-son that the latter three are significant must be smaller standard errors thanusing MTAQ with no adjustments. This is confirmed in Figure 4, which plotsPercent Effective Spread from day −80 to day +80. The figure shows clearlythat Percent Effective Spread using MTAQ with no adjustments is very noisy(creating a large standard error), whereas using both the DTAQ first-best andMTAQ second-best solutions is very smooth (creating small standard errors).
Panel B reports the Percent Effective Spread of the NYSE stocks minus Per-cent Effective Spread of the matching NASDAQ stocks. Using MTAQ with noadjustments, the change from pre- to post-Hybrid is 1.9 basis points and sig-nificant, but there is reason to doubt this result. Figure 5 shows the differencein Percent Effective Spread (NYSE − NASDAQ) by Hybrid event time. MTAQwith no adjustments is in a completely different range of values from the othermethods, shows a general upward trend, and is very volatile. Indeed, it is not
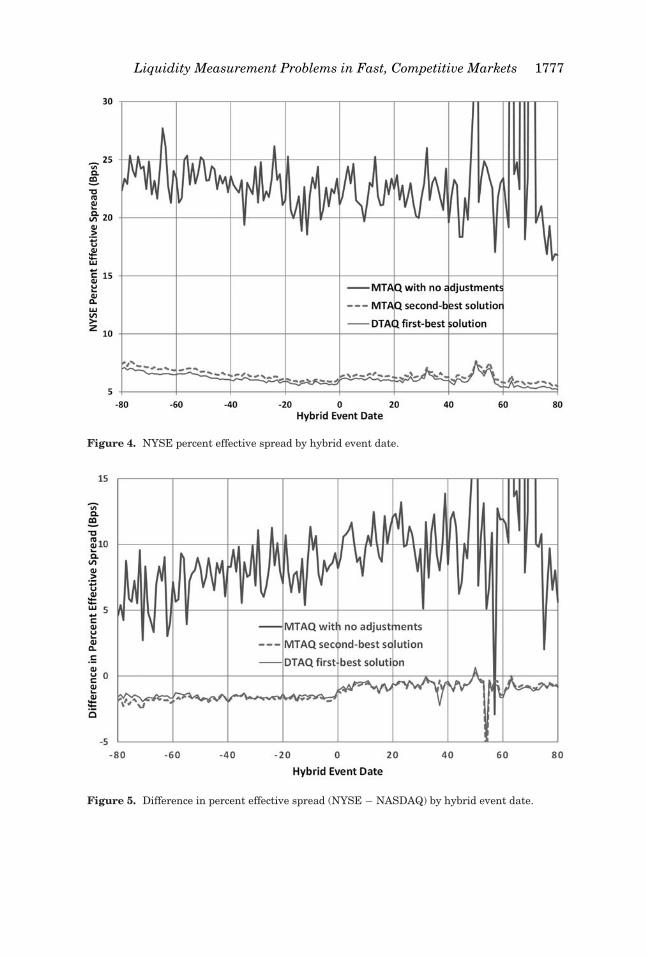
Liquidity Measurement Problems in Fast, Competitive Markets 1777
Figure 4. NYSE percent effective spread by hybrid event date.
Figure 5. Difference in percent effective spread (NYSE − NASDAQ) by hybrid event date.
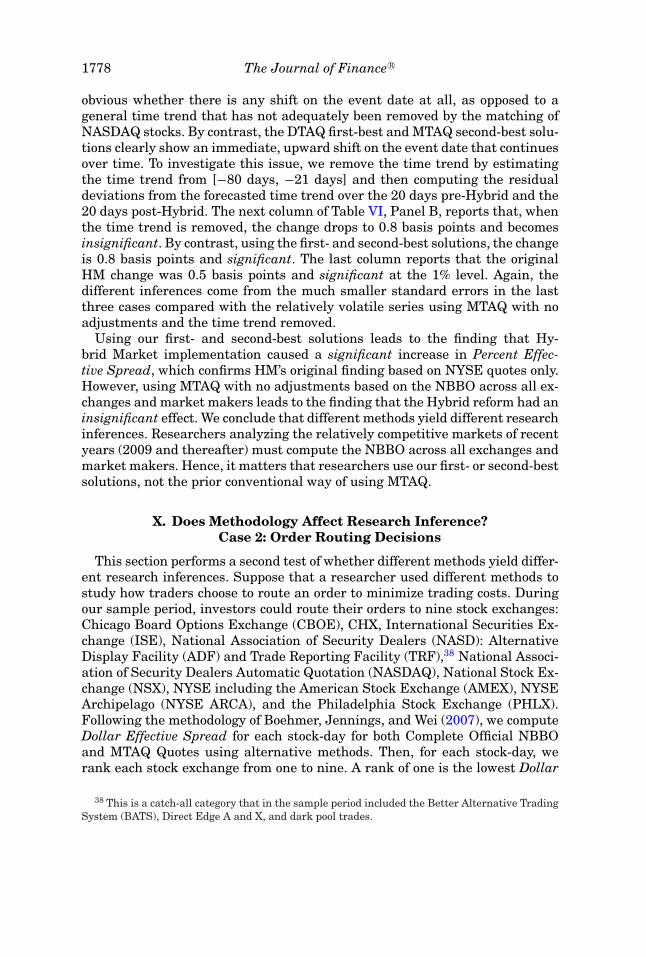
1778 The Journal of Finance R©
obvious whether there is any shift on the event date at all, as opposed to ageneral time trend that has not adequately been removed by the matching ofNASDAQ stocks. By contrast, the DTAQ first-best and MTAQ second-best solu-tions clearly show an immediate, upward shift on the event date that continuesover time. To investigate this issue, we remove the time trend by estimatingthe time trend from [−80 days, −21 days] and then computing the residualdeviations from the forecasted time trend over the 20 days pre-Hybrid and the20 days post-Hybrid. The next column of Table VI, Panel B, reports that, whenthe time trend is removed, the change drops to 0.8 basis points and becomesinsignificant. By contrast, using the first- and second-best solutions, the changeis 0.8 basis points and significant. The last column reports that the originalHM change was 0.5 basis points and significant at the 1% level. Again, thedifferent inferences come from the much smaller standard errors in the lastthree cases compared with the relatively volatile series using MTAQ with noadjustments and the time trend removed.
Using our first- and second-best solutions leads to the finding that Hy-brid Market implementation caused a significant increase in Percent Effec-tive Spread, which confirms HM’s original finding based on NYSE quotes only.However, using MTAQ with no adjustments based on the NBBO across all ex-changes and market makers leads to the finding that the Hybrid reform had aninsignificant effect. We conclude that different methods yield different researchinferences. Researchers analyzing the relatively competitive markets of recentyears (2009 and thereafter) must compute the NBBO across all exchanges andmarket makers. Hence, it matters that researchers use our first- or second-bestsolutions, not the prior conventional way of using MTAQ.
X. Does Methodology Affect Research Inference?Case 2: Order Routing Decisions
This section performs a second test of whether different methods yield differ-ent research inferences. Suppose that a researcher used different methods tostudy how traders choose to route an order to minimize trading costs. Duringour sample period, investors could route their orders to nine stock exchanges:Chicago Board Options Exchange (CBOE), CHX, International Securities Ex-change (ISE), National Association of Security Dealers (NASD): AlternativeDisplay Facility (ADF) and Trade Reporting Facility (TRF),38 National Associ-ation of Security Dealers Automatic Quotation (NASDAQ), National Stock Ex-change (NSX), NYSE including the American Stock Exchange (AMEX), NYSEArchipelago (NYSE ARCA), and the Philadelphia Stock Exchange (PHLX).Following the methodology of Boehmer, Jennings, and Wei (2007), we computeDollar Effective Spread for each stock-day for both Complete Official NBBOand MTAQ Quotes using alternative methods. Then, for each stock-day, werank each stock exchange from one to nine. A rank of one is the lowest Dollar
38 This is a catch-all category that in the sample period included the Better Alternative TradingSystem (BATS), Direct Edge A and X, and dark pool trades.
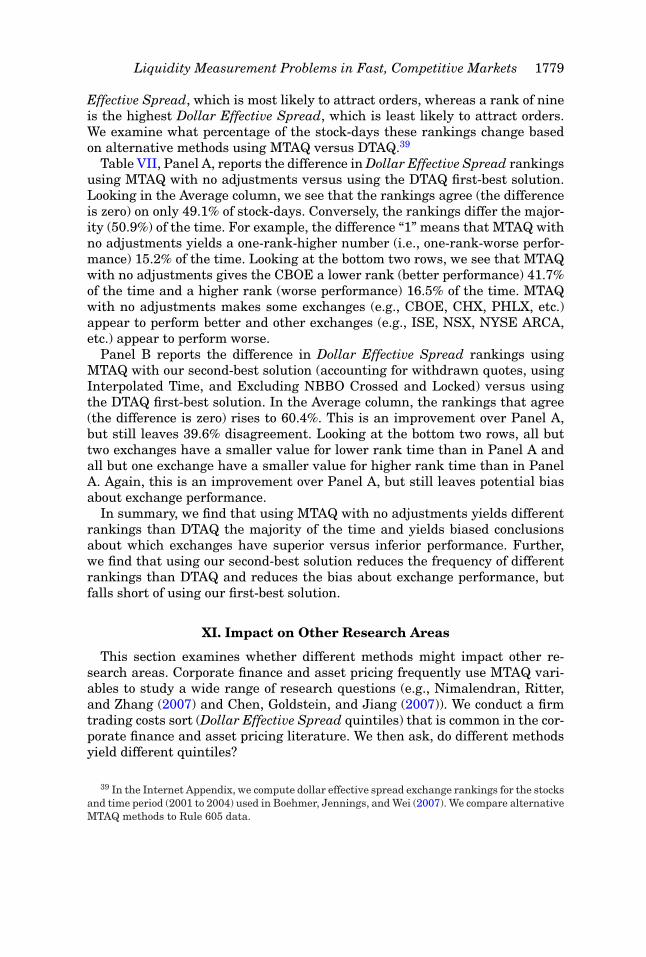
Liquidity Measurement Problems in Fast, Competitive Markets 1779
Effective Spread, which is most likely to attract orders, whereas a rank of nineis the highest Dollar Effective Spread, which is least likely to attract orders.We examine what percentage of the stock-days these rankings change basedon alternative methods using MTAQ versus DTAQ.39
Table VII, Panel A, reports the difference in Dollar Effective Spread rankingsusing MTAQ with no adjustments versus using the DTAQ first-best solution.Looking in the Average column, we see that the rankings agree (the differenceis zero) on only 49.1% of stock-days. Conversely, the rankings differ the major-ity (50.9%) of the time. For example, the difference “1” means that MTAQ withno adjustments yields a one-rank-higher number (i.e., one-rank-worse perfor-mance) 15.2% of the time. Looking at the bottom two rows, we see that MTAQwith no adjustments gives the CBOE a lower rank (better performance) 41.7%of the time and a higher rank (worse performance) 16.5% of the time. MTAQwith no adjustments makes some exchanges (e.g., CBOE, CHX, PHLX, etc.)appear to perform better and other exchanges (e.g., ISE, NSX, NYSE ARCA,etc.) appear to perform worse.
Panel B reports the difference in Dollar Effective Spread rankings usingMTAQ with our second-best solution (accounting for withdrawn quotes, usingInterpolated Time, and Excluding NBBO Crossed and Locked) versus usingthe DTAQ first-best solution. In the Average column, the rankings that agree(the difference is zero) rises to 60.4%. This is an improvement over Panel A,but still leaves 39.6% disagreement. Looking at the bottom two rows, all buttwo exchanges have a smaller value for lower rank time than in Panel A andall but one exchange have a smaller value for higher rank time than in PanelA. Again, this is an improvement over Panel A, but still leaves potential biasabout exchange performance.
In summary, we find that using MTAQ with no adjustments yields differentrankings than DTAQ the majority of the time and yields biased conclusionsabout which exchanges have superior versus inferior performance. Further,we find that using our second-best solution reduces the frequency of differentrankings than DTAQ and reduces the bias about exchange performance, butfalls short of using our first-best solution.
XI. Impact on Other Research Areas
This section examines whether different methods might impact other re-search areas. Corporate finance and asset pricing frequently use MTAQ vari-ables to study a wide range of research questions (e.g., Nimalendran, Ritter,and Zhang (2007) and Chen, Goldstein, and Jiang (2007)). We conduct a firmtrading costs sort (Dollar Effective Spread quintiles) that is common in the cor-porate finance and asset pricing literature. We then ask, do different methodsyield different quintiles?
39 In the Internet Appendix, we compute dollar effective spread exchange rankings for the stocksand time period (2001 to 2004) used in Boehmer, Jennings, and Wei (2007). We compare alternativeMTAQ methods to Rule 605 data.
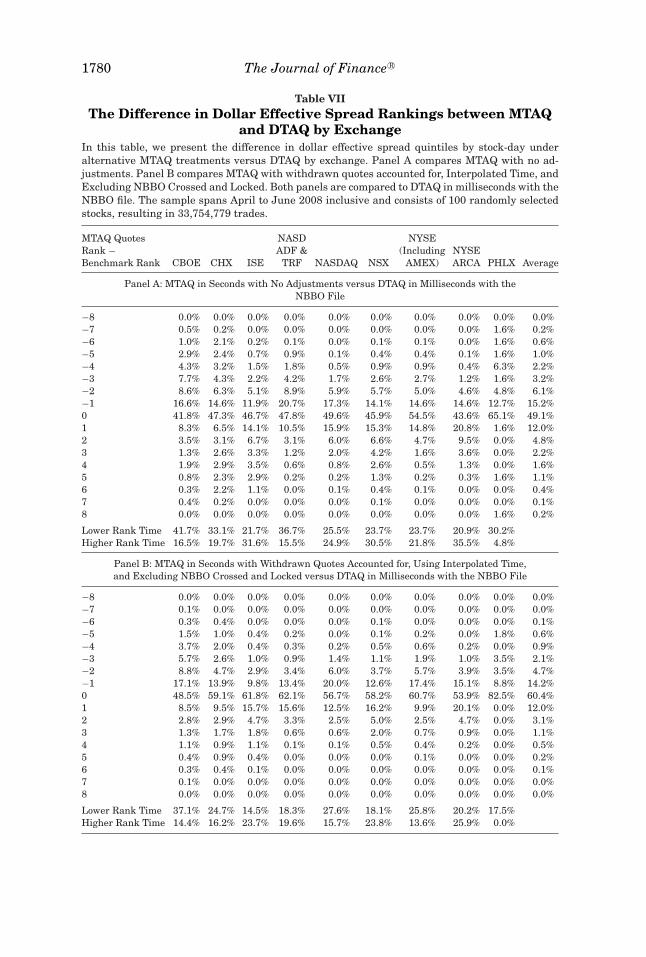
1780 The Journal of Finance R©
Table VIIThe Difference in Dollar Effective Spread Rankings between MTAQ
and DTAQ by ExchangeIn this table, we present the difference in dollar effective spread quintiles by stock-day underalternative MTAQ treatments versus DTAQ by exchange. Panel A compares MTAQ with no ad-justments. Panel B compares MTAQ with withdrawn quotes accounted for, Interpolated Time, andExcluding NBBO Crossed and Locked. Both panels are compared to DTAQ in milliseconds with theNBBO file. The sample spans April to June 2008 inclusive and consists of 100 randomly selectedstocks, resulting in 33,754,779 trades.
MTAQ Quotes NASD NYSERank − ADF & (Including NYSEBenchmark Rank CBOE CHX ISE TRF NASDAQ NSX AMEX) ARCA PHLX Average
Panel A: MTAQ in Seconds with No Adjustments versus DTAQ in Milliseconds with theNBBO File
−8 0.0% 0.0% 0.0% 0.0% 0.0% 0.0% 0.0% 0.0% 0.0% 0.0%−7 0.5% 0.2% 0.0% 0.0% 0.0% 0.0% 0.0% 0.0% 1.6% 0.2%−6 1.0% 2.1% 0.2% 0.1% 0.0% 0.1% 0.1% 0.0% 1.6% 0.6%−5 2.9% 2.4% 0.7% 0.9% 0.1% 0.4% 0.4% 0.1% 1.6% 1.0%−4 4.3% 3.2% 1.5% 1.8% 0.5% 0.9% 0.9% 0.4% 6.3% 2.2%−3 7.7% 4.3% 2.2% 4.2% 1.7% 2.6% 2.7% 1.2% 1.6% 3.2%−2 8.6% 6.3% 5.1% 8.9% 5.9% 5.7% 5.0% 4.6% 4.8% 6.1%−1 16.6% 14.6% 11.9% 20.7% 17.3% 14.1% 14.6% 14.6% 12.7% 15.2%0 41.8% 47.3% 46.7% 47.8% 49.6% 45.9% 54.5% 43.6% 65.1% 49.1%1 8.3% 6.5% 14.1% 10.5% 15.9% 15.3% 14.8% 20.8% 1.6% 12.0%2 3.5% 3.1% 6.7% 3.1% 6.0% 6.6% 4.7% 9.5% 0.0% 4.8%3 1.3% 2.6% 3.3% 1.2% 2.0% 4.2% 1.6% 3.6% 0.0% 2.2%4 1.9% 2.9% 3.5% 0.6% 0.8% 2.6% 0.5% 1.3% 0.0% 1.6%5 0.8% 2.3% 2.9% 0.2% 0.2% 1.3% 0.2% 0.3% 1.6% 1.1%6 0.3% 2.2% 1.1% 0.0% 0.1% 0.4% 0.1% 0.0% 0.0% 0.4%7 0.4% 0.2% 0.0% 0.0% 0.0% 0.1% 0.0% 0.0% 0.0% 0.1%8 0.0% 0.0% 0.0% 0.0% 0.0% 0.0% 0.0% 0.0% 1.6% 0.2%
Lower Rank Time 41.7% 33.1% 21.7% 36.7% 25.5% 23.7% 23.7% 20.9% 30.2%Higher Rank Time 16.5% 19.7% 31.6% 15.5% 24.9% 30.5% 21.8% 35.5% 4.8%
Panel B: MTAQ in Seconds with Withdrawn Quotes Accounted for, Using Interpolated Time,and Excluding NBBO Crossed and Locked versus DTAQ in Milliseconds with the NBBO File
−8 0.0% 0.0% 0.0% 0.0% 0.0% 0.0% 0.0% 0.0% 0.0% 0.0%−7 0.1% 0.0% 0.0% 0.0% 0.0% 0.0% 0.0% 0.0% 0.0% 0.0%−6 0.3% 0.4% 0.0% 0.0% 0.0% 0.1% 0.0% 0.0% 0.0% 0.1%−5 1.5% 1.0% 0.4% 0.2% 0.0% 0.1% 0.2% 0.0% 1.8% 0.6%−4 3.7% 2.0% 0.4% 0.3% 0.2% 0.5% 0.6% 0.2% 0.0% 0.9%−3 5.7% 2.6% 1.0% 0.9% 1.4% 1.1% 1.9% 1.0% 3.5% 2.1%−2 8.8% 4.7% 2.9% 3.4% 6.0% 3.7% 5.7% 3.9% 3.5% 4.7%−1 17.1% 13.9% 9.8% 13.4% 20.0% 12.6% 17.4% 15.1% 8.8% 14.2%0 48.5% 59.1% 61.8% 62.1% 56.7% 58.2% 60.7% 53.9% 82.5% 60.4%1 8.5% 9.5% 15.7% 15.6% 12.5% 16.2% 9.9% 20.1% 0.0% 12.0%2 2.8% 2.9% 4.7% 3.3% 2.5% 5.0% 2.5% 4.7% 0.0% 3.1%3 1.3% 1.7% 1.8% 0.6% 0.6% 2.0% 0.7% 0.9% 0.0% 1.1%4 1.1% 0.9% 1.1% 0.1% 0.1% 0.5% 0.4% 0.2% 0.0% 0.5%5 0.4% 0.9% 0.4% 0.0% 0.0% 0.0% 0.1% 0.0% 0.0% 0.2%6 0.3% 0.4% 0.1% 0.0% 0.0% 0.0% 0.0% 0.0% 0.0% 0.1%7 0.1% 0.0% 0.0% 0.0% 0.0% 0.0% 0.0% 0.0% 0.0% 0.0%8 0.0% 0.0% 0.0% 0.0% 0.0% 0.0% 0.0% 0.0% 0.0% 0.0%
Lower Rank Time 37.1% 24.7% 14.5% 18.3% 27.6% 18.1% 25.8% 20.2% 17.5%Higher Rank Time 14.4% 16.2% 23.7% 19.6% 15.7% 23.8% 13.6% 25.9% 0.0%
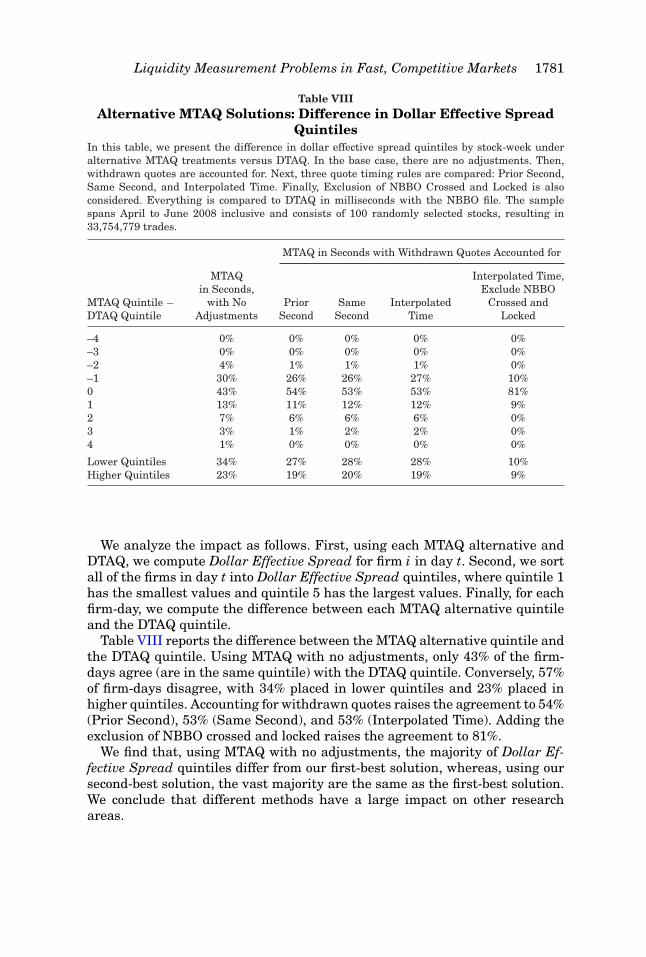
Liquidity Measurement Problems in Fast, Competitive Markets 1781
Table VIIIAlternative MTAQ Solutions: Difference in Dollar Effective Spread
QuintilesIn this table, we present the difference in dollar effective spread quintiles by stock-week underalternative MTAQ treatments versus DTAQ. In the base case, there are no adjustments. Then,withdrawn quotes are accounted for. Next, three quote timing rules are compared: Prior Second,Same Second, and Interpolated Time. Finally, Exclusion of NBBO Crossed and Locked is alsoconsidered. Everything is compared to DTAQ in milliseconds with the NBBO file. The samplespans April to June 2008 inclusive and consists of 100 randomly selected stocks, resulting in33,754,779 trades.
MTAQ in Seconds with Withdrawn Quotes Accounted for
MTAQ Interpolated Time,in Seconds, Exclude NBBO
MTAQ Quintile − with No Prior Same Interpolated Crossed andDTAQ Quintile Adjustments Second Second Time Locked
–4 0% 0% 0% 0% 0%–3 0% 0% 0% 0% 0%–2 4% 1% 1% 1% 0%–1 30% 26% 26% 27% 10%0 43% 54% 53% 53% 81%1 13% 11% 12% 12% 9%2 7% 6% 6% 6% 0%3 3% 1% 2% 2% 0%4 1% 0% 0% 0% 0%
Lower Quintiles 34% 27% 28% 28% 10%Higher Quintiles 23% 19% 20% 19% 9%
We analyze the impact as follows. First, using each MTAQ alternative andDTAQ, we compute Dollar Effective Spread for firm i in day t. Second, we sortall of the firms in day t into Dollar Effective Spread quintiles, where quintile 1has the smallest values and quintile 5 has the largest values. Finally, for eachfirm-day, we compute the difference between each MTAQ alternative quintileand the DTAQ quintile.
Table VIII reports the difference between the MTAQ alternative quintile andthe DTAQ quintile. Using MTAQ with no adjustments, only 43% of the firm-days agree (are in the same quintile) with the DTAQ quintile. Conversely, 57%of firm-days disagree, with 34% placed in lower quintiles and 23% placed inhigher quintiles. Accounting for withdrawn quotes raises the agreement to 54%(Prior Second), 53% (Same Second), and 53% (Interpolated Time). Adding theexclusion of NBBO crossed and locked raises the agreement to 81%.
We find that, using MTAQ with no adjustments, the majority of Dollar Ef-fective Spread quintiles differ from our first-best solution, whereas, using oursecond-best solution, the vast majority are the same as the first-best solution.We conclude that different methods have a large impact on other researchareas.
1782 The Journal of Finance R©
XII. The Ultimate Breakdown of the NBBO
Hasbrouck and Saar (2010) provide evidence that some traders are respond-ing to market events in milliseconds. Specifically, they find that, after a quoteimproves or deteriorates, there is a peak in the hazard rate two to three millisec-onds later for limit order submission, limit order cancellation, and execution atthe updated quoted price. In other words, current trading algorithms are ableto observe the market event, process the information, and take action in abouttwo to three milliseconds.
There is every reason to believe that response times will get faster in thedecades ahead. Moore (1965) (“Moore’s Law”) and other similar formulationshave found evidence that, over the past half-century, there has been an expo-nential increase in computing power (as measured by CPU speed per dollar,memory capacity per dollar, hard disk capacity per dollar, etc.) and an exponen-tial increase in network power (as measured by internet backbone bandwidth,wireless network speeds, network latency, etc.). This has fueled a competitive“arms race” by proprietary trading firms to continually reduce network latencyand increase processing speed in order to leapfrog the competition (see Aldridge(2009)). Projecting these trends into the future, response times will likely accel-erate into microseconds (10−6 seconds) in the late 2010s and into nanoseconds(10−9 seconds) in the 2020s.
As response times accelerate, we predict that the fundamental legal andeconomic concept of the NBBO will ultimately break down.40 In 1687, Sir IsaacNewton published his seminal book on the law of gravity, which is based on aframework of absolute time and space that is independent of any observer. Ina Newtonian universe, it would be possible for bid and offer update messagesto travel arbitrarily fast so there could always exist a common NBBO for alleconomic agents in all locations.41 However, in 1905, Albert Einstein publishedhis special theory of relativity in which time and space differ depending onthe relative motion of each observer. Critically, the special theory of relativityyields the fundamental result that no physical entity can travel faster thanthe speed of light (186,282 miles per second). In an Einsteinian universe, abid and offer update message could not travel faster than the speed of light sohigh-speed traders face immutable lag times in receiving bid and offer updatesfrom remotely located exchanges.42
40 Macey and O’Hara (1997) note that the broker’s fundamental legal obligation of providing“best execution” for the client (the trader) is complex and hard to define, but has generally beeninterpreted by the courts as requiring that the trader at least get the NBBO.
41 Indeed, there could always exist a common best bid and offer throughout the entire universe.Stocks crossed-listed on exchanges all over the universe could trade at the Universal Best Bid andOffer.
42 The lag times could be viewed as endogenous. For example, an exchange might strategicallydecide to move its data center closer to the data centers of other exchanges in order to reduce mostlag times.
Liquidity Measurement Problems in Fast, Competitive Markets 1783
Consider a trading algorithm colocated43 with the servers of the CHX anda second trading algorithm colocated with the servers of the NYSE. Suppose,for a particular security for a five millisecond period leading up to 9:47:25.000,both locations observe that the best ask is $47.10 and the best bid is $47.00.Then, one millisecond later at 9:47:25.001, the trading algorithm in Chicagosubmits a limit sell at $47.09, which improves the CHX ask price. Then, onemillisecond later at 9:47:25.002, the trading algorithm in New York submitsa market buy to the NYSE. Chicago and New York are 790 miles apart, orequivalently, 4.24 milliseconds apart when traveling at the speed of light. Atthat moment (9:47:25.002), it is physically impossible for a message about theimproved CHX ask price to have traveled the 790 miles in just one millisecondto inform the matching engine on the NYSE, so the market buy is executed atthe unimproved NYSE ask price of $47.10. This example illustrates that theNewtonian-type concept of a single absolute NBBO for all economic agents inall locations breaks down under sufficiently fast trading.
As a replacement for the NBBO, we propose an Einsteinian-type conceptof an RBBO that is different for each market center, where a market centeris defined as an exchange or market maker. The RBBO for a given marketcenter matching engine is based on local information in real time and remoteinformation with various lag times. Suppose that market center i is one of Nmarket centers in the United States. Let Dij be the distance from the datacenter for market center j to the data center for market center i. Let τi j bethe theoretical minimum lag time in communicating from the data center formarket center j to the data center for market center i as given by
τi j = Dijc, (18)
where c is the speed of light.44 Let Bid( j, t) and Of f er( j, t) be the bid and offerof market center j at time t. We propose that the RBBO for market center i attime t is
RBBO(i, t) ={
Max[Bid(1, t − τi1), Bid(2, t − τi2), . . . , Bid(N, t − τiN)],
Min[Of f er(1, t − τi1), Of f er(2, t − τi2), . . . , Of f er(N, t − τiN)]
}.
(19)
By construction, the local lag time τii is zero. In the example above, the RBBO onthe CHX at 9:47:25.002 is given by RBBO(CHX, 9:47:25.002) = {$47.00, $47.09},which reflects the improved ask price. However, the RBBO on the NYSE in the
43 Colocation is where a trading firm’s computer is placed in the same room as an exchange’scomputer to minimize the computer-to-computer communication time. Colocation has grown ex-plosively in recent years.
44 In practice, proprietary and high-frequency traders are rapidly approaching the theoreticalminimum lag time. For example, several trading firms recently invested in line-of-sight microwavetowers between Chicago and New York so that they can communicate trading instructions betweenChicago and New York in 4.25 milliseconds, rather than use fiber optic cables that take 6.55milliseconds because they must follow the available communication right-of-ways and contour ofthe earth (Wall Street Journal, May 30, 2012).
1784 The Journal of Finance R©
same millisecond is given by RBBO(NYSE, 9:47:25.002) = {$47.00, $47.10}, whichis based on the unimproved ask price.
XIII. Conclusion
We investigate whether today’s fast, competitive U.S. equity markets yieldliquidity measurement problems. We find that the widely used MTAQ databaseyields a 54% higher Percent Effective Spread than the expensive DTAQdatabase and a Percent Quoted Spread that goes negative 37 times more often.We find that these differences are driven by: (1) withdrawn quotes, (2) sec-ond (versus millisecond) time stamps, and (3) other causes, including canceledquotes. We test ways to eliminate or mitigate these differences. We find thatthe expensive solution—using DTAQ—is first-best. For financially constrainedresearchers, the cheap solution—using MTAQ with our new Interpolated Timetechnique, adjusting for withdrawn quotes, and throwing away economicallynonsensical states—is second-best. We find that both our first-best and second-best solutions yield different inferences from using MTAQ with no adjustments.Looking to the future, we anticipate the ultimate demise of the NBBO and pro-pose that it be replaced with an RBBO that is different for each market center.
Initial submission: November 9, 2011; Final version received: September 11, 2013Editor: Campbell Harvey
REFERENCES
Aldridge, Irene, 2009, High-Frequency Trading: A Practical Guide to Algorithmic Strategies andTrading Systems (Wiley Trading, Hoboken, NJ).
Amihud, Yakov, and Haim Mendelson, 1980, Dealership market: Market making with inventory,Journal of Financial Economics 8, 31–53.
Angel, James, Lawrence Harris, and Chester Spatt, 2011, Equity trading in the 21st century,Quarterly Journal of Finance 1, 1–53.
Bessembinder, Hendrik, 2003, Issues in assessing trade execution costs, Journal of FinancialMarkets 6, 233–257.
Boehmer, Ekkehart, Robert Jennings, and Li Wei, 2007, Public disclosure and private decisions:Equity market execution quality and order routing, Review of Financial Studies 20, 315–358.
Chakrabarty, Bidisha, Bingguang Li, Vanthuan Nguyen, and Robert Van Ness, 2006, Trade clas-sification algorithms for electronic communication networks, Journal of Banking and Finance31, 3806–3821.
Chakrabarty, Bidisha, Pamela Moulton, and Andriy Shkilko, 2012, Short sales, long sales, and theLee-Ready trade classification revisited, Journal of Financial Markets 15, 467–491.
Chen, Qi, Itay Goldstein, and Wei Jiang, 2007, Price informativeness and investment sensitivityto stock price, Review of Financial Studies 20, 619–650.
Chordia, Tarun, Richard Roll, and Avanidhar Subrahmanyam, 2000, Commonality in liquidity,Journal of Financial Economics 56, 3–28.
Chordia, Tarun, Richard Roll, and Avanidhar Subrahmanyam, 2001, Market liquidity and tradingactivity, Journal of Finance 56, 501–530.
Chordia, Tarun, Richard Roll, and Avanidhar Subrahmanyam, 2002, Order imbalance, liquidity,and market returns, Journal of Financial Economics 65, 111–130.
Chordia, Tarun, Richard Roll, and Avanidhar Subrahmanyam, 2012, Recent trends in tradingactivity, Journal of Financial Economics 101, 243–263.
Liquidity Measurement Problems in Fast, Competitive Markets 1785
Easley, David, Robert Engle, Maureen O’Hara, and Liuren Wu, 2008, Time-varying arrival ratesof informed and uninformed trades, Journal of Financial Econometrics 6, 171–207.
Easley, David, and Maureen O’Hara, 1987, Price, trade size, and information in securities markets,Journal of Financial Economics 19, 69–90.
Einstein, Albert, 1905, Elektrodynamik bewegter Korper, Annalen der Physik 17, 891–921.Ellis, Katrina, Roni Michaely, and Maureen O’Hara, 2000, The accuracy of trade classification
rules: Evidence from Nasdaq, Journal of Financial and Quantitative Analysis 35, 529–552.Glosten, Lawrence, and Paul Milgrom, 1985, Bid, ask, and transaction prices in a specialist market
with heterogeneously informed traders, Journal of Financial Economics 14, 71–100.Hasbrouck, Joel, 2009, Trading costs and returns for U.S. equities: Estimating effective costs from
daily data, Journal of Finance 46, 1445–1477.Hasbrouck, Joel, and Gideon Saar, 2010, Low-latency trading, Working paper, New York University.Hendershott, Terrence, and Pamela Moulton, 2011, Automation, speed, and stock market quality:
The NYSE’s hybrid, Journal of Financial Markets 14, 568–604.Henker, Thomas, and Jian-Xin Wang, 2006, On the importance of timing specifications in market
microstructure research, Journal of Financial Markets 9, 162–179.Ho, Thomas, and Hans Stoll, 1981, Optimal dealer pricing under transactions and return uncer-
tainty, Journal of Financial Economics 9, 47–73.Ho, Thomas, and Hans Stoll, 1983, The dynamics of dealer markets under competition, Journal of
Finance 38, 1053–1074.Jain, Pankaj, 2005, Financial market design and the equity premium: Electronic versus floor
trading, Journal of Finance 60, 2955–2985.Jain, Pankaj, James Upson, and Robert Wood, 2008, Post-Reg NMS transaction costs: An efficient
NBBO estimation method, Working paper, University of Memphis.Kaul, Gautam, Qin Lei, and Noah Stoffman, 2008, AIMing at PIN: Order flow, information, and
liquidity, Working paper, Indiana University.Kyle, Albert, 1985, Continuous auctions and insider trading, Econometrica 53, 1315–1335.Lee, Charles and Mark Ready, 1991, Inferring trade direction from intraday data, Journal of
Finance 46, 733–746.Macey, Jonathan, and Maureen O’Hara, 1997, The law and economics of best execution, Journal
of Financial Intermediation 6, 188–223.Moore, Gordon, 1965, Cramming more components onto integrated circuits, Electronics 38, 114–
119.New York Stock Exchange, Inc., 2008, TAQ 3 Users Guide, Version 1.1.9.Newton, Isaac, 1687, Philosophiæ Naturalis Principia Mathematica in Bernard Cohen and Anne
Whitman, 1999, Isaac Newton: The Principia, Mathematical Principles of Natural Philosophy,a New Translation (University of California Press, Berkeley, CA).
Nimalendran, Mahendrarajah, Jay Ritter, and Donghang Zhang, 2007, Do today’s trades affecttomorrow’s IPO allocations? Journal of Financial Economics 84, 87–109.
Odders-White, Elizabeth, 2000, On the occurrence and consequences of inaccurate trade classifi-cation, Journal of Financial Markets 3, 259–286.
Peterson, Mark, and Erik Sirri, 2003, Evaluation of the biases in execution cost estimation usingtrade and quote data, Journal of Financial Markets 6, 259–280.
Roll, Richard, 1984, A simple implicit measure of the effective bid–ask spread in an efficientmarket, Journal of Finance 39, 1127–1139.
Thompson, Samuel, 2011, Simple formulas for standard errors that cluster by both firm and time,Journal of Financial Economics 99, 1–10.
Wolfe, Brian, 2010, Declining information share at the NYSE and increasing information overload,Working paper, Indiana University.
Supporting Information
Additional Supporting Information may be found in the online version of thisarticle at the publisher’s website:
Appendix S1: Internet Appendix.