Embed Size (px)
Citation preview

LIS Technical Working Paper
Series
Luxembourg Income Study (LIS), asbl
No. 6
Netting Down Gross Earnings Data in the LIS Database: An Evaluation of Two Procedures
Rense Nieuwenhuis, Teresa Munzi and Janet C. Gornick
August 2013
Netting Down Gross Earnings Data in the LIS
Database: An Evaluation of Two Procedures
Rense Nieuwenhuis1, Teresa Munzi2, Janet Gornick3
August 1, 2013
Abstract
LIS researchers who seek to perform country-comparative and / or
trend analyses have to account for the fact that in some LIS datasets
income variables were reported net of taxes and social security contri-
butions, while in other datasets income variables were reported gross
of taxes and social security contributions. In this technical paper we
discuss, develop, and evaluate two ‘netting down procedures’ that help
reduce bias that would be introduced by directly comparing net and
gross datasets. Results of evaluating the performance of these netting
down procedures indicate that the validity of the comparison of net
and gross datasets can be greatly improved when netting down pro-
cedures are applied. In several cases, however, substantial amounts of
bias remain.
1Institute for Innovation and Governance Studies (IGS), University of [email protected]
2LIS. [email protected] & Graduate Center, City University of New York. [email protected]
1
Contents
1 Introduction 4
2 Comparing Net and Gross Earnings Data 6
2.1 Why is the difference between net and gross datasets important? 7
2.2 Netting Down, or Grossing up? . . . . . . . . . . . . . . . . . 9
3 Practical Guidelines on Netting Down Person-level Earn-
ings 10
3.1 Netting Down Specific Income Sources . . . . . . . . . . . . . 11
3.2 Netting Down Person Level Earnings . . . . . . . . . . . . . . 12
3.3 Programs for Netting Down . . . . . . . . . . . . . . . . . . . 12
4 Method and Data 14
4.1 Method . . . . . . . . . . . . . . . . . . . . . . . . . . . . . . 14
4.2 Data . . . . . . . . . . . . . . . . . . . . . . . . . . . . . . . . 17
5 Results 18
5.1 Results on Average Earnings . . . . . . . . . . . . . . . . . . 18
5.2 Results on Measures of Inequality . . . . . . . . . . . . . . . . 22
5.3 Two Notes on the Benchmark . . . . . . . . . . . . . . . . . . 24
5.4 Alternative Netting Down Procedures . . . . . . . . . . . . . 29
6 Conclusion 30
A STATA Program Person-Level netting down 36
B STATA Program Household-Level netting down 37
C R Program Person-Level netting down 38
2

D R Program Household-Level netting down 39
E SPSS Program Person-Level netting down 40
F SPSS Program Household-Level netting down 42
G SAS Program Person-Level netting down 43
H SAS Program Household-Level netting down 45
3
1 Introduction
LIS researchers who seek to perform country-comparative or trend analyses
have to account for the fact that in some LIS datasets earnings variables
were reported net of income taxes and social security contributions (paid
by the employee), while in other datasets earnings variables were reported
gross of income taxes and social security contributions. Directly comparing
net and gross earnings variables while assuming both measure the same
earnings concept introduces bias to the analysis. Net earnings variables
represent earnings after income taxes and contributions were subtracted,
while gross earnings variables represent earnings before income taxes and
contributions were subtracted. For the users of LIS who seek to perform
country-comparative or trend analyses, this results in the challenge that
their selected earnings variable(s) refer(s) refer to different earnings concepts
in the different datasets used, and therefore in most applications should not
be compared directly. In the remainder of this technical paper, wherever
it is stated ‘taxes’, we refer to the combination of income taxes and social
security contributions. In addition, throughout this paper, when we use the
term ‘contributions’, we refer to ‘social security contributions’ (paid by the
employee); in other words, we use those terms interchangeably
LIS researchers have available (and have applied) four different strate-
gies for comparing net and gross datasets. The first is to include both types
of datasets in the same (comparative) analysis, explicitly stating that the
comparison might be biased. The second strategy is to limit the analysis
either to only net datasets, or to only gross datasets. This results in correct
analyses, but clearly limits the scope of the research. Thirdly, LIS users can
0The authors thank Markus Jantti for valuable comments on an earlier version of thispaper, and Thierry Kruten for translating our code to SAS.
4
present separate analyses for the net datasets, and for the gross datasets.
This also results in correct analyses, and users can discuss the differences in
results between the two groups of countries. The limitation of this strategy
is that differences in the results between the net and gross analyses can orig-
inate both from the different earnings concepts that were used, as well as
from the analyses being based on different countries. In addition, because
separate analyses were performed, no statistical tests can be performed in
comparing the differences in outcomes between (groups of) countries. The
fourth strategy for comparing net and gross datasets is to modify the gross
earnings data to approximate net earnings data. This process is referred to
as ‘netting down’ gross data, and entails subtracting taxes from the gross
data. Research on such netting down procedures, however, is limited. Al-
though some netting down procedures for LIS are available informally, they
are undocumented and it has not been evaluated empirically whether such
netting down procedures result in measurements of earnings that are equiv-
alent across datasets. Hence, the goals of this technical paper are, in this
order, the following:
• Provide background information on the comparison of earnings in net
and gross LIS datasets.
• Provide practical guidelines on using two netting down procedures, in-
cluding program code (for STATA, SPSS, R, and SAS) and an overview
of the assumptions that are made in these procedures.
• Quantify the degree of bias introduced by directly comparing net and
gross earnings variables, answering the question “To what extent is
bias introduced by directly comparing gross to net earnings data?”
• Evaluate the degree to which the provided netting down procedures
5
improve the comparability of net and gross earnings variables, an-
swering the question: “To what extent do ‘netting down’ procedures
result in measures of net earnings that are equivalent (unbiased) across
datasets?”
2 Comparing Net and Gross Earnings Data
The Luxembourg Income Study Database (LIS) provides harmonized sur-
vey data on numerous aspects of income, taxes, social security contribu-
tions, transfers, expenditures, consumption, employment, and background
information, covering nearly 40 countries with the first wave dating back to
around 1980. All datasets in the LIS database are harmonized to a com-
mon template, allowing for comparisons between countries and over time.
This makes LIS an invaluable source of data for country-comparative and/or
trend studies on various aspects of income. From the 205 LIS datasets avail-
able at the time of writing, 55 (27%) were classified as providing earnings
variables net of taxes, 139 (68%) provide earnings variables gross of taxes,
and 11 (5%) were classified as ‘mixed’.1 Newly added datasets are increas-
ingly likely to provide earnings gross of taxes.
The difference between datasets with net or gross earnings variables af-
fects country-comparative research, as the earnings variables for some coun-
tries were always classified as net (e.g. Hungary, Mexico, and Slovenia) and
others always as gross (e.g. Australia, Canada, and the Netherlands). As
in some countries the measurement of earnings variables over time changed
from net to gross (e.g. Greece, Italy), the (lack of) comparability between
net and gross earnings variables can also affect trend studies on a single
1For an updated overview, see: http://www.lisdatacenter.org/our-data/lis-database/datasets-information/
6

country.
2.1 Why is the difference between net and gross datasets
important?
Comparing net and gross data on income can either be a challenge in com-
parability, or of substantive interest. This applies to income in general, and
to earnings as a specific form of income on which this technical paper is
focused.
First, the differences between net and gross earnings becomes a challenge
in comparability, when comparisons are made between datasets of which
some are gross and others are net. This is the case in country-comparative
analyses and / or in trend analyses. It has been shown that country-
comparative studies based on different earnings concepts across countries
can be “seriously misleading” (p. 777), for instance when net and gross
earnings variables are mixed (Atkinson and Brandolini, 2001). Also, in mea-
suring inequality, the earnings concept used was found to not only affect the
level of inequality, but also the trend in inequality (ibid.).2 The compari-
son between net and gross datasets can then be improved by netting down
the gross earnings, so that the comparison is based on a common earnings
concept: net of taxes.
Secondly, the difference between gross and net income is of substantive
interest when a single dataset contains information on both gross and net
income or earnings, when information on taxes is available, and when addi-
tional information on social transfers is available. This allows LIS users to,
2The literature on comparability of measurements across countries and / or time is welldeveloped (Davidov et al., 2011; Verhagen, 2012; Kline, 2005). However, the methodologyin this literature is mostly based on a generalized-latent variable approach. This approachassumes a latent construct that is measured by multiple manifest indicators. Since earningsare not a latent construct, this approach does not apply here.
7
for instance, compare pre-tax-pre-transfer income to post-tax-post-transfer
income, and thereby to answer a set of research questions on how taxes, but
also social transfers, affect the income distribution.3 This approach has been
applied to study the effects of social-welfare policies on the poverty rates
in the total population of countries (see, e.g., Kenworthy, 1999). Other
studies have evaluated how taxes and transfers affected poverty of specific
subgroups, such as among children (see, e.g., Gornick and Jantti, 2012) and
migrant households (Sainsbury and Morissens, 2012; Morissens and Sains-
bury, 2005). With respect to earnings, questions on redistribution include
whether the gender gap in earnings differs between net and gross earnings
(cf. England et al., 2012; Blau and Kahn, 2000), and the whether women’s
net or gross earnings provide more bargaining power in household economic
models (cf. Becker, 1991). For such ‘redistribution studies’, the actual dif-
ferences between net and gross income are of substantive interest, and both
are compared within a single dataset.
The issue of comparability between net and gross datasets in LIS also ap-
plies to redistribution studies. This is clarified using a detailed example of a
typical redistribution study on the comparison between pre-tax-and-transfer
income (referred to as ‘household market income’) to post-tax-and-transfer
income (referred to as ‘disposable household income’) (Gornick and Jantti,
2012). However, market income was reported gross of income taxes in some
LIS datasets, and net of income taxes in other LIS datasets. As for these
‘redistribution’ studies, parallel to the issues raised with earnings, bias is in-
troduced when gross and net datasets are mixed and the poverty/inequality
reductions associated with taxes and transfers are compared across datasets.
3Note that with comparing pre-tax-pre-transfer income to post-tax-post-transfer in-come, solely using the concept of ‘earnings’ is not meaningful, as total income can bederived from labor (including earnings), capital and transfers.
8

That clearly understates poverty/inequality reduction in the net datasets,
as the comparison between market income and disposable household income
in these datasets only captures the effects of transfers, whereas in gross
datasets this comparison would capture the combined effect of taxes and
transfers. Thus, although the quantity of interest (the difference between
market household income and disposable household income) is derived by
comparison within a dataset, here again the challenge of comparisons arises
when this quantity of interest is compared between net and gross datasets.
Thus, here too the comparison between net and gross datasets can then
be improved by netting down the gross datasets, so that the comparison is
based on a common market household income concept.
2.2 Netting Down, or Grossing up?
It should be noted that in principle there is no difference between netting
down gross earnings data, or grossing up net earnings data. Both options
can be attractive, depending upon the substantive questions to be answered
or hypotheses to be tested with the data.
With LIS, however, grossing up is not possible as the datasets that are
labeled as ‘net’ do not contain information on taxes. To then estimate
the gross earnings would require country-specific details on the tax system,
which is beyond the scope of this technical paper. Detailed simulations to
this end are available for many countries through the Euromod project.4
The scope of this technical paper is limited to developing and evaluating
netting down procedures.
4On the internet: https://www.iser.essex.ac.uk/euromod
9

3 Practical Guidelines on Netting Down Person-
level Earnings
In this section, practical guidelines are provided on netting down person-
level earnings. The steps to be taken in netting down person-level earnings
in gross datasets are summarized in Figure 1.
Figure 1: Schematic representation of netting down person-level gross earn-ings in LIS
10

3.1 Netting Down Specific Income Sources
Total income is typically recognized to be obtained from three different
sources: labor, capital, and transfers. A researcher can be interested in
comparing the total income derived from these sources combined, or be in-
terested in the income derived from one of these sources, such as for instance
labor. These three main categories can be divided further, for instance
by differentiating between earnings derived from dependent employment or
from self-employment (both part of labor).
Netting down the income from either labor, capital, or transfers is chal-
lenging both conceptually and practically. The conceptual problem with
net income from separate sources lies in the fact that typically earners pay
their taxes based on all (taxable) income. So, if a household or person has
income from multiple sources the amount of income taxes paid is based on
the amount of total income, rather than the amount of earnings from each
of these sources separately. Nevertheless, studying income from a single
source, such as the earnings obtained from employment, may be interesting
for many researchers.
The practical problem with net income from separate sources is that as a
result of the above, only information on total taxes is available. Therefore,
to calculate the net income from a separate source, the assumption that
income from each source was taxed at the same rate, is required.
In the empirical part of this technical paper we will evaluate the netting
down of just those earnings that were obtained from dependent employment
(not including self-employment).
11

3.2 Netting Down Person Level Earnings
All LIS datasets provide disposable household income (LIS variable name:
DHI) and monetary disposable household income (LIS variable name: DPI).
These household-level variables are comparable across countries.
However, it may also be desirable to calculate net earnings at the person
level, rather than at the household level. To do so, person-level taxes (thus
both income taxes and social security contributions) are subtracted from
person-level gross earnings. Doing so, however, is challenging in countries
with joint taxation of members of the same household. So, if no person-
level tax variables are available, netting down person-level earnings requires
the assumption that the taxes paid at the household level were paid by each
household member proportionally to the share of the total household income
received by that member.
The decision whether to compare household-level or person-level earn-
ings depends, of course, of the substantive research interest. Netting down
procedures can be developed for both person-level and household-level in-
come concepts. As LIS provides comparable data on several specific income
concepts on the household-level, but not on the person-level, the focus of
this technical paper is on developing and evaluating netting down proce-
dures for person-level earnings. This is represented in the top row of Figure
1.
3.3 Programs for Netting Down
We developed two programs that perform netting down procedures, available
for STATA, SPSS, R, and SAS. These procedures either use information on
taxes on the person-level or, if these are not available, or household level tax
information. The LIS website has a table providing information on whether
12

datasets are gross or net (URL was given above). Datasets classified as
mixed should be treated with more caution, as the earnings reported in
these datasets can be gross of income taxes but net of contributions, or vice
versa. This is reported in detail in the LIS data documentation per country.
All LIS datasets also contain a variable named ‘GROSSNET’, providing
information on how earnings (and other income variables) were reported.
Users should carefully apply the correct netting down program for each
dataset in their analysis. The second row from the top in Figure 1 indicates
that netting down procedures should not be applied to datasets that were
classified as net.
If person-level variables on taxes (LIS variable PMXITI) and (self-paid)
social security contributions (LIS variable PMXITSS) are available, the
person-level netting down procedure should be applied. Otherwise, the
household-level netting down procedure should be applied. This is repre-
sented by the third row from the top in Figure 1. The person-level and
household-level netting down procedures are described below. These de-
scriptions also state the assumptions that are required for the procedure to
result in information on person-level net earnings.
Person-level Netting Down Procedure: When person level tax infor-
mation is available, the netting down procedure first calculates the
total taxable income (earnings from dependent employment, self em-
ployment, unemployment compensation benefits, short-term sickness
and work injury benefits, family leave benefits, and pensions). Next,
it calculates the proportion of that total income that was obtained by
dependent employment. Next, it is assumed that the total amount of
taxes was distributed proportionally over all sources of income. As
taxable income is made up of different components across countries,
13

this procedure is based merely on an approximation of taxable income.
The person level net earnings are then calculated by subtracting the
paid income taxes from the gross earnings, proportional to the amount
of total income obtained from earnings.
Household-level Netting Down Procedure: When tax information is
only available at the household level, the netting down procedure first
calculates the percentage of the total household income that was paid
as taxes. Next, it is assumed that this percentage is equal to all mem-
bers of the household, and applies equally to all sources of income. The
person level net earnings are then calculated by reducing the person
level gross earnings by the percentage taxes.
4 Method and Data
4.1 Method
In a select number of LIS datasets both gross and net earnings variables
were reported at the person level, as well as information on taxes and so-
cial security contributions on both the person-level and the household-level.
Thereby, these datasets provide a unique opportunity for quantifying the
amount of bias that arises from directly comparing net and gross datasets,
as well as for evaluating netting down procedures.
To quantify the degree of bias that is introduced by directly comparing
datasets with either net or gross earnings, we calculated different measures
of the earnings distribution, such as for instance the average earnings. We
did so twice for each dataset: once using the gross earnings variable, and
once using the net earnings variable. The two resulting averages thus refer
to the same country and year, and they were calculated based on exactly the
14
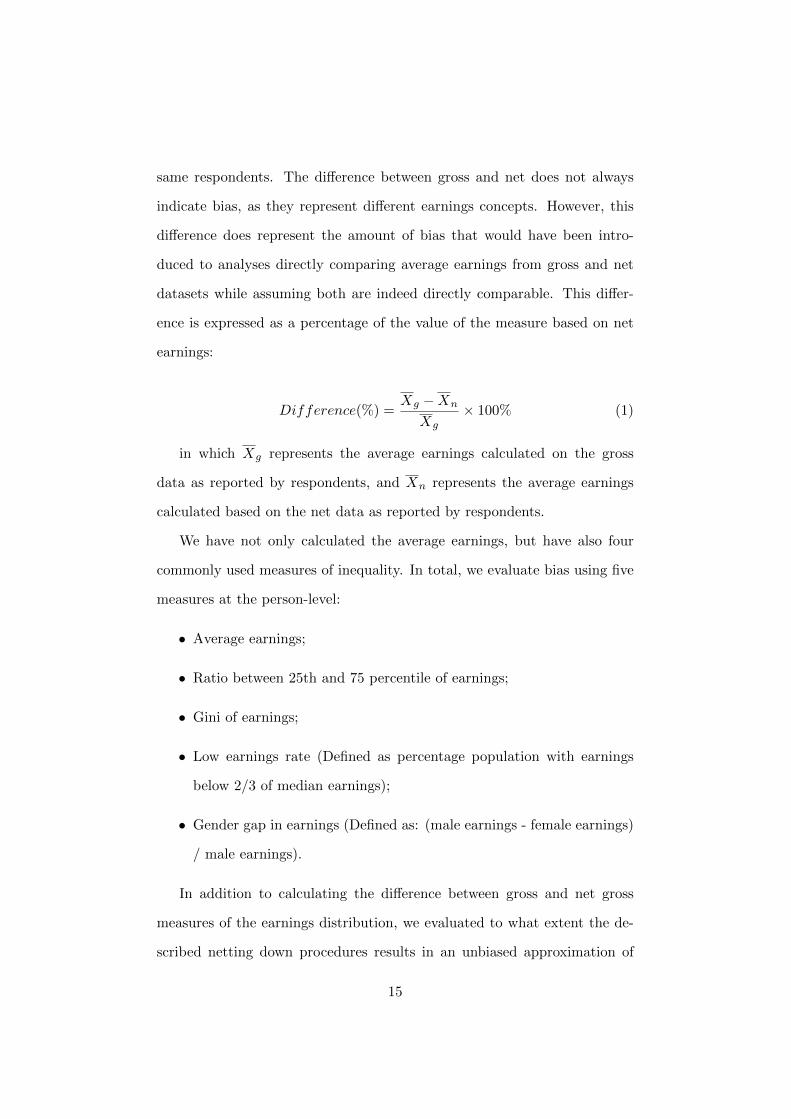
same respondents. The difference between gross and net does not always
indicate bias, as they represent different earnings concepts. However, this
difference does represent the amount of bias that would have been intro-
duced to analyses directly comparing average earnings from gross and net
datasets while assuming both are indeed directly comparable. This differ-
ence is expressed as a percentage of the value of the measure based on net
earnings:
Difference(%) =Xg −Xn
Xg
× 100% (1)
in which Xg represents the average earnings calculated on the gross
data as reported by respondents, and Xn represents the average earnings
calculated based on the net data as reported by respondents.
We have not only calculated the average earnings, but have also four
commonly used measures of inequality. In total, we evaluate bias using five
measures at the person-level:
• Average earnings;
• Ratio between 25th and 75 percentile of earnings;
• Gini of earnings;
• Low earnings rate (Defined as percentage population with earnings
below 2/3 of median earnings);
• Gender gap in earnings (Defined as: (male earnings - female earnings)
/ male earnings).
In addition to calculating the difference between gross and net gross
measures of the earnings distribution, we evaluated to what extent the de-
scribed netting down procedures results in an unbiased approximation of
15

net earnings. To evaluate a netting down procedure, we applied this proce-
dure to a gross earnings variable, calculated the average earnings (or one of
the other measures of the earnings distribution) based on the netted down
earnings variable, and compared the results to those based on the reported
net earnings. The reported net earnings thus serve as a benchmark against
which the netted down net earnings are evaluated. We calculated the degree
to which the netted down results are biased (compared to the reported net
results) using the following equation:
Bias(%) =Xnd −Xn
Xn
× 100% (2)
in which Xnd represents the (for example) average earnings calculated
on the netted down net data, and Xn represents the average earnings cal-
culated based on the net data as reported by respondents. The resulting
bias is expressed as a percentage of the reported net earnings. So, a bias of
0% means that the results based on the approximated net earnings (Xnd,
obtained using the netting down procedure) is identical to those based on
the net earnings as reported by respondents (Xn). In that case the netting
down procedure results in an unbiased measure of net earnings. If the bias
% is larger than 0, this means that the results based on the approximated
net earnings are higher than those based on the reported net earnings, a
percentage below 0 indicates that the approximated results are lower.
To evaluate whether the netting down procedure improves the quality
of a comparison of earnings across net and gross datasets, the bias of the
netting down procedure (Bias %, defined in 2) is to be compared to the
difference between reported net and gross earnings (Difference %, defined
in 1). If the (absolute) percentage of bias of the netting down procedure
is smaller than the difference between the reported net and gross earnings,
16
this indicates that the netted down earnings are closer to the benchmark of
the reported net earnings than the reported gross earnings are.
4.2 Data
The netting down procedures described in this technical paper can be applied
to LIS datasets of the ‘new’ (post-2011) template that are classified as gross.
The evaluation of these netting down procedures, however, required the
availability of both gross and net earnings as reported by the respondent.
This could only be the case in the ‘old’ template (pre-2011; these are still
available to users).5 The required earnings variables, as well as person- and
household level variables on taxes and social contribution were available in 7
datasets: Austria 2004, Belgium 1992, Belgium 1997, Estonia 2004, Ireland
2004, United Kingdom 1999, and United Kingdom 2004.
We have restricted our analyses to those observations with valid informa-
tion on both the gross and net earnings variables. Although this introduced
some missing observations (either by persons not having reported their gross
earnings, their net earnings, or both), the goal of this technical paper is not
to obtain valid inferences regarding the measures of earnings, but to un-
derstand the bias that was introduced by directly comparing net and gross
earnings data. By deleting observations in which any or both of the earnings
measures were missing, we assured that our measurement of bias was not
affected by the gross and net earnings variables were based on different ob-
servations. Person-level sampling weights were applied. The total number
of person-level observations is presented in Table 1.
5Luxembourg Income Study Database (LIS), www.lisdatacenter.org (multiple countries;October 2012-November 2013). Luxembourg: LIS
17

Table 1: Countries and Number of person level observations
Country Year Number Observations
Austria 2004 5,563Belgium 1992 4,138Belgium 1997 4,001Estonia 2004 5,155Ireland 2004 3,297United Kingdom 1999 21,791United Kingdom 2004 24,161
5 Results
5.1 Results on Average Earnings
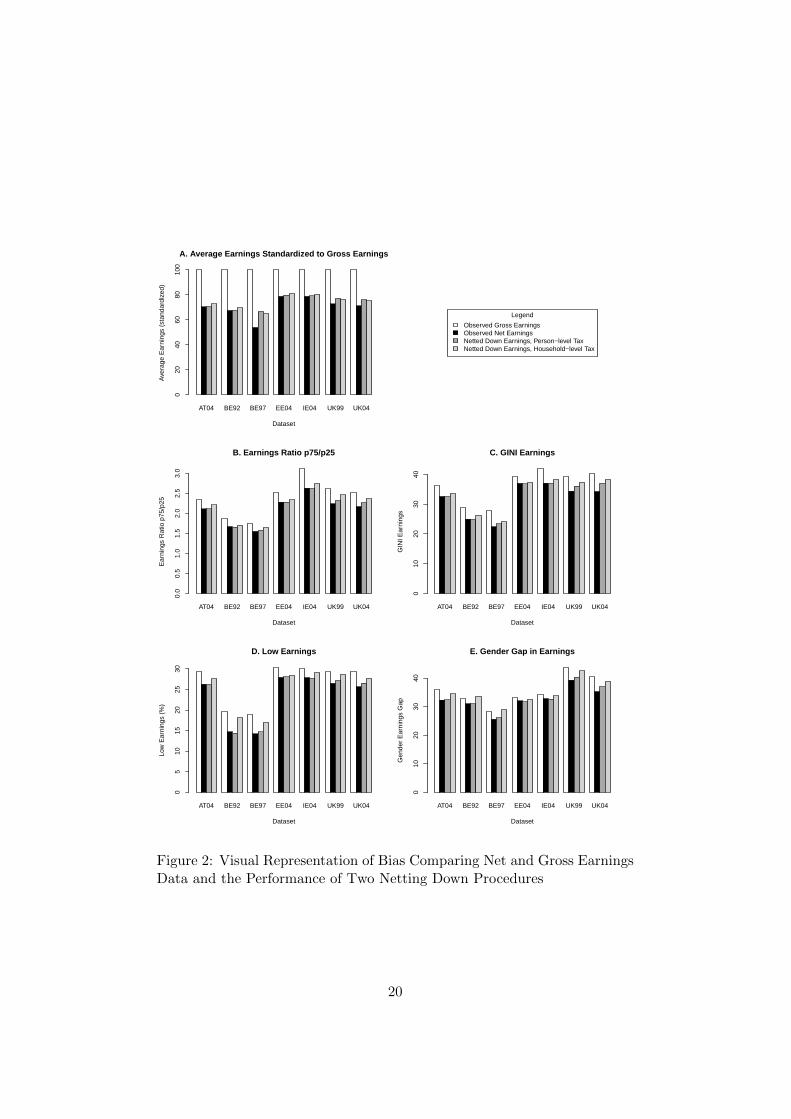
First, we present in detail our results regarding netting down average earn-
ings. In the next sub-section, we present the outcomes of netting down the
measures of inequality. In Figure 2 the results of our analyses are presented
graphically. In panel A, the average earnings are shown, standardized by
setting the average gross earnings to 100 to account for widely different av-
erages between countries. The average gross earnings were directly observed
in the data and are represented by the white bars. The observed net earn-
ings are shown as black bars, and unsurprisingly the average net earnings
are much lower than the average gross earnings. Of course, this is the result
of paying taxes, but if directly compared between datasets this would result
in the amount of bias as calculated.
Next, the dark-gray bars represent an approximation of the average net
earnings, that was based on the netting down procedure using person-level
taxes. This average of the approximated net earnings is very close to the av-
erage of the net earnings that were reported by respondents, suggesting that
the netting down procedure performed well. The same holds for the netting
18
down procedure based on the household-level tax information household,
represented by the light-gray bars.
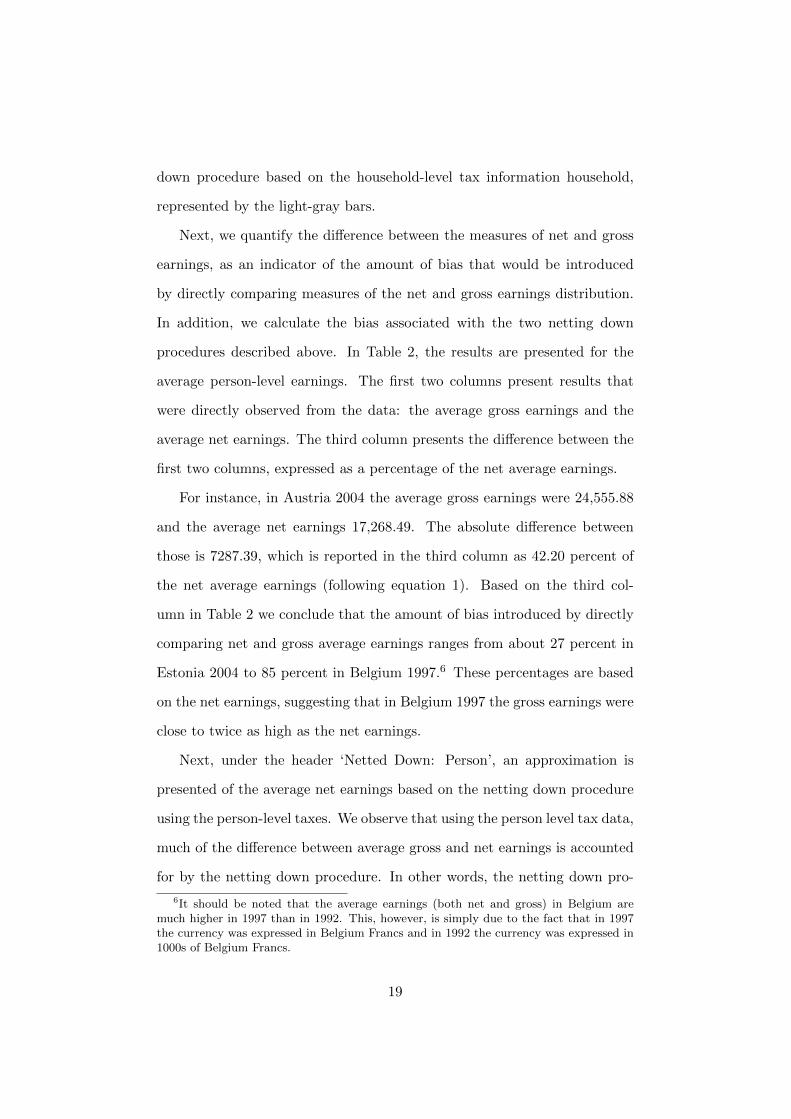
Next, we quantify the difference between the measures of net and gross
earnings, as an indicator of the amount of bias that would be introduced
by directly comparing measures of the net and gross earnings distribution.
In addition, we calculate the bias associated with the two netting down
procedures described above. In Table 2, the results are presented for the
average person-level earnings. The first two columns present results that
were directly observed from the data: the average gross earnings and the
average net earnings. The third column presents the difference between the
first two columns, expressed as a percentage of the net average earnings.
For instance, in Austria 2004 the average gross earnings were 24,555.88
and the average net earnings 17,268.49. The absolute difference between
those is 7287.39, which is reported in the third column as 42.20 percent of
the net average earnings (following equation 1). Based on the third col-
umn in Table 2 we conclude that the amount of bias introduced by directly
comparing net and gross average earnings ranges from about 27 percent in
Estonia 2004 to 85 percent in Belgium 1997.6 These percentages are based
on the net earnings, suggesting that in Belgium 1997 the gross earnings were
close to twice as high as the net earnings.
Next, under the header ‘Netted Down: Person’, an approximation is
presented of the average net earnings based on the netting down procedure
using the person-level taxes. We observe that using the person level tax data,
much of the difference between average gross and net earnings is accounted
for by the netting down procedure. In other words, the netting down pro-
6It should be noted that the average earnings (both net and gross) in Belgium aremuch higher in 1997 than in 1992. This, however, is simply due to the fact that in 1997the currency was expressed in Belgium Francs and in 1992 the currency was expressed in1000s of Belgium Francs.
19
AT04 BE92 BE97 EE04 IE04 UK99 UK04
A. Average Earnings Standardized to Gross Earnings
Dataset
Ave
rage
Ear
ning
s (s
tand
ardi
zed)
020
4060
8010
0
Legend
Observed Gross EarningsObserved Net EarningsNetted Down Earnings, Person−level TaxNetted Down Earnings, Household−level Tax
AT04 BE92 BE97 EE04 IE04 UK99 UK04
B. Earnings Ratio p75/p25
Dataset
Ear
ning
s R
atio
p75
/p25
0.0
0.5
1.0
1.5
2.0
2.5
3.0
AT04 BE92 BE97 EE04 IE04 UK99 UK04
C. GINI Earnings
Dataset
GIN
I Ear
ning
s
010
2030
40
AT04 BE92 BE97 EE04 IE04 UK99 UK04
D. Low Earnings
Dataset
Low
Ear
ning
s (%
)
05
1015
2025
30
AT04 BE92 BE97 EE04 IE04 UK99 UK04
E. Gender Gap in Earnings
Dataset
Gen
der
Ear
ning
s G
ap
010
2030
40
Figure 2: Visual Representation of Bias Comparing Net and Gross EarningsData and the Performance of Two Netting Down Procedures
20

Tab
le2:
Com
par
ing
Gro
ssan
dN
etA
vera
geE
arn
ings
:Q
uan
tify
ing
Bia
san
dE
valu
atin
gT
wo
Net
tin
gD
own
Pro
ced
ure
s
Ob
serv
edfr
omD
ata
Net
ted
Dow
n:
Per
son
Net
ted
Dow
n:
Hou
seh
old
Cou
ntr
yY
ear
Gro
ssN
etD
iffer
ence
(%)
abs.
Bia
s(%
)ab
s.B
ias
(%)
Au
stri
a2004
2455
5.8
817
268.
4942
.20
1732
3.61
0.32
1784
6.89
3.35
Bel
giu
m199
278
63.
3252
97.9
348
.42
5305
.25
0.14
5469
.41
3.24
Bel
giu
m199
711
058
50.0
059
4700
.10
85.9
573
8104
.20
24.1
172
1286
.80
21.2
9E
ston
ia2004
7624
3.2
560
022.
5027
.02
6079
6.69
1.29
6174
5.79
2.87
Irel
an
d200
4265
23.7
920
864.
4527
.12
2099
2.20
0.61
2134
3.59
2.30
Un
ited
Kin
gd
om
199
9168
93.3
112
266.
8737
.71
1304
7.11
6.36
1288
7.84
5.06
Un
ited
Kin
gd
om
200
4213
35.3
515
164.
9140
.69
1621
2.84
6.91
1604
7.22
5.82
21

cedure results in approximations of net earnings that have very little bias
compared to the benchmark of reported net earnings. For instance, applying
the netting down procedures on the Austrian gross earnings data, results in
an average of the netted down wage of 17,323.61 Euros. The reported net
earnings averaged at 17,268.49. This means that the netting down proce-
dure performed very well using the person level tax information in the data,
and resulted in an approximation of average net earnings that was very close
to the reported net earnings. Following equation 2, the bias in this case was
only 0.32%. This is, of course, much lower than the 42.20% bias that would
have been introduced by directly comparing average earnings based on gross
and net earnings data. When only household level tax data was available
(presented in the final two columns), the netting down procedure performed
slightly less well with a calculated bias of 3.35%. Based on the performance
of the two netting down procedures in other countries, it was clear that the
netting down procedures substantially reduce the bias for calculating aver-
age earnings, but no conclusions can be drawn on whether the netting down
procedure based on person level taxes, or the netting down procedure based
on household level taxes, performed better.
5.2 Results on Measures of Inequality
Looking back at Figure 2, panels B through E represent the results of the
ratio of the earnings of the 75th and 25th percentile of the earnings distri-
bution, the GINI, the percentage of individuals with low earnings, and the
gender gap in earnings. The overall patterns in each of these four measures
of inequality are similar. The results based on the reported gross earnings
are different from those based on the reported net earnings, with inequali-
ties being smaller in the net data. In all cases, this suggests that bias would
22

be introduced by directly comparing net and gross earnings. In most cases,
the results for the netted down earnings are closer to the reported net than
the reported gross. This holds both for the person-level and household-level
netting down procedures, suggesting that both procedures perform well in
reducing bias.
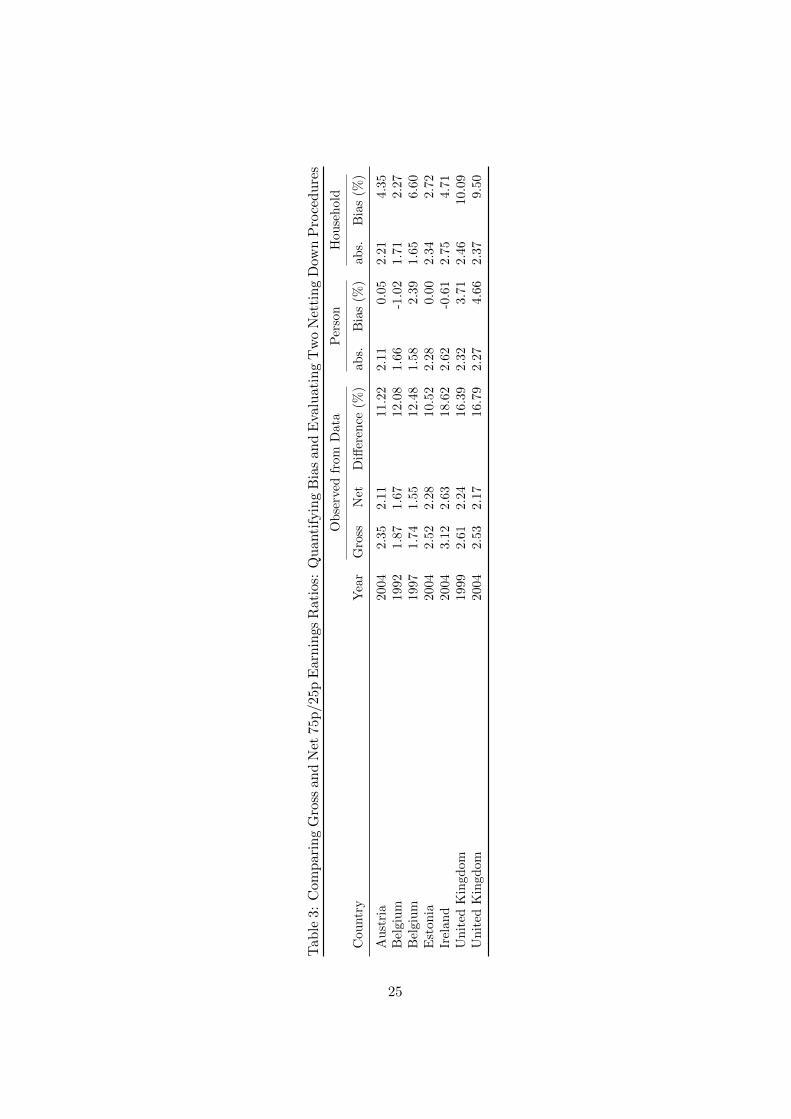
These findings based on Figure 2 are generally supported by the quan-
tified results presented in Tables 3 (earnings ratio of the 75th and 25th
percentile), 4 (GINI), 5 (low earnings rate), and 6 (gender gap in earnings).
Closer examination of these quantified results reveals several further find-
ings, including some exceptions to the general pattern. We discuss five.
First, the bias that is introduced when directly comparing gross and net
earnings (indicated in the columns labeled Difference (%)) is bigger with
average earnings than it is with the four measures of inequality.
Secondly, the performance of the netting down procedures is typically
poorer with the measures of inequality compared to with the average earn-
ings. This thus means that the remaining bias is smallest where the differ-
ences between net and gross earnings were largest to begin with.
Third, for all measures of inequality and in all countries that were evalu-
ated, the person-level netting down procedure outperformed the household-
level netting-down procedures. The bias associated with the person-level
netting down procedure typically was around reduced the bias by 0-8%.
When household-level tax variables were used, however, performance de-
graded: the bias associated with this netting down procedure typically
ranged from 1% to 24%. So, for comparing measures of inequality, using
the person-level netting down procedure is preferable when person-level tax
information is available.
Fourth, in some cases the netting down procedures corrected more than
23

100% of the existing difference between net and gross earnings. This is
indicated by a negative estimate of bias. An example is the 75p/25p earnings
ratio in Belgium 1992: the person-level netting down procedure is associated
with a bias of -1.02%.
Fifth, and finally, in the specific case of the gender gap in earnings in
Belgium (1992 and 1997), applying the household-level netting down pro-
cedure actually introduced bias. This is indicated by the fact that the bias
associated with this netting down procedure was larger than the actual dif-
ferences between the measurements of the gender gap in earnings based on
the (reported) net and gross earnings.
5.3 Two Notes on the Benchmark
As indicated, the benchmark we used to evaluate the netting down pro-
cedures was the difference between the reported gross and reported net
earnings from dependent employment. Closer examination of the original
micro-level surveys that were used to create the LIS data, however, showed
that this benchmark was not correct for all countries. The reason for this is
that the reported gross and net earnings were calculated in different ways
(other than of course the exclusion of income taxes and social security con-
tributions in the net earnings). Two such exceptions are described in this
section.
First, the LIS dataset on Belgium in 1997 was based on Socio-Economic
Panel. In this original dataset, the information on holiday- and end-of-
year bonuses was only available net of taxes, but unavailable gross of taxes.
Hence, in calculating the yearly gross earnings in preparation of the LIS
dataset, the monthly earnings were multiplied by 13,85 (approximating the
average bonuses). For the net yearly earnings the information on bonuses
24
Tab
le3:
Com
par
ing
Gro
ssan
dN
et75
p/2
5p
Ear
nin
gsR
atio
s:Q
uan
tify
ing
Bia
san
dE
valu
atin
gT
wo
Net
tin
gD
own
Pro
ced
ure
s
Ob
serv
edfr
om
Data
Per
son
Hou
sehold
Cou
ntr
yY
ear
Gro
ssN
etD
iffer
ence
(%)
ab
s.B
ias
(%)
ab
s.B
ias
(%)
Au
stri
a2004
2.3
52.1
111.2
22.1
10.0
52.2
14.3
5B
elgi
um
1992
1.8
71.6
712.0
81.6
6-1
.02
1.7
12.2
7B
elgi
um
1997
1.7
41.5
512.4
81.5
82.3
91.6
56.6
0E
ston
ia2004
2.5
22.2
810.5
22.2
80.0
02.3
42.7
2Ir
elan
d2004
3.1
22.6
318.6
22.6
2-0
.61
2.7
54.7
1U
nit
edK
ingd
om1999
2.6
12.2
416.3
92.3
23.7
12.4
610.0
9U
nit
edK
ingd
om2004
2.5
32.1
716.7
92.2
74.6
62.3
79.5
0
25

Tab
le4:
Com
pari
ng
Gro
ssan
dN
etE
arn
ings
GIN
I:Q
uan
tify
ing
Bia
san
dE
valu
atin
gT
wo
Net
tin
gD
own
Pro
ced
ure
s
Ob
serv
edfr
omD
ata
Per
son
Hou
seh
old
Cou
ntr
yY
ear
Gro
ssN
etD
iffer
ence
(%)
abs.
Bia
s(%
)ab
s.B
ias
(%)
Au
stri
a20
0436
.22
32.5
911
.13
32.5
4-0
.16
33.5
83.
05B
elgi
um
1992
28.9
825
.01
15.8
824
.90
-0.4
426
.33
5.28
Bel
giu
m19
9727
.87
22.4
224
.32
23.3
94.
3424
.19
7.92
Est
onia
2004
39.3
336
.99
6.35
36.8
0-0
.49
37.3
40.
95Ir
elan
d20
0441
.99
37.0
813
.26
37.0
4-0
.09
38.3
93.
54U
nit
edK
ingd
om
1999
39.2
134
.37
14.0
936
.10
5.05
37.4
48.
93U
nit
edK
ingd
om
2004
40.1
634
.27
17.1
937
.05
8.14
38.3
311
.85
26

Tab
le5:
Com
par
ing
Gro
ssan
dN
etL
owE
arn
ings
Rat
e:Q
uan
tify
ing
Bia
san
dE
valu
atin
gT
wo
Net
tin
gD
own
Pro
ced
ure
s
Ob
serv
edfr
om
Data
Per
son
Hou
seh
old
Cou
ntr
yY
ear
Gro
ssN
etD
iffer
ence
(%)
ab
s.B
ias
(%)
ab
s.B
ias
(%)
Au
stri
a2004
29.3
426.2
611.7
326.2
0-0
.23
27.6
05.1
0B
elgi
um
1992
19.6
714.6
933.9
014.4
0-1
.97
18.1
523.5
5B
elgi
um
1997
18.9
214.2
233.0
514.6
73.1
617.0
319.7
6E
ston
ia2004
30.4
027.9
38.8
428.0
50.4
328.4
41.8
3Ir
elan
d2004
30.2
127.8
78.4
027.7
2-0
.54
29.1
54.5
9U
nit
edK
ingd
om1999
29.4
826.4
711.3
727.1
92.7
228.7
18.4
6U
nit
edK
ingd
om2004
29.3
125.6
614.2
226.5
73.5
527.7
58.1
4
27

Tab
le6:
Com
par
ing
Gro
ssan
dN
etG
end
erG
apin
Ear
nin
gs:
Qu
anti
fyin
gB
ias
and
Eva
luat
ing
Tw
oN
etti
ng
Dow
nP
roce
du
res
Ob
serv
edfr
om
Data
Per
son
Hou
seh
old
Cou
ntr
yY
ear
Gro
ssN
etD
iffer
ence
(%)
ab
s.B
ias
(%)
ab
s.B
ias
(%)
Au
stri
a2004
34.9
532.3
18.1
732.3
50.1
234.4
56.6
2B
elgi
um
1992
32.9
231.0
36.0
930.9
9-0
.13
33.6
98.5
7B
elgi
um
1997
28.4
725.5
811.3
026.1
02.0
328.9
413.1
4E
ston
ia2004
33.3
132.0
34.0
031.6
6-1
.16
32.6
41.9
0Ir
elan
d2004
34.4
232.7
94.9
732.6
5-0
.43
33.8
63.2
6U
nit
edK
ingd
om1999
43.7
939.2
811.4
840.3
62.7
542.5
28.2
5U
nit
edK
ingd
om2004
40.5
935.2
715.0
837.0
24.9
638.8
610.1
8
28

was available in the original data. Hence, whereas in the LIS dataset the net
yearly earnings account for person-level variation in bonuses independent of
other earnings, in the gross yearly earnings the bonuses such person-level
variation was not accounted for.
Second, the LIS datasets on the United Kingdom (both in 1999 and 2004)
were based on the Family Resources Survey. During the recoding of these
datasets to the LIS templates, the gross earnings were specified to include
income from odd jobs, while net earnings could not be specified to include
this source of income. Hence, the difference between gross and net yearly
earnings is an overestimation of the ’real’ difference. Therefore, the netted
down results presented in the Tables of this technical paper may actually be
a better representation of persons’ true net earnings than the net earnings
reported in the data. It should be noted, that within the scope of this paper
it was not possible to empirically test this statement.
5.4 Alternative Netting Down Procedures
The two netting down procedures evaluated in this technical paper were
designed to use as few variables as possible, thereby allowing to be used
on a as large as possible number of LIS datasets. Despite their simplicity,
the presented netting down procedures outperformed several alternatives
that were based on more variables, but also required more assumptions.
Several of these alternative netting down procedures were evaluated, but
not presented. These procedures performed less well and were associated
with more bias. These procedures are described below, so that users do not
need to evaluate themselves.
The following alternatives were evaluated to perform less well than those
presented, or not to apply to the new LIS template:
29

Person-level Gross/Net Wages In some LIS datasets, the person level
files provide both gross and net hourly wages (earned in a set period
of time). Although this period of time (hourly, weekly, monthly, etc.)
varies between datasets, it is always identical in the gross and net
variables of a single datasets. Based on these variables, it was expected
that a good approximation of person level taxes for earnings from
paid employment could be established. This procedure could only
be evaluated in Austria and Ireland, and generally performed worse
compared to the netting down procedure based on both the household-
and person level taxes.
Household-level gross/net wages In the pre-revised LIS datasets, house-
hold level variables representing both the gross and the net ‘wages and
salaries’ (V1 / V1NET) were available. These were used to calculate
the percentage of gross wages that were paid as taxes by the household,
and this percentage was used to net down the person-level gross earn-
ings. This netting down procedure actually performed better than the
one using household level tax variables presented above (but worse
than the one based on person level tax data). These variables (or
equivalents) are not available in the revised LIS-template. Therefore,
this procedure cannot be used with most recent LIS datasets, and
therefore these results are not presented here.
6 Conclusion
In this technical paper guidelines were presented for comparing earnings
using both net and gross LIS datasets. Two netting down procedures were
developed that approximate net earnings based on information regarding
30

gross earnings, taxes and social security contributions. One netting down
procedure uses tax variables measured on the person-level, and one netting
down procedure uses household-level tax variables.
Descriptive analyses quantified the difference between measures of gross
and net earnings, as an indication of the bias that would be introduced if
net and gross datasets are directly compared. The difference between net
and gross earnings was (unsurprisingly) substantial, but varied with the
measure of the earnings distribution used. The difference was smallest with
about 5-15% in the gender gap in earnings, and largest with about 30-85%
in the average earnings. This suggests that, depending on the measure of
the earnings distribution that is used, country-comparative and / or trend
analyses should treat comparisons between net and gross LIS datasets with
caution.
The netting down procedures that were developed in this technical paper
typically were associated with lower amounts of bias than the original differ-
ence between net and gross earnings. Generally, this suggests that applying
a netting down procedure is preferable over not netting down. The excep-
tion to this, we found in the Belgium 1992 and 1997 datasets, was with the
gender earnings ratio when netted down using only household-level tax vari-
ables. In these specific cases the netting down procedure actually resulted
in more bias than a direct comparison between net and gross earnings would
have resulted in.
The results of our analyses also strongly suggest that when seeking to net
down earnings to estimate measures of inequality, using person level taxes is
desirable over using the netting down procedure based on household-level tax
variables only. Nevertheless, the person-level tax variables are not available
in all LIS datasets.
31

In many cases, data availability will dictate which of the two netting
down procedures users can apply. It should be noted, however, that it is
to be expected that the household-level netting down procedure is expected
to perform better in a country with joint-taxation, rather than in countries
in which spouses pay taxes separately. Furthermore, in both netting down
procedures it is assumed that all sources of income are taxed at the same
rate. From this, the expectation follows that the procedures will perform
better in countries with a single, rather than a dual tax system in which
separate tax rates exist for capital income and other income. Finally, we
expect the procedures to perform better in countries with a tax system that
is close to proportional (=flat rate).
A user seeking to compare a large number of both net and gross datasets,
may want to statistically control for the different netting down procedures
used. In regression-based analyses, for instance, this could be done by adding
dummy-variables indicating the observations derived from datasets netted
down with the person-level procedure, and another dummy for the observa-
tions from datasets that were netted down using the household-level proce-
dure (the observations from datasets that were reported as net then function
as the reference category). This would capture the average bias associated
with the different netting down procedures, thereby further improving the
analyses.
The program code of the two netting down procedures developed and
evaluated in this technical paper is available as appendices.7 The code
presented here serves as an example, and users will notice how simple the
code is. In addition to the steps describe above, several lines of code are
7Please note that the results presented in this technical paper are based on the pre-revised LIS template, whereas the code provided here is prepared for using in the newLIS template. As a result of slight coding differences, results may vary, but only slightly.Conclusions in this paper still hold.
32

intended to prepare variables for use in the procedure, and to deal with
missing values. Of course, more detailed netting down procedures can be
developed. Initial attempts to do so, as discussed, did not improve the
performance of our netting down procedures, could not be applied to all LIS
datasets, or even resulted in a poorer performance. In addition, if we had
developed country-specific netting down procedures this would have limited
the ability to compare the consequences of the assumptions made in these
procedures across countries.
To conclude, country-comparative and trend analyses of earnings based
on both net and gross LIS datasets should be executed with caution. The
netting down procedures presented here typically improve comparability.
However, depending on the outcome measure of interest, and especially when
no person-level tax variables were available, netting down procedures result
in approximations of net earnings that are substantially biased.
33

References
Atkinson, A. and Brandolini, A. (2001). Promise and pitfalls in the use of
“secondary” data-sets: Income inequality in OECD countries as a case
study. Journal of Economic Literature, 39(3):771–799.
Becker, G. S. (1991). A Treatise on the Family. Harvard University Press,
Cambridge.
Blau, F. D. and Kahn, L. M. (2000). Gender differences in pay. The Journal
of Economic Perspectives, 14(4):75–99.
Davidov, E., Schmidt, P., and Biliet, J., editors (2011). Cross-Cultural
analysis. Methods and Applications. Routledge.
England, P., Gornick, J., and Shafer, E. (2012). Women’s employment,
education, and the gender gap in 17 countries. Monthly Lab. Rev., (April).
Gornick, J. C. and Jantti, M. (2012). Child poverty in cross-national per-
spective: Lessons from the Luxembourg Income Study. Children and
Youth Services Review, 34(3):558–568.
Kenworthy, L. (1999). Do social-welfare policies reduce poverty? A cross-
national assessment. Social Forces, 77(3):1119–1139.
Kline, R. B. (2005). Principles and Practice of Structural Equation Modeling.
The Guilford Press, New York, second edition.
Luxembourg Income Study (LIS) Database, http://www.lisdatacenter.org
(multiple countries; October 2012 - June 2013). Luxembourg: LIS.
Morissens, A. and Sainsbury, D. (2005). Migrants’ Social Rights, Ethnicity
and Welfare Regimes. Journal of Social Policy, 34(04):637.
34

Sainsbury, D. and Morissens, A. (2012). Immigrants’ Social Rights across
Welfare States. In Welfare States and Immigrant Rights. The Politics of
Inclusion and Exclusion, chapter 6, page 327. Oxford University Press,
Oxford.
Verhagen, J. (2012). Bayasian Item Response Theory Models for Measure-
ment Variance. PhD thesis, University of Twente.
35

A STATA Program Person-Level netting down
* Check whether a program with name ’persontax’ exists
* Removes the program from memory if needed:
capture program drop persontax
* Start definition of the person-level netting down procedure:
program define persontax
* Removes variables from memory if needed (e.g. from previous runs)
capture drop propwage
capture drop earnings
* Replace the missing values into zeros for variables that are completely empty:
quietly sum pmils
replace pmils=0 if r(N) == 0
quietly sum pmitsisun
replace pmitsisun=0 if r(N) == 0
quietly sum pmitsissi
replace pmitsissi=0 if r(N) == 0
quietly sum pmitsisma
replace pmitsisma=0 if r(N) == 0
quietly sum ppension
replace ppension=0 if r(N) == 0
quietly sum pmxiti
replace pmxiti=0 if r(N) == 0
quietly sum pmxitss
replace pmxitss=0 if r(N) == 0
* Calculate the proportion of earnings into total taxable earnings:
gen propwage = pmile / (pmile+pmils+pmitsisun+pmitsissi+pmitsisma+ppension)
* Calculate net earnings by subtracting from the gross earnings,
* the income taxes and contributions in the same proportion
* as earnings into total taxable earnings:
gen earnings = pmile - ((pmxiti + pmxitss) * propwage)
* End definition of the person-level netting down procedure:
end
36
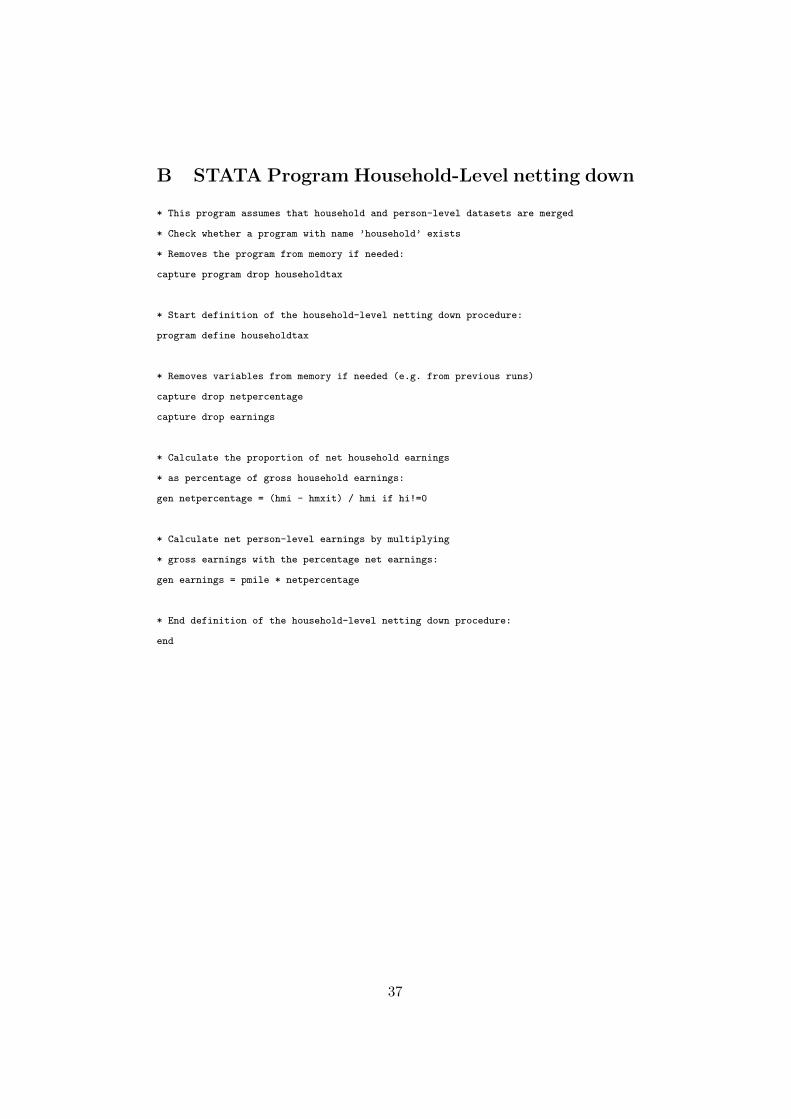
B STATA Program Household-Level netting down
* This program assumes that household and person-level datasets are merged
* Check whether a program with name ’household’ exists
* Removes the program from memory if needed:
capture program drop householdtax
* Start definition of the household-level netting down procedure:
program define householdtax
* Removes variables from memory if needed (e.g. from previous runs)
capture drop netpercentage
capture drop earnings
* Calculate the proportion of net household earnings
* as percentage of gross household earnings:
gen netpercentage = (hmi - hmxit) / hmi if hi!=0
* Calculate net person-level earnings by multiplying
* gross earnings with the percentage net earnings:
gen earnings = pmile * netpercentage
* End definition of the household-level netting down procedure:
end
37
C R Program Person-Level netting down
# Start definition of the person-level netting down procedure:
persontax <- function(x)
{
# Replace the missing values into zeros for variables that are completely empty:
if(sum(is.na(x$pmils)) ==length(x$pmils)) x$pmils <- 0
if(sum(is.na(x$pmitsisun)) ==length(x$pmitsisun)) x$pmitsisun <- 0
if(sum(is.na(x$pmitsissi)) ==length(x$pmitsissi)) x$pmitsissi <- 0
if(sum(is.na(x$pmitsisma)) ==length(x$pmitsisma)) x$pmitsisma <- 0
if(sum(is.na(x$ppension)) ==length(x$ppension)) x$ppension <- 0
if(sum(is.na(x$pmxiti)) ==length(x$pmxiti)) x$pmxiti <- 0
if(sum(is.na(x$pmxitss)) ==length(x$pmxitss)) x$pmxitss <- 0
# Calculate the proportion of earnings into total taxable earnings:
x <- within(x, propwage <-
pmile / (pmile+pmils+pmitsisun+pmitsissi+pmitsisma+ppension))
# Calculate net earnings by subtracting from the gross earnings
# the taxes and contributions in the same proportion
# as earnings into total taxable earnings:
x <- within(x, earnings <- pmile - ((pmxiti + pmxitss) * propwage))
# End definition of the person-level netting down procedure:
return(x)
}
38

D R Program Household-Level netting down
# This program assumes that household and person-level datasets are merged
# Start definition of the household-level netting down procedure:
householdtax <- function(x)
{
# Calculate the proportion of net household earnings
# as percentage of gross household earnings:
x <- within(x, netpercentage <- (hmi - hmxit) / hmi)
x <- within(x, netpercentage[hi==0] <- NA)
# Calculate net person-level earnings by multiplying
# gross earnings with the percentage net earnings:
x <- within(x, earnings <- pmile * netpercentage)
# End definition of the household-level netting down procedure:
return(x)
}
39
E SPSS Program Person-Level netting down
* Start definition of the person-level netting down procedure:.
define persontax() .
* Replace the missing values into zeros for variables that are completely empty: .
COMPUTE ismissing = nmiss(pmils) .
AGGREGATE
/OUTFILE=* MODE=ADDVARIABLES overwrite=YES
/allmiss=MEAN(ismissing).
IF (allmiss=1) pmils = 0 .
COMPUTE ismissing = nmiss(pmitsisun) .
AGGREGATE
/OUTFILE=* MODE=ADDVARIABLES overwrite=YES
/allmiss=MEAN(ismissing).
IF (allmiss=1) pmitsisun = 0 .
COMPUTE ismissing = nmiss(pmitsissi) .
AGGREGATE
/OUTFILE=* MODE=ADDVARIABLES overwrite=YES
/allmiss=MEAN(ismissing).
IF (allmiss=1) pmitsissi = 0 .
COMPUTE ismissing = nmiss(pmitsisma) .
AGGREGATE
/OUTFILE=* MODE=ADDVARIABLES overwrite=YES
/allmiss=MEAN(ismissing).
IF (allmiss=1) pmitsisma = 0 .
COMPUTE ismissing = nmiss(ppension) .
AGGREGATE
/OUTFILE=* MODE=ADDVARIABLES overwrite=YES
/allmiss=MEAN(ismissing).
IF (allmiss=1) ppension = 0 .
COMPUTE ismissing = nmiss(pmxiti) .
AGGREGATE
40

/OUTFILE=* MODE=ADDVARIABLES overwrite=YES
/allmiss=MEAN(ismissing).
IF (allmiss=1) pmxiti = 0 .
COMPUTE ismissing = nmiss(pmxitss) .
AGGREGATE
/OUTFILE=* MODE=ADDVARIABLES overwrite=YES
/allmiss=MEAN(ismissing).
IF (allmiss=1) pmxitss = 0 .
* Calculate the proportion of earnings into total taxable earnings: .
COMPUTE totalinc = pmile + pmils + pmitsisun + pmitsissi + pmitsisma + ppension .
IF (totalinc ~= 0) propwage = pmile / totalinc .
* Calculate net earnings by subtracting from the gross earnings,
* the income taxes and contributions in the same proportion
* as earnings into total taxable earnings: .
COMPUTE earnings = pmile - ((pmxiti + pmxitss) * propwage) .
IF (missing(propwage)) earnings = $sysmis .
* End definition of the person-level netting down procedure: .
!enddefine .
41

F SPSS Program Household-Level netting down
* Start definition of the household-level netting down procedure:.
* This program assumes that household and person-level datasets are merged .
define householdtax () .
* Calculate the proportion of net household earnings
* as percentage of gross household earnings: .
if hi~=0 netpercentage = (hmi - hmxit) / hmi .
* Calculate net person-level earnings by multiplying
* gross earnings with the percentage net earnings: .
compute earnings = pmile * netpercentage .
* End definition of the household-level netting down procedure: .
!enddefine .
42

G SAS Program Person-Level netting down
%MACRO indNetDown ;
/*------------------------------------------------------------------*/
/* INDIVIDUAL-LEVEL NETTING DOWN PROCEDURE */
/*------------------------------------------------------------------*/
/* NOTE -- This program assumes that you replace the macro variable */
/* &CCYYp by the valid LIS individual (SAS) dataset name such */
/* as &ie04p. */
/*------------------------------------------------------------------*/
DATA myPFile (DROP=i j k epmils epmitsisun epmitsissi epmitsisma eppension epmxiti epmxitss totalinc) ;
* Keep the value of the former record ;
RETAIN epmils epmitsisun epmitsissi epmitsisma eppension epmxiti epmxitss ;
* Loop over the entire dataset ;
IF _N_ = 1 THEN DO i = 1 TO all;
* Open the dataset ;
SET &CCYYp (KEEP=pmils pmitsisun pmitsissi pmitsisma ppension pmxiti pmxitss pmile) NOBS=all ;
* Create arrays with a new lsit of control variable (VarExist1-varExist7) to count the number of ;
* times a variable is missing ;
ARRAY varList {7} pmils pmitsisun pmitsissi pmitsisma ppension pmxiti pmxitss ;
ARRAY varExist {7} epmils epmitsisun epmitsissi epmitsisma eppension epmxiti epmxitss (7*0) ;
* Count the number of times each selected variable (Array: varList) get a missing value;
DO j = 1 TO DIM(varList) ;
IF varList{j} = . THEN varExist{j} + 1 ;
END ;
END ;
* Re-open the dataset including the counters ;
SET &CCYYp NOBS = total;
* Replace missing by 0 when the entire variable is not filled;
DO k = 1 TO DIM(varList) ;
IF varExist(k) = total THEN varList(k) = 0 ;
END ;
* Calculate the proportion of earnings into total taxable earnings ;
totalinc = pmile + pmils + pmitsisun + pmitsissi + pmitsisma + ppension;
propwage = . ;
IF (totalinc ne 0) THEN propwage = pmile / totalinc ;
/* Calculate net earnings by subtracting from the gross earnings, */
43

/* the income taxes and contributions in the same proportion as */
/* earnings into total taxable earnings: */
earnings = . ;
IF (propwage ne .) THEN earnings = pmile - ((pmxiti + pmxitss) * propwage) ;
RUN ;
%MEND indNetDown ;
44

H SAS Program Household-Level netting down
%MACRO hldNetDown ;
/*------------------------------------------------------------------------------*/
/* HOUSEHOLD-LEVEL NETTING DOWN PROCEDURE */
/*------------------------------------------------------------------------------*/
/* NOTE -- This program assumes that your targeted LIS household dataset and */
/* the person-level dataset created in the MACRO indNetDown (myPFile) are */
/* merged into a dataset called myMerge. */
/*------------------------------------------------------------------------------*/
DATA myMerge ;
SET myMerge ;
* Calculate the proportion of net household earnings as ;
* percentage of gross household earnings ;
netpercentage = . ;
IF (hi ne 0) THEN netpercentage = (hmi - hmxit) / hmi ;
* Calculate net person-level earnings by multiplying gross earnings ;
* with the percentage net earnings ;
earnings = pmile * netpercentage ;
RUN ;
%MEND hldNetDown ;
45