Embed Size (px)
Citation preview

EMBO course in Beijing, April-May, 2011 Dias 1
Calorimetry and its applications to Biological Molecules
Lise Arleth, Professor
BioNano-Science Group, University of Copenhagen, Faculty of Life Sciences Denmark
Thanks to Prof. Peter Westh, RUC, for several of the slides in this talk

EMBO Course, Beijing, April-May, 2011 Dias 2
Calorimetry is (probably) one of the oldest analytical techniques??
Antoine de Lavoisier’s equipment ~1780
Life processes are a type of combustion

EMBO Course, Beijing, April-May, 2011 Dias 3
Measuring principles Detect temperature - calculate heat, Q (=ΔΕ+PΔV=ΔH) For constant pressure, P: heat=enthalpy change (ΔH). For constant volume, V: heat=internal energy change (ΔE).

EMBO Course, Beijing, April-May, 2011 Dias 4
Measuring nano-J heats ! All biocalorimeters are “coffe cup” instruments (i.e. measure ΔH rather
than ΔE) – (So we allow the sample volume to change slightly)
Two (simple) principles:
Insulator Insulator
Heat conductor
Thermo-electric element
HEAT S
INK
HEAT
SIN
K

EMBO Course, Beijing, April-May, 2011 Dias 5
Two types of calorimeters dominate biochemical applications
Differential Scanning Calorimetry (DSC) Isothermal Titration Calorimetry (ITC)
DSC ITC
Measures the heat that is required to linearly increase temperature, T
Measures heat of mixing (titrand into titrate)
Constant composition – temperature perturbed
Constant Temperature – composition perturbed
Applications:
Protein denaturation
phase transitions
Applications:
Ligand binding,
Critical micellar concentrations
Protein-surfactant interactions

EMBO Course, Beijing, April-May, 2011 Dias 6
Experimental setups: DSC and ITC ITC DSC
Shoe-box sized instruments
200 µL Sample 500 µL
Sample
EMBO Course, Beijing, April-May, 2011 Dias 7
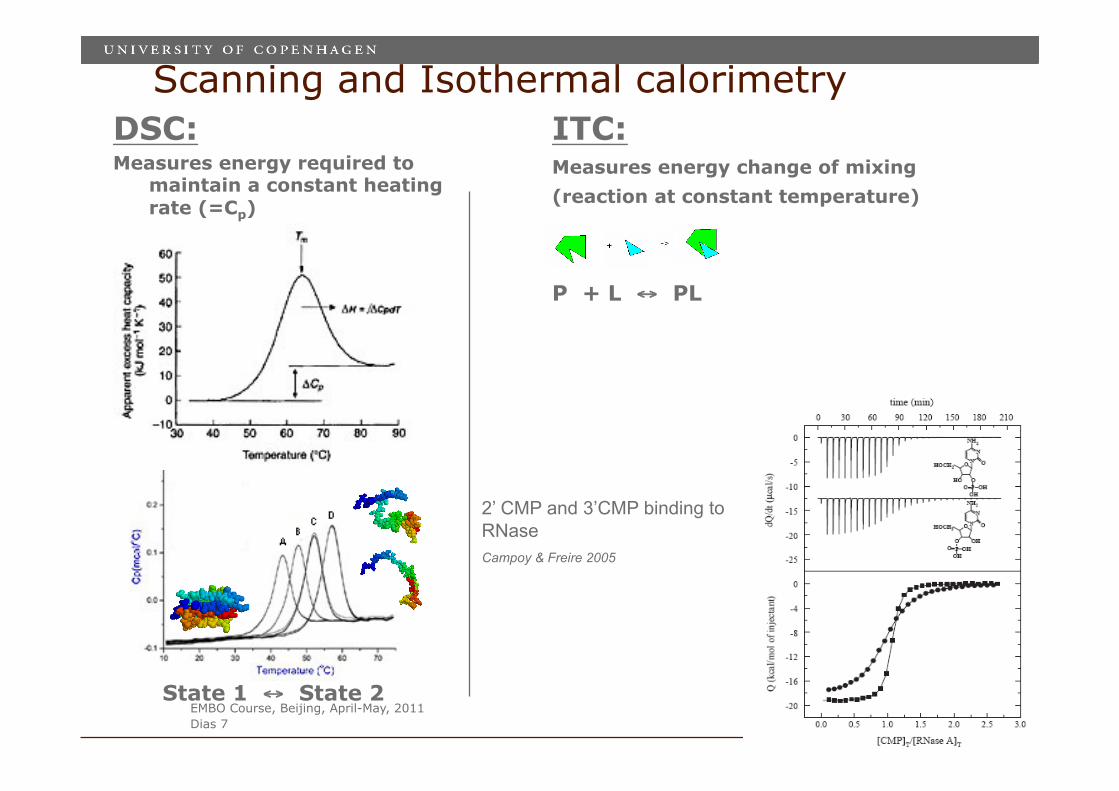
Scanning and Isothermal calorimetry DSC: Measures energy required to
maintain a constant heating rate (=Cp)
ITC: Measures energy change of mixing (reaction at constant temperature)
P + L ↔ PL
2’ CMP and 3’CMP binding to RNase Campoy & Freire 2005
State 1 ↔ State 2

EMBO Course, Beijing, April-May, 2011 Dias 8
Bio-calorimetry The pro’s and con’s of application
PRO Universally applicable No probe/no special sample preparation Quantitative Non specific
CON No structure information Moderate sensitivity Low through-put Non specific

EMBO Course, Beijing, April-May, 2011 Dias 9
Differential Scanning Calorimetry

EMBO Course, Beijing, April-May, 2011 Dias 10
Assumption: N D K= [D]/[N]
Tm: Temperature where K=1 ([D]=[N]
ΔH: Enthalpy of transition (total area using “step” shaped baseline)
ΔS°: At Tm: ΔG°=0 hence ΔS°=ΔH/T
ΔCp : D-N difference in heat capacity. dΔH/dT=ΔCp

EMBO Course, Beijing, April-May, 2011 Dias 11
Check your assumption: The Van´t Hoff analysis
Divide the peak area into T-partitioned slices
Determine the equilibrium constant at each temperature E.g. At 50°C: fraction denatured = red area/total area Native fraction (total area-red area)/total area
Hence: K(50°C)= red area/(total area – red area)
€
Van't Hoff equationd lnKd(1
T)= −
ΔHo
R⇒
Plot calculated ln(K) values against 1/T. The slope is -ΔH°/R
€
ln K2
K1
⎛
⎝ ⎜
⎞
⎠ ⎟ = −
ΔHm
R1T2−1T1
⎡
⎣ ⎢
⎤
⎦ ⎥
If the Van’t Hoff analysis does not give you this, then your assumptions must be wrong (two-state model, baseline or ?)

EMBO Course, Beijing, April-May, 2011 Dias 12
The protein folding problem
Molecular interpretations of DSC thermograms
• Hydrophobic driving forces • Cooperative units • Quantitative interpretations of mutation-effects • Docking and ”structural thermodynamics”
-Has led to an significant part of our current(fragmentary) knowledge on the protein folding process

EMBO Course, Beijing, April-May, 2011 Dias 13
Interactions of proteins and other molecules affects the thermogram
The binding of a ligand to the native state brings about stabilization – The dicplacement of the peak along with the change in transition enthalpy quantifies the binding strength
2’ CMP binding to RNase Campoy & Freire 2005
EMBO Course, Beijing, April-May, 2011 Dias 14
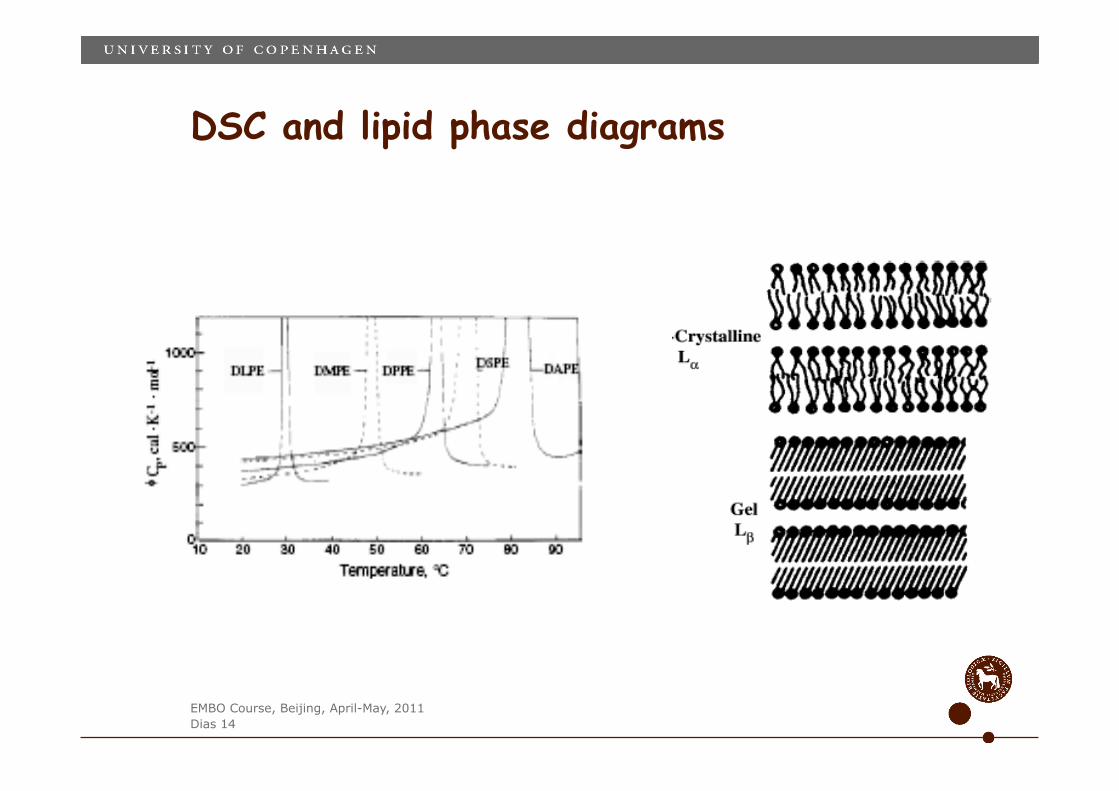
DSC and lipid phase diagrams

EMBO Course, Beijing, April-May, 2011 Dias 15
Alcohols depress the main (Pβ – Lα) phase transition temperature
So does pressure – Le chateliers principle!

EMBO Course, Beijing, April-May, 2011 Dias 16
Isothermal Titration Calorimetry

EMBO Course, Beijing, April-May, 2011 Dias 17
Isothermal titration calorimetry:
€
€
Qpeak,i =V ⋅ ΔH⋅ ΔLi = the area under the i' th peakV : Sample volumeΔH : The characteristic binding enthalpy for the reactionΔLi : The increase in number of saturated binding sites
ΔLi = P[ ] ×Ka L[ ]i
1+Ka L[ ]i−
Ka L[ ]i−1
1+Ka L[ ]i−1
⎛
⎝ ⎜
⎞
⎠ ⎟
€
Which allows for determining the binding constant, Ka

EMBO Course, Beijing, April-May, 2011 Dias 18
Limitations of measurements
Window of binding strength typically 103-109 M-1 Use Competition-binding assays to get up to 1012 M-1
Too strong Perfect Difficult Too weak
Advantages of ITC measurements
High resolution Fast Several binding parameters in one trial

EMBO Course, Beijing, April-May, 2011 Dias 19
Surfactants (=detergents)
• Amphiphilic
• Selforganize into micelles when surfactant concention exeeds critical Monomer Concentration (cmc)
Proteins
• Hierachical structure
• Folded / Unfolded
+ = ?
Elaborated ITC Example: Protein-surfactant interactions Collaboration with P. Westh, L. Lundby-Hansen
Practical relevance: Detergent Enzyme industry

EMBO Course, Beijing, April-May, 2011 Dias 20
Air Water
Surfactants and the critical micellar concentration (CMC)
Ln (Concentration)
Sur
face
ten
sion
, γ
(mJ/
m2 )
Air Water
Critical micellar concentration

EMBO Course, Beijing, April-May, 2011 Dias 21
ITC – Typical data set: -As obtained in Prof. Peter Westh’s Lab., Denmark
HiC protein (an enzyme) titrated with the detergent SDS
Raw data
ITC data

EMBO Course, Beijing, April-May, 2011 Dias 22
Critical micellar concentration
Demicellization versus temperature
ΔHdemic = 0 at 22ºC
CMCSDS = 2.2 mM at 22ºC
Buffer: 50 mM TRIS, 2 mM EDTA, pH=7
ΔHdemic is T-dependent => We can “contrast-match” it out at a given temperature

EMBO Course, Beijing, April-May, 2011 Dias 23
ITC-scans of protein-surfactant interactions at 22 C
SDS-HiC (Humicola insolens
pisi cutinase) SDS-BSA (Bovine Serum Albumin)
Data suggest that there is more information than Tanfords ”Each g protein binds 1.4 g SDS”:
”Thermodynamic fingerprint”

EMBO Course, Beijing, April-May, 2011 Dias 24
Complementarity between SANS/SAXS and ITC
SANS Very detailed structural information can be obtained
Time consuming, requires large facility, 1 sample takes 2 hours at the SANS-II at PSI. Data analysis may be relatively complicated
ITC Measures of enthalpy of surfactant-protein interactions. ”Thermodynamic fingerprint”
Small laboratory based instrument, 1 full titration scan takes about 3-6 hours
No structural information

EMBO Course, Beijing, April-May, 2011 Dias 25
Focus: SDS:BSA system and its thermodynamic finger print. At the very beginning …..
A B C
A: Specific binding
E
B: ?
C: ?
D: ?
E: Saturation
D

EMBO Course, Beijing, April-May, 2011 Dias 26
SDS concentration
Plot as a function of
SDS-BSA Molar ratio
Vary BSA concentration

EMBO Course, Beijing, April-May, 2011 Dias 27
Concentration dependence of titration scans Identify characteristic points

EMBO Course, Beijing, April-May, 2011 Dias 28
Intercept at [BSA]=0 gives free monomer concentration at given point,
Slope gives binding number

EMBO Course, Beijing, April-May, 2011 Dias 29 Realistic ?
Binding Isotherm determined from ITC

EMBO Course, Beijing, April-May, 2011 Dias 30
Performed SANS measurements along the titration scan
A B C
A: Specific binding
E
B: ?
C: ?
D: ?
E: Saturation
D

EMBO Course, Beijing, April-May, 2011 Dias 31
SANS data (pure sds, pure bsa and mixtures)
BSA SDS BSA:SDS MR=50
I(q)
p(r): Pair Distance
Distribution
function
Step 1: Use this for determining the forward Scattering I(0), (via IFT)

EMBO Course, Beijing, April-May, 2011 Dias 32
Binding Isotherm determined from ITC and from SANS
So our ITC point-plot-method gives the same
binding isotherms as we obtain from SANS

EMBO Course, Beijing, April-May, 2011 Dias 33
Thermodynamic finger print and structure of surfactant protein complexes
A B C
A: Strong Specific binding
E
B: Strong increase of Cfree – Weak increase
of binding number
C: 1st unfolding,
Size of complex and
Cfree increases
D: 2nd unfolding Further elongation of complex, Cfree increases weakly
E: Saturated
complexes,
monomers
and micelles
D
Nbinding at saturation: 210 SDS per BSA,
=0.9 g SDS per g BSA

EMBO Course, Beijing, April-May, 2011 Dias 34
Closing remarks
Practically any physical or chemical process absorbs or releases heat – hence it can be followed by calorimetry.
If the qualitative# nature of the process is known, calorimetry is often effective and easy to use. If it is not, the method is often useless.
• # E.g. a structural, general or molecular understanding of the process
⇒ Structural and calorimetric methods are very strong in combination !
For example SANS and ITC can be used in combination to obtain a very detailed quantitative understanding of the SDS-Induced protein unfolding