Embed Size (px)
Citation preview
Europe | Themes & Tactics
Europe Insights 11 October 2016
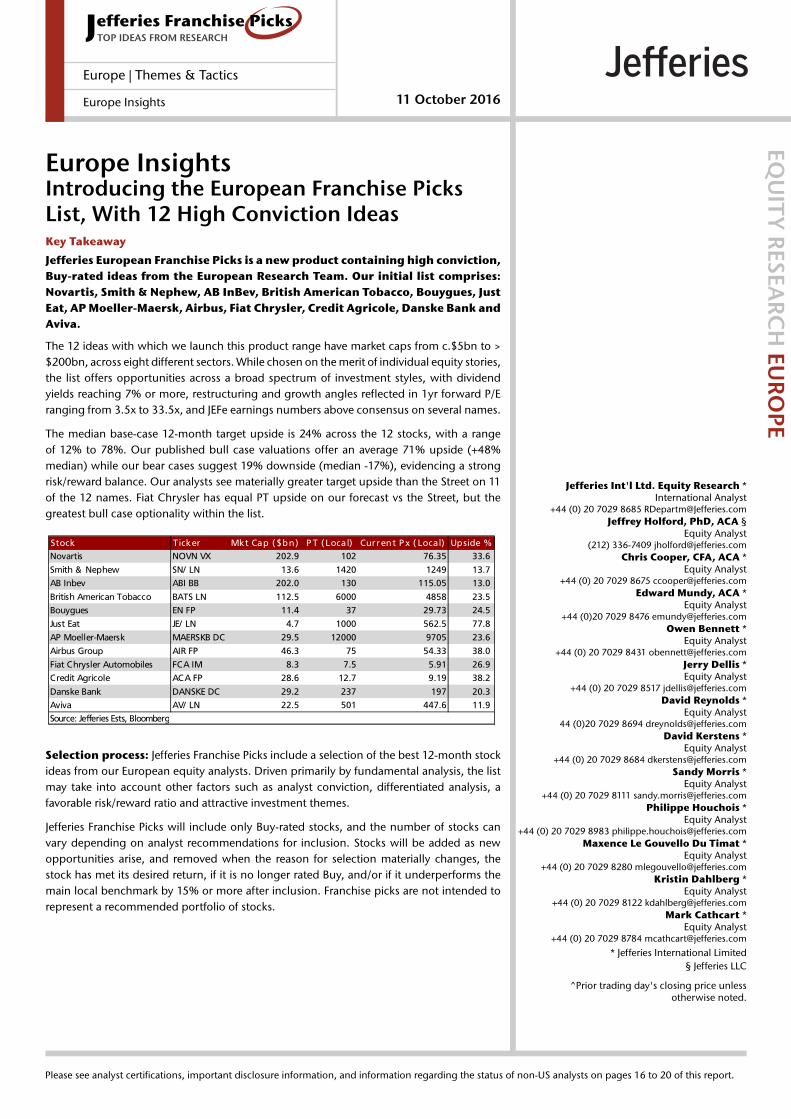
Europe InsightsIntroducing the European Franchise PicksList, With 12 High Conviction Ideas
EQU
ITY R
ESEARC
H EU
ROPE
Jefferies Int'l Ltd. Equity Research *International Analyst
+44 (0) 20 7029 8685 [email protected] Holford, PhD, ACA §
Equity Analyst(212) 336-7409 [email protected]
Chris Cooper, CFA, ACA *Equity Analyst
+44 (0) 20 7029 8675 [email protected] Mundy, ACA *
Equity Analyst+44 (0)20 7029 8476 [email protected]
Owen Bennett *Equity Analyst
+44 (0) 20 7029 8431 [email protected] Dellis *Equity Analyst
+44 (0) 20 7029 8517 [email protected] Reynolds *
Equity Analyst44 (0)20 7029 8694 [email protected]
David Kerstens *Equity Analyst
+44 (0) 20 7029 8684 [email protected] Morris *
Equity Analyst+44 (0) 20 7029 8111 [email protected]
Philippe Houchois *Equity Analyst
+44 (0) 20 7029 8983 [email protected] Le Gouvello Du Timat *
Equity Analyst+44 (0) 20 7029 8280 [email protected]
Kristin Dahlberg *Equity Analyst
+44 (0) 20 7029 8122 [email protected] Cathcart *
Equity Analyst+44 (0) 20 7029 8784 [email protected]
* Jefferies International Limited § Jefferies LLC
^Prior trading day's closing price unlessotherwise noted.
Key Takeaway
Jefferies European Franchise Picks is a new product containing high conviction,Buy-rated ideas from the European Research Team. Our initial list comprises:Novartis, Smith & Nephew, AB InBev, British American Tobacco, Bouygues, JustEat, AP Moeller-Maersk, Airbus, Fiat Chrysler, Credit Agricole, Danske Bank andAviva.
The 12 ideas with which we launch this product range have market caps from c.$5bn to >$200bn, across eight different sectors. While chosen on the merit of individual equity stories,the list offers opportunities across a broad spectrum of investment styles, with dividendyields reaching 7% or more, restructuring and growth angles reflected in 1yr forward P/Eranging from 3.5x to 33.5x, and JEFe earnings numbers above consensus on several names.
The median base-case 12-month target upside is 24% across the 12 stocks, with a rangeof 12% to 78%. Our published bull case valuations offer an average 71% upside (+48%median) while our bear cases suggest 19% downside (median -17%), evidencing a strongrisk/reward balance. Our analysts see materially greater target upside than the Street on 11of the 12 names. Fiat Chrysler has equal PT upside on our forecast vs the Street, but thegreatest bull case optionality within the list.
Stock Ticker Mkt Cap ( $bn) P T ( Local) Current Px ( Local) Upside %
Novartis NOVN VX 202.9 102 76.35 33.6
Smith & Nephew SN/ LN 13.6 1420 1249 13.7
AB Inbev ABI BB 202.0 130 115.05 13.0
British American Tobacco BATS LN 112.5 6000 4858 23.5
Bouygues EN FP 11.4 37 29.73 24.5
Just Eat JE/ LN 4.7 1000 562.5 77.8
AP Moeller-Maersk MAERSKB DC 29.5 12000 9705 23.6
Airbus Group AIR FP 46.3 75 54.33 38.0
Fiat Chrysler Automobiles FCA IM 8.3 7.5 5.91 26.9
Credit Agricole ACA FP 28.6 12.7 9.19 38.2
Danske Bank DANSKE DC 29.2 237 197 20.3
Aviva AV/ LN 22.5 501 447.6 11.9
Source: Jefferies Ests, Bloomberg
Selection process: Jefferies Franchise Picks include a selection of the best 12-month stockideas from our European equity analysts. Driven primarily by fundamental analysis, the listmay take into account other factors such as analyst conviction, differentiated analysis, afavorable risk/reward ratio and attractive investment themes.
Jefferies Franchise Picks will include only Buy-rated stocks, and the number of stocks canvary depending on analyst recommendations for inclusion. Stocks will be added as newopportunities arise, and removed when the reason for selection materially changes, thestock has met its desired return, if it is no longer rated Buy, and/or if it underperforms themain local benchmark by 15% or more after inclusion. Franchise picks are not intended torepresent a recommended portfolio of stocks.
Please see analyst certifications, important disclosure information, and information regarding the status of non-US analysts on pages 16 to 20 of this report.

Summary of Contents Page
Investment Themes/Styles 2
Cornerstones of Conviction Across the 12 Picks 3
Novartis – Jeff Holford, Global Pharma, Tel: +1 212 336 7409, Email: [email protected] 4
Smith & Nephew – Chris Cooper, European Medtech, Tel: +44 207 029 8675, Email: [email protected] 5
AB InBev – Ed Mundy, Global Beverages, Tel: +44 207 029 8476, Email: [email protected] 6
British American Tobacco – Owen Bennett, Global Tobacco, Tel: +44 207 029 8431, Email: [email protected] 7
Bouygues – Jerry Dellis, European Telecoms, Tel: +44 207 029 8517, Email: [email protected] 8
Just Eat – David Reynolds, European Internet, Tel: +44 207 029 8694, Email: [email protected] 9
AP Moeller-Maersk – David Kerstens, European Transport & Logistics, Tel: +44 207 029 8684, Email: [email protected] 10
Airbus Group – Sandy Morris, European Aerospace & Defence, Tel: +44 207 029 8111, Email: [email protected] 11
Fiat Chrysler – Philippe Houchois, Global Autos, Tel: +44 207 029 8983, Email: [email protected] 12
Credit Agricole – Maxence Le Gouvello du Timat, European Banks, Tel: +44 207 029 8280, Email: [email protected] 13
Danske Bank – Kristin Dahlberg, European Banks, Tel: +44 207 029 8122, Email: [email protected] 14
Aviva – Mark Cathcart, European Insurance, Tel: +44 207 029 8784, Email: [email protected] 15
Investment Themes/Styles
While the stocks included in this list have been selected on the merit of their individual equity stories, there are many common threads
across the group that could appeal to investors searching for particular themes or styles of investment opportunity.
Management Teams Integrating Acquisitions – AB InBev, Aviva
Business Mix Shifts and Restructuring Stories – Credit Agricole, AP Moeller-Maersk, Fiat
Positive Margin Developments – AB InBev, Just Eat, Fiat, Danske Bank, Smith & Nephew, Bouygues, BATS
Revenue Growth Opportunities – Just Eat, Bouygues, AB InBev, British American Tobacco, Smith & Nephew
FCF Improvement – Airbus, Bouygues
Yield Opportunities – Aviva, British American Tobacco, Credit Agricole, Danske Bank, Bouygues
Market Share Gains – Bouygues, British American Tobacco, AP Moeller-Maersk
Potential Consensus Beaters – Novartis, AB InBev, British American Tobacco, Just Eat
Themes & Tactics
Europe Insights
11 October 2016
page 2 of 20 , International Analyst, +44 (0) 20 7029 8685, [email protected] Jefferies Int'l Ltd. Equity Research
Please see important disclosure information on pages 16 - 20 of this report.

Cornerstones of Conviction
Novartis (NOVN VX) – Jeff Holford
Our Sept ’16 Entresto survey confirmed that payer barriers are starting to ease, while cardiologists’ prescribing intentions are increasing.
Smith & Nephew (SN/ LN) – Chris Cooper
Detailed scenario analysis on the impact of CJR found only (0.7)-(1.0)% EPS impact FY16-20, which should allay concerns on the subject.
As much as 33%-50% of treatment cost is borne in post-acute care and, since not included in the DRG payment, is a far easier and quicker
way to recognise progress. Proprietary survey of 55 orthopaedic surgeons supports our analysis.
AB InBev (ABI BB) – Ed Mundy
Our €130 PT is predicated on delivery of US$3bn cost saves on the SABMiller deal vs guidance US$1.4bn, where we have high conviction
in ABI over-delivering. In our long-range outlook, we think a share price of €180-200 is justified (by 2022) through delivery on the Dream
Incentive Plan and reaching a US$100bn revenue target.
British American Tobacco (BATS LN) – Owen Bennett
Share gains possible (understanding segment exposure important); emerging strength (ex-problem markets, we show growth has
remained impressive elsewhere); self-help for another 3-4 years; strong Reynolds contribution (standalone coverage).
Bouygues (EN FP) – Jerry Dellis
Bouygues is trading on an attractive 18/19e EqFCF yield of 5.9%-8.0%. With operating momentum likely to pick up in the construction
assets and Bouygues’ stand-out growth in mobile likely to be sustained, we believe the stock should merit a tighter yield.
Just Eat (JE/ LN) – David Reynolds
We see Just Eat winning the competitive battle in its key UK market (64% of revs, 44% growth), and as we explored in the ‘Modelling a
2025 margin’ note, a 70% EBITDA margin seems achievable. Our recent initiation on Grubhub explored why Grubhub was compelled to
invest in ‘last mile’ and concluded that Just Eat addresses fundamentally more attractive end markets and appears to be executing better.
AP Moeller-Maersk (MAERSKB DC) – David Kerstens
Maersk Line is set to further gain market share, benefiting from a flight to safety in the financially distressed container shipping industry,
with dangerously high debt levels at 13x FY16E EBITDA (versus Maersk 1.5x FY16E EBITDA). Customers started to move volume to safer
carriers in 1H16, a trend we expect to accelerate in 2H16 after Hanjin Shipping in Korea went into receivership.
Airbus Group (AIR FP) – Sandy Morris
Our cornerstone is FCF. We estimate there are around 45 A350s in various stages of final assembly. As Airbus aims for a less than three-
month lead-time, those 45 aircraft could support production of 10/month once Airbus gets up the learning curve. That means pre-delivery
payments and, in time, profits all turn into FCF. Add positive FX & higher pricing on the A320neo and the impact on FCF is very material.
Fiat Chrysler (FCA IM) — Philippe Houchois
Consensus appears focused on risk from financial leverage; we argue that without a captive finco, FCA can sustain more debt and over the
coming quarters, reduced net capitalisation of R&D will improve earnings quality while reduced interest expense will support above
industry average earnings growth.
Credit Agricole (ACA FP) – Maxence le Gouvello du Timat
Our bottom-up breakdown of the group’s new industrial plan highlights where group earnings growth comes from over the next four
years. We see the mix as favourable as it is geared towards activities with high P/E and strong cash generation. By 2019, Asset Gathering
will be the key driver, accounting for 36% of group net income. CA SA’s core activities should reach a 12.8% RONCA by 2019.
Danske Bank (DANSKE DC) – Kristin Dahlberg
Expanding mortgage margins, cost efficiency potential, improving asset quality and share buybacks combine to support at least 8% EPS
adj CAGR 2016-18. The 15.8% CET 1 ratio vs required 11.9% and 60bps capital generation/q adds to advantages. The combination of
margin expansion, cost efficiency potential and improving asset quality is unique among European banks.
Aviva (AV/LN) – Mark Cathcart
Over the long term, we view Aviva evolving as the composite leader with its cross-sell push in the UK as peers remain focused on
alternative markets (Pru in US /Asia) or niche products (AM at Standard Life, bulks at L&G). In addition to organic capability, our cash
generation forecasts support an additional 1%-2% growth pa from reinvestment of the £300m excess capital generated.
Themes & Tactics
Europe Insights
11 October 2016
page 3 of 20 , International Analyst, +44 (0) 20 7029 8685, [email protected] Jefferies Int'l Ltd. Equity Research
Please see important disclosure information on pages 16 - 20 of this report.
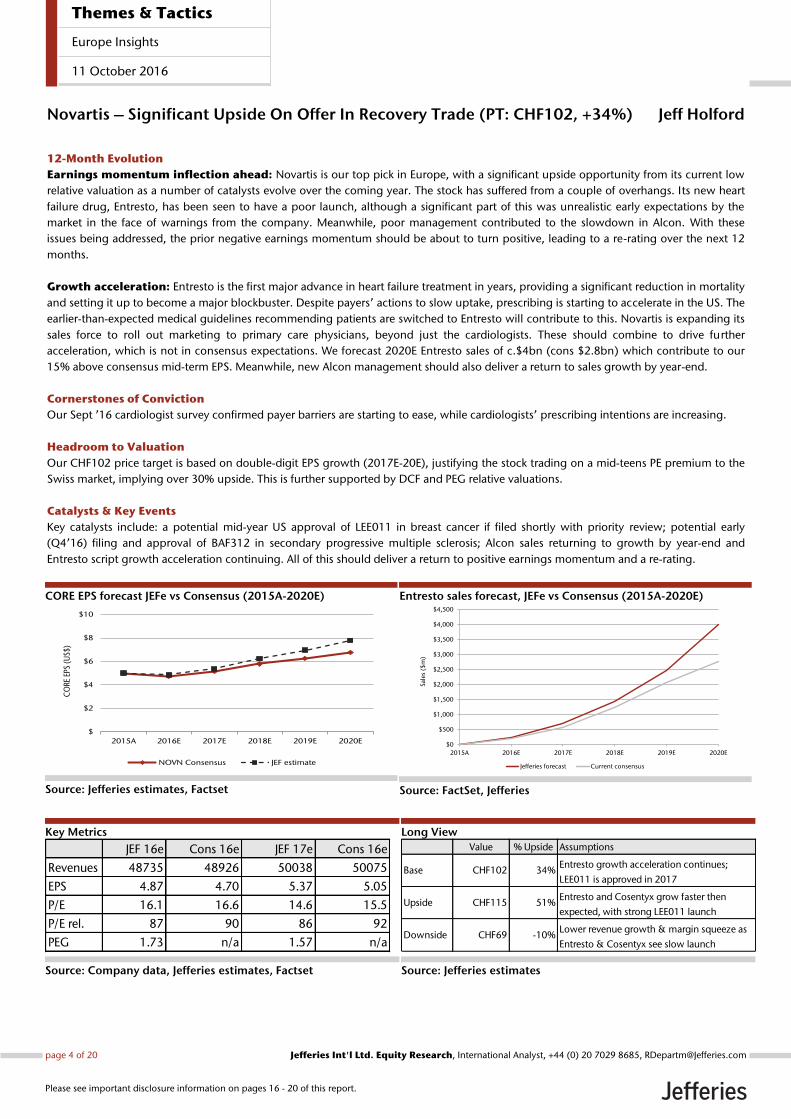
Novartis – Significant Upside On Offer In Recovery Trade (PT: CHF102, +34%) Jeff Holford
12-Month Evolution
Earnings momentum inflection ahead: Novartis is our top pick in Europe, with a significant upside opportunity from its current low
relative valuation as a number of catalysts evolve over the coming year. The stock has suffered from a couple of overhangs. Its new heart
failure drug, Entresto, has been seen to have a poor launch, although a significant part of this was unrealistic early expectations by the
market in the face of warnings from the company. Meanwhile, poor management contributed to the slowdown in Alcon. With these
issues being addressed, the prior negative earnings momentum should be about to turn positive, leading to a re-rating over the next 12
months.
Growth acceleration: Entresto is the first major advance in heart failure treatment in years, providing a significant reduction in mortality
and setting it up to become a major blockbuster. Despite payers’ actions to slow uptake, prescribing is starting to accelerate in the US. The
earlier-than-expected medical guidelines recommending patients are switched to Entresto will contribute to this. Novartis is expanding its
sales force to roll out marketing to primary care physicians, beyond just the cardiologists. These should combine to drive further
acceleration, which is not in consensus expectations. We forecast 2020E Entresto sales of c.$4bn (cons $2.8bn) which contribute to our
15% above consensus mid-term EPS. Meanwhile, new Alcon management should also deliver a return to sales growth by year-end.
Cornerstones of Conviction
Our Sept ’16 cardiologist survey confirmed payer barriers are starting to ease, while cardiologists’ prescribing intentions are increasing.
Headroom to Valuation
Our CHF102 price target is based on double-digit EPS growth (2017E-20E), justifying the stock trading on a mid-teens PE premium to the
Swiss market, implying over 30% upside. This is further supported by DCF and PEG relative valuations.
Catalysts & Key Events
Key catalysts include: a potential mid-year US approval of LEE011 in breast cancer if filed shortly with priority review; potential early
(Q4’16) filing and approval of BAF312 in secondary progressive multiple sclerosis; Alcon sales returning to growth by year-end and
Entresto script growth acceleration continuing. All of this should deliver a return to positive earnings momentum and a re-rating.
CORE EPS forecast JEFe vs Consensus (2015A-2020E)
Source: Jefferies estimates, Factset
Entresto sales forecast, JEFe vs Consensus (2015A-2020E)
Source: FactSet, Jefferies
Key Metrics
Source: Company data, Jefferies estimates, Factset
Long View
Source: Jefferies estimates
$
$2
$4
$6
$8
$10
2015A 2016E 2017E 2018E 2019E 2020E
CO
RE E
PS (
US$
)
NOVN Consensus JEF estimate
$0
$500
$1,000
$1,500
$2,000
$2,500
$3,000
$3,500
$4,000
$4,500
2015A 2016E 2017E 2018E 2019E 2020E
Sale
s ($
m)
Jefferies forecast Current consensus
JEF 16e Cons 16e JEF 17e Cons 16e
Revenues 48735 48926 50038 50075
EPS 4.87 4.70 5.37 5.05
P/E 16.1 16.6 14.6 15.5
P/E rel. 87 90 86 92
PEG 1.73 n/a 1.57 n/a
Value % Upside Assumptions
Base CHF102 34%Entresto growth acceleration continues;
LEE011 is approved in 2017
Upside CHF115 51%Entresto and Cosentyx grow faster then
expected, with strong LEE011 launch
Downside CHF69 -10%Lower revenue growth & margin squeeze as
Entresto & Cosentyx see slow launch
Themes & Tactics
Europe Insights
11 October 2016
page 4 of 20 , International Analyst, +44 (0) 20 7029 8685, [email protected] Jefferies Int'l Ltd. Equity Research
Please see important disclosure information on pages 16 - 20 of this report.
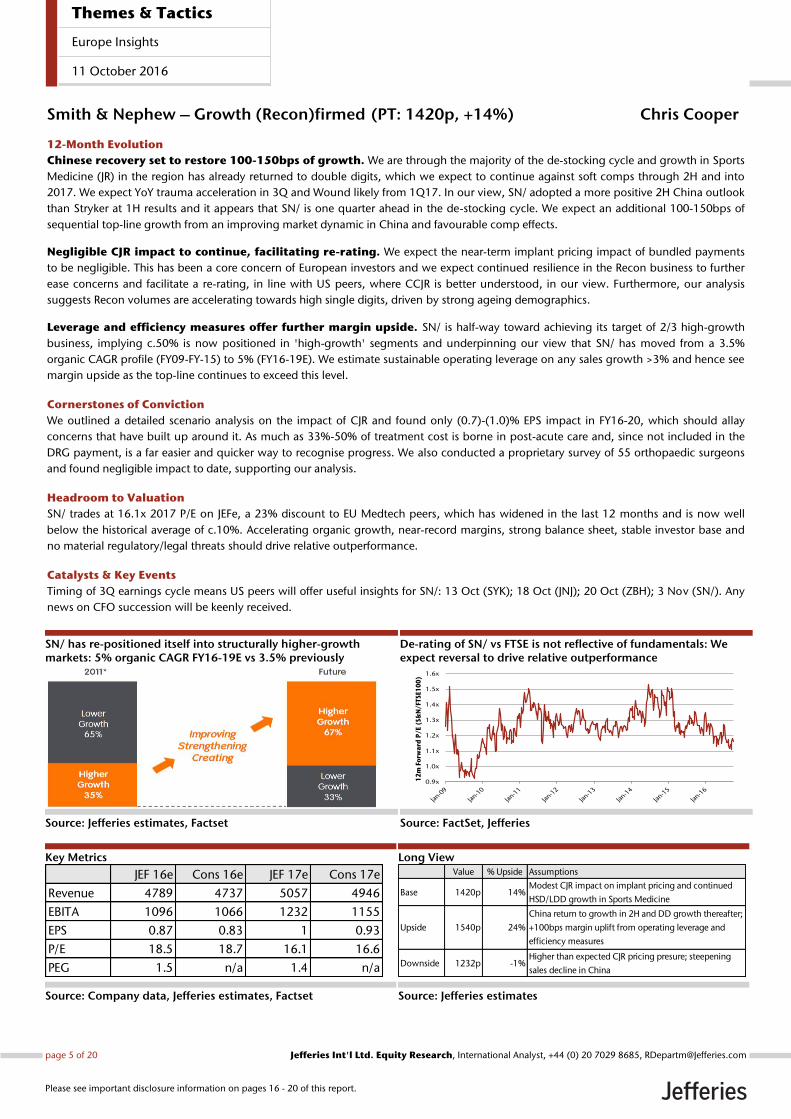
Smith & Nephew – Growth (Recon)firmed (PT: 1420p, +14%) Chris Cooper
12-Month Evolution
Chinese recovery set to restore 100-150bps of growth. We are through the majority of the de-stocking cycle and growth in Sports
Medicine (JR) in the region has already returned to double digits, which we expect to continue against soft comps through 2H and into
2017. We expect YoY trauma acceleration in 3Q and Wound likely from 1Q17. In our view, SN/ adopted a more positive 2H China outlook
than Stryker at 1H results and it appears that SN/ is one quarter ahead in the de-stocking cycle. We expect an additional 100-150bps of
sequential top-line growth from an improving market dynamic in China and favourable comp effects.
Negligible CJR impact to continue, facilitating re-rating. We expect the near-term implant pricing impact of bundled payments
to be negligible. This has been a core concern of European investors and we expect continued resilience in the Recon business to further
ease concerns and facilitate a re-rating, in line with US peers, where CCJR is better understood, in our view. Furthermore, our analysis
suggests Recon volumes are accelerating towards high single digits, driven by strong ageing demographics.
Leverage and efficiency measures offer further margin upside. SN/ is half-way toward achieving its target of 2/3 high-growth
business, implying c.50% is now positioned in 'high-growth' segments and underpinning our view that SN/ has moved from a 3.5%
organic CAGR profile (FY09-FY-15) to 5% (FY16-19E). We estimate sustainable operating leverage on any sales growth >3% and hence see
margin upside as the top-line continues to exceed this level.
Cornerstones of Conviction
We outlined a detailed scenario analysis on the impact of CJR and found only (0.7)-(1.0)% EPS impact in FY16-20, which should allay
concerns that have built up around it. As much as 33%-50% of treatment cost is borne in post-acute care and, since not included in the
DRG payment, is a far easier and quicker way to recognise progress. We also conducted a proprietary survey of 55 orthopaedic surgeons
and found negligible impact to date, supporting our analysis.
Headroom to Valuation
SN/ trades at 16.1x 2017 P/E on JEFe, a 23% discount to EU Medtech peers, which has widened in the last 12 months and is now well
below the historical average of c.10%. Accelerating organic growth, near-record margins, strong balance sheet, stable investor base and
no material regulatory/legal threats should drive relative outperformance.
Catalysts & Key Events
Timing of 3Q earnings cycle means US peers will offer useful insights for SN/: 13 Oct (SYK); 18 Oct (JNJ); 20 Oct (ZBH); 3 Nov (SN/). Any
news on CFO succession will be keenly received.
SN/ has re-positioned itself into structurally higher-growth markets: 5% organic CAGR FY16-19E vs 3.5% previously
Source: Jefferies estimates, Factset
De-rating of SN/ vs FTSE is not reflective of fundamentals: We expect reversal to drive relative outperformance
Source: FactSet, Jefferies
Key Metrics
Source: Company data, Jefferies estimates, Factset
Long View
Source: Jefferies estimates
0.9x
1.0x
1.1x
1.2x
1.3x
1.4x
1.5x
1.6x
12
m F
orw
ard
P/E
(S&
N/F
TSE
10
0)
JEF 16e Cons 16e JEF 17e Cons 17e
Revenue 4789 4737 5057 4946
EBITA 1096 1066 1232 1155
EPS 0.87 0.83 1 0.93
P/E 18.5 18.7 16.1 16.6
PEG 1.5 n/a 1.4 n/a
Value % Upside Assumptions
Base 1420p 14%Modest CJR impact on implant pricing and continued
HSD/LDD growth in Sports Medicine
Upside 1540p 24%
China return to growth in 2H and DD growth thereafter;
+100bps margin uplift from operating leverage and
efficiency measures
Downside 1232p -1%Higher than expected CJR pricing presure; steepening
sales decline in China
Themes & Tactics
Europe Insights
11 October 2016
page 5 of 20 , International Analyst, +44 (0) 20 7029 8685, [email protected] Jefferies Int'l Ltd. Equity Research
Please see important disclosure information on pages 16 - 20 of this report.

AB InBev – Living the Dream (PT: €130, +13%) Ed Mundy
12-Month Evolution
Over-delivery of SABMiller cost cutting: Given our more aggressive cost cutting targets ($3bn vs guidance “at least $1.4bn”),
we are 6% ahead of FY17 consensus and 9% ahead of FY18. Key analysis includes a deep dive on ABI/SAB cost bases and in-depth analysis
of previous transactions. See: Living the dream. This is the key driver of our 12M €130 PT.
Driving sustainable medium-term revenue growth +6%: Top-line revenue growth is an increasingly important metric for the
group. Our bottom-up review of ABI-SAB's footprint shows the potential value uplift over the medium term from revenue synergies
(worth €3-6 per share), and increasing low alcohol mix (worth an incremental €3-19 per share). While revenue benefits are unlikely to be
quantified, we see potential for stronger revenue management at SABMiller under new ownership.
Further value-accretive M&A: Although the pace of M&A will naturally slow, we estimate EPS accretion of over 10% from the buy-in
of SABMiller’s associate positions. This is reminiscent of the BUD transaction, which offered a c.10% earnings kicker through the Modelo
deal.
Cornerstones of Conviction
Our €130 PT is predicated on delivery of US$3bn cost saves on the SABMiller deal vs guidance US$1.4bn, where we have high
conviction in ABI over-delivering. In our long-range outlook, per our initiation report of 13 September, Living the dream, we think a
share price of €180-200 is justified (by 2022) through delivery on the Dream Incentive Plan and reaching a US$100bn revenue target. Key
steps are 1) over-delivery on SABMiller cost saves, 2) driving sustainable medium-term revenue growth +6% and 3) further value-
accretive M&A (over 10% accretive to EPS)
Headroom to Valuation
ABI trades on cal 2018 p/e 21.2x on JEFe, in line with global staples 20.1x. FCF yield 5.0% and dividend yield 3.4% Our DCF driven PT of
€130 implies a 15% premium to global staples, a re-rating warranted given the company's durable competitive advantages, earnings
potential & balance sheet optionality. ‘Blue sky’ scenario of €180-200 is justified (by 2022) by delivering on the Dream incentive plan.
Catalysts & Key Events
Post the deal completion on 10 October, we believe that 16Q3 reporting on the 28 October is too soon for upgrades to guidance on cost
savings targets. Therefore, we expect limited new news on the deal until full-year results in March 2017, when we expect synergy targets
to be upgraded. We acknowledge some 'detail risk' on the SABMiller transaction, such as the combined entity’s effective tax rate.
However, we believe the long-term arguments are sufficiently compelling to recommend a Buy on ABI.
Upside to US$1.4bn synergy target: We estimate US$3bn
Source: Jefferies estimates, Factset
Dream 2020: US$100bn revenue bridge by 2022
Source: FactSet, Jefferies
Key Metrics
Source: Jefferies estimates, Factset
Long View
Source: Jefferies estimates
JEF 17e Cons 17e JEF 18e Cons 18e
Revenue 57,509 57,812 59,936 60,194
Organic sales 5.9% 4.9% 5.9% 6.0%
EBITDA (adj) 23,786 22,163 25,784 23,818
EBITDA margin 41.4% 38.3% 43.0% 39.6%
EPS (adj) 5.57 5.32 6.18 5.72
P/E 23.5x n/a 21.2x n/a
FCF Yield 4.5% n/a 5.0% n/a
Value % Upside Assumptions
Base €130 13%$3bn synergies vs guidance $1.4bn and +6%
oragnic revenue growth FY17-19E
Upside €200 74%Achievement of $100bn revenue target by 2022.
Successful roll out of premium brand stretegy
Downside €90 -22%
Failure to integrate SAB. Every $200m synergies is
1% to earnings. Higher tax rate, we assume 23-
24% (no guidance).
Themes & Tactics
Europe Insights
11 October 2016
page 6 of 20 , International Analyst, +44 (0) 20 7029 8685, [email protected] Jefferies Int'l Ltd. Equity Research
Please see important disclosure information on pages 16 - 20 of this report.

British American Tobacco – Momentum Building Again (PT: 6000p, 24%) Owen Bennett
12-Month Evolution
Share gains persisting: BAT has been the best performer over the last few years. Share strength is driven by over-indexation to
innovation, best balanced portfolio across premium, mid and value, skew to adult smokers under 30, and geographic positioning. We
expect share gains to persist and see FY16 organic volumes as the best across the global peers.
Margins rebounding: Margins that fell in FY15 are expected to be down again in FY16 which has weighed on the stock. We expect
margins to rebound in FY17; first evidence will be 1H17 numbers as the 1Q17 release is sales only. We would expect commitment to 50-
100bps at FY16 year-end results, however and see lots of room for further margin development in the years ahead.
Increasing credit for e-vapour: We think a key reason for PMI’s inflated multiple is credit given for potential e-vapour value (as per our
sector initiation, this could be significant). As BAT rolls out its own products more aggressively/launches its own heat not burn (vapour
device we see getting most growth — due in a test city at the end of this year), we would expect it’s multiple to see support.
Cornerstones of Conviction
Share gains possible (understanding segment exposure important); emerging strength (stripping out problem markets, we show growth
has remained impressive elsewhere); self-help for another 3-4 years (benchmarking core cigarette costs to peers, adjusting for business
model differences/vapour spend); Reynolds contribution (standalone coverage). Recent BAT note looks at all these areas in detail.
Headroom to Valuation
Our PT implies NTM PE of 19.5x, based on separate 10-year DCFs for vapour and cigarettes, applying different TGRs. Key metric for us is
EV/EBITDA as it strips out impact of Reynolds holding (25% of BAT value), leaving BATS roughly on par with Imperial and a 23% discount
to PMI.
Catalysts & Key Events
Nine-month sales 31 Oct (expect strong volumes and price/mix); 4Q16 (heat not burn launch); FY16 numbers Feb 2017 (co. guidance for
FY17 margins 50-100bps); 1H17 numbers Jul 2017 (evidence of margin rebound); Reynolds updates (strong share momentum).
Recent and expected cigarette share trends
Source: Jefferies estimates, Factset
Recent and expected margin development
Source: FactSet, Jefferies
Key Metrics
Source: Company data, Jefferies estimates, Factset
Long View
Source: Jefferies estimates
JEF 16e Cons 16e JEF 17e Cons 17e
Revenue 14,775 14,598 16,894 16,894
Org growth 5.6% 4.7% 5.8% 4.2%
EPS 247 244 288 274
PE 19.7 19.9 16.9 17.8
Divi Yield 3.3% 3.4% 3.7% 3.6%
Value % Upside Assumptions
Base 6000p 24%
Underlying emerging momentum remains strong,
problem markets see some recovery, margin
rebounds, robust vapour development.
Upside 6600p 36%
Emerging really accelerates including recovery in
problem markets, vapour growth better than
expected.
Downside 4500p -8%Emerging trends worsen, vapour business does
not develop as expected, Reynolds underperforms
Themes & Tactics
Europe Insights
11 October 2016
page 7 of 20 , International Analyst, +44 (0) 20 7029 8685, [email protected] Jefferies Int'l Ltd. Equity Research
Please see important disclosure information on pages 16 - 20 of this report.

Bouygues – Challenger Strategy on Track (PT: €37, +26%) Jerry Dellis
12-Month Evolution
Challenger strategy on track: In a four-player telecoms market, Bouygues’ logical incentive is to build revenue scale aggressively
while it retains a mobile network advantage over SFR and Free. To appeal more distinctly to mid/high-end 4G users (among whom it is
currently underrepresented), Bouygues adopted a flatter tariff structure in May. 2Q16 results revealed accelerating revenue growth,
twinned with margin expansion. This contrasted sharply against soft results from SFR and Orange.
Solid prospects for FCF recovery: FCF has been depressed at Bouygues in recent years by new entrant competition in telecoms and
weak demand in domestic construction activities. With EBITDA expected to grow starting in 2016, and non-recurring cash costs set to be
smaller, we believe that Adj. FCF post spectrum on our estimates will grow from €42m in 2016 to €569m in 2017. We believe this can be
achieved without reducing telecom capital expenditure and hence conceding network advantage.
A more upbeat tone: At the 2Q16 results, Bouygues management struck a more positive tone about domestic activity in contracting
construction, roads and property development. This was allied to a clear statement that Bouygues Telecom intends to sustain its
successful challenger tactics.
Cornerstones of Conviction
Bouygues is trading on an attractive 2018/19 EqFCF yield of 5.9%/8.0%. With operating momentum likely to pick up in the construction
assets and Bouygues’ stand-out growth in mobile likely to be sustained, we believe Bouygues should merit a tighter yield.
Headroom to Valuation
Our PT for Bouygues is €37, implying 26% upside. To arrive at this, we value the Telco asset on 7.5x EV/EBITDA (a justified premium to the
sector given the growth of BYG Tel) and the construction assets on 10.5x 2016 EV/EBIT (the blend of Vinci/Eiffage/Saint-Gobain and
others).
Catalysts & Key Events
The French telecoms operators report their results in the coming weeks; these could all act as catalysts: Orange (25 October), Iliad (27
October [Projected]), SFR (8 November) and Bouygues (16 November).
MSR Growth – BYG Stands Out
Source: Jefferies estimates, company data
Building Blocks of FCF Growth
Source: Jefferies estimates, company data
Key Metrics
Source: Company data, Jefferies estimates, Factset
Long View
Source: Jefferies estimates
-9.0%
-7.5%
-6.0%
-4.5%
-3.0%
-1.5%
0.0%
1.5%
3.0%
4.5%
1Q15 2Q15 3Q15 4Q15 1Q16 2Q16
ORA ORA ex-Free roaming SFR BYG
251 594 392 27 (302) (145) (117) 700
0
200
400
600
800
1,000
1,200
1,400
JEF 18e Cons 18e JEF 19e Cons 19e
Revs 33,179 33,332 33,869 33,805
EBITDA 3,005 2,996 3,154 3,065
Capex 1,568 1,553 1,551 1,601
OpFCF 1,438 1,443 1,603 1,464
Value % Upside Assumptions
Base €37 26%A material recovery in EBITDA margin with
the company still guiding to 25% in 2017.
Upside €41 40% Even greater mgn expansion at BYG Tel.
Downside €26 -12%Tougher French Macro limits construction
growth
Themes & Tactics
Europe Insights
11 October 2016
page 8 of 20 , International Analyst, +44 (0) 20 7029 8685, [email protected] Jefferies Int'l Ltd. Equity Research
Please see important disclosure information on pages 16 - 20 of this report.

Just Eat – Beat, Raise, Repeat (PT: 1000p, +78%) David Reynolds
12-Month Evolution
Upside risk to estimates: At IPO, we forecasted FY16E £231m revenue, JE printed £248m. In 2015, International revenues were £78m
bigger than the UK at IPO. For H116, UK revenues grew +43.7% YoY organically with adjusted EBITDA £58m, a 52% margin. The FY16
guide stepped up for the second time. No other stock in the European digital universe does that….we await the FY16 print in January
2017.
An archetypal online marketplace business model: Takeaway restaurants on one side, consumers on the other, Just Eat dominates
the most attractive geography globally, the UK, and is also the number one player in 11 other geographies. Once over the liquidity hump,
competitive dominance amplifies the network effect and super-normal margins become achievable. We see the existing UK business
leveraging the 13% commission rate to drive to +60% adjusted EBITDA margins and the future’s plot taking that towards 70%.
The ‘last mile delivery’ debate: A volatile equity, with an optically rich valuation, has ebbed and flowed on the winds of the ‘last mile’
debate. Much misunderstood. Deliveroo, Uber Eats et al compete in the casual dining franchise arena for a yield management opportunity
with restaurants that have never delivered. Just Eat competes in the independent takeaway restaurant arena, some 30,000 restaurants on
the UK network. Small businesses that deliver c.90% of volume, a majority of which comes on Friday and Saturday evenings. The
restaurants have always delivered, will always deliver. Only marginal overlap between the two propositions, ‘last mile’ and Just Eat.
Cornerstones of Conviction
The UK business, 64% revenue, growing +44% and driving 770 bps EBITDA margin expansion, we see Just Eat winning the competitive
battle in this key market, and as we explored in the ‘Modelling a 2025 margin’ note, (here) a 70% EBITDA margin seems achievable. Our
initiation on Grubhub disaggregated the income statement into the three key business lines, explored why Grubhub was compelled to
invest in ‘last mile’ and concluded that Just Eat addresses fundamentally more attractive end markets and appears to be executing better.
Headroom to Valuation
The clearest example of under-priced growth in the sector, in our view; Greatest upside surprise risk, 78% upside, PT 1000p.
Catalysts & Key Events
Q316 order update 3 November, FY16 print March 2017.
JEFe Revenue: Consistent beat and raise at JE/
Source: Jefferies estimates, Factset
Consistent incremental new orders p.m. (‘m)
Source: FactSet, Jefferies
Key Metrics
Source: Company data, Jefferies estimates, Factset
Long View
Source: Jefferies estimates
157.0
247.6
372.8
487.4
609.2
0
100
200
300
400
500
600
700
2014A 2015A 2016E 2017E 2018E
Initiation 02-Mar-15 20-May-15 12-Oct-15 Now
0
2
4
6
8
10
12
14
Jan
-13
Feb
-13
Mar-
13
Ap
r-1
3M
ay-1
3Ju
n-1
3Ju
l-1
3A
ug
-13
Sep
-13
Oct-
13
No
v-1
3D
ec-1
3Ja
n-1
4Feb
-14
Mar-
14
Ap
r-1
4M
ay-1
4Ju
n-1
4Ju
l-1
4A
ug
-14
Sep
-14
Oct-
14
No
v-1
4D
ec-1
4Ja
n-1
5Feb
-15
Mar-
15
Ap
r-1
5M
ay-1
5Ju
n-1
5Ju
l-1
5A
ug
-15
Sep
-15
Oct-
15
No
v-1
5D
ec-1
5Ja
n-1
6Feb
-16
Mar-
16
Ap
r-1
6M
ay-1
6Ju
n-1
6Ju
l-1
6A
ug
-16
Sep
-16
Oct-
16
No
v-1
6D
ec-1
6
1.8 per
month
1.0 per
month
1.6 per
month
2.2 per
month
2.4 per
month
1.4 per
month
1.6 per
month
1.8 per
month
1.9 per
month
1.0 per
month
1.1 per
month
1.3 per
month
Metric JEF 17e Cons 17e JEF 18e Cons 18e
Revenue 477.4 467.8 585.6 562.1
EBITDA 170.7 160.6 229.2 208.5
EPS (p) 18.1 16.7 25.0 22.2
EPS CAGR 57.6% 51.4% 57.6% 51.4%
P/E 30.8x 33.4x 22.4x 25.1x
PEG 0.5x 0.6x 0.4x 0.5x
Value % Upside Assumptions
Base 1000p 78%
Continued operational excellence, new
marketing campaign continues to strengthen
leadership
Upside 1500p 167%
Restaurants on the 14% comission rate increase,
market leadership in all countries continues to
strengthen
Downside 340p -40%
New comm rate sees higher levels of restaurants
churn and other geographies don't scale as
easily as the UK
Themes & Tactics
Europe Insights
11 October 2016
page 9 of 20 , International Analyst, +44 (0) 20 7029 8685, [email protected] Jefferies Int'l Ltd. Equity Research
Please see important disclosure information on pages 16 - 20 of this report.

AP Moeller-Maersk – All Hands on Deck (PT: DKK12,000, +24%) David Kerstens
12-Month Evolution
Breaking up the conglomerate: Maersk will break-up the conglomerate and focus on creating a more integrated transport & logistics
company around Maersk Line, while the energy businesses will be separated. This will unlock the hidden value in the conglomerate and
potentially free up to $16bn in capital (30% of JEFe NAV), for consolidation of Transport & Logistics and potentially special dividends.
Integrating Transport Logistics: Maersk Line, APM Terminals and Damco will increase collaboration and increasingly operate as one
integrated company, expected to result in cost synergies of $600m, enhancing ROIC by 2%, and an improved product offering, supported
by further digitisation. Maersk Line is one of the few remaining financially sound carriers and we expect it to continue to gain market share
on the back of a flight to safety. It is likely to emerge as the leading consolidator in the financially-distressed container shipping industry.
Separating Energy: Maersk will optimise the value of its energy division, while looking for different solutions for the individual
businesses, including separation of entities through joint ventures, mergers or listings within the next 24 months. This could potentially
release up to $16bn in capital, dependent on transaction structure and the retained family stake in Energy.
Cornerstones of Conviction
Maersk Line is set to further gain market share, benefiting from a flight to safety in the financially distressed container shipping industry,
with dangerously high debt levels at 13x FY16E EBITDA (versus Maersk 1.5x FY16E EBITDA). Customers started to move volume to safer
carriers in 1H16, a trend we expect to accelerate in 2H16 after Hanjin Shipping in Korea went into receivership.
Headroom to Valuation
Maersk shares are trading at a 60% discount to a synthetic peer group and a 24% discount to our SOTP-based NAV, which conservatively
values Maersk Line at 1.0x invested capital. Our DKK12,000 price target is based on a 10% conglomerate discount to our SOTP-based
NAV. Our upside scenario arrives at a fair value of DKK14,500, valuing Maersk Line at a 20% premium to invested capital.
Catalysts & Key Events
3Q16 results on 2 November are likely to reflect improved earnings momentum following the recent recovery of container freight rates,
while the Maersk Capital Markets Day in Copenhagen on 13 December is expected to provide further information on the new strategy.
High financial leverage (net debt / FY16E EBITDA)
Source: Jefferies estimates, Factset
More balanced container shipping market by FY18E
Source: Alphaliner, Maersk Line, Jefferies estimates
Key Metrics
Source: Company data, Jefferies estimates, Factset
Long View
Source: Jefferies estimates
Metric JEF 16e Cons 16e JEF 17e Cons 17e JEF 18e Cons 18e
Revenue 36,312 36,056 38,399 37,430 39,710 37,917
EBITDA 7,948 7,600 9,081 8,289 9,276 8,314
EPS 75 62 105 94 120 113
P/E 19.5 23.7 14.0 15.6 12.2 13.0
Value % Upside
Base DKK12,000 24%
Upside DKK14,500 48%
Downside DKK8,750 -11%
10% discount to SOTP-based NAV; Maersk
Line valued at invested capital
In line with SOTP-based NAV; Maersk Line at
20% premium to IC
28% discount to SOTP based NAV; Maersk
Line at 20% discount to IC
Assumptions
Themes & Tactics
Europe Insights
11 October 2016
page 10 of 20 , International Analyst, +44 (0) 20 7029 8685, [email protected] Jefferies Int'l Ltd. Equity Research
Please see important disclosure information on pages 16 - 20 of this report.

Airbus – Scramble! (PT: €75, +38%) Sandy Morris
12-Month Evolution
Getting through: In December 2014, Airbus guided for flat EBIT through FY15 and FY16, reflecting the start of A350 production and the
transition to the A330neo. Inevitably, not everything has gone smoothly. The A400M programme also reared its head again. Airbus
became vulnerable to concerns about the civil aircraft cycle. Much of the heavy lifting is, however, already behind us.
Visibility: We can now see A350 and A320neo deliveries rising. The airline traffic data remains satisfactory. There is still some execution
risk on A350-1000 and A330neo, but it is steadily reducing. The path of the US$/€ has also remained very positive for Airbus.
Scramble: We believe Airbus can make some progress in growing EBIT and FCF in 2017, a more helpful backdrop. The read across from
Boeing is that once a new aircraft programme gets into its stride, FCF strengthens materially. In short, the working capital for full-rate
A350 production is probably in place now. EBIT follows. We believe the future course of Airbus EBIT and FCF will be plain within 12
months.
Cornerstones of Conviction
Our cornerstone is FCF. We estimate there are around 45 A350s in various stages of final assembly. As Airbus aims for a less than three-
month lead-time, those 45 aircraft could support production of 10/month once Airbus gets up the learning curve. That means pre-delivery
payments and, in time, profits all turn into FCF. Add positive FX and higher pricing on the A320neo and the impact on FCF is very
material.
Headroom to Valuation
The current Airbus market capitalisation is around €42bn. Between 2017 and 2020, we forecast total FCF of around €14bn, almost 70% of
that arriving in 2019 and 2020. We believe our assumptions on aircraft deliveries are prudent, hence robust, and when there is no US$/€
hedging we assume US$1.35/€, an assumption that must rank as conservative. Earnings are also forecast to become supportive.
Catalysts & Key Events
We do not envisage there being a single catalyst or key event; rather we foresee it simply becoming apparent that Airbus is on course. We
do not rule out that happening this year, particularly if the airline traffic data remains satisfactory. Q3 earnings on 26 October.
JEFe FCF before M&A (€m)
Source: Jefferies estimates, Bloomberg
JEFe FCF Yield at various Share Prices
Source: Jefferies estimates, Bloomberg
Key Metrics
Source: Jefferies estimates, Bloomberg
Long View
Source: Jefferies estimates
JEF 17e Cons 17e JEF 18e Cons 18e
Revenue 66383 68456 68500 73650
EBIT 4163 4486 5481 5679
EPS 3.5 3.8 4.9 5.1
P/E 15.5 14.4 11.2 10.7
FCF Yield 3% 7%
Value % Upside Assumptions
Base €75 38%3-4% growth in air traffic, A350 program remains on
schedule, market's horizon extends to FY18
Upside €80 47%
A350 XWB production ramps more rapidly,
macro/traffic data better, orders secured for A330ceo,
exchange rate remains favourable
Downside €40 -26%A350 program encounters a problem, no additional
orders for A330ceo, airline traffic data weakens
Themes & Tactics
Europe Insights
11 October 2016
page 11 of 20 , International Analyst, +44 (0) 20 7029 8685, [email protected] Jefferies Int'l Ltd. Equity Research
Please see important disclosure information on pages 16 - 20 of this report.

Fiat Chrysler – Rare Equity Leverage (PT: €7.50, +27%) Philippe Houchois
12-Month Evolution
Soft-cycle: In line with our sector view of a ‘soft auto cycle’ ahead, we see high leverage at FCA as a valuation opportunity, with shares
currently trading on a price/sales multiple of 8% vs EV/sales of 18%. We see additional valuation support from management’s openness to
consolidation/cooperation agreements to reduce capital intensity and duplication.
Shift in NAFTA focus from cars to SUVs: FCA’s strategy to refocus existing NAFTA capacity on high-margin SUVs and cross-overs and
away from cars, which we believe have negative contribution, is consistent with durably changing customer preferences. FCA plans to
maintain its presence in cars through outsourcing agreements with other OEMs. We believe this will result in higher op. margins and
ROIC.
Product outlook and brand revival: In addition to production of Jeeps in China, FCA is ramping up three mix-enhancing products in
2016-2017: Chrysler Pacifica, Maserati Levante and Alfa-Romeo Giulia. Like peers Ford and GM, FCA remains highly dependent on the US
for profitability but its limited exposure to the UK, Jeep’s global expansion and product mix upgrade in LatAM will drive up its margins.
Cornerstones of Conviction
Consensus appears focused on risk from financial leverage, but without a captive finco FCA can sustain more debt and, over the coming
quarters, reduced net capitalisation of R&D will improve earnings quality and reduced interest expense will support better than industry
average earnings growth. We forecast 18% EPS growth (2016-2018E). Risk from financial leverage is also mitigated by asset disposals.
Headroom to Valuation
Over the years, one of the key drivers of FCA’s stock performance has been the company’s high equity leverage with P/S of 8% vs EV/sales
of 18%. Debt restructuring/refinancing should add €0.35-0.4 of EPS over 2016-18 and we estimate at €2-3bn the value of non-core asset
Magneti-Marelli, using the sector low-end multiple of Faurecia. Our PT of €7.5 is the average of our estimated through-the-cycle fair value
(€9) and our 2017E earnings – consolidated earnings at a PE of 6x and equity income at 5x. FCA is currently trading at the lower end of its
historical valuation range. On our 2017 estimates, FCA is currently trading at 0.18x sales, 4.6x EBIT and 4.0x PE.
Catalysts & Key Events
Q3 earnings on 25 October. We expect FCA to report adj. EBIT of €1.3bn with flat earnings in NAFTA and improved contribution from
Europe compensating for a weaker performance in LatAm. We see some downside risk from current negotiations with unions in Canada
and upside risk from further progress in securing an agreement to outsource car assembly and negotiations regarding asset disposals.
NA EBIT as % of Group EBIT ex. finco – 2017e
Source: Jefferies estimates, company data
JEF 2017e PE
Source: Jefferies estimates, company data
Key Metrics
Source: Company data, Jefferies estimates, Factset
Long View
Source: Jefferies estimates
82%101% 103%
0%
20%
40%
60%
80%
100%
120%
FCA Ford* GM
*Ford - EBT instead of EBIT
0.0x
1.0x
2.0x
3.0x
4.0x
5.0x
6.0x
7.0x
8.0x
FCA F GM RNO VOW3 UG
JEF 16e Cons 16e JEF 17e Cons 17e
Revenue 113,386 112,848 116,414 115,986
Group EBIT 5,660 5,493 5,550 5,914
EBIT margin 5.0% 4.9% 4.8% 5.1%
EPS 1.60 1.44 1.64 1.68
PE 4.63x 4.13x 3.96x 3.58x
Value % Upside Assumptions
Base € 7.50 27%Avg through the cycle fair value (€9), PE of 6x on
2017 consolidated earnings and 5x on equity
Upside € 19.00 221%5% cash R&D margin, interest cost down 20% to
€1.0bn would result in EPS of €2.4. PE of 8x.
Downside € 4.20 -29%2% cash R&D margin, €1.5bn interest charge
would take EPS to €0.7. PE of 6x.
Themes & Tactics
Europe Insights
11 October 2016
page 12 of 20 , International Analyst, +44 (0) 20 7029 8685, [email protected] Jefferies Int'l Ltd. Equity Research
Please see important disclosure information on pages 16 - 20 of this report.

Credit Agricole – Grand Cru Primeur (PT: €12.7, +38%) Maxence Le Gouvello
12-Month Evolution
Project Eureka: CA SA offers a restructuring story with a redefinition of the core business while paying a high dividend yield (8% in
2019E). New strategy is based on: 1) more balanced business mix and 2) simplification of the capital structure. The new business mix will
cover: a) Asset gathering, b) Retail banking (including foreign retail e.g. Italy), and c) Wholesale banking. The new mix will increase the
group’s exposure to higher P/E activities with AM/Insurance contribution increasing from 32% to 39%. The better and simplified structure
finally settles the capital debate.
Our expectations: We expect 2016 and 2017 group net income to grow modestly before reaping the benefits of the investments made
over 2018 and 2019. We see 13.9% annual group income growth over the last two years of the plan, to reach €4.2bn of net profit in
2019. We are below the company’s target as we haven’t fully priced in the benefit of repricing in IB and want to see the first stages of
implementation of this part of the plan before we factor in the full benefits. There might be further optionality to speed up asset
management growth from the acquisition of Pioneer AM by Amundi (CA SA owns 75% of Amundi); refer to our note here.
Cornerstones of Conviction
Our full bottom-up breakdown by business of the group’s new industrial plan highlighted where group earnings growth comes from over
the next four years, with Chart 1 depicting the net income share bridge up to 2019. We see the mix as favourable as it is geared towards
activities with high P/E and strong cash generations. By 2019, Asset Gathering will be the key driver, accounting for 36% of the group net
income, followed by International activities at 22%, SFS 18% and LCL (5%). CA SA’s core activities should reach a 12.8% RONCA (Return
on normalised core activities) by 2019 vs 2019 RoTE of 8.2%.
Headroom to Valuation
CA SA trades on 8.6X 2017 P/E, a 7.5% discount to the European bank sector, 0.55x 2017 TNAV and a 7.4% 2018 RoTE, in line with the
sector. The 2016 divi yield is >7%, a premium to its sector, and a net CF yield of 8.3%. We applied a 15% structural discount on CA SA,
which is half of its discount vs the Euro peers as we believe the actual 32% discount is exaggerated by CA SA having plenty of goodwill on
its books. Also, the new strategy has put an end to the complex structure relative to peers, which allows for a lower discount.
Catalysts & Key Events
3Q16 earnings on 8 November. Inflection in French retail.
Net Income group share bridge, 2015-2019
Source: Jefferies estimates, Company data
Share price performance, 12 m PT and scenarios
Source: FactSet, Jefferies
Key Metrics
Source: Company data, Jefferies estimates, Factset
Long View
Source: Jefferies estimates
JEFe Cons JEF vs Cons
EPS 2018e (clean) 1.13 1.08 4.6%
EPS 2017e (clean) 0.94 0.98 -4.1%
Net Income 2018e 3,652 3,158 15.6%
Net Income 2017e 3,134 2,814 11.4%
P/E 18e 8.20 7.96 3.1%
Divi yield 18e 6.2% 6.8%
Value % Upside Assumptions
Base €12.70 38%
Low CoR, slow improvement in rates,
consistent delivery of the new plan. 15x
2017 P/E, 0.95x 2017 P/TBV
Upside €17.00 85%
External growth in AM, Successful repricing
in IB, increase in interest rates. 13x 2017 P/E,
1.11x 2017 PTBV
Downside €5.60 -39%
Slow implementation of the new plan,
Persistent low rates and stagnant European
economy. 18x 2017 P/E, 0.4x 2017 P/TBV
Themes & Tactics
Europe Insights
11 October 2016
page 13 of 20 , International Analyst, +44 (0) 20 7029 8685, [email protected] Jefferies Int'l Ltd. Equity Research
Please see important disclosure information on pages 16 - 20 of this report.
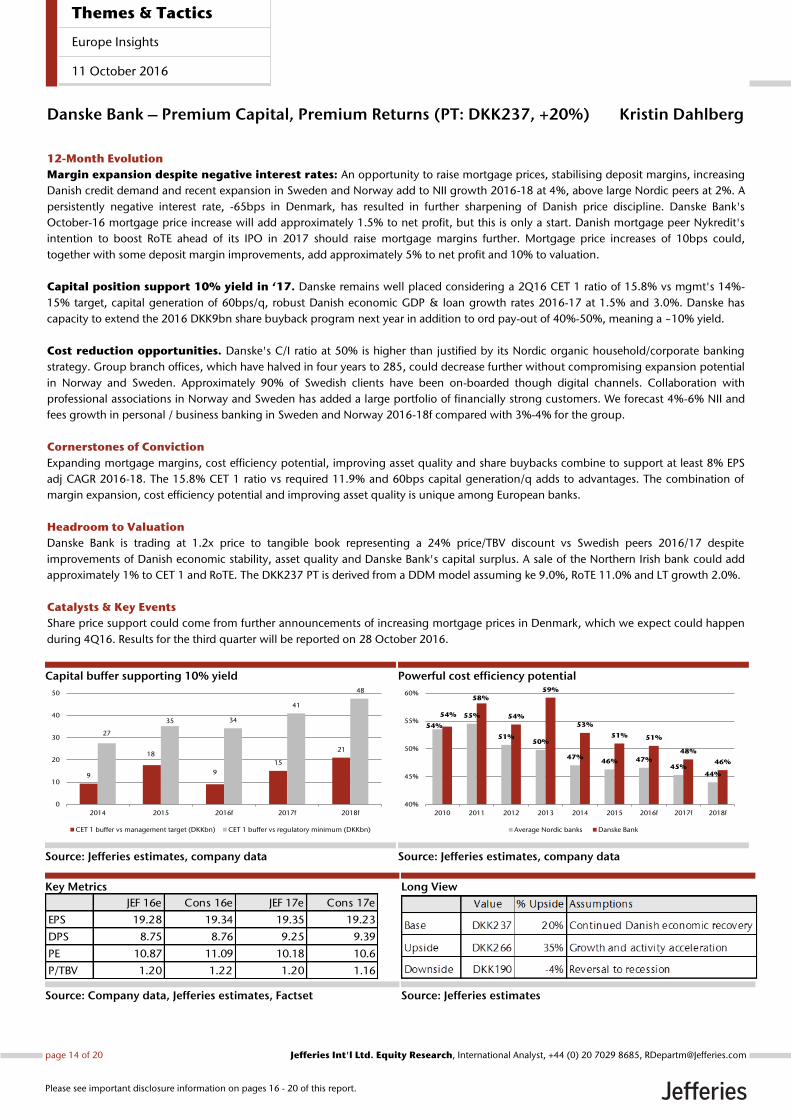
Danske Bank – Premium Capital, Premium Returns (PT: DKK237, +20%) Kristin Dahlberg
12-Month Evolution
Margin expansion despite negative interest rates: An opportunity to raise mortgage prices, stabilising deposit margins, increasing
Danish credit demand and recent expansion in Sweden and Norway add to NII growth 2016-18 at 4%, above large Nordic peers at 2%. A
persistently negative interest rate, -65bps in Denmark, has resulted in further sharpening of Danish price discipline. Danske Bank's
October-16 mortgage price increase will add approximately 1.5% to net profit, but this is only a start. Danish mortgage peer Nykredit's
intention to boost RoTE ahead of its IPO in 2017 should raise mortgage margins further. Mortgage price increases of 10bps could,
together with some deposit margin improvements, add approximately 5% to net profit and 10% to valuation.
Capital position support 10% yield in ‘17. Danske remains well placed considering a 2Q16 CET 1 ratio of 15.8% vs mgmt's 14%-
15% target, capital generation of 60bps/q, robust Danish economic GDP & loan growth rates 2016-17 at 1.5% and 3.0%. Danske has
capacity to extend the 2016 DKK9bn share buyback program next year in addition to ord pay-out of 40%-50%, meaning a ~10% yield.
Cost reduction opportunities. Danske's C/I ratio at 50% is higher than justified by its Nordic organic household/corporate banking
strategy. Group branch offices, which have halved in four years to 285, could decrease further without compromising expansion potential
in Norway and Sweden. Approximately 90% of Swedish clients have been on-boarded though digital channels. Collaboration with
professional associations in Norway and Sweden has added a large portfolio of financially strong customers. We forecast 4%-6% NII and
fees growth in personal / business banking in Sweden and Norway 2016-18f compared with 3%-4% for the group.
Cornerstones of Conviction
Expanding mortgage margins, cost efficiency potential, improving asset quality and share buybacks combine to support at least 8% EPS
adj CAGR 2016-18. The 15.8% CET 1 ratio vs required 11.9% and 60bps capital generation/q adds to advantages. The combination of
margin expansion, cost efficiency potential and improving asset quality is unique among European banks.
Headroom to Valuation
Danske Bank is trading at 1.2x price to tangible book representing a 24% price/TBV discount vs Swedish peers 2016/17 despite
improvements of Danish economic stability, asset quality and Danske Bank's capital surplus. A sale of the Northern Irish bank could add
approximately 1% to CET 1 and RoTE. The DKK237 PT is derived from a DDM model assuming ke 9.0%, RoTE 11.0% and LT growth 2.0%.
Catalysts & Key Events
Share price support could come from further announcements of increasing mortgage prices in Denmark, which we expect could happen
during 4Q16. Results for the third quarter will be reported on 28 October 2016.
Capital buffer supporting 10% yield
Source: Jefferies estimates, company data
Powerful cost efficiency potential
Source: Jefferies estimates, company data
Key Metrics
Source: Company data, Jefferies estimates, Factset
Long View
Source: Jefferies estimates
9
18
9
15
21
27
35 34
41
48
0
10
20
30
40
50
2014 2015 2016f 2017f 2018f
CET 1 buffer vs management target (DKKbn) CET 1 buffer vs regulatory minimum (DKKbn)
54%
55%
51%50%
47%46% 47%
45%44%
54%
58%
54%
59%
53%
51% 51%
48%
46%
40%
45%
50%
55%
60%
2010 2011 2012 2013 2014 2015 2016f 2017f 2018f
Average Nordic banks Danske Bank
JEF 16e Cons 16e JEF 17e Cons 17e
EPS 19.28 19.34 19.35 19.23
DPS 8.75 8.76 9.25 9.39
PE 10.87 11.09 10.18 10.6
P/TBV 1.20 1.22 1.20 1.16
Themes & Tactics
Europe Insights
11 October 2016
page 14 of 20 , International Analyst, +44 (0) 20 7029 8685, [email protected] Jefferies Int'l Ltd. Equity Research
Please see important disclosure information on pages 16 - 20 of this report.
Aviva – Gates of Eden (PT: 501p, +12%) Mark Cathcart
12-Month Evolution
Acquisition discount post Friends: Aviva’s underperformance stretches back to the announcement of the Friends acquisition, with
investors wary of a large purchase given past value-destructive deals. However, this is undeserved, in our view, as the benefits of the
acquisition are feeding through earlier than expected, cost cuts are one year ahead of plan and capital synergies from Friends have
generated below-average SII sensitivity to financial markets.
Resilience against falling yields and macro environment: The fall in UK interest rates YTD has been unhelpful, but despite these
headwinds management are targeting mid-single digit earnings growth over the medium term. The July Investor Day additionally assured
the market of the group’s growth potential in the current low yield climate, with the market beginning to reward the company for the
deal.
Dividend resilience: Our cash stress test shows Aviva to have the strongest resilience vs UK peers with 17% cash above dividends in a
stress scenario (vs 4% at Prudential, 12% at Standard Life, -4% at Legal and General).
Cornerstones of Conviction
Over the long term, we view Aviva evolving as the composite leader with its cross-sell push in the UK as peers remain focused on
alternative markets (Pru in US /Asia) or niche products (AM at Standard Life, bulks at L&G). In addition to organic capability, our cash
generation forecasts support an additional 1%-2% growth pa from reinvestment of the £300m excess capital generated.
Headroom to Valuation
Aviva appears supported by traditional valuation metrics on 2017F PER 8.4x vs European conglomerates at 9.3x underpinned by divi yield
2017F of 6%. We use a multi-stage residual income model, with a 10.4% CoC (11% for the UK life operation) and a 4% growth trend.
Catalysts & Key Events
The stock is likely to outperform peers over the next year as management continue to assure the market of the growth potential in the
current low yield climate.
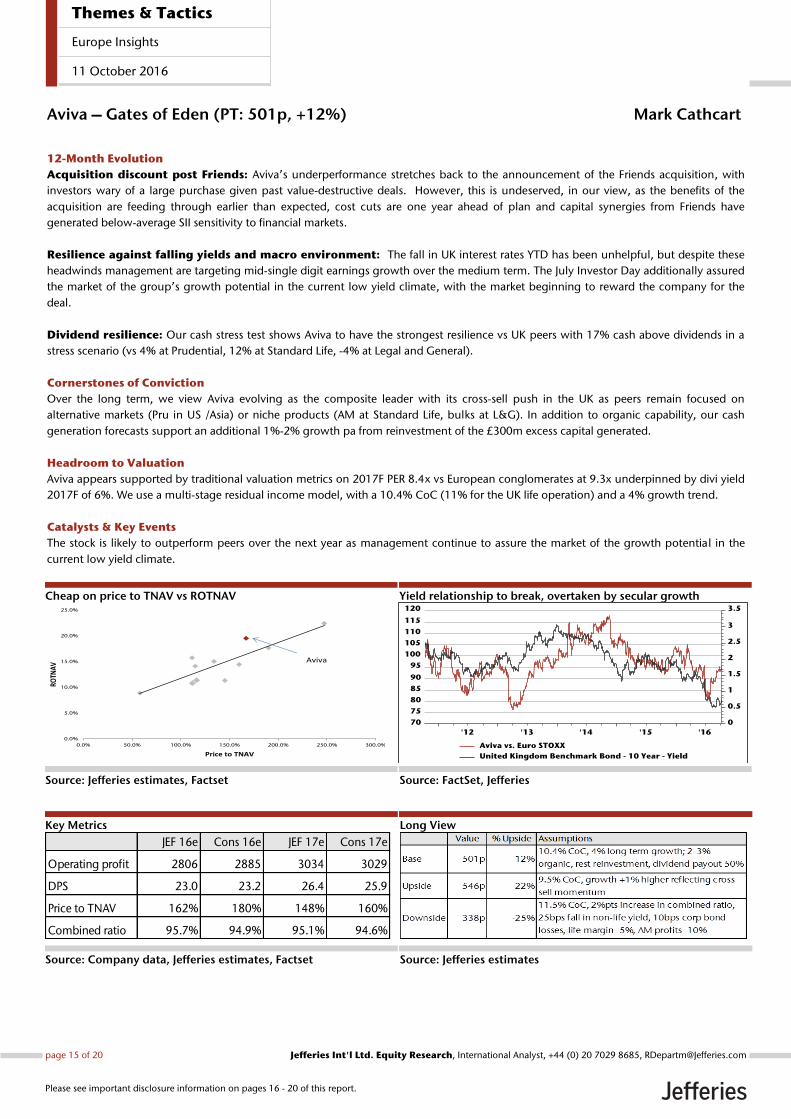
Cheap on price to TNAV vs ROTNAV
Source: Jefferies estimates, Factset
Yield relationship to break, overtaken by secular growth
Source: FactSet, Jefferies
Key Metrics
Source: Company data, Jefferies estimates, Factset
Long View
Source: Jefferies estimates
0.0%
5.0%
10.0%
15.0%
20.0%
25.0%
0.0% 50.0% 100.0% 150.0% 200.0% 250.0% 300.0%
ROTN
AV
Price to TNAV
Aviva
JEF 16e Cons 16e JEF 17e Cons 17e
Operating profit 2806 2885 3034 3029
DPS 23.0 23.2 26.4 25.9
Price to TNAV 162% 180% 148% 160%
Combined ratio 95.7% 94.9% 95.1% 94.6%
Themes & Tactics
Europe Insights
11 October 2016
page 15 of 20 , International Analyst, +44 (0) 20 7029 8685, [email protected] Jefferies Int'l Ltd. Equity Research
Please see important disclosure information on pages 16 - 20 of this report.

Analyst Certification:I, Jefferies Int'l Ltd. Equity Research, certify that all of the views expressed in this research report accurately reflect my personal views about the subjectsecurity(ies) and subject company(ies). I also certify that no part of my compensation was, is, or will be, directly or indirectly, related to the specificrecommendations or views expressed in this research report.I, Jeffrey Holford, PhD, ACA, certify that all of the views expressed in this research report accurately reflect my personal views about the subjectsecurity(ies) and subject company(ies). I also certify that no part of my compensation was, is, or will be, directly or indirectly, related to the specificrecommendations or views expressed in this research report.I, Chris Cooper, CFA, ACA, certify that all of the views expressed in this research report accurately reflect my personal views about the subjectsecurity(ies) and subject company(ies). I also certify that no part of my compensation was, is, or will be, directly or indirectly, related to the specificrecommendations or views expressed in this research report.I, Edward Mundy, ACA, certify that all of the views expressed in this research report accurately reflect my personal views about the subjectsecurity(ies) and subject company(ies). I also certify that no part of my compensation was, is, or will be, directly or indirectly, related to the specificrecommendations or views expressed in this research report.I, Owen Bennett, certify that all of the views expressed in this research report accurately reflect my personal views about the subject security(ies) andsubject company(ies). I also certify that no part of my compensation was, is, or will be, directly or indirectly, related to the specific recommendationsor views expressed in this research report.I, Jerry Dellis, certify that all of the views expressed in this research report accurately reflect my personal views about the subject security(ies) andsubject company(ies). I also certify that no part of my compensation was, is, or will be, directly or indirectly, related to the specific recommendationsor views expressed in this research report.I, David Reynolds, certify that all of the views expressed in this research report accurately reflect my personal views about the subject security(ies) andsubject company(ies). I also certify that no part of my compensation was, is, or will be, directly or indirectly, related to the specific recommendationsor views expressed in this research report.I, David Kerstens, certify that all of the views expressed in this research report accurately reflect my personal views about the subject security(ies) andsubject company(ies). I also certify that no part of my compensation was, is, or will be, directly or indirectly, related to the specific recommendationsor views expressed in this research report.I, Sandy Morris, certify that all of the views expressed in this research report accurately reflect my personal views about the subject security(ies) andsubject company(ies). I also certify that no part of my compensation was, is, or will be, directly or indirectly, related to the specific recommendationsor views expressed in this research report.I, Philippe Houchois, certify that all of the views expressed in this research report accurately reflect my personal views about the subject security(ies) andsubject company(ies). I also certify that no part of my compensation was, is, or will be, directly or indirectly, related to the specific recommendationsor views expressed in this research report.I, Maxence Le Gouvello Du Timat, certify that all of the views expressed in this research report accurately reflect my personal views about the subjectsecurity(ies) and subject company(ies). I also certify that no part of my compensation was, is, or will be, directly or indirectly, related to the specificrecommendations or views expressed in this research report.I, Kristin Dahlberg, certify that all of the views expressed in this research report accurately reflect my personal views about the subject security(ies) andsubject company(ies). I also certify that no part of my compensation was, is, or will be, directly or indirectly, related to the specific recommendationsor views expressed in this research report.I, Mark Cathcart, certify that all of the views expressed in this research report accurately reflect my personal views about the subject security(ies) andsubject company(ies). I also certify that no part of my compensation was, is, or will be, directly or indirectly, related to the specific recommendationsor views expressed in this research report.Registration of non-US analysts: Jefferies Int'l Ltd. Equity Research is employed by Jefferies International Limited, a non-US affiliate of Jefferies LLCand is not registered/qualified as a research analyst with FINRA. This analyst(s) may not be an associated person of Jefferies LLC, a FINRA member firm,and therefore may not be subject to the NASD Rule 2241 and Incorporated NYSE Rule 472 restrictions on communications with a subject company,public appearances and trading securities held by a research analyst.Registration of non-US analysts: Chris Cooper, CFA, ACA is employed by Jefferies International Limited, a non-US affiliate of Jefferies LLC and isnot registered/qualified as a research analyst with FINRA. This analyst(s) may not be an associated person of Jefferies LLC, a FINRA member firm, andtherefore may not be subject to the NASD Rule 2241 and Incorporated NYSE Rule 472 restrictions on communications with a subject company, publicappearances and trading securities held by a research analyst.Registration of non-US analysts: Edward Mundy, ACA is employed by Jefferies International Limited, a non-US affiliate of Jefferies LLC and is notregistered/qualified as a research analyst with FINRA. This analyst(s) may not be an associated person of Jefferies LLC, a FINRA member firm, andtherefore may not be subject to the NASD Rule 2241 and Incorporated NYSE Rule 472 restrictions on communications with a subject company, publicappearances and trading securities held by a research analyst.Registration of non-US analysts: Owen Bennett is employed by Jefferies International Limited, a non-US affiliate of Jefferies LLC and is notregistered/qualified as a research analyst with FINRA. This analyst(s) may not be an associated person of Jefferies LLC, a FINRA member firm, andtherefore may not be subject to the NASD Rule 2241 and Incorporated NYSE Rule 472 restrictions on communications with a subject company, publicappearances and trading securities held by a research analyst.Registration of non-US analysts: Jerry Dellis is employed by Jefferies International Limited, a non-US affiliate of Jefferies LLC and is not registered/qualified as a research analyst with FINRA. This analyst(s) may not be an associated person of Jefferies LLC, a FINRA member firm, and therefore maynot be subject to the NASD Rule 2241 and Incorporated NYSE Rule 472 restrictions on communications with a subject company, public appearancesand trading securities held by a research analyst.Registration of non-US analysts: David Reynolds is employed by Jefferies International Limited, a non-US affiliate of Jefferies LLC and is notregistered/qualified as a research analyst with FINRA. This analyst(s) may not be an associated person of Jefferies LLC, a FINRA member firm, andtherefore may not be subject to the NASD Rule 2241 and Incorporated NYSE Rule 472 restrictions on communications with a subject company, publicappearances and trading securities held by a research analyst.Registration of non-US analysts: David Kerstens is employed by Jefferies International Limited, a non-US affiliate of Jefferies LLC and is notregistered/qualified as a research analyst with FINRA. This analyst(s) may not be an associated person of Jefferies LLC, a FINRA member firm, andtherefore may not be subject to the NASD Rule 2241 and Incorporated NYSE Rule 472 restrictions on communications with a subject company, publicappearances and trading securities held by a research analyst.Registration of non-US analysts: Sandy Morris is employed by Jefferies International Limited, a non-US affiliate of Jefferies LLC and is not registered/qualified as a research analyst with FINRA. This analyst(s) may not be an associated person of Jefferies LLC, a FINRA member firm, and therefore may
Themes & Tactics
Europe Insights
11 October 2016
page 16 of 20 , International Analyst, +44 (0) 20 7029 8685, [email protected] Jefferies Int'l Ltd. Equity Research
Please see important disclosure information on pages 16 - 20 of this report.

not be subject to the NASD Rule 2241 and Incorporated NYSE Rule 472 restrictions on communications with a subject company, public appearancesand trading securities held by a research analyst.Registration of non-US analysts: Philippe Houchois is employed by Jefferies International Limited, a non-US affiliate of Jefferies LLC and is notregistered/qualified as a research analyst with FINRA. This analyst(s) may not be an associated person of Jefferies LLC, a FINRA member firm, andtherefore may not be subject to the NASD Rule 2241 and Incorporated NYSE Rule 472 restrictions on communications with a subject company, publicappearances and trading securities held by a research analyst.Registration of non-US analysts: Maxence Le Gouvello Du Timat is employed by Jefferies International Limited, a non-US affiliate of Jefferies LLCand is not registered/qualified as a research analyst with FINRA. This analyst(s) may not be an associated person of Jefferies LLC, a FINRA member firm,and therefore may not be subject to the NASD Rule 2241 and Incorporated NYSE Rule 472 restrictions on communications with a subject company,public appearances and trading securities held by a research analyst.Registration of non-US analysts: Kristin Dahlberg is employed by Jefferies International Limited, a non-US affiliate of Jefferies LLC and is notregistered/qualified as a research analyst with FINRA. This analyst(s) may not be an associated person of Jefferies LLC, a FINRA member firm, andtherefore may not be subject to the NASD Rule 2241 and Incorporated NYSE Rule 472 restrictions on communications with a subject company, publicappearances and trading securities held by a research analyst.Registration of non-US analysts: Mark Cathcart is employed by Jefferies International Limited, a non-US affiliate of Jefferies LLC and is notregistered/qualified as a research analyst with FINRA. This analyst(s) may not be an associated person of Jefferies LLC, a FINRA member firm, andtherefore may not be subject to the NASD Rule 2241 and Incorporated NYSE Rule 472 restrictions on communications with a subject company, publicappearances and trading securities held by a research analyst.As is the case with all Jefferies employees, the analyst(s) responsible for the coverage of the financial instruments discussed in this report receivescompensation based in part on the overall performance of the firm, including investment banking income. We seek to update our research asappropriate, but various regulations may prevent us from doing so. Aside from certain industry reports published on a periodic basis, the large majorityof reports are published at irregular intervals as appropriate in the analyst's judgement.
Investment Recommendation Record(Article 3(1)e and Article 7 of MAR)
Recommendation Published , 04:31 ET. October 11, 2016Recommendation Distributed , 04:31 ET. October 11, 2016
Company Specific DisclosuresFor Important Disclosure information on companies recommended in this report, please visit our website at https://javatar.bluematrix.com/sellside/Disclosures.action or call 212.284.2300.
Explanation of Jefferies RatingsBuy - Describes securities that we expect to provide a total return (price appreciation plus yield) of 15% or more within a 12-month period.Hold - Describes securities that we expect to provide a total return (price appreciation plus yield) of plus 15% or minus 10% within a 12-month period.Underperform - Describes securities that we expect to provide a total return (price appreciation plus yield) of minus 10% or less within a 12-monthperiod.The expected total return (price appreciation plus yield) for Buy rated securities with an average security price consistently below $10 is 20% or morewithin a 12-month period as these companies are typically more volatile than the overall stock market. For Hold rated securities with an averagesecurity price consistently below $10, the expected total return (price appreciation plus yield) is plus or minus 20% within a 12-month period. ForUnderperform rated securities with an average security price consistently below $10, the expected total return (price appreciation plus yield) is minus20% or less within a 12-month period.NR - The investment rating and price target have been temporarily suspended. Such suspensions are in compliance with applicable regulations and/or Jefferies policies.CS - Coverage Suspended. Jefferies has suspended coverage of this company.NC - Not covered. Jefferies does not cover this company.Restricted - Describes issuers where, in conjunction with Jefferies engagement in certain transactions, company policy or applicable securitiesregulations prohibit certain types of communications, including investment recommendations.Monitor - Describes securities whose company fundamentals and financials are being monitored, and for which no financial projections or opinionson the investment merits of the company are provided.
Valuation MethodologyJefferies' methodology for assigning ratings may include the following: market capitalization, maturity, growth/value, volatility and expected totalreturn over the next 12 months. The price targets are based on several methodologies, which may include, but are not restricted to, analyses of marketrisk, growth rate, revenue stream, discounted cash flow (DCF), EBITDA, EPS, cash flow (CF), free cash flow (FCF), EV/EBITDA, P/E, PE/growth, P/CF,P/FCF, premium (discount)/average group EV/EBITDA, premium (discount)/average group P/E, sum of the parts, net asset value, dividend returns,and return on equity (ROE) over the next 12 months.
Jefferies Franchise PicksJefferies Franchise Picks include stock selections from among the best stock ideas from our equity analysts over a 12 month period. Stock selectionis based on fundamental analysis and may take into account other factors such as analyst conviction, differentiated analysis, a favorable risk/rewardratio and investment themes that Jefferies analysts are recommending. Jefferies Franchise Picks will include only Buy rated stocks and the numbercan vary depending on analyst recommendations for inclusion. Stocks will be added as new opportunities arise and removed when the reason forinclusion changes, the stock has met its desired return, if it is no longer rated Buy and/or if it triggers a stop loss. Stocks having 120 day volatility inthe bottom quartile of S&P stocks will continue to have a 15% stop loss, and the remainder will have a 20% stop. Franchise Picks are not intendedto represent a recommended portfolio of stocks and is not sector based, but we may note where we believe a Pick falls within an investment stylesuch as growth or value.
Themes & Tactics
Europe Insights
11 October 2016
page 17 of 20 , International Analyst, +44 (0) 20 7029 8685, [email protected] Jefferies Int'l Ltd. Equity Research
Please see important disclosure information on pages 16 - 20 of this report.

Risks which may impede the achievement of our Price TargetThis report was prepared for general circulation and does not provide investment recommendations specific to individual investors. As such, thefinancial instruments discussed in this report may not be suitable for all investors and investors must make their own investment decisions basedupon their specific investment objectives and financial situation utilizing their own financial advisors as they deem necessary. Past performance ofthe financial instruments recommended in this report should not be taken as an indication or guarantee of future results. The price, value of, andincome from, any of the financial instruments mentioned in this report can rise as well as fall and may be affected by changes in economic, financialand political factors. If a financial instrument is denominated in a currency other than the investor's home currency, a change in exchange rates mayadversely affect the price of, value of, or income derived from the financial instrument described in this report. In addition, investors in securities suchas ADRs, whose values are affected by the currency of the underlying security, effectively assume currency risk.
Other Companies Mentioned in This Report• A.P. Møller - Mærsk A/S (MAERSKB DC: DKK9,705.00, BUY)• Airbus Group NV (AIR FP: €54.33, BUY)• Anheuser-Busch InBev (ABI BB: NA, BUY)• Aviva Plc (AV/ LN: p447.90, BUY)• Bouygues (EN FP: €29.73, BUY)• British American Tobacco (BATS LN: p4,858.50, BUY)• Crédit Agricole S.A. (ACA FP: €9.19, BUY)• Danske Bank A/S (DANSKE DC: DKK197.00, BUY)• Fiat Chrysler Automobiles NV (FCA IM: €5.91, BUY)• JUST EAT plc (JE/ LN: p562.50, BUY)• Novartis AG (NOVN VX: CHF76.35, BUY)• Smith & Nephew (SN/ LN: p1,249.00, BUY)
For Important Disclosure information on companies recommended in this report, please visit our website at https://javatar.bluematrix.com/sellside/Disclosures.action or call 212.284.2300.
Distribution of RatingsIB Serv./Past 12 Mos.
Rating Count Percent Count Percent
BUY 1109 52.26% 325 29.31%HOLD 852 40.15% 163 19.13%UNDERPERFORM 161 7.59% 17 10.56%
Themes & Tactics
Europe Insights
11 October 2016
page 18 of 20 , International Analyst, +44 (0) 20 7029 8685, [email protected] Jefferies Int'l Ltd. Equity Research
Please see important disclosure information on pages 16 - 20 of this report.

Other Important DisclosuresJefferies does and seeks to do business with companies covered in its research reports. As a result, investors should be aware that Jefferies may have aconflict of interest that could affect the objectivity of this report. Investors should consider this report as only a single factor in making their investmentdecision.Jefferies Equity Research refers to research reports produced by analysts employed by one of the following Jefferies Group LLC (“Jefferies”) groupcompanies:United States: Jefferies LLC which is an SEC registered firm and a member of FINRA.United Kingdom: Jefferies International Limited, which is authorized and regulated by the Financial Conduct Authority; registered in England andWales No. 1978621; registered office: Vintners Place, 68 Upper Thames Street, London EC4V 3BJ; telephone +44 (0)20 7029 8000; facsimile +44 (0)207029 8010.Hong Kong: Jefferies Hong Kong Limited, which is licensed by the Securities and Futures Commission of Hong Kong with CE number ATS546; locatedat Suite 2201, 22nd Floor, Cheung Kong Center, 2 Queen’s Road Central, Hong Kong.Singapore: Jefferies Singapore Limited, which is licensed by the Monetary Authority of Singapore; located at 80 Raffles Place #15-20, UOB Plaza 2,Singapore 048624, telephone: +65 6551 3950.Japan: Jefferies (Japan) Limited, Tokyo Branch, which is a securities company registered by the Financial Services Agency of Japan and is a memberof the Japan Securities Dealers Association; located at Hibiya Marine Bldg, 3F, 1-5-1 Yuraku-cho, Chiyoda-ku, Tokyo 100-0006; telephone +813 52516100; facsimile +813 5251 6101.India: Jefferies India Private Limited (CIN - U74140MH2007PTC200509), which is licensed by the Securities and Exchange Board of India as a MerchantBanker (INM000011443), Research Analyst (INH000000701) and a Stock Broker with Bombay Stock Exchange Limited (INB011491033) and NationalStock Exchange of India Limited (INB231491037) in the Capital Market Segment; located at 42/43, 2 North Avenue, Maker Maxity, Bandra-KurlaComplex, Bandra (East) Mumbai 400 051, India; Tel +91 22 4356 6000.This material has been prepared by Jefferies employing appropriate expertise, and in the belief that it is fair and not misleading. The information setforth herein was obtained from sources believed to be reliable, but has not been independently verified by Jefferies. Therefore, except for any obligationunder applicable rules we do not guarantee its accuracy. Additional and supporting information is available upon request. Unless prohibited by theprovisions of Regulation S of the U.S. Securities Act of 1933, this material is distributed in the United States ("US"), by Jefferies LLC, a US-registeredbroker-dealer, which accepts responsibility for its contents in accordance with the provisions of Rule 15a-6, under the US Securities Exchange Act of1934. Transactions by or on behalf of any US person may only be effected through Jefferies LLC. In the United Kingdom and European EconomicArea this report is issued and/or approved for distribution by Jefferies International Limited and is intended for use only by persons who have, or havebeen assessed as having, suitable professional experience and expertise, or by persons to whom it can be otherwise lawfully distributed. JefferiesInternational Limited Equity Research personnel are separated from other business groups and are not under their supervision or control. JefferiesInternational Limited has implemented policies to (i) address conflicts of interest related to the preparation, content and distribution of research reports,public appearances, and interactions between research analysts and those outside of the research department; (ii) ensure that research analysts areinsulated from the review, pressure, or oversight by persons engaged in investment banking services activities or other persons who might be biased intheir judgment or supervision; and (iii) promote objective and reliable research that reflects the truly held opinions of research analysts and prevents theuse of research reports or research analysts to manipulate or condition the market or improperly favor the interests of the Jefferies International Limitedor a current or prospective customer or class of customers. Jefferies International Limited may allow its analysts to undertake private consultancywork. Jefferies International Limited’s conflicts management policy sets out the arrangements Jefferies International Limited employs to manage anypotential conflicts of interest that may arise as a result of such consultancy work. Jefferies International Ltd, its affiliates or subsidiaries, may make amarket or provide liquidity in the financial instruments referred to in this investment recommendation. For Canadian investors, this material is intendedfor use only by professional or institutional investors. None of the investments or investment services mentioned or described herein is available toother persons or to anyone in Canada who is not a "Designated Institution" as defined by the Securities Act (Ontario). In Singapore, Jefferies SingaporeLimited is regulated by the Monetary Authority of Singapore. For investors in the Republic of Singapore, this material is provided by Jefferies SingaporeLimited pursuant to Regulation 32C of the Financial Advisers Regulations. The material contained in this document is intended solely for accredited,expert or institutional investors, as defined under the Securities and Futures Act (Cap. 289 of Singapore). If there are any matters arising from, orin connection with this material, please contact Jefferies Singapore Limited, located at 80 Raffles Place #15-20, UOB Plaza 2, Singapore 048624,telephone: +65 6551 3950. In Japan this material is issued and distributed by Jefferies (Japan) Limited to institutional investors only. In Hong Kong,this report is issued and approved by Jefferies Hong Kong Limited and is intended for use only by professional investors as defined in the Hong KongSecurities and Futures Ordinance and its subsidiary legislation. In the Republic of China (Taiwan), this report should not be distributed. The researchin relation to this report is conducted outside the PRC. This report does not constitute an offer to sell or the solicitation of an offer to buy any securitiesin the PRC. PRC investors shall have the relevant qualifications to invest in such securities and shall be responsible for obtaining all relevant approvals,licenses, verifications and/or registrations from the relevant governmental authorities themselves. In India this report is made available by JefferiesIndia Private Limited. In Australia this information is issued solely by Jefferies International Limited and is directed solely at wholesale clients withinthe meaning of the Corporations Act 2001 of Australia (the "Act") in connection with their consideration of any investment or investment servicethat is the subject of this document. Any offer or issue that is the subject of this document does not require, and this document is not, a disclosuredocument or product disclosure statement within the meaning of the Act. Jefferies International Limited is authorised and regulated by the FinancialConduct Authority under the laws of the United Kingdom, which differ from Australian laws. Jefferies International Limited has obtained relief underAustralian Securities and Investments Commission Class Order 03/1099, which conditionally exempts it from holding an Australian financial serviceslicence under the Act in respect of the provision of certain financial services to wholesale clients. Recipients of this document in any other jurisdictionsshould inform themselves about and observe any applicable legal requirements in relation to the receipt of this document.
This report is not an offer or solicitation of an offer to buy or sell any security or derivative instrument, or to make any investment. Any opinion orestimate constitutes the preparer's best judgment as of the date of preparation, and is subject to change without notice. Jefferies assumes no obligationto maintain or update this report based on subsequent information and events. Jefferies, its associates or affiliates, and its respective officers, directors,and employees may have long or short positions in, or may buy or sell any of the securities, derivative instruments or other investments mentioned ordescribed herein, either as agent or as principal for their own account. Upon request Jefferies may provide specialized research products or servicesto certain customers focusing on the prospects for individual covered stocks as compared to other covered stocks over varying time horizons orunder differing market conditions. While the views expressed in these situations may not always be directionally consistent with the long-term viewsexpressed in the analyst's published research, the analyst has a reasonable basis and any inconsistencies can be reasonably explained. This materialdoes not constitute a personal recommendation or take into account the particular investment objectives, financial situations, or needs of individualclients. Clients should consider whether any advice or recommendation in this report is suitable for their particular circumstances and, if appropriate,seek professional advice, including tax advice. The price and value of the investments referred to herein and the income from them may fluctuate. Pastperformance is not a guide to future performance, future returns are not guaranteed, and a loss of original capital may occur. Fluctuations in exchange
Themes & Tactics
Europe Insights
11 October 2016
page 19 of 20 , International Analyst, +44 (0) 20 7029 8685, [email protected] Jefferies Int'l Ltd. Equity Research
Please see important disclosure information on pages 16 - 20 of this report.
rates could have adverse effects on the value or price of, or income derived from, certain investments. This report has been prepared independently ofany issuer of securities mentioned herein and not in connection with any proposed offering of securities or as agent of any issuer of securities. Noneof Jefferies, any of its affiliates or its research analysts has any authority whatsoever to make any representations or warranty on behalf of the issuer(s).Jefferies policy prohibits research personnel from disclosing a recommendation, investment rating, or investment thesis for review by an issuer priorto the publication of a research report containing such rating, recommendation or investment thesis. Any comments or statements made herein arethose of the author(s) and may differ from the views of Jefferies.
This report may contain information obtained from third parties, including ratings from credit ratings agencies such as Standard & Poor’s. Reproductionand distribution of third party content in any form is prohibited except with the prior written permission of the related third party. Third party contentproviders do not guarantee the accuracy, completeness, timeliness or availability of any information, including ratings, and are not responsible forany errors or omissions (negligent or otherwise), regardless of the cause, or for the results obtained from the use of such content. Third party contentproviders give no express or implied warranties, including, but not limited to, any warranties of merchantability or fitness for a particular purpose oruse. Third party content providers shall not be liable for any direct, indirect, incidental, exemplary, compensatory, punitive, special or consequentialdamages, costs, expenses, legal fees, or losses (including lost income or profits and opportunity costs) in connection with any use of their content,including ratings. Credit ratings are statements of opinions and are not statements of fact or recommendations to purchase, hold or sell securities. Theydo not address the suitability of securities or the suitability of securities for investment purposes, and should not be relied on as investment advice.
Jefferies research reports are disseminated and available primarily electronically, and, in some cases, in printed form. Electronic research issimultaneously available to all clients. This report or any portion hereof may not be reprinted, sold or redistributed without the written consent ofJefferies. Neither Jefferies nor any officer nor employee of Jefferies accepts any liability whatsoever for any direct, indirect or consequential damagesor losses arising from any use of this report or its contents.
For Important Disclosure information, please visit our website at https://javatar.bluematrix.com/sellside/Disclosures.action or call 1.888.JEFFERIES
© 2016 Jefferies Group LLC
Themes & Tactics
Europe Insights
11 October 2016
page 20 of 20 , International Analyst, +44 (0) 20 7029 8685, [email protected] Jefferies Int'l Ltd. Equity Research
Please see important disclosure information on pages 16 - 20 of this report.