Embed Size (px)
Citation preview

Content table
Executive summary 01
Introduction 02
Previous research 03
Methods adopted 07
Nature and sources of data 08
Results 11
Summary and conclusions 18
Dr Steven Devaney is Lecturer in Real Estate at the University of Aberdeen Business School.
Dr Qin Xiao is Senior Lecturer in Finance at Hull University Business School.
Mark Clacy-Jones is the Head of Indices at Investment Property Databank.
Views expressed are solely those of the authors and not necessarily of their respective organisations.
Listed and direct real estate investment: a European analysis
Steven Devaney [email protected] Fraser Hughes, EPRA Research Director: [email protected]
Steven Devaney Qin Xiao Mark Clacy-Jones
Contact
Any interpretation and implementation resulting from the data and finding within remain the responsibility of the company concerned. There can be no republishing of this paper without the express permission from EPRA.
Disclaimer

Best Pra
|
EPRA RESEARCH 2012 - Square de Meeus 23, 1000 Brussels, Belgium 1
Listed and direct real estate investment
A European analysis
Title
Executive summary This study investigates the extent to which returns from the listed real estate sector are related to returns in the direct real estate market for the US and for six European countries: France, Germany, the Netherlands, Sweden, Switzerland and the UK. Past research has often used valuation based indices for the direct real estate market, but these are criticised with regard to their perceived smoothing and lagging of market performance. In contrast, this study uses transaction based/linked indices of direct real estate prices, as well as valuation based ones for the purpose of comparison. Returns, standard deviations, correlations and peaks and troughs are compared before the techniques of spectral and cross-spectral analysis are used for examining the cyclical attributes of the data. The main findings from the research are as follows:
Transaction based series are more volatile than their valuation based counterparts and thus imply a smaller difference in volatility between direct real estate and the listed sector. Other factors such as gearing and the different trading environment continue to distinguish indices for each form of real estate.
Movements in listed sector returns lead those in the direct market regardless of whether a transaction or valuation based series is used for the latter. Hence, the lead is not solely due to valuation smoothing. The extent of the lead varies; it is two to four quarters in France, the Netherlands, Sweden and the US, and zero to two quarters in the UK.
In terms of the recent major cycle, listed sector indices exhibited both an earlier peak (either Q4 2006 or Q1 2007) and an earlier trough (Q1 2009) than their direct market counterparts. This is consistent with the idea that price discovery occurs first in one market and then in the other.
Spectral analysis suggests cycles of 5.5 years (22 quarters) for several listed sector series, but similar cycles are not found for the direct market. Nonetheless, cross-spectral analysis shows that the degree of coherency (analogous to correlation) between direct and listed real estate rises when longer term movements in the series are analysed.
Throughout the analysis, results for Germany and Switzerland differ from those for the other countries. Here, there are low correlations between all three series and little visual similarity other than an absence of a cycle in the different direct market series. The reasons behind this require more research.
The results of the study largely support conclusions from earlier research, despite the switch to using transaction based indices. However, similar long run trends and cycles should be expected in the two types of direct market series; ultimately, they track the same market. Further explanations relate to aggregation and recording issues, and variations in liquidity. The other contribution of the study is to widen the spatial scope of research in this area.
08 Herfst

Best Pra
|
EPRA RESEARCH 2012 - Square de Meeus 23, 1000 Brussels, Belgium 2
Listed and direct real estate investment
A European analysis
Main Report
1. Introduction The relationship between the performance of listed real estate companies and the underlying real estate markets in which they invest is a topic that has important implications for property pricing and investment strategies. Similarities in performance would suggest that the two can be regarded as substitutes in a portfolio context, leading investors to allocate capital between these alternatives based on preferences for aspects such as liquidity and control, as well as the amount of capital that is available. Moreover, owing to their greater liquidity, investments in the listed sector enhance the scope for tactical allocations in real estate. Yet empirical research has generated mixed findings as to whether these two forms of real estate do produce similar patterns of returns. The reasons for different results include variations in the countries and periods studied, the methods used and the short term or long term focus of the analysis. However, one feature of most studies to date is their reliance on valuation based indices as measures of direct real estate performance. Such indices have been challenged on the grounds that they appear to understate the volatility of real estate and may not reflect market turning points in a timely manner. These issues stem from the processes of property valuation and may be affected by how valuations are aggregated into market indices. More recently, though, transaction based series of investment property prices have become available and these have stimulated new research to establish whether earlier conclusions on the relatedness of direct and listed real estate remain valid. This study compares the performance of listed real estate with both valuation and transaction based measures of direct real estate for a sample of countries where all three types of series are available. It reports basic descriptors of performance and relatedness, such as means, standard deviations and correlations, as well as results from the more sophisticated methods of spectral and cross-spectral analysis, which identify and compare the cyclical properties of time series. The countries studied are France, Germany, the Netherlands, Sweden, Switzerland, the UK and the US. Thus, the study adds to research that uses transaction based indices while also widening the spatial scope of research in this field by increasing the limited amount of evidence that exists for mainland European countries. The rest of the report is structured as follows. In the next section, the sources of difference between listed and direct real estate investment are reviewed and previous evidence on their relationship is discussed. Section three then outlines the methods of spectral and cross-spectral analysis before the fourth section discusses the datasets used in this study. Section five presents the results from the empirical analysis and this is followed by reflections on these results in the conclusion.

Best Pra
|
EPRA RESEARCH 2012 - Square de Meeus 23, 1000 Brussels, Belgium 3
Listed and direct real estate investment
A European analysis
2. Previous research The extent to which investment in the shares of listed real estate companies is a substitute for direct investment in real estate has been the subject of much research. Real estate investment is attractive owing to its return generating and diversification capabilities, but to obtain a reasonably sized portfolio through direct investment entails a large capital cost, whilst real estate markets are also notoriously illiquid, with high costs and lengthy transaction times inhibiting the frequent trading of assets, limiting investment strategies. In contrast, shares in listed real estate companies are highly liquid, can be bought in small quantities and offer exposure to diversified portfolios of assets. When combined with the low transaction costs and relative transparency that accompany exchange listing, they are potentially a highly attractive means of investing in real estate to retail and institutional investors alike. However, it has been demonstrated empirically across a range of countries that the performance of listed real estate tends to differ from that of the underlying property market. Movements in prices are not synchronised and the volatility of returns from listed real estate is typically larger than that exhibited by direct market measures. This may seem surprising as the fundamental business of most real estate companies is investing in and operating real estate assets, with income being generated from renting these assets to other organisations. The value of the assets should reflect real estate market conditions as should the cash flows and, thus, the potential to pay dividends. Yet there are a number of reasons why differences in performance might be expected and these are as follows:
Market structure The different nature of the markets in which listed and direct real estate investments are traded may lead to differences in price behaviour. Liquidity and low trading costs in the former case encourages transactions to occur while prices can be readily observed by other investors, informing their decisions in turn. These factors also facilitate the construction of high frequency price-based indices. In comparison, the decentralised and private nature of direct markets makes it hard to observe prices whilst transactions themselves are infrequent and relate, at that time, to unique interests not being traded elsewhere. This leads to more uncertainty in pricing and impedes information transfer. Thus, divergences in performance may arise because of the relative efficiency with which each market responds to price signals and price relevant information, with evidence existing for price discovery in the listed sector ahead of the direct real estate market (see Geltner et al., 2003).
Type of investors The participation of different investor groups varies between the listed and direct markets, reflecting their characteristics. Small lot sizes and liquidity in the listed sector enables more small investors and short term investors to gain real estate exposure, whereas the direct market is often more dominated by investment institutions with longer horizons. It is possible, though contentious, that the different behaviour of these groups affects wider patterns in pricing observed in these markets. For example, Barkham & Ward (1999) find some support for the ‘noise trader’ hypothesis whereby the actions of relatively uninformed investors that rely more on sentiment creates greater volatility in share prices and leads to deviations from fundamental values.
1
Use of debt Many listed real estate firms use debt to fund their investment and development activities and, as such, the purchase of their shares represents investment in a geared entity.
2 Such gearing
can enhance returns in an upswing, but it also amplifies volatility. Although investors may use debt to access the direct market, measures of direct real estate performance are constructed on an ungeared basis. Therefore, this is an important source of differences at the index level.
1 Alternatively, Clayton & MacKinnon (2003) discuss whether greater volatility in the US REIT sector stems from the
increased participation of institutions and their trading strategies. 2 See the regular EPRA Loan to Value reports for Europe-wide evidence on the use of debt by the listed sector.

Best Pra
|
EPRA RESEARCH 2012 - Square de Meeus 23, 1000 Brussels, Belgium 4
Listed and direct real estate investment
A European analysis
Scope of activities Listed real estate companies could be involved in one or more of a number of activities ranging from long term real estate investment to short term property trading, property development, fund or asset management, brokerage services or the operation of real estate related businesses such as hotels. Risks and returns from some of these activities are different from those of real estate portfolio investment. This should be recognised when investors select those companies, but may influence indices for the listed sector unless there are appropriate rules in place surrounding index eligibility. Similarly, the place of listing for a firm does not necessarily constrain geographical investment. Thus, the types and locations of assets held by listed firms may not mirror the structure of the direct real estate market in a given nation.
3
Corporate structure and management The legal structure of real estate companies can influence performance. Many countries have now adopted the REIT model whereby firms can obtain tax transparency if they follow certain rules relating to the scope of their activities and the source and distribution of cash flows, as well as other aspects that may include use of debt or number of shareholders. In addition to their investment focus, the dividend rules and tax transparency of a REIT should mean that cash flows are more like those from direct real estate than is the case for an equivalent non-REIT.
4 The share prices of individual firms may also reflect the quality of the management team
in place, as well as the underlying assets.
Direct market indices The performance of direct real estate portfolios is usually assessed by conducting valuations of the underlying assets. These provide data from which market indices may then be constructed. However, an extensive literature exists that highlights problems with such indices. One set of issues concerns the valuation process; specifically, the availability of sales evidence and the selection and weighting of that evidence (see Clayton et al., 2001). Given limited and noisy price information, valuers partly rely on past evidence and value estimates when conducting a new valuation. As this behaviour is systematic, it will feed through into any index produced from such inputs, causing it to be a smoothed and lagged indicator of the market. This is problematic for investment analysis as volatility and correlation measures will be biased. Furthermore, problems may be exacerbated by index aggregation processes (Geltner, 1993).
Early empirical research highlighted the higher volatility of listed real estate in comparison to direct market series and their low contemporaneous correlation.
5 In contrast, high correlations were frequently
found between listed real estate and broader equity indices, especially those that tracked small capitalisation equities. At face value, such patterns suggest that investors in listed real estate did not receive the same diversification benefits as those in direct real estate, assuming a portfolio containing other financial assets. Yet this literature also found that movements in listed real estate returns led those in the direct market and possessed a degree of predictive power. This was even the case where unsmoothing techniques were applied to adjust for potential smoothing and lagging in valuation based series (see also Barkham & Geltner, 1995). These early studies mostly focused on the US and on the short run behaviour of returns.
6 However, a
lead-lag relationship implies longer term links between these forms of real estate investment. Thus, subsequent studies explored long run behaviour using cointegration methods. For instance, Wang et al. (1997) demonstrated cointegration between listed real estate and direct market returns for the UK, with the former found to Granger Cause the latter, but not vice versa. This is consistent with the earlier argument about relative efficiency. In comparison, results for the US in Glascock et al. (2000) and
3 However, this may also be true for patterns in institutional investment on which direct real estate indices are based. For
example, see Malpezzi & Shilling (2000). 4 REITs may still have some discretion with regard to dividends. For example, depreciation allowances in the US create
discrepancies between accounting net income and cash available for distribution. 5 See Giliberto (1990), Gyourko & Keim (1992), Myer & Webb (1993), Fisher et al. (1994), Eichholtz & Hartzell (1996) and
the review by Corgel et al. (1995). 6 In the US case, they also covered a period prior to or overlapping a time of significant change and maturation in the REIT
sector. See Clayton & MacKinnon (2001, 2003) for discussion and analysis.
Best Pra
|
EPRA RESEARCH 2012 - Square de Meeus 23, 1000 Brussels, Belgium 5
Listed and direct real estate investment
A European analysis
Tuluca et al. (2000) suggest that the relationship is more complex, with feedback possible from the direct market to the listed sector. In these last two cases, valuation based series are used, but without adjustments for smoothing. This may cause their findings to be questioned, but debate continues around the correct procedures for unsmoothing and appropriate model parameters. Smoothing is a complex phenomenon and Bond et al. (2012) supply evidence that established techniques for unsmoothing valuation based indices may be inappropriate. A different course of action for researchers is to seek a different measure of direct real estate returns altogether. Transaction based indices for direct real estate markets have been researched for many years, but it is only recently and with advances in methods that regularly published series for investment markets have become available in some countries. Perhaps the most widely known are the different indices developed for the US by the MIT Centre for Real Estate in collaboration with various partners. One set has been developed with data from the National Council of Real Estate Index Fiduciaries (NCREIF) and is based on a modification of the hedonic method that sees prior valuations for the sold assets substituted in place of traditional hedonic variables. The rationale for this is explained in Fisher et al. (2007). It is these indices, in particular, that have been the subject of renewed research into how the direct real estate market and listed real estate sector are related.
7
First, Fisher et al. (2007) present a comparison of returns, standard deviations and correlations between the All Property transaction based index and the NCREIF valuation based index. They find that the transaction based index has similar long run returns, but is twice as volatile. Its movements also lead those of the valuation based index. Nonetheless, it is only half as volatile as the index of REIT shares produced by the National Association of Real Estate Investment Trusts (NAREIT), though the latter is not adjusted for leverage. Furthermore, contemporaneous correlations with NAREIT and stock market series are only marginally higher than in the case of the standard NCREIF series. Lagged correlations and long run relationships with listed real estate are not explored.
8
Subsequently, Oikarinen et al. (2011) examine both short run and long run dynamics between direct and listed real estate using cointegration methods. They begin their analysis with the NCREIF index and then use the transaction based index for comparison. In each case, they find cointegration with the NAREIT index for Equity REITs, but do not find it between any of these series and the US stock market. This indicates that listed and direct real estate may offer similar diversification benefits over a long horizon. They also report that it is direct real estate rather than REITs that adjust to the long run relationship, as well as to shorter term changes in the listed sector series. The valuation based index lags NAREIT by more than the transaction based index, but, nonetheless, the authors note that “since REIT returns lead also the transaction-based [index] returns, the perceived lead-lag relation cannot only be attributed to appraisal smoothing effects” (p96). Finally, Boudry et al. (2012) and Hoesli & Oikarinen (2012) use sector level transaction based indices in place of valuation based indices to explore whether links between US direct and listed real estate are stronger at a more disaggregate level. The latter study also examines Australia and the UK using valuation based series. The results of these studies affirm that REITs and the direct market are linked in the long run, but disagree on whether adjustment to that relationship occurs in the returns of just one or both of the forms of real estate. However, Hoesli & Oikarinen use a wider range of tests and cater for both gearing and economic influences when finding that predictability runs solely from the listed sector to the direct market. These studies indicate that transaction based indices may facilitate a greater understanding of the relationships between direct and listed real estate. However, these studies all focus on the US, as does most of the literature in this area. Few studies have explored this issue for markets in mainland Europe,
7 The other set use the repeat sales approach and are now published by Moodys and Real Capital Analytics. These series
are higher frequency (monthly) than the NCREIF based ones, but span a shorter period of time, being only available from the end of 2000. 8 Similar results are found by Fisher et al. (2003) with annual frequency data. They show that the NAREIT series leads their
transaction based series, which, in turn, leads the NCREIF in time.

Best Pra
|
EPRA RESEARCH 2012 - Square de Meeus 23, 1000 Brussels, Belgium 6
Listed and direct real estate investment
A European analysis
reflecting historical patterns of data availability.9 Data coverage has gradually improved over time,
though, and this study seeks to add to the literature through the use of new transaction linked indices constructed for several European countries by Investment Property Databank (IPD). Furthermore, it differs from much previous research by choosing to compare the cyclical properties of direct and listed real estate series. This is achieved by using the methods of spectral and cross-spectral analysis, which are outlined in the next section.
9 Exceptions are Hoesli & Serrano (2007) who include France among the countries they study and Yunus et al. (2010) who
examine the Netherlands alongside other markets. Meanwhile, Sebastian & Zhu (2011) use house price indices as proxies for the performance of income-producing real estate in an effort to extend the spatial scope of such research.

Best Pra
|
EPRA RESEARCH 2012 - Square de Meeus 23, 1000 Brussels, Belgium 7
Listed and direct real estate investment
A European analysis
3. Methods adopted The studies reviewed in section 2 use a variety of techniques to analyse direct and listed real estate data. These range from comparisons of simple measures such as means and standard deviations to calculation of correlations, use of regression-based Granger Causality tests and the implementation of cointegration techniques such as VECM in order to explore both long run and short run dynamics between the series. These methods can be described as time domain techniques and typically they have been applied in a linear framework. As such, they work well where asset returns are governed by linear dynamic systems, but they cannot detect non-linear dependencies and they also tend to assume a Gaussian distribution in returns. A pervasive feature of real estate markets is their tendency to exhibit cycles. The causes of these are complex and range from external economic factors to rigidities in the real estate market itself, which generate imperfect and lagged responses by market actors. More than one cyclical pattern may also be present; for example, values may fluctuate in reaction to the business cycle and to longer cycles in development activity. Such features are important for understanding real estate performance, but they are not directly identified by the methods mentioned above. However, it is possible to utilise spectral analysis for this purpose, which decomposes a series into several independent components including a slowly varying trend, oscillatory components and a structureless noise term. Results from spectral analysis can then be compared for different series to see whether similar cyclical patterns are evident in each case. A mathematical outline of spectral analysis is given in the appendix, but the procedure essentially involves fitting a trigonometric function to a series with parameters for that function corresponding to a cycle of a particular duration. The amount of variance that is explained by different parameter values can be plotted in the form of a periodogram, analogous to a histogram, in which the peaks disclose the cycle lengths that appear to be most important in the data to hand. For two different, but related series, it is possible that only some and not all of the cycles occurring in one also occur in the other. For instance, there may be short run fluctuations in the prices of real estate shares that are not replicated in the direct market. Such movements could distort correlations even though long term cycles are shared by both series. In this case, cross-spectral analysis can be used to further identify the correspondence between series, as well as any lead-lag relationships that may be present.
10 This is discussed further in the appendix, but consists of measuring the covariance between
cycles of different lengths that may exist in the series. This can be evaluated for different possible cycles and the results plotted to reveal the frequencies of the cycles that the two series appear to share in common. Key outputs are coherency, a scaled measure of the covariance that is bounded by 0 and 1 (analogous to the square of a correlation coefficient), and the phase difference, a measure that reports the amount of time between a cycle of specified length starting in one series and then the other. The techniques of spectral and cross-spectral analysis have rarely been applied to real estate returns data. One instance where they have been used to analyse relationships between direct and indirect real estate was in a study of Singapore by Brown & Liow (2001). They found evidence of a roughly eight year cycle in both direct and listed real estate returns, a high degree of coherence for this cycle and an insignificant lag on the part of the direct market. Apart from this, other examples of the use of these techniques are studies by Oppenheimer & Grissom (1998) and Wilson & Okunev (1999) that compare listed real estate returns to the wider stock market. Therefore, this study increases the use of these techniques in this area. However, to aid comparisons with other literature, this study also presents a number of conventional measures in advance of the spectral and cross-spectral results. In particular, it reports average returns, standard deviations and autocorrelations in individual series, as well as correlations between series and graphs that visually illustrate the volatility and cyclicality of each the series concerned.
10
See Granger (1969) and Iacobucci (2005).

Best Pra
|
EPRA RESEARCH 2012 - Square de Meeus 23, 1000 Brussels, Belgium 8
Listed and direct real estate investment
A European analysis
4. Nature and sources of data Data was sought on the performance of the direct real estate market and listed real estate sector for both different European countries and the US, the latter to provide some comparability with recent research on US data. The data collected are aggregate time series that attempt to depict the general performance of either directly held or listed real estate investments in different locations. Series for the listed sector are henceforth described as equity based indices (EBIs) whilst the direct market series are either valuation based indices (VBIs) or transaction based/linked indices (TBIs) of institutional-grade real estate in each country studied. In all cases, the data used are capital returns in nominal and local currency terms. Capital returns are used since total return figures are not available for the European transaction linked indices. The three types of series are now considered further. Equity based indices The equity based indices used in this study are predominantly the FTSE EPRA/NAREIT indices for the listed real estate sector in different countries. These track the performance of companies engaged in the ownership, trading and development of income-producing real estate. To this end, constituent companies must satisfy a test based on the proportion of EBITDA generated by these activities.
11 The
EBITDA is also checked for the geographical origin of earnings while other rules related to company accounts, size, free-float and turnover of shares exist to ensure that each series represents the most transparent, investible and liquid companies operating in that market. The rules are set out in more detail in FTSE/EPRA/NAREIT (2011) together with the procedures for regular index reviews. The rules used for the FTSE EPRA/NAREIT indices have the advantages of ensuring consistency in the construction of series across countries and of reducing the difference from direct real estate returns attributable to the scope of corporate activities. However, the trade-off for these benefits is that the number of constituents can be small in some markets. In the smallest markets, there are also gaps in coverage owing to a lack of qualifying companies in some time periods; for instance, this is currently the case for Denmark and previously so for Norway, which prevented inclusion of these countries in the study. Nonetheless, for markets in the major European economies, the FTSE EPRA/NAREIT series provide consistent high frequency measures of listed sector returns dating back to end 1989. The series used are the primary published indices for each country in question, but in markets where legislation exists for REIT-style vehicles, sub-indices are available based on companies that qualify for REIT status. In principle, these indices contain data of even greater relevance to this study owing to the increased focus of REITs in terms of activity and the dividend and taxation implications of their corporate structure. However, the time span of these series is typically too short to enable their use here, in part reflecting the relatively recent introduction of REITs to several countries, such as France in 2003 and the UK in 2007. For the US, though, the NAREIT index for Equity REITs was used as this extended back as far as the end of 1971. Valuation based indices With the exception of the US, the valuation based indices used in this study have been produced by Investment Property Databank. They are constructed using cash flow data and regular valuations for property assets that are directly owned by institutional investors and funds that contribute to the IPD performance measurement service. The indices are value weighted and are solely comprised of what are termed standing investments and thus exclude any impacts from development or trading activity as well as the effects of gearing. Although the absolute numbers of assets underlying the different national indices are typically very high, coverage of the total professional investment market in each country varies considerably.
12 More details about the computation and coverage of these indices are given in
IPD (2011a).
11
Some related real estate activities are specifically excluded. This includes financing, brokerage, contracting and project management, investment management, and the operation of trading properties or infrastructure. 12
In terms of European markets, estimated coverage of IPD annual (largest) databases at end 2010 ranged from 17% of the market in the case of Germany through to 54% and 58% in France and the UK and up to 82% in the case of Ireland. These figures are taken from IPD (2011a).
Best Pra
|
EPRA RESEARCH 2012 - Square de Meeus 23, 1000 Brussels, Belgium 9
Listed and direct real estate investment
A European analysis
IPD publishes indices for a number of European countries, but an issue for a time series study is that many only have short histories. Another issue is that the frequency of observations is often low. In each case, the frequency is contingent on the valuation regimes to which contributing investors are subject. Hence, many European indices are only annual, though more frequent indices exist in some markets that are based on subsets of more regularly valued assets.
13 However, owing to demand for more
frequent data for modelling and monitoring purposes, IPD has experimented with the production of quarterly series for a wider range of markets through the use of intermediate cash flow data and interpolation of valuation records (see IPD, 2011b). These experimental series, updated to end 2011, were used here for the following countries: France, Germany, Sweden and Switzerland. A concern with the interpolated series is that the processes involved could exacerbate the problems noted in section 2 regarding possible smoothing and lagging in valuation based series. This issue is acknowledged, but there appears to be little obvious impact on the empirical analyses that follow. In all cases, the aggregate All Property index for a country was used and this contains a mix of property types and locations that broadly reflects, in most cases, the character and spread of the investment market concerned. Finally, the index chosen for the US was that from the National Council of Real Estate Investment Fiduciaries (NCREIF). Although an IPD series exists for the US, the NCREIF index has a longer quarterly time series and is computed on broadly the same lines, though it has been subject to criticism in the extant literature.
14
Transaction based indices For the US market, this study uses the transaction based index produced by the MIT Centre for Real Estate in collaboration with NCREIF that was first discussed in section 2. This series is available at the All Property level from Q1 1984 through to Q1 2011.
15 It is based on regressions of sale prices on to
preceding valuations and time dummy variables, with the coefficients used to trace out the price of a representative property through time. A similar method was subsequently applied to data for the UK by Devaney & Martinez Diaz (2011) and it is this approach that forms the basis of transaction linked indices now produced by IPD for both the UK and a number of European countries.
16 These series were still
under development at the time of writing, but estimated indices for several countries were obtained for the period Q4 2001 to Q4 2011. The transactions data used by these sources are sales of properties that were previously held within the portfolios of contributing investors to NCREIF and IPD, respectively. For the IPD series, separate OLS regressions are conducted for each quarter to gauge the relationship between prices and prior valuations at that point in time. The valuations used are those for two quarters prior to the quarter in which the sale took place. In line with the discussion of valuation based indices above, this means that some of these valuations will be interpolated figures. Meanwhile, as the quarterly sale samples are very small in some countries, the European series are estimated by pooling data across different markets and using dummy variables to identify country or sector specific price changes. The greater transaction volumes in the UK market mean that this index is estimated separately. In contrast to the US series, the coefficients from the UK and European models are used to estimate the sale prices of all properties in the IPD databases that did not trade. It is then changes in the sum of these predicted prices that are used to construct the indices. This process ensures that the indices are both value weighted and mirror the composition of the valuation based indices that IPD produce for the markets concerned. However, despite their potential usefulness as an alternative measure of direct real estate performance, the use of prior valuations in the modelling means that they cannot be produced for longer periods and so the problem of short histories remains. Nor are there enough sales to generate indices that are more frequent than quarterly.
13
For instance, a truly quarterly series exists for Ireland from end-1994, the Netherlands from end-2007 and the UK from end-2000, with a UK monthly index also available from end-1986 (IPD, 2011a). 14
For example, historically, not all properties used to construct the NCREIF index had quarterly reappraisals, so some valuations were simply rolled over from previous quarters (termed stale appraisals). See Geltner (1993). 15
Q1 2011 marked the end of regular production of the econometric TBI by the MIT Centre for Real Estate. In its place, NCREIF now uses ratios of observed sale prices to preceding valuations to construct a transaction based index of performance. See http://www.ncreif.org/tbi-returns.aspx 16
IPD describes these series as Transaction Linked Indices because they use both transaction and valuation data in the regression model and are not purely reliant on transaction based inputs.

Best Pra
|
EPRA RESEARCH 2012 - Square de Meeus 23, 1000 Brussels, Belgium 10
Listed and direct real estate investment
A European analysis
In summary, while a variety of indices are now available for many European real estate markets, it is clear that each type of index has strengths and weaknesses, while not all types of index are available in each country. The sample of markets used in this study is defined by the objective of comparing the three types of series discussed above and thus was narrowed to the following countries: France, Germany, the Netherlands, Sweden, Switzerland, the UK and the US. The range of countries is mainly constrained by the availability of transaction based/linked indices while time periods for comparisons are limited by the length of both transaction and valuation based series. Nonetheless, this study tries to break new ground with the data that is now available and provide a reference point for future research once the length and quality of European real estate data has improved further.
Best Pra
|
EPRA RESEARCH 2012 - Square de Meeus 23, 1000 Brussels, Belgium 11
Listed and direct real estate investment
A European analysis
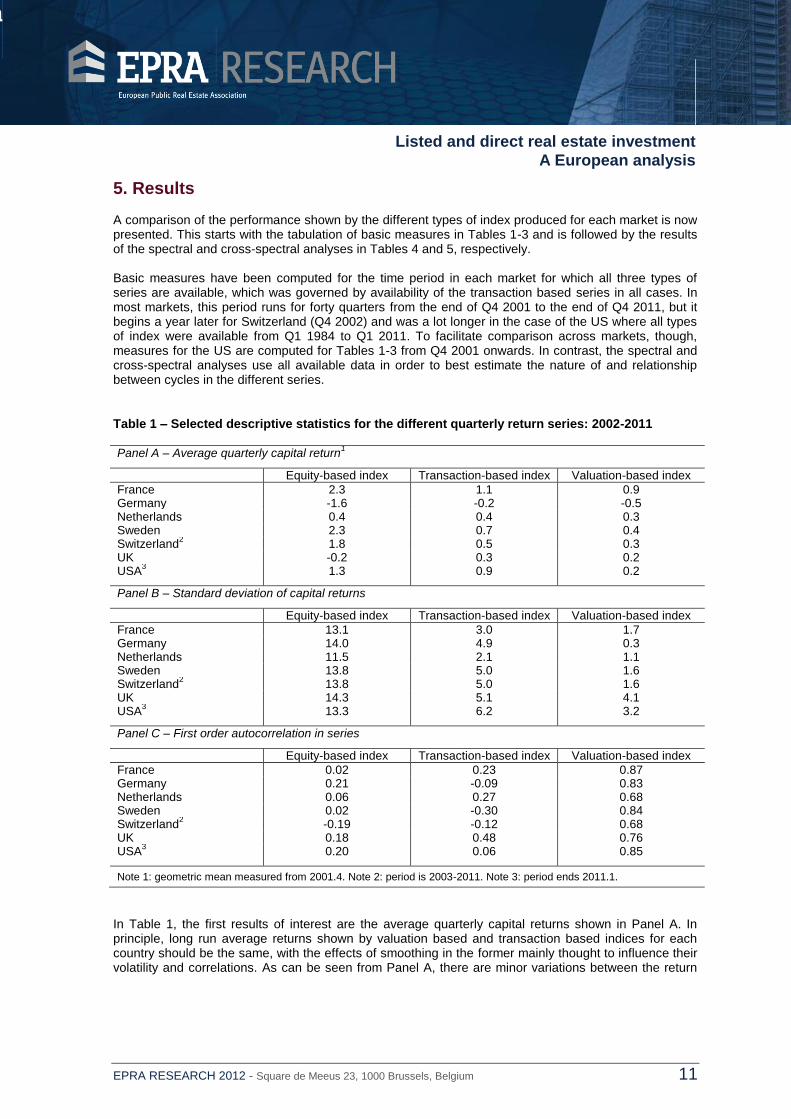
5. Results A comparison of the performance shown by the different types of index produced for each market is now presented. This starts with the tabulation of basic measures in Tables 1-3 and is followed by the results of the spectral and cross-spectral analyses in Tables 4 and 5, respectively. Basic measures have been computed for the time period in each market for which all three types of series are available, which was governed by availability of the transaction based series in all cases. In most markets, this period runs for forty quarters from the end of Q4 2001 to the end of Q4 2011, but it begins a year later for Switzerland (Q4 2002) and was a lot longer in the case of the US where all types of index were available from Q1 1984 to Q1 2011. To facilitate comparison across markets, though, measures for the US are computed for Tables 1-3 from Q4 2001 onwards. In contrast, the spectral and cross-spectral analyses use all available data in order to best estimate the nature of and relationship between cycles in the different series.
Table 1 – Selected descriptive statistics for the different quarterly return series: 2002-2011 Panel A – Average quarterly capital return
1
Equity-based index Transaction-based index Valuation-based index
France 2.3 1.1 0.9 Germany -1.6 -0.2 -0.5 Netherlands 0.4 0.4 0.3 Sweden 2.3 0.7 0.4 Switzerland
2 1.8 0.5 0.3
UK -0.2 0.3 0.2 USA
3 1.3 0.9 0.2
Panel B – Standard deviation of capital returns
Equity-based index Transaction-based index Valuation-based index
France 13.1 3.0 1.7 Germany 14.0 4.9 0.3 Netherlands 11.5 2.1 1.1 Sweden 13.8 5.0 1.6 Switzerland
2 13.8 5.0 1.6
UK 14.3 5.1 4.1 USA
3 13.3 6.2 3.2
Panel C – First order autocorrelation in series
Equity-based index Transaction-based index Valuation-based index
France 0.02 0.23 0.87 Germany 0.21 -0.09 0.83 Netherlands 0.06 0.27 0.68 Sweden 0.02 -0.30 0.84 Switzerland
2 -0.19 -0.12 0.68
UK 0.18 0.48 0.76 USA
3 0.20 0.06 0.85
Note 1: geometric mean measured from 2001.4. Note 2: period is 2003-2011. Note 3: period ends 2011.1.
In Table 1, the first results of interest are the average quarterly capital returns shown in Panel A. In principle, long run average returns shown by valuation based and transaction based indices for each country should be the same, with the effects of smoothing in the former mainly thought to influence their volatility and correlations. As can be seen from Panel A, there are minor variations between the return

Best Pra
|
EPRA RESEARCH 2012 - Square de Meeus 23, 1000 Brussels, Belgium 12
Listed and direct real estate investment
A European analysis
figures for these series, with transaction indices showing marginally stronger growth.17
In comparison, there are larger differences between these figures and returns for the equity based indices. However, these differences are consistent with the effects of leverage since stronger growth for the equity based series is observed where the underlying direct market performed relatively well and declines are found where direct real estate had weak or negative growth. In Panel B of Table 1, standard deviations are shown for each quarterly capital return series. Here, differences between the valuation based and transaction based series are more evident. Transaction based series are typically two to three times more volatile than the valuation based series, but they do not match the volatility of the equity based series over this period, which is reasonably consistent in absolute terms across the sample of countries studied. For the US and UK, equity based indices are three to four times more volatile than their valuation based counterparts whereas they are eight to ten times more volatile for France, Netherlands, Sweden and Switzerland.
18 Again, leverage is an important
factor, but the trading environment for real estate shares is important too in this respect. Panel C completes Table 1 by showing the first order autocorrelation in each series. This measures the extent to which current period returns are related to those in the previous period and a value of zero indicates that returns in the immediate past have no predictive power, which could be taken as a signal of weak form efficiency. For the equity based series, none of the correlation coefficients are significantly different from zero. In contrast, for the valuation based series, all of them are high and significant at the 1% level – consistent with the presence of smoothing. The coefficients for the transaction based series are more mixed, but closer in nature to those of the equity based series, the anomalies being Sweden, with a large negative value, and the UK where the value of 0.48 is high and significantly different from zero at the 1% level. The time series performance of the three types of index is then graphed for each of the six European countries in Figure 1, charts (a) to (f) – overleaf. The charts demonstrate the consistency of the two direct real estate series in terms of their overall trends. They also indicate the comparative smoothness of the valuation based series and the much greater volatility of the equity based indices in comparison with the other series. Nonetheless, the equity based series trace out a cycle that is followed in most cases by the direct real estate market with a lag. The main exceptions are (b) Germany and (e) Switzerland where there is no obvious cycle in the direct market indices and so the relationship with the performance of the listed sector is less obvious. In the former case, this may be unsurprising in light of the continuing debate around German valuations (see Crosby et al., 2011). It is surprising in the case of the transaction based index. Table 2 explores the issues of relatedness and lead-lag relationships further by examining correlation coefficients between selected pairings, again using data for the sub-periods in each country when all three types of series are available.
19 Contemporaneous correlations between movements in all types of
series are shown as well as correlations where the equity based series are lagged for one, two, three or four periods. This allows for the possibility that information in the equity based series could take up to a year to manifest itself in one of the direct market indicators. Those correlations that are significantly different from zero at the 5% level are shown in bold. Given the earlier arguments about valuation smoothing, it was expected that correlations between changes in the transaction based and equity based series would be stronger and would arise after a shorter lag. However, Table 2 does not show this. In the case of France and the Netherlands, correlations with both types of direct market series are similar and strongest at a lag of two to four quarters while the same is true for the UK, but with a lag of zero to two quarters. For the US, the results are weakly suggestive that the transaction based index reacts more quickly to movements in the equity
17
The large gap in the US case may be due to weighting (US TBI is equal weighted) and different treatments of capital expenditure within the return calculations (see Fisher et al., 2007). 18
Over the period Q1 1984 to Q1 2011, both means and standard deviations for the US series are lower, but the ratios in volatility are very similar. 19
Pairwise correlations using longer runs of data for comparing the equity based series and valuation based series tell a substantively similar story.

Best Pra
|
EPRA RESEARCH 2012 - Square de Meeus 23, 1000 Brussels, Belgium 13
Listed and direct real estate investment
A European analysis
based series than the valuation based one,20
but, for the remaining markets, the figures are inconsistent. For instance, in Sweden, the valuation based index seems to have stronger short term links to the listed sector series, but, in Germany, the opposite seems to hold.
Figure 1 – Comparison of indices for each market: 2002-2011 (Indices = 100 at Q4 2005)
(a) France (d) Sweden
0
20
40
60
80
100
120
140
160
180
20
01
.4
20
02
.2
20
02
.4
20
03
.2
20
03
.4
20
04
.2
20
04
.4
20
05
.2
20
05
.4
20
06
.2
20
06
.4
20
07
.2
20
07
.4
20
08
.2
20
08
.4
20
09
.2
20
09
.4
20
10
.2
20
10
.4
20
11
.2
20
11
.4
TBI VBI EBI
0
20
40
60
80
100
120
140
160
20
01
.4
20
02
.2
20
02
.4
20
03
.2
20
03
.4
20
04
.2
20
04
.4
20
05
.2
20
05
.4
20
06
.2
20
06
.4
20
07
.2
20
07
.4
20
08
.2
20
08
.4
20
09
.2
20
09
.4
20
10
.2
20
10
.4
20
11
.2
20
11
.4
TBI VBI EBI
(b) Germany (e) Switzerland
0
20
40
60
80
100
120
140
160
20
01
.4
20
02
.2
20
02
.4
20
03
.2
20
03
.4
20
04
.2
20
04
.4
20
05
.2
20
05
.4
20
06
.2
20
06
.4
20
07
.2
20
07
.4
20
08
.2
20
08
.4
20
09
.2
20
09
.4
20
10
.2
20
10
.4
20
11
.2
20
11
.4
TBI VBI EBI
0
20
40
60
80
100
120
140
160
20
02
.4
20
03
.2
20
03
.4
20
04
.2
20
04
.4
20
05
.2
20
05
.4
20
06
.2
20
06
.4
20
07
.2
20
07
.4
20
08
.2
20
08
.4
20
09
.2
20
09
.4
20
10
.2
20
10
.4
20
11
.2
20
11
.4
TBI VBI EBI
(c) Netherlands (f) UK
0
20
40
60
80
100
120
140
160
20
01
.4
20
02
.2
20
02
.4
20
03
.2
20
03
.4
20
04
.2
20
04
.4
20
05
.2
20
05
.4
20
06
.2
20
06
.4
20
07
.2
20
07
.4
20
08
.2
20
08
.4
20
09
.2
20
09
.4
20
10
.2
20
10
.4
20
11
.2
20
11
.4
TBI VBI EBI
0
20
40
60
80
100
120
140
160
20
01
.4
20
02
.2
20
02
.4
20
03
.2
20
03
.4
20
04
.2
20
04
.4
20
05
.2
20
05
.4
20
06
.2
20
06
.4
20
07
.2
20
07
.4
20
08
.2
20
08
.4
20
09
.2
20
09
.4
20
10
.2
20
10
.4
20
11
.2
20
11
.4
TBI VBI EBI
20
When measured from Q1 1984, the pattern is clearer. Correlation with the transaction based index again peaks at a lag of two quarters while, for the valuation based index, it peaks at four quarters distant.

Best Pra
|
EPRA RESEARCH 2012 - Square de Meeus 23, 1000 Brussels, Belgium 14
Listed and direct real estate investment
A European analysis
Table 2 – Contemporaneous and lagged correlations between selected series, 2002-2011 Indicator
EBI EBI t-1 EBI t-2 EBI t-3 EBI t-4 VBI
France TBI 0.23 0.17 0.42 0.27 0.40 0.63
VBI 0.17 0.27 0.41 0.53 0.45 -
Germany TBI -0.17 0.33 0.30 0.07 0.11 0.15 VBI -0.36 -0.25 0.01 0.09 0.27 -
Netherlands TBI 0.06 0.11 0.29 0.49 0.18 0.54
VBI 0.25 0.17 0.32 0.24 0.38 -
Sweden TBI 0.07 0.20 -0.07 0.05 0.24 0.26
VBI 0.07 0.19 0.35 0.47 0.37 -
Switzerland TBI -0.17 -0.06 0.12 -0.05 0.39 0.10 VBI -0.29 0.02 -0.03 0.19 0.16 -
UK TBI 0.37 0.52 0.46 0.31 0.02 0.81
VBI 0.55 0.56 0.55 0.20 0.08 -
USA TBI 0.20 0.33 0.37 0.27 0.09 0.61
VBI 0.28 0.29 0.34 0.39 0.43 -
Correlation coefficients in bold are positive and significantly different from zero at the 5% level.
Table 2 also reports contemporaneous correlations between changes in the transaction based and valuation based series. These are moderate to high in magnitude in four of the seven countries, but low in Sweden and very low for Germany and Switzerland, which seems consistent with the picture of market performance and volatility given in Figure 1. In general, though, correlations are a limited measure of the relatedness of series, as they may be distorted by outliers or estimation noise during the period concerned. With this in mind, Table 3 shows when the different series in each country marked the major turning points in the most recent cycle.
Table 3 – Peak and trough points in the most recent major cycle Panel A – Timing of index peak
Equity-based index Transaction-based index Valuation-based index
France 2007.1 2008.1 2007.4 Germany 2006.4 - - Netherlands 2007.1 2008.3 2008.3 Sweden 2007.1 2008.2 2007.4 Switzerland 2007.1 - - UK 2006.4 2007.3 2007.2 USA 2007.1 2007.2 2008.1
Panel B – Timing of subsequent trough
Equity-based index Transaction-based index Valuation-based index
France 2009.1 2009.4 2009.4 Germany 2009.1 - - Netherlands 2009.1 2010.1 - Sweden 2009.1 2010.3 2009.4 Switzerland 2009.1 - - UK 2009.1 2009.2 2009.2 USA 2009.1 2009.4 2010.1
Overall, the peaks and troughs in the transaction based indices tend to occur in the same or adjacent quarter to those in the valuation based series and both of these lag the equity based indices, which consistently mark the peak at Q4 2006 or Q1 2007 and the trough as Q1 2009 across this sample of

Best Pra
|
EPRA RESEARCH 2012 - Square de Meeus 23, 1000 Brussels, Belgium 15
Listed and direct real estate investment
A European analysis
countries. However, for the US, the transaction based index is much faster to record a peak and slightly faster at marking a trough. Hence, these findings are consistent with the story indicated by Table 2. In line with earlier comments, there is no obvious peak or trough for Germany or Switzerland and no trough in the Netherlands valuation based index prior to the end of 2011. A more formal analysis of the cyclical properties of each series is provided by applying the spectral analysis described in section 3. As mentioned earlier, it is applied to all observations for a series in order to obtain the best possible estimates of important cycle frequencies from the limited data that is available. Results in terms of the length of different cycles in each series are shown in Table 4. The first number within each cell of the table corresponds to the cycle that explains most of the variance while the results in brackets relate to other, smaller peaks that occur in the periodogram.
21
Table 4 – Length in quarters of cycles indicated by spectral analysis Equity-based index
1 Transaction-based index
2 Valuation-based index
3
France 2 (5.5, 17.6, 88) >40 >48 Germany 22 (5.5) 5 >48 Netherlands 5.5 (14.67) >40 >48 Sweden 88 2.67 24 Switzerland 3.83 (22) 4 >40 UK 22 (5.87) >40 25 USA 5.52 (22.86, 8) 36 (4, 5.68) 34
Numbers in brackets indicate periods or harmonics of less important cycles, ranked by spectral density (high to low) and omitting cycles less than four quarters in duration.
Note 1: n = 89 quarters except in US (161). Note 2: n = 49 quarters except in Switzerland (41), UK (101) and US (137). Note 3: n = 41 quarters except in Switzerland (37) and US (109).
The clearest results in Table 4 are for the US, which also has the longest runs of data for each type of index. The results for the transaction based and valuation based indices point to an 8-9 year cycle in the direct real estate market. Meanwhile, the UK results of 25 quarters for the valuation based index and 22 quarters for the equity based index are suggestive of a 5-6 year cycle, a frequency that also emerges in the equity based indices for three other countries. This shorter frequency may reflect the business cycle. It is noticeable too that the equity based series exhibit more short term oscillations.
22 The valuation
based indices, on the other hand, mostly suggest that the dominant cycle frequency in Europe lies outside the range of the time series available to this study and this is largely supported by the transaction based series for markets where cycles were observed in Figure 1. With longer time series, better estimates of any long cycle would be possible. Table 5 reports results from the cross-spectral analyses. Panel A contains coherency values, which measure the correspondence between series for cycles of different frequencies. The reported values are the minimums for all cycles with a frequency of 20 quarters (5 years) or longer. Thus, they aim to convey the general coherence between the two series concerned in terms of their long term cyclical movements. In addition, for the six European countries, Figure 2 charts coherency values across the range of frequencies studied. Lastly, Panel B of Table 5 reports phase differences and these show the extent to which a given series either leads (+) or lags (-) the other in terms of recording longer term movements.
From Table 5, it can be seen that, in most countries, there is a high level of coherency between the valuation based and transaction based indices. Meanwhile, the figures suggest moderate coherency between the direct market measures and real estate shares in all cases except Sweden. In this latter case, Figure 2 indicates that there is reasonable correspondence in the medium term between these series; as such, the results for Sweden remain somewhat anomalous. Figure 2 also makes clear that coherency typically rises at higher frequencies, which is consistent with many of the observations in
21
The periodograms are available from the authors on request. 22
This includes very short-term minor oscillations (less than four quarters) that are not reported. See notes to Table 4.

Best Pra
|
EPRA RESEARCH 2012 - Square de Meeus 23, 1000 Brussels, Belgium 16
Listed and direct real estate investment
A European analysis
previous research with regard to the long term connection of direct and indirect forms of real estate. Yet this does not appear to hold for Germany and Switzerland, implying that there is a disconnection between all the series that attempt to measure these markets.
Figure 2 – Coherency graphs from the cross-spectral analysis
(a) France (d) Sweden
0.00
0.10
0.20
0.30
0.40
0.50
0.60
0.70
0.80
0.90
1.00
2.0
0
2.1
1
2.2
2
2.3
5
2.5
0
2.6
7
2.8
6
3.0
8
3.3
3
3.6
4
4.0
0
4.4
4
5.0
0
5.7
1
6.6
7
8.0
0
10
.00
13
.33
20
.00
40
.00
> 4
0
Co
her
ency
Frequency (quarters)
EBI and VBI EBI and TBI VBI and TBI
0.00
0.10
0.20
0.30
0.40
0.50
0.60
0.70
0.80
0.90
1.00
2.0
0
2.1
1
2.2
2
2.3
5
2.5
0
2.6
7
2.8
6
3.0
8
3.3
3
3.6
4
4.0
0
4.4
4
5.0
0
5.7
1
6.6
7
8.0
0
10
.00
13
.33
20
.00
40
.00
> 4
0
Co
her
ency
Frequency (quarters)
EBI and VBI EBI and TBI VBI and TBI
(b) Germany (e) Switzerland
0.00
0.10
0.20
0.30
0.40
0.50
0.60
0.70
0.80
0.90
1.00
2.0
0
2.1
1
2.2
2
2.3
5
2.5
0
2.6
7
2.8
6
3.0
8
3.3
3
3.6
4
4.0
0
4.4
4
5.0
0
5.7
1
6.6
7
8.0
0
10
.00
13
.33
20
.00
40
.00
> 4
0
Co
her
ency
Frequency (quarters)
EBI and VBI EBI and TBI VBI and TBI
0.00
0.10
0.20
0.30
0.40
0.50
0.60
0.70
0.80
0.90
1.00
2.0
0
2.1
2
2.2
5
2.4
0
2.5
7
2.7
7
3.0
0
3.2
7
3.6
0
4.0
0
4.5
0
5.1
4
6.0
0
7.2
0
9.0
0
12
.00
18
.00
36
.00
> 3
6
Co
her
ency
Frequency (quarters)
EBI and VBI EBI and TBI VBI and TBI
(c) Netherlands (f) UK
0.00
0.10
0.20
0.30
0.40
0.50
0.60
0.70
0.80
0.90
1.00
2.0
0
2.1
1
2.2
2
2.3
5
2.5
0
2.6
7
2.8
6
3.0
8
3.3
3
3.6
4
4.0
0
4.4
4
5.0
0
5.7
1
6.6
7
8.0
0
10
.00
13
.33
20
.00
40
.00
> 4
0
Co
her
ency
Frequency (quarters)
EBI and VBI EBI and TBI VBI and TBI
0.00
0.10
0.20
0.30
0.40
0.50
0.60
0.70
0.80
0.90
1.00
2.0
0
2.1
1
2.2
2
2.3
5
2.5
0
2.6
7
2.8
6
3.0
8
3.3
3
3.6
4
4.0
0
4.4
4
5.0
0
5.7
1
6.6
7
8.0
0
10
.00
13
.33
20
.00
40
.00
> 4
0
Co
her
ency
Frequency (quarters)
EBI and VBI EBI and TBI VBI and TBI
Finally, the phase differences shown in Table 5 are largely consistent in suggesting that equity based indices lead the direct market series, with the magnitude of this lead broadly matching the evidence from correlation tests in Table 2. Thus, on this evidence, indices of listed real estate seem to function as a leading indicator of both short term movements and long term oscillations in direct real estate markets

Best Pra
|
EPRA RESEARCH 2012 - Square de Meeus 23, 1000 Brussels, Belgium 17
Listed and direct real estate investment
A European analysis
irrespective of whether the latter are measured on a valuation or transaction basis. They also suggest that transaction based series move contemporaneously with the valuation based series, except in the US and in Switzerland where the coherence is very weak. Reflections on these results now follow.
Table 5 – Coherency and phase results from cross-spectral analysis Panel A – Coherency for cycles of 20 quarters or longer
EBI and VBI EBI and TBI VBI and TBI
France ≥ 0.34 ≥ 0.33 ≥ 0.94 Germany ≥ 0.35 ≥ 0.28 ≥ 0.02 Netherlands ≥ 0.23 ≥ 0.24 ≥ 0.80 Sweden ≥ 0.05 ≥ 0.07 ≥ 0.77 Switzerland
1 ≥ 0.31 ≥ 0.23 ≥ 0.06
UK ≥ 0.92 ≥ 0.87 ≥ 0.98 USA ≥ 0.09 ≥ 0.31 ≥ 0.69
Panel B – Phase difference for cycles of 20 quarters or longer
EBI leads VBI EBI leads TBI VBI leads TBI
France 1.66 1.83 0.16 Germany -1.17 2.13 n/a
2
Netherlands 3.02 3.35 -0.35 Sweden 3.92 4.30 0.23 Switzerland
1 -2.34 1.50 -2.54
UK 0.50 0.62 0.06 USA 3.43 1.99 -1.32
Note 1: Owing to smaller numbers of data points, the Switzerland result is for 18 quarters or greater. Note 2: Not reported as coherency < 0.05.

Best Pra
|
EPRA RESEARCH 2012 - Square de Meeus 23, 1000 Brussels, Belgium 18
Listed and direct real estate investment
A European analysis
6. Summary and conclusions Understanding the relationships between the listed real estate sector and the underlying real estate markets in which these companies invest is an important topic for investors and market analysts. It has also generated a substantial body of research over the last three decades. This research suggests that despite short term differences in performance, the returns from listed and direct real estate are firmly linked in the long run. Hence, the two different forms of investment might be regarded as long term substitutes. However, the majority of studies have needed to rely on valuation based indicators of the direct real estate market and so their results may be affected by smoothing within such series or be contingent on the methods used to deal with such effects. With the increased availability of transaction based/linked indices, researchers have started to examine this fundamental topic once more. This study contributes to that effort by comparing the listed sector in several European countries with both valuation based and new transaction linked indices that IPD has produced for those same countries. This comparison involved a basic analysis of capital returns over the period 2002-2011 and the use of spectral and cross-spectral analysis that uses all available time series observations for the different series concerned. The latter techniques are used to investigate whether direct and listed real estate share similar cyclical attributes and assess the extent to which their cycles correspond. The results of the study are consistent with previous research in affirming the long term relatedness of listed and direct real estate performance. In most cases, the movements in the listed sector were found to lead those in the direct market regardless of whether valuation or transaction based series were used. Furthermore, transaction based/linked indices do not appear to respond any more rapidly than valuation indices whether judged in terms of correlations, peaks and troughs or phase differences. However, they do exhibit more volatility and less autocorrelation. Meanwhile, results are weakest in the cases of Germany and Switzerland; here there seems to be little connection between any of the types of index that attempt to measure these markets. The fact that the available transaction based series do not provide markedly different results to valuation indices is something of a puzzle, but is likely to reflect several factors. Over the long term, transaction based series should exhibit similar trends and cycles to valuation based ones even if their movements are not synchronised since, ultimately, they track the same asset market. Therefore, the spectral and cross-spectral analyses should find similar cycles and high coherency, which they do in most cases. Also, while short term changes in valuation based indices may be affected by valuation smoothing, the transaction based series used here are affected by the temporal aggregation of sales evidence in each quarter and the time gap between price agreement and the sale completion date used in index construction (see Devaney & Martinez Diaz, 2011).
23
Another factor is that many investors in direct real estate have discretion about what and when to sell, and may wait longer to sell in poorer markets if they decide to sell at such times at all. Although conventional techniques for transaction index construction enable quality to be held constant over time, most extant indices do not adjust for variations in liquidity whereby the prices recorded at different times will reflect varying ease of selling (Fisher et al., 2003). This may help to explain the results found here, though more research is needed to understand the role of this aspect. Finally, for European markets, only relatively short time series could be obtained. Thus, future extensions of this study may generate different results when more years of performance evidence are available.
23
For the mainland European markets, this temporal aggregation factor is more marked as low sales volumes have led to rolling six-month samples of sales being used in the underlying models.

Best Pra
|
EPRA RESEARCH 2012 - Square de Meeus 23, 1000 Brussels, Belgium 19
Listed and direct real estate investment
A European analysis
Appendix A – spectral analysis Consider a time series that can be described by a mathematical function, g, of time, t, plus a random
disturbance, . Such a time series could be a transaction based index of the direct real estate market. If g(t) is PERIODIC with a period of T, then:
tttTt TBIεg(t)εTtgTBI
In other words, the value of the time series will repeat itself every T periods, as if it were moving in a circular fashion. Thus, the time taken to complete one cycle will be T periods and, within that cycle, it
can be said that the series has travelled 2 radians. Related to this is the concept of frequency, f, which is the number of cycles travelled by the series per unit of time, with f = 1/T.
Such a periodic function can be represented by a trigonometric series; g(t) = cos(t), where is
termed angular frequency and is equal to 2f, which is the number of radians travelled by the series per
unit of time. Suppose that at time, t, the series is at position B which is radians away from the starting
position A. If we know and , the value of g(t) can be predicted for any given time t. Of course, the true
parameters and are unknown, but these can be estimated using sample data.
If the series contains a cycle with frequency j, then the estimated power spectrum, f(j), will have a
peak at j if we plot f(j) against . We can then infer that the period of the cycle is Tj = 2/j. This example is rather simplistic. It is more likely that a series such as a transaction index will contain components with periodic movements of different frequencies, as illustrated in Figure A1 where:
t2211t21t εt)cos(ωβt)cos(ωβε(t)gtgTBI
Figure A1 – A time series containing two cyclical processes
In more formal terms, consider a stationary random process of the form

Best Pra
|
EPRA RESEARCH 2012 - Square de Meeus 23, 1000 Brussels, Belgium 20
Listed and direct real estate investment
A European analysis
Where j, j = 1, …,k, is a set of real numbers with j and aj, j = 1, …, k, a set of independent, complex random variables with
Where is the conjugate of . For each j,
which is a periodic function with frequency j/2 cycles per unit of time, and period 2/ j units of time
per cycle. The element j is called the angular frequency measured in radians per time unit. The autocovariance of Xt has a spectral representation of the form
where F() is the power spectral distribution function. When F() is absolutely continuous, the following can be written
with f() the power spectrum of the random process Xt. For a real, stationary process with 0 j ,
All spectral estimates are of the form
where , j = 0, …, m, with m the cut-off point or number of lags used. The covariance estimate Ck
is similar to
A weight k is assigned to covariance of different lags. Different weights and smoothing formula are used in different spectral estimating approaches (for example, Tukey-Hanning and Parzen).
The (100 - )% confidence interval of is given by
Or
For Tukey –Hanning and Parzen estimates,
, and
where n is the number of observations in the sample, m the number of lags used and k the equivalent degree of freedom (‘equivalent’ because data may not be exactly normally distributed) with k = 2n/m.

Best Pra
|
EPRA RESEARCH 2012 - Square de Meeus 23, 1000 Brussels, Belgium 21
Listed and direct real estate investment
A European analysis
Appendix B – cross-spectral analysis When two series, such as a transaction based index and a valuation based index, contain a cycle component with the same frequency, it is useful to measure the covariance in this component of the two
processes. This can be done by estimating a statistic called coherency, C(), with 0 C() 1, analogous to the square of the correlation coefficient between two samples.
Consider a pair of real bivariate stationary processes {Xt, Yt} with auto-covariance xx() and yy() and
cross-covariance xy(). The spectral representation for the bivariate processes becomes
For the processes with absolutely continuous spectral density functions, these become
where and are the power spectra of the processes {Xt}, {Yt} respectively; is the co-
spectrum, the quadrature spectrum, and
Is known as the power cross-spectrum between {Xt} and {Yt}. These functions obey the coherence-inequality:
Inverting the covariance function above gives
Twice the co-spectral density gives the covariance between the components that are in phase, whilst twice the quadrature spectral density gives the covariance between the components that are in
quadrature (/2 out of phase). Therefore, if but , the components of the two
processes with frequency are somewhat connected and exactly in phase with each other, but if
and , the two components will be somewhat connected and somewhat out of phase.
To measure the extent to which the frequency component of {Xt} is correlated to the frequency
component of {Yt}, we need to make use of cross-spectra. A measure of the correlation between the frequency components of the two processes is given by
,
which is called the coherency between {Xt} and {Yt} and .

Best Pra
|
EPRA RESEARCH 2012 - Square de Meeus 23, 1000 Brussels, Belgium 22
Listed and direct real estate investment
A European analysis
is analogous to the square of the correlation coefficient between two samples and may be
interpreted in a similar way. A plot of C() against angular frequency over produces a
coherency diagram, such as those presented in Figure 2 of the main report for the countries in this study.
The same frequency component of the two processes may be out of phase; for example, the j frequency component of the transaction based index may lead the same component of the valuation based index by 2 quarters. A measure of the phase difference between the frequency components of the two processes is
And the plot of against over is called the phase diagram. Both C() and () can be
estimated using sample data. The estimate of co-spectrum, quadrature spectrum, and their null distribution can be found in Granger & Hatanaka (1964: 78-9).

Best Pra
|
EPRA RESEARCH 2012 - Square de Meeus 23, 1000 Brussels, Belgium 23
Listed and direct real estate investment
A European analysis
References Barkham, R. and Geltner, D. (1995), Price Discovery in American and British Property Markets, Real
Estate Economics, 23 (1): 21-44.
Barkham, R. J. and Ward, C .W. R. (1999), Investor Sentiment and Noise Traders: Discount to Net Asset Value in Listed Property Companies in the U.K., Journal of Real Estate Research, 18 (2): 291-312.
Bond, S. A., Hwang, S. and Marcato, G. (2012), Commercial Real Estate Returns: An Anatomy of Smoothing in Asset and Index Returns, Real Estate Economics, Forthcoming.
Boudry, W. I., Coulson, N. E., Kallberg, J. G. and Liu, C. H. (2012), On the Hybrid Nature of REITs, Journal of Real Estate Finance and Economics, Forthcoming.
Brown, G. and Liow, K. H. (2001), Cyclical relationship between commercial real estate and property stock prices, Journal of Property Research, 18 (4): 309-320.
Clayton, J., Geltner, D. and Hamilton, S. W. (2001), Smoothing in Commercial Property Valuations: Evidence from Individual Appraisals, Real Estate Economics, 29 (3): 337-360.
Clayton, J. and MacKinnon, G. (2001), The Time-Varying Nature of the Link Between REIT, Real Estate and Financial Asset Returns, Journal of Real Estate Portfolio Management, 7 (1): 43-54.
Clayton, J. and MacKinnon, G. (2003), The Relative Importance of Stock, Bond and Real Estate Factors in Explaining REIT Returns, Journal of Real Estate Finance and Economics, 27 (1): 39-60.
Corgel, J. B., McIntosh, W. and Ott, S. H. (1995), Real Estate Investment Trusts: A Review of the Financial Economics Literature, Journal of Real Estate Literature, 3 (1): 13-43.
Crosby, N., Devaney, S. and Law, V. (2011), Benchmarking and valuation issues in measuring depreciation for European office markets, Journal of European Real Estate Research, 4 (1): 7-28.
Devaney, S. and Martinez Diaz, R. (2011), Transaction based indices for the UK commercial real estate market: an exploration using IPD transaction data, Journal of Property Research, 28 (4): 269-289.
Eichholtz, P. M. A. and Hartzell, D. J. (1996), Property Shares, Appraisals and the Stock Market: An International Perspective, Journal of Real Estate Finance and Economics, 12 (2): 163-178.
Fisher, J., Gatzlaff, D., Geltner, D. and Haurin, D. (2003), Controlling for the Impact of Variable Liquidity in Commercial Real Estate Price Indices, Real Estate Economics, 31 (2): 269-303.
Fisher, J., Geltner, D. and Pollakowski, H. (2007), A Quarterly Transactions-based Index of Institutional Real Estate Investment Performance and Movements in Supply and Demand, Journal of Real Estate Finance and Economics, 34 (1): 5-33.
Fisher, J. D., Geltner, D. M. and Webb, R. B. (1994), Value Indices of Commercial Real Estate: A Comparison of Index Construction Methods, Journal of Real Estate Finance and Economics, 9 (2): 137-164.
FTSE/EPRA/NAREIT (2011), Ground Rules for the Management of the FTSE EPRA/NAREIT Global Real Estate Index Series: Version 5.0 December 2011, FTSE / EPRA / NAREIT.
Geltner, D. (1993), Estimating Market Values from Appraised Values without Assuming an Efficient Market, Journal of Real Estate Research, 8 (3): 325-345.
Geltner, D., MacGregor, B. D. and Schwann, G. M. (2003), Appraisal Smoothing and Price Discovery in Real Estate Markets, Urban Studies, 40 (5-6): 1047-1064.
Giliberto, S. M. (1990), Equity Real Estate Investment Trusts and Real Estate Returns, Journal of Real Estate Research, 5 (2): 259-263.
Glascock, J. L., Lu, C. and So, R. W. (2000), Further Evidence on the Integration of REIT, Bond and Stock Returns, Journal of Real Estate Finance and Economics, 20 (2): 177-194.

Best Pra
|
EPRA RESEARCH 2012 - Square de Meeus 23, 1000 Brussels, Belgium 24
Listed and direct real estate investment
A European analysis
Granger, C. W. J. (1969), Investigating casual relations by econometric models and cross-spectral methods, Econometrica, 37 (3): 424-438.
Granger, C. W. J. and M. Hatanaka (1964), Spectral analysis of economic time series, Princeton, New Jersey, Princeton University Press.
Gyourko, J. and Keim, D. B. (1992), What Does the Stock Market Tell Us About Real Estate Returns?, Journal of the American Real Estate and Urban Economics Association, 20 (3): 457-485.
Hoesli, M. and Oikarinen, E. (2012), Are REITs real estate? Evidence from international sector level data, Journal of International Money and Finance, Forthcoming.
Hoesli, M. and Serrano, C. (2007), Securitized Real Estate and its Link with Financial Assets and Real Estate: An International Analysis, Journal of Real Estate Literature, 15: 59-84.
Iacobucci, A. (2005), Spectral Analysis for Economic Time Series, In Leskow, J., Punzo, L. F. and Puchet, M. (Eds.), New Tools of Economic Dynamics, Springer Berlin Heidelberg, pp. 203-219.
IPD (2011a), IPD Index Guide: Edition Seven – December 2011, Investment Property Databank, London.
IPD (2011b), The IPD Solvency II Review: Informing a New Regulatory Framework for Real Estate, Investment Property Databank, London.
Malpezzi, S. and Shilling, J. D. (2000), Institutional Investors Tilt Their Real Estate Holdings Toward Quality, Too, Journal of Real Estate Finance and Economics, 21 (2): 113-140.
Myer, F. C. N. and Webb, J. R. (1993), Return Properties of Equity REITs, Common Stocks, and Commercial Real Estate: A Comparison, Journal of Real Estate Research, 8 (1): 87-106.
Oikarinen, E., Hoesli, M. and Serrano, C. (2011), The Long-Run Dynamics between Direct and Securitized Real Estate, Journal of Real Estate Research, 33 (1): 73-102.
Oppenheimer, P. and Grissom, T. V. (1998), Frequency Space Correlation between REITs and Capital Market Indices, Journal of Real Estate Research, 16 (3): 291-309.
Sebastian, S. and Zhu, B. (2012), Real Estate Securities – Real Estate or Equities?, EPRA Research, Brussels.
Tuluca, S. A., Myer, F. C. N. and Webb, J. R. (2000), Dynamics of Private and Public Real Estate Markets, Journal of Real Estate Finance and Economics, 21 (3): 279-296.
Wang, P., Lizieri, C. and Matysiak, G. (1997), Information asymmetry, long-run relationship and price discovery in property investment markets, The European Journal of Finance, 3 (3): 261-275.
Wilson, P. and Okunev, J. (1999), Spectral Analysis of Real Estate and Financial Assets Markets, Journal of Property Investment and Finance, 17 (1): 61-74.
Yunus, N., Hansz, J. A. and Kennedy, P. J. (2010), Dynamic Interactions Between Private and Public Real Estate Markets: Some International Evidence, Journal of Real Estate Finance and Economics, Forthcoming.