Embed Size (px)
Citation preview
GeoConvention 2014: FOCUS 1
Listening to the Rocks: Understanding Rock Fabric Heterogeneity for Hydraulic Fracturing In the Montney - Integrating Seismic Inversion with Microseismic Claudia Duenas (1), Matthew Lee (1), Thomas Davis (1), and David D’Amico (2)
(1) Colorado School of Mines (2) Talisman Energy Inc.
Summary Understanding the lateral heterogeneity of unconventional plays prior to hydraulic fracturing is important for hydrocarbon production and recovery. This study shows a consistent methodology to predict areas of better rock quality and their correlation with microseismicity following the hydraulic fracturing of two horizontal wells in Units C and D of the Montney shale in Pouce Coupe area of Alberta, Canada. Lateral and vertical heterogeneity of rock fabric was estimated using multi-attribute analysis of well logs integrated with post-stack and pre-stack inversions of a baseline multicomponent seismic survey. The two horizontal wells were monitored by two downhole arrays in nearby wells in order to record the microseismicity associated with the completions. The integration of this analysis with the production profile of the two horizontal wells in the area shows that the lithology has a major influence on the rock quality of the Montney interval. The combined interpretation of this work with an understanding of the natural fracture system and the stress state of the reservoir can provide a rock quality index (RQI). This RQI can aid in future exploration and operational development of the Montney play and other shale reservoirs worldwide.
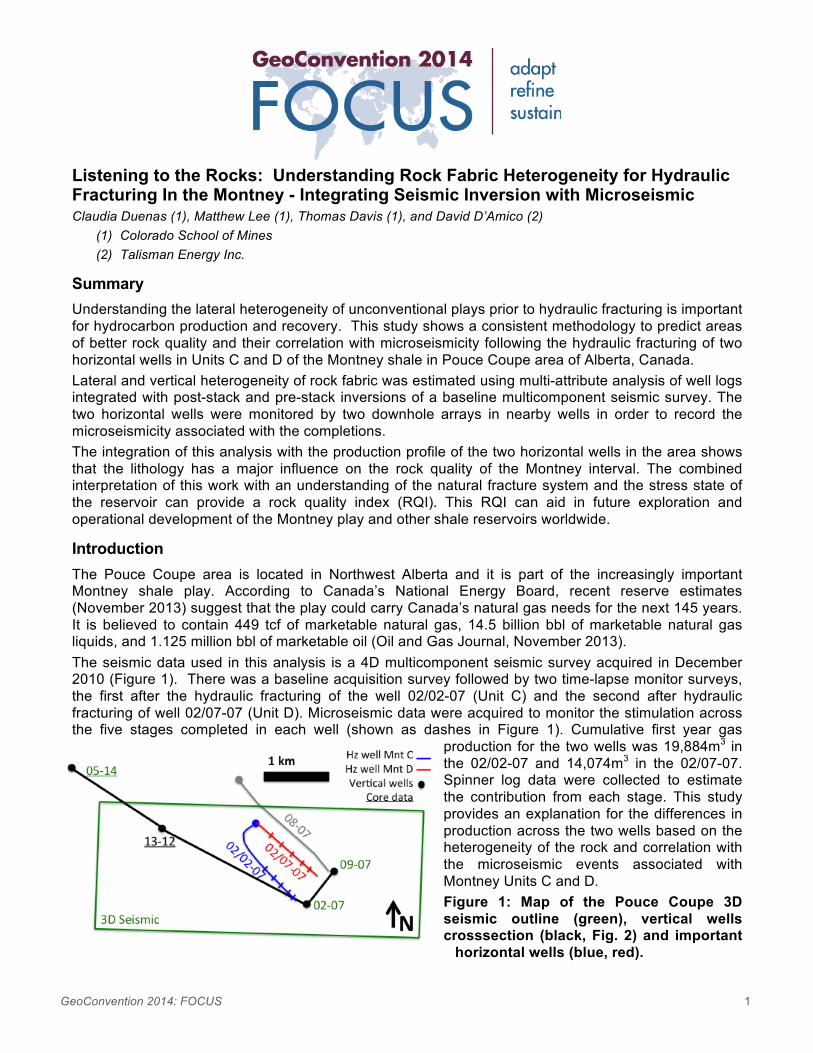
Introduction The Pouce Coupe area is located in Northwest Alberta and it is part of the increasingly important Montney shale play. According to Canada’s National Energy Board, recent reserve estimates (November 2013) suggest that the play could carry Canada’s natural gas needs for the next 145 years. It is believed to contain 449 tcf of marketable natural gas, 14.5 billion bbl of marketable natural gas liquids, and 1.125 million bbl of marketable oil (Oil and Gas Journal, November 2013). The seismic data used in this analysis is a 4D multicomponent seismic survey acquired in December 2010 (Figure 1). There was a baseline acquisition survey followed by two time-lapse monitor surveys, the first after the hydraulic fracturing of the well 02/02-07 (Unit C) and the second after hydraulic fracturing of well 02/07-07 (Unit D). Microseismic data were acquired to monitor the stimulation across the five stages completed in each well (shown as dashes in Figure 1). Cumulative first year gas
production for the two wells was 19,884m3 in the 02/02-07 and 14,074m3 in the 02/07-07. Spinner log data were collected to estimate the contribution from each stage. This study provides an explanation for the differences in production across the two wells based on the heterogeneity of the rock and correlation with the microseismic events associated with Montney Units C and D. Figure 1: Map of the Pouce Coupe 3D seismic outline (green), vertical wells crosssection (black, Fig. 2) and important
horizontal wells (blue, red).
GeoConvention 2014: FOCUS 2
Methodology The first objective is to understand the lateral and vertical heterogeneity at different scales of the rock fabric of Units C and D of the Montney Formation. The initial step in the methodology is using a cluster-analysis technique of four vertical wells in the area to define rock classes based on their fundamental attributes of texture and composition. The second step is correlating the rock classes with elastic properties extracted from a pre-stack simultaneous seismic inversion of the PP-PSTM baseline seismic survey. The baseline survey was used with the assumption that the rock is not significantly affected by production. The second objective is to correlate this lateral and vertical heterogeneity with the microseismic events recorded during the hydraulic fracturing of the two horizontal wells. Only those events located between Units C and D of the Montney were used to correlate with the results of the pre-stack seismic inversion.
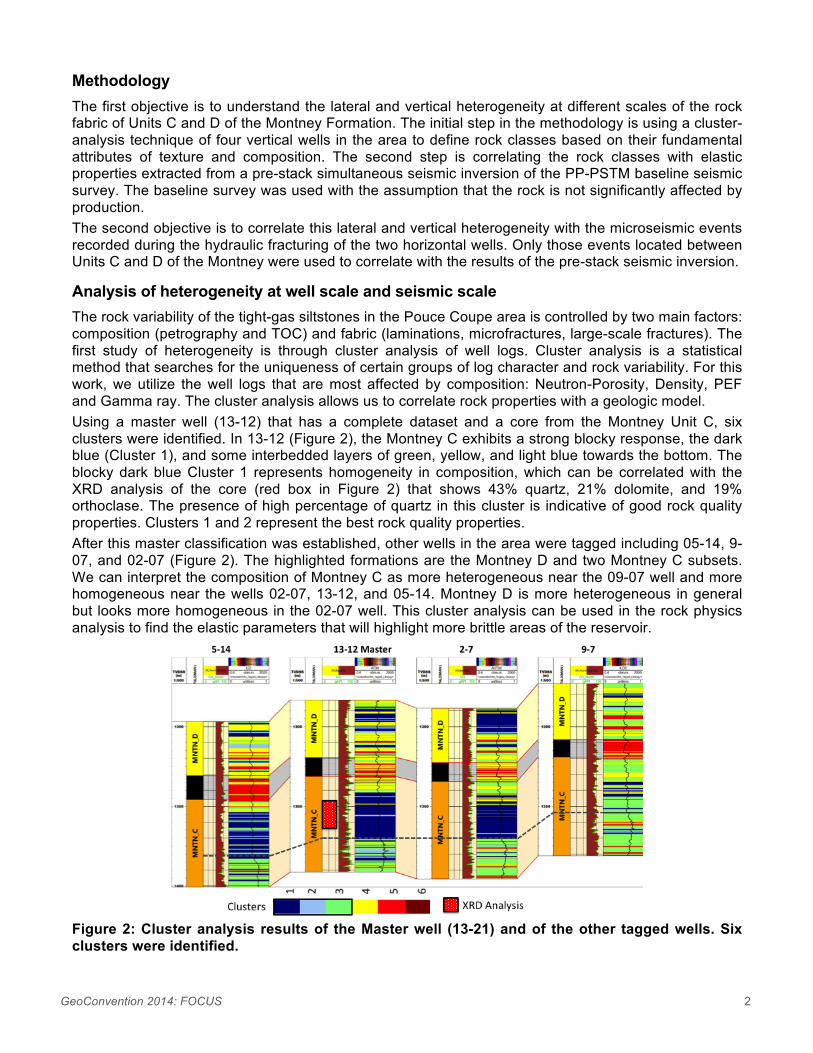
Analysis of heterogeneity at well scale and seismic scale The rock variability of the tight-gas siltstones in the Pouce Coupe area is controlled by two main factors: composition (petrography and TOC) and fabric (laminations, microfractures, large-scale fractures). The first study of heterogeneity is through cluster analysis of well logs. Cluster analysis is a statistical method that searches for the uniqueness of certain groups of log character and rock variability. For this work, we utilize the well logs that are most affected by composition: Neutron-Porosity, Density, PEF and Gamma ray. The cluster analysis allows us to correlate rock properties with a geologic model. Using a master well (13-12) that has a complete dataset and a core from the Montney Unit C, six clusters were identified. In 13-12 (Figure 2), the Montney C exhibits a strong blocky response, the dark blue (Cluster 1), and some interbedded layers of green, yellow, and light blue towards the bottom. The blocky dark blue Cluster 1 represents homogeneity in composition, which can be correlated with the XRD analysis of the core (red box in Figure 2) that shows 43% quartz, 21% dolomite, and 19% orthoclase. The presence of high percentage of quartz in this cluster is indicative of good rock quality properties. Clusters 1 and 2 represent the best rock quality properties. After this master classification was established, other wells in the area were tagged including 05-14, 9-07, and 02-07 (Figure 2). The highlighted formations are the Montney D and two Montney C subsets. We can interpret the composition of Montney C as more heterogeneous near the 09-07 well and more homogeneous near the wells 02-07, 13-12, and 05-14. Montney D is more heterogeneous in general but looks more homogeneous in the 02-07 well. This cluster analysis can be used in the rock physics analysis to find the elastic parameters that will highlight more brittle areas of the reservoir.
Figure 2: Cluster analysis results of the Master well (13-21) and of the other tagged wells. Six clusters were identified.
GeoConvention 2014: FOCUS 3
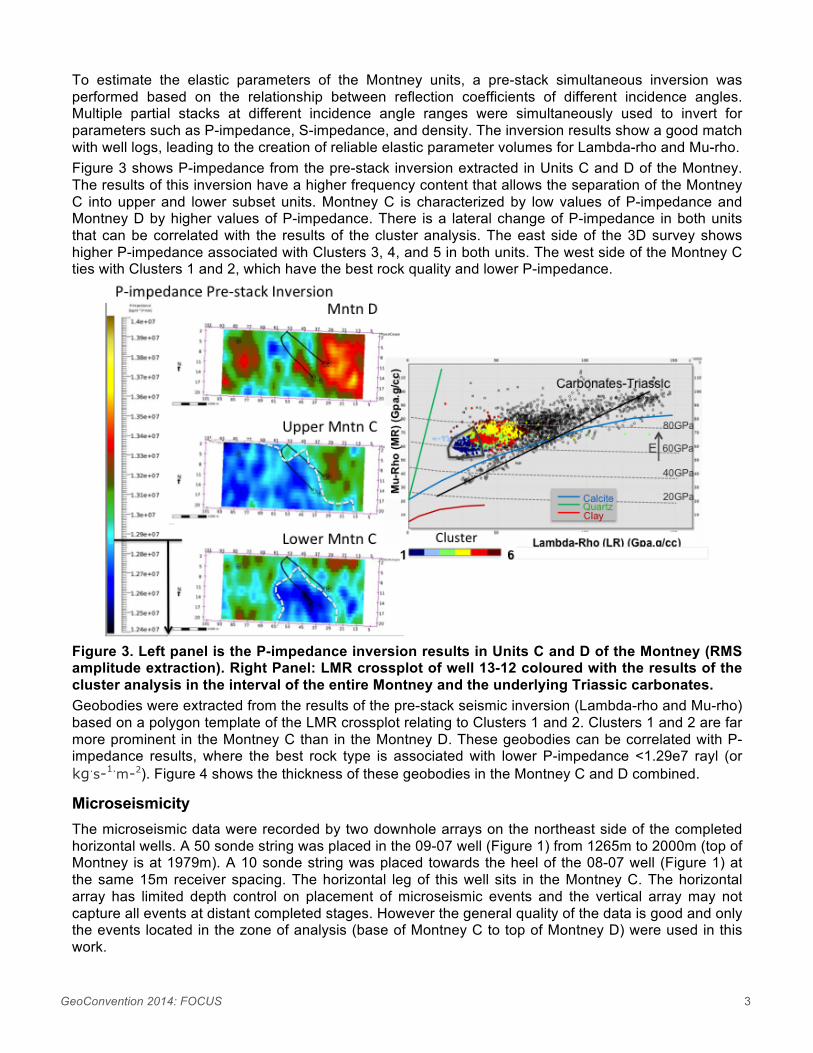
To estimate the elastic parameters of the Montney units, a pre-stack simultaneous inversion was performed based on the relationship between reflection coefficients of different incidence angles. Multiple partial stacks at different incidence angle ranges were simultaneously used to invert for parameters such as P-impedance, S-impedance, and density. The inversion results show a good match with well logs, leading to the creation of reliable elastic parameter volumes for Lambda-rho and Mu-rho. Figure 3 shows P-impedance from the pre-stack inversion extracted in Units C and D of the Montney. The results of this inversion have a higher frequency content that allows the separation of the Montney C into upper and lower subset units. Montney C is characterized by low values of P-impedance and Montney D by higher values of P-impedance. There is a lateral change of P-impedance in both units that can be correlated with the results of the cluster analysis. The east side of the 3D survey shows higher P-impedance associated with Clusters 3, 4, and 5 in both units. The west side of the Montney C ties with Clusters 1 and 2, which have the best rock quality and lower P-impedance.
Figure 3. Left panel is the P-impedance inversion results in Units C and D of the Montney (RMS amplitude extraction). Right Panel: LMR crossplot of well 13-12 coloured with the results of the cluster analysis in the interval of the entire Montney and the underlying Triassic carbonates. Geobodies were extracted from the results of the pre-stack seismic inversion (Lambda-rho and Mu-rho) based on a polygon template of the LMR crossplot relating to Clusters 1 and 2. Clusters 1 and 2 are far more prominent in the Montney C than in the Montney D. These geobodies can be correlated with P-impedance results, where the best rock type is associated with lower P-impedance <1.29e7 rayl (or kg.s-1.m-2). Figure 4 shows the thickness of these geobodies in the Montney C and D combined.
Microseismicity The microseismic data were recorded by two downhole arrays on the northeast side of the completed horizontal wells. A 50 sonde string was placed in the 09-07 well (Figure 1) from 1265m to 2000m (top of Montney is at 1979m). A 10 sonde string was placed towards the heel of the 08-07 well (Figure 1) at the same 15m receiver spacing. The horizontal leg of this well sits in the Montney C. The horizontal array has limited depth control on placement of microseismic events and the vertical array may not capture all events at distant completed stages. However the general quality of the data is good and only the events located in the zone of analysis (base of Montney C to top of Montney D) were used in this work.
GeoConvention 2014: FOCUS 4
Integration
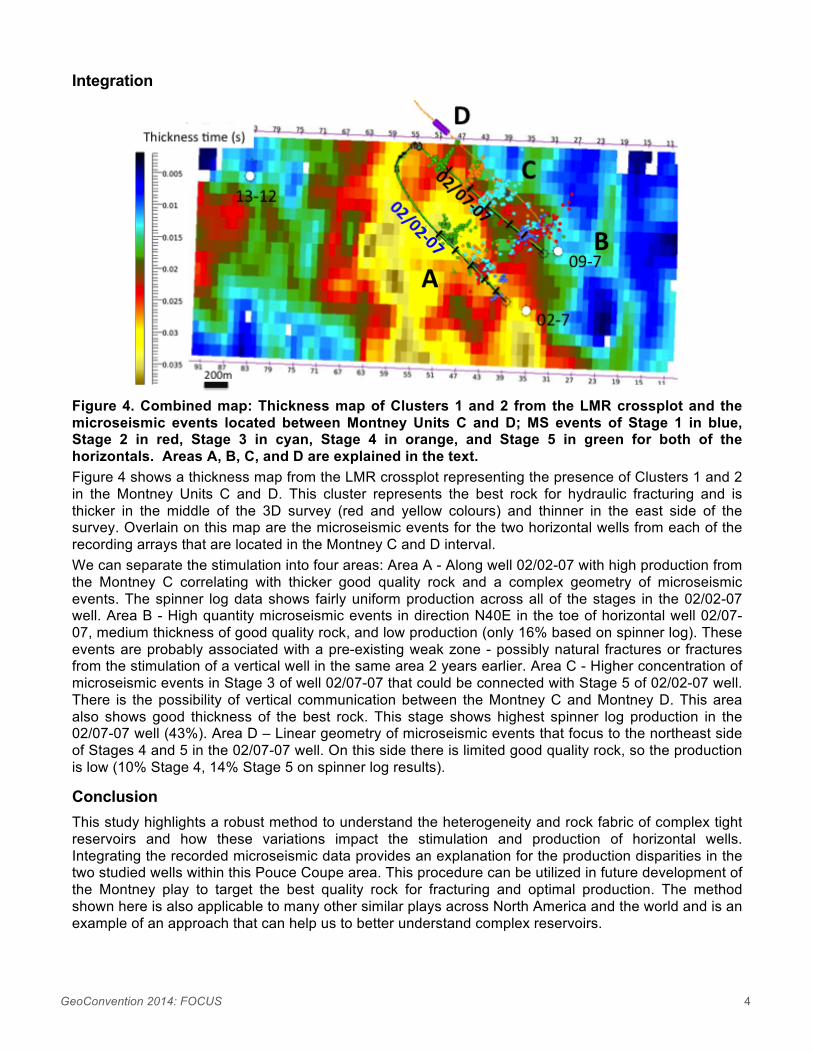
Figure 4. Combined map: Thickness map of Clusters 1 and 2 from the LMR crossplot and the microseismic events located between Montney Units C and D; MS events of Stage 1 in blue, Stage 2 in red, Stage 3 in cyan, Stage 4 in orange, and Stage 5 in green for both of the horizontals. Areas A, B, C, and D are explained in the text. Figure 4 shows a thickness map from the LMR crossplot representing the presence of Clusters 1 and 2 in the Montney Units C and D. This cluster represents the best rock for hydraulic fracturing and is thicker in the middle of the 3D survey (red and yellow colours) and thinner in the east side of the survey. Overlain on this map are the microseismic events for the two horizontal wells from each of the recording arrays that are located in the Montney C and D interval. We can separate the stimulation into four areas: Area A - Along well 02/02-07 with high production from the Montney C correlating with thicker good quality rock and a complex geometry of microseismic events. The spinner log data shows fairly uniform production across all of the stages in the 02/02-07 well. Area B - High quantity microseismic events in direction N40E in the toe of horizontal well 02/07-07, medium thickness of good quality rock, and low production (only 16% based on spinner log). These events are probably associated with a pre-existing weak zone - possibly natural fractures or fractures from the stimulation of a vertical well in the same area 2 years earlier. Area C - Higher concentration of microseismic events in Stage 3 of well 02/07-07 that could be connected with Stage 5 of 02/02-07 well. There is the possibility of vertical communication between the Montney C and Montney D. This area also shows good thickness of the best rock. This stage shows highest spinner log production in the 02/07-07 well (43%). Area D – Linear geometry of microseismic events that focus to the northeast side of Stages 4 and 5 in the 02/07-07 well. On this side there is limited good quality rock, so the production is low (10% Stage 4, 14% Stage 5 on spinner log results).
Conclusion This study highlights a robust method to understand the heterogeneity and rock fabric of complex tight reservoirs and how these variations impact the stimulation and production of horizontal wells. Integrating the recorded microseismic data provides an explanation for the production disparities in the two studied wells within this Pouce Coupe area. This procedure can be utilized in future development of the Montney play to target the best quality rock for fracturing and optimal production. The method shown here is also applicable to many other similar plays across North America and the world and is an example of an approach that can help us to better understand complex reservoirs.
GeoConvention 2014: FOCUS 5
Acknowledgements The authors would like to acknowledge Talisman Energy, RCP, Jason, Schlumberger, Transform and Pinnacle for the data and software support in the development of this project.
References Andersen, E., Davey,H.,Steinhoff,C. and Davis,T. 2013. Investigating the relationship between microseismic events and geomechanical variations in the Montney Shale reservoir-a case study. First break, Volume 31, February 2013 Atkinson, J. 2010. Multicomponent time-lapse monitoring of two hydraulic fracture stimulations in an un- conventional reservoir, Pouce Coupe field, Canada. MS Thesis, Colorado School of Mines Davey, H. 2012. Geomechanical characterization of the Montney Shale northwest Alberta and northeast British Columbia, Canada. MS Thesis, Colorado School of Mines Derder, O. 2012. Characterizing reservoir properties for the lower Triassic Montney formation (Units C and D) based on petrophysical methods. MS Thesis. University of Calgary Goodway, B., Perez, M., Varsek, J. and Abaco, C. 2010. Seismic petrophysicis and isotropic anisotropic AVO methods for unconventional gas exploration. The leading Edge, December 2010, pp. 1500-1508 Steinhoff, C. 2013. Multicomponent seismic monitoring of the effective stimulated volume associated with hydraulic fracture stimulations in a shale reservoir, Pouce Coupe field, Alberta, Canada. MS Thesis, Colorado School of Mines Suarez, R. 2012. Improving geologic core descriptions and heterogeneous rock characterization via continuous profiles of core properties. SPWLA 53rd Annual Logging Symposium. June 16-20, 2012