Embed Size (px)
Citation preview
Literacy and Poverty in Greater Cleveland
Kristen Mikelbank & Claudia CoultonCenter on Urban Poverty and Community Development
Mandel School of Applied Social SciencesCase Western Reserve University
The Literacy Cooperative Instructors Learning Network Launch
May 11, 2007
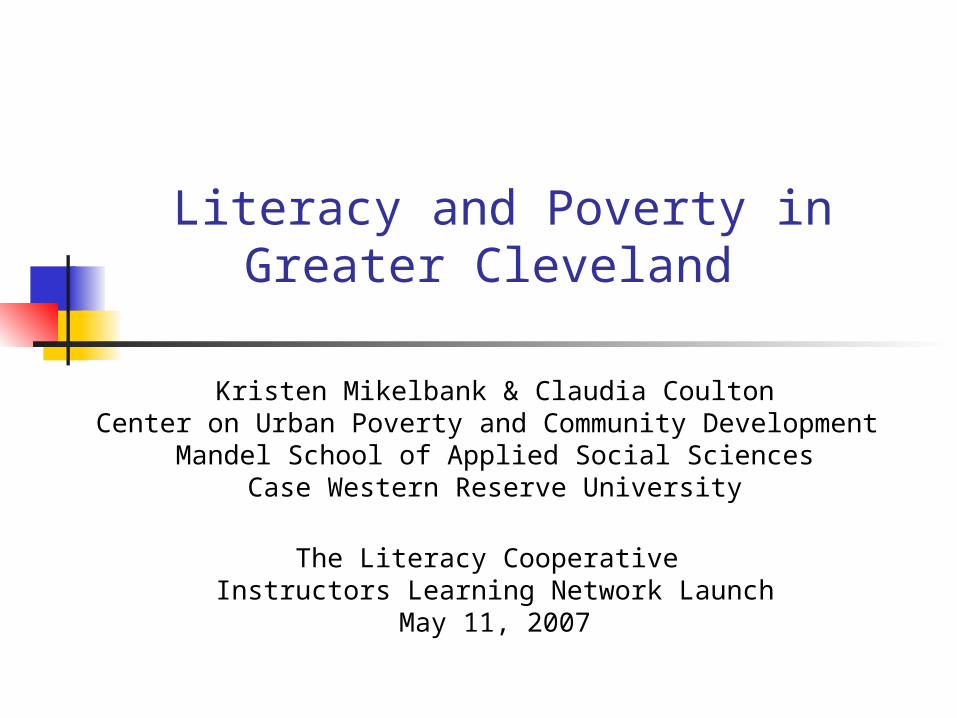
Outline
Poverty Overview Definitions & Rankings Investment Framework
Literacy Overview Summary of Findings How it fits into the investment
framework
Prepared by: Center on Urban Poverty and Community Development

Definition of Poverty
How the Census Bureau measures poverty:• Family income• Number of persons in family• Ages of family members
In 2005, a family of four with an income of less than $19,350 was considered poor.
In 2007, a family of four with an income of less than $20,650 is considered poor.
Prepared by: Center on Urban Poverty and Community Development
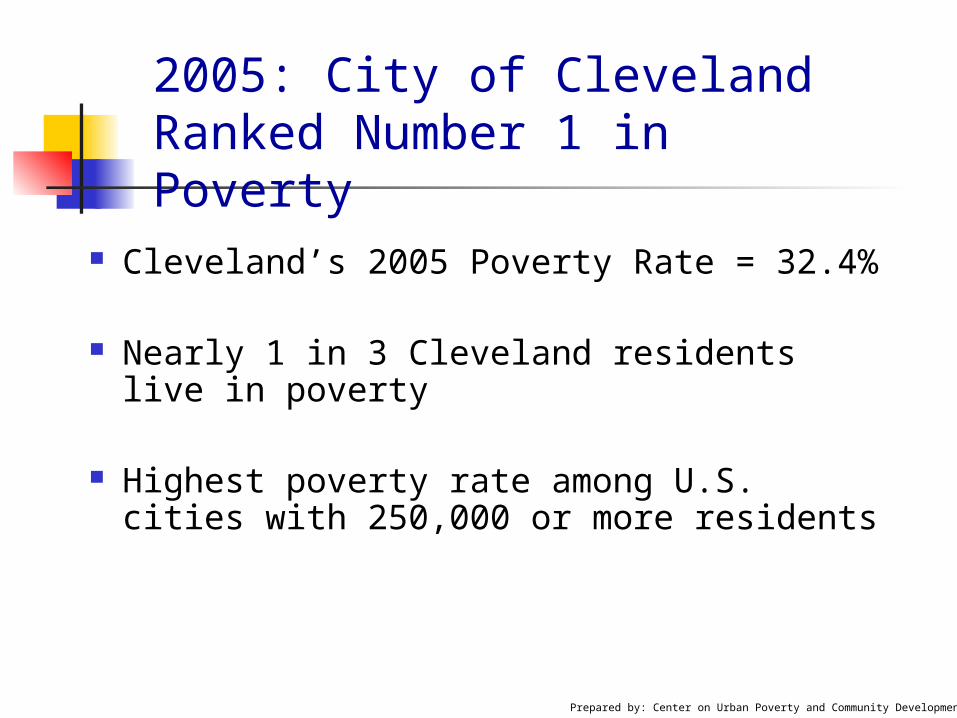
2005: City of Cleveland Ranked Number 1 in Poverty
Cleveland’s 2005 Poverty Rate = 32.4%
Nearly 1 in 3 Cleveland residents live in poverty
Highest poverty rate among U.S. cities with 250,000 or more residents
Prepared by: Center on Urban Poverty and Community Development
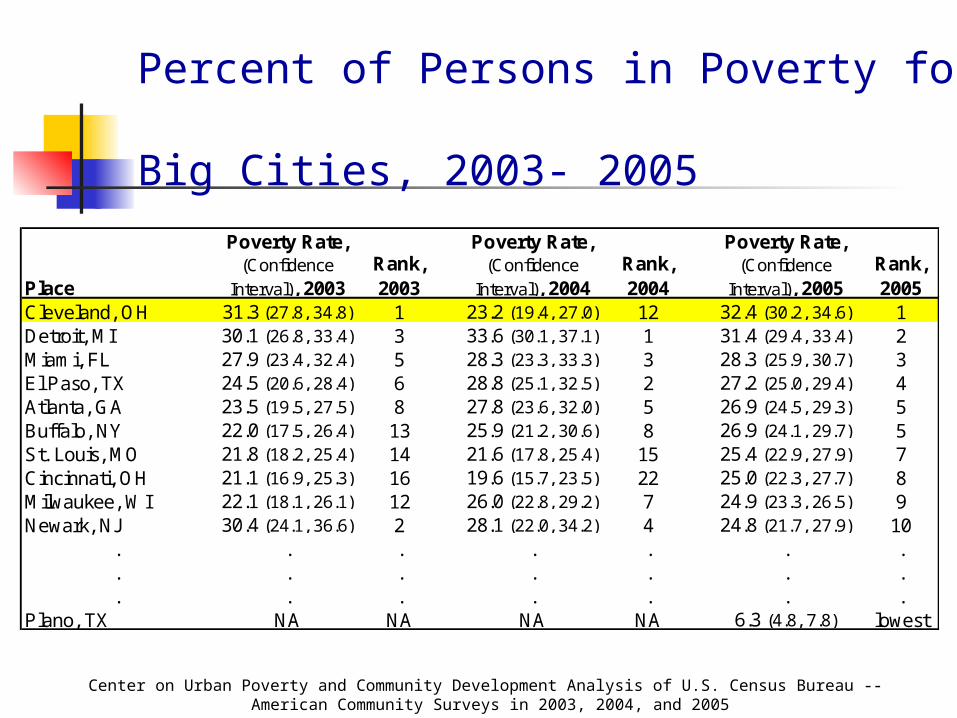
Percent of Persons in Poverty for Big Cities, 2003- 2005
Center on Urban Poverty and Community Development Analysis of U.S. Census Bureau -- American Community Surveys in 2003, 2004, and 2005
Place
Poverty Rate, (Confidence
Interval), 2003Rank, 2003
Poverty Rate, (Confidence
Interval), 2004Rank, 2004
Poverty Rate, (Confidence
Interval), 2005Rank, 2005
Cleveland, OH 31.3 (27.8, 34.8) 1 23.2 (19.4, 27.0) 12 32.4 (30.2, 34.6) 1Detroit, MI 30.1 (26.8, 33.4) 3 33.6 (30.1, 37.1) 1 31.4 (29.4, 33.4) 2Miami, FL 27.9 (23.4, 32.4) 5 28.3 (23.3, 33.3) 3 28.3 (25.9, 30.7) 3El Paso, TX 24.5 (20.6, 28.4) 6 28.8 (25.1, 32.5) 2 27.2 (25.0, 29.4) 4Atlanta, GA 23.5 (19.5, 27.5) 8 27.8 (23.6, 32.0) 5 26.9 (24.5, 29.3) 5Buffalo, NY 22.0 (17.5, 26.4) 13 25.9 (21.2, 30.6) 8 26.9 (24.1, 29.7) 5St. Louis, MO 21.8 (18.2, 25.4) 14 21.6 (17.8, 25.4) 15 25.4 (22.9, 27.9) 7Cincinnati, OH 21.1 (16.9, 25.3) 16 19.6 (15.7, 23.5) 22 25.0 (22.3, 27.7) 8Milwaukee, WI 22.1 (18.1, 26.1) 12 26.0 (22.8, 29.2) 7 24.9 (23.3, 26.5) 9Newark, NJ 30.4 (24.1, 36.6) 2 28.1 (22.0, 34.2) 4 24.8 (21.7, 27.9) 10
. . . . . . .
. . . . . . .
. . . . . . .Plano, TX NA NA NA NA 6.3 (4.8, 7.8) lowest
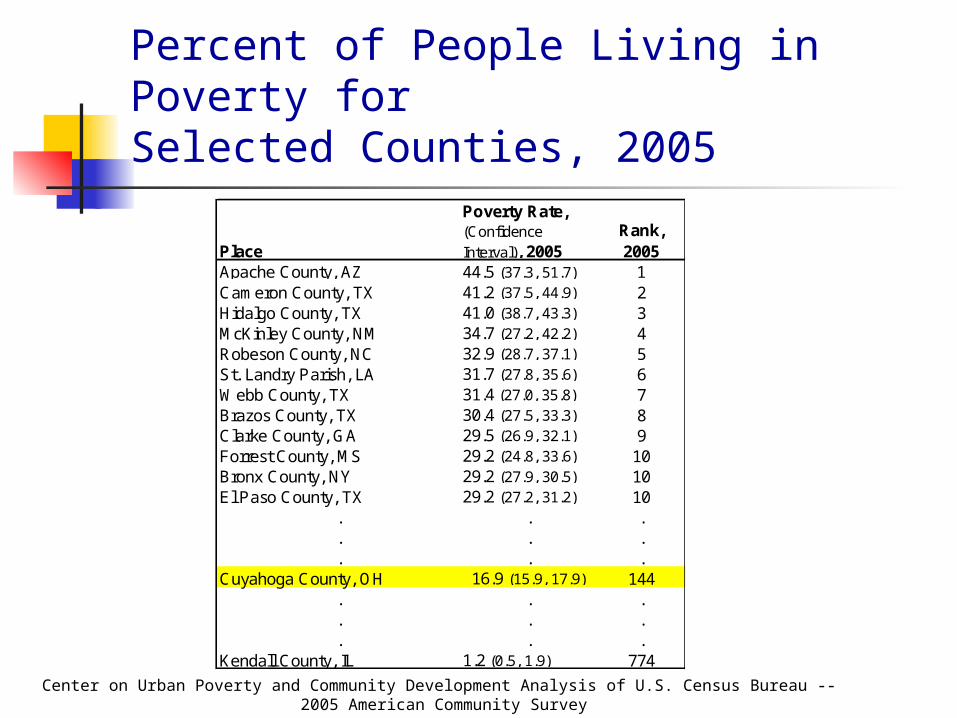
Percent of People Living in Poverty for Selected Counties, 2005
Place
Poverty Rate, (Confidence
Interval), 2005Rank, 2005
Apache County, AZ 44.5 (37.3, 51.7) 1Cameron County, TX 41.2 (37.5, 44.9) 2Hidalgo County, TX 41.0 (38.7, 43.3) 3McKinley County, NM 34.7 (27.2, 42.2) 4Robeson County, NC 32.9 (28.7, 37.1) 5St. Landry Parish, LA 31.7 (27.8, 35.6) 6Webb County, TX 31.4 (27.0, 35.8) 7Brazos County, TX 30.4 (27.5, 33.3) 8Clarke County, GA 29.5 (26.9, 32.1) 9Forrest County, MS 29.2 (24.8, 33.6) 10Bronx County, NY 29.2 (27.9, 30.5) 10El Paso County, TX 29.2 (27.2, 31.2) 10
. . .
. . .
. . .Cuyahoga County, OH 16.9 (15.9, 17.9) 144
. . .
. . .
. . .Kendall County, IL 1.2 (0.5, 1.9) 774
Center on Urban Poverty and Community Development Analysis of U.S. Census Bureau -- 2005 American Community Survey
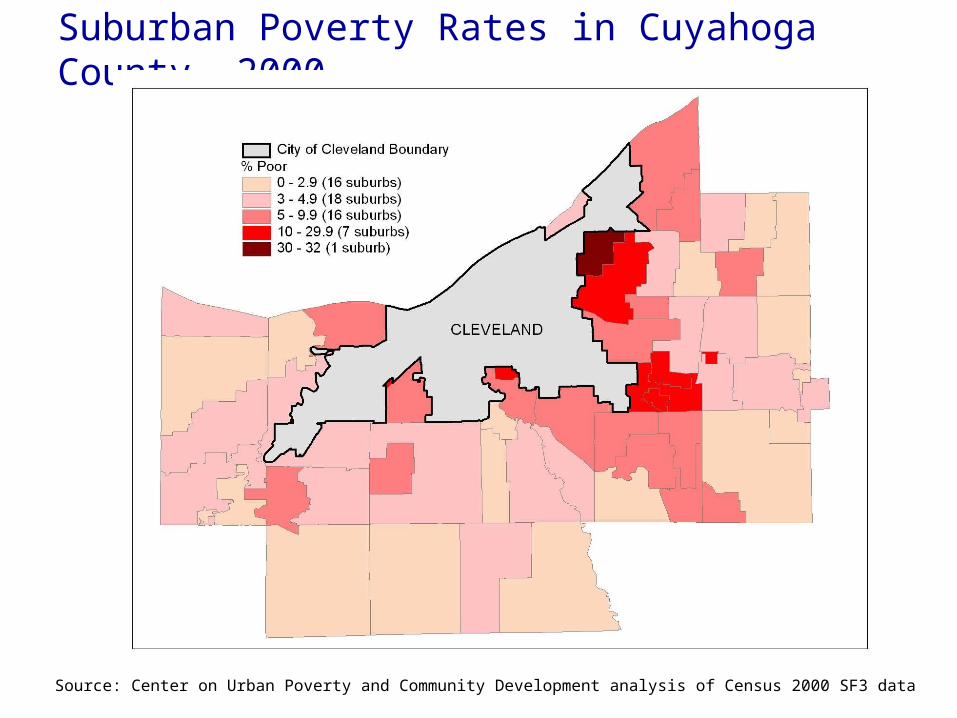
Suburban Poverty Rates in Cuyahoga County, 2000
Source: Center on Urban Poverty and Community Development analysis of Census 2000 SF3 data

Poverty: An Investment Framework
SocialCapital
EconomicOpportunity
HumanCapital
Prepared by: Center on Urban Poverty and Community Development

Human Capital: Being Able to Compete
in Today’s Economy
SocialCapital
EconomicOpportunity
HumanCapital
Cognitive development
Skills
Soc
ial s
kills
New jobs require complex thinking and behavioral qualifications
Development of these capacities starts early
Prepared by: Center on Urban Poverty and Community Development
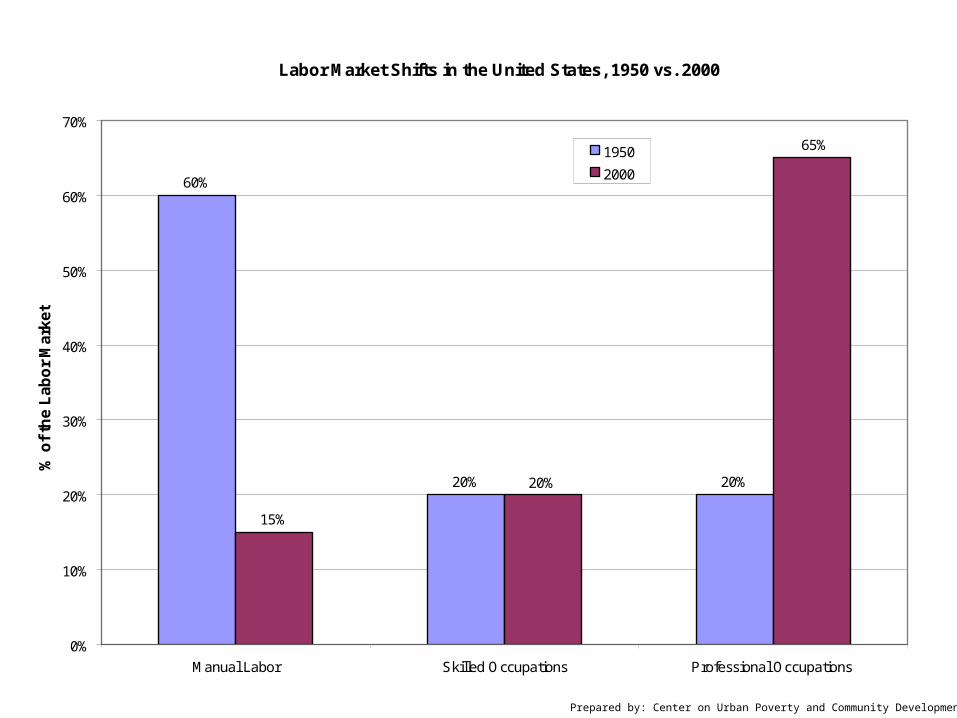
Labor Market Shifts in the United States, 1950 vs. 2000
60%
20% 20%
15%
20%
65%
0%
10%
20%
30%
40%
50%
60%
70%
Manual Labor Skilled Occupations Professional Occupations
% o
f th
e L
ab
or
Ma
rke
t
1950
2000
Prepared by: Center on Urban Poverty and Community Development
Literacy Defined
“…an individual's ability to read, write, speak in English, compute and solve problems at levels of proficiency necessary to function on the job, in the family of the individual, and in society.”
-- Workforce Investment Act of 1998, U.S. Congress
Prepared by: Center on Urban Poverty and Community Development

Levels of Literacy
Level 1 Locate the expiration date on a driver’s license
Level 2 Locate an intersection on a street map
Level 3 Use a bus schedule to choose the correct bus to take to get
to work on time Level 4
Explain the difference between two types of benefits at work Level 5
Compare and summarize different approaches lawyers use during a trial
Prepared by: Center on Urban Poverty and Community Development
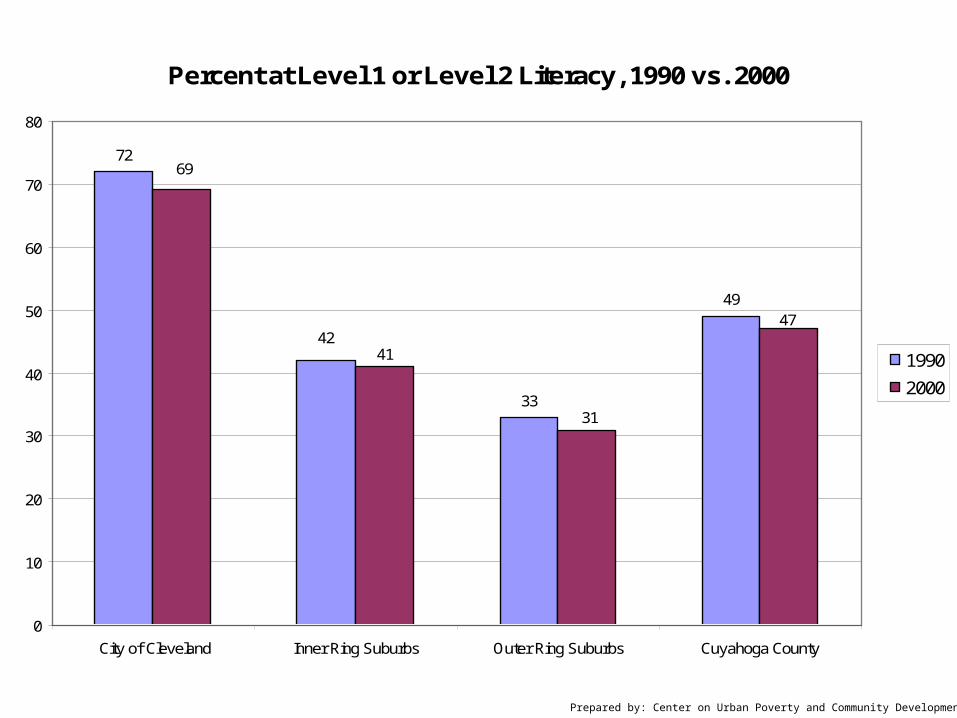
Percent at Level 1 or Level 2 Literacy, 1990 vs. 2000
72
33
49
4241
47
31
69
0
10
20
30
40
50
60
70
80
City of Cleveland Inner Ring Suburbs Outer Ring Suburbs Cuyahoga County
1990
2000
Prepared by: Center on Urban Poverty and Community Development
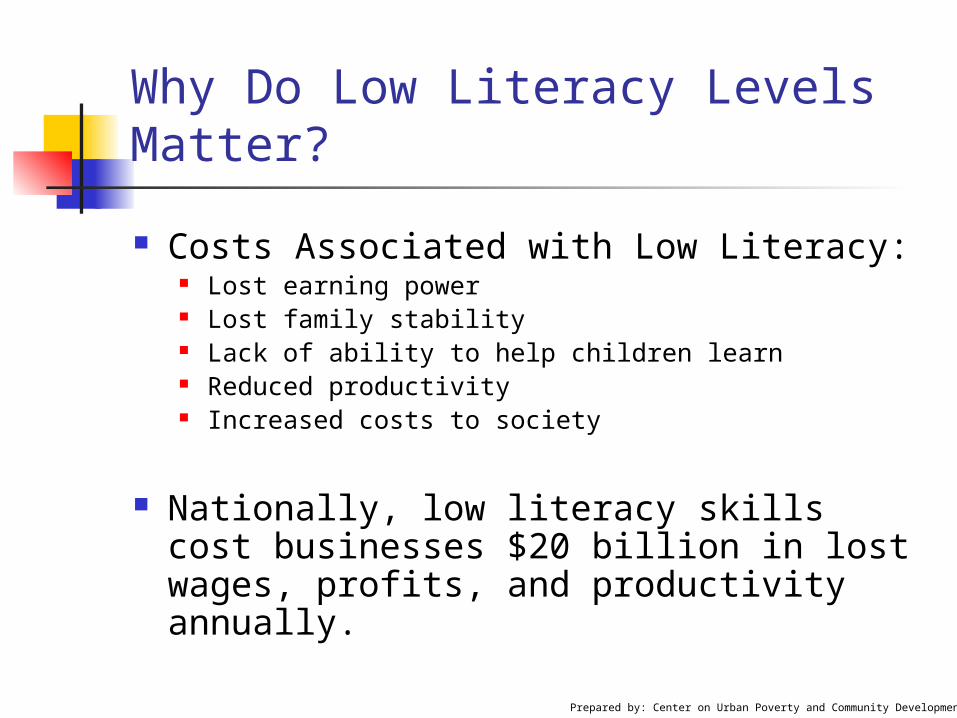
Costs Associated with Low Literacy: Lost earning power Lost family stability Lack of ability to help children learn Reduced productivity Increased costs to society
Nationally, low literacy skills cost
businesses $20 billion in lost wages, profits, and productivity annually.
Why Do Low Literacy Levels Matter?
Prepared by: Center on Urban Poverty and Community Development

Literacy Factors: Early Childhood Population
Mother’s Educational Attainment Cuyahoga County, 1998 – 2002:
16,593 babies born, or 18% of the births, were to mothers with less than a high school degree
Children Living in Poverty Cuyahoga County, 2005:
28% of children under age 5 and their families live in poverty
Prepared by: Center on Urban Poverty and Community Development

Literacy Factors: School-Age Children
Passage rate for 4th grade reading proficiency by school building, 2003-2004 school year: 119 out of 193 Cuyahoga County
public schools not meeting state requirement of 75% for 4th grade reading proficiency
72 of 119 are in the Cleveland Municipal School District.
Prepared by: Center on Urban Poverty and Community Development

Percent of People Aged 25 and Older Who Have Completed High School for Selected Places,2003 - 2005
Place
Percent (Confidence Interval), 2003
Rank, 2003
Percent (Confidence Interval), 2004
Rank, 2004
Percent (Confidence Interval), 2005
Rank, 2005
Seattle, WA 93.4 (92.2, 94.7) 1 89.9 (87.8, 92.0) 5 91.9 (90.7, 93.1) 3Virginia Beach, VA 92.7 (91.3, 94.1) 2 92.7 (90.8, 94.6) 1 92.5 (91.7, 93.3) 1Colorado Springs, CO 92.1 (90.1, 94.1) 3 90.7 (88.7, 92.7) 4 92.0 (90.9, 93.1) 2Anchorage, AK 90.9 (89.5, 92.3) 4 91.9 (91.0, 92.8) 2 91.7 (90.5, 92.9) 4Raleigh, NC 90.9 (88.7, 93.2) 4 91.4 (89.4, 93.4) 3 90.7 (89.5, 91.9) 5
. . . . . . .
. . . . . . .Long Beach, CA 73.7 (70.1, 77.4) 59 74.8 (71.1, 78.5) 60 75.9 (74.0, 77.9) 58Cleveland, OH 73.3 (71.0, 75.6) 60 76.5 (73.0, 80.0) 55 74.2 (72.8, 75.6) 60Houston, TX 72.9 (71.5, 74.4) 61 71.8 (70.6, 73.0) 64 72.2 (71.4, 73.0) 61Dallas, TX 72.0 (70.1, 73.8) 62 70.5 (68.6, 72.4) 65 71.1 (69.9, 72.3) 64Los Angeles, CA 71.1 (69.9, 72.4) 63 70.1 (68.8, 71.4) 67 72.0 (71.3, 72.7) 62
. . . . . . .
. . . . . . .Santa Ana, CA 49.4 (43.9, 54.9) 70 of 70 51.4 (45.6, 57.2) 70 of 70 50.1 (47.4, 52.8) 70 of 70
Center on Urban Poverty and Community Development Analysis of U.S. Census Bureau -- American Community Surveys in 2003, 2004, and 2005
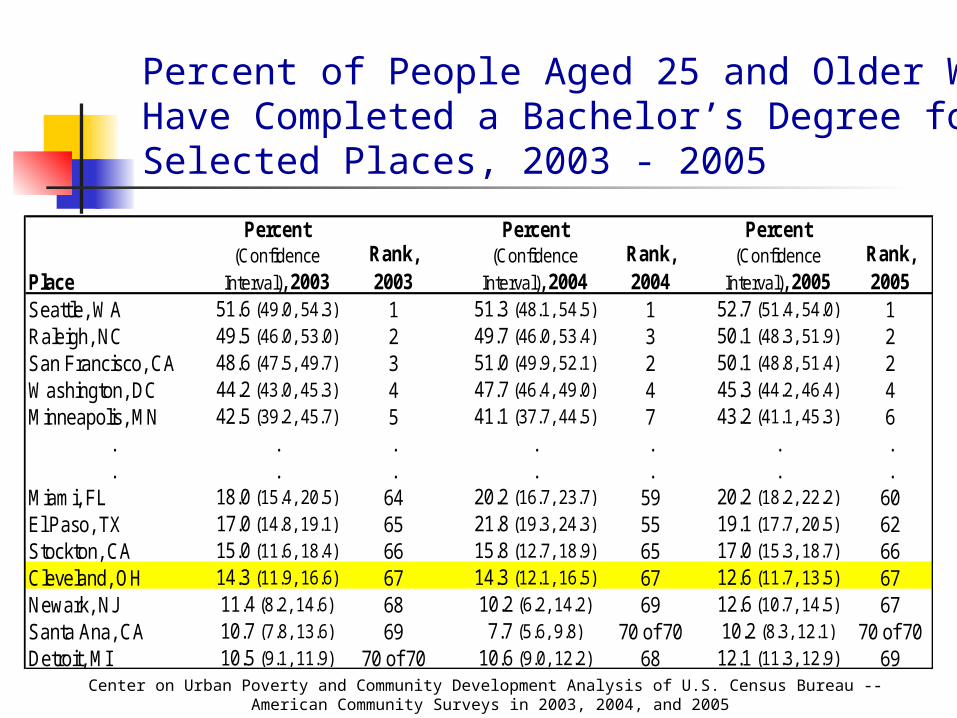
Percent of People Aged 25 and Older Who Have Completed a Bachelor’s Degree for Selected Places, 2003 - 2005
Place
Percent (Confidence
Interval), 2003Rank, 2003
Percent (Confidence
Interval), 2004Rank, 2004
Percent (Confidence
Interval), 2005Rank, 2005
Seattle, WA 51.6 (49.0, 54.3) 1 51.3 (48.1, 54.5) 1 52.7 (51.4, 54.0) 1Raleigh, NC 49.5 (46.0, 53.0) 2 49.7 (46.0, 53.4) 3 50.1 (48.3, 51.9) 2San Francisco, CA 48.6 (47.5, 49.7) 3 51.0 (49.9, 52.1) 2 50.1 (48.8, 51.4) 2Washington, DC 44.2 (43.0, 45.3) 4 47.7 (46.4, 49.0) 4 45.3 (44.2, 46.4) 4Minneapolis, MN 42.5 (39.2, 45.7) 5 41.1 (37.7, 44.5) 7 43.2 (41.1, 45.3) 6
. . . . . . .
. . . . . . .Miami, FL 18.0 (15.4, 20.5) 64 20.2 (16.7, 23.7) 59 20.2 (18.2, 22.2) 60El Paso, TX 17.0 (14.8, 19.1) 65 21.8 (19.3, 24.3) 55 19.1 (17.7, 20.5) 62Stockton, CA 15.0 (11.6, 18.4) 66 15.8 (12.7, 18.9) 65 17.0 (15.3, 18.7) 66Cleveland, OH 14.3 (11.9, 16.6) 67 14.3 (12.1, 16.5) 67 12.6 (11.7, 13.5) 67Newark, NJ 11.4 (8.2, 14.6) 68 10.2 (6.2, 14.2) 69 12.6 (10.7, 14.5) 67Santa Ana, CA 10.7 (7.8, 13.6) 69 7.7 (5.6, 9.8) 70 of 70 10.2 (8.3, 12.1) 70 of 70Detroit, MI 10.5 (9.1, 11.9) 70 of 70 10.6 (9.0, 12.2) 68 12.1 (11.3, 12.9) 69
Center on Urban Poverty and Community Development Analysis of U.S. Census Bureau -- American Community Surveys in 2003, 2004, and 2005
Ways to Invest in Human Capital
Healthy births and newborn home visits to reach families early
Early Childhood Programs for at-risk children pay off ten fold Quality child care Home visiting and parent programs from
birth to three Universal preschool of high quality
Prepared by: Center on Urban Poverty and Community Development
Adult job education and training can raise employment rates
Attract and retain educated workers and invest in their continued development
Ways to Invest in Human Capital, cont.
Prepared by: Center on Urban Poverty and Community Development
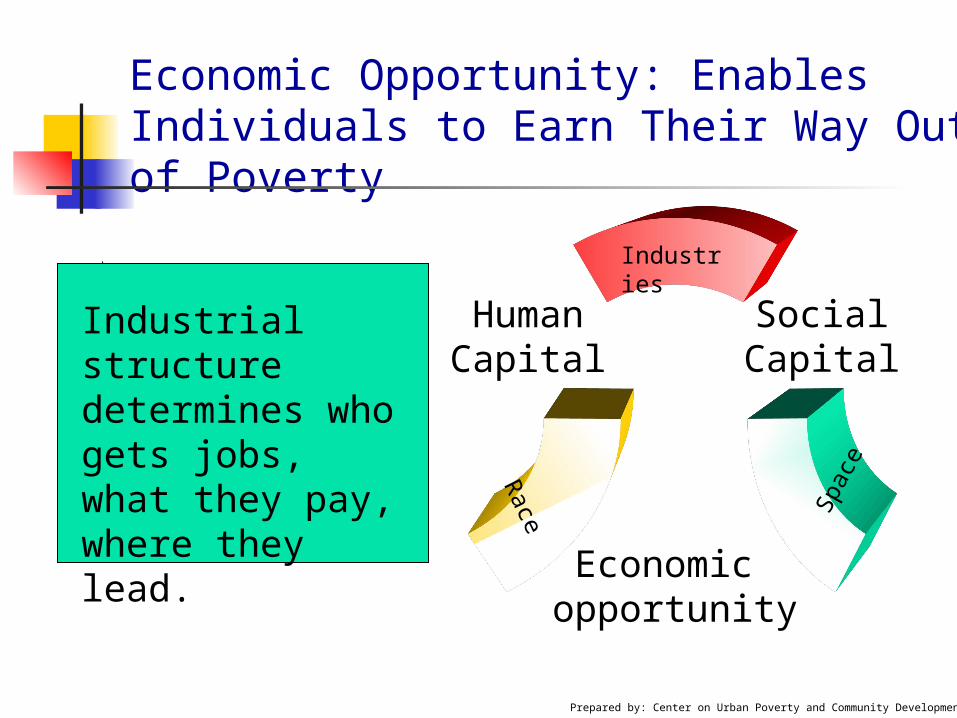
Economic Opportunity: Enables Individuals to Earn Their Way Out of Poverty
SocialCapital
Economic opportunity
HumanCapital
Industries
Race
S
pace
Industrial structure determines who gets jobs, what they pay, where they lead.
Prepared by: Center on Urban Poverty and Community Development
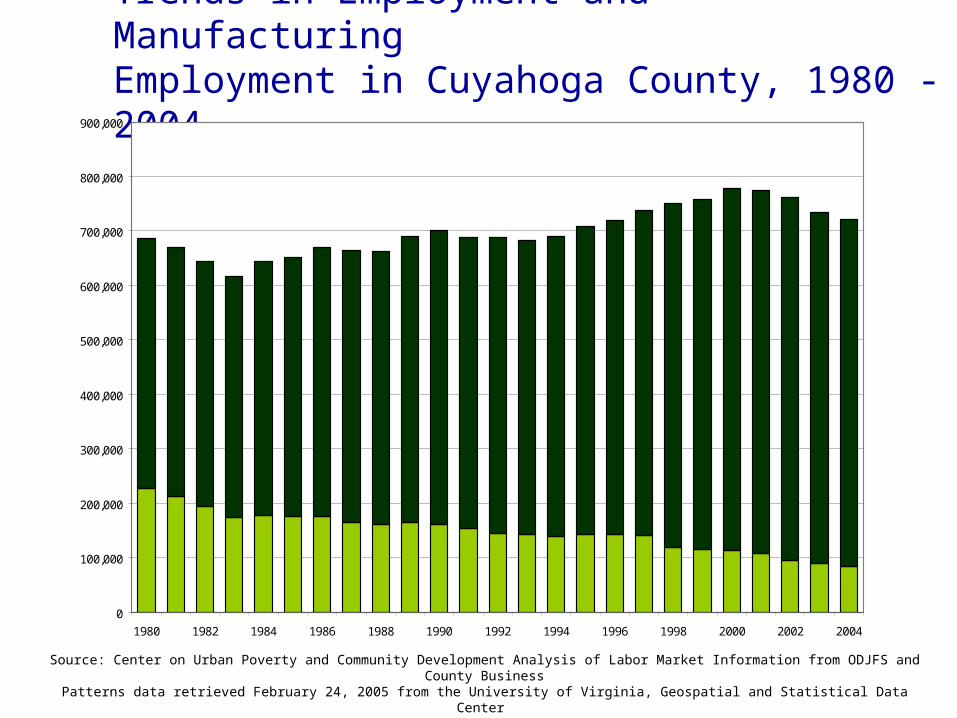
Trends in Employment and Manufacturing Employment in Cuyahoga County, 1980 - 2004
0
100,000
200,000
300,000
400,000
500,000
600,000
700,000
800,000
900,000
1980 1982 1984 1986 1988 1990 1992 1994 1996 1998 2000 2002 2004
Source: Center on Urban Poverty and Community Development Analysis of Labor Market Information from ODJFS and County BusinessPatterns data retrieved February 24, 2005 from the University of Virginia, Geospatial and Statistical Data Center
http://fisher.lib.virginia.edu/collections/stats/cbp/
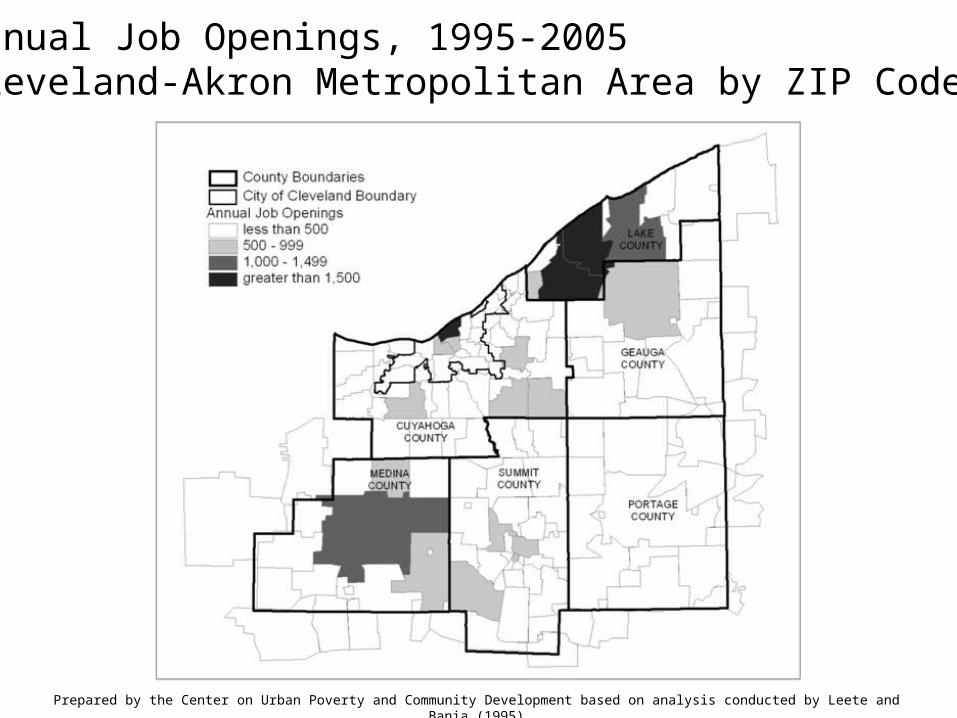
Prepared by the Center on Urban Poverty and Community Development based on analysis conducted by Leete and Bania (1995)
Annual Job Openings, 1995-2005Cleveland-Akron Metropolitan Area by ZIP Code
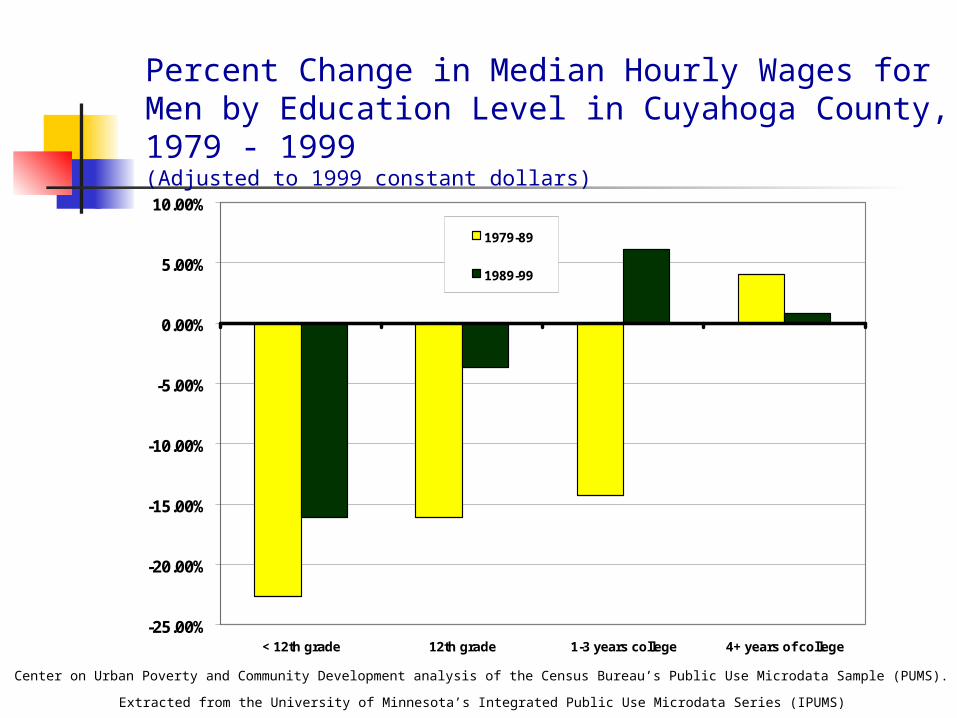
Percent Change in Median Hourly Wages for Men by Education Level in Cuyahoga County, 1979 - 1999(Adjusted to 1999 constant dollars)
Center on Urban Poverty and Community Development analysis of the Census Bureau’s Public Use Microdata Sample (PUMS).
Extracted from the University of Minnesota’s Integrated Public Use Microdata Series (IPUMS)
-25.00%
-20.00%
-15.00%
-10.00%
-5.00%
0.00%
5.00%
10.00%
< 12th grade 12th grade 1-3 years college 4+ years of college
1979-89
1989-99
Ways to Invest in Economic Opportunities
Inclusionary housing development allows lower skill workers to live near jobs
Regional economic development reduces non productive competition, promotes winners
Bridges to work programs overcome spatial and racial divide
Prepared by: Center on Urban Poverty and Community Development

Social Capital: Enables Individuals and Communities to Reach Goals
SocialCapital
Economicopportunity
HumanCapital
Networks
Trust
Nor
ms
Poverty undermines social capital,
especially in high concentrations
Prepared by: Center on Urban Poverty and Community Development
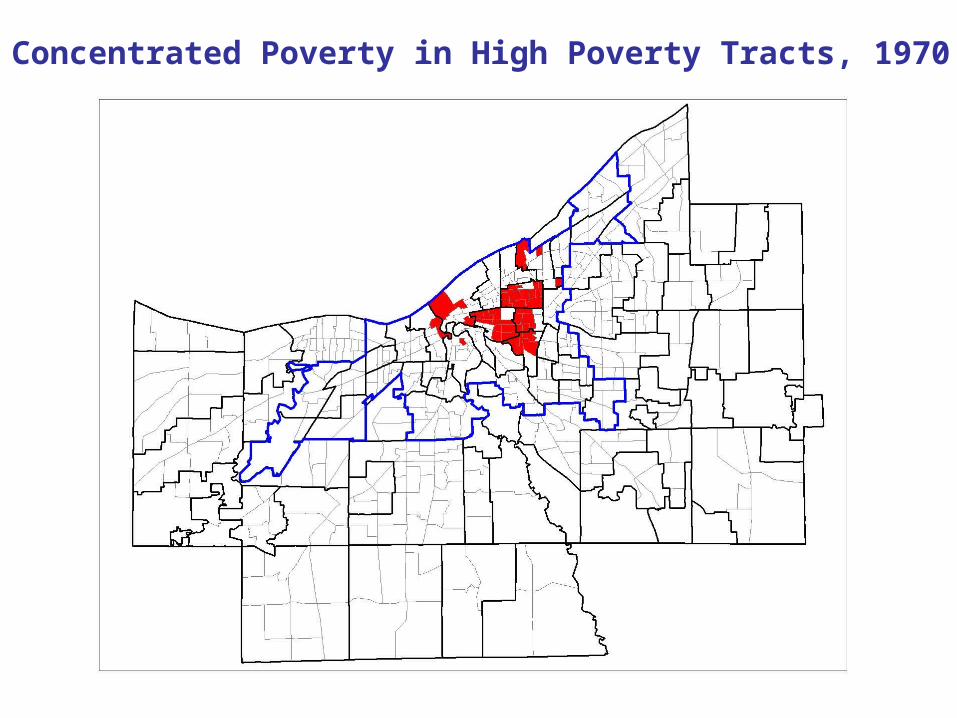
Concentrated Poverty in High Poverty Tracts, 1970
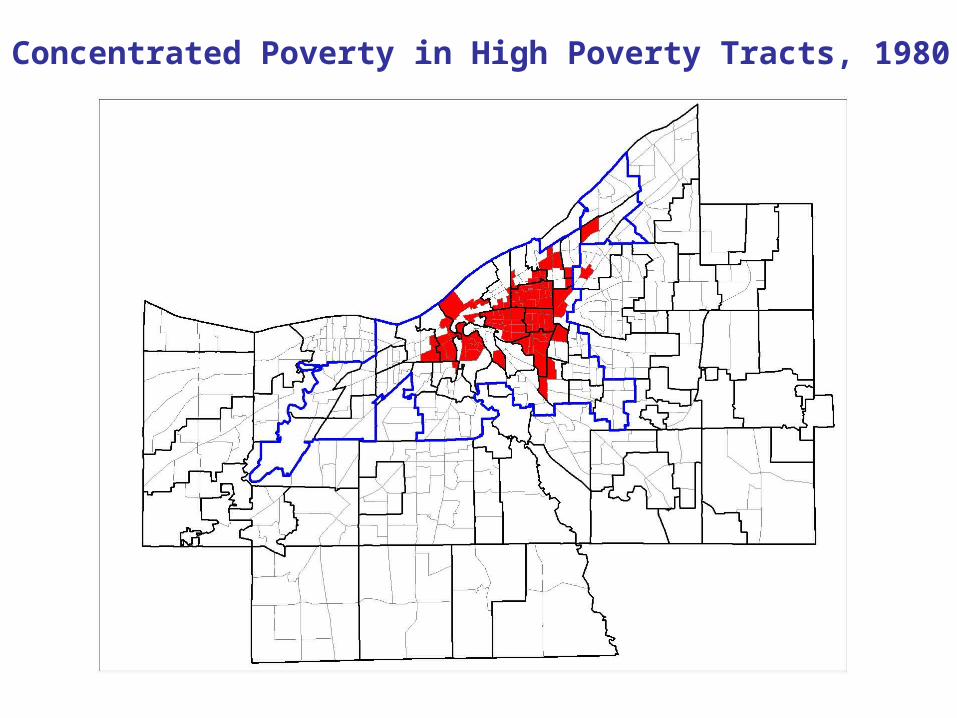
Concentrated Poverty in High Poverty Tracts, 1980
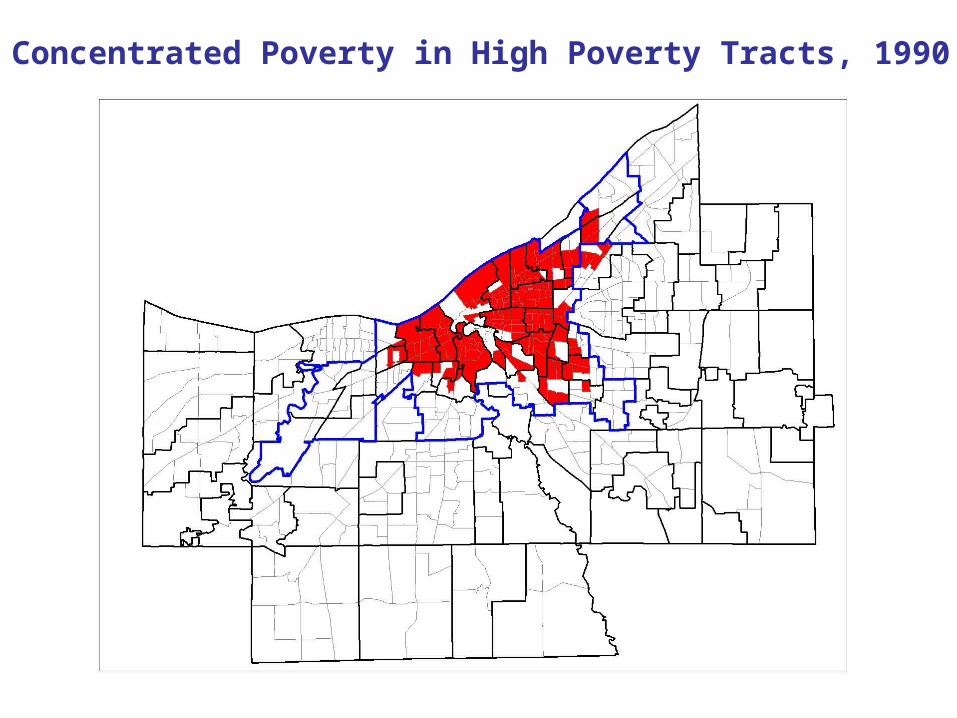
Concentrated Poverty in High Poverty Tracts, 1990
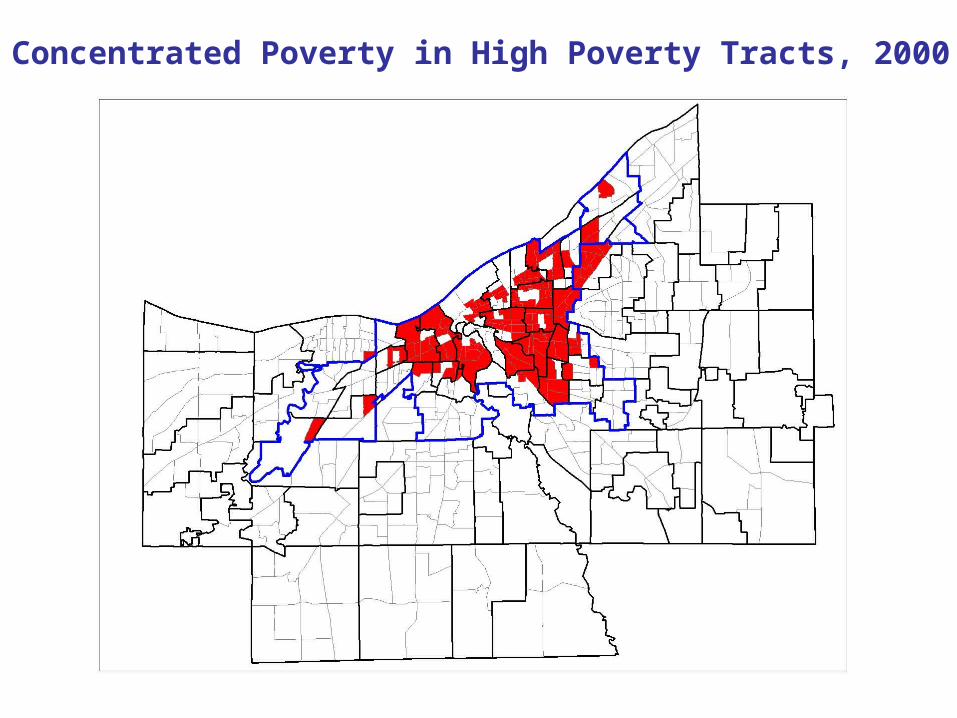
Concentrated Poverty in High Poverty Tracts, 2000
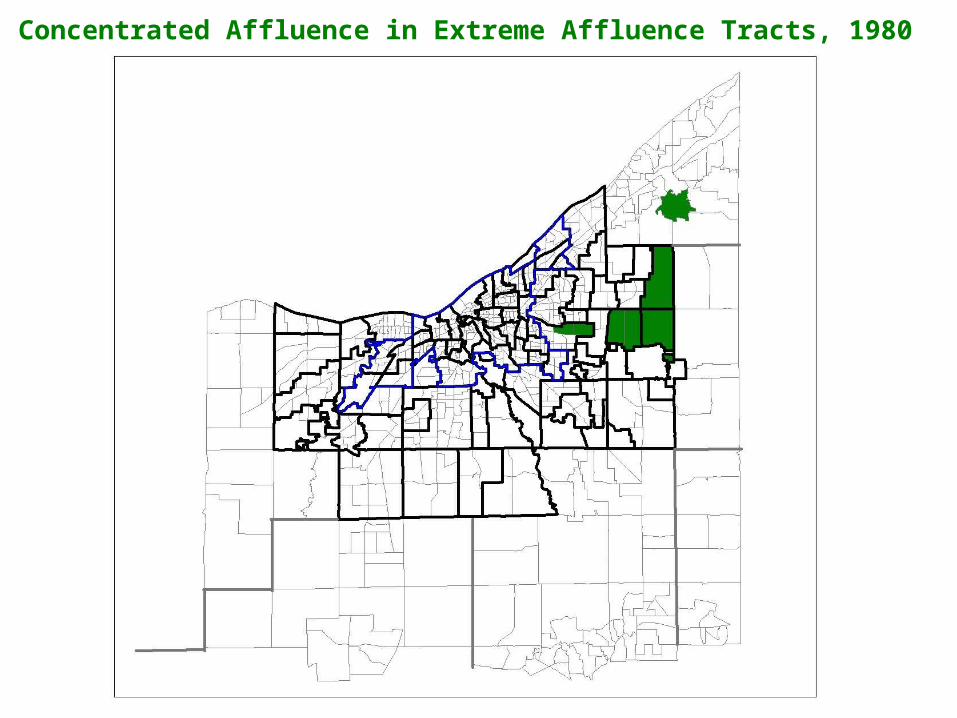
Concentrated Affluence in Extreme Affluence Tracts, 1980
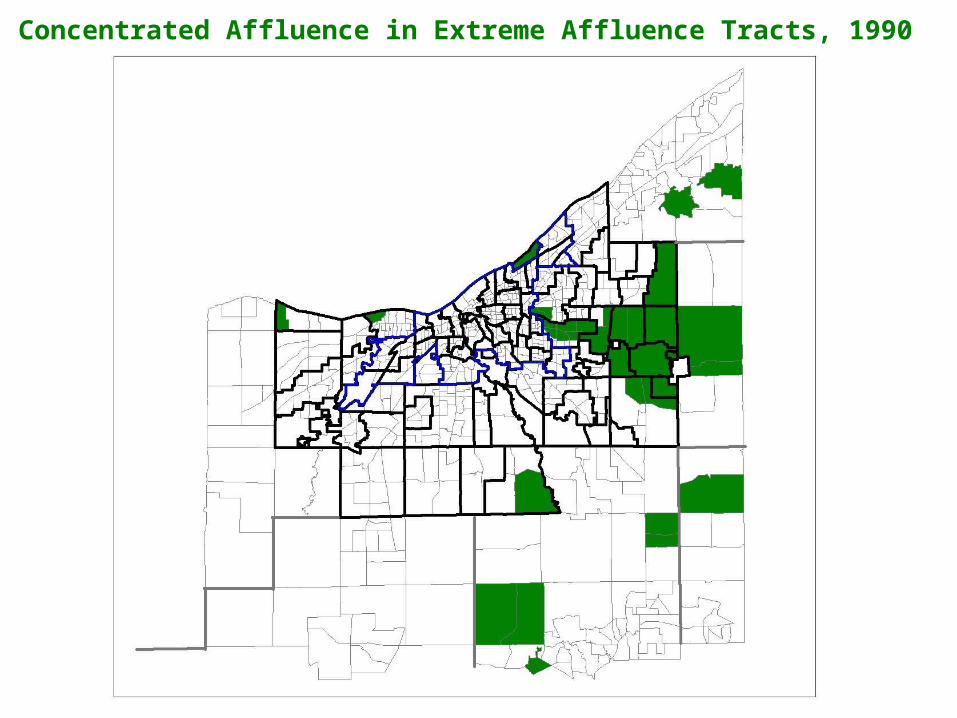
Concentrated Affluence in Extreme Affluence Tracts, 1990
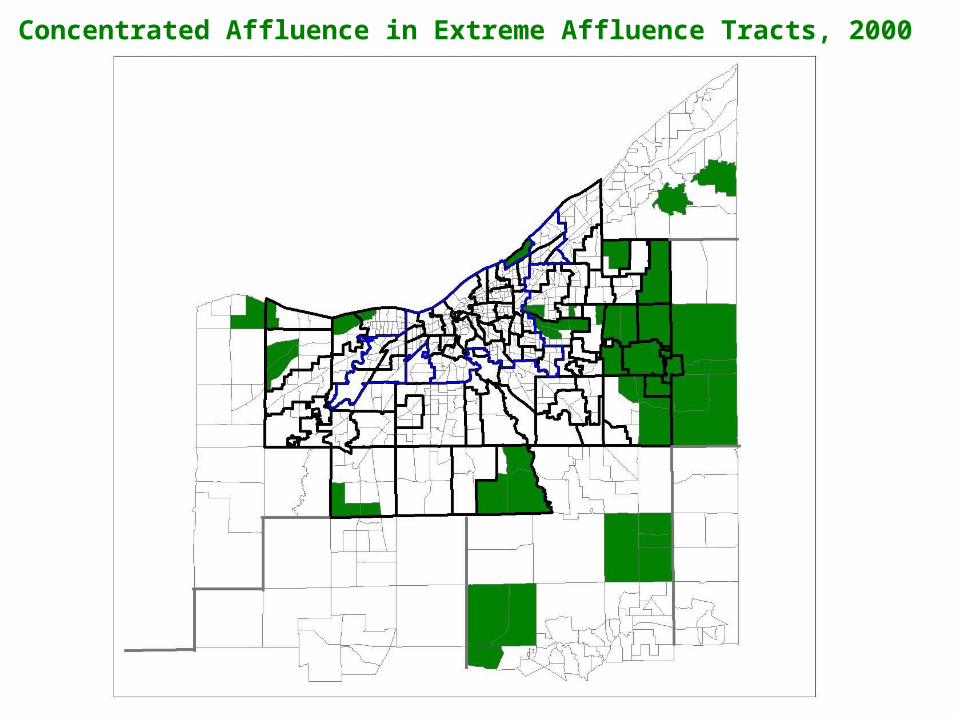
Concentrated Affluence in Extreme Affluence Tracts, 2000
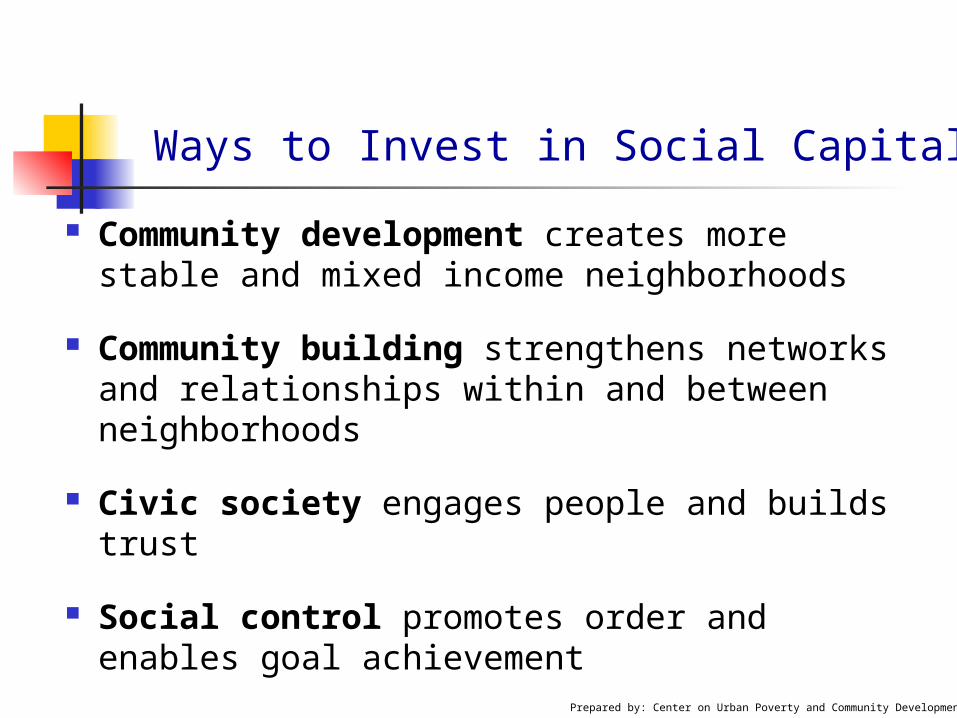
Ways to Invest in Social Capital
Community development creates more stable and mixed income neighborhoods
Community building strengthens networks and relationships within and between neighborhoods
Civic society engages people and builds trust
Social control promotes order and enables goal achievement
Prepared by: Center on Urban Poverty and Community Development
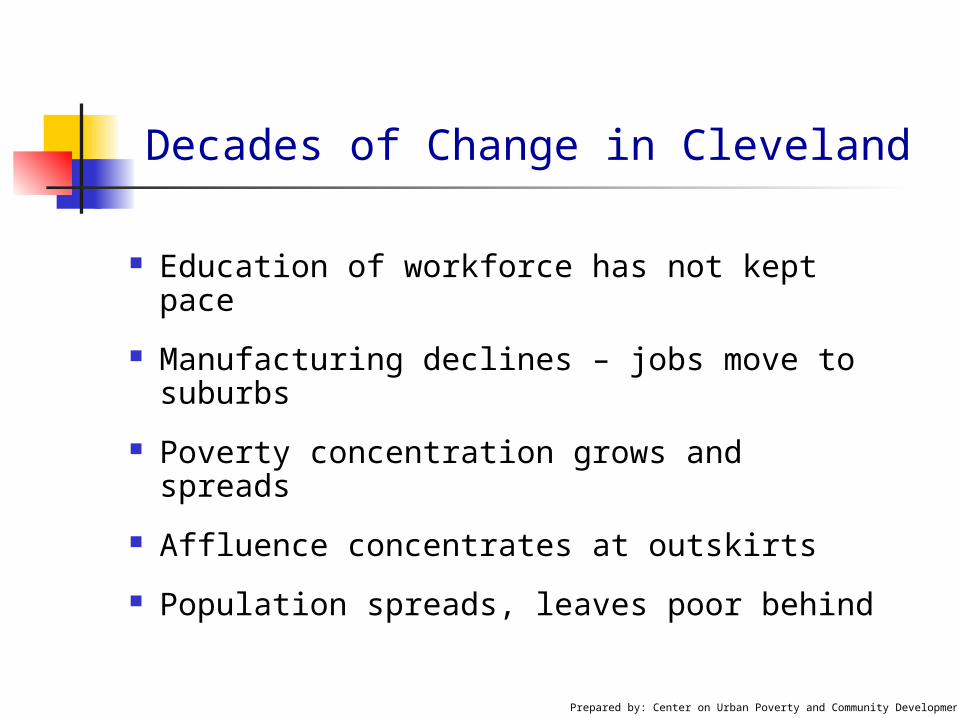
Decades of Change in Cleveland
Education of workforce has not kept pace
Manufacturing declines – jobs move to suburbs
Poverty concentration grows and spreads
Affluence concentrates at outskirts
Population spreads, leaves poor behind
Prepared by: Center on Urban Poverty and Community Development
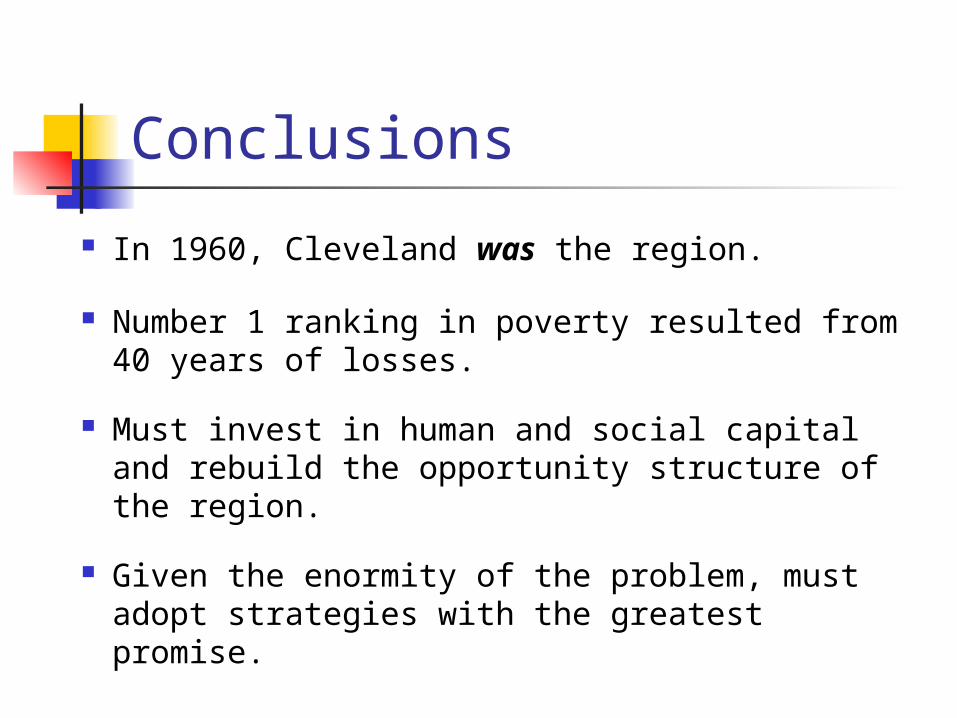
Conclusions
In 1960, Cleveland was the region.
Number 1 ranking in poverty resulted from 40 years of losses.
Must invest in human and social capital and rebuild the opportunity structure of the region.
Given the enormity of the problem, must adopt strategies with the greatest promise.
Contact Information
Kristen Mikelbank
Center on Urban Poverty and Community Development
Mandel School of Applied Social Sciences Case Western Reserve University
(216) 368 – 3188
http://povertycenter.case.edu