Embed Size (px)
Citation preview
Literacy & Numeracy Boost
Bangladesh Baseline
July 2013
Binoy Deb Nath, Jarret Guajardo, and Moazzem Hossain
Acknowledgement to Sk. Md. Abu Bakar, Abdul Quddus Miah, Khalilur
Rahman, Gulam Kabir, and Education department for their excellent support
Special thanks to our team of enumerators: Raju Ahmmed, Asma Akter,
Moushumi Akter, Nasrin Akhter, Rinky Akter, Abdul Gaffar, Md. Uzzal Hossain,
Sheikh Ahmmed Ishtiak, Rafiqul Islam, Khandakar Nusrat Jahan, Lovely Khatun,
Mst. Rahana Khatun, Salma Khatun, Oheduzzaman Liltu, Ahsan Kabir Masum,
Rukaya Mustary, Nasrin Parvin, Shamima Parvin, Obaidur Rahman, Md. Shohel
Rana, Md. Shahidur Rahman Shiplu, Mahmuda Sultana, and Rubana Yasmin.
1
Table of Contents
Acronyms and Select Definitions..................................................................................................3
Reading Outcome Definitions .......................................................................................................4
Executive Summary .......................................................................................................................5
Introduction and Context............................................................................................................ 11
Context ...................................................................................................................................... 12
Methods ..................................................................................................................................... 13
Sampling: School Selection ..................................................................................................... 13
Sampling: Meherpur Sadar School Sample Assignment ......................................................... 14
Sampling: Gangni School Sample Assignment ........................................................................ 14
Sampling: Student Selection ................................................................................................... 15
Measurement ............................................................................................................................ 15
Analysis ...................................................................................................................................... 18
Children’s Background ................................................................................................................ 19
Overall .................................................................................................................................... 19
Important Differences between Sample Groups .................................................................... 19
Sex Differences ....................................................................................................................... 20
Students’ Reading Skills ............................................................................................................... 21
Letter Identification ................................................................................................................ 21
Pseudo Words ......................................................................................................................... 23
Readers ................................................................................................................................... 24
Listening Comprehension ........................................................................................................ 25
Fluency and Accuracy ............................................................................................................. 25
Reading Comprehension ......................................................................................................... 27
Reading with Comprehension ................................................................................................. 29
Students’ Math Skills .................................................................................................................... 29
Conceptual Area 1: Numbers and Operations ...................................................................... 30
Counting ................................................................................................................................. 30
Number Recognition ............................................................................................................... 31
Operations .............................................................................................................................. 33
Conceptual Area 2: Measurement .......................................................................................... 38
Straw Measurement ................................................................................................................ 38
Time ........................................................................................................................................ 39
Conceptual Area 3: Geometry ................................................................................................ 39
Shapes ..................................................................................................................................... 39
2
Sex Differences in Literacy and Numeracy Skills...................................................................... 40
Sex Differences ....................................................................................................................... 46
Literacy & Numeracy Boost Site profiles: Skills and Home Literacy & Numeracy
Environment ................................................................................................................................. 47
Relationships between Skills and Student Background & Home Literacy & Numeracy
Environment ................................................................................................................................. 48
Conclusion..................................................................................................................................... 50
Appendix A: Inter-rater Reliability ............................................................................................. 54
Appendix B: Student Background Tables .................................................................................. 55
Appendix C: Multilevel Regression Output – Literacy Sub-tests ............................................ 59
Appendix C: Multilevel Regression Output (continued) – Counting and Number
Recognition Numeracy Sub-tests ............................................................................................... 60
Appendix C: Multilevel Regression Output (continued) – Operations Numeracy Sub-tests
........................................................................................................................................................ 61
Appendix C: Multilevel Regression Output (continued) – Measurement and Geometry
Numeracy Sub-tests ..................................................................................................................... 62
3
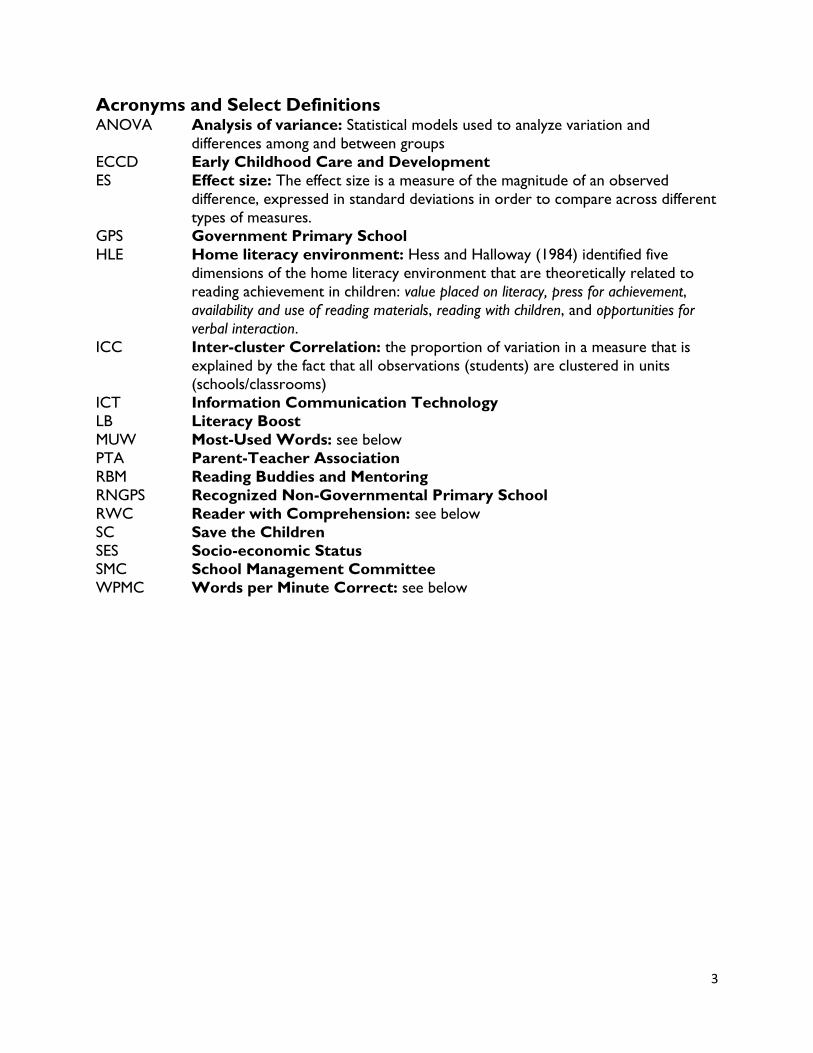
Acronyms and Select Definitions ANOVA Analysis of variance: Statistical models used to analyze variation and
differences among and between groups
ECCD Early Childhood Care and Development
ES Effect size: The effect size is a measure of the magnitude of an observed
difference, expressed in standard deviations in order to compare across different
types of measures.
GPS Government Primary School
HLE Home literacy environment: Hess and Halloway (1984) identified five
dimensions of the home literacy environment that are theoretically related to
reading achievement in children: value placed on literacy, press for achievement,
availability and use of reading materials, reading with children, and opportunities for
verbal interaction.
ICC Inter-cluster Correlation: the proportion of variation in a measure that is
explained by the fact that all observations (students) are clustered in units
(schools/classrooms)
ICT Information Communication Technology
LB Literacy Boost
MUW Most-Used Words: see below
PTA Parent-Teacher Association
RBM Reading Buddies and Mentoring
RNGPS Recognized Non-Governmental Primary School
RWC Reader with Comprehension: see below
SC Save the Children
SES Socio-economic Status SMC School Management Committee
WPMC Words per Minute Correct: see below
4
Reading Outcome Definitions
Letter Identification The number of letters (out of all 50 letters of the Bangla alphabet)
for which the child either correctly gave the name, the sound, or
a word that begins with that letter.
Most Used Words The number of words (out of 20 of the most frequently used words in children’s grade 3 textbook) correctly read aloud by the
child.
Pseudo Words The number of nonsense words (out of 20) correctly read aloud
by the child, as a test of children’s decoding skills.
Reader A child who is able to read the oral reading passage
independently, here defined as reading at least five words
correctly in the first 30 seconds of the sub-test. Readers were
allowed to continue reading until they finished the passage or
refused to read any further; non-readers were stopped and read
the passage by the assessor.
Fluency Tested during the oral reading passage sub-test, fluency is defined
as the number of words read correctly per minute. As assessors
marked the child’s progress at 30 seconds, this measure is
calculated by counting the number of words correct at the 30
second mark and multiplying this number by two.
Accuracy1 Tested during the oral reading passage sub-test, the percentage of
the total words in the passage read correctly by students.
Reading Comprehension Children’s ability to correctly answer 10 questions following the
administration of the oral reading passage sub-test.
Readers with
Comprehension Defined as at least 75% of reading comprehension questions
correctly answered (in this case, at least 4 of 5 questions correct)
and either at least one standard deviation of fluency lower than
the average for children who scored 4 of 5 comprehension
questions correct or at least one standard deviation of
recognition lower than the average for children who scored 4 of 5
comprehension questions correct, based on baseline scores. Thus,
to meet this threshold children must score at least 4 of 5
comprehension question correct and read either at least 33.2
words per minute correct or with 96% recognition.
1 In the body of Literacy Boost assessment research in over 15 countries, as well as in much of the international
education community’s work on early grade reading assessments, ‘accuracy’ is the standard term to refer to the number or percentage of words read correctly from the oral reading passage sub-test of reading assessments. However, there are multiple definitions of what ‘accuracy’ means, and in particular there may be some controversy within Bangladesh. This report will use the term ‘accuracy’ to refer to the abovementioned definition, as a proxy measure of children’s ability to recognize words while reading connected text, acknowledging that other definitions of accuracy exist.
5
Executive Summary This report examines the results of a learner background survey, reading assessment, and math
assessment conducted in March-April 2013. The survey and assessment covered 1531 grade 2
learners throughout 86 schools in the Meherpur district of Bangladesh. The 86 schools were
randomly divided into 36 primary schools designated to receive Save the Children’s (SC)
Numeracy Boost program (18 schools in the sub-district of Meherpur Sadar and 18 schools in
the sub-district of Gangni), 18 primary schools designated to receive a mixed intervention of
both Numeracy Boost and Literacy Boost, and 32 comparison primary schools receiving no
intervention (14 schools in Meherpur Sadar and 18 in Gangni).
The Literacy Boost program includes teacher training, community reading activities, and age-
appropriate local language material creation to support emergent literacy skills among early-
grade children. The Numeracy Boost program addresses math learning both inside and outside
the classroom through a three-pronged approach: students are assessed to gauge how much
math they know, teachers are trained in math content and pedagogy, and families are shown
how they can support math learning in the home. As part of Literacy and Numeracy Boost,
learners are periodically assessed in their reading and math skills to inform the adaptation of
SC’s Literacy Boost and Numeracy Boost programs to this context.
Background Characteristics
Students are significantly older in Gangni than Meherpur Sadar, and significantly less likely to
have previously attended an ECD program. Gangni students spend more time doing
chores/work in the evening and morning, and may spend more time on chores overall. They
also appear to spend less time studying than the Meherpur Sadar students. Given the pattern
of differences between Meherpur Sadar and Gangni, these two upazilas should be analyzed separately during endline impact analysis, and this baseline report will
also examine the two upazilas separately, focusing on the comparisons and
dynamics within upazilas. On the whole, it appears that within upazilas, the sample
groups are remarkably similar to each other. This indicates that randomization of
assignment to sample groups was successful, and that the groups are sufficiently
comparable for a difference-in-difference impact analysis at endline, controlling for
the small number of observed differences.
Boys are older by half a year on average than girls, significantly more likely to have changed
schools, and more often report missing school due to illness and due to work. Girls are more
likely to report missing school due to leisure. Significantly more girls report doing chores than
boys, and girls report doing both more types of chores as well as spending a longer amount of
time on chores. Boys and girls report performing different types of chores, and girls report
spending significantly more time studying per day than boys. Utilizing the information
about why boys and girls miss school, the fact that girls appear to do more chores
more frequently than boys, and the different types of chores done by boys and girls
can provide clues as to the most effective suggestions to provide parents for how
they can integrate literacy and numeracy practice into their children’s routines.
For example, when targeting improvements in girls’ numeracy skills, parental
awareness can suggest having talking to girls about measurement, quantity, and
6
estimation when cooking. Math Camps can teach children simple math-reinforcing
games that girls can use when they are caring for their younger siblings.
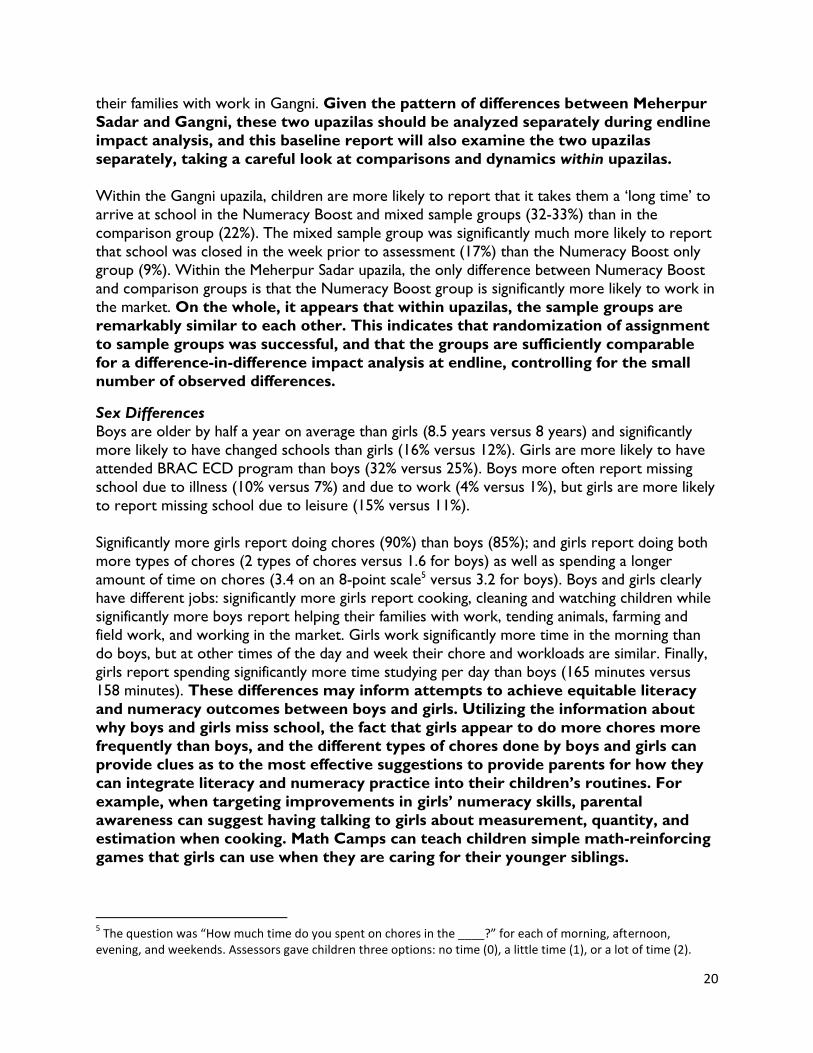
Students’ Reading Skills
On average, all groups together correctly identified 39 of the 50 letters. A subset of children
comprising 12% of the sample could identify less than 50% of the letters, and 5% of children
could not identify any letters. The Literacy Boost program should prioritize letter
awareness as a critical area for teachers and community action facilitators to focus
on. To ensure children learn all of their letters as early as possible, moving forward
Literacy Boost should help teachers and community action facilitators focus on the
most difficult letters (W, J, O, H, h, T, F, P, c, R, Z, j, A, g, B, k, Av, and K) as well as
give teachers the tools to conduct effective formative assessment in order to
better target the specific deficiencies of the children in their classroom.
Learners in all sample groups were only able to read nine of the 20 most-used words. The most
difficult words, correctly read by less than a quarter of students, were and
The next most difficult words, read correctly by less than half of students, were
and In addition to emphasizing letter awareness, Literacy Boost should train
teachers in effective phonological awareness and decoding instructional techniques in order to build children’s ability to read words from letters as they increase their
letter knowledge.
In terms of decoding skills, children could only read six or seven of 20 pseudo words correctly.
A full third of children could not read a single pseudo word. The most difficult words, correctly
read by less than a quarter of children, were
and Again, Literacy Boost should give children improved explicit instruction and practice in phonological awareness and decoding skills as they work toward
mastering their letters.
At baseline, about 42% of children could read at least five words correctly of a grade-level
passage in 30 seconds. These students were designated as ‘readers’ and allowed to continue
reading for as long as it took them to finish the passage. Those who could not meet this
threshold were designated as ‘non-readers’ and were stopped and read the passage by the
assessors. Students classified as nonreaders correctly answered only half of the listening
comprehension questions correctly. Children, especially those who already struggle to
read, may need more practice with verbal interaction. As such, Literacy Boost
should encourage parents to tell more stories to their children, ask more questions
of their children, and simply engage their children in conversation more frequently.
Students classified as readers in read about 34 words per minute correct with an average of
87% accuracy. It appears that, of the 42% of children designated as ‘readers,’ fluency
and accuracy are at decent levels, albeit with some room for improvement. These
children represent a valuable resource to help their nonreading peers catch up, and
can actively contribute through programs such as Reading Buddies.
7
Despite their fluency and accuracy scores, readers could answer only five or six reading
comprehension correct on average. Students found the easiest type of reading comprehension
question to be the inferential questions. The next hardest questions were the summary and
literal questions, and the hardest question for students was the evaluative question. Literacy
Boost should encourage teachers and parents to ask different types of questions
about the texts that children read or were read. Questions should not be limited to
factual ones, but should also include inferential, evaluative and summary questions.
Only nine percent of students qualified as ‘readers with comprehension’ (reading a grade-level
text with at least 80% comprehension). The next year of Literacy Boost implementation
should build students’ lower-order skills with the goal of helping students achieve
reading with comprehension.
The average scores for Mehepur Sadar and Gangni upazilas were often different, and the scores
for sample groups within upazilas was also sometimes different. Thus, baseline literacy
scores should be controlled for during endline impact analysis. Additionally, some evidence of impact from the previous year of Literacy Boost in the Meherpur Sadar
intervention group was found. More students reported having storybooks in the
home and also had significantly higher fluency and reading comprehension than the
Meherpur Sadar comparison group.
Students’ Math Skills
For counting skills, students performed the best at counting aloud to 100 (89% correct) but
were not as able to count backward from 10 to 1 (75% correct) and did poorly skip counting
by 5s (54% correct). Nine percent of students could not count backward at all and 13% could
not skip count by 5s at all. Numeracy Boost should highlight these issues with teachers
and community action facilitators as well as suggest strategies to strengthen
children’s ability to transition through new multiples of 10 when counting, to count
very high numbers (85-100), to count backward, and to skip count by 5s. Students
will need ample, enjoyable opportunities to practice all sorts of counting activities.
On the three sub-tests associated with number recognition, students had the hardest time
guessing the correct missing number (50% correct) and scored an equal percentage of correct
items when identifying numbers and indicating the largest/smallest number (70% correct).
Students need the most help with double-digit numbers, both in terms of
identifying the symbols and the value they represent. Numeracy Boost should help
children master their recognition of number symbols and the value represented by
them, and build on this to help students understand, detect, and solve number
patterns. This can be done through training teachers in active-learning methods
and activities that strengthen students’ conceptual understanding of these number
dynamics as well as incorporate practice of these skills into community activities.
In operations, students overall performed the best at the timed addition questions (84%
correct) followed closely by authentic addition (74% correct). Students performed worse at
timed subtraction and authentic subtraction (68% and 67%, respectively), but had the most
difficulty with the word problems (47% correct). A full quarter of students were unable to
8
correctly answer a single word problem. Numeracy Boost should address these skill
deficiencies through providing teachers and community activity facilitators with
strategies and activities for engaging children in enjoyable and relevant practice of
addition and subtraction. In particular, Numeracy Boost should give teachers the
tools to turn the instruction of operations from an abstract exercise to one that
engages students with relevant examples from their lives in the form of word
problems. Numeracy Boost community activities can supplement in-school word
problem instruction with fun and diverse approaches to practicing addition and
subtraction word problems.
Given authentic assessment evidence that students performed better at addition and
subtraction when using outwardly visible counting strategies and using their fingers versus
nothing, Numeracy Boost should test if helping students learn addition and
subtraction through a variety of different strategies including counting strategies
helps them learn more effectively. Numeracy Boost should also ensure that all
students realize the tools they have at their disposal, including fingers, to practice solving addition and subtraction problems.
In measurement, students did fairly well at measurement of length (78% correct), matching
activities with the time of day (86% correct), and naming the days of the week (90% correct).
However, only about one-third of students could correctly give the length of the longest straw
in centimeters using a ruler, and over 50% of students could not name any months (average
22% correct). Numeracy Boost should train teachers and community activity
facilitators to instruct students how to use rulers and other methods for measuring
the special dimensions of objects. Numeracy Boost should also encourage teachers,
community facilitators, and parent to talk to students about the months of the year
and to engage children in real-life application of their knowledge of days of the
week and months of the year.
Finally, for geometry shapes sub-test was one of the most difficult for students, and the sample
as a whole could answer slightly over half the questions correctly. The questions asking
students to identify two-dimensional shapes were more difficult for students than those asking
students to give a real-life example of three-dimensional shapes. Numeracy Boost should
build on as well as strengthen students’ contextual knowledge of shapes in their
daily lives to improve conceptual understanding about shapes In general.
Average scores in Gangni upazila were often significantly higher as a whole than average scores
in Meherpur Sadar in many of the numeracy sub-tests.
Sex Differences in Reading and Math Skills
Overall, girls significantly outperformed boys in about half of the literacy sub-tests, but boys
outscored girls in a majority of numeracy sub-tests. Literacy Boost and Numeracy Boost
programming should take these disparities into account to inform the training
given to teachers and community action facilitators as well as materials provided.
It will be especially necessary to engage girls more in learning and applying
mathematical concepts.
9
Students’ Home Literacy & Numeracy Environment
Few students report newspapers, magazines, or child-friendly reading materials such as coloring
books and comics (and storybooks in Gangni) at home. It will be important for Literacy
Boost to address these deficiencies through ensuring students have easy access to
engaging, child-friendly reading materials at Book Banks.
A high percentage of household members are encouraging students to study, but
there is room for improvement particularly in the area of telling stories to children,
as this activity does not require reading skills on the part of the household
member. Assuming that at least as many household members can count and add
themselves as are reported to be seen using numbers or math, the proportion of
household members asking children to count or add things can also be increased.
The fact that book borrowing was much more frequently reported in Meherpur Sadar than in
Gangni is not surprising, given that 100% of Meherpur Sadar schools have libraries but only one
quarter of Gangni schools do. It will be important to compensate for this shortage of school libraries in the Gangni mixed intervention group through Book Banks.
In response to the question, ‘How do you use math outside of school?’ students most readily
mentioned using math in the market, but few children reported using math in other activities.
Numeracy Boost should suggest strategies for parents to integrate math more
explicitly into daily activities such as chores.
Boys are more likely to report the presence of religious reading materials in the home than
girls. Boys are also more likely to report using math outside of school, and specifically in the
market to count money/buy things and when filling water containers to gauge quantity and
capacity. However, girls are more likely to report using math in the kitchen for estimation and
measurement and when sorting clothes. Girls report significantly more household members
telling them stories on average than boys, but boys report significantly more household
members asking them to help with counting or adding things. These sex differences should
be taken into account for attempts to make learning to read more engaging for
boys, and learning math more engaging for girls.
Relationship between Students’ Skills and Background and Home Literacy & Numeracy Environment
Overall, it appears that boys fall behind in literacy, girls in numeracy, and the poorest of the
poor and those with large chore and workloads fall behind in both literacy and numeracy. A
deprived household literacy environment is associated with falling behind in literacy, and
likewise a deprived household numeracy environment is associated with falling behind in
numeracy. Literacy Boost and Numeracy Boost programming should take these
disparities into account, to ensure that all children learn regardless of sex, socio-
economic status, and chore and workload. Perhaps special material for boys and
girls, targeting mechanisms for the poorest, and flexible timing of community
activities for the chore and work-burdened can help these groups keep pace or
even catch up with their more advantaged peers. Additionally, Literacy Boost and
Numeracy Boost programming can actively change the home literacy and
numeracy environment faced by children, and should seek to level the playing field
10
for those from literacy- and numeracy-deprived households by providing plenty of
reading and math material and opportunities to practice for all children.
Older students, those who have repeated at least one grade, those with a larger number of
household members, and those who report missing at least one day of school the week before
performed worse on many literacy and numeracy sub-tests. Literacy Boost and Numeracy
Boost programming should explore what special remedial options are available to
help any children who are falling behind, especially older children, repeaters, and
those from large families. As illness was one of the most frequently mentioned
reasons for missing school, Save the Children can also explore options for
combining School Health & Nutrition programming with Literacy Boost and
Numeracy Boost. More information is needed to understand how children who
report missing school for leisure can be encouraged to attend more frequently.
11
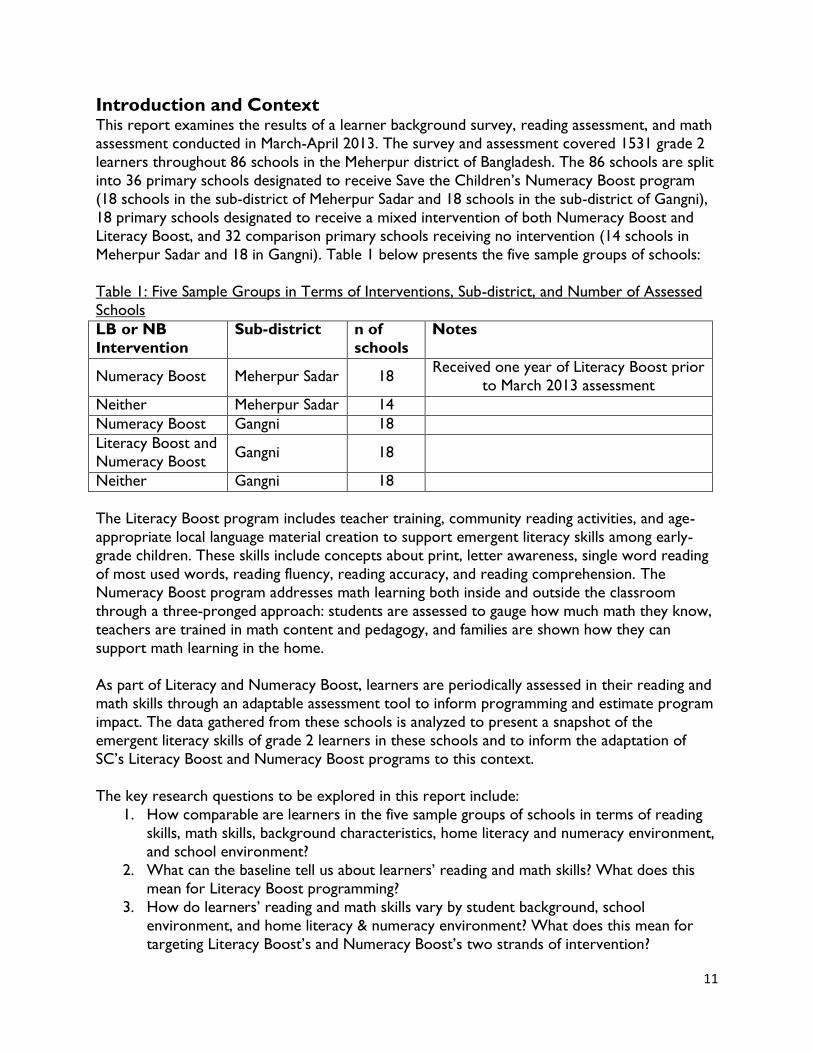
Introduction and Context This report examines the results of a learner background survey, reading assessment, and math
assessment conducted in March-April 2013. The survey and assessment covered 1531 grade 2
learners throughout 86 schools in the Meherpur district of Bangladesh. The 86 schools are split
into 36 primary schools designated to receive Save the Children’s Numeracy Boost program
(18 schools in the sub-district of Meherpur Sadar and 18 schools in the sub-district of Gangni),
18 primary schools designated to receive a mixed intervention of both Numeracy Boost and
Literacy Boost, and 32 comparison primary schools receiving no intervention (14 schools in
Meherpur Sadar and 18 in Gangni). Table 1 below presents the five sample groups of schools:
Table 1: Five Sample Groups in Terms of Interventions, Sub-district, and Number of Assessed
Schools
LB or NB
Intervention
Sub-district n of
schools
Notes
Numeracy Boost Meherpur Sadar 18 Received one year of Literacy Boost prior
to March 2013 assessment
Neither Meherpur Sadar 14
Numeracy Boost Gangni 18
Literacy Boost and
Numeracy Boost Gangni 18
Neither Gangni 18
The Literacy Boost program includes teacher training, community reading activities, and age-
appropriate local language material creation to support emergent literacy skills among early-
grade children. These skills include concepts about print, letter awareness, single word reading
of most used words, reading fluency, reading accuracy, and reading comprehension. The
Numeracy Boost program addresses math learning both inside and outside the classroom
through a three-pronged approach: students are assessed to gauge how much math they know,
teachers are trained in math content and pedagogy, and families are shown how they can
support math learning in the home.
As part of Literacy and Numeracy Boost, learners are periodically assessed in their reading and
math skills through an adaptable assessment tool to inform programming and estimate program
impact. The data gathered from these schools is analyzed to present a snapshot of the
emergent literacy skills of grade 2 learners in these schools and to inform the adaptation of
SC’s Literacy Boost and Numeracy Boost programs to this context.
The key research questions to be explored in this report include:
1. How comparable are learners in the five sample groups of schools in terms of reading
skills, math skills, background characteristics, home literacy and numeracy environment,
and school environment?
2. What can the baseline tell us about learners’ reading and math skills? What does this
mean for Literacy Boost programming?
3. How do learners’ reading and math skills vary by student background, school
environment, and home literacy & numeracy environment? What does this mean for
targeting Literacy Boost’s and Numeracy Boost’s two strands of intervention?
12
To investigate these questions, this report will first describe the research methods used;
including sampling, measurement, and analysis. Next, in order to see if groups are statistically
similar, the comparability of Literacy Boost, Numeracy Boost and comparison schools will be
examined through clustered t-tests and post-hoc pairwise comparisons. The report will then
compare Literacy Boost, Numeracy Boost, and comparison learners’ scores for each of the
numeracy and literacy skills, exploring learners’ strengths and weaknesses in each skill. After
this, the report will then examine which skills are already well-developed among this sample of
children, and which skills Literacy Boost and Numeracy Boost should focus on. Finally, the
report will investigate any correlations with student background and home practices &
environment variables using multilevel regression analysis.
Context SC Bangladesh’s sponsorship-funded program known as Shishuder Jonno (“For the children” in
Bangla), aims to ensure that children in Meherpur learn and develop to their full potential. The
program provides support to children and their families at every stage of life through four core
programs: Early Childhood Care and Development (ECCD), Basic Education (BE), School
Health and Nutrition (SHN) and Adolescent Development (AD), following Save the Children
International’s Common Approach for Sponsorship Program (CASP) modules. In addition to
the four core programs, Shishuder Jonno also implements cross-cutting Child Protection (CP)
and Community Mobilization (CM) activities across the implementation area, as well as select
innovation and pilot projects that may be scaled up within the program or in other Save the
Children programs throughout Bangladesh. The Literacy and Numeracy Boost pilot is part of
the Basic Education program.
Since 2008, Shishuder Jonno has been operating in all three upazilas (sub-districts) of Meherpur.
In the sub-district of Meherpur Sadar, SC works through direct delivery. In Mujibnagar and
Gangni sub-districts, SC through partner NGO Jagoroni Chakra Foundation (JCF).
Situated in Khulna Division, Meherpur is located approximately 245 km northwest of the
Bangladeshi capital Dhaka and is the smallest District in the country. It consists of three
upazilas: Meherpur Sadar, Mujibnagar and Gangni. Within the upazilas there are two
municipalities, 18 unions and 249 villages. Although Meherpur shares a 118 km border with
India, migration of the 591,436 inhabitants of Meherpur to India is rare. The population of this
area is religiously and linguistically homogenous, as the vast majority of inhabitants are Muslim
and speak Bangla as their native tongue. The economy is based primarily on agriculture.
Despite certain climatic advantages, including fertile land with more than one growing season and a slightly higher land elevation level in comparison to other parts of the country, many
marginalized communities in Meherpur face the socioeconomic challenges. 2011 Population and
Housing Census data show that the literacy rate in the Meherpur Sadar upazila is 49.4% while
the rate is 42.2% in the upazila of Gangni. The primary education survival rate to Grade is
41.1% compared to the national rate of 51.9% (PDEP II). In spite of high primary school
enrollment rates, only about 58% students are regularly attending school and dropout rates are
high. Moreover, there are tremendous disparities between advantaged and disadvantaged
groups and, generally rural areas, are considered the least advantaged.
13
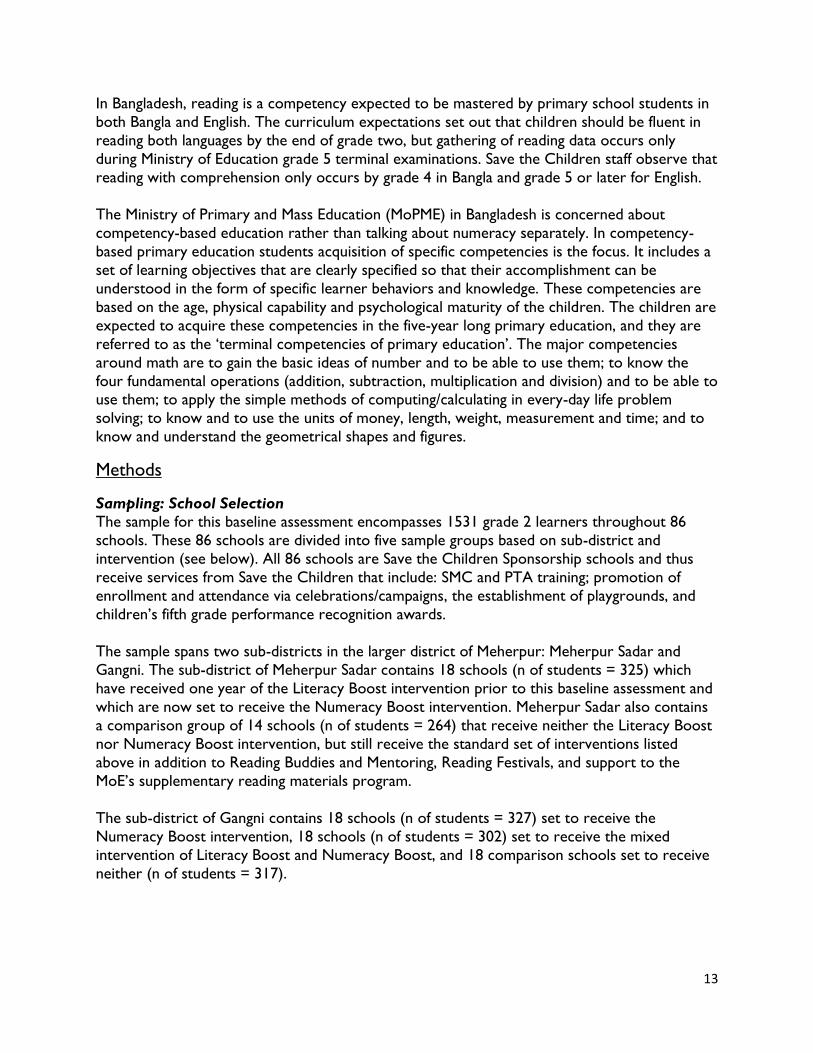
In Bangladesh, reading is a competency expected to be mastered by primary school students in
both Bangla and English. The curriculum expectations set out that children should be fluent in
reading both languages by the end of grade two, but gathering of reading data occurs only
during Ministry of Education grade 5 terminal examinations. Save the Children staff observe that
reading with comprehension only occurs by grade 4 in Bangla and grade 5 or later for English.
The Ministry of Primary and Mass Education (MoPME) in Bangladesh is concerned about
competency-based education rather than talking about numeracy separately. In competency-
based primary education students acquisition of specific competencies is the focus. It includes a
set of learning objectives that are clearly specified so that their accomplishment can be
understood in the form of specific learner behaviors and knowledge. These competencies are
based on the age, physical capability and psychological maturity of the children. The children are
expected to acquire these competencies in the five-year long primary education, and they are
referred to as the ‘terminal competencies of primary education’. The major competencies
around math are to gain the basic ideas of number and to be able to use them; to know the
four fundamental operations (addition, subtraction, multiplication and division) and to be able to use them; to apply the simple methods of computing/calculating in every-day life problem
solving; to know and to use the units of money, length, weight, measurement and time; and to
know and understand the geometrical shapes and figures.
Methods
Sampling: School Selection The sample for this baseline assessment encompasses 1531 grade 2 learners throughout 86
schools. These 86 schools are divided into five sample groups based on sub-district and
intervention (see below). All 86 schools are Save the Children Sponsorship schools and thus
receive services from Save the Children that include: SMC and PTA training; promotion of
enrollment and attendance via celebrations/campaigns, the establishment of playgrounds, and
children’s fifth grade performance recognition awards.
The sample spans two sub-districts in the larger district of Meherpur: Meherpur Sadar and
Gangni. The sub-district of Meherpur Sadar contains 18 schools (n of students = 325) which
have received one year of the Literacy Boost intervention prior to this baseline assessment and
which are now set to receive the Numeracy Boost intervention. Meherpur Sadar also contains
a comparison group of 14 schools (n of students = 264) that receive neither the Literacy Boost
nor Numeracy Boost intervention, but still receive the standard set of interventions listed
above in addition to Reading Buddies and Mentoring, Reading Festivals, and support to the
MoE’s supplementary reading materials program.
The sub-district of Gangni contains 18 schools (n of students = 327) set to receive the
Numeracy Boost intervention, 18 schools (n of students = 302) set to receive the mixed
intervention of Literacy Boost and Numeracy Boost, and 18 comparison schools set to receive
neither (n of students = 317).
14
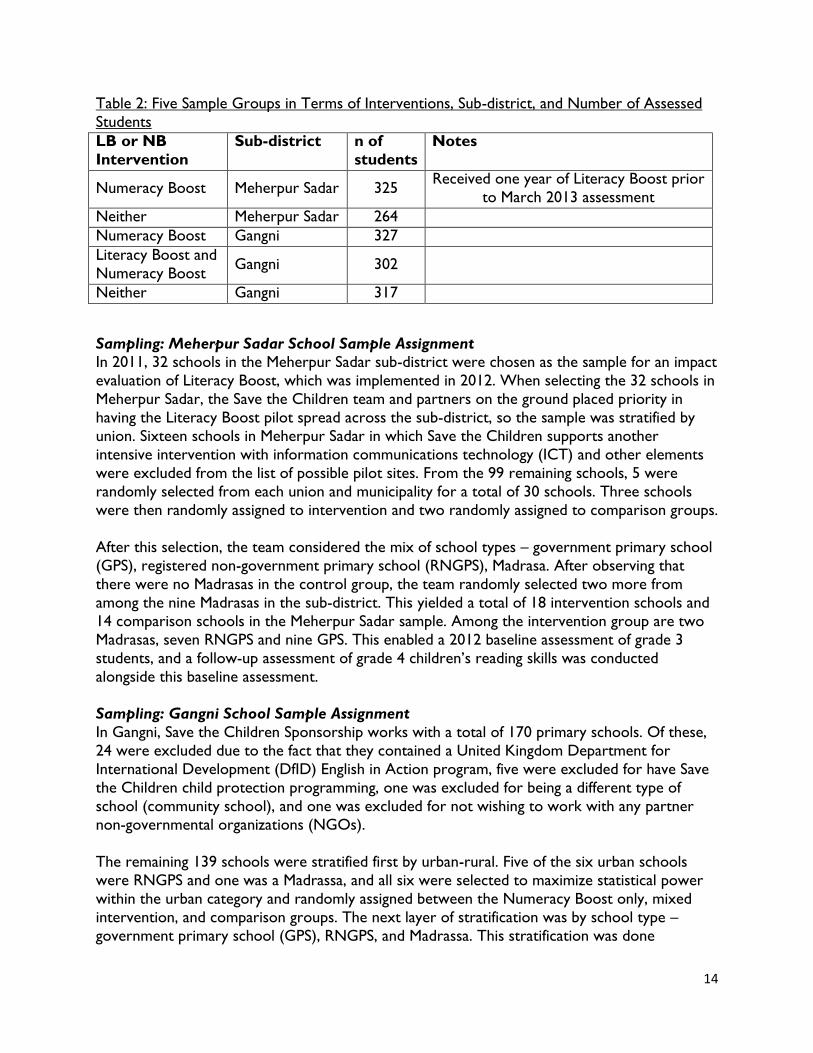
Table 2: Five Sample Groups in Terms of Interventions, Sub-district, and Number of Assessed
Students
LB or NB
Intervention
Sub-district n of
students
Notes
Numeracy Boost Meherpur Sadar 325 Received one year of Literacy Boost prior
to March 2013 assessment
Neither Meherpur Sadar 264
Numeracy Boost Gangni 327
Literacy Boost and
Numeracy Boost Gangni 302
Neither Gangni 317
Sampling: Meherpur Sadar School Sample Assignment In 2011, 32 schools in the Meherpur Sadar sub-district were chosen as the sample for an impact
evaluation of Literacy Boost, which was implemented in 2012. When selecting the 32 schools in
Meherpur Sadar, the Save the Children team and partners on the ground placed priority in
having the Literacy Boost pilot spread across the sub-district, so the sample was stratified by
union. Sixteen schools in Meherpur Sadar in which Save the Children supports another
intensive intervention with information communications technology (ICT) and other elements
were excluded from the list of possible pilot sites. From the 99 remaining schools, 5 were
randomly selected from each union and municipality for a total of 30 schools. Three schools
were then randomly assigned to intervention and two randomly assigned to comparison groups.
After this selection, the team considered the mix of school types – government primary school
(GPS), registered non-government primary school (RNGPS), Madrasa. After observing that
there were no Madrasas in the control group, the team randomly selected two more from
among the nine Madrasas in the sub-district. This yielded a total of 18 intervention schools and
14 comparison schools in the Meherpur Sadar sample. Among the intervention group are two
Madrasas, seven RNGPS and nine GPS. This enabled a 2012 baseline assessment of grade 3
students, and a follow-up assessment of grade 4 children’s reading skills was conducted
alongside this baseline assessment.
Sampling: Gangni School Sample Assignment
In Gangni, Save the Children Sponsorship works with a total of 170 primary schools. Of these,
24 were excluded due to the fact that they contained a United Kingdom Department for
International Development (DfID) English in Action program, five were excluded for have Save
the Children child protection programming, one was excluded for being a different type of
school (community school), and one was excluded for not wishing to work with any partner
non-governmental organizations (NGOs).
The remaining 139 schools were stratified first by urban-rural. Five of the six urban schools
were RNGPS and one was a Madrassa, and all six were selected to maximize statistical power
within the urban category and randomly assigned between the Numeracy Boost only, mixed
intervention, and comparison groups. The next layer of stratification was by school type –
government primary school (GPS), RNGPS, and Madrassa. This stratification was done
15
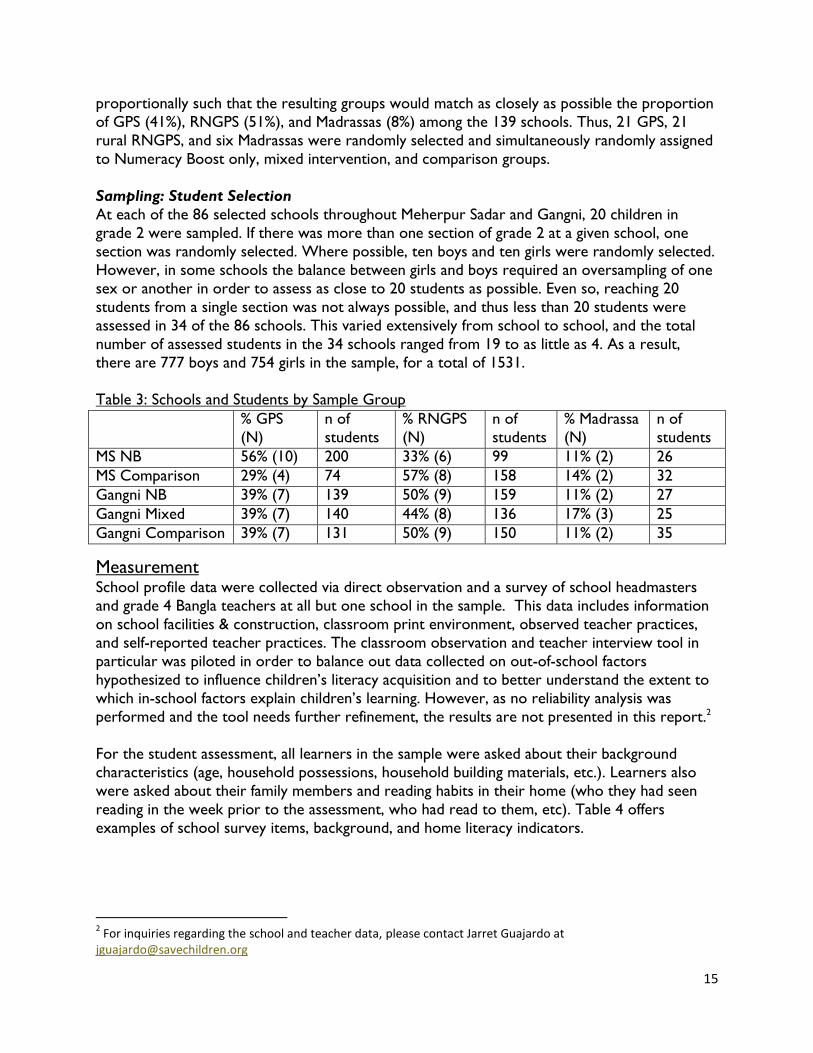
proportionally such that the resulting groups would match as closely as possible the proportion
of GPS (41%), RNGPS (51%), and Madrassas (8%) among the 139 schools. Thus, 21 GPS, 21
rural RNGPS, and six Madrassas were randomly selected and simultaneously randomly assigned
to Numeracy Boost only, mixed intervention, and comparison groups.
Sampling: Student Selection
At each of the 86 selected schools throughout Meherpur Sadar and Gangni, 20 children in
grade 2 were sampled. If there was more than one section of grade 2 at a given school, one
section was randomly selected. Where possible, ten boys and ten girls were randomly selected.
However, in some schools the balance between girls and boys required an oversampling of one
sex or another in order to assess as close to 20 students as possible. Even so, reaching 20
students from a single section was not always possible, and thus less than 20 students were
assessed in 34 of the 86 schools. This varied extensively from school to school, and the total
number of assessed students in the 34 schools ranged from 19 to as little as 4. As a result,
there are 777 boys and 754 girls in the sample, for a total of 1531.
Table 3: Schools and Students by Sample Group
% GPS
(N)
n of
students
% RNGPS
(N)
n of
students
% Madrassa
(N)
n of
students
MS NB 56% (10) 200 33% (6) 99 11% (2) 26
MS Comparison 29% (4) 74 57% (8) 158 14% (2) 32
Gangni NB 39% (7) 139 50% (9) 159 11% (2) 27
Gangni Mixed 39% (7) 140 44% (8) 136 17% (3) 25
Gangni Comparison 39% (7) 131 50% (9) 150 11% (2) 35
Measurement School profile data were collected via direct observation and a survey of school headmasters
and grade 4 Bangla teachers at all but one school in the sample. This data includes information
on school facilities & construction, classroom print environment, observed teacher practices,
and self-reported teacher practices. The classroom observation and teacher interview tool in
particular was piloted in order to balance out data collected on out-of-school factors
hypothesized to influence children’s literacy acquisition and to better understand the extent to
which in-school factors explain children’s learning. However, as no reliability analysis was
performed and the tool needs further refinement, the results are not presented in this report.2
For the student assessment, all learners in the sample were asked about their background
characteristics (age, household possessions, household building materials, etc.). Learners also
were asked about their family members and reading habits in their home (who they had seen
reading in the week prior to the assessment, who had read to them, etc). Table 4 offers
examples of school survey items, background, and home literacy indicators.
2 For inquiries regarding the school and teacher data, please contact Jarret Guajardo at
16
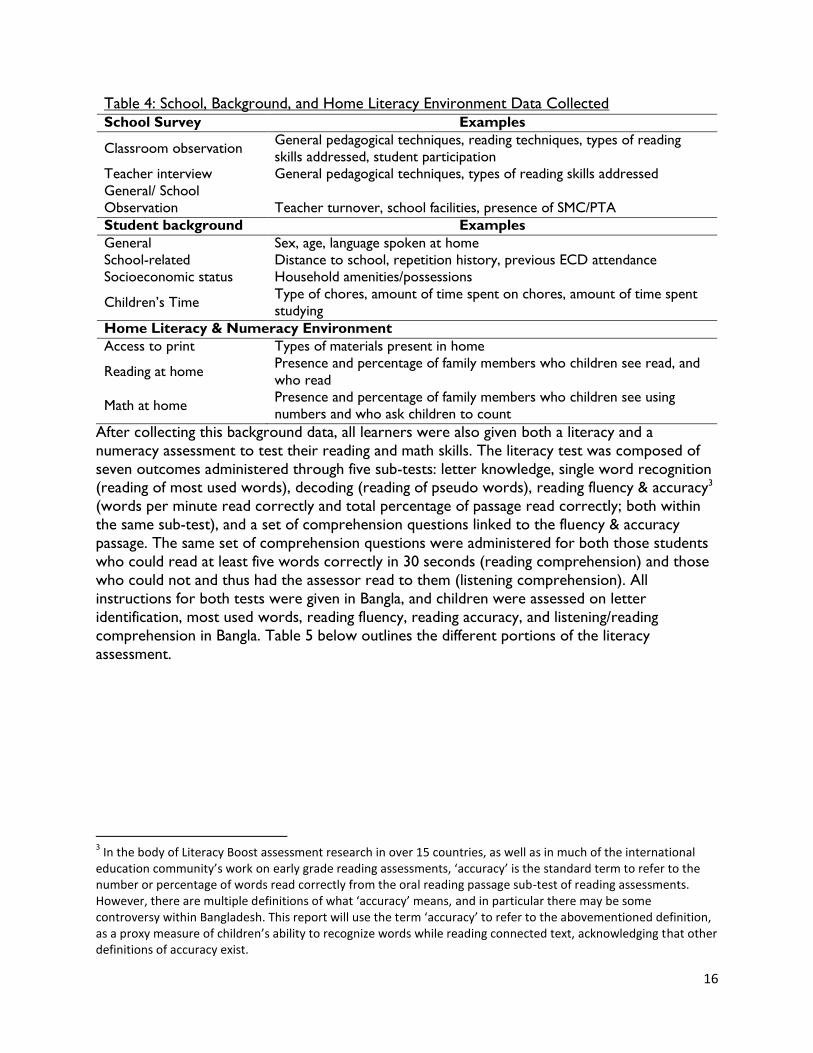
Table 4: School, Background, and Home Literacy Environment Data Collected
School Survey Examples
Classroom observation General pedagogical techniques, reading techniques, types of reading
skills addressed, student participation
Teacher interview General pedagogical techniques, types of reading skills addressed
General/ School
Observation Teacher turnover, school facilities, presence of SMC/PTA
Student background Examples
General Sex, age, language spoken at home
School-related Distance to school, repetition history, previous ECD attendance
Socioeconomic status Household amenities/possessions
Children’s Time Type of chores, amount of time spent on chores, amount of time spent
studying
Home Literacy & Numeracy Environment
Access to print Types of materials present in home
Reading at home Presence and percentage of family members who children see read, and
who read
Math at home Presence and percentage of family members who children see using
numbers and who ask children to count
After collecting this background data, all learners were also given both a literacy and a
numeracy assessment to test their reading and math skills. The literacy test was composed of
seven outcomes administered through five sub-tests: letter knowledge, single word recognition (reading of most used words), decoding (reading of pseudo words), reading fluency & accuracy3
(words per minute read correctly and total percentage of passage read correctly; both within
the same sub-test), and a set of comprehension questions linked to the fluency & accuracy
passage. The same set of comprehension questions were administered for both those students
who could read at least five words correctly in 30 seconds (reading comprehension) and those
who could not and thus had the assessor read to them (listening comprehension). All
instructions for both tests were given in Bangla, and children were assessed on letter
identification, most used words, reading fluency, reading accuracy, and listening/reading
comprehension in Bangla. Table 5 below outlines the different portions of the literacy
assessment.
3 In the body of Literacy Boost assessment research in over 15 countries, as well as in much of the international
education community’s work on early grade reading assessments, ‘accuracy’ is the standard term to refer to the number or percentage of words read correctly from the oral reading passage sub-test of reading assessments. However, there are multiple definitions of what ‘accuracy’ means, and in particular there may be some controversy within Bangladesh. This report will use the term ‘accuracy’ to refer to the abovementioned definition, as a proxy measure of children’s ability to recognize words while reading connected text, acknowledging that other definitions of accuracy exist.
17
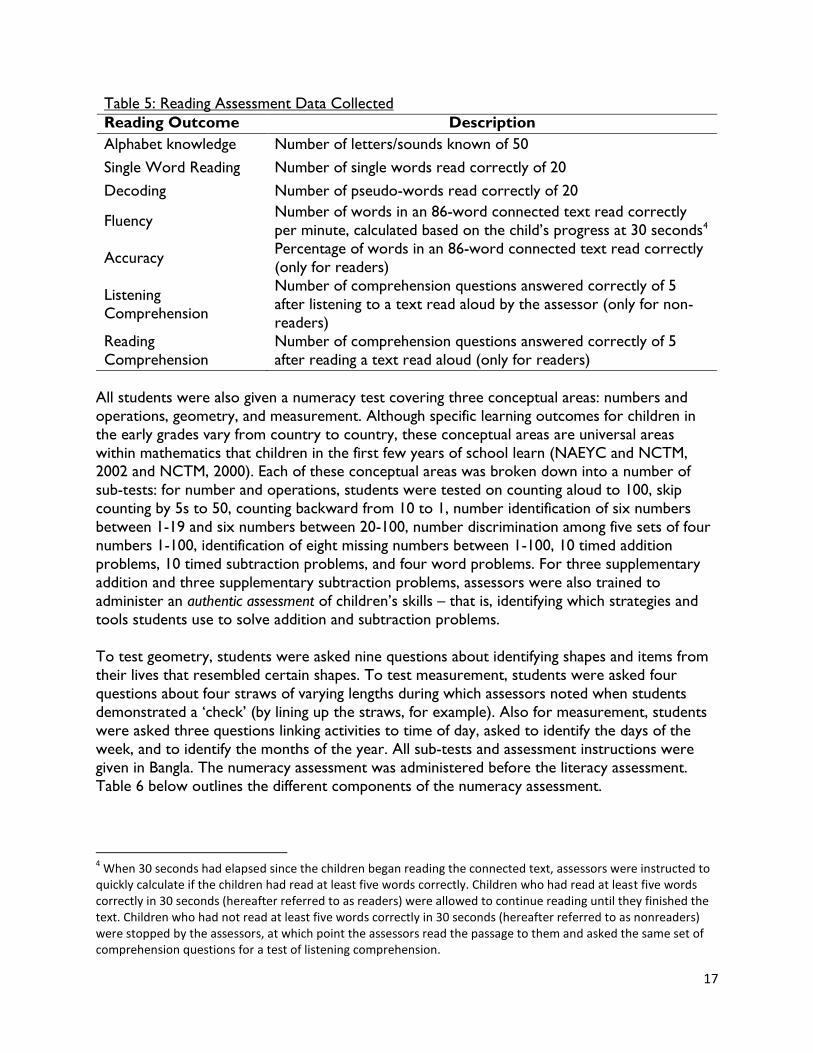
Table 5: Reading Assessment Data Collected
Reading Outcome Description
Alphabet knowledge Number of letters/sounds known of 50
Single Word Reading Number of single words read correctly of 20
Decoding Number of pseudo-words read correctly of 20
Fluency Number of words in an 86-word connected text read correctly
per minute, calculated based on the child’s progress at 30 seconds4
Accuracy Percentage of words in an 86-word connected text read correctly
(only for readers)
Listening
Comprehension
Number of comprehension questions answered correctly of 5
after listening to a text read aloud by the assessor (only for non-
readers)
Reading
Comprehension
Number of comprehension questions answered correctly of 5
after reading a text read aloud (only for readers)
All students were also given a numeracy test covering three conceptual areas: numbers and
operations, geometry, and measurement. Although specific learning outcomes for children in
the early grades vary from country to country, these conceptual areas are universal areas
within mathematics that children in the first few years of school learn (NAEYC and NCTM, 2002 and NCTM, 2000). Each of these conceptual areas was broken down into a number of
sub-tests: for number and operations, students were tested on counting aloud to 100, skip
counting by 5s to 50, counting backward from 10 to 1, number identification of six numbers
between 1-19 and six numbers between 20-100, number discrimination among five sets of four
numbers 1-100, identification of eight missing numbers between 1-100, 10 timed addition
problems, 10 timed subtraction problems, and four word problems. For three supplementary
addition and three supplementary subtraction problems, assessors were also trained to
administer an authentic assessment of children’s skills – that is, identifying which strategies and
tools students use to solve addition and subtraction problems.
To test geometry, students were asked nine questions about identifying shapes and items from
their lives that resembled certain shapes. To test measurement, students were asked four
questions about four straws of varying lengths during which assessors noted when students
demonstrated a ‘check’ (by lining up the straws, for example). Also for measurement, students
were asked three questions linking activities to time of day, asked to identify the days of the
week, and to identify the months of the year. All sub-tests and assessment instructions were
given in Bangla. The numeracy assessment was administered before the literacy assessment.
Table 6 below outlines the different components of the numeracy assessment.
4 When 30 seconds had elapsed since the children began reading the connected text, assessors were instructed to
quickly calculate if the children had read at least five words correctly. Children who had read at least five words correctly in 30 seconds (hereafter referred to as readers) were allowed to continue reading until they finished the text. Children who had not read at least five words correctly in 30 seconds (hereafter referred to as nonreaders) were stopped by the assessors, at which point the assessors read the passage to them and asked the same set of comprehension questions for a test of listening comprehension.
18
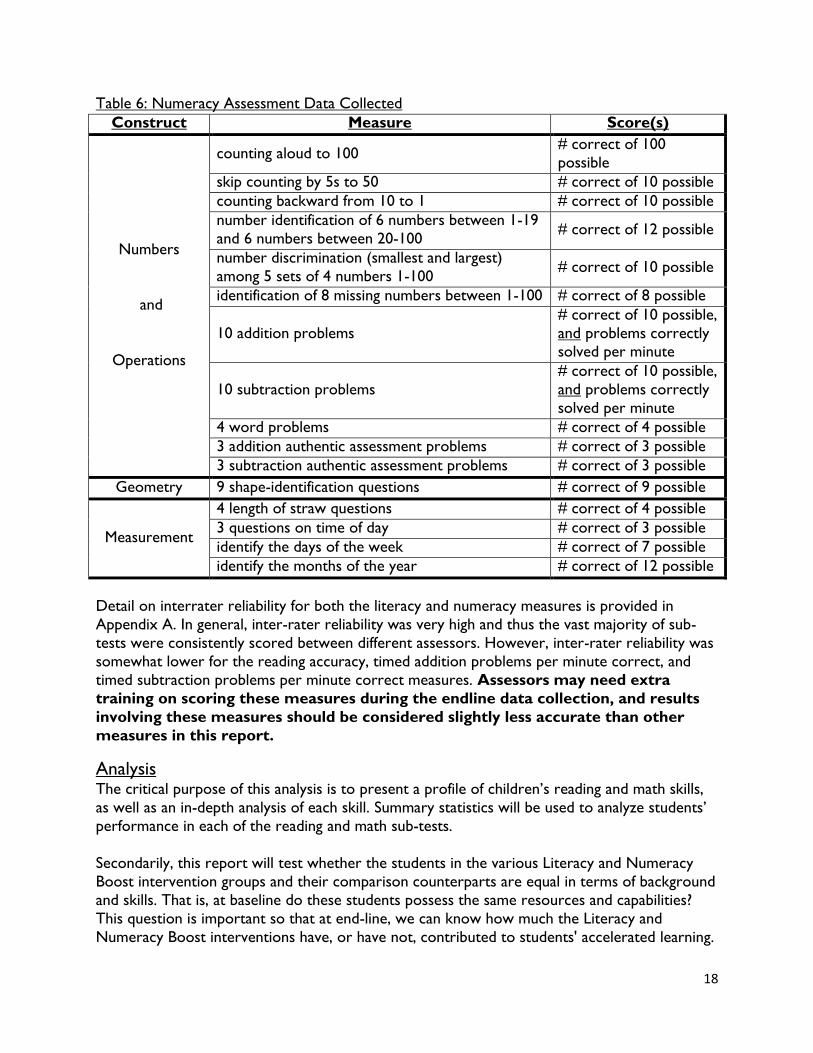
Table 6: Numeracy Assessment Data Collected
Construct Measure Score(s)
Numbers
and
Operations
counting aloud to 100 # correct of 100
possible
skip counting by 5s to 50 # correct of 10 possible
counting backward from 10 to 1 # correct of 10 possible
number identification of 6 numbers between 1-19
and 6 numbers between 20-100 # correct of 12 possible
number discrimination (smallest and largest)
among 5 sets of 4 numbers 1-100 # correct of 10 possible
identification of 8 missing numbers between 1-100 # correct of 8 possible
10 addition problems
# correct of 10 possible,
and problems correctly
solved per minute
10 subtraction problems
# correct of 10 possible,
and problems correctly
solved per minute
4 word problems # correct of 4 possible
3 addition authentic assessment problems # correct of 3 possible
3 subtraction authentic assessment problems # correct of 3 possible
Geometry 9 shape-identification questions # correct of 9 possible
Measurement
4 length of straw questions # correct of 4 possible
3 questions on time of day # correct of 3 possible
identify the days of the week # correct of 7 possible
identify the months of the year # correct of 12 possible
Detail on interrater reliability for both the literacy and numeracy measures is provided in
Appendix A. In general, inter-rater reliability was very high and thus the vast majority of sub-
tests were consistently scored between different assessors. However, inter-rater reliability was
somewhat lower for the reading accuracy, timed addition problems per minute correct, and
timed subtraction problems per minute correct measures. Assessors may need extra
training on scoring these measures during the endline data collection, and results
involving these measures should be considered slightly less accurate than other
measures in this report.
Analysis The critical purpose of this analysis is to present a profile of children’s reading and math skills,
as well as an in-depth analysis of each skill. Summary statistics will be used to analyze students’
performance in each of the reading and math sub-tests.
Secondarily, this report will test whether the students in the various Literacy and Numeracy
Boost intervention groups and their comparison counterparts are equal in terms of background
and skills. That is, at baseline do these students possess the same resources and capabilities?
This question is important so that at end-line, we can know how much the Literacy and
Numeracy Boost interventions have, or have not, contributed to students' accelerated learning.
19
To test the comparability of students in the samples, this report will use Tukey-Krammer post-
hoc pairwise comparison techniques and comparison of means through t-tests, with clustered
standard errors to account for the grouping of student-level data within schools. Finally, this
report will look to multilevel regression models to explore relationships between literacy skills
and student background characteristics, school environment, and home literacy & numeracy
environment.
Children’s Background
Overall
The students are about eight years old on average, and all students speak Bangla as their native
tongue. Sixty percent have attended some form of early-childhood development (ECD)
program, the most common programs being BRAC (28%), Islamic Foundation (13%), and SC
pre-primary (13%). Forty-three percent of students report having repeated at least one grade.
Almost no students have repeated their ECD program, but 31% repeated grade 1 and 12%
repeated grade 2. Fourteen percent of students report having changed schools at some point.
Of those who have changed schools, children most commonly cite the wishes of their guardian
(63%) as the reason, followed by the lack of upper grades at their old school (15%). Almost a
third of students report that it takes them a long time to arrive at school from their homes, and
the same proportion report having missed at least one day of school in the week prior to the
assessment. Among those who report having missed school in the previous week, the most
common reasons given were for leisure (40%), illness (27%), and school closure (20%).
On average, students live with three other family members and report having only one of four more valuable household assets (electricity, refrigerator, television, and motorbike) and three
of five less valuable household assets (bike, goats, cows, poultry, and land). The most prevalent
household asset is land (83%) and the least common is a refrigerator (3%). More than half of
students live in a house made of superior construction materials (pacca, or banana leaves) with
most other students living in houses made of bamboo, soil, or tin.
In terms of children’s time, the majority of students do chores (88%), and spend a little time on
chores in the morning, afternoon, and evening but slightly more time on weekends. On average,
children perform about two types of chores, the most common chores being helping a family
member with work (67%) and cleaning (41%); and the least common are working in the
fields/farming (3%), working in the market (5%), and caring for children (6%). On average
children report spending more than 2.5 hours studying each day. For detailed tables on student
background variables, see Appendix B.
Important Differences between Sample Groups Regarding differences between the two upazilas of Meherpur Sadar and Gangni, students are
significantly older in Gangni than Meherpur Sadar, and significantly less likely to have previously
attended an ECD program. Gangni students spend more time doing chores/work in the evening
and morning, and may spend more time on chores overall. They also appear to spend less time
studying than the Meherpur Sadar students. In terms of types of chores, children are more
likely to cook or work in the market in Meherpur Sadar than Gangni but more likely to help
20
their families with work in Gangni. Given the pattern of differences between Meherpur
Sadar and Gangni, these two upazilas should be analyzed separately during endline
impact analysis, and this baseline report will also examine the two upazilas
separately, taking a careful look at comparisons and dynamics within upazilas.
Within the Gangni upazila, children are more likely to report that it takes them a ‘long time’ to
arrive at school in the Numeracy Boost and mixed sample groups (32-33%) than in the
comparison group (22%). The mixed sample group was significantly much more likely to report
that school was closed in the week prior to assessment (17%) than the Numeracy Boost only
group (9%). Within the Meherpur Sadar upazila, the only difference between Numeracy Boost
and comparison groups is that the Numeracy Boost group is significantly more likely to work in
the market. On the whole, it appears that within upazilas, the sample groups are
remarkably similar to each other. This indicates that randomization of assignment
to sample groups was successful, and that the groups are sufficiently comparable
for a difference-in-difference impact analysis at endline, controlling for the small
number of observed differences.
Sex Differences
Boys are older by half a year on average than girls (8.5 years versus 8 years) and significantly
more likely to have changed schools than girls (16% versus 12%). Girls are more likely to have
attended BRAC ECD program than boys (32% versus 25%). Boys more often report missing
school due to illness (10% versus 7%) and due to work (4% versus 1%), but girls are more likely
to report missing school due to leisure (15% versus 11%).
Significantly more girls report doing chores (90%) than boys (85%); and girls report doing both
more types of chores (2 types of chores versus 1.6 for boys) as well as spending a longer
amount of time on chores (3.4 on an 8-point scale5 versus 3.2 for boys). Boys and girls clearly have different jobs: significantly more girls report cooking, cleaning and watching children while
significantly more boys report helping their families with work, tending animals, farming and
field work, and working in the market. Girls work significantly more time in the morning than
do boys, but at other times of the day and week their chore and workloads are similar. Finally,
girls report spending significantly more time studying per day than boys (165 minutes versus
158 minutes). These differences may inform attempts to achieve equitable literacy
and numeracy outcomes between boys and girls. Utilizing the information about
why boys and girls miss school, the fact that girls appear to do more chores more
frequently than boys, and the different types of chores done by boys and girls can
provide clues as to the most effective suggestions to provide parents for how they
can integrate literacy and numeracy practice into their children’s routines. For
example, when targeting improvements in girls’ numeracy skills, parental
awareness can suggest having talking to girls about measurement, quantity, and
estimation when cooking. Math Camps can teach children simple math-reinforcing
games that girls can use when they are caring for their younger siblings.
5 The question was “How much time do you spent on chores in the ____?” for each of morning, afternoon,
evening, and weekends. Assessors gave children three options: no time (0), a little time (1), or a lot of time (2).
21
39.2
0
5
10
15
20
25
30
35
40
45
50
Average for all groups
Ban
gla
lett
er
corr
ect
Figure 1: Letter Identification
Students’ Reading Skills This section considers children’s performance on each of the reading skills that comprised the
literacy assessment, comparing student average scores in the five different sample groups for
each skill. The comparisons, displayed graphically, take place on two levels: between upazilas,
and between sample groups within upaliza. On the first level, the average score for both
upazilas is shown together where there are no statistically significant differences between
upazilas. However, where the average score was statistically different between upazilas, the
averages for Meherpur Sadar and Gangni are shown separately. The second level of comparison
is only presented when the scores were statistically significant different between sample groups
within the upazila.
Letter Identification
This sub-test examined learners’
letter awareness. Learners were
shown a chart of all 50 Bangla
letters and asked to either give the
name of the letter, pronounce the
letter sound, or give a word that
begins with that letter. On average,
all groups together correctly
identified 39 of the 50 letters. A
subset of children comprising 12%
of the sample could identify less
than 50% of the letters, and 5% of
children could not identify any letters. This deficiency in
children’s letter knowledge
will negatively impact their ability to decode words and ultimately to read. The
Literacy Boost program should prioritize letter awareness as a critical area for
teachers and community action facilitators to focus on.
The most difficult letters, for which less than 60% of children correctly identified, were: s, t, X,
o, r, and p. These letters are all consonants that are never used as the first letter of any words,
and in fact are not commonly used. Children may have had difficulty with these letters as they
tend to be mostly familiar with letters that usually produce the first sound of a word. The next
most difficult letters, for which between 60-70% of children correctly identified, were W, J, O,
H, h, T, and F. These letters contain one vowel (F) that has an alternative letter (i) in
consonant form; they are also not commonly used letters in everyday life. The easiest letters
for children, for which over 90% of students correctly identified, were P, c, R, Z, j, A, g, B,
k, Av, and K. To ensure children learn all of their letters as early as possible, moving
forward Literacy Boost should help teachers and community action facilitators
focus on the most difficult letters (W, J, O, H, h, T, F, P, c, R, Z, j, A, g, B, k, Av, and
K) as well as give teachers the tools to conduct effective formative assessment in
order to better target the specific deficiencies of the children in their classroom.
Benchmark: 47 letters
22
9.2
0
2
4
6
8
10
12
14
16
18
20
Average for all groups
Mo
st u
sed
wo
rds
corr
ect
Figure 3: Most Used Words
Benchmark: 16 words
*Statistically significant difference between groups at the 5% level
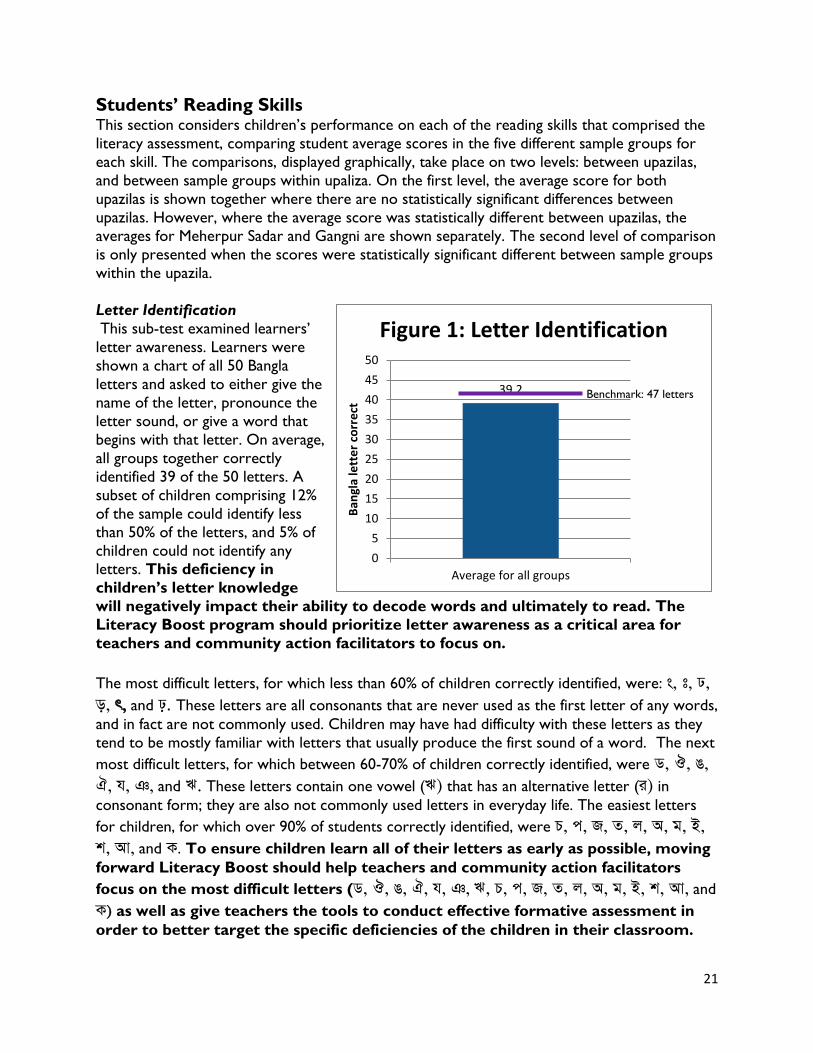
There were no noteworthy differences between upazilas, but as Figure 2 shows within the
Gangni upazila the Numeracy Boost group identified significantly less letters than the mixed
intervention group. Thus, baseline letter score should be controlled for at endline
when conducting impact analysis.
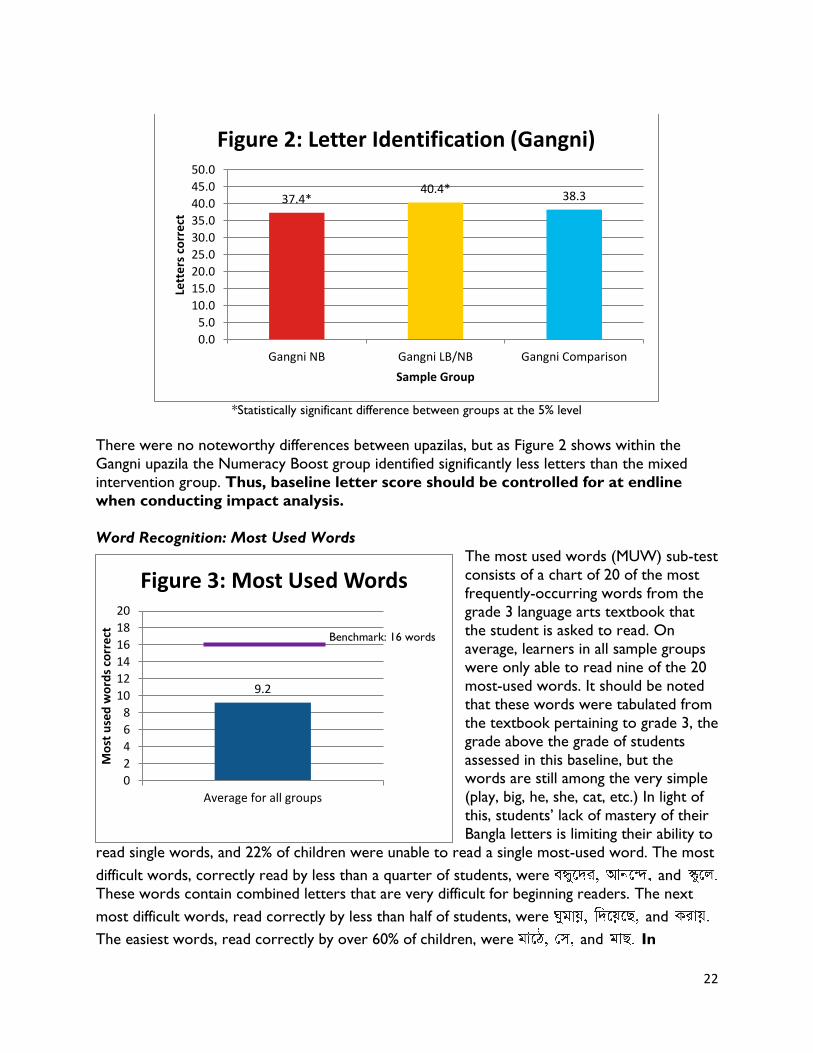
Word Recognition: Most Used Words
The most used words (MUW) sub-test
consists of a chart of 20 of the most
frequently-occurring words from the
grade 3 language arts textbook that
the student is asked to read. On
average, learners in all sample groups
were only able to read nine of the 20
most-used words. It should be noted
that these words were tabulated from
the textbook pertaining to grade 3, the
grade above the grade of students
assessed in this baseline, but the words are still among the very simple
(play, big, he, she, cat, etc.) In light of
this, students’ lack of mastery of their
Bangla letters is limiting their ability to
read single words, and 22% of children were unable to read a single most-used word. The most
difficult words, correctly read by less than a quarter of students, were and
These words contain combined letters that are very difficult for beginning readers. The next
most difficult words, read correctly by less than half of students, were and
The easiest words, read correctly by over 60% of children, were and In
37.4* 40.4*
38.3
0.0
5.0
10.0
15.0
20.0
25.0
30.0
35.0
40.0
45.0
50.0
Gangni NB Gangni LB/NB Gangni Comparison
Lett
ers
co
rre
ct
Sample Group
Figure 2: Letter Identification (Gangni)
23
6.5
0
2
4
6
8
10
12
14
16
18
20
Average for all groups
Pse
ud
o w
ord
s co
rre
ct
Figure 5: Pseudo Words
Benchmark: 12 words
addition to emphasizing letter awareness, Literacy Boost should train teachers in
effective phonological awareness and decoding instructional techniques in order to
build children’s ability to read words from letters as they increase their letter
knowledge.
*Statistically significant difference between groups at the 5% level
There were no noteworthy differences between upazilas, but as Figure 4 shows within the
Gangni upazila the comparison group identified significantly less words than the mixed
intervention group. Thus, baseline most-used words score should be controlled for at
endline when conducting impact analysis.
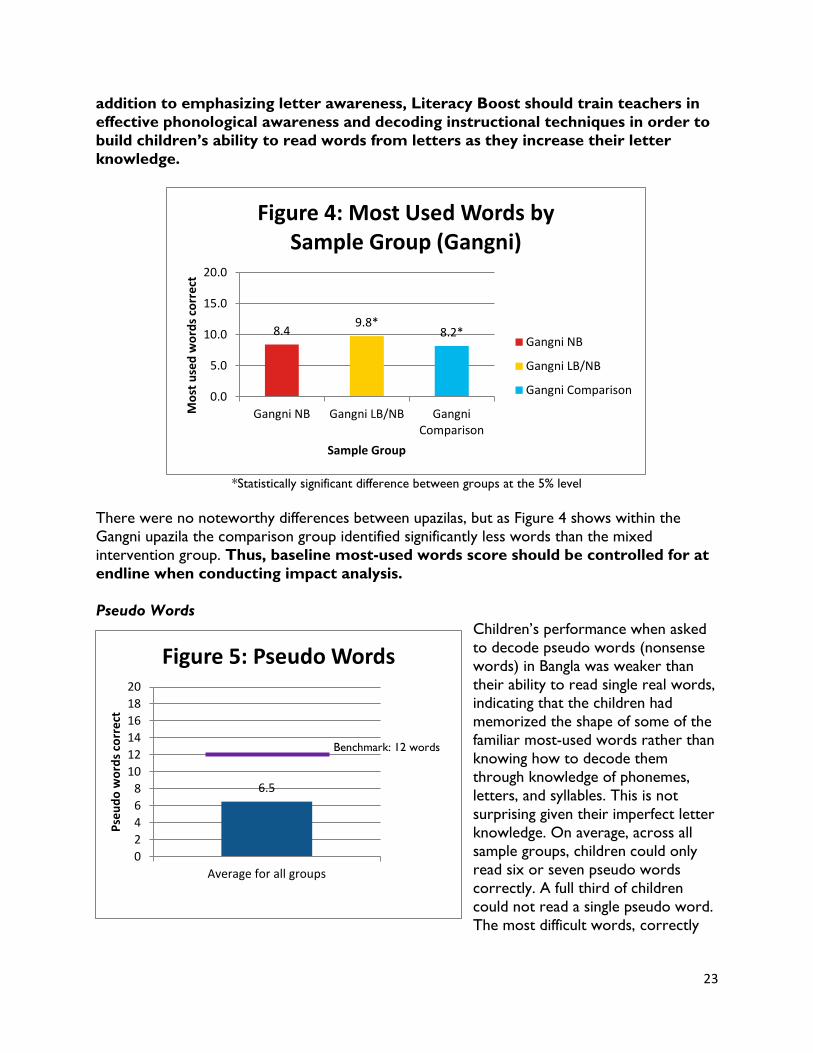
Pseudo Words
Children’s performance when asked
to decode pseudo words (nonsense
words) in Bangla was weaker than
their ability to read single real words, indicating that the children had
memorized the shape of some of the
familiar most-used words rather than
knowing how to decode them
through knowledge of phonemes,
letters, and syllables. This is not
surprising given their imperfect letter
knowledge. On average, across all
sample groups, children could only
read six or seven pseudo words
correctly. A full third of children
could not read a single pseudo word.
The most difficult words, correctly
8.4 9.8*
8.2*
0.0
5.0
10.0
15.0
20.0
Gangni NB Gangni LB/NB GangniComparison
Mo
st u
sed
wo
rds
corr
ect
Sample Group
Figure 4: Most Used Words by Sample Group (Gangni)
Gangni NB
Gangni LB/NB
Gangni Comparison
24
read by less than a quarter of children, were
and The least difficult words, read by over 40% of children, were
and There were no statistically significant differences either between upazilas or within
upazilas. Again, Literacy Boost should give children improved explicit instruction
and practice in phonological awareness and decoding skills as they work toward mastering their letters.
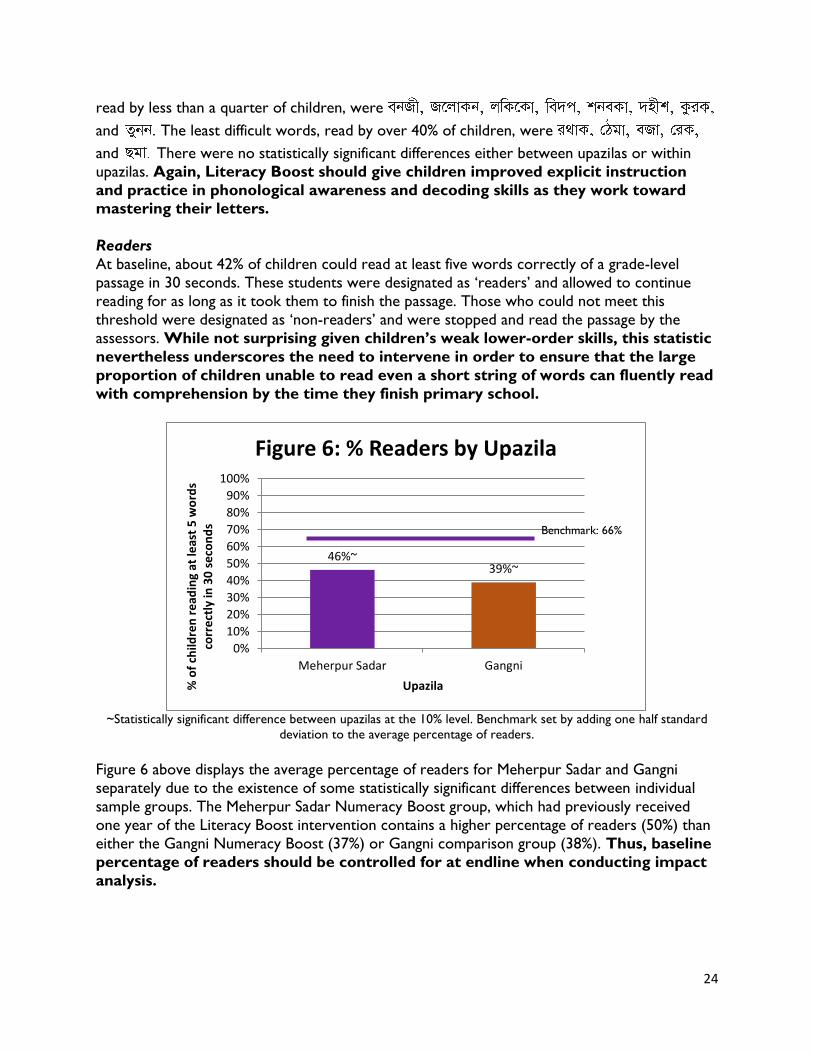
Readers
At baseline, about 42% of children could read at least five words correctly of a grade-level
passage in 30 seconds. These students were designated as ‘readers’ and allowed to continue
reading for as long as it took them to finish the passage. Those who could not meet this
threshold were designated as ‘non-readers’ and were stopped and read the passage by the
assessors. While not surprising given children’s weak lower-order skills, this statistic
nevertheless underscores the need to intervene in order to ensure that the large
proportion of children unable to read even a short string of words can fluently read
with comprehension by the time they finish primary school.
~Statistically significant difference between upazilas at the 10% level. Benchmark set by adding one half standard
deviation to the average percentage of readers.
Figure 6 above displays the average percentage of readers for Meherpur Sadar and Gangni
separately due to the existence of some statistically significant differences between individual
sample groups. The Meherpur Sadar Numeracy Boost group, which had previously received
one year of the Literacy Boost intervention contains a higher percentage of readers (50%) than
either the Gangni Numeracy Boost (37%) or Gangni comparison group (38%). Thus, baseline
percentage of readers should be controlled for at endline when conducting impact
analysis.
46%~ 39%~
0%
10%
20%
30%
40%
50%
60%
70%
80%
90%
100%
Meherpur Sadar Gangni
% o
f ch
ildre
n r
ead
ing
at le
ast
5 w
ord
s co
rre
ctly
in 3
0 s
eco
nd
s
Upazila
Figure 6: % Readers by Upazila
Benchmark: 66%
25
Listening Comprehension
Students in the nonreader category were asked the full list of ten comprehension questions
(one summary question, six literal comprehension questions, two inferential comprehension
questions, and one evaluative question) after the assessor read the passage to the student, for a
measure of listening comprehension. The one summary question asked children what the story
was about, and children’s responses are marked correct if they mentioned at least three of four
main points of the story (characters, problem, action, resolution). The six literal questions
asked children about information that was directly available in the text, questions like "What
was the name of the main character?" and "Where did the main character go?" and the two
inferential questions asked children about information that was indirectly available in the text.
Finally, the one evaluative question asked children for their opinion of the text, and children’s
responses were scored correctly if they justified their opinion with information from the text.
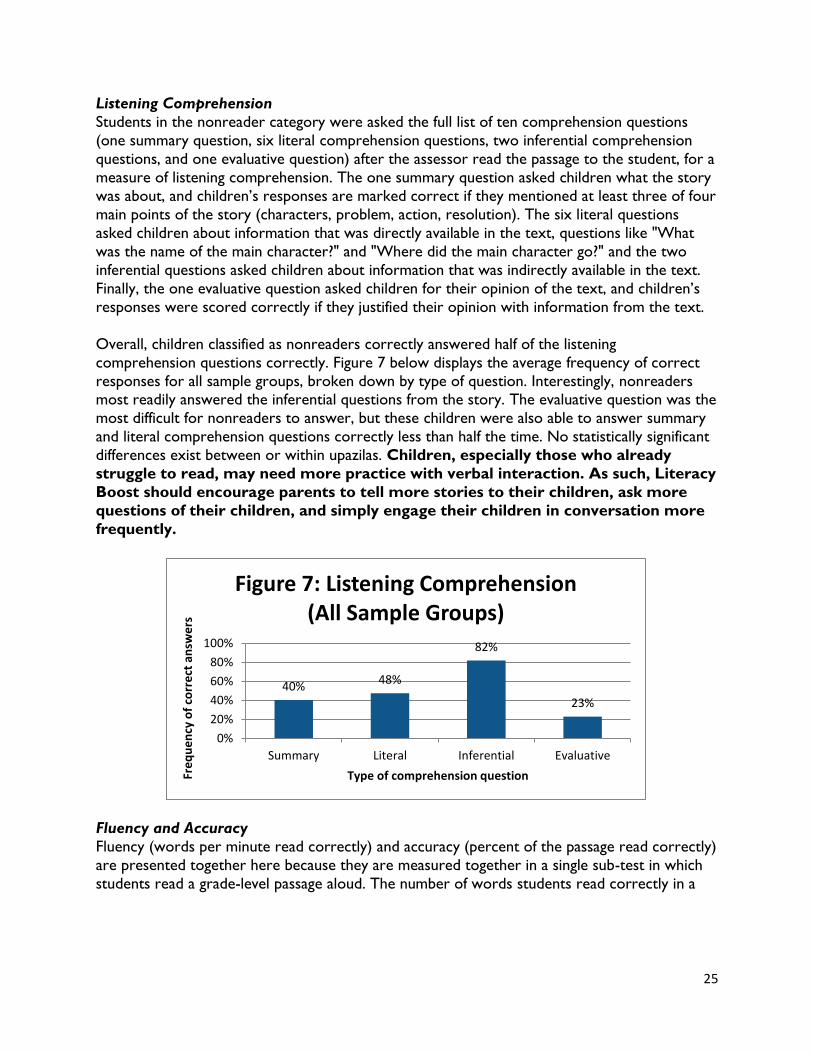
Overall, children classified as nonreaders correctly answered half of the listening
comprehension questions correctly. Figure 7 below displays the average frequency of correct
responses for all sample groups, broken down by type of question. Interestingly, nonreaders most readily answered the inferential questions from the story. The evaluative question was the
most difficult for nonreaders to answer, but these children were also able to answer summary
and literal comprehension questions correctly less than half the time. No statistically significant
differences exist between or within upazilas. Children, especially those who already
struggle to read, may need more practice with verbal interaction. As such, Literacy
Boost should encourage parents to tell more stories to their children, ask more
questions of their children, and simply engage their children in conversation more
frequently.
Fluency and Accuracy
Fluency (words per minute read correctly) and accuracy (percent of the passage read correctly)
are presented together here because they are measured together in a single sub-test in which
students read a grade-level passage aloud. The number of words students read correctly in a
40% 48%
82%
23%
0%
20%
40%
60%
80%
100%
Summary Literal Inferential Evaluative
Fre
qu
en
cy o
f co
rre
ct a
nsw
ers
Type of comprehension question
Figure 7: Listening Comprehension (All Sample Groups)
26
minute, calculated from their progress at 30 seconds,6 is tracked for fluency. As the student
continues to read after the first minute, the total number of words read correctly from the
passage as a whole, no matter how long it takes the student, is computed for accuracy.
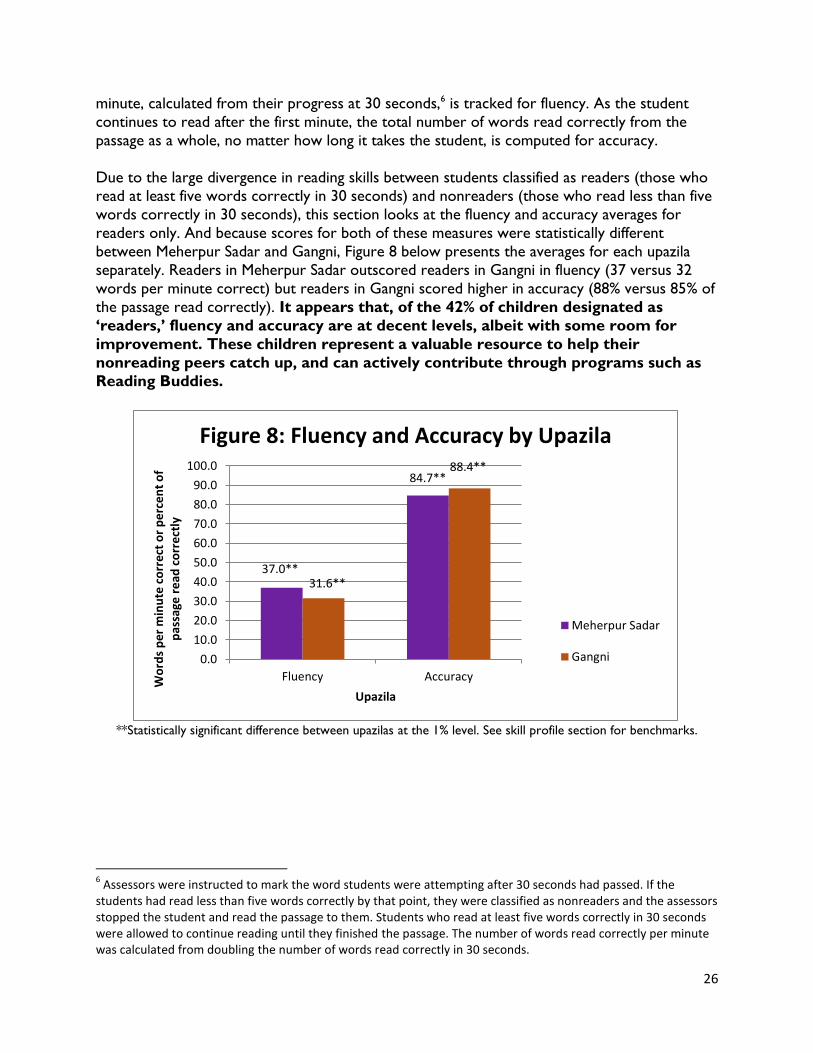
Due to the large divergence in reading skills between students classified as readers (those who
read at least five words correctly in 30 seconds) and nonreaders (those who read less than five
words correctly in 30 seconds), this section looks at the fluency and accuracy averages for
readers only. And because scores for both of these measures were statistically different
between Meherpur Sadar and Gangni, Figure 8 below presents the averages for each upazila
separately. Readers in Meherpur Sadar outscored readers in Gangni in fluency (37 versus 32
words per minute correct) but readers in Gangni scored higher in accuracy (88% versus 85% of
the passage read correctly). It appears that, of the 42% of children designated as
‘readers,’ fluency and accuracy are at decent levels, albeit with some room for
improvement. These children represent a valuable resource to help their
nonreading peers catch up, and can actively contribute through programs such as
Reading Buddies.
**Statistically significant difference between upazilas at the 1% level. See skill profile section for benchmarks.
6 Assessors were instructed to mark the word students were attempting after 30 seconds had passed. If the
students had read less than five words correctly by that point, they were classified as nonreaders and the assessors stopped the student and read the passage to them. Students who read at least five words correctly in 30 seconds were allowed to continue reading until they finished the passage. The number of words read correctly per minute was calculated from doubling the number of words read correctly in 30 seconds.
37.0**
84.7**
31.6**
88.4**
0.0
10.0
20.0
30.0
40.0
50.0
60.0
70.0
80.0
90.0
100.0
Fluency Accuracy
Wo
rds
pe
r m
inu
te c
orr
ect
or
pe
rce
nt
of
pas
sage
re
ad c
orr
ect
ly
Upazila
Figure 8: Fluency and Accuracy by Upazila
Meherpur Sadar
Gangni
27
5.6
0.0
2.0
4.0
6.0
8.0
10.0
Average for all groups
Co
mp
reh
en
sio
n q
ue
stio
ns
corr
ect
Figure 10: Reading Comprehension
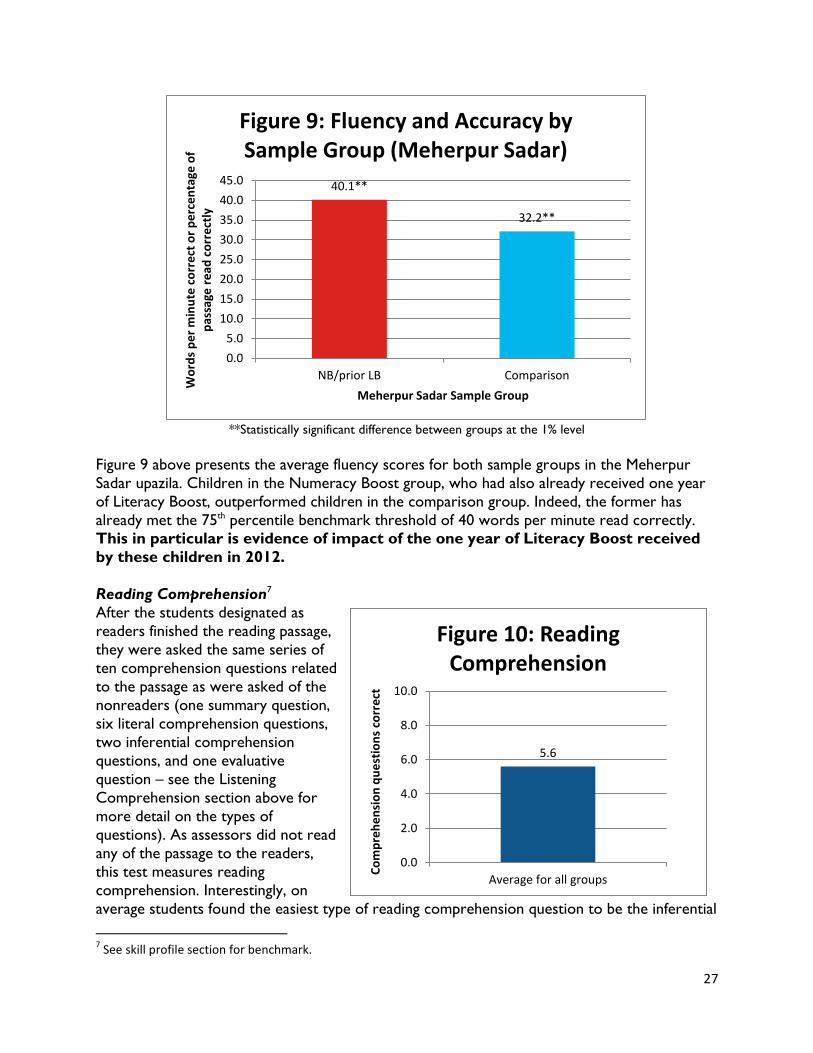
**Statistically significant difference between groups at the 1% level
Figure 9 above presents the average fluency scores for both sample groups in the Meherpur
Sadar upazila. Children in the Numeracy Boost group, who had also already received one year
of Literacy Boost, outperformed children in the comparison group. Indeed, the former has
already met the 75th percentile benchmark threshold of 40 words per minute read correctly. This in particular is evidence of impact of the one year of Literacy Boost received
by these children in 2012.
Reading Comprehension7
After the students designated as
readers finished the reading passage,
they were asked the same series of
ten comprehension questions related
to the passage as were asked of the
nonreaders (one summary question,
six literal comprehension questions,
two inferential comprehension
questions, and one evaluative
question – see the Listening
Comprehension section above for
more detail on the types of
questions). As assessors did not read
any of the passage to the readers,
this test measures reading
comprehension. Interestingly, on
average students found the easiest type of reading comprehension question to be the inferential
7 See skill profile section for benchmark.
40.1**
32.2**
0.0
5.0
10.0
15.0
20.0
25.0
30.0
35.0
40.0
45.0
NB/prior LB Comparison
Wo
rds
pe
r m
inu
te c
orr
ect
or
pe
rce
nta
ge o
f p
assa
ge r
ead
co
rre
ctly
Meherpur Sadar Sample Group
Figure 9: Fluency and Accuracy by Sample Group (Meherpur Sadar)
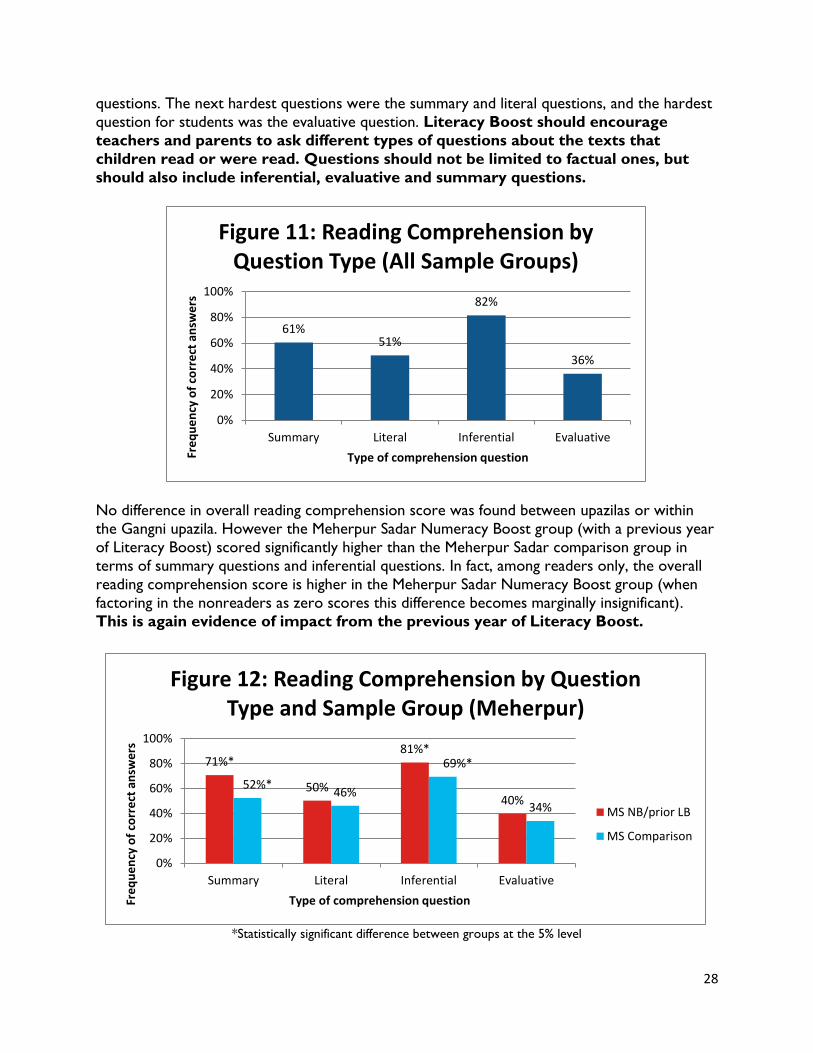
28
questions. The next hardest questions were the summary and literal questions, and the hardest
question for students was the evaluative question. Literacy Boost should encourage
teachers and parents to ask different types of questions about the texts that
children read or were read. Questions should not be limited to factual ones, but
should also include inferential, evaluative and summary questions.
No difference in overall reading comprehension score was found between upazilas or within
the Gangni upazila. However the Meherpur Sadar Numeracy Boost group (with a previous year
of Literacy Boost) scored significantly higher than the Meherpur Sadar comparison group in
terms of summary questions and inferential questions. In fact, among readers only, the overall
reading comprehension score is higher in the Meherpur Sadar Numeracy Boost group (when
factoring in the nonreaders as zero scores this difference becomes marginally insignificant).
This is again evidence of impact from the previous year of Literacy Boost.
*Statistically significant difference between groups at the 5% level
61% 51%
82%
36%
0%
20%
40%
60%
80%
100%
Summary Literal Inferential Evaluative
Fre
qu
en
cy o
f co
rre
ct a
nsw
ers
Type of comprehension question
Figure 11: Reading Comprehension by Question Type (All Sample Groups)
71%*
50%
81%*
40% 52%*
46%
69%*
34%
0%
20%
40%
60%
80%
100%
Summary Literal Inferential Evaluative
Fre
qu
en
cy o
f co
rre
ct a
nsw
ers
Type of comprehension question
Figure 12: Reading Comprehension by Question Type and Sample Group (Meherpur)
MS NB/prior LB
MS Comparison
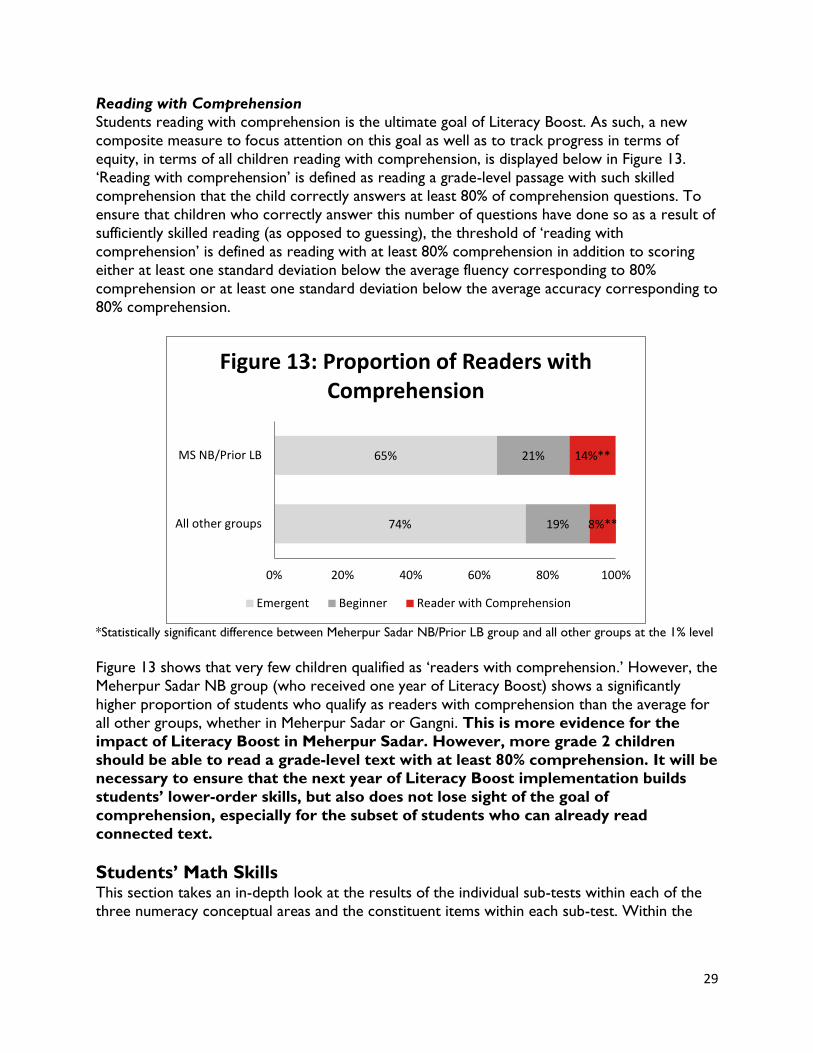
29
Reading with Comprehension
Students reading with comprehension is the ultimate goal of Literacy Boost. As such, a new
composite measure to focus attention on this goal as well as to track progress in terms of
equity, in terms of all children reading with comprehension, is displayed below in Figure 13.
‘Reading with comprehension’ is defined as reading a grade-level passage with such skilled
comprehension that the child correctly answers at least 80% of comprehension questions. To
ensure that children who correctly answer this number of questions have done so as a result of
sufficiently skilled reading (as opposed to guessing), the threshold of ‘reading with
comprehension’ is defined as reading with at least 80% comprehension in addition to scoring
either at least one standard deviation below the average fluency corresponding to 80%
comprehension or at least one standard deviation below the average accuracy corresponding to
80% comprehension.
*Statistically significant difference between Meherpur Sadar NB/Prior LB group and all other groups at the 1% level
Figure 13 shows that very few children qualified as ‘readers with comprehension.’ However, the
Meherpur Sadar NB group (who received one year of Literacy Boost) shows a significantly
higher proportion of students who qualify as readers with comprehension than the average for
all other groups, whether in Meherpur Sadar or Gangni. This is more evidence for the
impact of Literacy Boost in Meherpur Sadar. However, more grade 2 children
should be able to read a grade-level text with at least 80% comprehension. It will be necessary to ensure that the next year of Literacy Boost implementation builds
students’ lower-order skills, but also does not lose sight of the goal of
comprehension, especially for the subset of students who can already read
connected text.
Students’ Math Skills This section takes an in-depth look at the results of the individual sub-tests within each of the
three numeracy conceptual areas and the constituent items within each sub-test. Within the
74%
65%
19%
21%
8%**
14%**
0% 20% 40% 60% 80% 100%
All other groups
MS NB/Prior LB
Figure 13: Proportion of Readers with Comprehension
Emergent Beginner Reader with Comprehension
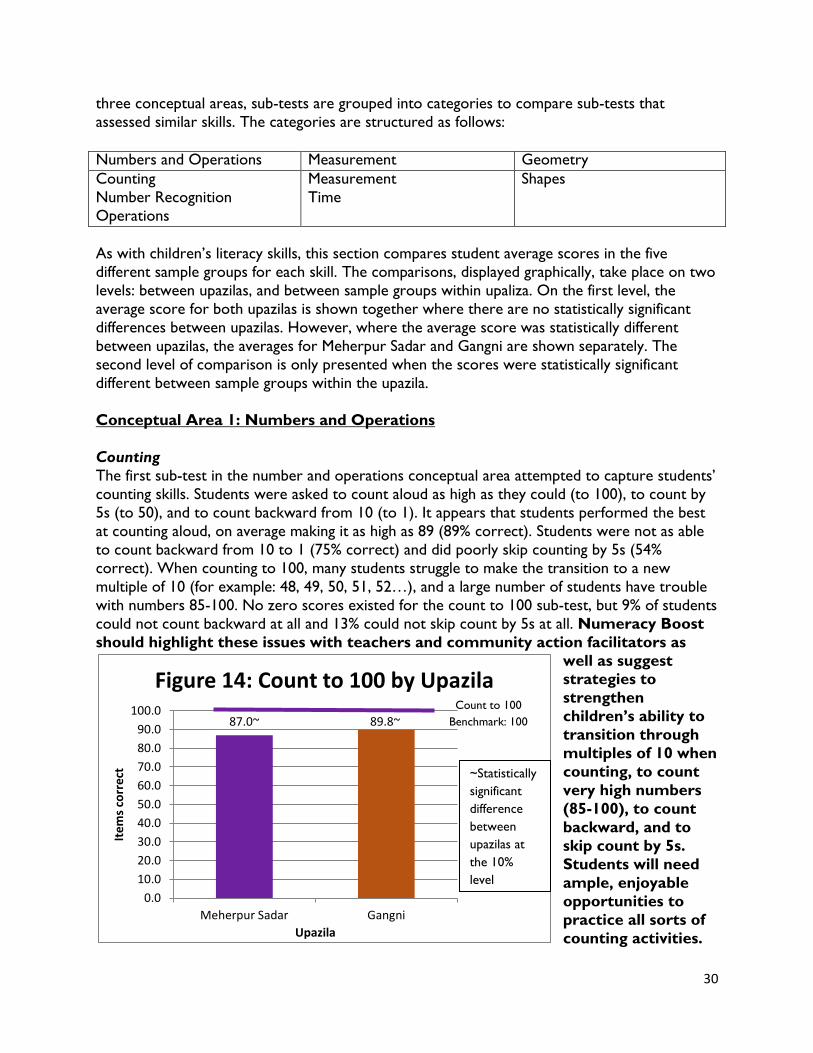
30
87.0~ 89.8~
0.0
10.0
20.0
30.0
40.0
50.0
60.0
70.0
80.0
90.0
100.0
Meherpur Sadar Gangni
Ite
ms
corr
ect
Upazila
Figure 14: Count to 100 by Upazila Count to 100
Benchmark: 100
three conceptual areas, sub-tests are grouped into categories to compare sub-tests that
assessed similar skills. The categories are structured as follows:
Numbers and Operations Measurement Geometry
Counting
Number Recognition
Operations
Measurement
Time
Shapes
As with children’s literacy skills, this section compares student average scores in the five
different sample groups for each skill. The comparisons, displayed graphically, take place on two
levels: between upazilas, and between sample groups within upaliza. On the first level, the
average score for both upazilas is shown together where there are no statistically significant
differences between upazilas. However, where the average score was statistically different
between upazilas, the averages for Meherpur Sadar and Gangni are shown separately. The
second level of comparison is only presented when the scores were statistically significant
different between sample groups within the upazila.
Conceptual Area 1: Numbers and Operations
Counting
The first sub-test in the number and operations conceptual area attempted to capture students’
counting skills. Students were asked to count aloud as high as they could (to 100), to count by
5s (to 50), and to count backward from 10 (to 1). It appears that students performed the best
at counting aloud, on average making it as high as 89 (89% correct). Students were not as able
to count backward from 10 to 1 (75% correct) and did poorly skip counting by 5s (54%
correct). When counting to 100, many students struggle to make the transition to a new
multiple of 10 (for example: 48, 49, 50, 51, 52…), and a large number of students have trouble
with numbers 85-100. No zero scores existed for the count to 100 sub-test, but 9% of students
could not count backward at all and 13% could not skip count by 5s at all. Numeracy Boost
should highlight these issues with teachers and community action facilitators as
well as suggest strategies to
strengthen
children’s ability to
transition through
multiples of 10 when
counting, to count
very high numbers
(85-100), to count
backward, and to
skip count by 5s.
Students will need
ample, enjoyable
opportunities to
practice all sorts of
counting activities.
~Statistically
significant
difference
between
upazilas at
the 10%
level
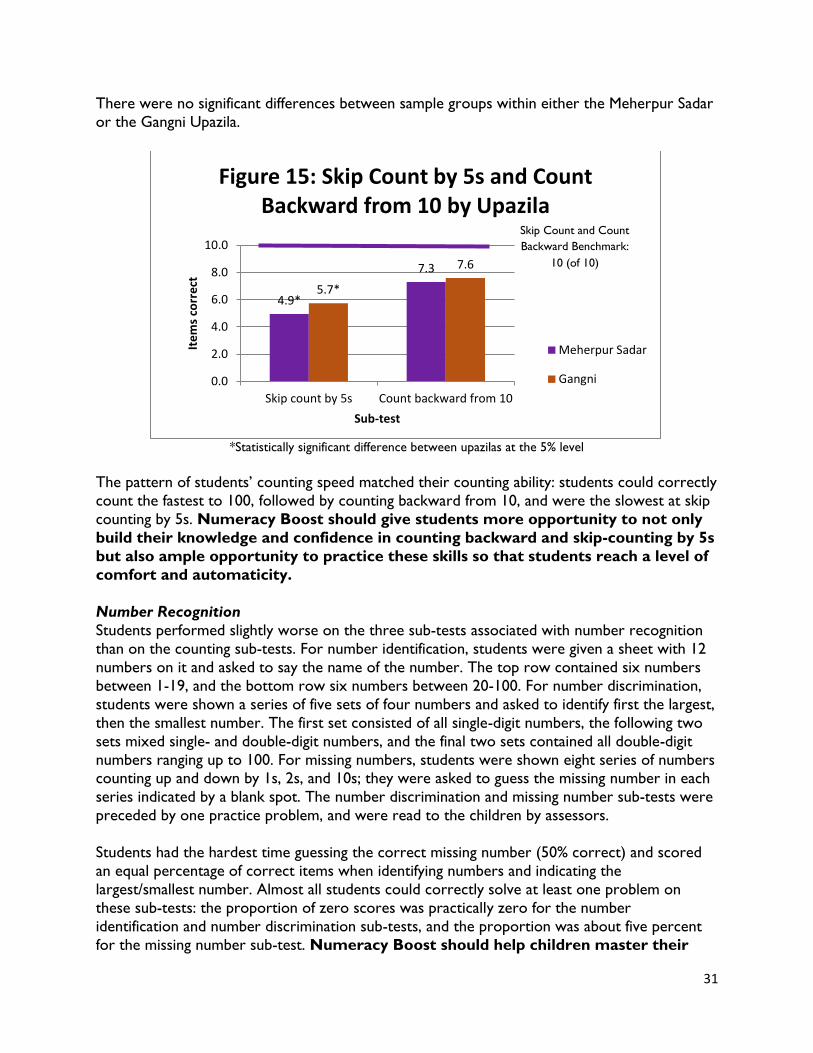
31
There were no significant differences between sample groups within either the Meherpur Sadar
or the Gangni Upazila.
*Statistically significant difference between upazilas at the 5% level
The pattern of students’ counting speed matched their counting ability: students could correctly
count the fastest to 100, followed by counting backward from 10, and were the slowest at skip
counting by 5s. Numeracy Boost should give students more opportunity to not only
build their knowledge and confidence in counting backward and skip-counting by 5s
but also ample opportunity to practice these skills so that students reach a level of
comfort and automaticity.
Number Recognition
Students performed slightly worse on the three sub-tests associated with number recognition
than on the counting sub-tests. For number identification, students were given a sheet with 12
numbers on it and asked to say the name of the number. The top row contained six numbers
between 1-19, and the bottom row six numbers between 20-100. For number discrimination,
students were shown a series of five sets of four numbers and asked to identify first the largest,
then the smallest number. The first set consisted of all single-digit numbers, the following two
sets mixed single- and double-digit numbers, and the final two sets contained all double-digit
numbers ranging up to 100. For missing numbers, students were shown eight series of numbers counting up and down by 1s, 2s, and 10s; they were asked to guess the missing number in each
series indicated by a blank spot. The number discrimination and missing number sub-tests were
preceded by one practice problem, and were read to the children by assessors.
Students had the hardest time guessing the correct missing number (50% correct) and scored
an equal percentage of correct items when identifying numbers and indicating the
largest/smallest number. Almost all students could correctly solve at least one problem on
these sub-tests: the proportion of zero scores was practically zero for the number
identification and number discrimination sub-tests, and the proportion was about five percent
for the missing number sub-test. Numeracy Boost should help children master their
4.9*
7.3
5.7*
7.6
0.0
2.0
4.0
6.0
8.0
10.0
Skip count by 5s Count backward from 10
Ite
ms
corr
ect
Sub-test
Figure 15: Skip Count by 5s and Count Backward from 10 by Upazila
Meherpur Sadar
Gangni
Skip Count and Count
Backward Benchmark:
10 (of 10)
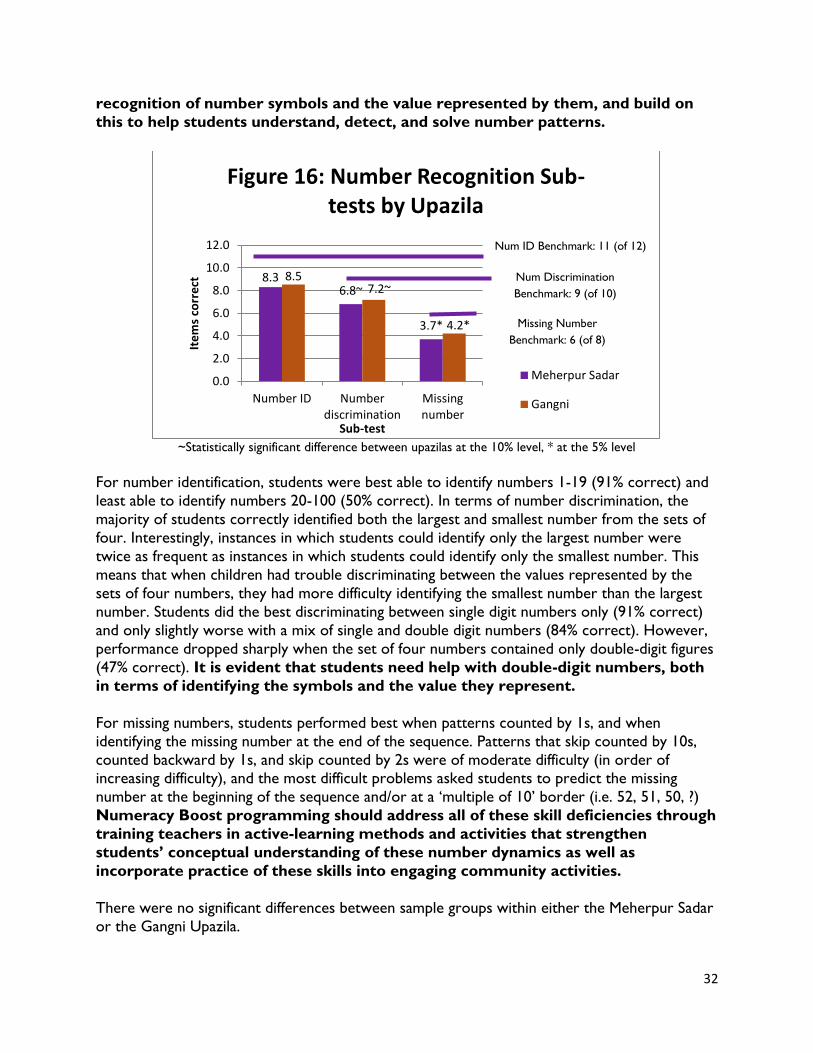
32
recognition of number symbols and the value represented by them, and build on
this to help students understand, detect, and solve number patterns.
~Statistically significant difference between upazilas at the 10% level, * at the 5% level
For number identification, students were best able to identify numbers 1-19 (91% correct) and
least able to identify numbers 20-100 (50% correct). In terms of number discrimination, the
majority of students correctly identified both the largest and smallest number from the sets of
four. Interestingly, instances in which students could identify only the largest number were
twice as frequent as instances in which students could identify only the smallest number. This
means that when children had trouble discriminating between the values represented by the
sets of four numbers, they had more difficulty identifying the smallest number than the largest
number. Students did the best discriminating between single digit numbers only (91% correct)
and only slightly worse with a mix of single and double digit numbers (84% correct). However,
performance dropped sharply when the set of four numbers contained only double-digit figures
(47% correct). It is evident that students need help with double-digit numbers, both
in terms of identifying the symbols and the value they represent.
For missing numbers, students performed best when patterns counted by 1s, and when
identifying the missing number at the end of the sequence. Patterns that skip counted by 10s,
counted backward by 1s, and skip counted by 2s were of moderate difficulty (in order of increasing difficulty), and the most difficult problems asked students to predict the missing
number at the beginning of the sequence and/or at a ‘multiple of 10’ border (i.e. 52, 51, 50, ?)
Numeracy Boost programming should address all of these skill deficiencies through
training teachers in active-learning methods and activities that strengthen
students’ conceptual understanding of these number dynamics as well as
incorporate practice of these skills into engaging community activities.
There were no significant differences between sample groups within either the Meherpur Sadar
or the Gangni Upazila.
8.3 6.8~
3.7*
8.5 7.2~
4.2*
0.0
2.0
4.0
6.0
8.0
10.0
12.0
Number ID Numberdiscrimination
Missingnumber
Ite
ms
corr
ect
Sub-test
Figure 16: Number Recognition Sub-tests by Upazila
Meherpur Sadar
Gangni
Num ID Benchmark: 11 (of 12)
Num Discrimination
Benchmark: 9 (of 10)
Missing Number
Benchmark: 6 (of 8)
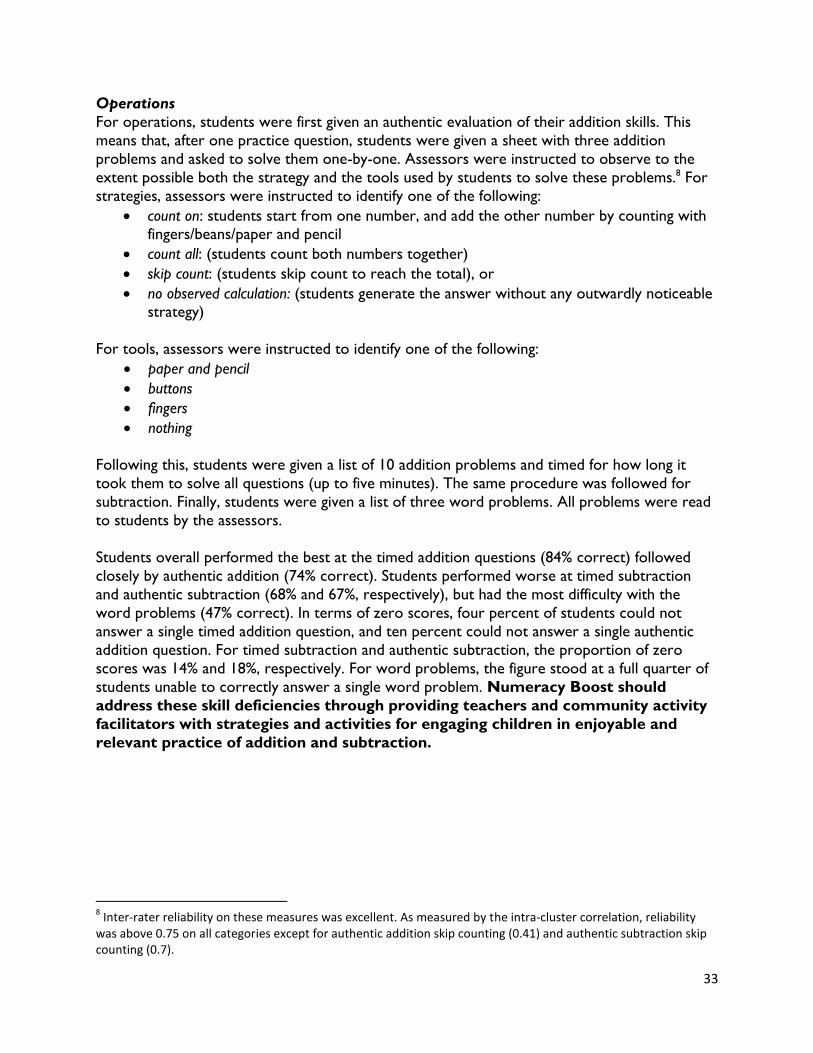
33
Operations
For operations, students were first given an authentic evaluation of their addition skills. This
means that, after one practice question, students were given a sheet with three addition
problems and asked to solve them one-by-one. Assessors were instructed to observe to the
extent possible both the strategy and the tools used by students to solve these problems.8 For
strategies, assessors were instructed to identify one of the following:
count on: students start from one number, and add the other number by counting with fingers/beans/paper and pencil
count all: (students count both numbers together)
skip count: (students skip count to reach the total), or
no observed calculation: (students generate the answer without any outwardly noticeable strategy)
For tools, assessors were instructed to identify one of the following:
paper and pencil
buttons
fingers
nothing
Following this, students were given a list of 10 addition problems and timed for how long it
took them to solve all questions (up to five minutes). The same procedure was followed for
subtraction. Finally, students were given a list of three word problems. All problems were read
to students by the assessors.
Students overall performed the best at the timed addition questions (84% correct) followed
closely by authentic addition (74% correct). Students performed worse at timed subtraction
and authentic subtraction (68% and 67%, respectively), but had the most difficulty with the
word problems (47% correct). In terms of zero scores, four percent of students could not
answer a single timed addition question, and ten percent could not answer a single authentic
addition question. For timed subtraction and authentic subtraction, the proportion of zero
scores was 14% and 18%, respectively. For word problems, the figure stood at a full quarter of
students unable to correctly answer a single word problem. Numeracy Boost should
address these skill deficiencies through providing teachers and community activity
facilitators with strategies and activities for engaging children in enjoyable and
relevant practice of addition and subtraction.
8 Inter-rater reliability on these measures was excellent. As measured by the intra-cluster correlation, reliability
was above 0.75 on all categories except for authentic addition skip counting (0.41) and authentic subtraction skip counting (0.7).
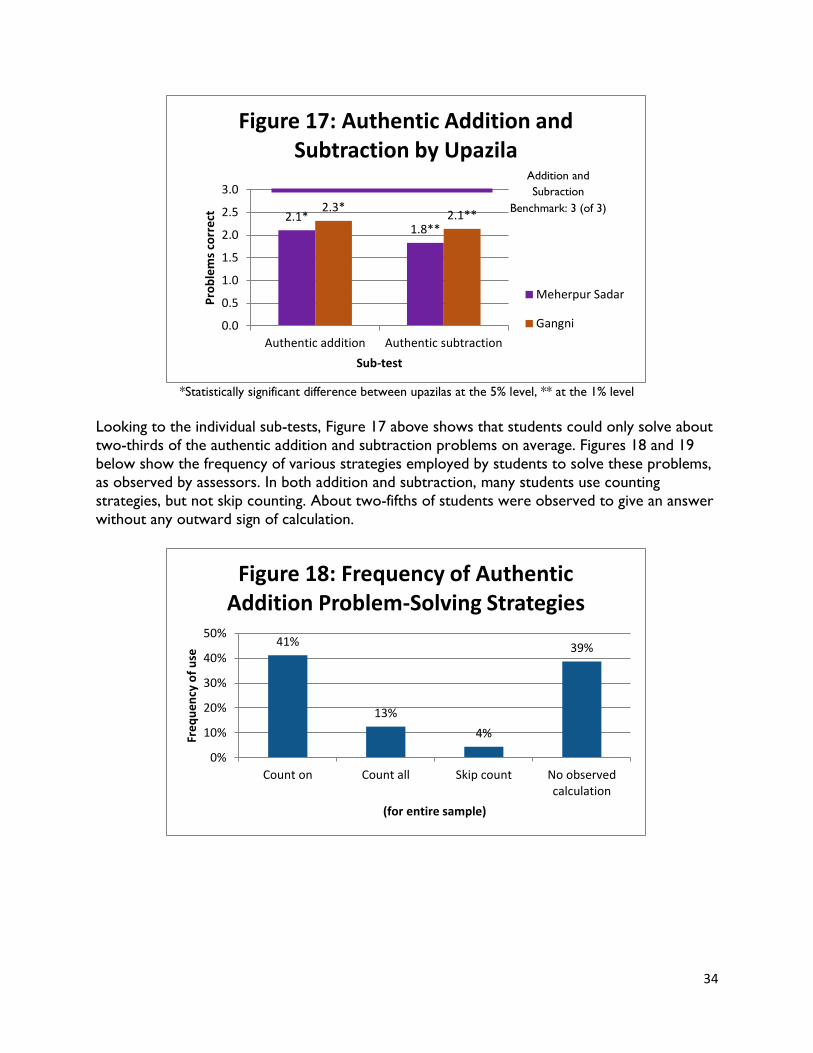
34
*Statistically significant difference between upazilas at the 5% level, ** at the 1% level
Looking to the individual sub-tests, Figure 17 above shows that students could only solve about
two-thirds of the authentic addition and subtraction problems on average. Figures 18 and 19
below show the frequency of various strategies employed by students to solve these problems,
as observed by assessors. In both addition and subtraction, many students use counting
strategies, but not skip counting. About two-fifths of students were observed to give an answer
without any outward sign of calculation.
2.1* 1.8**
2.3* 2.1**
0.0
0.5
1.0
1.5
2.0
2.5
3.0
Authentic addition Authentic subtraction
Pro
ble
ms
corr
ect
Sub-test
Figure 17: Authentic Addition and Subtraction by Upazila
Meherpur Sadar
Gangni
Addition and
Subraction
Benchmark: 3 (of 3)
41%
13%
4%
39%
0%
10%
20%
30%
40%
50%
Count on Count all Skip count No observedcalculation
Fre
qu
en
cy o
f u
se
(for entire sample)
Figure 18: Frequency of Authentic Addition Problem-Solving Strategies
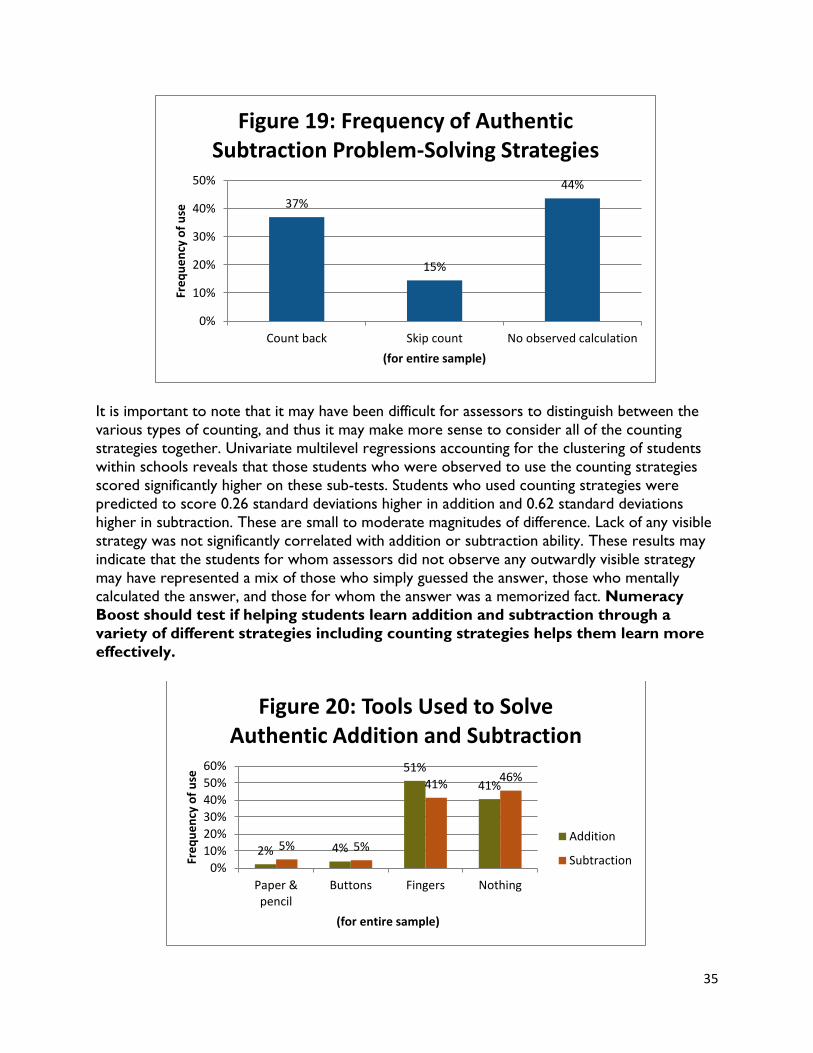
35
It is important to note that it may have been difficult for assessors to distinguish between the
various types of counting, and thus it may make more sense to consider all of the counting
strategies together. Univariate multilevel regressions accounting for the clustering of students
within schools reveals that those students who were observed to use the counting strategies
scored significantly higher on these sub-tests. Students who used counting strategies were
predicted to score 0.26 standard deviations higher in addition and 0.62 standard deviations
higher in subtraction. These are small to moderate magnitudes of difference. Lack of any visible
strategy was not significantly correlated with addition or subtraction ability. These results may
indicate that the students for whom assessors did not observe any outwardly visible strategy
may have represented a mix of those who simply guessed the answer, those who mentally
calculated the answer, and those for whom the answer was a memorized fact. Numeracy
Boost should test if helping students learn addition and subtraction through a
variety of different strategies including counting strategies helps them learn more
effectively.
37%
15%
44%
0%
10%
20%
30%
40%
50%
Count back Skip count No observed calculation
Fre
qu
en
cy o
f u
se
(for entire sample)
Figure 19: Frequency of Authentic Subtraction Problem-Solving Strategies
2% 4%
51%
41%
5% 5%
41% 46%
0%
10%
20%
30%
40%
50%
60%
Paper &pencil
Buttons Fingers Nothing
Fre
qu
en
cy o
f u
se
(for entire sample)
Figure 20: Tools Used to Solve Authentic Addition and Subtraction
Addition
Subtraction
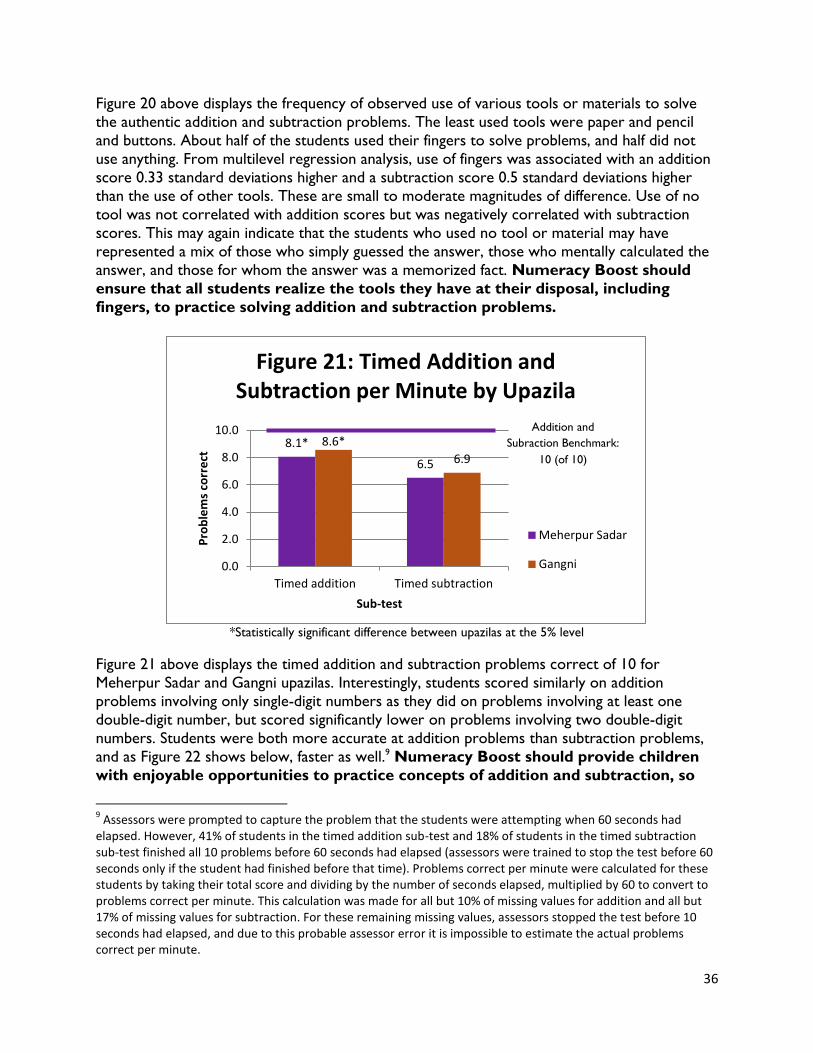
36
Figure 20 above displays the frequency of observed use of various tools or materials to solve
the authentic addition and subtraction problems. The least used tools were paper and pencil
and buttons. About half of the students used their fingers to solve problems, and half did not
use anything. From multilevel regression analysis, use of fingers was associated with an addition
score 0.33 standard deviations higher and a subtraction score 0.5 standard deviations higher
than the use of other tools. These are small to moderate magnitudes of difference. Use of no
tool was not correlated with addition scores but was negatively correlated with subtraction
scores. This may again indicate that the students who used no tool or material may have
represented a mix of those who simply guessed the answer, those who mentally calculated the
answer, and those for whom the answer was a memorized fact. Numeracy Boost should
ensure that all students realize the tools they have at their disposal, including
fingers, to practice solving addition and subtraction problems.
*Statistically significant difference between upazilas at the 5% level
Figure 21 above displays the timed addition and subtraction problems correct of 10 for
Meherpur Sadar and Gangni upazilas. Interestingly, students scored similarly on addition
problems involving only single-digit numbers as they did on problems involving at least one
double-digit number, but scored significantly lower on problems involving two double-digit
numbers. Students were both more accurate at addition problems than subtraction problems,
and as Figure 22 shows below, faster as well.9 Numeracy Boost should provide children
with enjoyable opportunities to practice concepts of addition and subtraction, so
9 Assessors were prompted to capture the problem that the students were attempting when 60 seconds had
elapsed. However, 41% of students in the timed addition sub-test and 18% of students in the timed subtraction sub-test finished all 10 problems before 60 seconds had elapsed (assessors were trained to stop the test before 60 seconds only if the student had finished before that time). Problems correct per minute were calculated for these students by taking their total score and dividing by the number of seconds elapsed, multiplied by 60 to convert to problems correct per minute. This calculation was made for all but 10% of missing values for addition and all but 17% of missing values for subtraction. For these remaining missing values, assessors stopped the test before 10 seconds had elapsed, and due to this probable assessor error it is impossible to estimate the actual problems correct per minute.
8.1*
6.5
8.6*
6.9
0.0
2.0
4.0
6.0
8.0
10.0
Timed addition Timed subtraction
Pro
ble
ms
corr
ect
Sub-test
Figure 21: Timed Addition and Subtraction per Minute by Upazila
Meherpur Sadar
Gangni
Addition and
Subraction Benchmark:
10 (of 10)
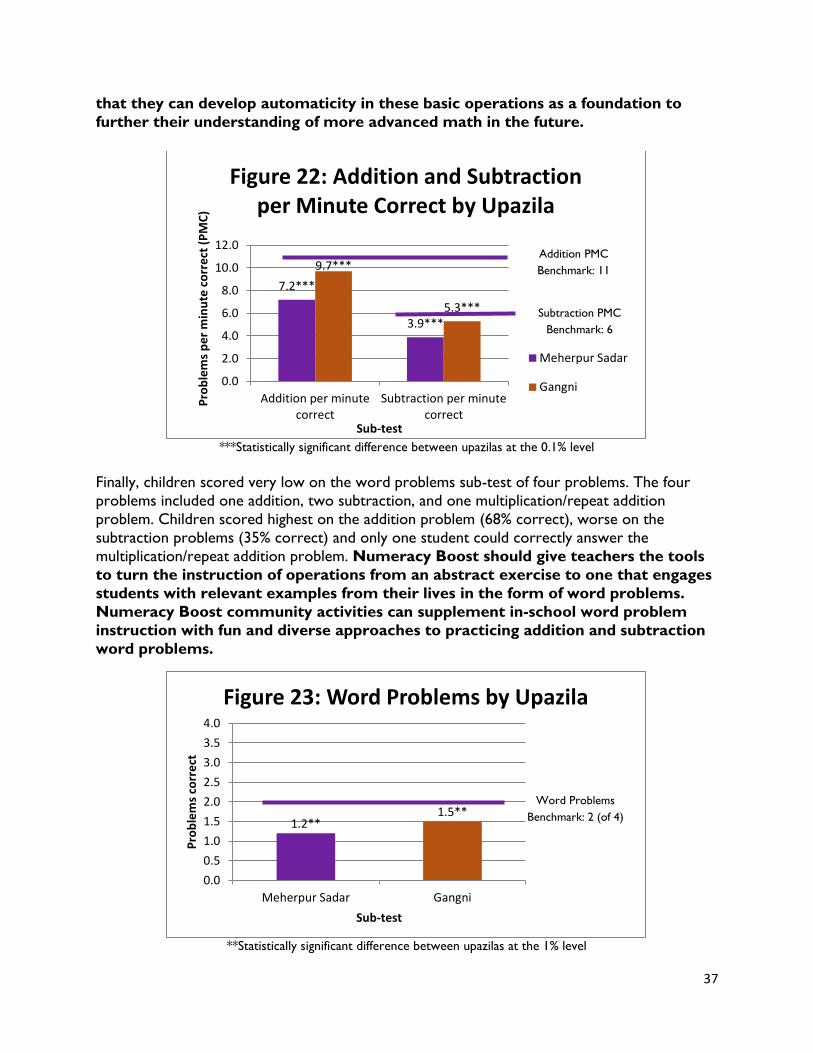
37
that they can develop automaticity in these basic operations as a foundation to
further their understanding of more advanced math in the future.
***Statistically significant difference between upazilas at the 0.1% level
Finally, children scored very low on the word problems sub-test of four problems. The four
problems included one addition, two subtraction, and one multiplication/repeat addition
problem. Children scored highest on the addition problem (68% correct), worse on the
subtraction problems (35% correct) and only one student could correctly answer the
multiplication/repeat addition problem. Numeracy Boost should give teachers the tools
to turn the instruction of operations from an abstract exercise to one that engages
students with relevant examples from their lives in the form of word problems.
Numeracy Boost community activities can supplement in-school word problem
instruction with fun and diverse approaches to practicing addition and subtraction
word problems.
**Statistically significant difference between upazilas at the 1% level
7.2***
3.9***
9.7***
5.3***
0.0
2.0
4.0
6.0
8.0
10.0
12.0
Addition per minutecorrect
Subtraction per minutecorrect
Pro
ble
ms
pe
r m
inu
te c
orr
ect
(P
MC
)
Sub-test
Figure 22: Addition and Subtraction per Minute Correct by Upazila
Meherpur Sadar
Gangni
Addition PMC
Benchmark: 11
Subtraction PMC
Benchmark: 6
1.2** 1.5**
0.0
0.5
1.0
1.5
2.0
2.5
3.0
3.5
4.0
Meherpur Sadar Gangni
Pro
ble
ms
corr
ect
Sub-test
Figure 23: Word Problems by Upazila
Word Problems
Benchmark: 2 (of 4)
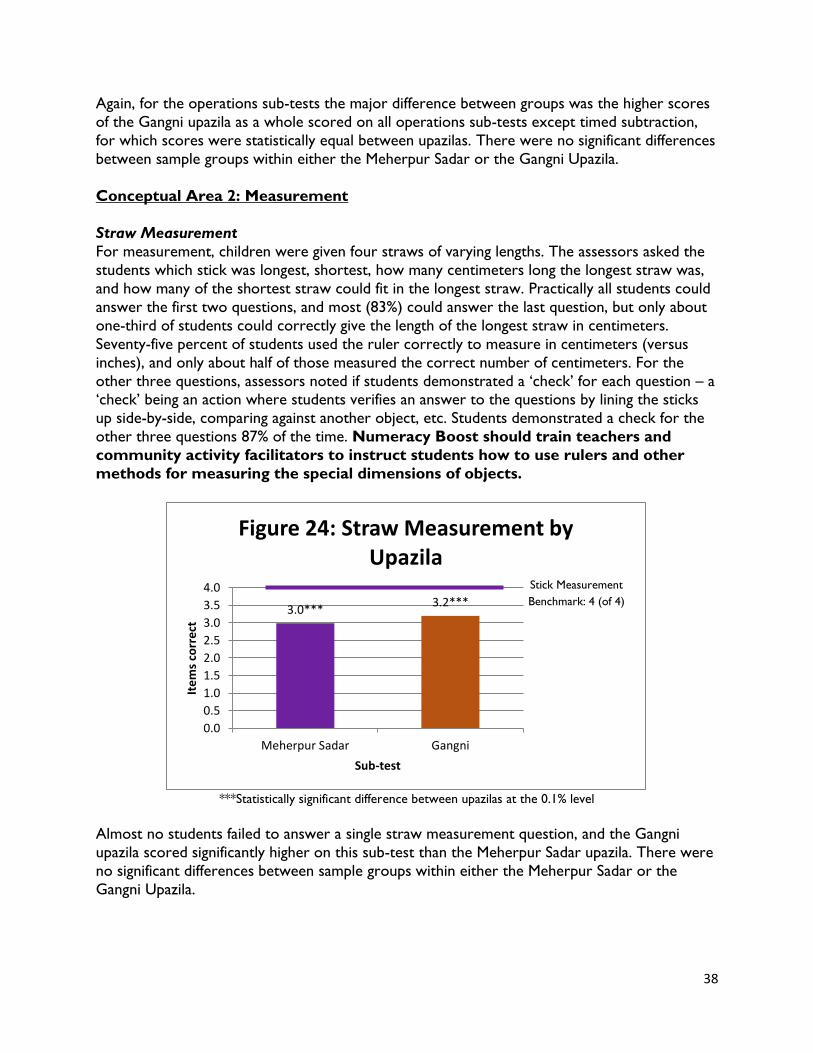
38
Again, for the operations sub-tests the major difference between groups was the higher scores
of the Gangni upazila as a whole scored on all operations sub-tests except timed subtraction,
for which scores were statistically equal between upazilas. There were no significant differences
between sample groups within either the Meherpur Sadar or the Gangni Upazila.
Conceptual Area 2: Measurement
Straw Measurement
For measurement, children were given four straws of varying lengths. The assessors asked the
students which stick was longest, shortest, how many centimeters long the longest straw was,
and how many of the shortest straw could fit in the longest straw. Practically all students could
answer the first two questions, and most (83%) could answer the last question, but only about
one-third of students could correctly give the length of the longest straw in centimeters.
Seventy-five percent of students used the ruler correctly to measure in centimeters (versus
inches), and only about half of those measured the correct number of centimeters. For the
other three questions, assessors noted if students demonstrated a ‘check’ for each question – a ‘check’ being an action where students verifies an answer to the questions by lining the sticks
up side-by-side, comparing against another object, etc. Students demonstrated a check for the
other three questions 87% of the time. Numeracy Boost should train teachers and
community activity facilitators to instruct students how to use rulers and other
methods for measuring the special dimensions of objects.
***Statistically significant difference between upazilas at the 0.1% level
Almost no students failed to answer a single straw measurement question, and the Gangni
upazila scored significantly higher on this sub-test than the Meherpur Sadar upazila. There were
no significant differences between sample groups within either the Meherpur Sadar or the
Gangni Upazila.
3.0*** 3.2***
0.0
0.5
1.0
1.5
2.0
2.5
3.0
3.5
4.0
Meherpur Sadar Gangni
Ite
ms
corr
ect
Sub-test
Figure 24: Straw Measurement by Upazila
Stick Measurement
Benchmark: 4 (of 4)
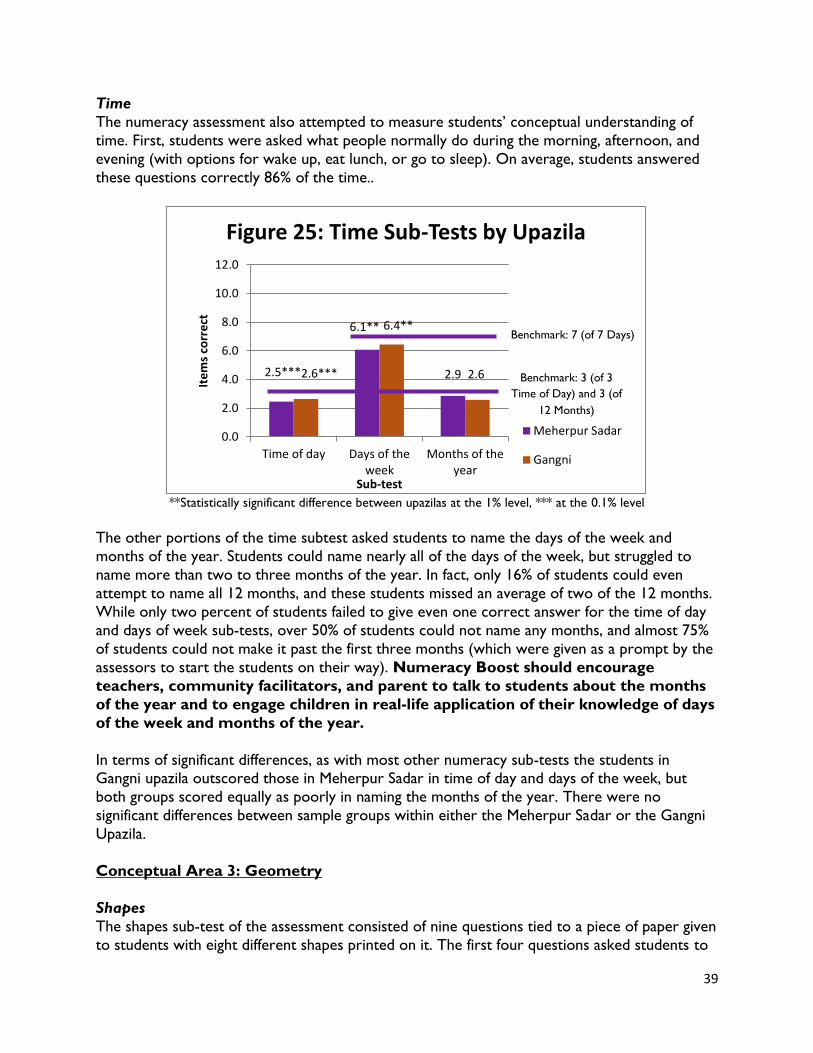
39
Time
The numeracy assessment also attempted to measure students’ conceptual understanding of
time. First, students were asked what people normally do during the morning, afternoon, and
evening (with options for wake up, eat lunch, or go to sleep). On average, students answered
these questions correctly 86% of the time..
**Statistically significant difference between upazilas at the 1% level, *** at the 0.1% level
The other portions of the time subtest asked students to name the days of the week and
months of the year. Students could name nearly all of the days of the week, but struggled to
name more than two to three months of the year. In fact, only 16% of students could even
attempt to name all 12 months, and these students missed an average of two of the 12 months.
While only two percent of students failed to give even one correct answer for the time of day
and days of week sub-tests, over 50% of students could not name any months, and almost 75%
of students could not make it past the first three months (which were given as a prompt by the
assessors to start the students on their way). Numeracy Boost should encourage
teachers, community facilitators, and parent to talk to students about the months
of the year and to engage children in real-life application of their knowledge of days
of the week and months of the year.
In terms of significant differences, as with most other numeracy sub-tests the students in Gangni upazila outscored those in Meherpur Sadar in time of day and days of the week, but
both groups scored equally as poorly in naming the months of the year. There were no
significant differences between sample groups within either the Meherpur Sadar or the Gangni
Upazila.
Conceptual Area 3: Geometry
Shapes
The shapes sub-test of the assessment consisted of nine questions tied to a piece of paper given
to students with eight different shapes printed on it. The first four questions asked students to
2.5***
6.1**
2.9 2.6***
6.4**
2.6
0.0
2.0
4.0
6.0
8.0
10.0
12.0
Time of day Days of theweek
Months of theyear
Ite
ms
corr
ect
Sub-test
Figure 25: Time Sub-Tests by Upazila
Meherpur Sadar
Gangni
Benchmark: 3 (of 3
Time of Day) and 3 (of
12 Months)
Benchmark: 7 (of 7 Days)
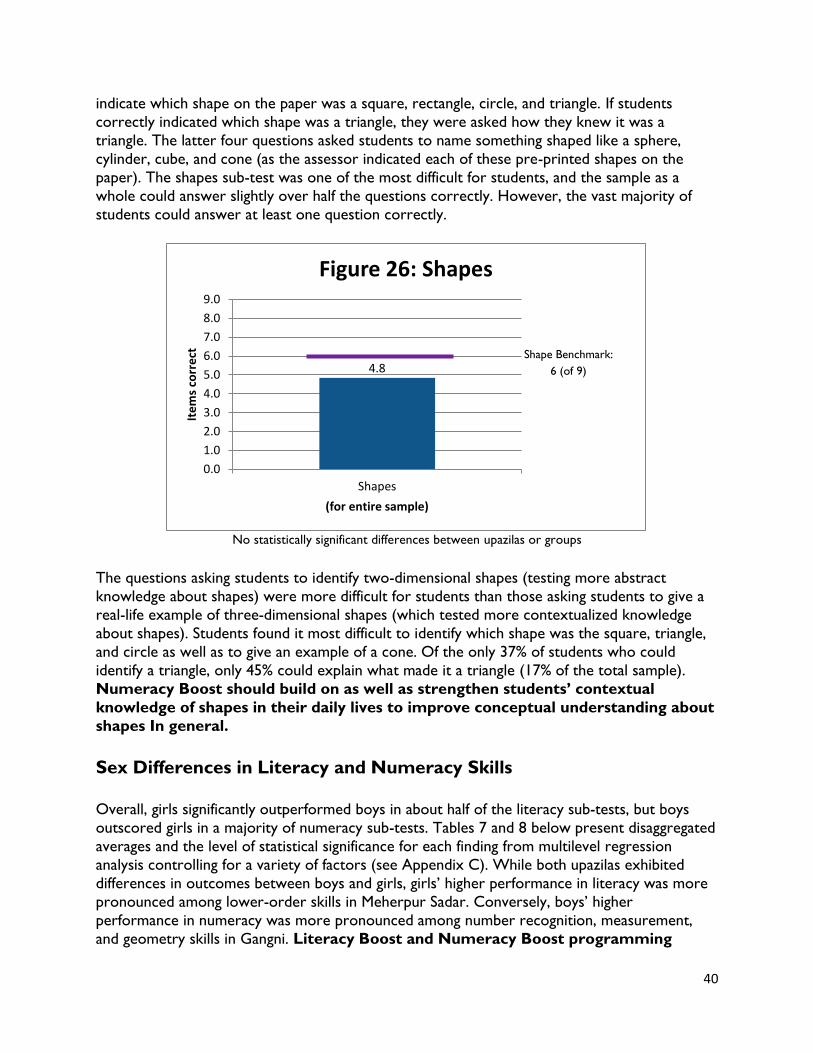
40
indicate which shape on the paper was a square, rectangle, circle, and triangle. If students
correctly indicated which shape was a triangle, they were asked how they knew it was a
triangle. The latter four questions asked students to name something shaped like a sphere,
cylinder, cube, and cone (as the assessor indicated each of these pre-printed shapes on the
paper). The shapes sub-test was one of the most difficult for students, and the sample as a
whole could answer slightly over half the questions correctly. However, the vast majority of
students could answer at least one question correctly.
No statistically significant differences between upazilas or groups
The questions asking students to identify two-dimensional shapes (testing more abstract
knowledge about shapes) were more difficult for students than those asking students to give a
real-life example of three-dimensional shapes (which tested more contextualized knowledge
about shapes). Students found it most difficult to identify which shape was the square, triangle,
and circle as well as to give an example of a cone. Of the only 37% of students who could
identify a triangle, only 45% could explain what made it a triangle (17% of the total sample).
Numeracy Boost should build on as well as strengthen students’ contextual
knowledge of shapes in their daily lives to improve conceptual understanding about
shapes In general.
Sex Differences in Literacy and Numeracy Skills
Overall, girls significantly outperformed boys in about half of the literacy sub-tests, but boys
outscored girls in a majority of numeracy sub-tests. Tables 7 and 8 below present disaggregated
averages and the level of statistical significance for each finding from multilevel regression
analysis controlling for a variety of factors (see Appendix C). While both upazilas exhibited
differences in outcomes between boys and girls, girls’ higher performance in literacy was more
pronounced among lower-order skills in Meherpur Sadar. Conversely, boys’ higher
performance in numeracy was more pronounced among number recognition, measurement,
and geometry skills in Gangni. Literacy Boost and Numeracy Boost programming
4.8
0.0
1.0
2.0
3.0
4.0
5.0
6.0
7.0
8.0
9.0
Shapes
Ite
ms
corr
ect
(for entire sample)
Figure 26: Shapes
Shape Benchmark:
6 (of 9)
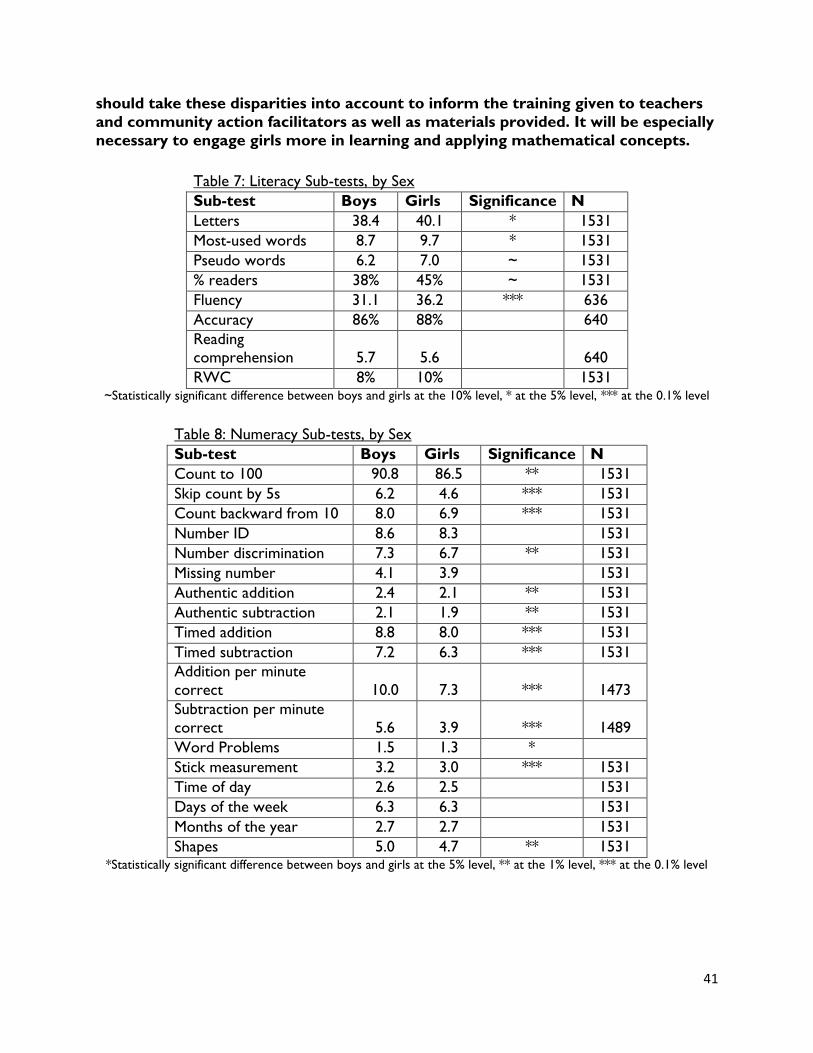
41
should take these disparities into account to inform the training given to teachers
and community action facilitators as well as materials provided. It will be especially
necessary to engage girls more in learning and applying mathematical concepts.
Table 7: Literacy Sub-tests, by Sex
Sub-test Boys Girls Significance N
Letters 38.4 40.1 * 1531
Most-used words 8.7 9.7 * 1531
Pseudo words 6.2 7.0 ~ 1531
% readers 38% 45% ~ 1531
Fluency 31.1 36.2 *** 636
Accuracy 86% 88%
640
Reading
comprehension 5.7 5.6
640
RWC 8% 10%
1531 ~Statistically significant difference between boys and girls at the 10% level, * at the 5% level, *** at the 0.1% level
Table 8: Numeracy Sub-tests, by Sex
Sub-test Boys Girls Significance N
Count to 100 90.8 86.5 ** 1531
Skip count by 5s 6.2 4.6 *** 1531
Count backward from 10 8.0 6.9 *** 1531
Number ID 8.6 8.3
1531
Number discrimination 7.3 6.7 ** 1531
Missing number 4.1 3.9
1531
Authentic addition 2.4 2.1 ** 1531
Authentic subtraction 2.1 1.9 ** 1531
Timed addition 8.8 8.0 *** 1531
Timed subtraction 7.2 6.3 *** 1531
Addition per minute
correct 10.0 7.3 *** 1473
Subtraction per minute
correct 5.6 3.9 *** 1489
Word Problems 1.5 1.3 *
Stick measurement 3.2 3.0 *** 1531
Time of day 2.6 2.5
1531
Days of the week 6.3 6.3
1531
Months of the year 2.7 2.7
1531
Shapes 5.0 4.7 ** 1531 *Statistically significant difference between boys and girls at the 5% level, ** at the 1% level, *** at the 0.1% level
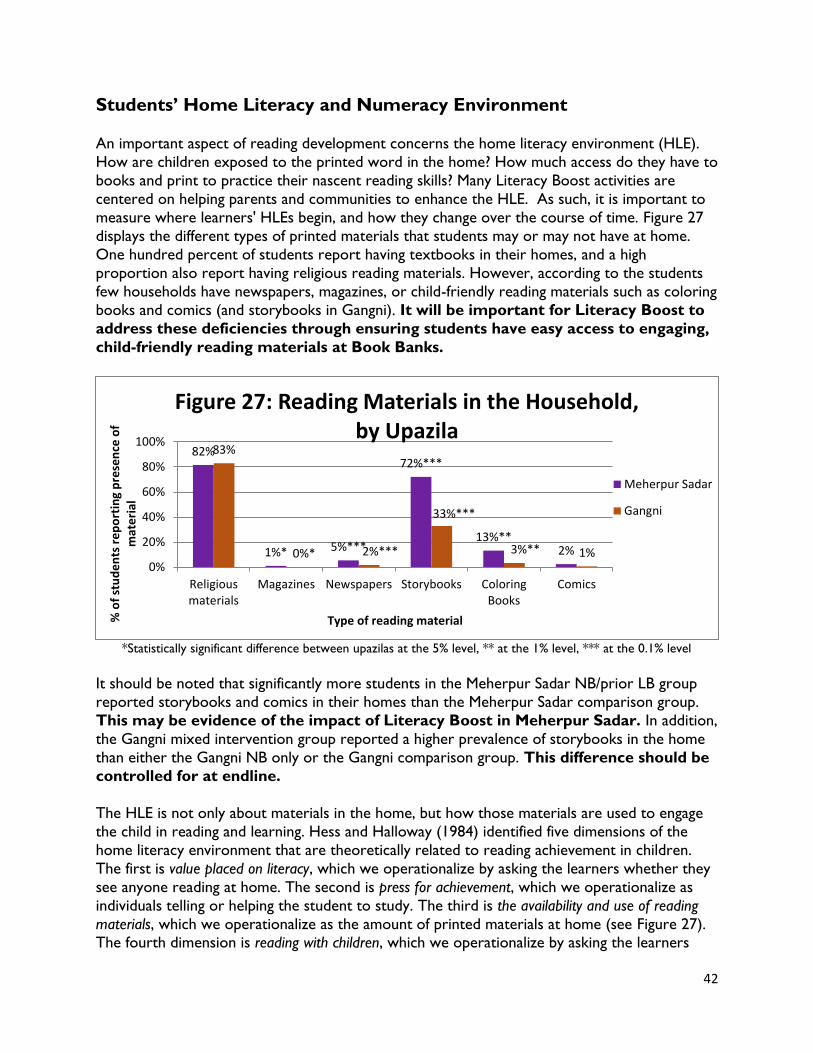
42
Students’ Home Literacy and Numeracy Environment
An important aspect of reading development concerns the home literacy environment (HLE).
How are children exposed to the printed word in the home? How much access do they have to
books and print to practice their nascent reading skills? Many Literacy Boost activities are
centered on helping parents and communities to enhance the HLE. As such, it is important to
measure where learners' HLEs begin, and how they change over the course of time. Figure 27
displays the different types of printed materials that students may or may not have at home.
One hundred percent of students report having textbooks in their homes, and a high
proportion also report having religious reading materials. However, according to the students
few households have newspapers, magazines, or child-friendly reading materials such as coloring
books and comics (and storybooks in Gangni). It will be important for Literacy Boost to
address these deficiencies through ensuring students have easy access to engaging,
child-friendly reading materials at Book Banks.
*Statistically significant difference between upazilas at the 5% level, ** at the 1% level, *** at the 0.1% level
It should be noted that significantly more students in the Meherpur Sadar NB/prior LB group
reported storybooks and comics in their homes than the Meherpur Sadar comparison group.
This may be evidence of the impact of Literacy Boost in Meherpur Sadar. In addition,
the Gangni mixed intervention group reported a higher prevalence of storybooks in the home
than either the Gangni NB only or the Gangni comparison group. This difference should be
controlled for at endline.
The HLE is not only about materials in the home, but how those materials are used to engage
the child in reading and learning. Hess and Halloway (1984) identified five dimensions of the
home literacy environment that are theoretically related to reading achievement in children.
The first is value placed on literacy, which we operationalize by asking the learners whether they
see anyone reading at home. The second is press for achievement, which we operationalize as
individuals telling or helping the student to study. The third is the availability and use of reading
materials, which we operationalize as the amount of printed materials at home (see Figure 27). The fourth dimension is reading with children, which we operationalize by asking the learners
82%
1%* 5%***
72%***
13%** 2%
83%
0%* 2%***
33%***
3%** 1% 0%
20%
40%
60%
80%
100%
Religiousmaterials
Magazines Newspapers Storybooks ColoringBooks
Comics
% o
f st
ud
en
ts r
ep
ort
ing
pre
sen
ce o
f m
ate
rial
Type of reading material
Figure 27: Reading Materials in the Household, by Upazila
Meherpur Sadar
Gangni
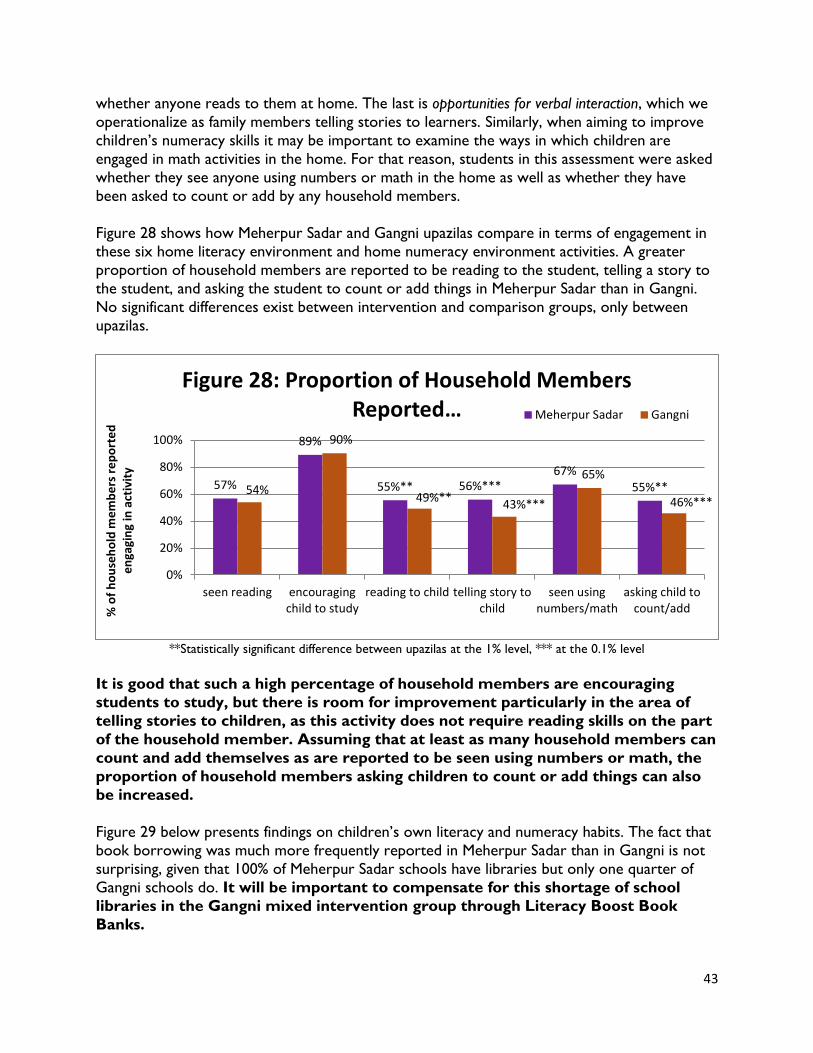
43
whether anyone reads to them at home. The last is opportunities for verbal interaction, which we
operationalize as family members telling stories to learners. Similarly, when aiming to improve
children’s numeracy skills it may be important to examine the ways in which children are
engaged in math activities in the home. For that reason, students in this assessment were asked
whether they see anyone using numbers or math in the home as well as whether they have
been asked to count or add by any household members.
Figure 28 shows how Meherpur Sadar and Gangni upazilas compare in terms of engagement in
these six home literacy environment and home numeracy environment activities. A greater
proportion of household members are reported to be reading to the student, telling a story to
the student, and asking the student to count or add things in Meherpur Sadar than in Gangni.
No significant differences exist between intervention and comparison groups, only between
upazilas.
**Statistically significant difference between upazilas at the 1% level, *** at the 0.1% level
It is good that such a high percentage of household members are encouraging
students to study, but there is room for improvement particularly in the area of
telling stories to children, as this activity does not require reading skills on the part
of the household member. Assuming that at least as many household members can
count and add themselves as are reported to be seen using numbers or math, the
proportion of household members asking children to count or add things can also
be increased.
Figure 29 below presents findings on children’s own literacy and numeracy habits. The fact that
book borrowing was much more frequently reported in Meherpur Sadar than in Gangni is not
surprising, given that 100% of Meherpur Sadar schools have libraries but only one quarter of
Gangni schools do. It will be important to compensate for this shortage of school
libraries in the Gangni mixed intervention group through Literacy Boost Book
Banks.
57%
89%
55%** 56%*** 67%
55%** 54%
90%
49%** 43%***
65%
46%***
0%
20%
40%
60%
80%
100%
seen reading encouragingchild to study
reading to child telling story tochild
seen usingnumbers/math
asking child tocount/add%
of
ho
use
ho
ld m
em
be
rs r
ep
ort
ed
e
nga
gin
g in
act
ivit
y
Figure 28: Proportion of Household Members Reported… Meherpur Sadar Gangni
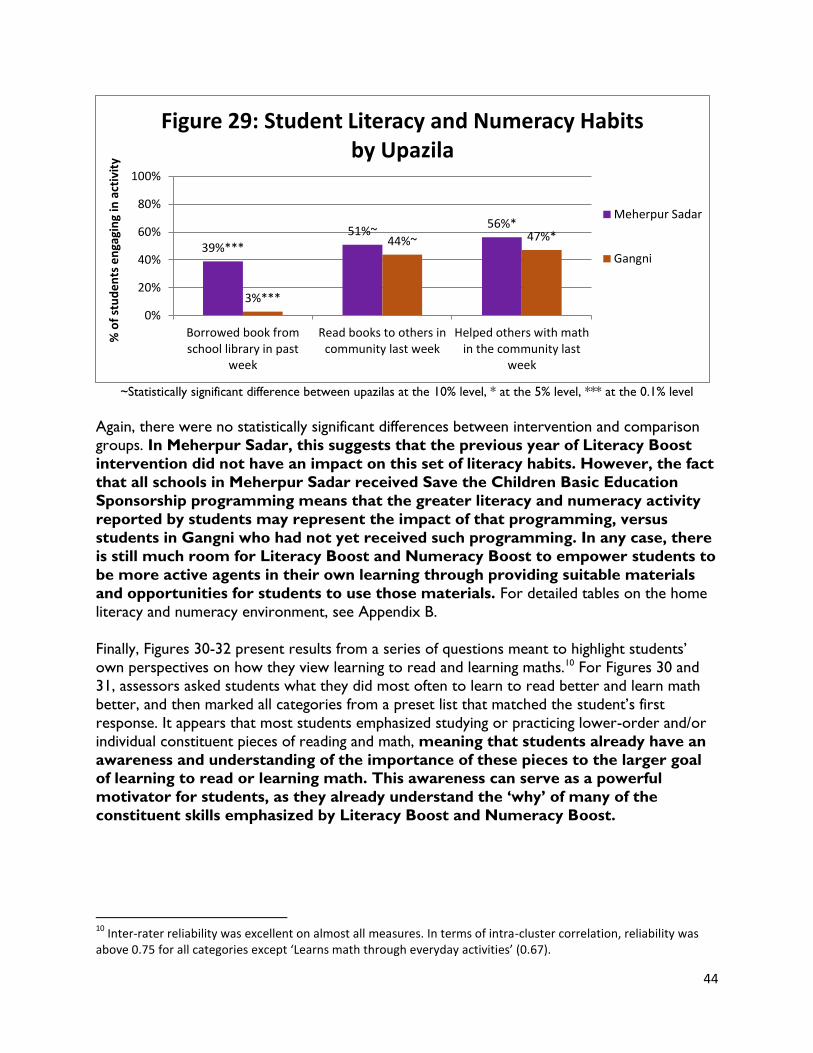
44
~Statistically significant difference between upazilas at the 10% level, * at the 5% level, *** at the 0.1% level
Again, there were no statistically significant differences between intervention and comparison
groups. In Meherpur Sadar, this suggests that the previous year of Literacy Boost
intervention did not have an impact on this set of literacy habits. However, the fact
that all schools in Meherpur Sadar received Save the Children Basic Education
Sponsorship programming means that the greater literacy and numeracy activity
reported by students may represent the impact of that programming, versus
students in Gangni who had not yet received such programming. In any case, there
is still much room for Literacy Boost and Numeracy Boost to empower students to
be more active agents in their own learning through providing suitable materials
and opportunities for students to use those materials. For detailed tables on the home
literacy and numeracy environment, see Appendix B.
Finally, Figures 30-32 present results from a series of questions meant to highlight students’
own perspectives on how they view learning to read and learning maths.10 For Figures 30 and
31, assessors asked students what they did most often to learn to read better and learn math
better, and then marked all categories from a preset list that matched the student’s first
response. It appears that most students emphasized studying or practicing lower-order and/or
individual constituent pieces of reading and math, meaning that students already have an
awareness and understanding of the importance of these pieces to the larger goal of learning to read or learning math. This awareness can serve as a powerful
motivator for students, as they already understand the ‘why’ of many of the
constituent skills emphasized by Literacy Boost and Numeracy Boost.
10
Inter-rater reliability was excellent on almost all measures. In terms of intra-cluster correlation, reliability was above 0.75 for all categories except ‘Learns math through everyday activities’ (0.67).
39%***
51%~ 56%*
3%***
44%~ 47%*
0%
20%
40%
60%
80%
100%
Borrowed book fromschool library in past
week
Read books to others incommunity last week
Helped others with mathin the community last
week
% o
f st
ud
en
ts e
nga
gin
g in
act
ivit
y Figure 29: Student Literacy and Numeracy Habits
by Upazila
Meherpur Sadar
Gangni
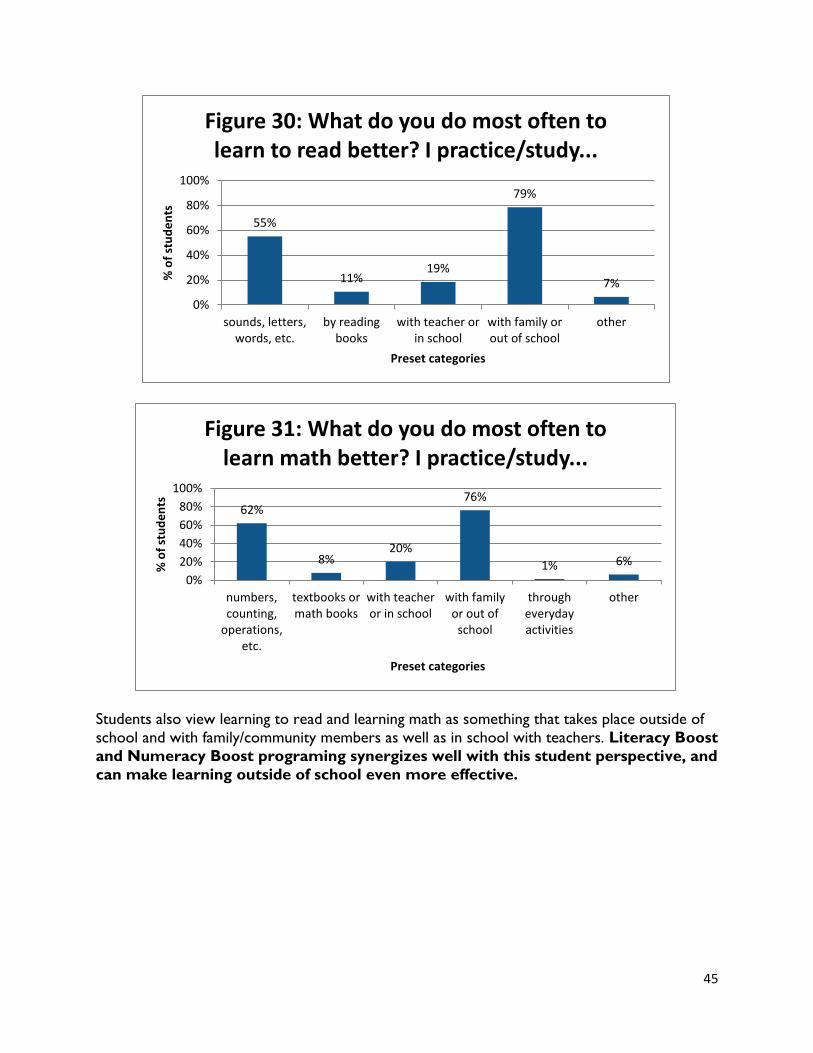
45
Students also view learning to read and learning math as something that takes place outside of
school and with family/community members as well as in school with teachers. Literacy Boost
and Numeracy Boost programing synergizes well with this student perspective, and
can make learning outside of school even more effective.
55%
11% 19%
79%
7%
0%
20%
40%
60%
80%
100%
sounds, letters,words, etc.
by readingbooks
with teacher orin school
with family orout of school
other
% o
f st
ud
en
ts
Preset categories
Figure 30: What do you do most often to learn to read better? I practice/study...
62%
8% 20%
76%
1% 6%
0%
20%
40%
60%
80%
100%
numbers,counting,
operations,etc.
textbooks ormath books
with teacheror in school
with familyor out of
school
througheverydayactivities
other
% o
f st
ud
en
ts
Preset categories
Figure 31: What do you do most often to learn math better? I practice/study...
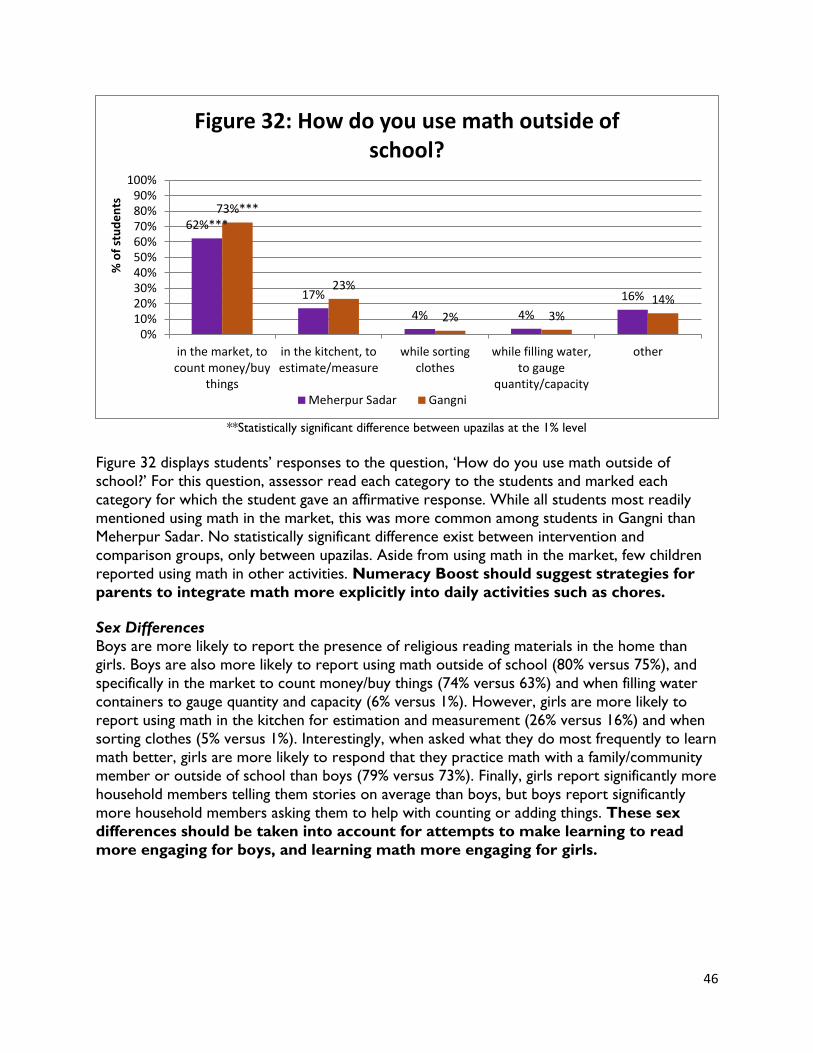
46
**Statistically significant difference between upazilas at the 1% level
Figure 32 displays students’ responses to the question, ‘How do you use math outside of
school?’ For this question, assessor read each category to the students and marked each
category for which the student gave an affirmative response. While all students most readily
mentioned using math in the market, this was more common among students in Gangni than
Meherpur Sadar. No statistically significant difference exist between intervention and
comparison groups, only between upazilas. Aside from using math in the market, few children
reported using math in other activities. Numeracy Boost should suggest strategies for
parents to integrate math more explicitly into daily activities such as chores.
Sex Differences
Boys are more likely to report the presence of religious reading materials in the home than
girls. Boys are also more likely to report using math outside of school (80% versus 75%), and
specifically in the market to count money/buy things (74% versus 63%) and when filling water
containers to gauge quantity and capacity (6% versus 1%). However, girls are more likely to
report using math in the kitchen for estimation and measurement (26% versus 16%) and when
sorting clothes (5% versus 1%). Interestingly, when asked what they do most frequently to learn
math better, girls are more likely to respond that they practice math with a family/community
member or outside of school than boys (79% versus 73%). Finally, girls report significantly more
household members telling them stories on average than boys, but boys report significantly
more household members asking them to help with counting or adding things. These sex
differences should be taken into account for attempts to make learning to read
more engaging for boys, and learning math more engaging for girls.
62%***
17%
4% 4%
16%
73%***
23%
2% 3% 14%
0%10%20%30%40%50%60%70%80%90%
100%
in the market, tocount money/buy
things
in the kitchent, toestimate/measure
while sortingclothes
while filling water,to gauge
quantity/capacity
other
% o
f st
ud
en
ts
Figure 32: How do you use math outside of school?
Meherpur Sadar Gangni
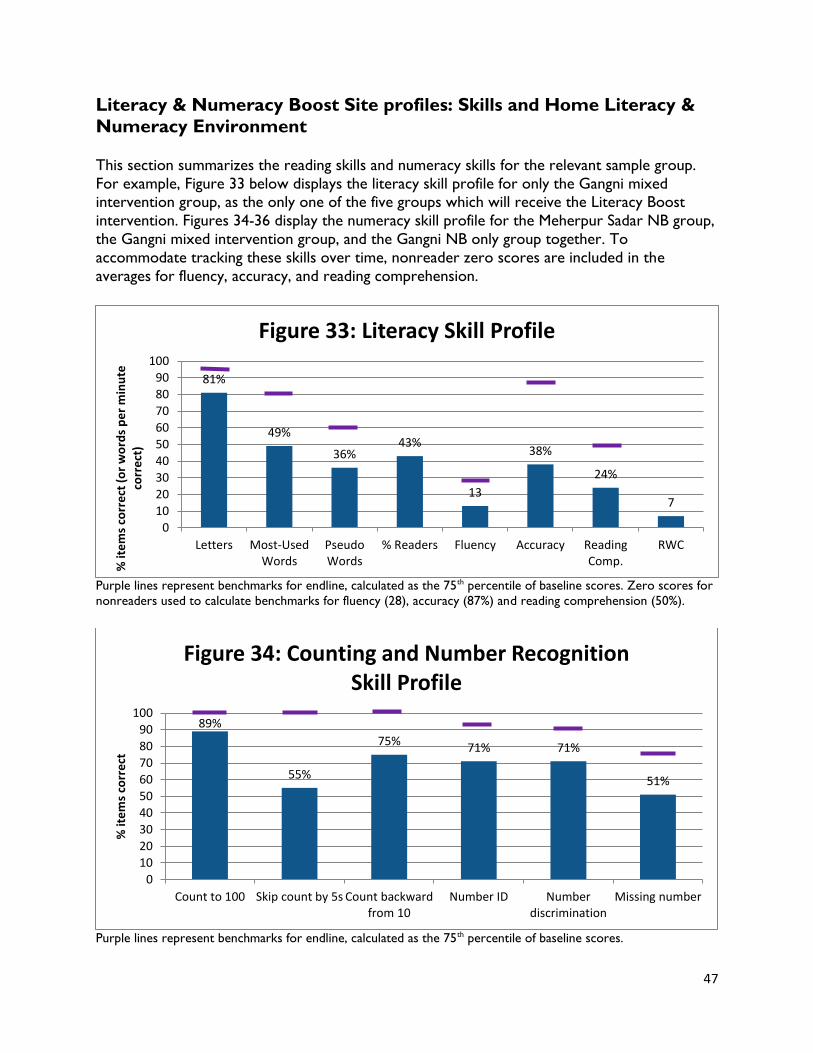
47
Literacy & Numeracy Boost Site profiles: Skills and Home Literacy &
Numeracy Environment
This section summarizes the reading skills and numeracy skills for the relevant sample group.
For example, Figure 33 below displays the literacy skill profile for only the Gangni mixed intervention group, as the only one of the five groups which will receive the Literacy Boost
intervention. Figures 34-36 display the numeracy skill profile for the Meherpur Sadar NB group,
the Gangni mixed intervention group, and the Gangni NB only group together. To
accommodate tracking these skills over time, nonreader zero scores are included in the
averages for fluency, accuracy, and reading comprehension.
Purple lines represent benchmarks for endline, calculated as the 75th percentile of baseline scores. Zero scores for
nonreaders used to calculate benchmarks for fluency (28), accuracy (87%) and reading comprehension (50%).
Purple lines represent benchmarks for endline, calculated as the 75th percentile of baseline scores.
81%
49%
36% 43%
13
38%
24%
7
0
10
20
30
40
50
60
70
80
90
100
Letters Most-UsedWords
PseudoWords
% Readers Fluency Accuracy ReadingComp.
RWC
% it
em
s co
rre
ct (
or
wo
rds
pe
r m
inu
te
corr
ect
)
Figure 33: Literacy Skill Profile
89%
55%
75% 71% 71%
51%
0
10
20
30
40
50
60
70
80
90
100
Count to 100 Skip count by 5s Count backwardfrom 10
Number ID Numberdiscrimination
Missing number
% it
em
s co
rre
ct
Figure 34: Counting and Number Recognition Skill Profile
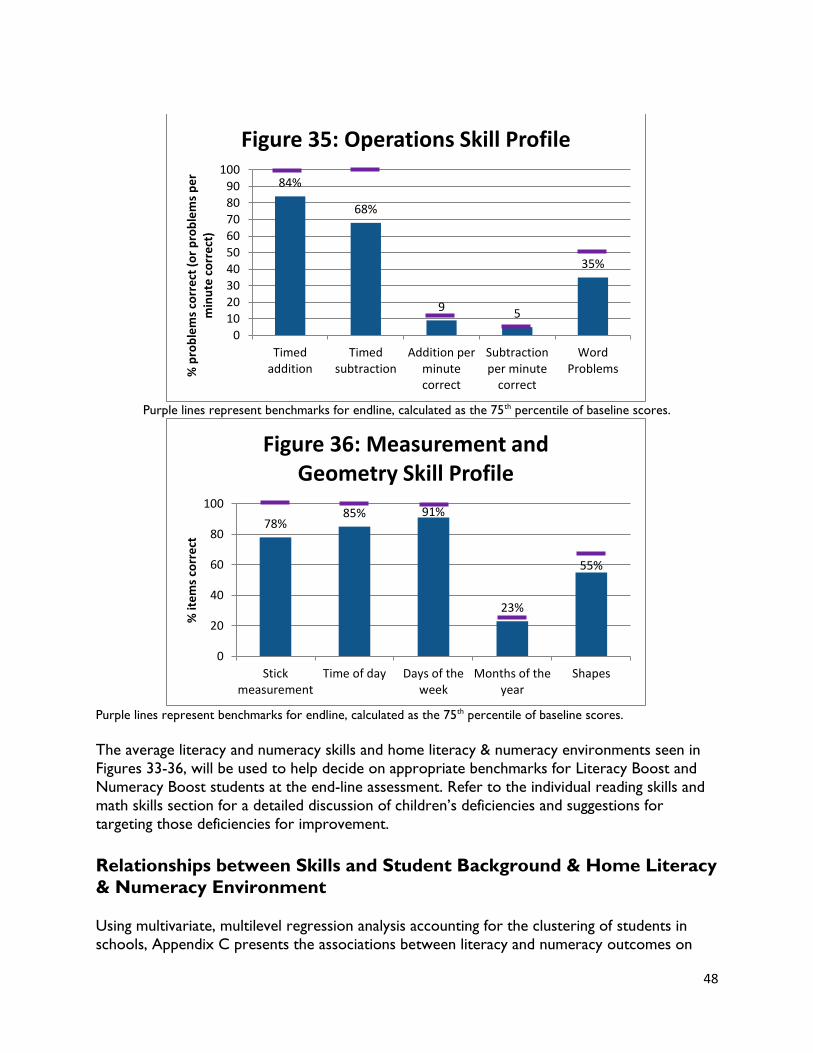
48
Purple lines represent benchmarks for endline, calculated as the 75th percentile of baseline scores.
Purple lines represent benchmarks for endline, calculated as the 75th percentile of baseline scores.
The average literacy and numeracy skills and home literacy & numeracy environments seen in
Figures 33-36, will be used to help decide on appropriate benchmarks for Literacy Boost and
Numeracy Boost students at the end-line assessment. Refer to the individual reading skills and
math skills section for a detailed discussion of children’s deficiencies and suggestions for
targeting those deficiencies for improvement.
Relationships between Skills and Student Background & Home Literacy
& Numeracy Environment
Using multivariate, multilevel regression analysis accounting for the clustering of students in
schools, Appendix C presents the associations between literacy and numeracy outcomes on
84%
68%
9 5
35%
0
1020
3040
50
6070
80
90100
Timedaddition
Timedsubtraction
Addition perminutecorrect
Subtractionper minute
correct
WordProblems%
pro
ble
ms
corr
ect
(o
r p
rob
lem
s p
er
min
ute
co
rre
ct)
Figure 35: Operations Skill Profile
78% 85% 91%
23%
55%
0
20
40
60
80
100
Stickmeasurement
Time of day Days of theweek
Months of theyear
Shapes
% it
em
s co
rre
ct
Figure 36: Measurement and Geometry Skill Profile
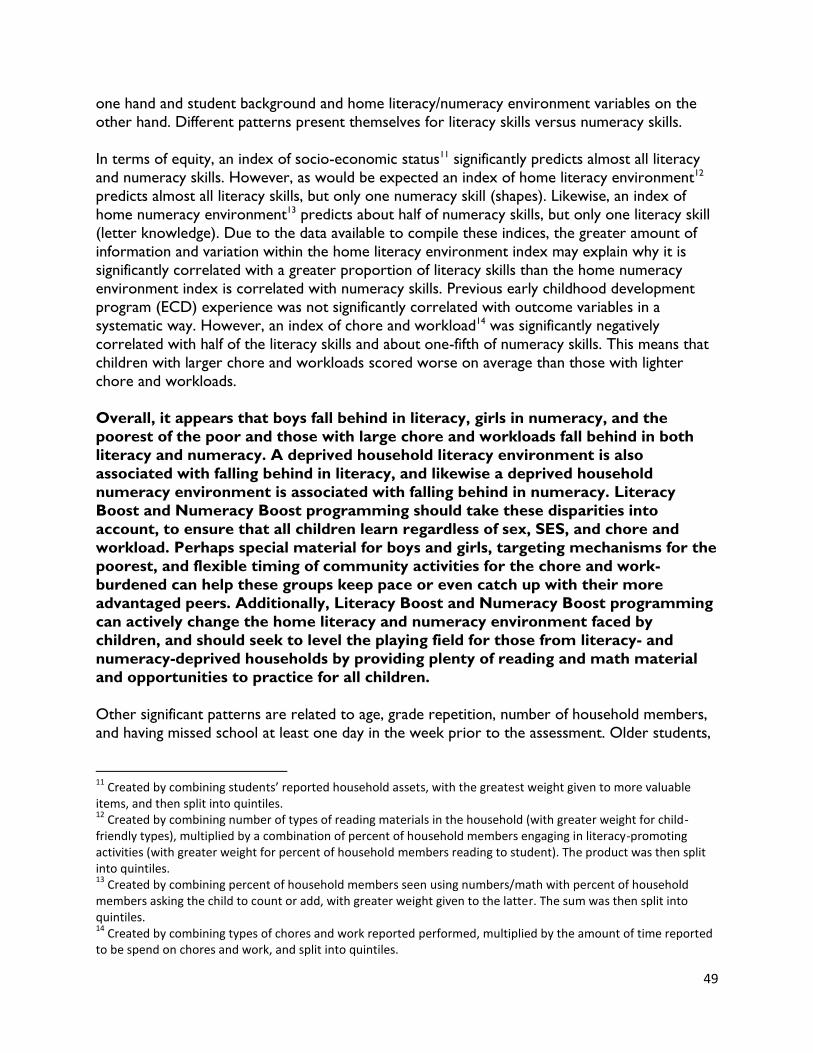
49
one hand and student background and home literacy/numeracy environment variables on the
other hand. Different patterns present themselves for literacy skills versus numeracy skills.
In terms of equity, an index of socio-economic status11 significantly predicts almost all literacy
and numeracy skills. However, as would be expected an index of home literacy environment12
predicts almost all literacy skills, but only one numeracy skill (shapes). Likewise, an index of
home numeracy environment13 predicts about half of numeracy skills, but only one literacy skill
(letter knowledge). Due to the data available to compile these indices, the greater amount of
information and variation within the home literacy environment index may explain why it is
significantly correlated with a greater proportion of literacy skills than the home numeracy
environment index is correlated with numeracy skills. Previous early childhood development
program (ECD) experience was not significantly correlated with outcome variables in a
systematic way. However, an index of chore and workload14 was significantly negatively
correlated with half of the literacy skills and about one-fifth of numeracy skills. This means that
children with larger chore and workloads scored worse on average than those with lighter
chore and workloads.
Overall, it appears that boys fall behind in literacy, girls in numeracy, and the
poorest of the poor and those with large chore and workloads fall behind in both
literacy and numeracy. A deprived household literacy environment is also
associated with falling behind in literacy, and likewise a deprived household
numeracy environment is associated with falling behind in numeracy. Literacy
Boost and Numeracy Boost programming should take these disparities into
account, to ensure that all children learn regardless of sex, SES, and chore and
workload. Perhaps special material for boys and girls, targeting mechanisms for the
poorest, and flexible timing of community activities for the chore and work-
burdened can help these groups keep pace or even catch up with their more
advantaged peers. Additionally, Literacy Boost and Numeracy Boost programming
can actively change the home literacy and numeracy environment faced by
children, and should seek to level the playing field for those from literacy- and
numeracy-deprived households by providing plenty of reading and math material
and opportunities to practice for all children.
Other significant patterns are related to age, grade repetition, number of household members,
and having missed school at least one day in the week prior to the assessment. Older students,
11
Created by combining students’ reported household assets, with the greatest weight given to more valuable items, and then split into quintiles. 12
Created by combining number of types of reading materials in the household (with greater weight for child-friendly types), multiplied by a combination of percent of household members engaging in literacy-promoting activities (with greater weight for percent of household members reading to student). The product was then split into quintiles. 13
Created by combining percent of household members seen using numbers/math with percent of household members asking the child to count or add, with greater weight given to the latter. The sum was then split into quintiles. 14
Created by combining types of chores and work reported performed, multiplied by the amount of time reported to be spend on chores and work, and split into quintiles.
50
those who have repeated at least one grade, those with a larger number of household
members, and those who report missing at least one day of school the week before all
performed worse on literacy sub-tests. However, while this association held for grade
repetition and missing school the past week among the numeracy sub-tests, it did not hold for
age or household size. In fact, older students scored better on the addition and subtraction
fluency sub-tests as well as straw measurement and time of day, and students from larger
households scored better on the shapes sub-test. Literacy Boost and Numeracy Boost
programming should explore what special remedial options are available to help
any children who are falling behind, especially older children, repeaters, and those
from large families. As illness was one of the most frequently mentioned reasons
for missing school, Save the Children can also explore options for combining
School Health & Nutrition programming with Literacy Boost and Numeracy Boost.
More information is needed to understand how children who report missing school
for leisure can be encouraged to attend more frequently.
Conclusion This study takes an in-depth quantitative look at the reading and math skills, as well as
background characteristics and home environment, of grade 2 children in two upazilas of the
Meherpur district in Bangladesh. These recommendations will inform programming for a second
round of Literacy Boost intervention in the area, and for the first round of Numeracy Boost
intervention. At endline, the large sample size rigorous research design will yield many insights
into how children in this context learn to read and develop math skills, and will explore if the
Literacy and Numeracy Boost programs were able to rectify existing disparities between
different types of students and deficiencies in all students’ reading and math skills.
Recommendations for Endline Analysis
Given the pattern of differences between Meherpur Sadar and Gangni, these
two upazilas should be analyzed separately during endline impact analysis,
and this baseline report will also examine the two upazilas separately,
focusing on the comparisons and dynamics within upazilas.
Within upazilas, the sample groups are remarkably similar to each other. This indicates that randomization of assignment to sample groups was
successful, and that the groups are sufficiently comparable for a difference-
in-difference impact analysis at endline, controlling for the small number of
observed differences.
Baseline literacy scores should be controlled for during endline impact
analysis.
Recommendations Based on Sex Differences
Utilizing the information about why boys and girls miss school, the fact that girls appear to do more chores more frequently than boys, and the different
types of chores done by boys and girls can provide clues as to the most
effective suggestions to provide parents for how they can integrate literacy
and numeracy practice into their children’s routines. For example, when
51
targeting improvements in girls’ numeracy skills, parental awareness can
suggest having talking to girls about measurement, quantity, and estimation
when cooking. Math Camps can teach children simple math-reinforcing
games that girls can use when they are caring for their younger siblings.
As girls performed better in many literacy skills and boys better in many numeracy skills, Literacy Boost and Numeracy Boost programming should
take these disparities into account to inform the training given to teachers
and community action facilitators as well as materials provided. It will be
especially necessary to engage girls more in learning and applying
mathematical concepts.
use the information that boys are more likely to report using math outside
of school (specifically in the market to count money/buy things and when
filling water containers to gauge quantity and capacity), that girls are more
likely to report using math in the kitchen for estimation and measurement
and when sorting clothes, that girls report significantly more household
members telling them stories on average than boys, and that boys report
significantly more household members asking them to help with counting or
adding things to rectify imbalances and make learning to read more
engaging for boys, and learning math more engaging for girls
Recommendations Based on Students’ Reading Skills: Literacy Boost programming should:
prioritize letter awareness as a critical area for teachers and community action facilitators to focus on
help teachers and community action facilitators focus on the most difficult
letters (W, J, O, H, h, T, F, P, c, R, Z, j, A, g, B, k, Av, and K)
give teachers the tools to conduct effective formative assessment in order to
better target the specific deficiencies of the children in their classroom
train teachers in effective phonological awareness and decoding instructional techniques in order to build children’s ability to read words from letters as
they increase their letter knowledge
give children improved explicit instruction and practice in phonological
awareness and decoding skills as they work toward mastering their letters
provide students who struggle to read more practice with verbal interaction by encouraging parents to tell more stories to their children, ask more
questions of their children, and simply engage their children in conversation
more frequently
recognize students who can already read as valuable resource to help their
nonreading peers catch up through programs such as Reading Buddies
encourage teachers and parents to ask different types of questions about the texts that children read or were read. Questions should not be limited to
factual ones, but should also include inferential, evaluative and summary
questions
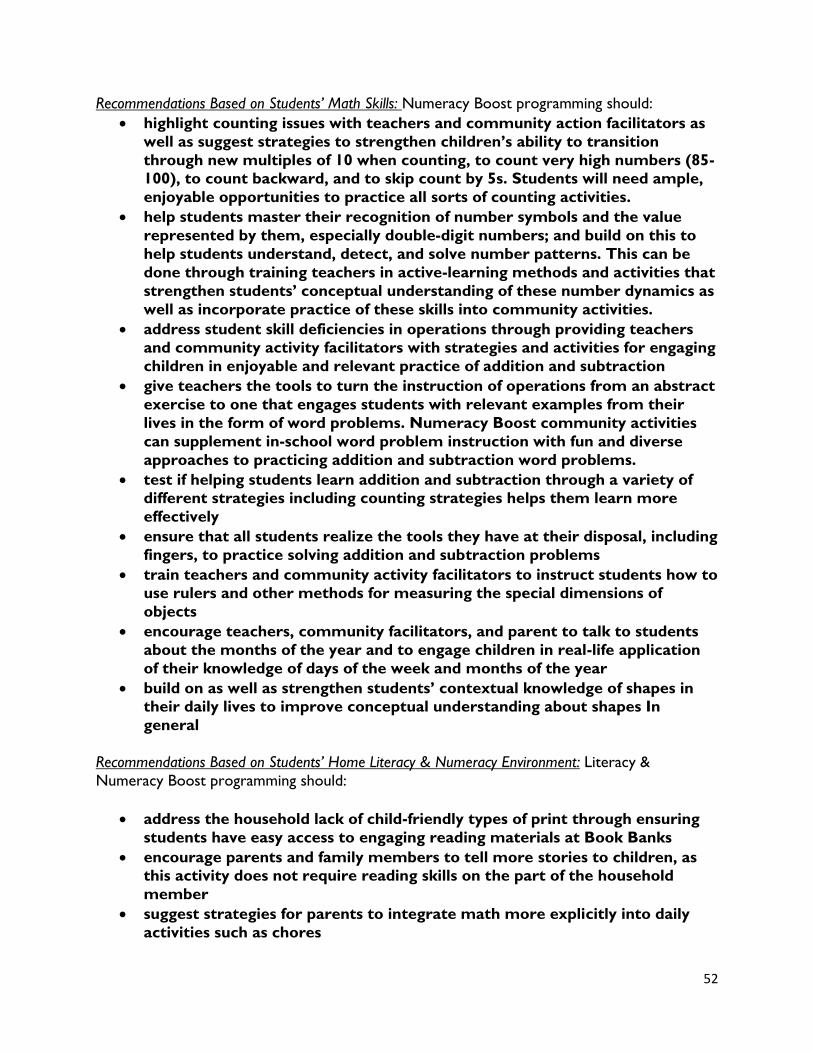
52
Recommendations Based on Students’ Math Skills: Numeracy Boost programming should:
highlight counting issues with teachers and community action facilitators as
well as suggest strategies to strengthen children’s ability to transition
through new multiples of 10 when counting, to count very high numbers (85-100), to count backward, and to skip count by 5s. Students will need ample,
enjoyable opportunities to practice all sorts of counting activities.
help students master their recognition of number symbols and the value
represented by them, especially double-digit numbers; and build on this to
help students understand, detect, and solve number patterns. This can be
done through training teachers in active-learning methods and activities that
strengthen students’ conceptual understanding of these number dynamics as
well as incorporate practice of these skills into community activities.
address student skill deficiencies in operations through providing teachers
and community activity facilitators with strategies and activities for engaging
children in enjoyable and relevant practice of addition and subtraction
give teachers the tools to turn the instruction of operations from an abstract
exercise to one that engages students with relevant examples from their
lives in the form of word problems. Numeracy Boost community activities
can supplement in-school word problem instruction with fun and diverse
approaches to practicing addition and subtraction word problems.
test if helping students learn addition and subtraction through a variety of different strategies including counting strategies helps them learn more
effectively
ensure that all students realize the tools they have at their disposal, including
fingers, to practice solving addition and subtraction problems
train teachers and community activity facilitators to instruct students how to use rulers and other methods for measuring the special dimensions of
objects
encourage teachers, community facilitators, and parent to talk to students
about the months of the year and to engage children in real-life application
of their knowledge of days of the week and months of the year
build on as well as strengthen students’ contextual knowledge of shapes in their daily lives to improve conceptual understanding about shapes In
general
Recommendations Based on Students’ Home Literacy & Numeracy Environment: Literacy &
Numeracy Boost programming should:
address the household lack of child-friendly types of print through ensuring
students have easy access to engaging reading materials at Book Banks
encourage parents and family members to tell more stories to children, as this activity does not require reading skills on the part of the household
member
suggest strategies for parents to integrate math more explicitly into daily
activities such as chores
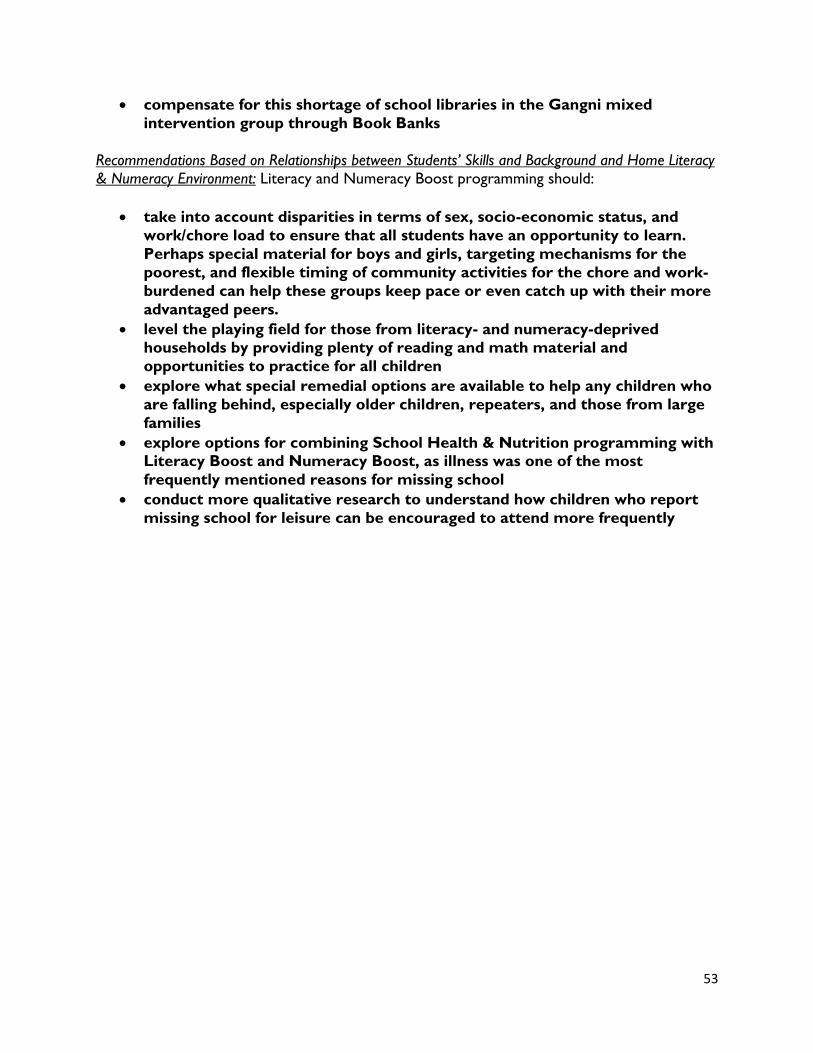
53
compensate for this shortage of school libraries in the Gangni mixed
intervention group through Book Banks
Recommendations Based on Relationships between Students’ Skills and Background and Home Literacy & Numeracy Environment: Literacy and Numeracy Boost programming should:
take into account disparities in terms of sex, socio-economic status, and
work/chore load to ensure that all students have an opportunity to learn.
Perhaps special material for boys and girls, targeting mechanisms for the
poorest, and flexible timing of community activities for the chore and work-
burdened can help these groups keep pace or even catch up with their more
advantaged peers.
level the playing field for those from literacy- and numeracy-deprived
households by providing plenty of reading and math material and
opportunities to practice for all children
explore what special remedial options are available to help any children who
are falling behind, especially older children, repeaters, and those from large
families
explore options for combining School Health & Nutrition programming with Literacy Boost and Numeracy Boost, as illness was one of the most
frequently mentioned reasons for missing school
conduct more qualitative research to understand how children who report
missing school for leisure can be encouraged to attend more frequently
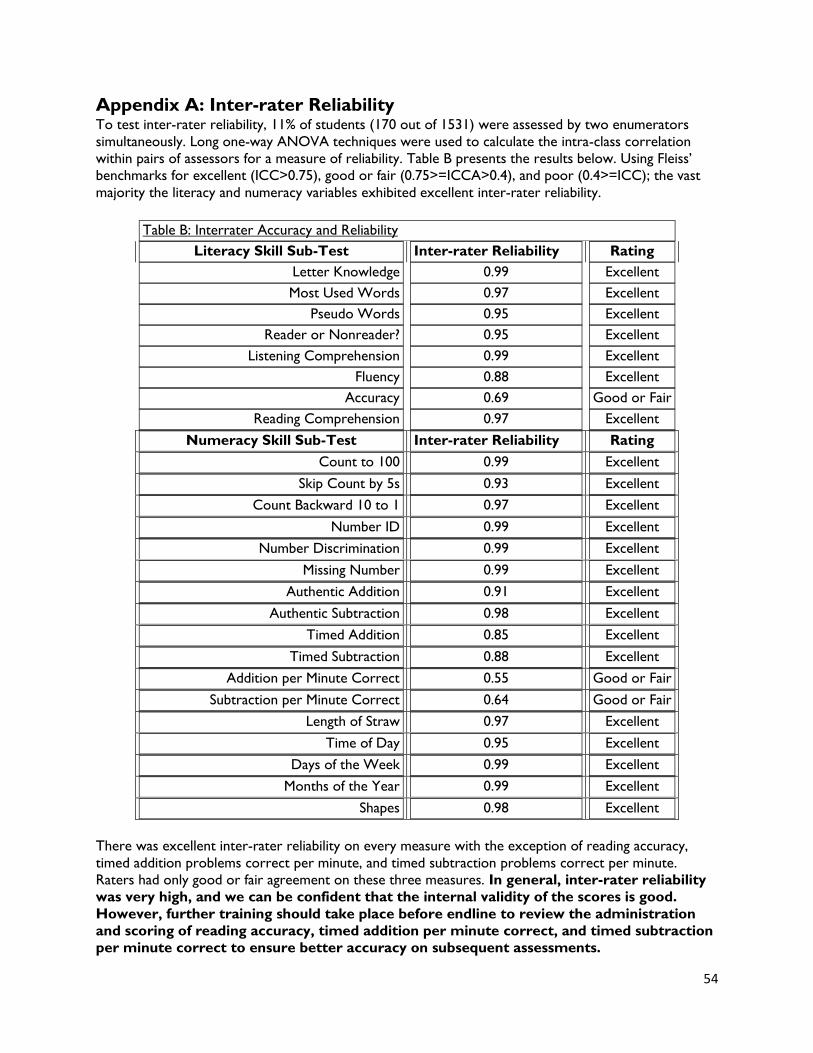
54
Appendix A: Inter-rater Reliability To test inter-rater reliability, 11% of students (170 out of 1531) were assessed by two enumerators
simultaneously. Long one-way ANOVA techniques were used to calculate the intra-class correlation
within pairs of assessors for a measure of reliability. Table B presents the results below. Using Fleiss’
benchmarks for excellent (ICC>0.75), good or fair (0.75>=ICCA>0.4), and poor (0.4>=ICC); the vast
majority the literacy and numeracy variables exhibited excellent inter-rater reliability.
Table B: Interrater Accuracy and Reliability
Literacy Skill Sub-Test Inter-rater Reliability Rating
Letter Knowledge 0.99 Excellent
Most Used Words 0.97 Excellent
Pseudo Words 0.95 Excellent
Reader or Nonreader? 0.95 Excellent
Listening Comprehension 0.99 Excellent
Fluency 0.88 Excellent
Accuracy 0.69 Good or Fair
Reading Comprehension 0.97 Excellent
Numeracy Skill Sub-Test Inter-rater Reliability Rating
Count to 100 0.99 Excellent
Skip Count by 5s 0.93 Excellent
Count Backward 10 to 1 0.97 Excellent
Number ID 0.99 Excellent
Number Discrimination 0.99 Excellent
Missing Number 0.99 Excellent
Authentic Addition 0.91 Excellent
Authentic Subtraction 0.98 Excellent
Timed Addition 0.85 Excellent
Timed Subtraction 0.88 Excellent
Addition per Minute Correct 0.55 Good or Fair
Subtraction per Minute Correct 0.64 Good or Fair
Length of Straw 0.97 Excellent
Time of Day 0.95 Excellent
Days of the Week 0.99 Excellent
Months of the Year 0.99 Excellent
Shapes 0.98 Excellent
There was excellent inter-rater reliability on every measure with the exception of reading accuracy,
timed addition problems correct per minute, and timed subtraction problems correct per minute.
Raters had only good or fair agreement on these three measures. In general, inter-rater reliability
was very high, and we can be confident that the internal validity of the scores is good.
However, further training should take place before endline to review the administration
and scoring of reading accuracy, timed addition per minute correct, and timed subtraction
per minute correct to ensure better accuracy on subsequent assessments.
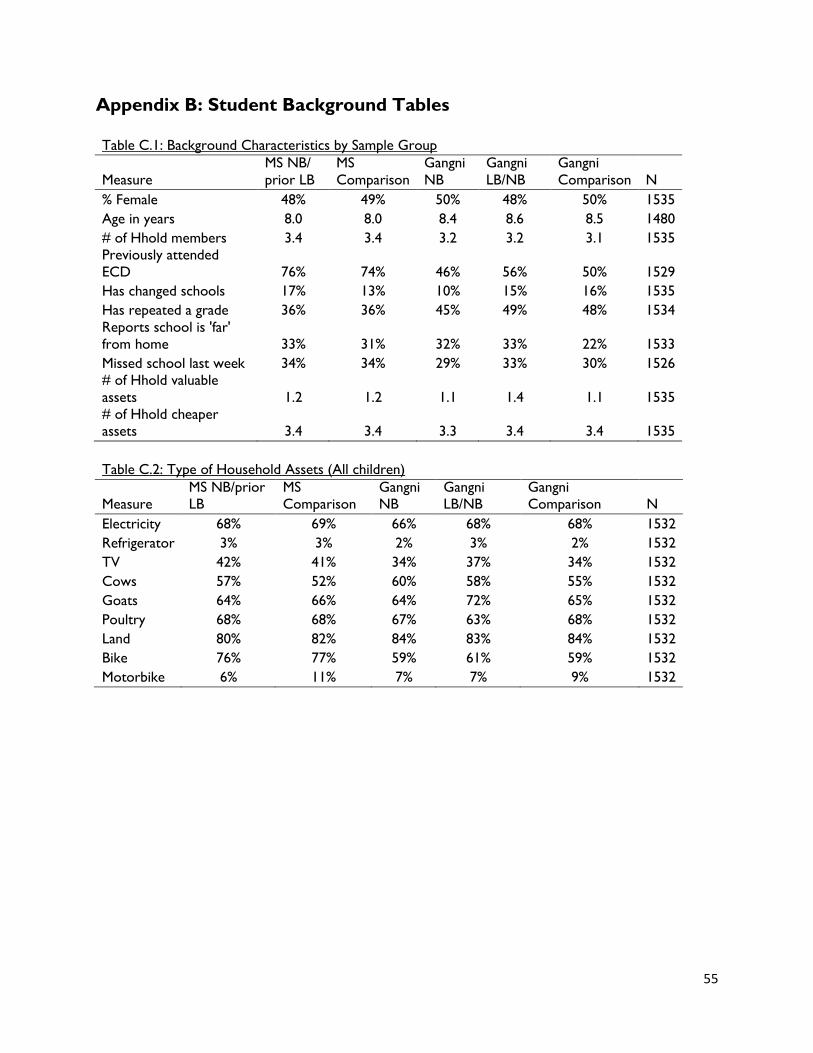
55
Appendix B: Student Background Tables
Table C.1: Background Characteristics by Sample Group
Measure
MS NB/
prior LB
MS
Comparison
Gangni
NB
Gangni
LB/NB
Gangni
Comparison N
% Female 48% 49% 50% 48% 50% 1535
Age in years 8.0 8.0 8.4 8.6 8.5 1480
# of Hhold members 3.4 3.4 3.2 3.2 3.1 1535
Previously attended
ECD 76% 74% 46% 56% 50% 1529
Has changed schools 17% 13% 10% 15% 16% 1535
Has repeated a grade 36% 36% 45% 49% 48% 1534
Reports school is 'far'
from home 33% 31% 32% 33% 22% 1533
Missed school last week 34% 34% 29% 33% 30% 1526
# of Hhold valuable
assets 1.2 1.2 1.1 1.4 1.1 1535
# of Hhold cheaper
assets 3.4 3.4 3.3 3.4 3.4 1535
Table C.2: Type of Household Assets (All children)
Measure
MS NB/prior
LB
MS
Comparison
Gangni
NB
Gangni
LB/NB
Gangni
Comparison N
Electricity 68% 69% 66% 68% 68% 1532
Refrigerator 3% 3% 2% 3% 2% 1532
TV 42% 41% 34% 37% 34% 1532
Cows 57% 52% 60% 58% 55% 1532
Goats 64% 66% 64% 72% 65% 1532
Poultry 68% 68% 67% 63% 68% 1532
Land 80% 82% 84% 83% 84% 1532
Bike 76% 77% 59% 61% 59% 1532
Motorbike 6% 11% 7% 7% 9% 1532
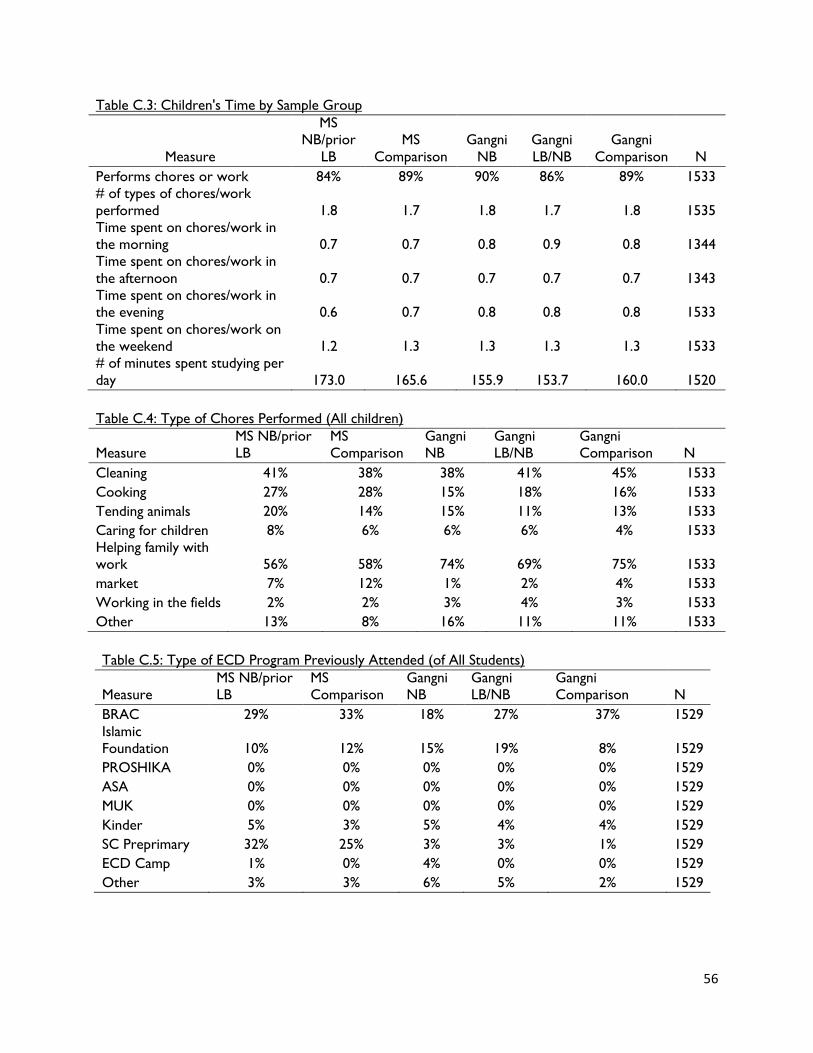
56
Table C.3: Children's Time by Sample Group
Measure
MS
NB/prior
LB
MS
Comparison
Gangni
NB
Gangni
LB/NB
Gangni
Comparison N
Performs chores or work 84% 89% 90% 86% 89% 1533
# of types of chores/work
performed 1.8 1.7 1.8 1.7 1.8 1535
Time spent on chores/work in
the morning 0.7 0.7 0.8 0.9 0.8 1344
Time spent on chores/work in
the afternoon 0.7 0.7 0.7 0.7 0.7 1343
Time spent on chores/work in
the evening 0.6 0.7 0.8 0.8 0.8 1533
Time spent on chores/work on
the weekend 1.2 1.3 1.3 1.3 1.3 1533
# of minutes spent studying per
day 173.0 165.6 155.9 153.7 160.0 1520
Table C.4: Type of Chores Performed (All children)
Measure
MS NB/prior
LB
MS
Comparison
Gangni
NB
Gangni
LB/NB
Gangni
Comparison N
Cleaning 41% 38% 38% 41% 45% 1533
Cooking 27% 28% 15% 18% 16% 1533
Tending animals 20% 14% 15% 11% 13% 1533
Caring for children 8% 6% 6% 6% 4% 1533
Helping family with
work 56% 58% 74% 69% 75% 1533
market 7% 12% 1% 2% 4% 1533
Working in the fields 2% 2% 3% 4% 3% 1533
Other 13% 8% 16% 11% 11% 1533
Table C.5: Type of ECD Program Previously Attended (of All Students)
Measure
MS NB/prior
LB
MS
Comparison
Gangni
NB
Gangni
LB/NB
Gangni
Comparison N
BRAC 29% 33% 18% 27% 37% 1529
Islamic
Foundation 10% 12% 15% 19% 8% 1529
PROSHIKA 0% 0% 0% 0% 0% 1529
ASA 0% 0% 0% 0% 0% 1529
MUK 0% 0% 0% 0% 0% 1529
Kinder 5% 3% 5% 4% 4% 1529
SC Preprimary 32% 25% 3% 3% 1% 1529
ECD Camp 1% 0% 4% 0% 0% 1529
Other 3% 3% 6% 5% 2% 1529
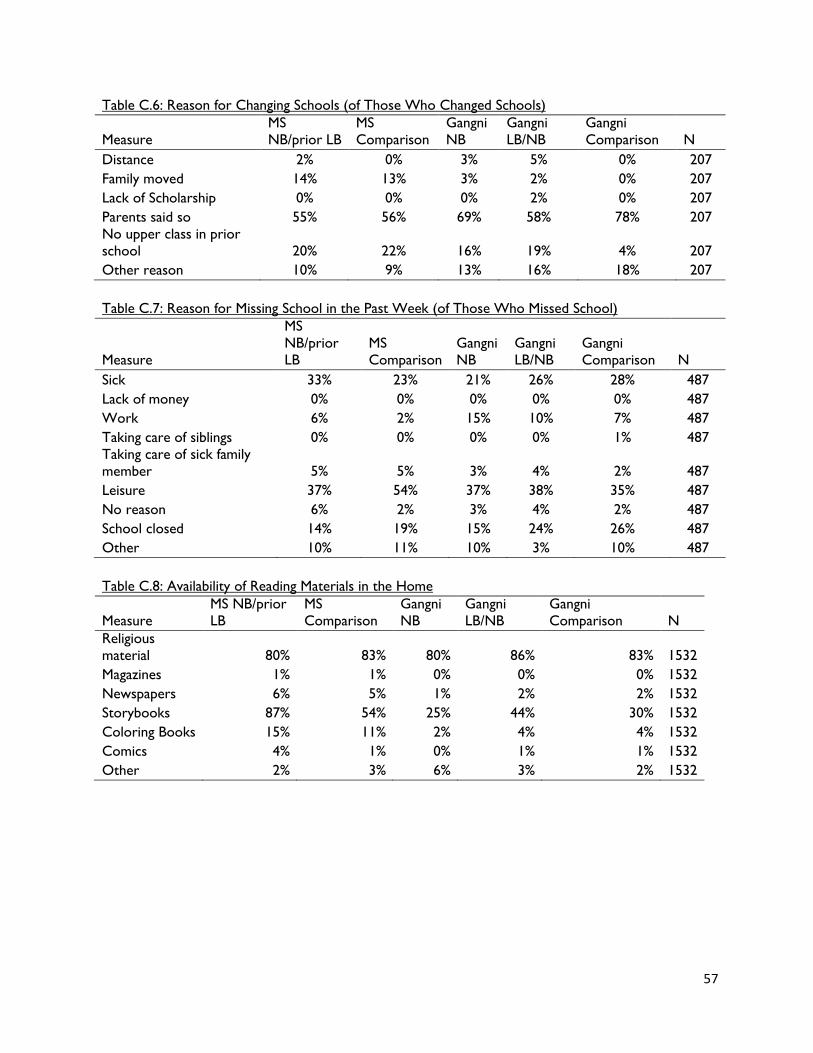
57
Table C.6: Reason for Changing Schools (of Those Who Changed Schools)
Measure
MS
NB/prior LB
MS
Comparison
Gangni
NB
Gangni
LB/NB
Gangni
Comparison N
Distance 2% 0% 3% 5% 0% 207
Family moved 14% 13% 3% 2% 0% 207
Lack of Scholarship 0% 0% 0% 2% 0% 207
Parents said so 55% 56% 69% 58% 78% 207
No upper class in prior
school 20% 22% 16% 19% 4% 207
Other reason 10% 9% 13% 16% 18% 207
Table C.7: Reason for Missing School in the Past Week (of Those Who Missed School)
Measure
MS
NB/prior
LB
MS
Comparison
Gangni
NB
Gangni
LB/NB
Gangni
Comparison N
Sick 33% 23% 21% 26% 28% 487
Lack of money 0% 0% 0% 0% 0% 487
Work 6% 2% 15% 10% 7% 487
Taking care of siblings 0% 0% 0% 0% 1% 487
Taking care of sick family
member 5% 5% 3% 4% 2% 487
Leisure 37% 54% 37% 38% 35% 487
No reason 6% 2% 3% 4% 2% 487
School closed 14% 19% 15% 24% 26% 487
Other 10% 11% 10% 3% 10% 487
Table C.8: Availability of Reading Materials in the Home
Measure
MS NB/prior
LB
MS
Comparison
Gangni
NB
Gangni
LB/NB
Gangni
Comparison N
Religious
material 80% 83% 80% 86% 83% 1532
Magazines 1% 1% 0% 0% 0% 1532
Newspapers 6% 5% 1% 2% 2% 1532
Storybooks 87% 54% 25% 44% 30% 1532
Coloring Books 15% 11% 2% 4% 4% 1532
Comics 4% 1% 0% 1% 1% 1532
Other 2% 3% 6% 3% 2% 1532
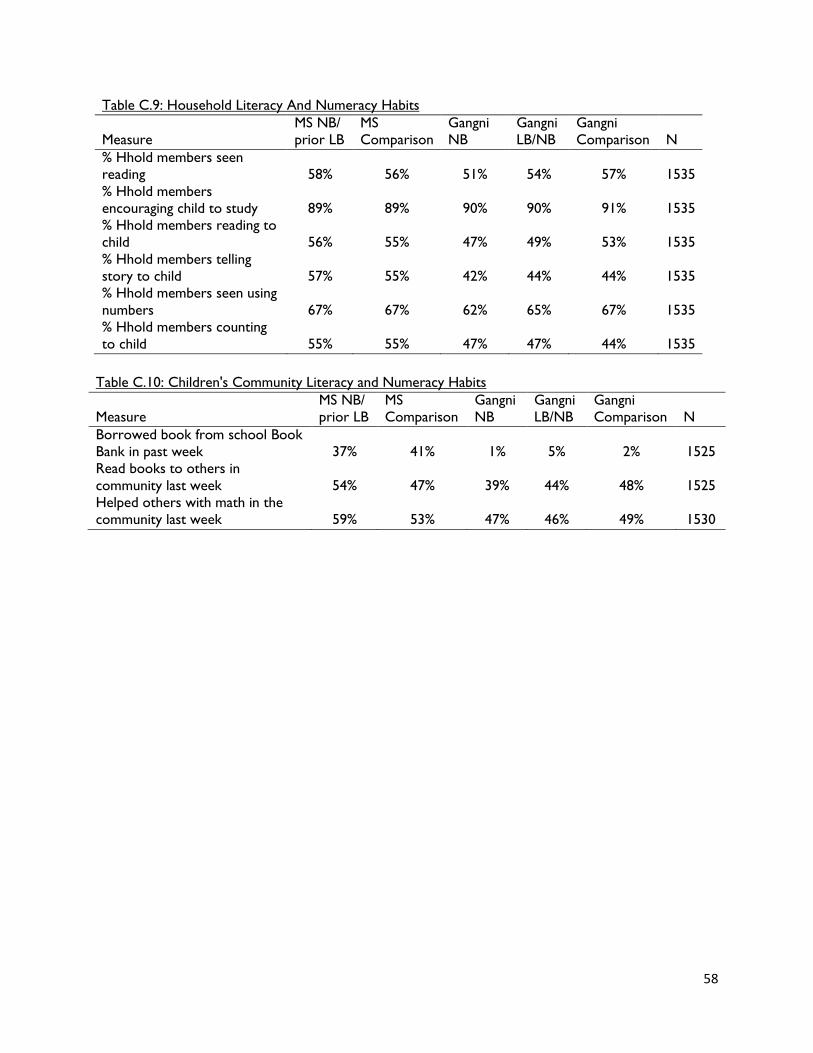
58
Table C.9: Household Literacy And Numeracy Habits
Measure
MS NB/
prior LB
MS
Comparison
Gangni
NB
Gangni
LB/NB
Gangni
Comparison N
% Hhold members seen
reading 58% 56% 51% 54% 57% 1535
% Hhold members
encouraging child to study 89% 89% 90% 90% 91% 1535
% Hhold members reading to
child 56% 55% 47% 49% 53% 1535
% Hhold members telling
story to child 57% 55% 42% 44% 44% 1535
% Hhold members seen using
numbers 67% 67% 62% 65% 67% 1535
% Hhold members counting
to child 55% 55% 47% 47% 44% 1535
Table C.10: Children's Community Literacy and Numeracy Habits
Measure
MS NB/
prior LB
MS
Comparison
Gangni
NB
Gangni
LB/NB
Gangni
Comparison N
Borrowed book from school Book
Bank in past week 37% 41% 1% 5% 2% 1525
Read books to others in
community last week 54% 47% 39% 44% 48% 1525
Helped others with math in the
community last week 59% 53% 47% 46% 49% 1530
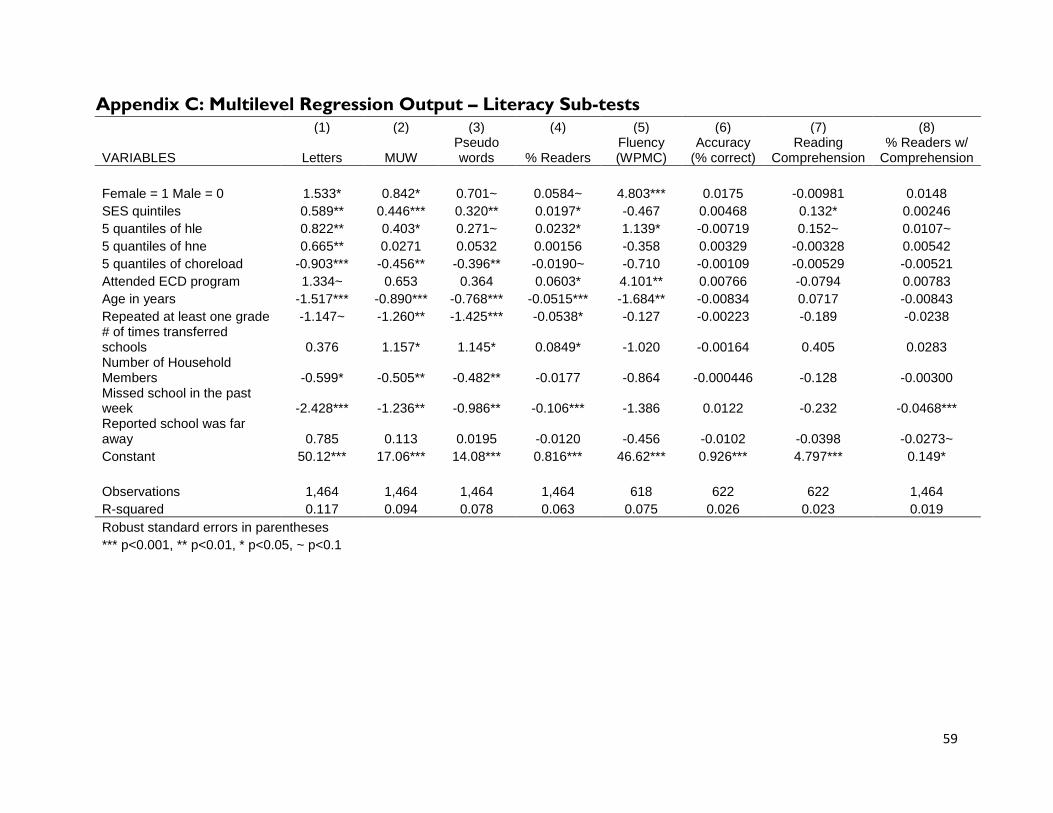
59
Appendix C: Multilevel Regression Output – Literacy Sub-tests
(1) (2) (3) (4) (5) (6) (7) (8)
VARIABLES Letters MUW Pseudo words % Readers
Fluency (WPMC)
Accuracy (% correct)
Reading Comprehension
% Readers w/ Comprehension
Female = 1 Male = 0 1.533* 0.842* 0.701~ 0.0584~ 4.803*** 0.0175 -0.00981 0.0148
SES quintiles 0.589** 0.446*** 0.320** 0.0197* -0.467 0.00468 0.132* 0.00246
5 quantiles of hle 0.822** 0.403* 0.271~ 0.0232* 1.139* -0.00719 0.152~ 0.0107~
5 quantiles of hne 0.665** 0.0271 0.0532 0.00156 -0.358 0.00329 -0.00328 0.00542
5 quantiles of choreload -0.903*** -0.456** -0.396** -0.0190~ -0.710 -0.00109 -0.00529 -0.00521
Attended ECD program 1.334~ 0.653 0.364 0.0603* 4.101** 0.00766 -0.0794 0.00783
Age in years -1.517*** -0.890*** -0.768*** -0.0515*** -1.684** -0.00834 0.0717 -0.00843
Repeated at least one grade -1.147~ -1.260** -1.425*** -0.0538* -0.127 -0.00223 -0.189 -0.0238 # of times transferred schools 0.376 1.157* 1.145* 0.0849* -1.020 -0.00164 0.405 0.0283 Number of Household Members -0.599* -0.505** -0.482** -0.0177 -0.864 -0.000446 -0.128 -0.00300 Missed school in the past week -2.428*** -1.236** -0.986** -0.106*** -1.386 0.0122 -0.232 -0.0468*** Reported school was far away 0.785 0.113 0.0195 -0.0120 -0.456 -0.0102 -0.0398 -0.0273~
Constant 50.12*** 17.06*** 14.08*** 0.816*** 46.62*** 0.926*** 4.797*** 0.149*
Observations 1,464 1,464 1,464 1,464 618 622 622 1,464
R-squared 0.117 0.094 0.078 0.063 0.075 0.026 0.023 0.019
Robust standard errors in parentheses
*** p<0.001, ** p<0.01, * p<0.05, ~ p<0.1
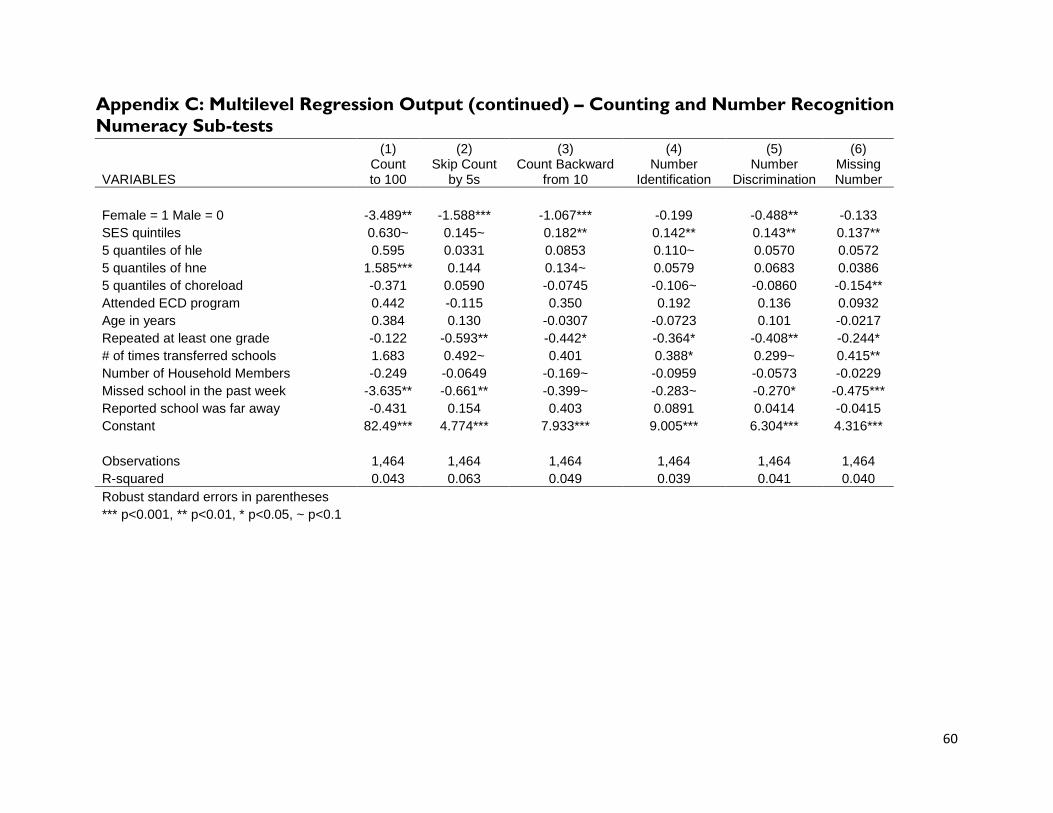
60
Appendix C: Multilevel Regression Output (continued) – Counting and Number Recognition
Numeracy Sub-tests
(1) (2) (3) (4) (5) (6)
VARIABLES Count to 100
Skip Count by 5s
Count Backward from 10
Number Identification
Number Discrimination
Missing Number
Female = 1 Male = 0 -3.489** -1.588*** -1.067*** -0.199 -0.488** -0.133
SES quintiles 0.630~ 0.145~ 0.182** 0.142** 0.143** 0.137**
5 quantiles of hle 0.595 0.0331 0.0853 0.110~ 0.0570 0.0572
5 quantiles of hne 1.585*** 0.144 0.134~ 0.0579 0.0683 0.0386
5 quantiles of choreload -0.371 0.0590 -0.0745 -0.106~ -0.0860 -0.154**
Attended ECD program 0.442 -0.115 0.350 0.192 0.136 0.0932
Age in years 0.384 0.130 -0.0307 -0.0723 0.101 -0.0217
Repeated at least one grade -0.122 -0.593** -0.442* -0.364* -0.408** -0.244*
# of times transferred schools 1.683 0.492~ 0.401 0.388* 0.299~ 0.415**
Number of Household Members -0.249 -0.0649 -0.169~ -0.0959 -0.0573 -0.0229
Missed school in the past week -3.635** -0.661** -0.399~ -0.283~ -0.270* -0.475***
Reported school was far away -0.431 0.154 0.403 0.0891 0.0414 -0.0415
Constant 82.49*** 4.774*** 7.933*** 9.005*** 6.304*** 4.316***
Observations 1,464 1,464 1,464 1,464 1,464 1,464
R-squared 0.043 0.063 0.049 0.039 0.041 0.040
Robust standard errors in parentheses *** p<0.001, ** p<0.01, * p<0.05, ~ p<0.1
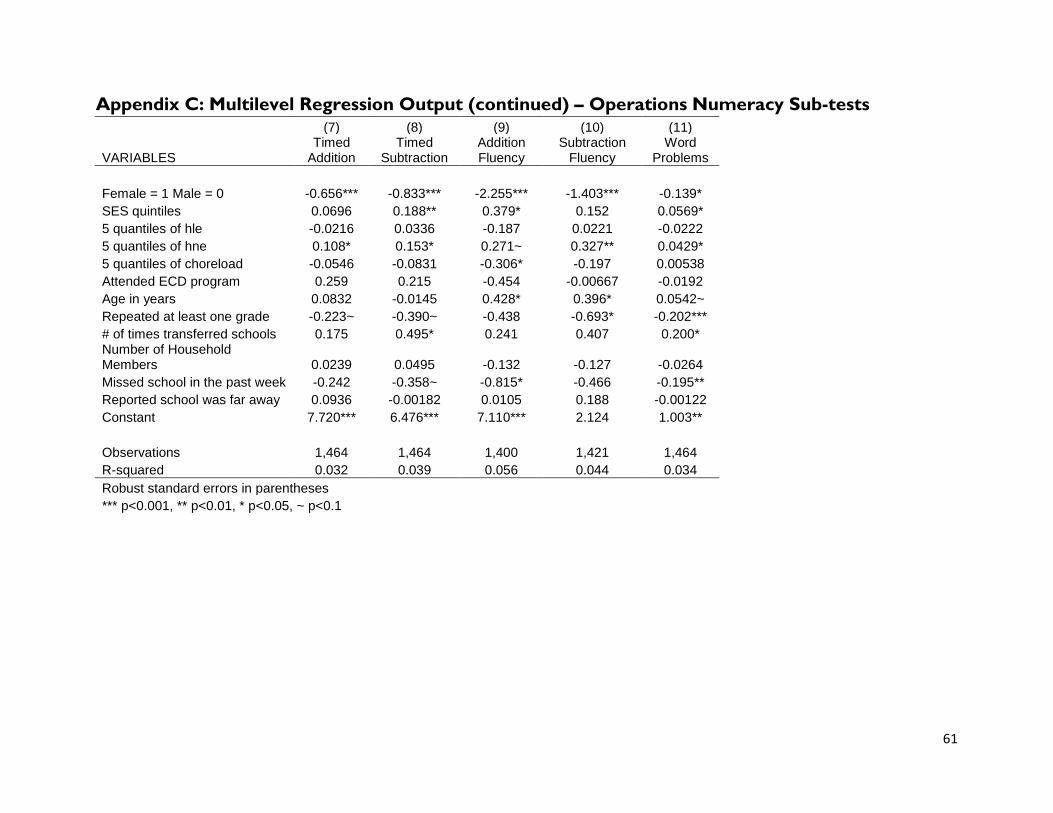
61
Appendix C: Multilevel Regression Output (continued) – Operations Numeracy Sub-tests
(7) (8) (9) (10) (11)
VARIABLES Timed
Addition Timed
Subtraction Addition Fluency
Subtraction Fluency
Word Problems
Female = 1 Male = 0 -0.656*** -0.833*** -2.255*** -1.403*** -0.139*
SES quintiles 0.0696 0.188** 0.379* 0.152 0.0569*
5 quantiles of hle -0.0216 0.0336 -0.187 0.0221 -0.0222
5 quantiles of hne 0.108* 0.153* 0.271~ 0.327** 0.0429*
5 quantiles of choreload -0.0546 -0.0831 -0.306* -0.197 0.00538
Attended ECD program 0.259 0.215 -0.454 -0.00667 -0.0192
Age in years 0.0832 -0.0145 0.428* 0.396* 0.0542~
Repeated at least one grade -0.223~ -0.390~ -0.438 -0.693* -0.202***
# of times transferred schools 0.175 0.495* 0.241 0.407 0.200* Number of Household Members 0.0239 0.0495 -0.132 -0.127 -0.0264
Missed school in the past week -0.242 -0.358~ -0.815* -0.466 -0.195**
Reported school was far away 0.0936 -0.00182 0.0105 0.188 -0.00122
Constant 7.720*** 6.476*** 7.110*** 2.124 1.003**
Observations 1,464 1,464 1,400 1,421 1,464
R-squared 0.032 0.039 0.056 0.044 0.034
Robust standard errors in parentheses *** p<0.001, ** p<0.01, * p<0.05, ~ p<0.1
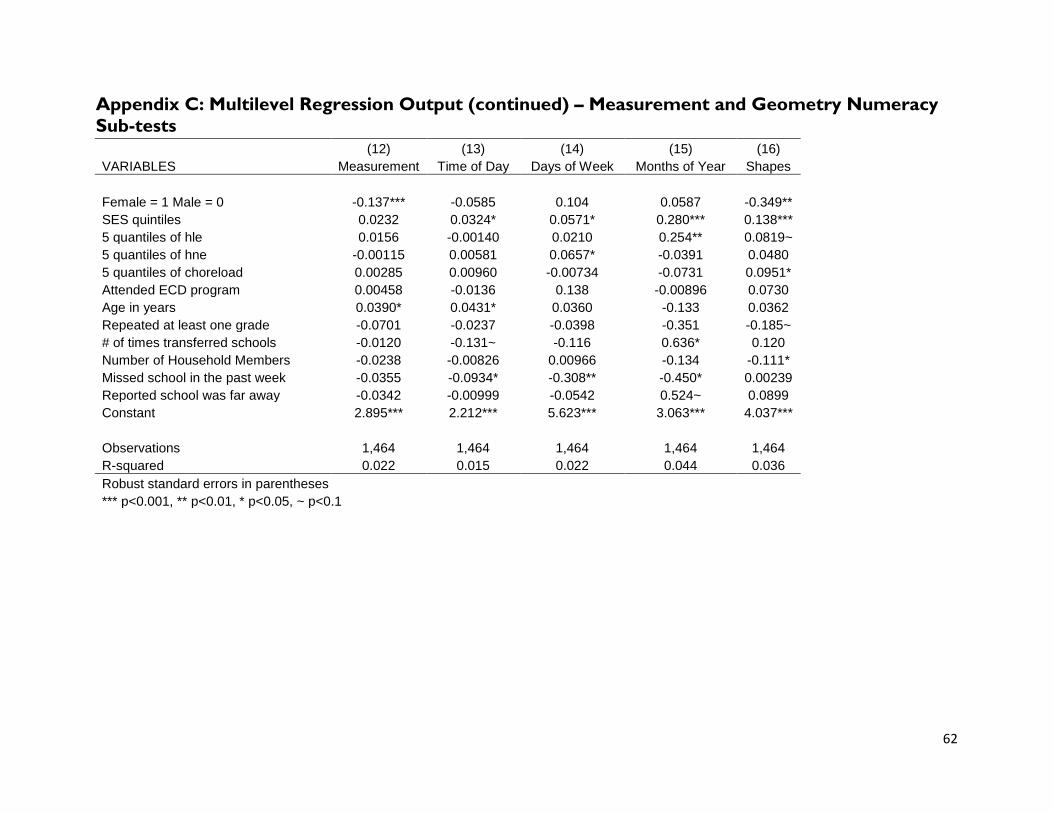
62
Appendix C: Multilevel Regression Output (continued) – Measurement and Geometry Numeracy
Sub-tests
(12) (13) (14) (15) (16)
VARIABLES Measurement Time of Day Days of Week Months of Year Shapes
Female = 1 Male = 0 -0.137*** -0.0585 0.104 0.0587 -0.349**
SES quintiles 0.0232 0.0324* 0.0571* 0.280*** 0.138***
5 quantiles of hle 0.0156 -0.00140 0.0210 0.254** 0.0819~
5 quantiles of hne -0.00115 0.00581 0.0657* -0.0391 0.0480
5 quantiles of choreload 0.00285 0.00960 -0.00734 -0.0731 0.0951*
Attended ECD program 0.00458 -0.0136 0.138 -0.00896 0.0730
Age in years 0.0390* 0.0431* 0.0360 -0.133 0.0362
Repeated at least one grade -0.0701 -0.0237 -0.0398 -0.351 -0.185~
# of times transferred schools -0.0120 -0.131~ -0.116 0.636* 0.120
Number of Household Members -0.0238 -0.00826 0.00966 -0.134 -0.111*
Missed school in the past week -0.0355 -0.0934* -0.308** -0.450* 0.00239
Reported school was far away -0.0342 -0.00999 -0.0542 0.524~ 0.0899
Constant 2.895*** 2.212*** 5.623*** 3.063*** 4.037***
Observations 1,464 1,464 1,464 1,464 1,464
R-squared 0.022 0.015 0.022 0.044 0.036
Robust standard errors in parentheses *** p<0.001, ** p<0.01, * p<0.05, ~ p<0.1