Embed Size (px)
Citation preview
8200 | Phys. Chem. Chem. Phys., 2021, 23, 8200–8221 This journal is © the Owner Societies 2021
Cite this: Phys. Chem. Chem. Phys.,
2021, 23, 8200
Lithium ion battery degradation: what you needto know
Jacqueline S. Edge, ab Simon O’Kane,ab Ryan Prosser,ab Niall D. Kirkaldy,a
Anisha N. Patel, a Alastair Hales,a Abir Ghosh,abc Weilong Ai, bd Jingyi Chen,d
Jiang Yang, a Shen Li,a Mei-Chin Pang,ab Laura Bravo Diaz, a Anna Tomaszewska, d
M. Waseem Marzook,a Karthik N. Radhakrishnan, a Huizhi Wang,a Yatish Patel,a
Billy Wubd and Gregory J. Offer *ab
The expansion of lithium-ion batteries from consumer electronics to larger-scale transport and energy
storage applications has made understanding the many mechanisms responsible for battery degradation
increasingly important. The literature in this complex topic has grown considerably; this perspective aims
to distil current knowledge into a succinct form, as a reference and a guide to understanding battery
degradation. Unlike other reviews, this work emphasises the coupling between the different mechanisms
and the different physical and chemical approaches used to trigger, identify and monitor various
mechanisms, as well as the various computational models that attempt to simulate these interactions.
Degradation is separated into three levels: the actual mechanisms themselves, the observable
consequences at cell level called modes and the operational effects such as capacity or power fade.
Five principal and thirteen secondary mechanisms were found that are generally considered to be the
cause of degradation during normal operation, which all give rise to five observable modes. A flowchart
illustrates the different feedback loops that couple the various forms of degradation, whilst a table is
presented to highlight the experimental conditions that are most likely to trigger specific degradation
mechanisms. Together, they provide a powerful guide to designing experiments or models for
investigating battery degradation.
Introduction
Understanding battery degradation is critical for cost-effectivedecarbonisation of both energy grids1 and transport.2 However,battery degradation is often presented as complicated anddifficult to understand. This perspective aims to distil theknowledge gained by the scientific community to date into asuccinct form, highlighting the minimum number of papersthat need to be read in order to understand lithium ion battery(LIB) degradation. Other recent reviews in this area includeKabir et al.,3 providing a classification for degradation mechanismsand modes and briefly covering key experimental techniques;Hapuarachichi et al.,5 having a strong focus on in situ experimentaltechniques for assessing anode degradation; Woody et al.,6 drawingout implications for best practise in LIB use and Pender et al.,7
covering the degradation of electrode materials for the extendedLIB family. This perspective provides a simple and consistentclassification for the main mechanisms affecting lithium inter-calation materials, draws out the link between degradationmechanisms and their triggering conditions and highlights theinterconnection between various mechanisms, presenting the com-plexity through updated figures and tables in an accessible way.
The rapid market expansion for LIBs8 is driving down cost,but making LIBs last longer is just as important. This improvesthe lifetime economics, enables longer warranties4 and dilutesthe environmental impacts associated with raw material extractionand manufacturing.9,10 Understanding battery degradation is keyto increasing operational lifetime. Being able to accurately predictbattery end-of-life (EoL) enables the risks of thermal runaway to beminimised.11
With time and use, the storage capacity of LIBs diminishesand the internal resistance increases,12 due to a wide range ofdegradation mechanisms, some occurring simultaneously, ortriggering further mechanisms. Some usage patterns and operatingconditions lead to rapid degradation by one or more processes andthe interplay between mechanisms is still not well understood.13
This perspective presents a state-of-the-art picture of the most
a Department of Mechanical Engineering, Imperial College London, London SW7
2AZ, UK. E-mail: [email protected] The Faraday Institution, Quad One, Becquerel Avenue, Harwell Campus, Didcot,
OX11 0RA, UKc Department of Chemical Engineering and Technology, Indian Institute of
Technology (BHU), Varanasi, Uttar Pradesh 221005, Indiad Dyson School of Design Engineering, Imperial College London, London SW7 2AZ, UK
Received 25th January 2021,Accepted 22nd March 2021
DOI: 10.1039/d1cp00359c
rsc.li/pccp
PCCP
PERSPECTIVE
Ope
n A
cces
s A
rtic
le. P
ublis
hed
on 2
2 M
arch
202
1. D
ownl
oade
d on
1/1
6/20
22 1
2:17
:31
AM
. T
his
artic
le is
lice
nsed
und
er a
Cre
ativ
e C
omm
ons
Attr
ibut
ion
3.0
Unp
orte
d L
icen
ce.
View Article OnlineView Journal | View Issue
This journal is © the Owner Societies 2021 Phys. Chem. Chem. Phys., 2021, 23, 8200–8221 | 8201
prominent degradation processes, presenting the latest under-standing of each mechanism, experimental techniques andconditions that can trigger and/or exacerbate the degradationcaused by that mechanism and the models which have beenproposed to simulate it.
From a user’s perspective, there are three main externalstress factors that influence degradation: temperature, state ofcharge (SoC) and load profile. The relative importance of eachof these factors varies depending on the chemistry, form factorand historic use conditions, among others. Works such as Birklet al.14 have highlighted how these stress factors can influencethe underpinning physical degradation processes, with modelssuch as those reviewed in Reniers et al.,13 showing how individualmechanisms can be described. In general, temperature is the mostsignificant stress factor, where deviations from the typical 25 1Ccan lead to accelerated failure.15 Higher SoC operation acceleratesdegradation, due to the relationship between the electrodepotentials and the rate of parasitic side reactions, while highercurrent operation increases the likelihood of failure, due tomechanical stresses developing in the battery during cycling,but also promotion of lithium plating during charge.
The magnitude of these influences is also dependent onsecondary factors, such as subtle manufacturing defects. Harriset al.,16 for instance, demonstrated the variability in lifetime of24 nominally identical pouch cells, all cycled with the sameload profile. While the root cause of this variability is stilldebated, slight variations in manufacturing conditions arelikely to have played a role, thus highlighting the need forstatistically significant sample sizes. This is further amplified bysensitivity to testing conditions often not controlled nor measured,such as the application of external pressure to pouch cells orthermal gradients that build up, due to internal heat generation.
Recently,17,18 attention has been drawn to the importance ofpath dependence,19 i.e. the order in which the various degradationmechanisms are triggered through either calendar ageing, occur-ring while the battery is at rest, or cycle ageing, when the battery isin use or being charged. In real world usage patterns, periods ofrapid (dis)charging may be interspersed with slower (dis)chargingor periods of idleness, therefore investigations of this aspect areneeded for more accurate lifetime prediction.
Given the topical nature of LIBs, many publications havepresented models to describe their degradation. However, inthe vast majority of cases, these are done in isolation of othermechanisms, ignoring their interplay. To date, the authors arenot aware of any fully comprehensive model capturing all effectsand their influences on each other. Some notable works haveattempted to link mechanisms together, such as Yang et al.,20
who showed how the growth of the solid–electrolyte interphase(SEI) layer leads to pore blockage and subsequently an increasein the rate of lithium plating, ultimately leading to a non-lineardrop-off in cell capacity. Beyond the importance of coupling theinteractions between the various degradation mechanisms, theimportance of path-dependency – i.e. which mechanism wastriggered first – is also often understated; with the sequence ofevents being an important factor in determining life, especiallyat higher current loads.17 These complex interactions often cannot
be captured accurately with empirical or semi-empirical models,instead needing physics-based models.
In this perspective, we cover the main mechanisms occurringduring normal operating conditions, within the safety limitsdefined by the manufacturer’s specifications. The structure ofthe perspective has three main sections, starting with descriptionsof the mechanisms, their consequences and interactions, followedby experimental techniques for characterising and triggering thesemechanisms. The third section covers the state-of-the art inmodelling these mechanisms, including a discussion on modelswhich attempt to capture the interactions between them.
Clarification of nomenclature
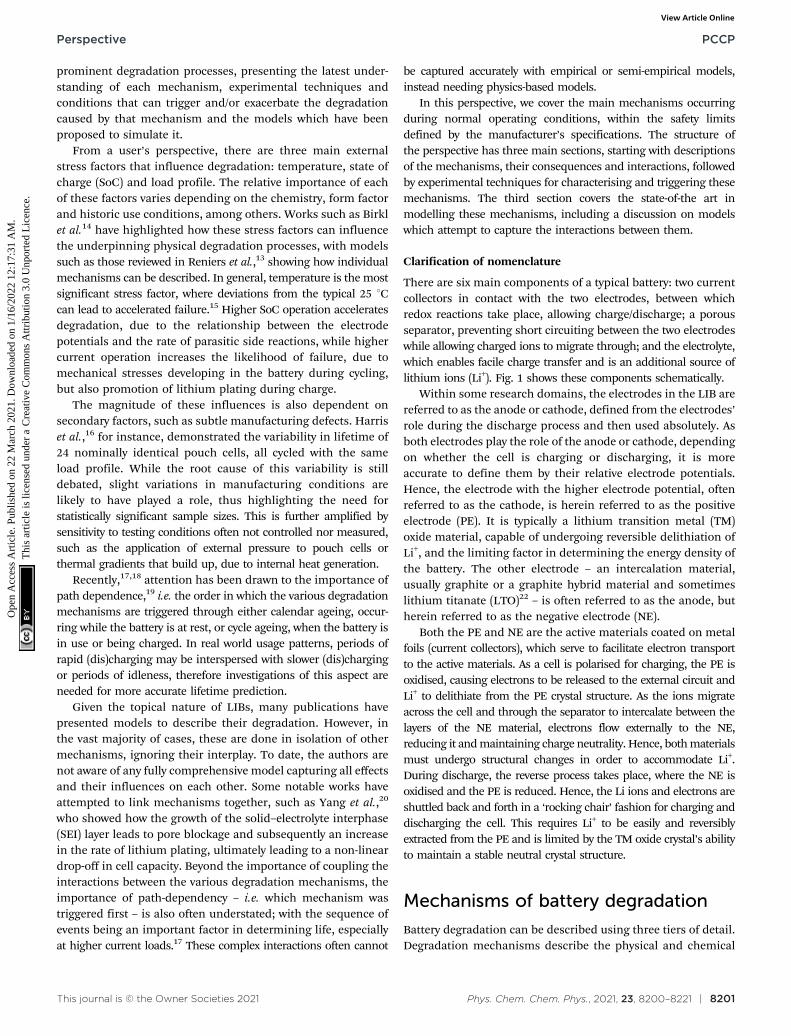
There are six main components of a typical battery: two currentcollectors in contact with the two electrodes, between whichredox reactions take place, allowing charge/discharge; a porousseparator, preventing short circuiting between the two electrodeswhile allowing charged ions to migrate through; and the electrolyte,which enables facile charge transfer and is an additional source oflithium ions (Li+). Fig. 1 shows these components schematically.
Within some research domains, the electrodes in the LIB arereferred to as the anode or cathode, defined from the electrodes’role during the discharge process and then used absolutely. Asboth electrodes play the role of the anode or cathode, dependingon whether the cell is charging or discharging, it is moreaccurate to define them by their relative electrode potentials.Hence, the electrode with the higher electrode potential, oftenreferred to as the cathode, is herein referred to as the positiveelectrode (PE). It is typically a lithium transition metal (TM)oxide material, capable of undergoing reversible delithiation ofLi+, and the limiting factor in determining the energy density ofthe battery. The other electrode – an intercalation material,usually graphite or a graphite hybrid material and sometimeslithium titanate (LTO)22 – is often referred to as the anode, butherein referred to as the negative electrode (NE).
Both the PE and NE are the active materials coated on metalfoils (current collectors), which serve to facilitate electron transportto the active materials. As a cell is polarised for charging, the PE isoxidised, causing electrons to be released to the external circuit andLi+ to delithiate from the PE crystal structure. As the ions migrateacross the cell and through the separator to intercalate between thelayers of the NE material, electrons flow externally to the NE,reducing it and maintaining charge neutrality. Hence, both materialsmust undergo structural changes in order to accommodate Li+.During discharge, the reverse process takes place, where the NE isoxidised and the PE is reduced. Hence, the Li ions and electrons areshuttled back and forth in a ‘rocking chair’ fashion for charging anddischarging the cell. This requires Li+ to be easily and reversiblyextracted from the PE and is limited by the TM oxide crystal’s abilityto maintain a stable neutral crystal structure.
Mechanisms of battery degradation
Battery degradation can be described using three tiers of detail.Degradation mechanisms describe the physical and chemical
Perspective PCCP
Ope
n A
cces
s A
rtic
le. P
ublis
hed
on 2
2 M
arch
202
1. D
ownl
oade
d on
1/1
6/20
22 1
2:17
:31
AM
. T
his
artic
le is
lice
nsed
und
er a
Cre
ativ
e C
omm
ons
Attr
ibut
ion
3.0
Unp
orte
d L
icen
ce.
View Article Online
8202 | Phys. Chem. Chem. Phys., 2021, 23, 8200–8221 This journal is © the Owner Societies 2021
changes that have occurred within the cell. Mechanisms are themost detailed viewpoint of degradation but are also typicallythe most difficult to observe during battery operation. Thedirectly observable effects of degradation are capacity fade andpower fade. Capacity fade is a reduction in the usable capacity ofthe cell and power fade is a reduction of the deliverable power ofthe cell after degradation. These observable effects are the leastdetailed viewpoint of degradation but are the easiest to measure.As a result, many practical measures of cell degradation are ofcapacity fade and power fade.
Between degradation mechanisms and observable effects liethe degradation modes: a method of grouping degradationmechanisms, based on their overall impact on the cell’s ther-modynamic and kinetic behaviour. We would like to highlightfour modes, all of which impact the thermodynamic behaviourof the cell, i.e. the shape of the open-circuit voltage (OCV) curveand the maximum theoretical capacity of the cell. Firstly, loss ofactive material (LAM), occurring in both positive and negativeelectrodes. This mode groups mechanisms which lead to areduction in the material available for electrochemical activity.Secondly, loss of lithium inventory (LLI) groups mechanismsresulting in a reduction of the amount of cyclable lithiumavailable for transport between electrodes. Thirdly, most oftenassociated with LLI, is stoichiometric drift, where the electrodesbecome imbalanced relative to each other.21 Finally, impedancechange groups those mechanisms affecting the kinetic behaviourof the cell. Various terms have been used in the literature torefer to this mode. Han et al.23 use the term resistance increase,
while Vetter et al.24 use the term impedance rise. All of theseterms lead to the same grouping of degradation mechanisms.This mode was further divided by Dubarry et al.,25 who introducedtwo modes termed ‘‘ohmic resistance increase’’ and ‘‘faradaic ratedegradation’’. The former arises through degradation of theelectronic conduction pathways in the cell, occurring throughmechanisms such as current collector corrosion. faradaic ratedegradation occurs primarily through electrodes not reacting withlithium ions at the same rate as had occurred at the beginning oflife and is caused by mechanisms such as SEI growth and poreblockage. A notable cause of impedance increase is related to theloss of electrolyte (LE), taking place at the interface of bothelectrodes due to various mechanisms, such as SEI formation,high voltages, high temperature, lithium plating, or reactionwith moisture contamination resulting in hydrofluoric acid (HF)formation. These are key degradation mechanisms and arediscussed in detail below. In addition, as the volume of electro-lyte reduces, drying of pores and local areas within bothelectrodes can take place, therefore LE leads to LAM, but alsoleads to an increased concentration of lithium salt.
Degradation of LIBs is evidently a complex issue and thisperspective aims to provide a state-of-the-art overview of theprincipal degradation mechanisms afflicting both electrodes,illustrated in Fig. 1. We start by discussing SEI formation andlithium plating, which are exclusively associated with the NE.Then we cover a host of interlinked mechanisms affecting thestructure and decomposition of positive electrodes, includingthe well-known formation of the cathode electrolyte interphase (CEI),
Fig. 1 Schematic showing the basic components of a lithium ion battery cell and the location and consequences of the degradation mechanismscovered in this review, with primary mechanisms labelled in green and secondary mechanisms labelled in dark red. Reprinted (adapted) with permissionfrom Merla et al.21 Copyright (2015), Elsevier B.V.
PCCP Perspective
Ope
n A
cces
s A
rtic
le. P
ublis
hed
on 2
2 M
arch
202
1. D
ownl
oade
d on
1/1
6/20
22 1
2:17
:31
AM
. T
his
artic
le is
lice
nsed
und
er a
Cre
ativ
e C
omm
ons
Attr
ibut
ion
3.0
Unp
orte
d L
icen
ce.
View Article Online
This journal is © the Owner Societies 2021 Phys. Chem. Chem. Phys., 2021, 23, 8200–8221 | 8203
herein referred to as positive solid electrolyte interface (pSEI) forconsistency. Particle fracture is discussed next, affecting bothelectrodes, but the special case of silicon additives in negativeelectrodes is also described. The final subsection discusses thedeveloping research area of the relationship between degradationmechanisms and how they either positively or negatively rein-force each other.
Although there are other mechanisms that exist, it is not theaim of this review to extensively cover all known processes,rather to provide the reader with a distillation of knowledge ofthe mechanisms that are generally considered to be the mostimportant during normal operation. Other known degradationprocesses include: salt precipitation, current collector corrosion,binder decomposition, separator pore blockage, electrode-currentcollector delamination and electrolyte evaporation, to name but afew, and are covered well in other reviews.11,23,24
SEI layer growth
Principles. The SEI is a passivation layer on most NE surfaces,having the properties of a solid electrolyte and formed when theliquid electrolyte comes into contact with the electron-conductivesurface of the NE. This is usually operating at voltages below theelectrochemical stability window of the electrolyte,12,24 accelerat-ing redox processes irreversibly breaking down the electrolyte,leading to electrolyte loss. Li metal electrodes develop this SEIlayer, as well as graphite.26,27 A variety of compounds have beenobserved within the SEI, for example: lithium fluoride (LiF),lithium carbonate (Li2CO3), lithium methyl carbonate (LiO-CO2CH3), lithium ethylene dicarbonate (LiOCO2CH2)2 andlithium oxide (Li2O).28
The SEI layer forms initially on the first cycle of the cell,resulting in ca. 10% reduction in capacity, but then serves to stopfurther reaction of the electrolyte at the NE. However, the thicknessof the SEI layer increases (predominantly on the graphite NE) asthe cell ages. The growth could be due to various reasons,including diffusion of solvent molecules through existing SEI,new exposed electrode surfaces which result from cracking anddeposition of side reaction products, such as plated Li and TMions dissolved from the PE, which react with the electrolyte to formSEI. The SEI growth rate approximately correlates with the squareroot of time;29 as the SEI thickness increases, the rate of solventmolecule diffusion slows down.
Exacerbating and mitigating factors. The SEI begins to formas soon as the NE is lithiated and exposed to the electrolyte andwill grow even if the battery is not then used.30 However, hightemperatures increase diffusion rates and hence also the SEIgrowth rate. High currents also lead to particle cracking andnew SEI formation.31 Under normal conditions, LTO anodes donot form an SEI layer, due to LTO being within the stabilitylimit of most organic electrolytes, however an SEI can form atpotentials below 1 V.32
Consequences. Capacity is irreversibly lost due to otherwisecyclable lithium being trapped within the SEI.33 In addition, theSEI layer is less permeable to Li+ ions than the electrolyte,restricts electrolyte flow through pore blocking and consumesthe electrolyte solvent. All of these effects increase the overall
impedance of cells, leading to power fade. While the SEI layeritself is not thought to cause catastrophic failure, at elevatedtemperatures it can decompose and contribute to a thermalrunaway event.11 SEI growth consumes the electrolyte solvents,reducing both the amount and the conductivity of theelectrolyte.
Links to other mechanisms. (i) TM ions dissolved from thePE are deposited on the NE, accelerating SEI growth.34
(ii) Particle and SEI cracking, caused by high cycling rates,open up new surfaces for new SEI formation.
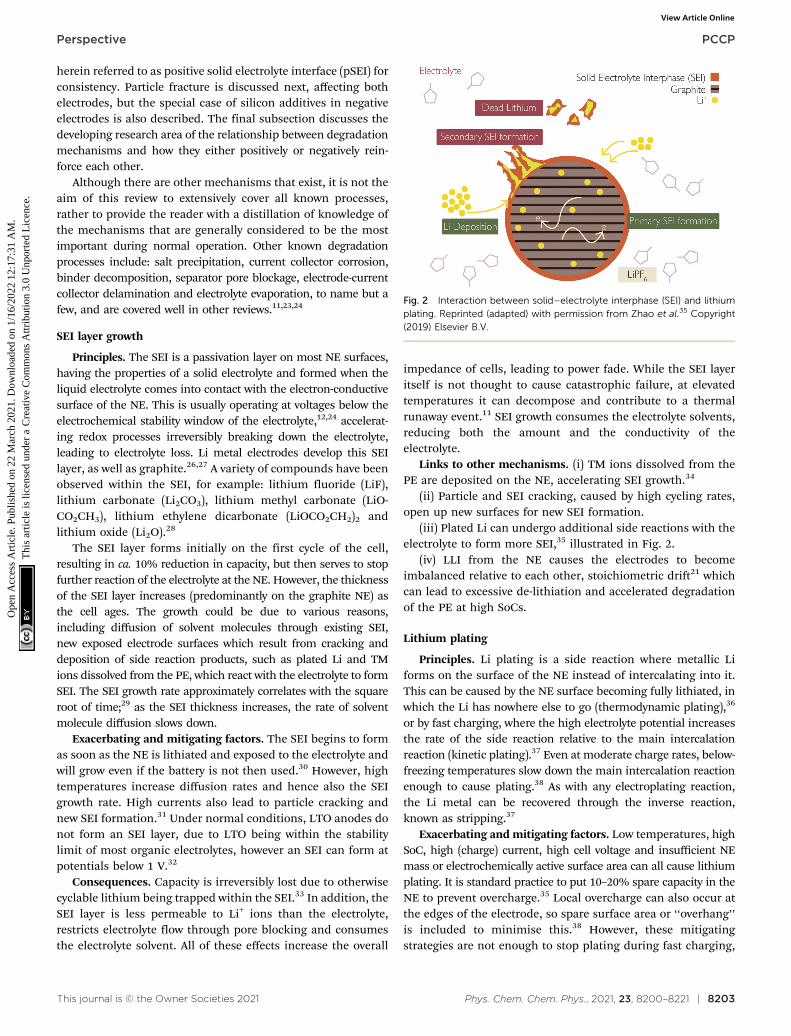
(iii) Plated Li can undergo additional side reactions with theelectrolyte to form more SEI,35 illustrated in Fig. 2.
(iv) LLI from the NE causes the electrodes to becomeimbalanced relative to each other, stoichiometric drift21 whichcan lead to excessive de-lithiation and accelerated degradationof the PE at high SoCs.
Lithium plating
Principles. Li plating is a side reaction where metallic Liforms on the surface of the NE instead of intercalating into it.This can be caused by the NE surface becoming fully lithiated, inwhich the Li has nowhere else to go (thermodynamic plating),36
or by fast charging, where the high electrolyte potential increasesthe rate of the side reaction relative to the main intercalationreaction (kinetic plating).37 Even at moderate charge rates, below-freezing temperatures slow down the main intercalation reactionenough to cause plating.38 As with any electroplating reaction,the Li metal can be recovered through the inverse reaction,known as stripping.37
Exacerbating and mitigating factors. Low temperatures, highSoC, high (charge) current, high cell voltage and insufficient NEmass or electrochemically active surface area can all cause lithiumplating. It is standard practice to put 10–20% spare capacity in theNE to prevent overcharge.35 Local overcharge can also occur atthe edges of the electrode, so spare surface area or ‘‘overhang’’is included to minimise this.38 However, these mitigatingstrategies are not enough to stop plating during fast charging,
Fig. 2 Interaction between solid–electrolyte interphase (SEI) and lithiumplating. Reprinted (adapted) with permission from Zhao et al.35 Copyright(2019) Elsevier B.V.
Perspective PCCP
Ope
n A
cces
s A
rtic
le. P
ublis
hed
on 2
2 M
arch
202
1. D
ownl
oade
d on
1/1
6/20
22 1
2:17
:31
AM
. T
his
artic
le is
lice
nsed
und
er a
Cre
ativ
e C
omm
ons
Attr
ibut
ion
3.0
Unp
orte
d L
icen
ce.
View Article Online
8204 | Phys. Chem. Chem. Phys., 2021, 23, 8200–8221 This journal is © the Owner Societies 2021
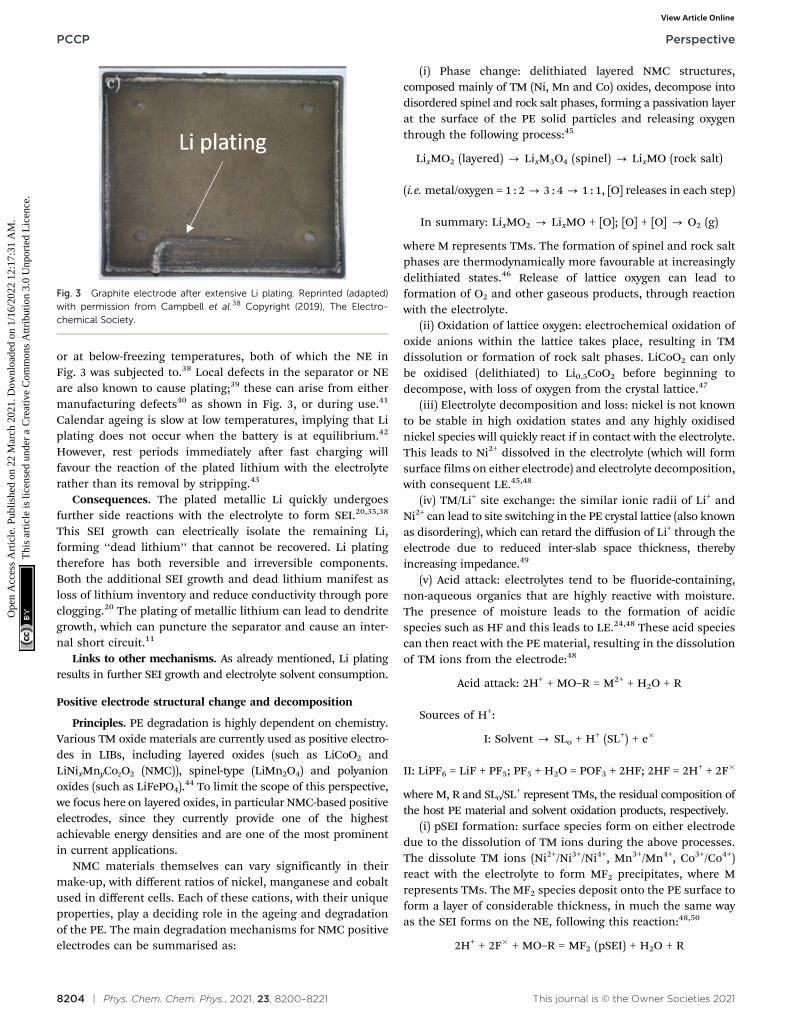
or at below-freezing temperatures, both of which the NE inFig. 3 was subjected to.38 Local defects in the separator or NEare also known to cause plating;39 these can arise from eithermanufacturing defects40 as shown in Fig. 3, or during use.41
Calendar ageing is slow at low temperatures, implying that Liplating does not occur when the battery is at equilibrium.42
However, rest periods immediately after fast charging willfavour the reaction of the plated lithium with the electrolyterather than its removal by stripping.43
Consequences. The plated metallic Li quickly undergoesfurther side reactions with the electrolyte to form SEI.20,35,38
This SEI growth can electrically isolate the remaining Li,forming ‘‘dead lithium’’ that cannot be recovered. Li platingtherefore has both reversible and irreversible components.Both the additional SEI growth and dead lithium manifest asloss of lithium inventory and reduce conductivity through poreclogging.20 The plating of metallic lithium can lead to dendritegrowth, which can puncture the separator and cause an inter-nal short circuit.11
Links to other mechanisms. As already mentioned, Li platingresults in further SEI growth and electrolyte solvent consumption.
Positive electrode structural change and decomposition
Principles. PE degradation is highly dependent on chemistry.Various TM oxide materials are currently used as positive electro-des in LIBs, including layered oxides (such as LiCoO2 andLiNixMnyCozO2 (NMC)), spinel-type (LiMn2O4) and polyanionoxides (such as LiFePO4).44 To limit the scope of this perspective,we focus here on layered oxides, in particular NMC-based positiveelectrodes, since they currently provide one of the highestachievable energy densities and are one of the most prominentin current applications.
NMC materials themselves can vary significantly in theirmake-up, with different ratios of nickel, manganese and cobaltused in different cells. Each of these cations, with their uniqueproperties, play a deciding role in the ageing and degradationof the PE. The main degradation mechanisms for NMC positiveelectrodes can be summarised as:
(i) Phase change: delithiated layered NMC structures,composed mainly of TM (Ni, Mn and Co) oxides, decompose intodisordered spinel and rock salt phases, forming a passivation layerat the surface of the PE solid particles and releasing oxygenthrough the following process:45
LixMO2 (layered) - LixM3O4 (spinel) - LixMO (rock salt)
(i.e. metal/oxygen = 1 : 2 - 3 : 4 - 1 : 1, [O] releases in each step)
In summary: LixMO2 - LixMO + [O]; [O] + [O] - O2 (g)
where M represents TMs. The formation of spinel and rock saltphases are thermodynamically more favourable at increasinglydelithiated states.46 Release of lattice oxygen can lead toformation of O2 and other gaseous products, through reactionwith the electrolyte.
(ii) Oxidation of lattice oxygen: electrochemical oxidation ofoxide anions within the lattice takes place, resulting in TMdissolution or formation of rock salt phases. LiCoO2 can onlybe oxidised (delithiated) to Li0.5CoO2 before beginning todecompose, with loss of oxygen from the crystal lattice.47
(iii) Electrolyte decomposition and loss: nickel is not knownto be stable in high oxidation states and any highly oxidisednickel species will quickly react if in contact with the electrolyte.This leads to Ni2+ dissolved in the electrolyte (which will formsurface films on either electrode) and electrolyte decomposition,with consequent LE.45,48
(iv) TM/Li+ site exchange: the similar ionic radii of Li+ andNi2+ can lead to site switching in the PE crystal lattice (also knownas disordering), which can retard the diffusion of Li+ through theelectrode due to reduced inter-slab space thickness, therebyincreasing impedance.49
(v) Acid attack: electrolytes tend to be fluoride-containing,non-aqueous organics that are highly reactive with moisture.The presence of moisture leads to the formation of acidicspecies such as HF and this leads to LE.24,48 These acid speciescan then react with the PE material, resulting in the dissolutionof TM ions from the electrode:48
Acid attack: 2H+ + MO–R = M2+ + H2O + R
Sources of H+:
I: Solvent - SLo + H+ (SL+) + e�
II: LiPF6 = LiF + PF5; PF5 + H2O = POF3 + 2HF; 2HF = 2H+ + 2F�
where M, R and SLo/SL+ represent TMs, the residual composition ofthe host PE material and solvent oxidation products, respectively.
(i) pSEI formation: surface species form on either electrodedue to the dissolution of TM ions during the above processes.The dissolute TM ions (Ni2+/Ni3+/Ni4+, Mn3+/Mn4+, Co3+/Co4+)react with the electrolyte to form MF2 precipitates, where Mrepresents TMs. The MF2 species deposit onto the PE surface toform a layer of considerable thickness, in much the same wayas the SEI forms on the NE, following this reaction:48,50
2H+ + 2F� + MO–R = MF2 (pSEI) + H2O + R
Fig. 3 Graphite electrode after extensive Li plating. Reprinted (adapted)with permission from Campbell et al.38 Copyright (2019), The Electro-chemical Society.
PCCP Perspective
Ope
n A
cces
s A
rtic
le. P
ublis
hed
on 2
2 M
arch
202
1. D
ownl
oade
d on
1/1
6/20
22 1
2:17
:31
AM
. T
his
artic
le is
lice
nsed
und
er a
Cre
ativ
e C
omm
ons
Attr
ibut
ion
3.0
Unp
orte
d L
icen
ce.
View Article Online
This journal is © the Owner Societies 2021 Phys. Chem. Chem. Phys., 2021, 23, 8200–8221 | 8205
where M, R and SLo/SL+ represent TMs, the residual composition ofthe host PE material and solvent oxidation products, respectively.This process usually happens during the first cycles. However,additional pSEI forms if the deposited layer is unstable andbreaks,51 much like the SEI-layer on the NE side. The chemicalcomposition of the pSEI strongly depends on the electrolytecomposition as the pSEI formation reaction consumes the proton(H+) from the electrolyte with other solvent oxidation products(SL+). Thus, pSEI formation and growth also contributes toelectrolyte decomposition and loss. Recent studies48,50,51 showthat, apart from TM fluoride (MF2), TM carbonates, along withminor quantities of hydroxides and water, are the few otherspecies that are present in the pSEI.
Exacerbating and mitigating factors. Mechanisms (i)–(iv)outlined above are all influenced by the chemical and structuralstability of the material. Each of the constituent TMs impartdifferent properties into the electrode material, with advantagesand disadvantages for each. High cobalt content results in greaterstability of the layered crystalline structure, but lower chemicalstability. LiMnO2 has a greater chemical stability due to its lowerredox potential, but suffers from structural instability, under-going a phase change from layered to spinel structure.24 PureLiNiO2 electrodes are more unstable, but when mixed with Coand Mn to form NMC composites, their chemical and structuralstabilities are intermediate to those of their cobalt and manga-nese analogues. They are less prone to phase change and areunlikely to decompose during oxidation (delithiation), due to theNi3+/4+ redox couple (which carries out the bulk of the redox work)sitting at a lower potential than that of Co3+/4+ (and, crucially, theO2� p band). However, high nickel content electrode materialscan be prone to Li+–Ni2+ site exchange.49 Furthermore, Ni4+ willreact when in contact with the electrolyte, leading to dissolvednickel ions and electrolyte oxidation products.52
High degrees of delithiation (LixMO2 with x o 0.3), corres-ponding to high cell SoCs, cause NMC structures, especiallyNi-rich positive electrodes such as NMC811, to become thermo-dynamically unstable.53 High enough voltages can also lead todecomposition, due to oxidation of lattice oxygen.
Chemical and structural decomposition are both most likelyto occur at the electrode surface. This is due to increasedsurface reactivity and the higher potentials experienced at theparticle surface.53 To mitigate degradation, protective surfacefilms or coatings are used in some batteries to protect the PEfrom attack by the electrolyte.54
High temperatures will accelerate the rate of degradation forall the mechanisms listed above.
Electrolytes tend to be non-aqueous organics and thereforehighly reactive with water. Replacing these with non-organicanalogues is an active area of research,55 as a route to mitigatingacid dissolution of the active material.
Consequences. Degradation due to any of these mechanismsresults in the same outcomes: LAM and an increase in cellimpedance. The formation of spinel and rock salt phases nearthe electrode surface not only reduces the amount of activematerial available for redox cycling, it can also increase cellimpedance due to the retarded kinetics through these phases.
Reactive lattice oxygen ([O]) released during electrodedecomposition or phase change converts into oxygen gas (O2)or forms reactive peroxide species. The amount of O2 releasedis largest in the first cycle and decreases in subsequent cycles,assumed to happen because O2 releases from the surface-nearregions only.45,56 The released [O] also oxidise ethylene carbonate(EC) to produce gases like CO2 and CO by the following reaction:
(CH2O)2CO (EC) + [O] - 2CO2 (g) + CO (g) + 2H2O
Recent studies45,57,58 show the abovementioned mechanism isone of the possible ways of CO2 and CO production within thecell, other than electrochemical oxidation of EC which happenswhen the cell is cycled above 5.0 V.
Formation of the pSEI layer and accelerated growth of thenegative SEI layer due to TM dissolution will cause an increasein the cell impedance.
In one study carried out in 2017,59 cell capacity loss, impedanceincrease and increase of TM content in the NE are all stated to bedriven, to an extent, by the rate of TM dissolution from the PE.Another study, published in 2018,34 details the specific effects atthe PE and NE during Mn dissolution. On the PE side, thedissolution of Mn leads to the loss of the active material andincreased impedance of the PE. However, the effect on the NEdominates.
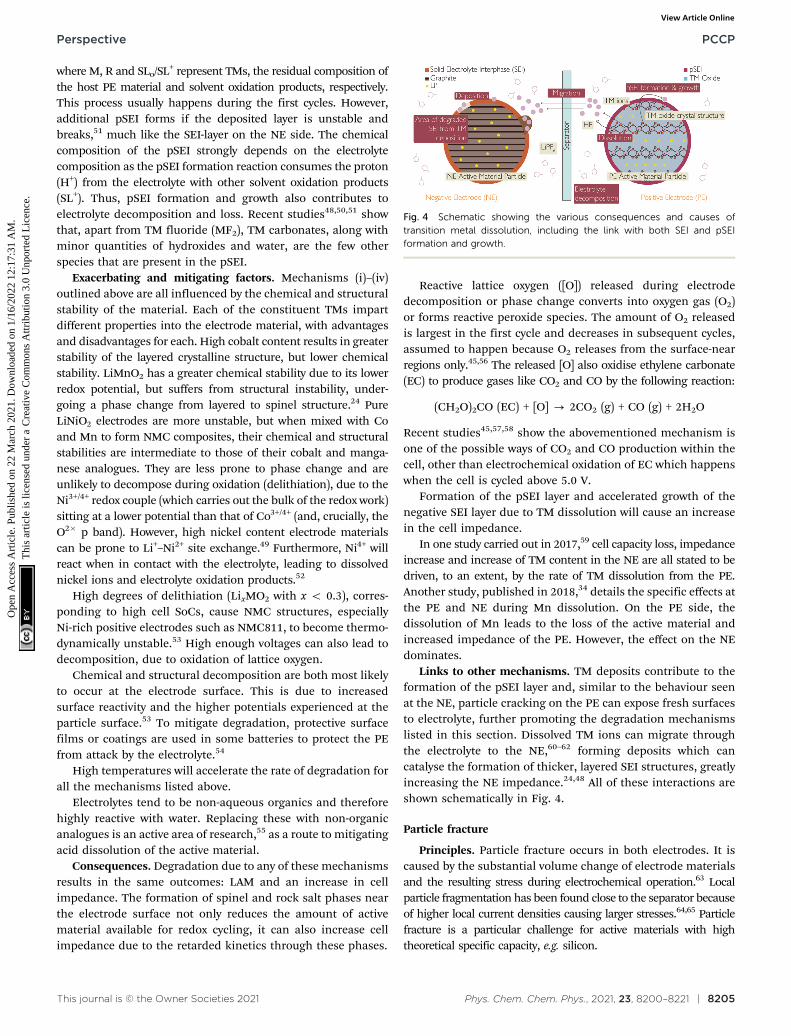
Links to other mechanisms. TM deposits contribute to theformation of the pSEI layer and, similar to the behaviour seenat the NE, particle cracking on the PE can expose fresh surfacesto electrolyte, further promoting the degradation mechanismslisted in this section. Dissolved TM ions can migrate throughthe electrolyte to the NE,60–62 forming deposits which cancatalyse the formation of thicker, layered SEI structures, greatlyincreasing the NE impedance.24,48 All of these interactions areshown schematically in Fig. 4.
Particle fracture
Principles. Particle fracture occurs in both electrodes. It iscaused by the substantial volume change of electrode materialsand the resulting stress during electrochemical operation.63 Localparticle fragmentation has been found close to the separator becauseof higher local current densities causing larger stresses.64,65 Particlefracture is a particular challenge for active materials with hightheoretical specific capacity, e.g. silicon.
Fig. 4 Schematic showing the various consequences and causes oftransition metal dissolution, including the link with both SEI and pSEIformation and growth.
Perspective PCCP
Ope
n A
cces
s A
rtic
le. P
ublis
hed
on 2
2 M
arch
202
1. D
ownl
oade
d on
1/1
6/20
22 1
2:17
:31
AM
. T
his
artic
le is
lice
nsed
und
er a
Cre
ativ
e C
omm
ons
Attr
ibut
ion
3.0
Unp
orte
d L
icen
ce.
View Article Online
8206 | Phys. Chem. Chem. Phys., 2021, 23, 8200–8221 This journal is © the Owner Societies 2021
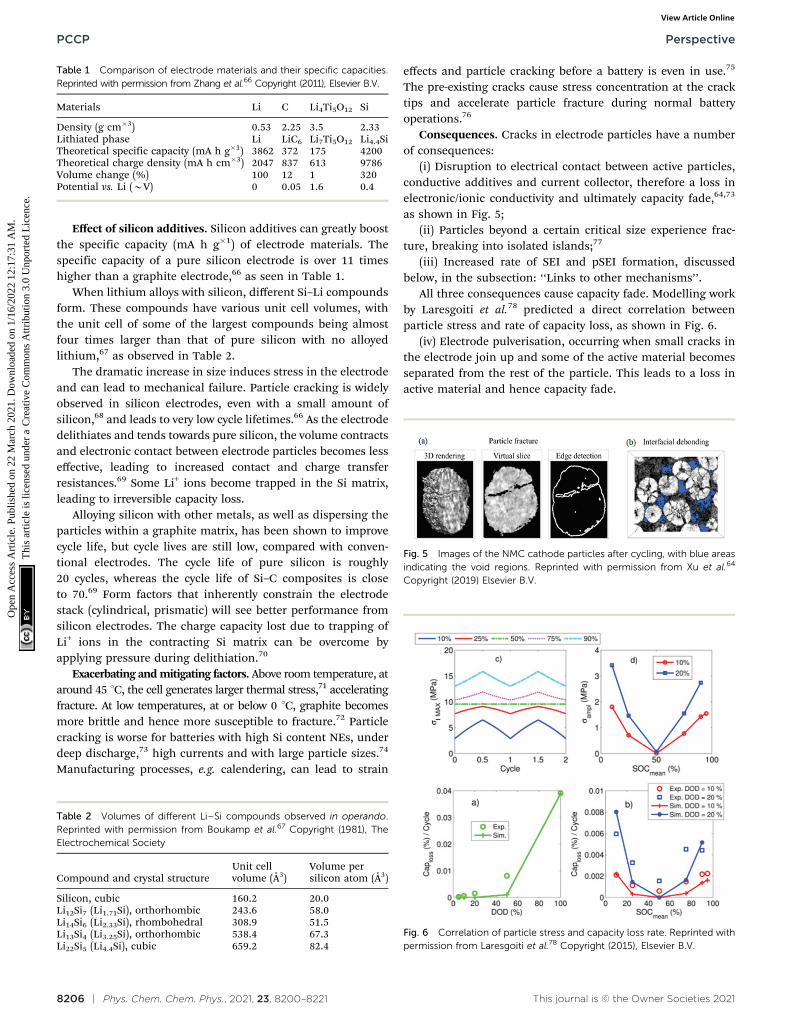
Effect of silicon additives. Silicon additives can greatly boostthe specific capacity (mA h g�1) of electrode materials. Thespecific capacity of a pure silicon electrode is over 11 timeshigher than a graphite electrode,66 as seen in Table 1.
When lithium alloys with silicon, different Si–Li compoundsform. These compounds have various unit cell volumes, withthe unit cell of some of the largest compounds being almostfour times larger than that of pure silicon with no alloyedlithium,67 as observed in Table 2.
The dramatic increase in size induces stress in the electrodeand can lead to mechanical failure. Particle cracking is widelyobserved in silicon electrodes, even with a small amount ofsilicon,68 and leads to very low cycle lifetimes.66 As the electrodedelithiates and tends towards pure silicon, the volume contractsand electronic contact between electrode particles becomes lesseffective, leading to increased contact and charge transferresistances.69 Some Li+ ions become trapped in the Si matrix,leading to irreversible capacity loss.
Alloying silicon with other metals, as well as dispersing theparticles within a graphite matrix, has been shown to improvecycle life, but cycle lives are still low, compared with conven-tional electrodes. The cycle life of pure silicon is roughly20 cycles, whereas the cycle life of Si–C composites is closeto 70.69 Form factors that inherently constrain the electrodestack (cylindrical, prismatic) will see better performance fromsilicon electrodes. The charge capacity lost due to trapping ofLi+ ions in the contracting Si matrix can be overcome byapplying pressure during delithiation.70
Exacerbating and mitigating factors. Above room temperature, ataround 45 1C, the cell generates larger thermal stress,71 acceleratingfracture. At low temperatures, at or below 0 1C, graphite becomesmore brittle and hence more susceptible to fracture.72 Particlecracking is worse for batteries with high Si content NEs, underdeep discharge,73 high currents and with large particle sizes.74
Manufacturing processes, e.g. calendering, can lead to strain
effects and particle cracking before a battery is even in use.75
The pre-existing cracks cause stress concentration at the cracktips and accelerate particle fracture during normal batteryoperations.76
Consequences. Cracks in electrode particles have a numberof consequences:
(i) Disruption to electrical contact between active particles,conductive additives and current collector, therefore a loss inelectronic/ionic conductivity and ultimately capacity fade,64,73
as shown in Fig. 5;(ii) Particles beyond a certain critical size experience frac-
ture, breaking into isolated islands;77
(iii) Increased rate of SEI and pSEI formation, discussedbelow, in the subsection: ‘‘Links to other mechanisms’’.
All three consequences cause capacity fade. Modelling workby Laresgoiti et al.78 predicted a direct correlation betweenparticle stress and rate of capacity loss, as shown in Fig. 6.
(iv) Electrode pulverisation, occurring when small cracks inthe electrode join up and some of the active material becomesseparated from the rest of the particle. This leads to a loss inactive material and hence capacity fade.
Table 1 Comparison of electrode materials and their specific capacities.Reprinted with permission from Zhang et al.66 Copyright (2011), Elsevier B.V.
Materials Li C Li4Ti5O12 Si
Density (g cm�3) 0.53 2.25 3.5 2.33Lithiated phase Li LiC6 Li7Ti5O12 Li4.4SiTheoretical specific capacity (mA h g�1) 3862 372 175 4200Theoretical charge density (mA h cm�3) 2047 837 613 9786Volume change (%) 100 12 1 320Potential vs. Li (BV) 0 0.05 1.6 0.4
Table 2 Volumes of different Li–Si compounds observed in operando.Reprinted with permission from Boukamp et al.67 Copyright (1981), TheElectrochemical Society
Compound and crystal structureUnit cellvolume (Å3)
Volume persilicon atom (Å3)
Silicon, cubic 160.2 20.0Li12Si7 (Li1.71Si), orthorhombic 243.6 58.0Li14Si6 (Li2.33Si), rhombohedral 308.9 51.5Li13Si4 (Li3.25Si), orthorhombic 538.4 67.3Li22Si5 (Li4.4Si), cubic 659.2 82.4
Fig. 5 Images of the NMC cathode particles after cycling, with blue areasindicating the void regions. Reprinted with permission from Xu et al.64
Copyright (2019) Elsevier B.V.
Fig. 6 Correlation of particle stress and capacity loss rate. Reprinted withpermission from Laresgoiti et al.78 Copyright (2015), Elsevier B.V.
PCCP Perspective
Ope
n A
cces
s A
rtic
le. P
ublis
hed
on 2
2 M
arch
202
1. D
ownl
oade
d on
1/1
6/20
22 1
2:17
:31
AM
. T
his
artic
le is
lice
nsed
und
er a
Cre
ativ
e C
omm
ons
Attr
ibut
ion
3.0
Unp
orte
d L
icen
ce.
View Article Online
This journal is © the Owner Societies 2021 Phys. Chem. Chem. Phys., 2021, 23, 8200–8221 | 8207
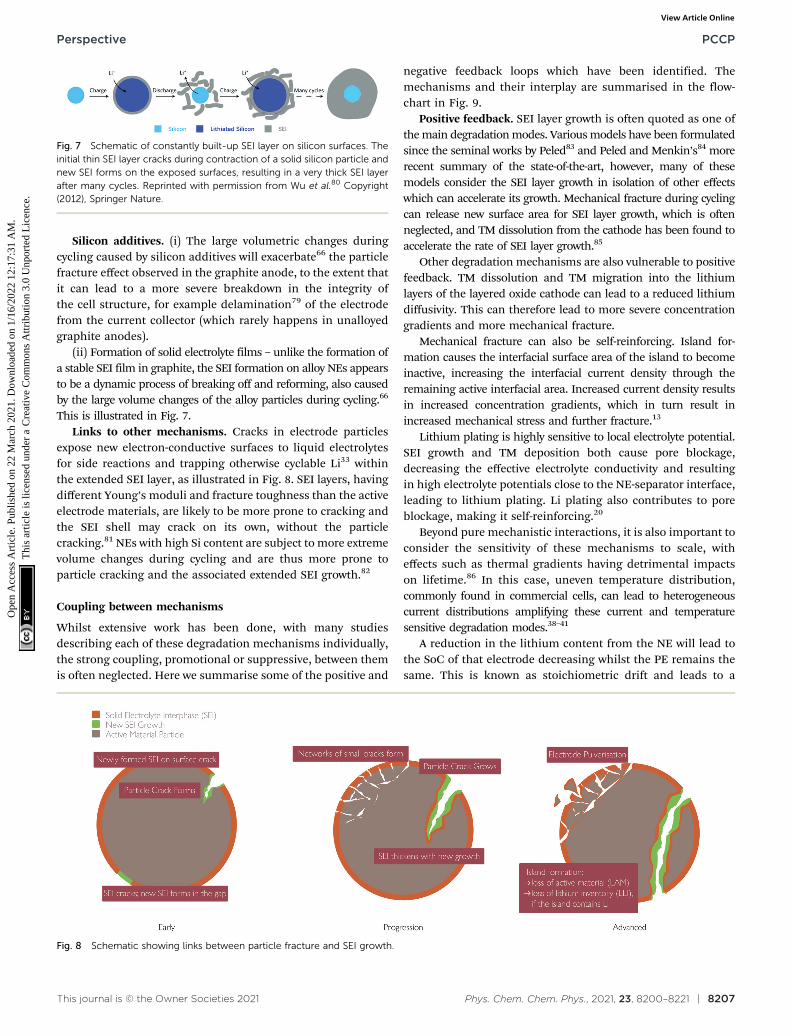
Silicon additives. (i) The large volumetric changes duringcycling caused by silicon additives will exacerbate66 the particlefracture effect observed in the graphite anode, to the extent thatit can lead to a more severe breakdown in the integrity ofthe cell structure, for example delamination79 of the electrodefrom the current collector (which rarely happens in unalloyedgraphite anodes).
(ii) Formation of solid electrolyte films – unlike the formation ofa stable SEI film in graphite, the SEI formation on alloy NEs appearsto be a dynamic process of breaking off and reforming, also causedby the large volume changes of the alloy particles during cycling.66
This is illustrated in Fig. 7.Links to other mechanisms. Cracks in electrode particles
expose new electron-conductive surfaces to liquid electrolytesfor side reactions and trapping otherwise cyclable Li33 withinthe extended SEI layer, as illustrated in Fig. 8. SEI layers, havingdifferent Young’s moduli and fracture toughness than the activeelectrode materials, are likely to be more prone to cracking andthe SEI shell may crack on its own, without the particlecracking.81 NEs with high Si content are subject to more extremevolume changes during cycling and are thus more prone toparticle cracking and the associated extended SEI growth.82
Coupling between mechanisms
Whilst extensive work has been done, with many studiesdescribing each of these degradation mechanisms individually,the strong coupling, promotional or suppressive, between themis often neglected. Here we summarise some of the positive and
negative feedback loops which have been identified. Themechanisms and their interplay are summarised in the flow-chart in Fig. 9.
Positive feedback. SEI layer growth is often quoted as one ofthe main degradation modes. Various models have been formulatedsince the seminal works by Peled83 and Peled and Menkin’s84 morerecent summary of the state-of-the-art, however, many of thesemodels consider the SEI layer growth in isolation of other effectswhich can accelerate its growth. Mechanical fracture during cyclingcan release new surface area for SEI layer growth, which is oftenneglected, and TM dissolution from the cathode has been found toaccelerate the rate of SEI layer growth.85
Other degradation mechanisms are also vulnerable to positivefeedback. TM dissolution and TM migration into the lithiumlayers of the layered oxide cathode can lead to a reduced lithiumdiffusivity. This can therefore lead to more severe concentrationgradients and more mechanical fracture.
Mechanical fracture can also be self-reinforcing. Island for-mation causes the interfacial surface area of the island to becomeinactive, increasing the interfacial current density through theremaining active interfacial area. Increased current density resultsin increased concentration gradients, which in turn result inincreased mechanical stress and further fracture.13
Lithium plating is highly sensitive to local electrolyte potential.SEI growth and TM deposition both cause pore blockage,decreasing the effective electrolyte conductivity and resultingin high electrolyte potentials close to the NE-separator interface,leading to lithium plating. Li plating also contributes to poreblockage, making it self-reinforcing.20
Beyond pure mechanistic interactions, it is also important toconsider the sensitivity of these mechanisms to scale, witheffects such as thermal gradients having detrimental impactson lifetime.86 In this case, uneven temperature distribution,commonly found in commercial cells, can lead to heterogeneouscurrent distributions amplifying these current and temperaturesensitive degradation modes.38–41
A reduction in the lithium content from the NE will lead tothe SoC of that electrode decreasing whilst the PE remains thesame. This is known as stoichiometric drift and leads to a
Fig. 7 Schematic of constantly built-up SEI layer on silicon surfaces. Theinitial thin SEI layer cracks during contraction of a solid silicon particle andnew SEI forms on the exposed surfaces, resulting in a very thick SEI layerafter many cycles. Reprinted with permission from Wu et al.80 Copyright(2012), Springer Nature.
Fig. 8 Schematic showing links between particle fracture and SEI growth.
Perspective PCCP
Ope
n A
cces
s A
rtic
le. P
ublis
hed
on 2
2 M
arch
202
1. D
ownl
oade
d on
1/1
6/20
22 1
2:17
:31
AM
. T
his
artic
le is
lice
nsed
und
er a
Cre
ativ
e C
omm
ons
Attr
ibut
ion
3.0
Unp
orte
d L
icen
ce.
View Article Online
8208 | Phys. Chem. Chem. Phys., 2021, 23, 8200–8221 This journal is © the Owner Societies 2021
reduction in the capacity but also an increase in the PEpotential at the end of charge, accelerating the PE degradationmechanisms.
Negative feedback. Many of the conclusions made in theliterature are generalisations and, in specific cases, opposingtrends can also be proposed. For instance, the SEI layer growthcauses LLI, which increases the NE potential with respect toLi,13 limiting the chance of lithium plating. SEI layer growth isevidently a key mechanism to consider, with many differentmodels describing the nature of the cell degradation proposed.For instance, kinetically dominated models generally show alinear trend in cell capacity fade over time, however manyresearchers have shown that diffusion dominated models area better representation of the behaviour of thicker SEI layers,indicating that as the SEI grows it presents greater resistance tosolvent molecules diffusing to the surface of the graphite, thuslimiting its own growth rate. However, this neglects the freshsurfaces exposed by cracks during battery cycling and thereality is likely to be a combination of kinetic and diffusiondominated behaviour.
Identifying and characterisingdegradation mechanisms
Whilst models are extremely useful for predicting future perfor-mance, their parameterisation and validation are equally essential.
In much of the literature, electrochemical measurements form thefoundations of characterisation, with galvanostatic methods beinga key tool for establishing measurements of capacity, resistanceand coulombic efficiency. Whilst relatively simple, these measure-ments can provide significant insight. A notable example is that ofHarlow et al.87 who extensively used high precision coulometry(HPC) and incremental capacity analysis (ICA) to probe theinfluences of different electrolytes of a NMC532-graphite celltowards an industrial benchmark.
Many variations of galvanostatic and potentiostatic methodsexist, each providing different key insights. Electrochemicalimpedance spectroscopy (EIS), for instance, is a core techniquefor decoupling resistance contributions in battery electrodes. Otherelectrochemical techniques involving the OCV of the cell, such asanalysing the curve itself,14 differential voltage analysis (DVA)68 andICA,88 have been used to predict electrode capacities and their offsetand, from this, the degradation modes of LAM and LLI. Slippagetracking is the process of monitoring the changing positions of IC orDV peaks as the battery is cycled, however this could be influencedby a range of degradation mechanisms.
Beyond electrical stimuli, a range of diffraction, spectro-scopy and microscopy techniques have all been used to assesschanges in electrode materials. For example, ex situ electronimaging or X-ray imaging is straightforward and hence carriedout frequently, providing important parameters for models.64
The highly coupled nature of many of these degradationeffects, and their multiscale and multi-physical interactions,
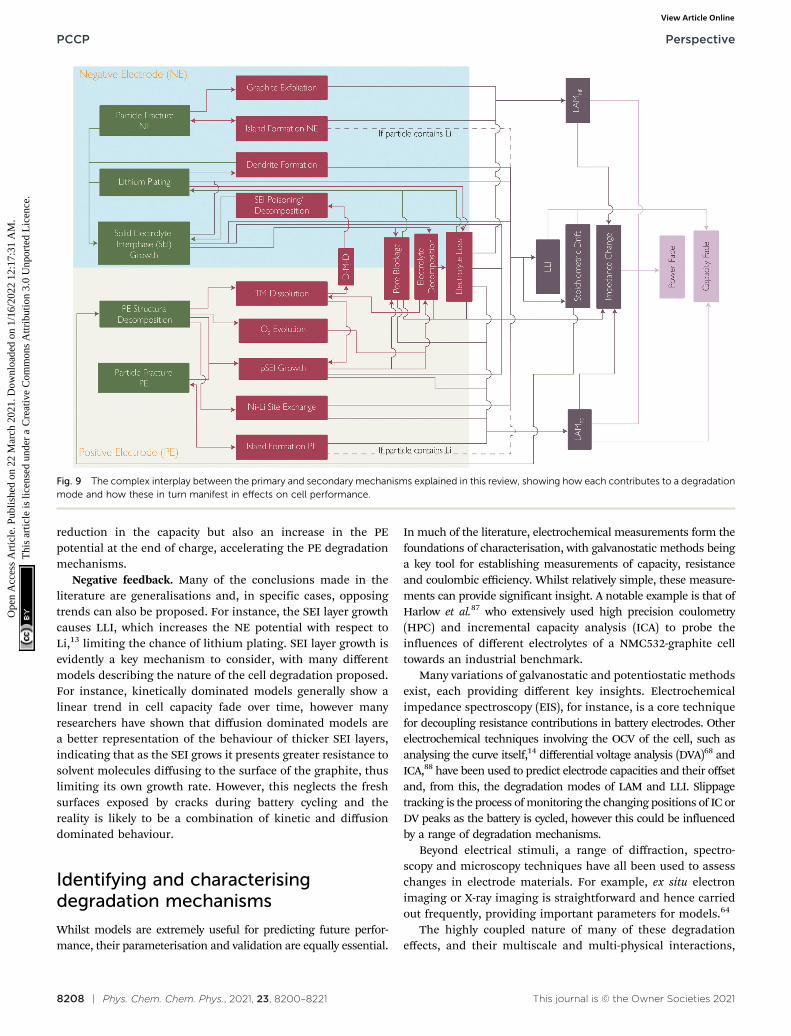
Fig. 9 The complex interplay between the primary and secondary mechanisms explained in this review, showing how each contributes to a degradationmode and how these in turn manifest in effects on cell performance.
PCCP Perspective
Ope
n A
cces
s A
rtic
le. P
ublis
hed
on 2
2 M
arch
202
1. D
ownl
oade
d on
1/1
6/20
22 1
2:17
:31
AM
. T
his
artic
le is
lice
nsed
und
er a
Cre
ativ
e C
omm
ons
Attr
ibut
ion
3.0
Unp
orte
d L
icen
ce.
View Article Online
This journal is © the Owner Societies 2021 Phys. Chem. Chem. Phys., 2021, 23, 8200–8221 | 8209
necessitates the use of multiple techniques to gain full insightsinto the underpinning processes. Furthermore, there is a needto both separate out the different contributions and capture theirinteractions. This is particularly important to consider in ex situcoin cell experiments, where a surrogate electrolyte is used. Sinceelectrolyte volume and additives can have a significant impact onlifetime, as well as introduce cross talk between the negative andpositive electrodes, this can lead to false conclusions due toexperimental artefacts. In situ measurements can be used toovercome these challenges, however these often require modifica-tions to the cell, which themselves bring about changes in the cellbehaviour.
Validation of models should always include the use of realworld drive cycles, to ensure that the interconnections betweenmodels as well as path dependence are fully represented.
The focus of this part of the perspective, however, is not toexhaustively review these techniques, but instead highlightthe insights they provide in the context of developing moreaccurate battery models.
SEI layer growth
Experimental triggers. SEI grows more rapidly at high tem-peratures and high currents, but it grows even when the cell isat rest at high SoC, albeit at slower rates (this contributes tocalendar ageing). Since particle cracking also enhances SEIgrowth, any conditions that cause particle cracking also causeincreased SEI growth.
Characterisation. In situ experiments:(i) HPC to identify irreversible capacity loss (most likely due
to SEI growth).(ii) EIS to monitor the impedance changes attributable to
SEI growth.(iii) Hybrid Pulse Power Characterisation (HPPC) tests, in
lieu of EIS, are also possible.Liu et al.28 used an electrochemical quartz crystal micro-
balance (EQCM) to monitor how the mass of the SEI increasedduring formation. They confirmed these findings using in situdifferential electrochemical mass spectroscopy (DEMS) andex situ atomic force microscopy (AFM). They also found that(LiOCO2CH2)2 could be re-oxidised to form Li2O.
The mechanical properties (Young’s moduli and fracturetoughness) of the SEI layer would be useful properties, however,it is very challenging to measure these and, to our knowledge,no experimental study has been reported to have attempted this.
Lithium plating
Experimental triggers. The main experimental trigger forlithium plating is fast charging at low temperatures. The lowerthe temperature, the more Li is plated.35 Higher charge currentsand voltages also result in more Li plating.89
Characterisation. Three different in situ methods for quantify-ing Li plating using cyclic capacity fade are proposed:89
(i) Resistance–capacity plot – assuming that Li plating doesnot increase the cell’s resistance, capacity loss due to plating isequal to the difference in capacity between the cell with platingand the cell without, for the same value of resistance.
(ii) Arrhenius plots – non-Arrhenius behaviour results fromLi plating, while Arrhenius behaviour results from SEI growth.Capacity loss due to Li plating is found by extrapolatingthe Arrhenius behaviour from higher temperatures and sub-tracting extrapolated and measured capacity losses at the lowertemperatures.
(iii) Conditions which trigger plating result in anomalouslyhigh capacity fade rates per cycle. Zhang et al.89 assume thatany capacity fade 40.024% per cycle is due to plating, but theexact value will vary between different cell types.
One proposed in situ method of quantifying plating resultingfrom a single charge is to detect the inverse stripping reactionthrough a tell-tale minimum in differential voltage (dV/dQ)plots,37 but the large spread of values in the literature call thereliability of this method into question.38,90 ICA (dQ/dV) has alsobeen shown to have an additional minimum at high voltageswhen stripping occurs.91
Any of these methods can be used to parameterise a Li platingmodel, by adjusting the rate constant for the side reaction so thatthe model predicts the correct amount of Li to be plated.
Positive electrode structural change and decomposition
Experimental triggers. All six of the degradation mechanismscovered in the previous section on PE structural change anddecomposition will be exacerbated at elevated temperatures.58,92
With the exception of oxidation of the lattice oxygen, none ofthe mechanisms listed (phase change, cation site exchange,chemical oxidation of the electrolyte, acid attack, and pSEI for-mation) are direct electrochemical processes and so are not directlyaffected by varying the cell voltage or current. However, they areindirectly linked through the potential of the electrode (degree oflithiation) and the dynamics of the electrode–electrolyte interface,which are themselves functions of electrode potential and current.58
Oxidation of lattice oxygen is an electrochemical process,happening when the electrode potential is greater than theedge of the O2� p band.44 Due to the oxidation potentials of theTM redox couples generally being below this value, oxidation oflattice oxygen will only happen in the extremely high SoC range.
Phase change from layered to spinel or rock salt structures ismore favourable at low degrees of lithiation (high SoC), corres-ponding to high cell voltages. Higher ambient temperaturefavours the phase transformation from the layered NMC structureto the rock salt layer. The bulk materials undergo a two-phasetransition from their layered structure to a spinel structure andeventually to a rock salt structure at around B170 1C.92–94 For-mation of more spinel/rock salt layer leads to [O] evolution, LAMand impedance rise.
Chemical oxidation of the electrolyte is primarily due to thepresence of highly oxidised TM species (Ni4+), which alsocorresponds to high SoCs (and therefore high voltages).51 Dueto this reaction taking place at the electrode–electrolyte inter-face, any conditions which lead to exposure of new electrodesurfaces (e.g. particle cracking) will exacerbate this mechanism.Acid attack is due to the presence of contaminants in theelectrolyte and can thus occur across the SoC range of the cell(full voltage range). Experimental studies45,46,57,58 have found
Perspective PCCP
Ope
n A
cces
s A
rtic
le. P
ublis
hed
on 2
2 M
arch
202
1. D
ownl
oade
d on
1/1
6/20
22 1
2:17
:31
AM
. T
his
artic
le is
lice
nsed
und
er a
Cre
ativ
e C
omm
ons
Attr
ibut
ion
3.0
Unp
orte
d L
icen
ce.
View Article Online
8210 | Phys. Chem. Chem. Phys., 2021, 23, 8200–8221 This journal is © the Owner Societies 2021
that high temperature and high voltage conditions shouldencourage TM dissolution and eventually encourage pSEIformation. This is likely due to the high voltage at higher SoCs(60–100%) exposing fresh electrode surfaces to the electrolyte.The result is spinel/rock salt phase transformation and O2
evolution, with subsequent TM dissolution.59
Characterisation. The effects of capacity fade and impe-dance increase should be visible through standard battery testmethods. LAM at the PE will change the OCV profile of thebattery, with peak depression, shift, or broadening in ICA anobvious sign. Direct in situ measurement of the mechanismsbehind this performance drop are significantly more difficult,however, and often require specially instrumented cells.45
The effects of these degradation mechanisms should beobservable upon cell disassembly using structural and chemicalanalyses of the electrodes and electrolyte.56 The electrode structurecan be examined using techniques such as X-ray diffraction andspectroscopy (XRD and XAS), and electron microscopy and spectro-scopy (TEM, SEM, EDX and EELS), giving information about thestructural change of the electrode, any defects (e.g. Ni2+/Li+ siteexchange) and surface films.53 The chemical composition of theelectrode could also be analysed using X-ray photoelectron spectro-scopy (XPS), atomic emission spectroscopy (such as ICP-OES), orgas chromatography (GC).50,95 This would also reveal if TMs havedeposited onto the NE and the composition of surface films.96
The presence of a spinel/rock salt phase at the PE particlesurface and the O2 evolution from the PE have been confirmedwith the help of the following experiments:
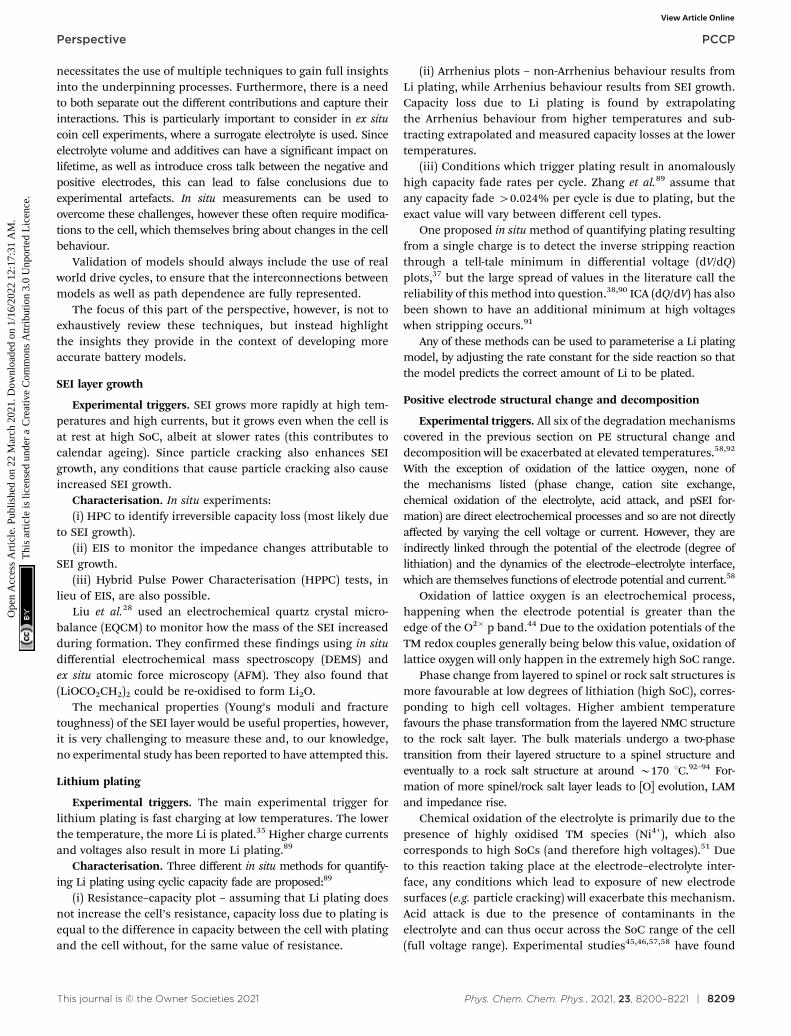
(i) Reconstructed disordered layer upon phase transforma-tion was visualised using the atomic resolution ADF-STEMimaging, as shown in Fig. 10.
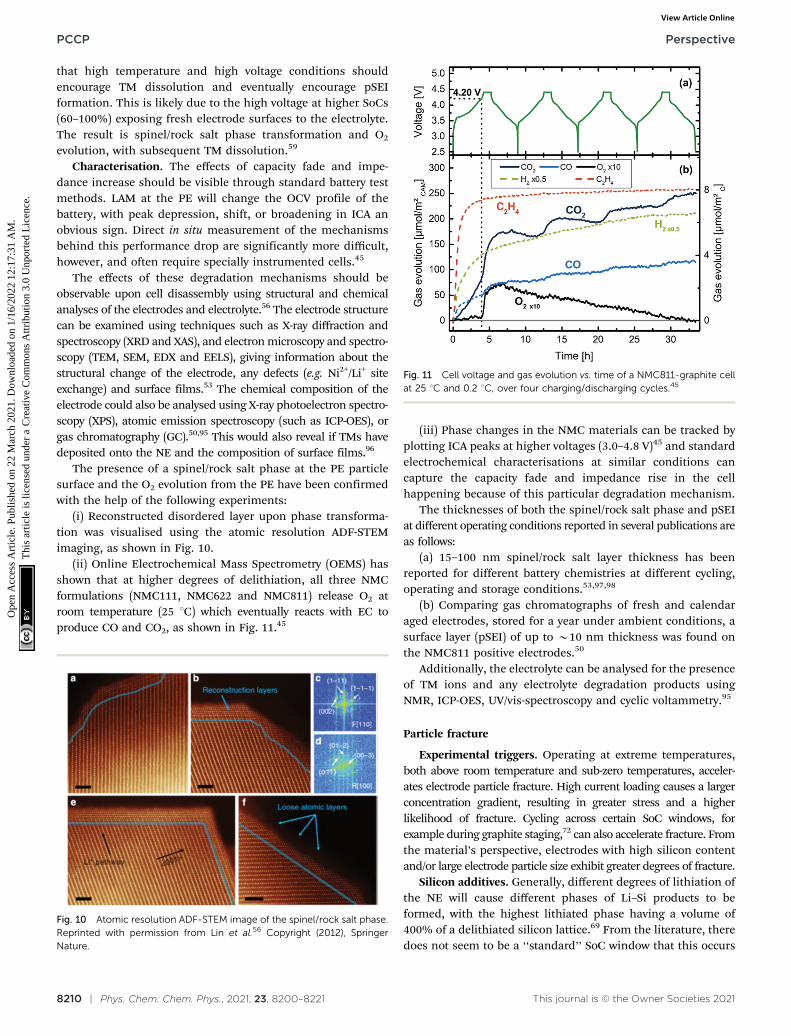
(ii) Online Electrochemical Mass Spectrometry (OEMS) hasshown that at higher degrees of delithiation, all three NMCformulations (NMC111, NMC622 and NMC811) release O2 atroom temperature (25 1C) which eventually reacts with EC toproduce CO and CO2, as shown in Fig. 11.45
(iii) Phase changes in the NMC materials can be tracked byplotting ICA peaks at higher voltages (3.0–4.8 V)45 and standardelectrochemical characterisations at similar conditions cancapture the capacity fade and impedance rise in the cellhappening because of this particular degradation mechanism.
The thicknesses of both the spinel/rock salt phase and pSEIat different operating conditions reported in several publications areas follows:
(a) 15–100 nm spinel/rock salt layer thickness has beenreported for different battery chemistries at different cycling,operating and storage conditions.53,97,98
(b) Comparing gas chromatographs of fresh and calendaraged electrodes, stored for a year under ambient conditions, asurface layer (pSEI) of up to B10 nm thickness was found onthe NMC811 positive electrodes.50
Additionally, the electrolyte can be analysed for the presenceof TM ions and any electrolyte degradation products usingNMR, ICP-OES, UV/vis-spectroscopy and cyclic voltammetry.95
Particle fracture
Experimental triggers. Operating at extreme temperatures,both above room temperature and sub-zero temperatures, acceler-ates electrode particle fracture. High current loading causes a largerconcentration gradient, resulting in greater stress and a higherlikelihood of fracture. Cycling across certain SoC windows, forexample during graphite staging,72 can also accelerate fracture. Fromthe material’s perspective, electrodes with high silicon contentand/or large electrode particle size exhibit greater degrees of fracture.
Silicon additives. Generally, different degrees of lithiation ofthe NE will cause different phases of Li–Si products to beformed, with the highest lithiated phase having a volume of400% of a delithiated silicon lattice.69 From the literature, theredoes not seem to be a ‘‘standard’’ SoC window that this occurs
Fig. 10 Atomic resolution ADF-STEM image of the spinel/rock salt phase.Reprinted with permission from Lin et al.56 Copyright (2012), SpringerNature.
Fig. 11 Cell voltage and gas evolution vs. time of a NMC811-graphite cellat 25 1C and 0.2 1C, over four charging/discharging cycles.45
PCCP Perspective
Ope
n A
cces
s A
rtic
le. P
ublis
hed
on 2
2 M
arch
202
1. D
ownl
oade
d on
1/1
6/20
22 1
2:17
:31
AM
. T
his
artic
le is
lice
nsed
und
er a
Cre
ativ
e C
omm
ons
Attr
ibut
ion
3.0
Unp
orte
d L
icen
ce.
View Article Online
This journal is © the Owner Societies 2021 Phys. Chem. Chem. Phys., 2021, 23, 8200–8221 | 8211
in; this will depend on the ratio of silicon in the electrode. Yaoet al. carried out an in operando experiment on cycling behaviourof silicon–graphite blended electrodes, and the results revealedthat the lithiation of silicon occurs throughout the whole rangeof voltage, while the lithiation of graphite starts when thepotential dips below 0.2 V. The delithiation is carried outsequentially: Li extraction happens first from graphite particlesand then from silicon particles, when the voltage exceeds 0.22 V.These experimental facts indicate that in a graphite anodecomposited with silicon, the large volume change of siliconshould occur during more than one voltage (SoC) range.99
Zhang66 briefly mentions the effects of temperature on cyclelife in silicon/matrix negative electrodes. The findings are thathigher temperatures increased the capacity of the cells percycle, but were detrimental to the cycle life of the cell. Thiscould be attributed to the reduction in overpotential for cells ata higher temperature, allowing more of the lithium to beremoved from the silicon in normal operating voltage windows,causing smaller particle size and hence increased tensilestresses in the electrode.
There seems to be no concrete evidence of the effects ofC-rate on cycle life in electrodes with silicon additives.
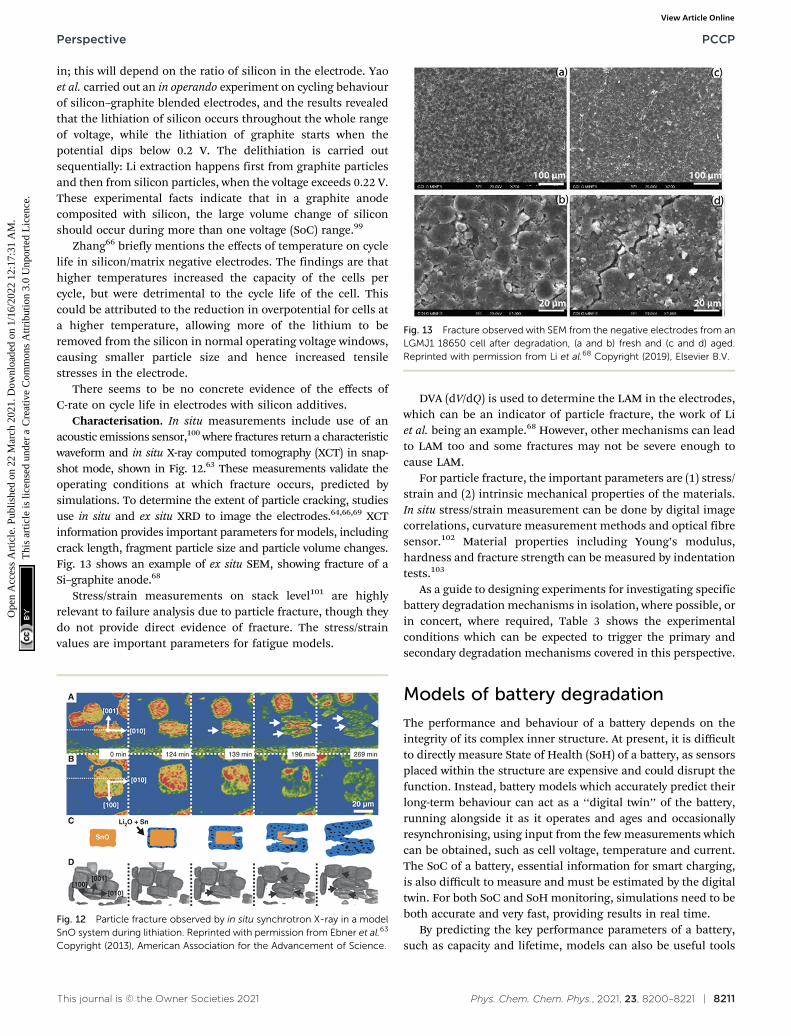
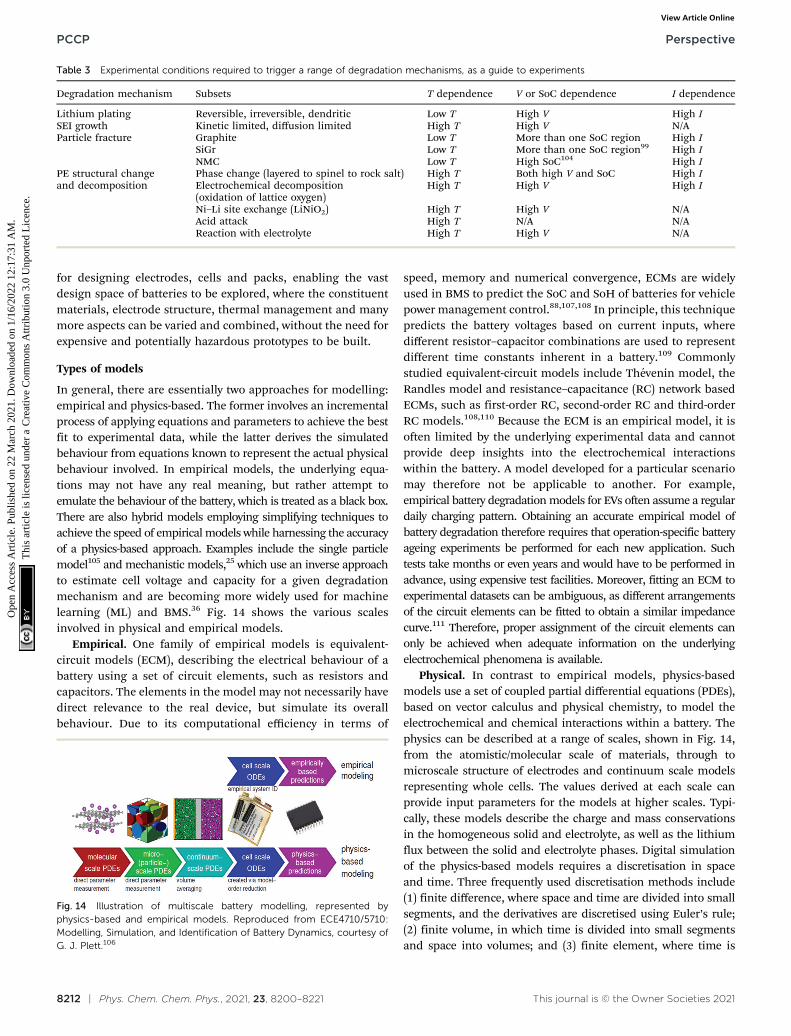
Characterisation. In situ measurements include use of anacoustic emissions sensor,100 where fractures return a characteristicwaveform and in situ X-ray computed tomography (XCT) in snap-shot mode, shown in Fig. 12.63 These measurements validate theoperating conditions at which fracture occurs, predicted bysimulations. To determine the extent of particle cracking, studiesuse in situ and ex situ XRD to image the electrodes.64,66,69 XCTinformation provides important parameters for models, includingcrack length, fragment particle size and particle volume changes.Fig. 13 shows an example of ex situ SEM, showing fracture of aSi–graphite anode.68
Stress/strain measurements on stack level101 are highlyrelevant to failure analysis due to particle fracture, though theydo not provide direct evidence of fracture. The stress/strainvalues are important parameters for fatigue models.
DVA (dV/dQ) is used to determine the LAM in the electrodes,which can be an indicator of particle fracture, the work of Liet al. being an example.68 However, other mechanisms can leadto LAM too and some fractures may not be severe enough tocause LAM.
For particle fracture, the important parameters are (1) stress/strain and (2) intrinsic mechanical properties of the materials.In situ stress/strain measurement can be done by digital imagecorrelations, curvature measurement methods and optical fibresensor.102 Material properties including Young’s modulus,hardness and fracture strength can be measured by indentationtests.103
As a guide to designing experiments for investigating specificbattery degradation mechanisms in isolation, where possible, orin concert, where required, Table 3 shows the experimentalconditions which can be expected to trigger the primary andsecondary degradation mechanisms covered in this perspective.
Models of battery degradation
The performance and behaviour of a battery depends on theintegrity of its complex inner structure. At present, it is difficultto directly measure State of Health (SoH) of a battery, as sensorsplaced within the structure are expensive and could disrupt thefunction. Instead, battery models which accurately predict theirlong-term behaviour can act as a ‘‘digital twin’’ of the battery,running alongside it as it operates and ages and occasionallyresynchronising, using input from the few measurements whichcan be obtained, such as cell voltage, temperature and current.The SoC of a battery, essential information for smart charging,is also difficult to measure and must be estimated by the digitaltwin. For both SoC and SoH monitoring, simulations need to beboth accurate and very fast, providing results in real time.
By predicting the key performance parameters of a battery,such as capacity and lifetime, models can also be useful tools
Fig. 12 Particle fracture observed by in situ synchrotron X-ray in a modelSnO system during lithiation. Reprinted with permission from Ebner et al.63
Copyright (2013), American Association for the Advancement of Science.
Fig. 13 Fracture observed with SEM from the negative electrodes from anLGMJ1 18650 cell after degradation, (a and b) fresh and (c and d) aged.Reprinted with permission from Li et al.68 Copyright (2019), Elsevier B.V.
Perspective PCCP
Ope
n A
cces
s A
rtic
le. P
ublis
hed
on 2
2 M
arch
202
1. D
ownl
oade
d on
1/1
6/20
22 1
2:17
:31
AM
. T
his
artic
le is
lice
nsed
und
er a
Cre
ativ
e C
omm
ons
Attr
ibut
ion
3.0
Unp
orte
d L
icen
ce.
View Article Online
8212 | Phys. Chem. Chem. Phys., 2021, 23, 8200–8221 This journal is © the Owner Societies 2021
for designing electrodes, cells and packs, enabling the vastdesign space of batteries to be explored, where the constituentmaterials, electrode structure, thermal management and manymore aspects can be varied and combined, without the need forexpensive and potentially hazardous prototypes to be built.
Types of models
In general, there are essentially two approaches for modelling:empirical and physics-based. The former involves an incrementalprocess of applying equations and parameters to achieve the bestfit to experimental data, while the latter derives the simulatedbehaviour from equations known to represent the actual physicalbehaviour involved. In empirical models, the underlying equa-tions may not have any real meaning, but rather attempt toemulate the behaviour of the battery, which is treated as a black box.There are also hybrid models employing simplifying techniques toachieve the speed of empirical models while harnessing the accuracyof a physics-based approach. Examples include the single particlemodel105 and mechanistic models,25 which use an inverse approachto estimate cell voltage and capacity for a given degradationmechanism and are becoming more widely used for machinelearning (ML) and BMS.36 Fig. 14 shows the various scalesinvolved in physical and empirical models.
Empirical. One family of empirical models is equivalent-circuit models (ECM), describing the electrical behaviour of abattery using a set of circuit elements, such as resistors andcapacitors. The elements in the model may not necessarily havedirect relevance to the real device, but simulate its overallbehaviour. Due to its computational efficiency in terms of
speed, memory and numerical convergence, ECMs are widelyused in BMS to predict the SoC and SoH of batteries for vehiclepower management control.88,107,108 In principle, this techniquepredicts the battery voltages based on current inputs, wheredifferent resistor–capacitor combinations are used to representdifferent time constants inherent in a battery.109 Commonlystudied equivalent-circuit models include Thevenin model, theRandles model and resistance–capacitance (RC) network basedECMs, such as first-order RC, second-order RC and third-orderRC models.108,110 Because the ECM is an empirical model, it isoften limited by the underlying experimental data and cannotprovide deep insights into the electrochemical interactionswithin the battery. A model developed for a particular scenariomay therefore not be applicable to another. For example,empirical battery degradation models for EVs often assume a regulardaily charging pattern. Obtaining an accurate empirical model ofbattery degradation therefore requires that operation-specific batteryageing experiments be performed for each new application. Suchtests take months or even years and would have to be performed inadvance, using expensive test facilities. Moreover, fitting an ECM toexperimental datasets can be ambiguous, as different arrangementsof the circuit elements can be fitted to obtain a similar impedancecurve.111 Therefore, proper assignment of the circuit elements canonly be achieved when adequate information on the underlyingelectrochemical phenomena is available.
Physical. In contrast to empirical models, physics-basedmodels use a set of coupled partial differential equations (PDEs),based on vector calculus and physical chemistry, to model theelectrochemical and chemical interactions within a battery. Thephysics can be described at a range of scales, shown in Fig. 14,from the atomistic/molecular scale of materials, through tomicroscale structure of electrodes and continuum scale modelsrepresenting whole cells. The values derived at each scale canprovide input parameters for the models at higher scales. Typi-cally, these models describe the charge and mass conservationsin the homogeneous solid and electrolyte, as well as the lithiumflux between the solid and electrolyte phases. Digital simulationof the physics-based models requires a discretisation in spaceand time. Three frequently used discretisation methods include(1) finite difference, where space and time are divided into smallsegments, and the derivatives are discretised using Euler’s rule;(2) finite volume, in which time is divided into small segmentsand space into volumes; and (3) finite element, where time is
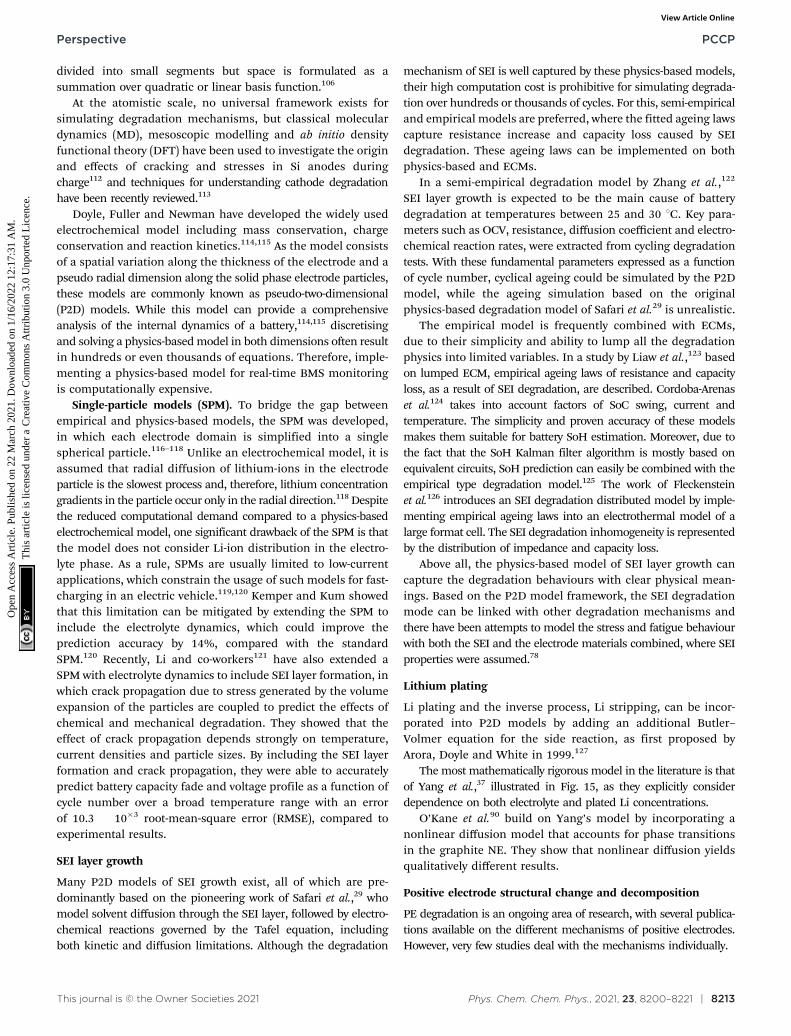
Table 3 Experimental conditions required to trigger a range of degradation mechanisms, as a guide to experiments
Degradation mechanism Subsets T dependence V or SoC dependence I dependence
Lithium plating Reversible, irreversible, dendritic Low T High V High ISEI growth Kinetic limited, diffusion limited High T High V N/AParticle fracture Graphite Low T More than one SoC region High I
SiGr Low T More than one SoC region99 High INMC Low T High SoC104 High I
PE structural changeand decomposition
Phase change (layered to spinel to rock salt) High T Both high V and SoC High IElectrochemical decomposition(oxidation of lattice oxygen)
High T High V High I
Ni–Li site exchange (LiNiO2) High T High V N/AAcid attack High T N/A N/AReaction with electrolyte High T High V N/A
Fig. 14 Illustration of multiscale battery modelling, represented byphysics-based and empirical models. Reproduced from ECE4710/5710:Modelling, Simulation, and Identification of Battery Dynamics, courtesy ofG. J. Plett.106
PCCP Perspective
Ope
n A
cces
s A
rtic
le. P
ublis
hed
on 2
2 M
arch
202
1. D
ownl
oade
d on
1/1
6/20
22 1
2:17
:31
AM
. T
his
artic
le is
lice
nsed
und
er a
Cre
ativ
e C
omm
ons
Attr
ibut
ion
3.0
Unp
orte
d L
icen
ce.
View Article Online
This journal is © the Owner Societies 2021 Phys. Chem. Chem. Phys., 2021, 23, 8200–8221 | 8213
divided into small segments but space is formulated as asummation over quadratic or linear basis function.106
At the atomistic scale, no universal framework exists forsimulating degradation mechanisms, but classical moleculardynamics (MD), mesoscopic modelling and ab initio densityfunctional theory (DFT) have been used to investigate the originand effects of cracking and stresses in Si anodes duringcharge112 and techniques for understanding cathode degradationhave been recently reviewed.113
Doyle, Fuller and Newman have developed the widely usedelectrochemical model including mass conservation, chargeconservation and reaction kinetics.114,115 As the model consistsof a spatial variation along the thickness of the electrode and apseudo radial dimension along the solid phase electrode particles,these models are commonly known as pseudo-two-dimensional(P2D) models. While this model can provide a comprehensiveanalysis of the internal dynamics of a battery,114,115 discretisingand solving a physics-based model in both dimensions often resultin hundreds or even thousands of equations. Therefore, imple-menting a physics-based model for real-time BMS monitoringis computationally expensive.
Single-particle models (SPM). To bridge the gap betweenempirical and physics-based models, the SPM was developed,in which each electrode domain is simplified into a singlespherical particle.116–118 Unlike an electrochemical model, it isassumed that radial diffusion of lithium-ions in the electrodeparticle is the slowest process and, therefore, lithium concentrationgradients in the particle occur only in the radial direction.118 Despitethe reduced computational demand compared to a physics-basedelectrochemical model, one significant drawback of the SPM is thatthe model does not consider Li-ion distribution in the electro-lyte phase. As a rule, SPMs are usually limited to low-currentapplications, which constrain the usage of such models for fast-charging in an electric vehicle.119,120 Kemper and Kum showedthat this limitation can be mitigated by extending the SPM toinclude the electrolyte dynamics, which could improve theprediction accuracy by 14%, compared with the standardSPM.120 Recently, Li and co-workers121 have also extended aSPM with electrolyte dynamics to include SEI layer formation, inwhich crack propagation due to stress generated by the volumeexpansion of the particles are coupled to predict the effects ofchemical and mechanical degradation. They showed that theeffect of crack propagation depends strongly on temperature,current densities and particle sizes. By including the SEI layerformation and crack propagation, they were able to accuratelypredict battery capacity fade and voltage profile as a function ofcycle number over a broad temperature range with an errorof 10.3 � 10�3 root-mean-square error (RMSE), compared toexperimental results.
SEI layer growth
Many P2D models of SEI growth exist, all of which are pre-dominantly based on the pioneering work of Safari et al.,29 whomodel solvent diffusion through the SEI layer, followed by electro-chemical reactions governed by the Tafel equation, includingboth kinetic and diffusion limitations. Although the degradation
mechanism of SEI is well captured by these physics-based models,their high computation cost is prohibitive for simulating degrada-tion over hundreds or thousands of cycles. For this, semi-empiricaland empirical models are preferred, where the fitted ageing lawscapture resistance increase and capacity loss caused by SEIdegradation. These ageing laws can be implemented on bothphysics-based and ECMs.
In a semi-empirical degradation model by Zhang et al.,122
SEI layer growth is expected to be the main cause of batterydegradation at temperatures between 25 and 30 1C. Key para-meters such as OCV, resistance, diffusion coefficient and electro-chemical reaction rates, were extracted from cycling degradationtests. With these fundamental parameters expressed as a functionof cycle number, cyclical ageing could be simulated by the P2Dmodel, while the ageing simulation based on the originalphysics-based degradation model of Safari et al.29 is unrealistic.
The empirical model is frequently combined with ECMs,due to their simplicity and ability to lump all the degradationphysics into limited variables. In a study by Liaw et al.,123 basedon lumped ECM, empirical ageing laws of resistance and capacityloss, as a result of SEI degradation, are described. Cordoba-Arenaset al.124 takes into account factors of SoC swing, current andtemperature. The simplicity and proven accuracy of these modelsmakes them suitable for battery SoH estimation. Moreover, due tothe fact that the SoH Kalman filter algorithm is mostly based onequivalent circuits, SoH prediction can easily be combined with theempirical type degradation model.125 The work of Fleckensteinet al.126 introduces an SEI degradation distributed model by imple-menting empirical ageing laws into an electrothermal model of alarge format cell. The SEI degradation inhomogeneity is representedby the distribution of impedance and capacity loss.
Above all, the physics-based model of SEI layer growth cancapture the degradation behaviours with clear physical mean-ings. Based on the P2D model framework, the SEI degradationmode can be linked with other degradation mechanisms andthere have been attempts to model the stress and fatigue behaviourwith both the SEI and the electrode materials combined, where SEIproperties were assumed.78
Lithium plating
Li plating and the inverse process, Li stripping, can be incor-porated into P2D models by adding an additional Butler–Volmer equation for the side reaction, as first proposed byArora, Doyle and White in 1999.127
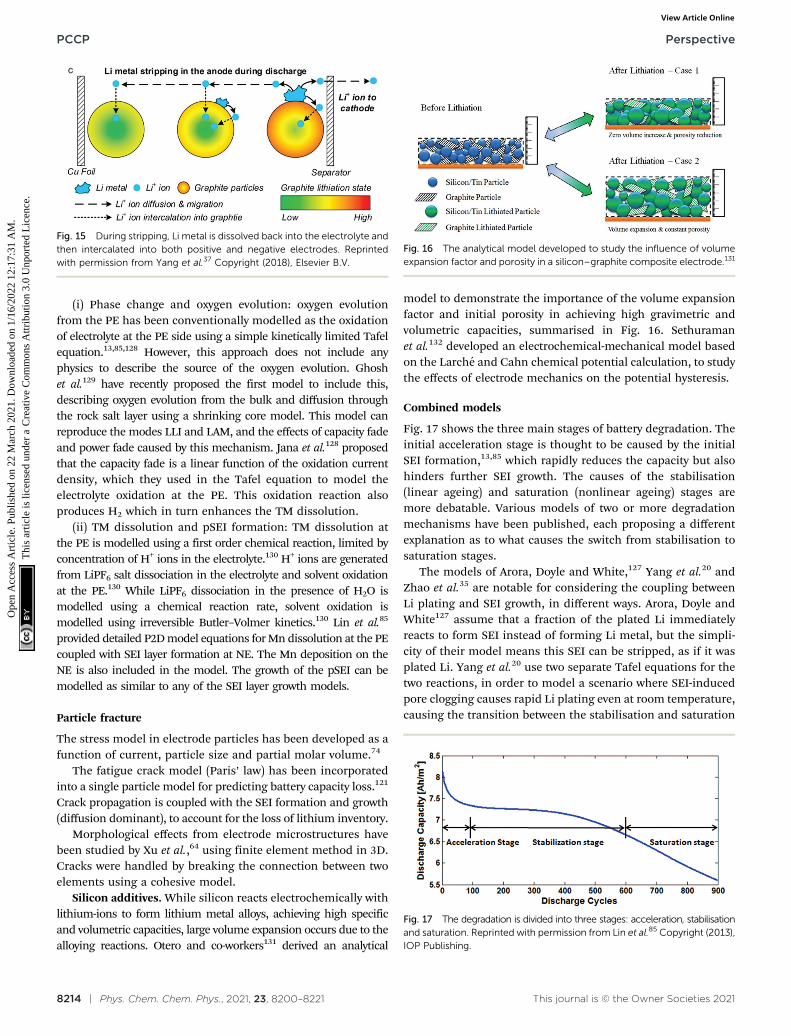
The most mathematically rigorous model in the literature is thatof Yang et al.,37 illustrated in Fig. 15, as they explicitly considerdependence on both electrolyte and plated Li concentrations.
O’Kane et al.90 build on Yang’s model by incorporating anonlinear diffusion model that accounts for phase transitionsin the graphite NE. They show that nonlinear diffusion yieldsqualitatively different results.
Positive electrode structural change and decomposition
PE degradation is an ongoing area of research, with several publica-tions available on the different mechanisms of positive electrodes.However, very few studies deal with the mechanisms individually.
Perspective PCCP
Ope
n A
cces
s A
rtic
le. P
ublis
hed
on 2
2 M
arch
202
1. D
ownl
oade
d on
1/1
6/20
22 1
2:17
:31
AM
. T
his
artic
le is
lice
nsed
und
er a
Cre
ativ
e C
omm
ons
Attr
ibut
ion
3.0
Unp
orte
d L
icen
ce.
View Article Online
8214 | Phys. Chem. Chem. Phys., 2021, 23, 8200–8221 This journal is © the Owner Societies 2021
(i) Phase change and oxygen evolution: oxygen evolutionfrom the PE has been conventionally modelled as the oxidationof electrolyte at the PE side using a simple kinetically limited Tafelequation.13,85,128 However, this approach does not include anyphysics to describe the source of the oxygen evolution. Ghoshet al.129 have recently proposed the first model to include this,describing oxygen evolution from the bulk and diffusion throughthe rock salt layer using a shrinking core model. This model canreproduce the modes LLI and LAM, and the effects of capacity fadeand power fade caused by this mechanism. Jana et al.128 proposedthat the capacity fade is a linear function of the oxidation currentdensity, which they used in the Tafel equation to model theelectrolyte oxidation at the PE. This oxidation reaction alsoproduces H2 which in turn enhances the TM dissolution.
(ii) TM dissolution and pSEI formation: TM dissolution atthe PE is modelled using a first order chemical reaction, limited byconcentration of H+ ions in the electrolyte.130 H+ ions are generatedfrom LiPF6 salt dissociation in the electrolyte and solvent oxidationat the PE.130 While LiPF6 dissociation in the presence of H2O ismodelled using a chemical reaction rate, solvent oxidation ismodelled using irreversible Butler–Volmer kinetics.130 Lin et al.85
provided detailed P2D model equations for Mn dissolution at the PEcoupled with SEI layer formation at NE. The Mn deposition on theNE is also included in the model. The growth of the pSEI can bemodelled as similar to any of the SEI layer growth models.
Particle fracture
The stress model in electrode particles has been developed as afunction of current, particle size and partial molar volume.74
The fatigue crack model (Paris’ law) has been incorporatedinto a single particle model for predicting battery capacity loss.121
Crack propagation is coupled with the SEI formation and growth(diffusion dominant), to account for the loss of lithium inventory.
Morphological effects from electrode microstructures havebeen studied by Xu et al.,64 using finite element method in 3D.Cracks were handled by breaking the connection between twoelements using a cohesive model.
Silicon additives. While silicon reacts electrochemically withlithium-ions to form lithium metal alloys, achieving high specificand volumetric capacities, large volume expansion occurs due to thealloying reactions. Otero and co-workers131 derived an analytical
model to demonstrate the importance of the volume expansionfactor and initial porosity in achieving high gravimetric andvolumetric capacities, summarised in Fig. 16. Sethuramanet al.132 developed an electrochemical-mechanical model basedon the Larche and Cahn chemical potential calculation, to studythe effects of electrode mechanics on the potential hysteresis.
Combined models
Fig. 17 shows the three main stages of battery degradation. Theinitial acceleration stage is thought to be caused by the initialSEI formation,13,85 which rapidly reduces the capacity but alsohinders further SEI growth. The causes of the stabilisation(linear ageing) and saturation (nonlinear ageing) stages aremore debatable. Various models of two or more degradationmechanisms have been published, each proposing a differentexplanation as to what causes the switch from stabilisation tosaturation stages.
The models of Arora, Doyle and White,127 Yang et al.20 andZhao et al.35 are notable for considering the coupling betweenLi plating and SEI growth, in different ways. Arora, Doyle andWhite127 assume that a fraction of the plated Li immediatelyreacts to form SEI instead of forming Li metal, but the simpli-city of their model means this SEI can be stripped, as if it wasplated Li. Yang et al.20 use two separate Tafel equations for thetwo reactions, in order to model a scenario where SEI-inducedpore clogging causes rapid Li plating even at room temperature,causing the transition between the stabilisation and saturation
Fig. 15 During stripping, Li metal is dissolved back into the electrolyte andthen intercalated into both positive and negative electrodes. Reprintedwith permission from Yang et al.37 Copyright (2018), Elsevier B.V.
Fig. 16 The analytical model developed to study the influence of volumeexpansion factor and porosity in a silicon–graphite composite electrode.131
Fig. 17 The degradation is divided into three stages: acceleration, stabilisationand saturation. Reprinted with permission from Lin et al.85 Copyright (2013),IOP Publishing.
PCCP Perspective
Ope
n A
cces
s A
rtic
le. P
ublis
hed
on 2
2 M
arch
202
1. D
ownl
oade
d on
1/1
6/20
22 1
2:17
:31
AM
. T
his
artic
le is
lice
nsed
und
er a
Cre
ativ
e C
omm
ons
Attr
ibut
ion
3.0
Unp
orte
d L
icen
ce.
View Article Online
This journal is © the Owner Societies 2021 Phys. Chem. Chem. Phys., 2021, 23, 8200–8221 | 8215
stages of degradation. Zhao et al.35 present an updated versionof Arora, Doyle and White’s model that allows them to modelboth reversible and irreversible plating at the same time.
Few attempts have been made to model more than twodegradation mechanisms at a time. Lin et al.85 presented acombined model of Mn dissolution, SEI formation and Mndeposition on the NE and analysed the combined effect of thesedegradation mechanisms. The model was able to qualitativelyreproduce all three stages of degradation, but neither quantitativecomparison with experiment nor temperature variation wereincluded. A recent follow-up paper by Li, Landers and Park133 addeda semi-empirical model of SEI formation on cracks in particles andfound that the majority of SEI was formed on cracks, as opposed togrowing on top of existing SEI.
Jin et al.134 combined Safari et al.’s29 model of SEI growth onthe NE, the same model applied to pSEI growth on the PE andan empirical model for loss of electrical contact due to particlecracking in both electrodes. The experiments did not last longenough to include the saturation stage, but the physics-baseddegradation model was found to be far superior to both equivalentcircuit and purely empirical models in predicting capacity lossduring an EV drive cycle.
Reniers, Mulder and Howey13 devised a SPM incorporating aNE SEI model valid in both the reaction-limited and diffusion-limited extremes, a Tafel equation for irreversible lithiumplating on the NE, an empirical expression for loss of electricalcontact in the NE and a Tafel equation for acid dissolution of thePE. Their model results in a good qualitative fit to experimentaldata at 25 1C and 45 1C, but not at 5 1C, which implies theirmodel of lithium plating could be improved.
Keil and Jossen135 presented a P2D model combining SEI growth,SEI formation on cracks and partially reversible Li plating. Like Yanget al.,20 they found that Li plating could explain the transition fromlinear to nonlinear ageing, even at room temperature.
From these combined models, three different possible explana-tions for the transition between stabilisation and saturation stagesemerge. Lin et al.’s 201385 model predicts that the stabilisationstage is dominated by SEI growth on the NE while the saturationstage is dominated by acid dissolution of the PE. Yang et al.20
propose that the transition is caused by SEI-induced pore clogging,which in turn causes Li plating, neglecting the role of the PEcompletely. Keil and Jossen135 also found that partially reversibleLi plating could explain the transition. Reniers, Mulder andHowey13 argue that their empirical model of electrical contact lossalso reproduces the saturation stage.
Prospective applications of machine learning
In recent years, ML techniques have become increasingly deployedat multiple length scales to aid researchers handle the increasingvolumes of data and develop new underpinning insights. At themicrostructural level, Wei et al.136 demonstrated a supervised andunsupervised data mining approach to analyse larger XCTdatasets for studying the effect of heterogeneous electrodeparticle degradation on cell level performance. Jiang et al.137
also used ML approaches to aid their tomographic analysis ofinterfacial degradation effects between electrode particles and
binders/conductive additives which are generally difficult tosegment. Here, a convolutional neural network approach wasused to aid with image segmentation. However, the real powerof ML approaches come from not just automating analysis, butfrom developing deeper insights. Gayon-Lombardo et al.,138 forinstance, developed a deep convolutional generative adversarialnetwork for the creation of synthetic microstructures. Thepower of these approaches further manifest themselves as theseinsights are integrated within a multiscale framework fromatomistic length scales towards cell level control with the fusionof models, data and ML.139,140
At the cell level, various authors have demonstrated theability to provide accurate estimations of the remaining usefullifetime (RUL) by using techniques such as linear regression141
and different types of neural networks from input voltageand resistance data. Often these signals are transformed intodifferentials, with Severson et al.142 showing that differentialcapacity is a strong indicator of RUL. Extensions of theseapproaches which use spectroscopic information, such as EIS,have also demonstrated accurate RUL estimation from non-intuitive data sources. Zhang et al.143 for instance combinedEIS measurements of batteries aged in various modes withGaussian process regression and an automatic feature identifi-cation approach to identify two specific frequencies (2 Hz and17 Hz) which were particularly sensitive to degradation. Herethe authors attribute this to changing interfacial properties,however further validation of this was needed.
Beyond these applications, text mining tools have also beendeveloped, such as the work by Torayev et al.144 which auto-matically scanned over 1800 articles and extracted key perfor-mance data for a LiO2 system. Predicting battery catastrophicfailure is also an emerging domain of interest for data-drivenapproaches as highlighted by Finegan et al.145 However, whilstthe frameworks are currently available, ensuring large enoughvolumes of high quality data and the fusion of multi-modaldata types remains a challenge.
Conclusions
Understanding battery degradation is vital for developing highperformance batteries that will meet the requirements formultiple applications. This perspective has identified five principaldegradation mechanisms that are most commonly considered tobe the cause of battery degradation during normal operation.These are SEI layer growth, lithium plating, PE decompositionand particle fracture at both electrodes. These five principaldegradation mechanisms interact with each other and give riseto thirteen secondary degradation mechanisms, which are shown inFig. 9, along with their interconnections. All of these degradationmechanisms result in 5 modes which are observable at the cell level.These are: LLI inventory, impedance change, stoichiometric drift,and LAM at both electrodes. These then result in operational effectssuch as capacity or power fade. Calendar or cycle ageing merelyrepresent different pathways through the degradation space repre-sented by these mechanisms.
Perspective PCCP
Ope
n A
cces
s A
rtic
le. P
ublis
hed
on 2
2 M
arch
202
1. D
ownl
oade
d on
1/1
6/20
22 1
2:17
:31
AM
. T
his
artic
le is
lice
nsed
und
er a
Cre
ativ
e C
omm
ons
Attr
ibut
ion
3.0
Unp
orte
d L
icen
ce.
View Article Online
8216 | Phys. Chem. Chem. Phys., 2021, 23, 8200–8221 This journal is © the Owner Societies 2021
Multiple interactions between degradation mechanismshave been identified and discussed, which in many cases requirefurther study to properly understand. Multiple explanations toexplain the transition between linear and non-linear degradationwere found, also known as the knee point, cell drop-off, suddenfailure, etc. Two examples of coupling found to explain thisinclude SEI layer growth leading to pore blockage and subse-quent lithium plating, and SEI layer growth leading to electrolyteloss and the cell drying out. However, we found no evidence for auniversal explanation that applies in every case. We consider it tobe far more likely that all reported explanations are possible, aswell as many not proposed yet, and that the exact combination ofdegradation mechanisms that leads to end-of-life will be afunction of cell chemistry and how a cell is used, simply resultingagain in different pathways through the degradation space.Multiple other degradation mechanisms were considered, butwere not included in this perspective, as they were not generallyconsidered to be significant during normal operation.
Battery models need to be parameterised before they can bereliably applied to particular chemistries, applications or stagesof the battery life. A variety of experimental and atomistictechniques exist for battery parameterisation, but these arenot well understood and there is a need for a similar, concertedeffort to be made to review parameterisation techniques forbattery models.
We found that degradation at the PE is generally overlookedand the majority of previous work has been focused on thenegative electrode. However, with the increased use of high nickelNMC electrodes, the thermodynamic stability of the electrode islowered and positive electrode degradation is increasingly reportedas significant.
The conditions that promote or attenuate the progression ofeach degradation mechanism are summarised, in a way thatwill help inform how to operate a cell to extend life, and alsoinform the design of accelerated degradation experiments.Understanding that only degradation modes and not themechanisms themselves are observable at the cell level in situ,and which degradation mechanisms result in similar modes,will also help with the design of accelerated degradation experi-ments for which the effects of each degradation mechanism onits own are observable. The attempts to model each degradationmechanism and a limited number of examples of attempts tocouple degradation mechanisms are also summarised, in a waythat will help inform future modelling attempts.
We propose that the first universal cell degradation modelthat would be suitable for the majority of operating conditionswould need to include the 5 principal and 13 secondarydegradation mechanisms that we have identified and how theyinteract with each other. However, consensus has not yet beenreached for the governing equations for many of these mechanismsand parameterisation will be difficult, requiring modellers andexperimentalists to work closely together. However, achieving this‘moonshot’ goal would significantly advance the field of lithium ionbattery modelling and would provide industry with an extremelyuseful tool to extend battery lifetime and performance in multipleapplications.
Author contributions
Jacqueline S. Edge: conceptualisation, funding & acquisition,methodology, project administration, visualisation, writing –original draft, writing – review and editing. Simon O’Kane: con-ceptualisation, investigation, writing – original draft. Ryan Prosser:conceptualisation, investigation, visualisation, writing – originaldraft. Niall D. Kirkaldy: investigation, methodology, visualisation,writing – original draft. Anisha N. Patel: conceptualisation, writing –review and editing. Alastair Hales: investigation, methodology,writing – original draft. Abir Ghosh, Weilong Ai, Jingyi Chen, JiangYang, Shen Li, Laura Bravo Diaz, Karthik N. Radhakrishnan:investigation, writing – original draft. Mei-Chin Pang: projectadministration, writing – original draft, Anna Tomaszewska,M. Waseem Marzook: writing – original draft. Huizhi Wang,Yatish Patel: supervision, writing – review and editing. Billy Wu,Gregory J. Offer: conceptualisation, funding & acquisition, super-vision, writing – original draft, writing – review and editing.
Conflicts of interest
There are no conflicts to declare.
Acknowledgements
This work was partially carried out with funding from theFaraday Institution (faraday.ac.uk; EP/S003053/1), grant numberFIRG003. We would also like to thank Mr Amir Kosha Amiri for hisgraphical design expertise in constructing Fig. 1, 2, 4, 8 and 9.
Notes and references
1 D. Sanders, A. Hart, M. Ravishankar, J. Brunert, G. Strbac,M. Aunedi and D. Pudjianto, An analysis of electricity systemflexibility for Great Britain, London, 2016.
2 G. E. Blomgren, The Development and Future of LithiumIon Batteries, J. Electrochem. Soc., 2017, 164, A5019–A5025.
3 M. M. Kabir and D. E. Demirocak, Application of grapheneand graphene-based materials in clean energy-relateddevices Minghui, Int. J. Energy Res., 2017, 41, 1963–1986.
4 J. C. Burns, A. Kassam, N. N. Sinha, L. E. Downie,L. Solnickova, B. M. Way and J. R. Dahn, Predicting andExtending the Lifetime of Li-Ion Batteries, J. Electrochem.Soc., 2013, 160, A1451–A1456.
5 S. N. S. Hapuarachchi, Z. Sun and C. Yan, Advances inIn Situ Techniques for Characterization of Failure Mechanismsof Li-Ion Battery Anodes, Adv. Sustainable Syst., 2018, 2, 1–29.
6 M. Woody, M. Arbabzadeh, G. M. Lewis, G. A. Keoleian andA. Stefanopoulou, Strategies to limit degradation andmaximize Li-ion battery service lifetime - Critical reviewand guidance for stakeholders, J. Energy Storage, 2020,28, 101231.
7 J. P. Pender, G. Jha, D. H. Youn, J. M. Ziegler, I. Andoni,E. J. Choi, A. Heller, B. S. Dunn, P. S. Weiss, R. M. Pennerand C. B. Mullins, Electrode Degradation in Lithium-IonBatteries, ACS Nano, 2020, 14, 1243–1295.
PCCP Perspective
Ope
n A
cces
s A
rtic
le. P
ublis
hed
on 2
2 M
arch
202
1. D
ownl
oade
d on
1/1
6/20
22 1
2:17
:31
AM
. T
his
artic
le is
lice
nsed
und
er a
Cre
ativ
e C
omm
ons
Attr
ibut
ion
3.0
Unp
orte
d L
icen
ce.
View Article Online
This journal is © the Owner Societies 2021 Phys. Chem. Chem. Phys., 2021, 23, 8200–8221 | 8217
8 M. Worsdorfer, T. Gul, P. Cazzola, M. Gorner, T. Bunsen,L. D’Amore, S. Scheffer, R. Schuitmaker, H. Signollet,J. Tattini and J. Teter, Global EV Outlook 2019 to electricmobility, 2019.
9 C. P. Grey and J. M. Tarascon, Sustainability and in situmonitoring in battery development, Nat. Mater., 2017, 16,45–56.
10 J. F. Peters, M. Baumann, B. Zimmermann, J. Braun andM. Weil, The environmental impact of Li-Ion batteries andthe role of key parameters – A review, Renewable Sustain-able Energy Rev., 2017, 67, 491–506.
11 C. Hendricks, N. Williard, S. Mathew and M. Pecht, Afailure modes, mechanisms, and effects analysis (FMMEA)of lithium-ion batteries, J. Power Sources, 2015, 297, 113–120.
12 C. Lin, A. Tang, H. Mu, W. Wang and C. Wang, Agingmechanisms of electrode materials in lithium-ion batteriesfor electric vehicles, J. Chem., 2015, 104673, DOI: 10.1155/2015/104673.
13 J. M. Reniers, G. Mulder and D. A. Howey, Review andperformance comparison of mechanical-chemical degra-dation models for lithium-ion batteries, J. Electrochem.Soc., 2019, 166, A3189–A3200.
14 C. R. Birkl, M. R. Roberts, E. McTurk, P. G. Bruce andD. A. Howey, Degradation diagnostics for lithium ion cells,J. Power Sources, 2017, 341, 373–386.
15 T. Waldmann, M. Wilka, M. Kasper, M. Fleischhammerand M. Wohlfahrt-Mehrens, Temperature dependentageing mechanisms in Lithium-ion batteries – A Post-Mortem study, J. Power Sources, 2014, 262, 129–135.
16 S. J. Harris, D. J. Harris and C. Li, Failure statistics forcommercial lithium ion batteries: A study of 24 pouchcells, J. Power Sources, 2017, 342, 589–597.
17 T. Raj, A. A. Wang, C. W. Monroe and D. A. Howey,Investigation of Path Dependent Degradation in Lithium-Ion Batteries, Batteries Supercaps, 2020, 3, 1377–1385.
18 M. Dubarry, N. Qin and P. Brooker, Calendar aging ofcommercial Li-ion cells of different chemistries – A review,Curr. Opin. Electrochem., 2018, 9, 106–113.
19 K. L. Gering, S. V. Sazhin, D. K. Jamison, C. J. Michelbacher,B. Y. Liaw, M. Dubarry and M. Cugnet, Investigation of pathdependence in commercial lithium-ion cells chosen forplug-in hybrid vehicle duty cycle protocols, J. Power Sources,2011, 196, 3395–3403.
20 X. G. Yang, Y. Leng, G. Zhang, S. Ge and C. Y. Wang,Modeling of lithium plating induced aging of lithium-ionbatteries: Transition from linear to nonlinear aging,J. Power Sources, 2017, 360, 28–40.
21 Y. Merla, B. Wu, V. Yufit, N. P. Brandon, R. F. Martinez-Botas and G. J. Offer, Novel application of differentialthermal voltammetry as an in-depth state-of-health diag-nosis method for lithium-ion batteries, J. Power Sources,2016, 307, 308–319.
22 N. Nitta, F. Wu, J. T. Lee and G. Yushin, Li-ion batterymaterials: Present and future, Mater. Today, 2015, 18, 252–264.
23 X. Han, L. Lu, Y. Zheng, X. Feng, Z. Li, J. Li and M. Ouyang,A review on the key issues of the lithium ion battery
degradation among the whole life cycle, eTransportation,2019, 1, 100005.
24 J. Vetter, P. Novak, M. R. Wagner, C. Veit, K.-C. Moller,J. O. Besenhard, M. Winter, M. Wohlfahrt-Mehrens, C. Voglerand A. Hammouche, Ageing mechanisms in lithium-ionbatteries, J. Power Sources, 2005, 147, 269–281.
25 M. Dubarry, C. Truchot and B. Y. Liaw, Synthesize batterydegradation modes via a diagnostic and prognostic model,J. Power Sources, 2012, 219, 204–216.
26 P. Bai, J. Li, F. R. Brushett and M. Z. Bazant, Transition oflithium growth mechanisms in liquid electrolytes, EnergyEnviron. Sci., 2016, 9, 3221–3229.
27 G. Liu and W. Lu, A Model of Concurrent Lithium DendriteGrowth, SEI Growth, SEI Penetration and Regrowth,J. Electrochem. Soc., 2017, 164, A1826–A1833.
28 T. Liu, L. Lin, X. Bi, L. Tian, K. Yang, J. Liu, M. Li, Z. Chen,J. Lu, K. Amine, K. Xu and F. Pan, In situ quantification ofinterphasial chemistry in Li-ion battery, Nat. Nanotechnol.,2019, 14, 50–56.
29 M. Safari, M. Morcrette, A. Teyssot and C. Delacourt,Multimodal Physics-Based Aging Model for Life Predictionof Li-Ion Batteries, J. Electrochem. Soc., 2009, 156, A145.
30 E. Sarasketa-Zabala, I. Gandiaga, L. M. Rodriguez-Martinezand I. Villarreal, Calendar ageing analysis of a LiFePO4/graphitecell with dynamic model validations: Towards realistic lifetimepredictions, J. Power Sources, 2014, 272, 45–57.
31 P. M. Attia, S. Das, S. J. Harris, M. Z. Bazant and W. C.Chueh, Electrochemical Kinetics of SEI Growth on CarbonBlack: Part I. Experiments, J. Electrochem. Soc., 2019, 166,E97–E106.
32 S. Wang, K. Yang, F. Gao, D. Wang and C. Shen, Directvisualization of solid electrolyte interphase on Li4Ti5O12by: In situ AFM, RSC Adv., 2016, 6, 77105–77110.
33 S. Zhang, K. Zhao, T. Zhu and J. Li, Electrochemomecha-nical degradation of high-capacity battery electrode mate-rials, Prog. Mater. Sci., 2017, 89, 479–521.
34 C. Zhan, T. Wu, J. Lu and K. Amine, Dissolution, migra-tion, and deposition of transition metal ions in Li-ionbatteries exemplified by Mn-based cathodes – a criticalreview, Energy Environ. Sci., 2018, 11, 243–257.
35 X. Zhao, Y. Yin, Y. Hu and S. Y. Choe, Electrochemical-thermalmodeling of lithium plating/stripping of Li(Ni0.6Mn0.2Co0.2)O2/Carbon lithium-ion batteries at subzero ambient temperatures,J. Power Sources, 2019, 418, 61–73.
36 M. Dubarry and D. Beck, Big data training data for artificialintelligence-based Li-ion diagnosis and prognosis, J. PowerSources, 2020, 479, 228806.
37 X. G. Yang, S. Ge, T. Liu, Y. Leng and C. Y. Wang, A lookinto the voltage plateau signal for detection and quantifi-cation of lithium plating in lithium-ion cells, J. PowerSources, 2018, 395, 251–261.
38 I. D. Campbell, M. Marzook, M. Marinescu and G. J. Offer,How Observable Is Lithium Plating? Differential VoltageAnalysis to Identify and Quantify Lithium Plating FollowingFast Charging of Cold Lithium-Ion Batteries, J. Electrochem.Soc., 2019, 166, A725–A739.
Perspective PCCP
Ope
n A
cces
s A
rtic
le. P
ublis
hed
on 2
2 M
arch
202
1. D
ownl
oade
d on
1/1
6/20
22 1
2:17
:31
AM
. T
his
artic
le is
lice
nsed
und
er a
Cre
ativ
e C
omm
ons
Attr
ibut
ion
3.0
Unp
orte
d L
icen
ce.
View Article Online
8218 | Phys. Chem. Chem. Phys., 2021, 23, 8200–8221 This journal is © the Owner Societies 2021
39 Q. Liu, C. Du, B. Shen, P. Zuo, X. Cheng, Y. Ma, G. Yin andY. Gao, Understanding undesirable anode lithium platingissues in lithium-ion batteries, RSC Adv., 2016, 6, 88683–88700.
40 X. M. Liu and C. B. Arnold, Effects of Current Density onDefect-Induced Capacity Fade through Localized Plating inLithium-Ion Batteries, J. Electrochem. Soc., 2020, 167, 130519.
41 T. C. Bach, S. F. Schuster, E. Fleder, J. Muller, M. J. Brand,H. Lorrmann, A. Jossen and G. Sextl, Nonlinear aging ofcylindrical lithium-ion cells linked to heterogeneous com-pression, J. Energy Storage, 2016, 5, 212–223.
42 M. Dubarry, N. Qin and P. Brooker, Calendar aging ofcommercial Li-ion cells of different chemistries – A review,Curr. Opin. Electrochem., 2018, 9, 106–113.
43 J. Keil, N. Paul, V. Baran, P. Keil, R. Gilles and A. Jossen,Linear and Nonlinear Aging of Lithium-Ion Cells Investi-gated by Electrochemical Analysis and In-Situ NeutronDiffraction, J. Electrochem. Soc., 2019, 166, A3908–A3917.
44 A. Manthiram, A reflection on lithium-ion battery cathodechemistry, Nat. Commun., 2020, 11, 1550.
45 R. Jung, M. Metzger, F. Maglia, C. Stinner and H. A.Gasteiger, Oxygen Release and Its Effect on the CyclingStability of LiNix MnyCozO2 (NMC) Cathode Materials forLi-Ion Batteries, J. Electrochem. Soc., 2017, 164, A1361–A1377.
46 M. D. Radin, S. Hy, M. Sina, C. Fang, H. Liu, J. Vinckeviciute,M. Zhang, M. S. Whittingham, Y. S. Meng and A. Van der Ven,Narrowing the Gap between Theoretical and PracticalCapacities in Li-Ion Layered Oxide Cathode Materials,Adv. Energy Mater., 2017, 7, 1–33.
47 E. Billy, M. Joulie, R. Laucournet, A. Boulineau, E. De Vitoand D. Meyer, Dissolution Mechanisms of LiNi1/3Mn1/3Co1/3O2 Positive Electrode Material from Lithium-IonBatteries in Acid Solution, ACS Appl. Mater. Interfaces,2018, 10, 16424–16435.
48 D. Li, H. Li, D. Danilov, L. Gao, J. Zhou, R. A. Eichel, Y. Yangand P. H. L. Notten, Temperature-dependent cycling perfor-mance and ageing mechanisms of C6/LiNi1/3Mn1/3Co1/3O2batteries, J. Power Sources, 2018, 396, 444–452.
49 E. Zhao, L. Fang, M. Chen, D. Chen, Q. Huang, Z. Hu,Q. Yan, M. Wu and X. Xiao, New insight into Li/Ni disorderin layered cathode materials for lithium ion batteries: ajoint study of neutron diffraction, electrochemical kineticanalysis and first-principles calculations, J. Mater. Chem. A,2017, 5, 1679–1686.
50 R. Jung, R. Morasch, P. Karayaylali, K. Phillips, F. Maglia,C. Stinner, Y. Shao-Horn and H. A. Gasteiger, Effect of AmbientStorage on the Degradation of Ni-Rich Positive ElectrodeMaterials (NMC811) for Li-Ion Batteries, J. Electrochem. Soc.,2018, 165, A132–A141.
51 E. M. Erickson, F. Schipper, T. R. Penki, J.-Y. Shin, C. Erk,F.-F. Chesneau, B. Markovsky and D. Aurbach, Review—RecentAdvances and Remaining Challenges for Lithium Ion BatteryCathodes, J. Electrochem. Soc., 2017, 164, A6341–A6348.
52 T. Li, X.-Z. Yuan, L. Zhang, D. Song, K. Shi and C. Bock,Degradation Mechanisms and Mitigation Strategies ofNickel-Rich NMC-Based Lithium-Ion Batteries, Electrochem.Energy Rev., 2020, 3, 43–80.
53 S.-K. Jung, H. Gwon, J. Hong, K.-Y. Park, D.-H. Seo, H. Kim,J. Hyun, W. Yang and K. Kang, Understanding the DegradationMechanisms of LiNi0.5Co0.2Mn0.3O2 Cathode Material inLithium Ion Batteries, Adv. Energy Mater., 2014, 4, 1300787.
54 C. Li, H. P. Zhang, L. J. Fu, H. Liu, Y. P. Wu, E. Rahm,R. Holze and H. Q. Wu, Cathode materials modified bysurface coating for lithium ion batteries, Electrochim. Acta,2006, 51, 3872–3883.
55 N. Alias and A. A. Mohamad, Advances of aqueousrechargeable lithium-ion battery: A review, J. Power Sources,2015, 274, 237–251.
56 F. Lin, I. M. Markus, D. Nordlund, T.-C. Weng, M. D. Asta,H. L. Xin and M. M. Doeff, Surface reconstruction andchemical evolution of stoichiometric layered cathode materialsfor lithium-ion batteries, Nat. Commun., 2014, 5, 3529.
57 R. Jung, M. Metzger, F. Maglia, C. Stinner and H. A.Gasteiger, Chemical versus electrochemical electrolyte oxidationon NMC111, NMC622, NMC811, LNMO, and conductivecarbon, J. Phys. Chem. Lett., 2017, 8, 4820–4825.
58 R. Jung, P. Strobl, F. Maglia, C. Stinner and H. A. Gasteiger,Temperature Dependence of Oxygen Release from LiNi 0.6Mn 0.2 Co 0.2 O 2 (NMC622) Cathode Materials for Li-IonBatteries, J. Electrochem. Soc., 2018, 165, A2869–A2879.
59 J. A. Gilbert, I. A. Shkrob and D. P. Abraham, TransitionMetal Dissolution, Ion Migration, Electrocatalytic Reductionand Capacity Loss in Lithium-Ion Full Cells, J. Electrochem.Soc., 2017, 164, A389–A399.
60 S. Komaba, B. Kaplan, T. Ohtsuka, Y. Kataoka, N. Kumagaiand H. Groult, Inorganic electrolyte additives to suppressthe degradation of graphite anodes by dissolved Mn(II) forlithium-ion batteries, J. Power Sources, 2003, 119–121, 378–382.
61 A. Blyr, C. Sigala, G. Amatuc, D. Guyornard, Y. Chabre andJ.-M. Tarascon, Self - Discharge of LiMn 2 O 4/C Li – IonCells in Their Discharged State: Understanding by Means ofThree – Electrode Measurements Cells in Their DischargedState, J. Electrochem. Soc., 1998, 145, 194–209.
62 J. Cho and M. M. Thackeray, Structural Changes ofLiMn2 O 4 Spinel Electrodes during Electrochemical Cycling,J. Electrochem. Soc., 1999, 146, 3577–3581.
63 M. Ebner, F. Marone, M. Stampanoni and V. Wood, Visualizationand quantification of Electrochemical and Mechanical,Science, 2013, 342, 716–721.
64 R. Xu, Y. Yang, F. Yin, P. Liu, P. Cloetens, Y. Liu, F. Lin andK. Zhao, Heterogeneous damage in Li-ion batteries: Experi-mental analysis and theoretical modeling, J. Mech. Phys.Solids, 2019, 129, 160–183.
65 W. Ai, L. Kraft, J. Sturm, A. Jossen and B. Wu, Electro-chemical thermal-mechanical modelling of stress inhomo-geneity in lithium-ion pouch cells, J. Electrochem. Soc.,2020, 167, 013512.
66 W.-J. Zhang, A review of the electrochemical performanceof alloy anodes for lithium-ion batteries, J. Power Sources,2011, 196, 13–24.
67 B. A. Boukamp, G. C. Lesh, R. A. Huggins and J. E. Soc,All-Solid Lithium Electrodes with Mixed-Conductor Matrix,J. Electrochem. Soc., 1981, 128, 725–729.
PCCP Perspective
Ope
n A
cces
s A
rtic
le. P
ublis
hed
on 2
2 M
arch
202
1. D
ownl
oade
d on
1/1
6/20
22 1
2:17
:31
AM
. T
his
artic
le is
lice
nsed
und
er a
Cre
ativ
e C
omm
ons
Attr
ibut
ion
3.0
Unp
orte
d L
icen
ce.
View Article Online
This journal is © the Owner Societies 2021 Phys. Chem. Chem. Phys., 2021, 23, 8200–8221 | 8219
68 X. Li, A. M. Colclasure, D. P. Finegan, D. Ren, Y. Shi,X. Feng, L. Cao, Y. Yang and K. Smith, Degradationmechanisms of high capacity 18650 cells containing Si-graphite anode and nickel-rich NMC cathode, Electrochim.Acta, 2019, 297, 1109–1120.
69 U. Kasavajjula, C. Wang and A. J. Appleby, Nano- and bulk-silicon-based insertion anodes for lithium-ion secondarycells, J. Power Sources, 2007, 163, 1003–1039.
70 J. H. Ryu, J. W. Kim, Y.-E. Sung and S. M. Oh, Failure Modesof Silicon Powder Negative Electrode in Lithium SecondaryBatteries, Electrochem. Solid-State Lett., 2004, 7, A306.
71 S. Mohan, Y. Kim, J. B. Siegel, N. A. Samad and A. G.Stefanopoulou, A Phenomenological Model of Bulk Force ina Li-Ion Battery Pack and Its Application to State of ChargeEstimation, J. Electrochem. Soc., 2014, 161, A2222–A2231.
72 T. Rauhala, K. Jalkanen, T. Romann, E. Lust, N. Omar andT. Kallio, Low-temperature aging mechanisms of commercialgraphite/LiFePO4 cells cycled with a simulated electric vehicleload profile—A post-mortem study, J. Energy Storage, 2018, 20,344–356.
73 F. P. McGrogan, S. N. Raja, Y.-M. Chiang and K. J. Van Vliet,Electrochemomechanical Fatigue: Decoupling Mechanisms ofFracture-Induced Performance Degradation in LiXMn2O4,J. Electrochem. Soc., 2018, 165, A2458–A2466.
74 J. Christensen and J. Newman, A Mathematical Model ofStress Generation and Fracture in Lithium ManganeseOxide, J. Electrochem. Soc., 2006, 153, A1019.
75 T. Gunther, D. Schreiner, A. Metkar, C. Meyer, A. Kwadeand G. Reinhart, Classification of Calendering-InducedElectrode Defects and Their Influence on SubsequentProcesses of Lithium-Ion Battery Production, Energy Tech-nol., 2020, 8, 1900026.
76 P. Zuo and Y.-P. Zhao, A phase field model couplinglithium diffusion and stress evolution with crack propagationand application in lithium ion batteries, Phys. Chem. Chem.Phys., 2015, 17, 287–297.
77 X. H. Liu, L. Zhong, S. Huang, S. X. Mao, T. Zhu andJ. Y. Huang, Size-dependent fracture of silicon nano-particles during lithiation, ACS Nano, 2012, 6, 1522–1531.
78 I. Laresgoiti, S. Kabitz, M. Ecker and D. U. Sauer, Modelingmechanical degradation in lithium ion batteries duringcycling: Solid electrolyte interphase fracture, J. PowerSources, 2015, 300, 112–122.
79 J. P. Maranchi, A. F. Hepp, A. G. Evans, N. T. Nuhfer andP. N. Kumta, Interfacial Properties of the a-Si/Cu:Active–Inactive Thin-Film Anode System for Lithium-Ion Batteries,J. Electrochem. Soc., 2006, 153, A1246.
80 H. Wu, G. Chan, J. W. Choi, I. Ryu, Y. Yao, M. T. Mcdowell,S. W. Lee, A. Jackson, Y. Yang, L. Hu and Y. Cui, Stablecycling of double-walled silicon nanotube battery anodesthrough solid-electrolyte interphase control, Nat. Nanotechnol.,2012, 7, 310–315.
81 R. D. Deshpande and D. M. Bernardi, Modeling Solid-Electrolyte Interphase (SEI) Fracture: Coupled Mechanical/Chemical Degradation of the Lithium Ion Battery, J. Electrochem.Soc., 2017, 164, A461–A474.
82 S. Muller, P. Pietsch, B. E. Brandt, P. Baade, V. De Andrade,F. De Carlo and V. Wood, Quantification and modeling ofmechanical degradation in lithium-ion batteries based onnanoscale imaging, Nat. Commun., 2018, 9, 1–8.
83 E. Peled, The Electrochemical Behavior of Alkali andAlkaline Earth Metals in Nonaqueous Battery Systems—TheSolid Electrolyte Interphase Model, J. Electrochem. Soc., 1979,126, 2047.
84 E. Peled and S. Menkin, Review—SEI: Past, Present andFuture, J. Electrochem. Soc., 2017, 164, A1703, DOI: 10.1149/2.1441707jes.
85 X. Lin, J. Park, L. Liu, Y. Lee, W. Lu and A. M. Sastry,A Comprehensive Capacity Fade Model and Analysis forLi-Ion Batteries, J. Electrochem. Soc., 2013, 160, A1701–A1710.
86 I. A. Hunt, Y. Zhao, Y. Patel and J. Offer, Surface CoolingCauses Accelerated Degradation Compared to Tab Coolingfor Lithium-Ion Pouch Cells, J. Electrochem. Soc., 2016, 163,A1846–A1852.
87 J. E. Harlow, X. Ma, J. Li, E. Logan, Y. Liu, N. Zhang, L. Ma,S. L. Glazier, M. M. E. Cormier, M. Genovese, S. Buteau,A. Cameron, J. E. Stark and J. R. Dahn, A Wide Range ofTesting Results on an Excellent Lithium-Ion Cell Chemistryto be used as Benchmarks for New Battery Technologies,J. Electrochem. Soc., 2019, 166, A3031–A3044.
88 M. Dubarry, N. Vuillaume and B. Y. Liaw, From single cellmodel to battery pack simulation for Li-ion batteries,J. Power Sources, 2009, 186, 500–507.
89 Y. Zhang, X. Li, L. Su, Z. Li, B. Y. Liaw and J. Zhang, LithiumPlating Detection and Quantification in Li-Ion Cells fromDegradation Behaviors, ECS Trans., 2017, 75, 37–50.
90 S. E. J. O’Kane, I. D. Campbell, M. W. J. Marzook, G. J. Offerand M. Marinescu, Physical Origin of the DifferentialVoltage Minimum Associated with Lithium Plating in Li-Ion Batteries, J. Electrochem. Soc., 2020, 167, 090540.
91 D. Ansean, M. Dubarry, A. Devie, B. Y. Liaw, V. M. Garcıa,J. C. Viera and M. Gonzalez, Operando lithium platingquantification and early detection of a commercial LiFePO4cell cycled under dynamic driving schedule, J. PowerSources, 2017, 356, 36–46.
92 H. Konishi, T. Yuasa and M. Yoshikawa, Thermal stabilityof Li1-yNixMn (1-x)/2Co(1-x)/2O2 layer-structured cathodematerials used in Li-Ion batteries, J. Power Sources, 2011,196, 6884–6888.
93 H. Arai, S. Okada, Y. Sakurai and J. I. Yamaki, Thermalbehavior of Li1-yNiO2 and the decomposition mechanism,Solid State Ionics, 1998, 109, 295–302.
94 I. Belharouak, D. Vissers and K. Amine, Thermal Stabilityof the Li(Ni[sub 0.8]Co[sub 0.15]Al[sub 0.05])O[sub 2] Cathodein the Presence of Cell Components, J. Electrochem. Soc., 2006,153, A2030.
95 H. Zheng, Q. Sun, G. Liu, X. Song and V. S. Battaglia,Correlation between dissolution behavior and electrochemicalcycling performance for LiNi1/3Co1/3Mn1/3O2-based cells,J. Power Sources, 2012, 207, 134–140.
96 A. Banerjee, Y. Shilina, B. Ziv, J. M. Ziegelbauer, S. Luski,D. Aurbach and I. C. Halalay, On the oxidation state of
Perspective PCCP
Ope
n A
cces
s A
rtic
le. P
ublis
hed
on 2
2 M
arch
202
1. D
ownl
oade
d on
1/1
6/20
22 1
2:17
:31
AM
. T
his
artic
le is
lice
nsed
und
er a
Cre
ativ
e C
omm
ons
Attr
ibut
ion
3.0
Unp
orte
d L
icen
ce.
View Article Online
8220 | Phys. Chem. Chem. Phys., 2021, 23, 8200–8221 This journal is © the Owner Societies 2021
manganese ions in li-ion battery electrolyte solutions,J. Am. Chem. Soc., 2017, 139, 1738–1741.
97 S. Muto, Y. Sasano, K. Tatsumi, T. Sasaki, K. Horibuchi,Y. Takeuchi and Y. Ukyo, Capacity-Fading Mechanisms ofLiNiO2-Based Lithium-Ion Batteries, J. Electrochem. Soc.,2009, 156, A371.
98 D. P. Abraham, R. D. Twesten, M. Balasubramanian,I. Petrov, J. McBreen and K. Amine, Surface changes onLiNi0.8Co0.2O2 particles during testing of high-powerlithium-ion cells, Electrochem. Commun., 2012, 4, 620–625.
99 K. P. C. Yao, J. S. Okasinski, K. Kalaga, J. D. Almer andD. P. Abraham, Operando Quantification of (De)LithiationBehavior of Silicon–Graphite Blended Electrodes forLithium-Ion Batteries, Adv. Energy Mater., 2019, 9, 1803380.
100 S. Kalnaus, K. Rhodes and C. Daniel, A study of lithium ionintercalation induced fracture of silicon particles used asanode material in Li-ion battery, J. Power Sources, 2011,196, 8116–8124.
101 J. Cannarella and C. B. Arnold, State of health and chargemeasurements in lithium-ion batteries using mechanicalstress, J. Power Sources, 2014, 269, 7–14.
102 X. Cheng and M. Pecht, In situ stress measurementtechniques on li-ion battery electrodes: A review, Energies,2017, 10, 1–19.
103 L. S. de Vasconcelos, N. Sharma, R. Xu and K. Zhao, In-SituNanoindentation Measurement of Local Mechanical Behaviorof a Li-Ion Battery Cathode in Liquid Electrolyte, Exp. Mech.,2019, 59, 337–347.
104 J. M. Lim, T. Hwang, D. Kim, M. S. Park, K. Cho andM. Cho, Intrinsic Origins of Crack Generation in Ni-richLiNi0.8Co0.1Mn0.1O2 Layered Oxide Cathode Material,Sci. Rep., 2017, 7, 2–11.
105 S. Atlung, K. West and T. Jacobsen, Dynamic Aspects ofSolid Solution Cathodes for Electrochemical Power Sources,J. Electrochem. Soc., 1979, 126, 1311–1321.
106 G. J. Plett, ECE4710/5710: Modeling, Simulation, andIdentification of Battery Dynamics, Colorado Springs, 2019.
107 Y. H. Chiang, W. Y. Sean and J. C. Ke, Online estimation ofinternal resistance and open-circuit voltage of lithium-ionbatteries in electric vehicles, J. Power Sources, 2011, 196,3921–3932.
108 X. Hu, S. Li and H. Peng, A comparative study of equivalentcircuit models for Li-ion batteries, J. Power Sources, 2012,198, 359–367.
109 W. He, M. Pecht, D. Flynn and F. Dinmohammadi, Aphysics-based electrochemical model for lithium-ion bat-tery state-of-charge estimation solved by an optimisedprojection-based method and moving-window filtering,Energies, 2018, 11, 1–24.
110 D. D. MacDonald, Reflections on the history of electro-chemical impedance spectroscopy, Electrochim. Acta, 2006,51, 1376–1388.
111 D. Klotz, D. S. Ellis, H. Dotan and A. Rothschild, Empirical:In operando analysis of the charge carrier dynamics inhematite photoanodes by PEIS, IMPS and IMVS, Phys.Chem. Chem. Phys., 2016, 18, 23438–23457.
112 D. E. Galvez-Aranda, A. Verma, K. Hankins, J. M. Seminario,P. P. Mukherjee and P. B. Balbuena, Chemical and mechanicaldegradation and mitigation strategies for Si anodes, J. PowerSources, 2019, 419, 208–218.
113 R. Hausbrand, G. Cherkashinin, H. Ehrenberg, M. Groting,K. Albe, C. Hess and W. Jaegermann, Fundamental degradationmechanisms of layered oxide Li-ion battery cathode materials:Methodology, insights and novel approaches, Mater. Sci. Eng. B,2015, 192, 3–25.
114 M. Doyle, T. F. Fuller and J. Newman, Modeling of Galvano-static Charge and Discharge of the Lithium/Polymer/InsertionCell, J. Electrochem. Soc., 1993, 140, 1526–1533.
115 T. F. Fuller, M. Doyle and J. Newman, Simulation andOptimization of the Dual Lithium Ion Insertion Cell,J. Electrochem. Soc., 1994, 141, 1–10.
116 S. G. Marquis, V. Sulzer, R. Timms, C. P. Please and S. J.Chapman, An Asymptotic Derivation of a Single ParticleModel with Electrolyte, J. Electrochem. Soc., 2019, 166,A3693–A3706.
117 G. Richardson, I. Korotkin, R. Ranom, M. Castle and J. M.Foster, Generalised single particle models for high-rate opera-tion of graded lithium-ion electrodes: Systematic derivation andvalidation, Electrochim. Acta, 2020, 339, 135862.
118 D. Zhang, B. N. Popov and R. E. White, Modeling LithiumIntercalation of a Single Spinel Particle under Potentio-dynamic Control, J. Electrochem. Soc., 2000, 147, 831.
119 E. Prada, D. Di Domenico, Y. Creff, J. Bernard, V. Sauvant-Moynot and F. Huet, Simplified Electrochemical andThermal Model of LiFePO 4 -Graphite Li-Ion Batteries forFast Charge Applications, J. Electrochem. Soc., 2012, 159,A1508–A1519.
120 P. Kemper and D. Kum, 2013 IEEE Vehicle Power andPropulsion Conference (VPPC), IEEE, 2013, pp. 1–6.
121 J. Li, K. Adewuyi, N. Lotfi, R. G. Landers and J. Park, Asingle particle model with chemical/mechanical degrada-tion physics for lithium ion battery State of Health (SOH)estimation, Appl. Energy, 2018, 212, 1178–1190.
122 L. Zhang, L. Wang, C. Lyu, J. Li and J. Zheng, Non-destructiveanalysis of degradation mechanisms in cycle-aged graphite/LiCoO2 batteries, Energies, 2014, 7, 6282–6305.
123 B. Y. Liaw, R. G. Jungst, G. Nagasubramanian, H. L. Caseand D. H. Doughty, Modeling capacity fade in lithium-ioncells, J. Power Sources, 2005, 140, 157–161.
124 A. Cordoba-Arenas, S. Onori, Y. Guezennec and G. Rizzoni,Capacity and power fade cycle-life model for plug-in hybridelectric vehicle lithium-ion battery cells containing blendedspinel and layered-oxide positive electrodes, J. Power Sources,2015, 278, 473–483.
125 J. Kim and B. H. Cho, State-of-charge estimation and state-of-health prediction of a Li-Ion degraded battery based onan EKF combined with a per-unit system, IEEE Trans. Veh.Technol., 2011, 60, 4249–4260.
126 M. Fleckenstein, O. Bohlen and B. Baker, Aging effect oftemperature gradients in Li-ion cells experimental andsimulative investigations and the consequences on thermalbattery management, World Electr. Veh. J., 2012, 5, 322–333.
PCCP Perspective
Ope
n A
cces
s A
rtic
le. P
ublis
hed
on 2
2 M
arch
202
1. D
ownl
oade
d on
1/1
6/20
22 1
2:17
:31
AM
. T
his
artic
le is
lice
nsed
und
er a
Cre
ativ
e C
omm
ons
Attr
ibut
ion
3.0
Unp
orte
d L
icen
ce.
View Article Online
This journal is © the Owner Societies 2021 Phys. Chem. Chem. Phys., 2021, 23, 8200–8221 | 8221
127 P. Arora, Mathematical Modeling of the Lithium DepositionOvercharge Reaction in Lithium-Ion Batteries Using Carbon-Based Negative Electrodes, J. Electrochem. Soc., 1999, 146, 3543.
128 A. Jana, G. M. Shaver and R. E. Garcıa, Physical, on the fly,capacity degradation prediction of LiNiMnCoO2-graphitecells, J. Power Sources, 2019, 422, 185–195.
129 A. Ghosh, J. M. Foster, G. J. Offer and A. Marinescu,Shrinking-Core Model for the Degradation of High-NickelCathodes (NMC811) in Li-Ion Batteries: Passivation LayerGrowth and Oxygen Evolution, J. Electrochem. Soc., 2021,168, 020509, DOI: 10.1149/1945-7111/abdc71.
130 Y. Dai, L. Cai and R. E. White, Capacity Fade Model for SpinelLiMn2O4 Electrode, J. Electrochem. Soc., 2013, 160, A182–A190.
131 M. Otero, C. Heim, E. P. M. Leiva, N. Wagner and A. Friedrich,Design-Considerations regarding Silicon/Graphite and Tin/Graphite Composite Electrodes for Lithium-Ion Batteries,Sci. Rep., 2018, 8, 1–10.
132 V. A. Sethuraman, V. Srinivasan, A. F. Bower and P. R.Guduru, In Situ Measurements of Stress-Potential Couplingin Lithiated Silicon, J. Electrochem. Soc., 2010, 157, A1253.
133 J. Li, R. G. Landers and J. Park, A comprehensive single-particle-degradation model for battery state-of-healthprediction, J. Power Sources, 2020, 456, 227950, DOI:10.1016/j.jpowsour.2020.227950.
134 X. Jin, A. Vora, V. Hoshing, T. Saha, G. Shaver, O. Wasynczukand S. Varigonda, Applicability of available Li-ion batterydegradation models for system and control algorithm design,Control Eng. Pract., 2018, 71, 1–9.
135 J. Keil and A. Jossen, Electrochemical Modeling of Linearand Nonlinear Aging of Lithium-Ion Cells, J. Electrochem.Soc., 2020, 167, 110535.
136 C. Wei, S. Xia, H. Huang, Y. Mao, P. Pianetta and Y. Liu,Mesoscale Battery Science: The Behavior of ElectrodeParticles Caught on a Multispectral X-ray Camera, Acc.Chem. Res., 2018, 51, 2484–2492.
137 Z. Jiang, J. Li, Y. Yang, L. Mu, C. Wei, X. Yu, P. Pianetta,K. Zhao, P. Cloetens, F. Lin and Y. Liu, Machine-learning-
revealed statistics of the particle-carbon/binder detachmentin lithium-ion battery cathodes, Nat. Commun., 2020, 11,2310.
138 A. Gayon-Lombardo, L. Mosser, N. P. Brandon and S. J.Cooper, Pores for thought: generative adversarial networksfor stochastic reconstruction of 3D multi-phase electrodemicrostructures with periodic boundaries, npj Comput.Mater., 2020, 6, 1–11.
139 X. Gao, X. Liu, R. He, M. Wang, W. Xie, N. P. Brandon,B. Wu, H. Ling and S. Yang, Designed high-performancelithium-ion battery electrodes using a novel hybrid model-datadriven approach, Energy Storage Mater., 2021, 36, 435–458.
140 B. Wu, W. D. Widanage, S. Yang and X. Liu, Battery digitaltwins: Perspectives on the fusion of models, data and artificialintelligence for smart battery management systems, Energyand AI, 2020, 1, 100016.
141 S. J. Kwon, D. Han, J. H. Choi, J. H. Lim, S. E. Lee andJ. Kim, Remaining-useful-life prediction via multiple linearregression and recurrent neural network reflecting degradationinformation of 20Ah LiNixMnyCo1�x�yO2 pouch cell,J. Electroanal. Chem., 2020, 858, 113729.
142 K. A. Severson, P. M. Attia, N. Jin, N. Perkins, B. Jiang, Z. Yang,M. H. Chen, M. Aykol, P. K. Herring, D. Fraggedakis, M. Z.Bazant, S. J. Harris, W. C. Chueh and R. D. Braatz, Data-drivenprediction of battery cycle life before capacity degradation, Nat.Energy, 2019, 4, 383–391.
143 Y. Zhang, Q. Tang, Y. Zhang, J. Wang, U. Stimming andA. A. Lee, Identifying degradation patterns of lithium ionbatteries from impedance spectroscopy using machinelearning, Nat. Commun., 2020, 11, 6–11.
144 A. Torayev, P. C. M. M. Magusin, C. P. Grey, C. Merlet andA. A. Franco, Text mining assisted review of the literatureon Li–O2 batteries, J. Phys.: Mater., 2019, 2, 044004.
145 D. P. Finegan, J. Zhu, X. Feng, M. Keyser, M. Ulmefors,W. Li, M. Z. Bazant and S. J. Cooper, The Application ofData-Driven Methods and Physics-Based Learning forImproving Battery Safety, Joule, 2021, 5, 316–329.
Perspective PCCP
Ope
n A
cces
s A
rtic
le. P
ublis
hed
on 2
2 M
arch
202
1. D
ownl
oade
d on
1/1
6/20
22 1
2:17
:31
AM
. T
his
artic
le is
lice
nsed
und
er a
Cre
ativ
e C
omm
ons
Attr
ibut
ion
3.0
Unp
orte
d L
icen
ce.
View Article Online