Embed Size (px)
Citation preview

Adv. Radio Sci., 15, 83–91, 2017https://doi.org/10.5194/ars-15-83-2017© Author(s) 2017. This work is distributed underthe Creative Commons Attribution 3.0 License.
Lithium-ion battery models: a comparative study and amodel-based powerline communicationFida Saidani1, Franz X. Hutter1, Rares-George Scurtu2, Wolfgang Braunwarth2, and Joachim N. Burghartz1
1Institut für Mikroelektronik Stuttgart (IMS CHIPS), Allmandring 30a, 70569 Stuttgart, Germany2Zentrum für Sonnenenergie- und Wasserstoff-Forschung Baden-Württemberg (ZSW), Lise-Meitner-Straße 24,89081 Ulm, Germany
Correspondence to: Fida Saidani ([email protected])
Received: 19 December 2016 – Revised: 13 March 2017 – Accepted: 18 March 2017 – Published: 21 September 2017
Abstract. In this work, various Lithium-ion (Li-ion) bat-tery models are evaluated according to their accuracy, com-plexity and physical interpretability. An initial classificationinto physical, empirical and abstract models is introduced.Also known as “white”, “black” and “grey” boxes, respec-tively, the nature and characteristics of these model types arecompared. Since the Li-ion battery cell is a thermo-electro-chemical system, the models are either in the thermal or inthe electrochemical state-space. Physical models attempt tocapture key features of the physical process inside the cell.Empirical models describe the system with empirical param-eters offering poor analytical, whereas abstract models pro-vide an alternative representation.
In addition, a model selection guideline is proposed basedon applications and design requirements. A complex modelwith a detailed analytical insight is of use for battery design-ers but impractical for real-time applications and in situ di-agnosis. In automotive applications, an abstract model repro-ducing the battery behavior in an equivalent but more practi-cal form, mainly as an equivalent circuit diagram, is recom-mended for the purpose of battery management. As a generalrule, a trade-off should be reached between the high fidelityand the computational feasibility. Especially if the model isembedded in a real-time monitoring unit such as a micropro-cessor or a FPGA, the calculation time and memory require-ments rise dramatically with a higher number of parameters.
Moreover, examples of equivalent circuit models ofLithium-ion batteries are covered. Equivalent circuit topolo-gies are introduced and compared according to the previouslyintroduced criteria. An experimental sequence to model a20Ah cell is presented and the results are used for the pur-poses of powerline communication.
1 Introduction
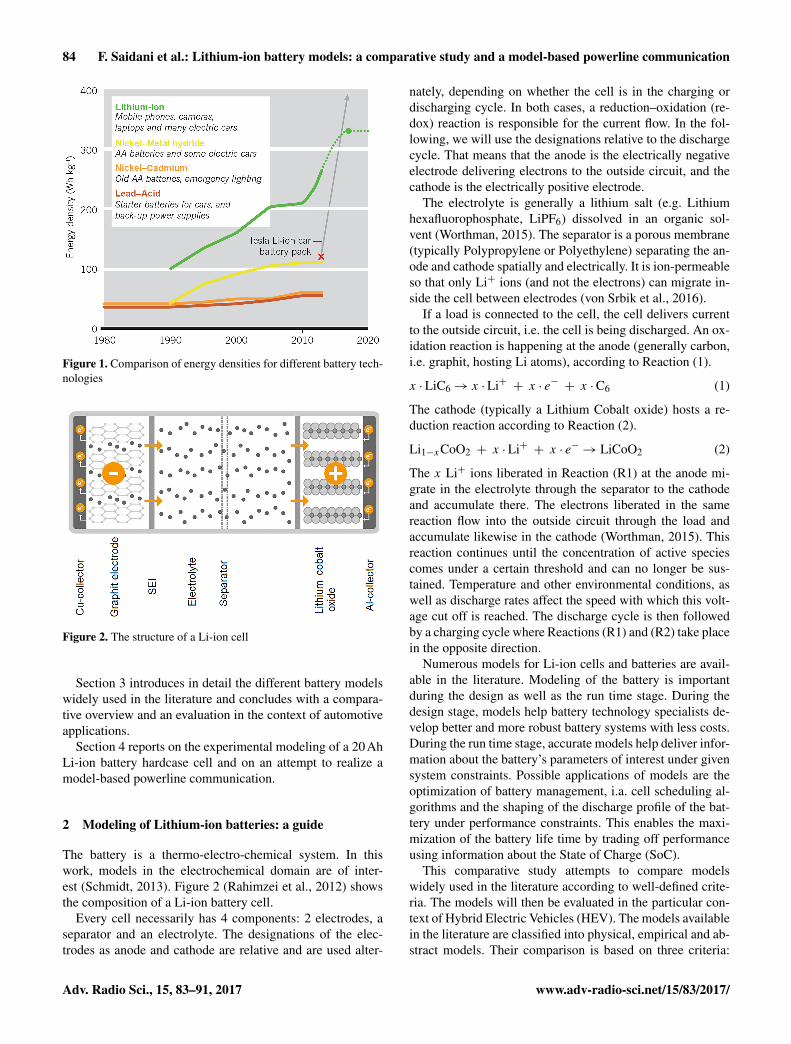
Modern electronics come with significant energy consump-tion costs. Features like colorful displays, powerful proces-sors and wireless communication are energy-hungry (Raoet al., 2003; Hu et al., 2012). Unfortunately, battery technol-ogy has not kept up with the consumer electronics growth,which has made the battery the bottleneck component inportable and automotive electronics. Among all different bat-tery technologies, Lithium-ion (Li-ion) batteries dominatethe consumer market. In 2013, five billion Li-ion cells weresold worldwide; modern technologies store twice as muchenergy per weight as the first commercial versions introducedby Sony in 1991 (Van Noorden, 2014).
As shown in Fig. 1, the high energy density and compact-ness of Li-ion batteries make them the first choice for energystorage in laptops, cameras, mobile phones, and other appli-cations (Van Noorden, 2014).
However, their reliability and lifetime are limited and de-pend considerably on environmental conditions and historyof usage. Therefore, accurate and effective battery modelsare needed for monitoring purposes (Hu et al., 2012; Raoet al., 2003). Being also used in electric and hybrid vehi-cles, higher requirements on battery design and managementsystems are set to ensure a safe, reliable and cost-efficientoperation. Therefore, accurate and computationally feasiblebattery models are important. This paper presents a compar-ative study of various Li-ion battery cells, according to well-defined criteria.
Section 2 presents an insightful view into the structure ofa Li-ion cell and introduces the comparison criteria.
Published by Copernicus Publications on behalf of the URSI Landesausschuss in der Bundesrepublik Deutschland e.V.
84 F. Saidani et al.: Lithium-ion battery models: a comparative study and a model-based powerline communication
Figure 1. Comparison of energy densities for different battery tech-nologies
Figure 2. The structure of a Li-ion cell
Section 3 introduces in detail the different battery modelswidely used in the literature and concludes with a compara-tive overview and an evaluation in the context of automotiveapplications.
Section 4 reports on the experimental modeling of a 20AhLi-ion battery hardcase cell and on an attempt to realize amodel-based powerline communication.
2 Modeling of Lithium-ion batteries: a guide
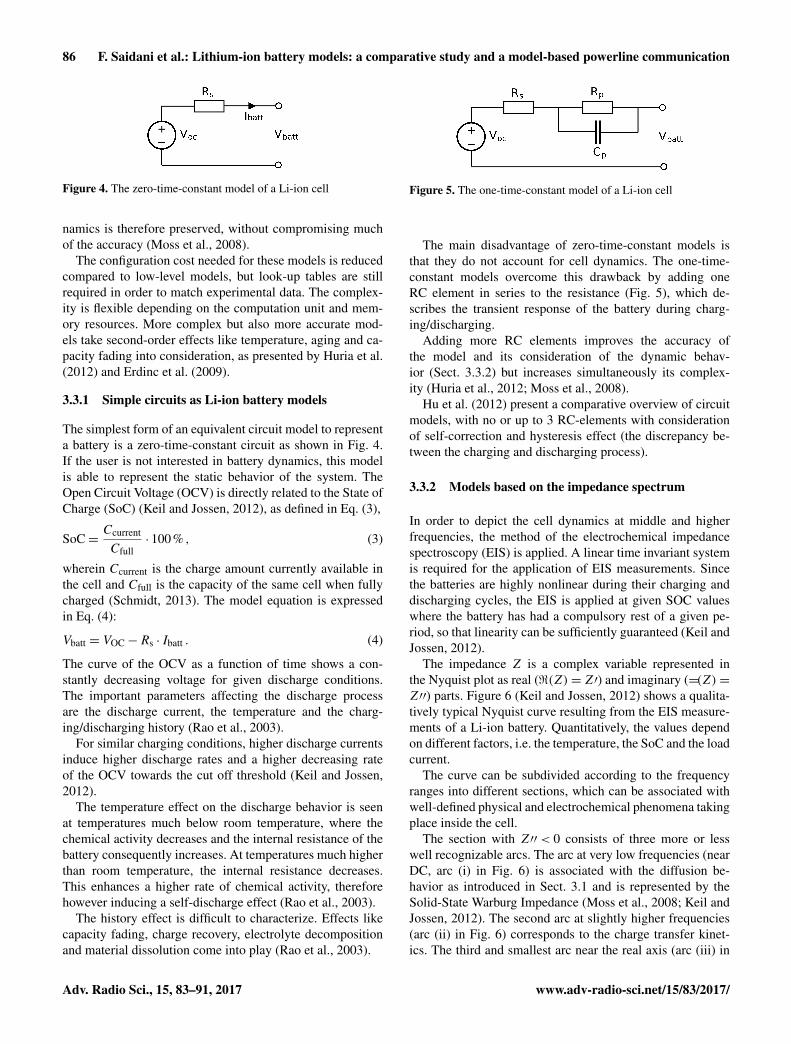
The battery is a thermo-electro-chemical system. In thiswork, models in the electrochemical domain are of inter-est (Schmidt, 2013). Figure 2 (Rahimzei et al., 2012) showsthe composition of a Li-ion battery cell.
Every cell necessarily has 4 components: 2 electrodes, aseparator and an electrolyte. The designations of the elec-trodes as anode and cathode are relative and are used alter-
nately, depending on whether the cell is in the charging ordischarging cycle. In both cases, a reduction–oxidation (re-dox) reaction is responsible for the current flow. In the fol-lowing, we will use the designations relative to the dischargecycle. That means that the anode is the electrically negativeelectrode delivering electrons to the outside circuit, and thecathode is the electrically positive electrode.
The electrolyte is generally a lithium salt (e.g. Lithiumhexafluorophosphate, LiPF6) dissolved in an organic sol-vent (Worthman, 2015). The separator is a porous membrane(typically Polypropylene or Polyethylene) separating the an-ode and cathode spatially and electrically. It is ion-permeableso that only Li+ ions (and not the electrons) can migrate in-side the cell between electrodes (von Srbik et al., 2016).
If a load is connected to the cell, the cell delivers currentto the outside circuit, i.e. the cell is being discharged. An ox-idation reaction is happening at the anode (generally carbon,i.e. graphit, hosting Li atoms), according to Reaction (1).
x ·LiC6→ x ·Li+ + x · e− + x ·C6 (1)
The cathode (typically a Lithium Cobalt oxide) hosts a re-duction reaction according to Reaction (2).
Li1−xCoO2 + x ·Li+ + x · e−→ LiCoO2 (2)
The x Li+ ions liberated in Reaction (R1) at the anode mi-grate in the electrolyte through the separator to the cathodeand accumulate there. The electrons liberated in the samereaction flow into the outside circuit through the load andaccumulate likewise in the cathode (Worthman, 2015). Thisreaction continues until the concentration of active speciescomes under a certain threshold and can no longer be sus-tained. Temperature and other environmental conditions, aswell as discharge rates affect the speed with which this volt-age cut off is reached. The discharge cycle is then followedby a charging cycle where Reactions (R1) and (R2) take placein the opposite direction.
Numerous models for Li-ion cells and batteries are avail-able in the literature. Modeling of the battery is importantduring the design as well as the run time stage. During thedesign stage, models help battery technology specialists de-velop better and more robust battery systems with less costs.During the run time stage, accurate models help deliver infor-mation about the battery’s parameters of interest under givensystem constraints. Possible applications of models are theoptimization of battery management, i.a. cell scheduling al-gorithms and the shaping of the discharge profile of the bat-tery under performance constraints. This enables the maxi-mization of the battery life time by trading off performanceusing information about the State of Charge (SoC).
This comparative study attempts to compare modelswidely used in the literature according to well-defined crite-ria. The models will then be evaluated in the particular con-text of Hybrid Electric Vehicles (HEV). The models availablein the literature are classified into physical, empirical and ab-stract models. Their comparison is based on three criteria:
Adv. Radio Sci., 15, 83–91, 2017 www.adv-radio-sci.net/15/83/2017/

F. Saidani et al.: Lithium-ion battery models: a comparative study and a model-based powerline communication 85
Figure 3. Physical processes taking place into a Li-ion cell
the accuracy of the model, the complexity of the model, andthe physical interpretability offered by the model (Rao et al.,2003).
The accuracy defines how closely the model can predictbattery state parameters and/or values of the battery vari-ables of interest. The complexity sets the number of param-eters needed for the model. Depending on the complexitylevel, computations or in situ estimations will take a moreor less considerable time, which would put into question themodel suitability for real-time applications. Also, complexmodels come with configuration effort costs. The physicalinterpretability can also be defined as the analytical insightthe model provides. A model with a high level of physicalinterpretability offers a good analytical understanding of thephysics inside the battery. The usefulness of this insight de-pends on the application.
3 Li-ion battery cell models: an overview
3.1 Physical models
Also known as white boxes (Schmidt, 2013), physical modelsare low-level models with a high accuracy level (Rao et al.,2003). They describe the structure of the materials and de-pict the complex electrochemical phenomena happening in-side the cell, namely thermodynamics, active species kineticsand transport phenomena.
Schmidt (2013) presented an overview of the physical phe-nomena as shown in Fig. 3. Four main processes are takingplace in three regions of operation: the two solid phases of theelectrodes material, and the liquid phase of the electrolyte.
The first process (process (1) in Fig. 3) is the passingthrough of charges and takes place in the first region of op-eration: the solid phase of the electrode. This process de-scribes the de- or intercalation of the Lithium ions into theactive material. The second process (process (2) in Fig. 3),taking place in the same region, is the solid state diffusionof Lithium ions compelled by the concentration gradient ofions between the surface and the bulk of the electrode. Thethird process (process (3) in Fig. 3) designates the electronsconduction from one electrode to another through the outsidecircuit. The fourth process (process (4) in Fig. 3) is the ions
conduction in the electrolyte through the separator. It is alsoforced by the concentration gradient and is based on diffu-sion but happens at a higher rate than in solids.
Based on interdependent differential equations, a largenumber of parameters is needed along with a high config-uration effort to establish a physical model. Diffusion coef-ficients as well other material related characteristics are im-portant parameters in the equations (Keil and Jossen, 2012).Examples of research attempting on physical modeling of Li-ion batteries are presented by Smith et al. (2007) and Ver-brugge et al. (2000). Such models offer a high analyticalinsight, which might be interesting for battery technologyspecialists and material scientists. However, from an elec-trical engineering point of view, such an insight is not neces-sary. With sometimes more than 50 parameters, the complex-ity is significantly high. This increases the requirements forneeded memory and computation time. Some models werereported to have run into over-fitting problems (Hu et al.,2012).
3.2 Empirical models
Empirical models are also called black boxes (Schmidt,2013) because of the poor insight they offer into the sys-tem. They are based on empirical parameters which do nothave any physical significance in some cases (Rao et al.,2003). The mathematical approaches used to define the trans-fer function from the inputs to the outputs of the black boxmake these models easy to configure, and able to deliverquick responses and predictions. However, their accuracy re-mains limited, especially if the model is too simple (Raoet al., 2003). The accuracy and the physical insight can beimproved if combined with a low-level model (Sect. 3.1).
More sophisticated models achieve better results based onstochastic models and/or fuzzy logic and can deliver batteryrelated parameters. Examples for such models are presentedby Yu (2015) and Wu et al. (2012). The work of Jiani et al.(2014) is also based on a similar mathematical approach; themodel presented itself is rather to be classified under the cat-egory of the abstract models, which is presented in Sect. 3.3.
3.3 Abstract models
Also known as grey boxes (Schmidt, 2013), abstract modelsprovide an alternative representation of the physical entity. Inthe context of Li-ion batteries, these models present a differ-ent, but equivalent representation of the battery system. Dif-ferent forms are therefore possible; the representation as anelectrical equivalent circuit is, however, very popular. Exam-ples are provided by Hu et al. (2012), Rahmoun and Biechl(2012), Huria et al. (2012) and Ouannes et al. (2014). Thecircuit-based models are simple and practical because theyallow for the complex electrochemical process to be replacedby a simple electrical circuit. The correlation with battery dy-
www.adv-radio-sci.net/15/83/2017/ Adv. Radio Sci., 15, 83–91, 2017
86 F. Saidani et al.: Lithium-ion battery models: a comparative study and a model-based powerline communication
Figure 4. The zero-time-constant model of a Li-ion cell
namics is therefore preserved, without compromising muchof the accuracy (Moss et al., 2008).
The configuration cost needed for these models is reducedcompared to low-level models, but look-up tables are stillrequired in order to match experimental data. The complex-ity is flexible depending on the computation unit and mem-ory resources. More complex but also more accurate mod-els take second-order effects like temperature, aging and ca-pacity fading into consideration, as presented by Huria et al.(2012) and Erdinc et al. (2009).
3.3.1 Simple circuits as Li-ion battery models
The simplest form of an equivalent circuit model to representa battery is a zero-time-constant circuit as shown in Fig. 4.If the user is not interested in battery dynamics, this modelis able to represent the static behavior of the system. TheOpen Circuit Voltage (OCV) is directly related to the State ofCharge (SoC) (Keil and Jossen, 2012), as defined in Eq. (3),
SoC=Ccurrent
Cfull· 100% , (3)
wherein Ccurrent is the charge amount currently available inthe cell and Cfull is the capacity of the same cell when fullycharged (Schmidt, 2013). The model equation is expressedin Eq. (4):
Vbatt = VOC−Rs · Ibatt . (4)
The curve of the OCV as a function of time shows a con-stantly decreasing voltage for given discharge conditions.The important parameters affecting the discharge processare the discharge current, the temperature and the charg-ing/discharging history (Rao et al., 2003).
For similar charging conditions, higher discharge currentsinduce higher discharge rates and a higher decreasing rateof the OCV towards the cut off threshold (Keil and Jossen,2012).
The temperature effect on the discharge behavior is seenat temperatures much below room temperature, where thechemical activity decreases and the internal resistance of thebattery consequently increases. At temperatures much higherthan room temperature, the internal resistance decreases.This enhances a higher rate of chemical activity, thereforehowever inducing a self-discharge effect (Rao et al., 2003).
The history effect is difficult to characterize. Effects likecapacity fading, charge recovery, electrolyte decompositionand material dissolution come into play (Rao et al., 2003).
Figure 5. The one-time-constant model of a Li-ion cell
The main disadvantage of zero-time-constant models isthat they do not account for cell dynamics. The one-time-constant models overcome this drawback by adding oneRC element in series to the resistance (Fig. 5), which de-scribes the transient response of the battery during charg-ing/discharging.
Adding more RC elements improves the accuracy ofthe model and its consideration of the dynamic behav-ior (Sect. 3.3.2) but increases simultaneously its complex-ity (Huria et al., 2012; Moss et al., 2008).
Hu et al. (2012) present a comparative overview of circuitmodels, with no or up to 3 RC-elements with considerationof self-correction and hysteresis effect (the discrepancy be-tween the charging and discharging process).
3.3.2 Models based on the impedance spectrum
In order to depict the cell dynamics at middle and higherfrequencies, the method of the electrochemical impedancespectroscopy (EIS) is applied. A linear time invariant systemis required for the application of EIS measurements. Sincethe batteries are highly nonlinear during their charging anddischarging cycles, the EIS is applied at given SOC valueswhere the battery has had a compulsory rest of a given pe-riod, so that linearity can be sufficiently guaranteed (Keil andJossen, 2012).
The impedance Z is a complex variable represented inthe Nyquist plot as real (<(Z)= Z′) and imaginary (=(Z)=
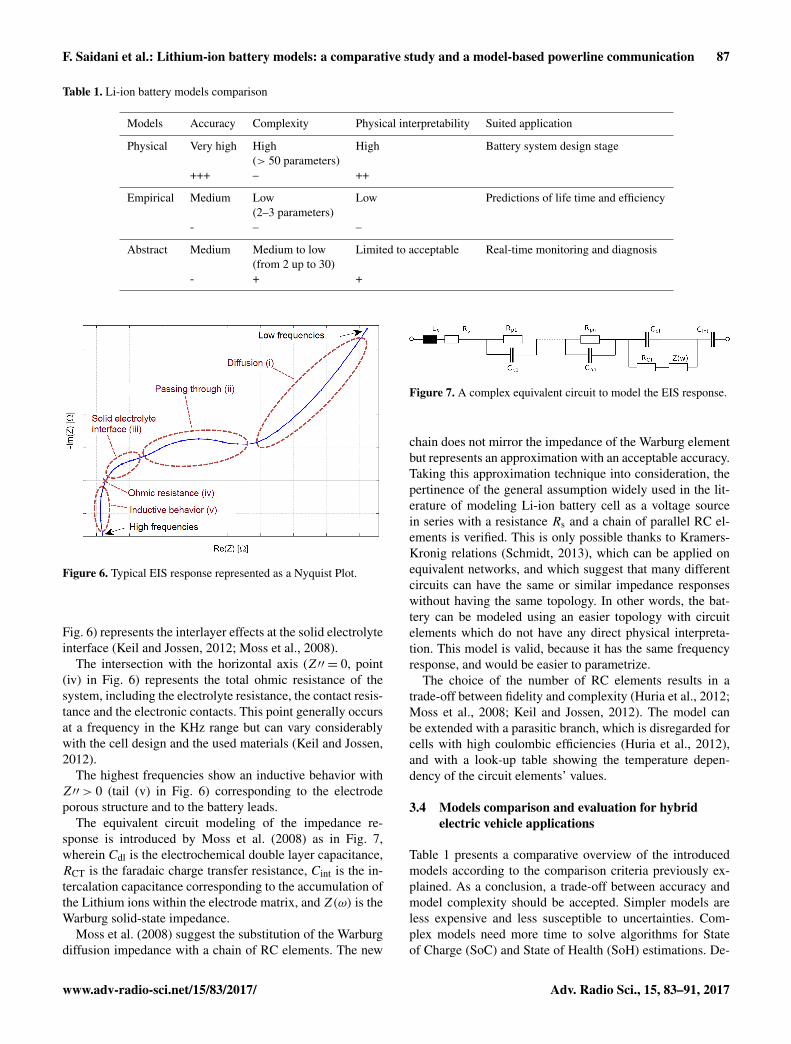
Z′′) parts. Figure 6 (Keil and Jossen, 2012) shows a qualita-tively typical Nyquist curve resulting from the EIS measure-ments of a Li-ion battery. Quantitatively, the values dependon different factors, i.e. the temperature, the SoC and the loadcurrent.
The curve can be subdivided according to the frequencyranges into different sections, which can be associated withwell-defined physical and electrochemical phenomena takingplace inside the cell.
The section with Z′′< 0 consists of three more or lesswell recognizable arcs. The arc at very low frequencies (nearDC, arc (i) in Fig. 6) is associated with the diffusion be-havior as introduced in Sect. 3.1 and is represented by theSolid-State Warburg Impedance (Moss et al., 2008; Keil andJossen, 2012). The second arc at slightly higher frequencies(arc (ii) in Fig. 6) corresponds to the charge transfer kinet-ics. The third and smallest arc near the real axis (arc (iii) in
Adv. Radio Sci., 15, 83–91, 2017 www.adv-radio-sci.net/15/83/2017/
F. Saidani et al.: Lithium-ion battery models: a comparative study and a model-based powerline communication 87
Table 1. Li-ion battery models comparison
Models Accuracy Complexity Physical interpretability Suited application
Physical Very high High High Battery system design stage(> 50 parameters)
+++ – ++
Empirical Medium Low Low Predictions of life time and efficiency(2–3 parameters)
- – –
Abstract Medium Medium to low Limited to acceptable Real-time monitoring and diagnosis(from 2 up to 30)
- + +
Figure 6. Typical EIS response represented as a Nyquist Plot.
Fig. 6) represents the interlayer effects at the solid electrolyteinterface (Keil and Jossen, 2012; Moss et al., 2008).
The intersection with the horizontal axis (Z′′ = 0, point(iv) in Fig. 6) represents the total ohmic resistance of thesystem, including the electrolyte resistance, the contact resis-tance and the electronic contacts. This point generally occursat a frequency in the KHz range but can vary considerablywith the cell design and the used materials (Keil and Jossen,2012).
The highest frequencies show an inductive behavior withZ′′> 0 (tail (v) in Fig. 6) corresponding to the electrodeporous structure and to the battery leads.
The equivalent circuit modeling of the impedance re-sponse is introduced by Moss et al. (2008) as in Fig. 7,wherein Cdl is the electrochemical double layer capacitance,RCT is the faradaic charge transfer resistance, Cint is the in-tercalation capacitance corresponding to the accumulation ofthe Lithium ions within the electrode matrix, and Z(ω) is theWarburg solid-state impedance.
Moss et al. (2008) suggest the substitution of the Warburgdiffusion impedance with a chain of RC elements. The new
Figure 7. A complex equivalent circuit to model the EIS response.
chain does not mirror the impedance of the Warburg elementbut represents an approximation with an acceptable accuracy.Taking this approximation technique into consideration, thepertinence of the general assumption widely used in the lit-erature of modeling Li-ion battery cell as a voltage sourcein series with a resistance Rs and a chain of parallel RC el-ements is verified. This is only possible thanks to Kramers-Kronig relations (Schmidt, 2013), which can be applied onequivalent networks, and which suggest that many differentcircuits can have the same or similar impedance responseswithout having the same topology. In other words, the bat-tery can be modeled using an easier topology with circuitelements which do not have any direct physical interpreta-tion. This model is valid, because it has the same frequencyresponse, and would be easier to parametrize.
The choice of the number of RC elements results in atrade-off between fidelity and complexity (Huria et al., 2012;Moss et al., 2008; Keil and Jossen, 2012). The model canbe extended with a parasitic branch, which is disregarded forcells with high coulombic efficiencies (Huria et al., 2012),and with a look-up table showing the temperature depen-dency of the circuit elements’ values.
3.4 Models comparison and evaluation for hybridelectric vehicle applications
Table 1 presents a comparative overview of the introducedmodels according to the comparison criteria previously ex-plained. As a conclusion, a trade-off between accuracy andmodel complexity should be accepted. Simpler models areless expensive and less susceptible to uncertainties. Com-plex models need more time to solve algorithms for Stateof Charge (SoC) and State of Health (SoH) estimations. De-
www.adv-radio-sci.net/15/83/2017/ Adv. Radio Sci., 15, 83–91, 2017
88 F. Saidani et al.: Lithium-ion battery models: a comparative study and a model-based powerline communication
101 102 103 104 105 106
Freq (Hz)
10-2
10-1
100
101
|Z|(
)
Simulated modelMeasured data
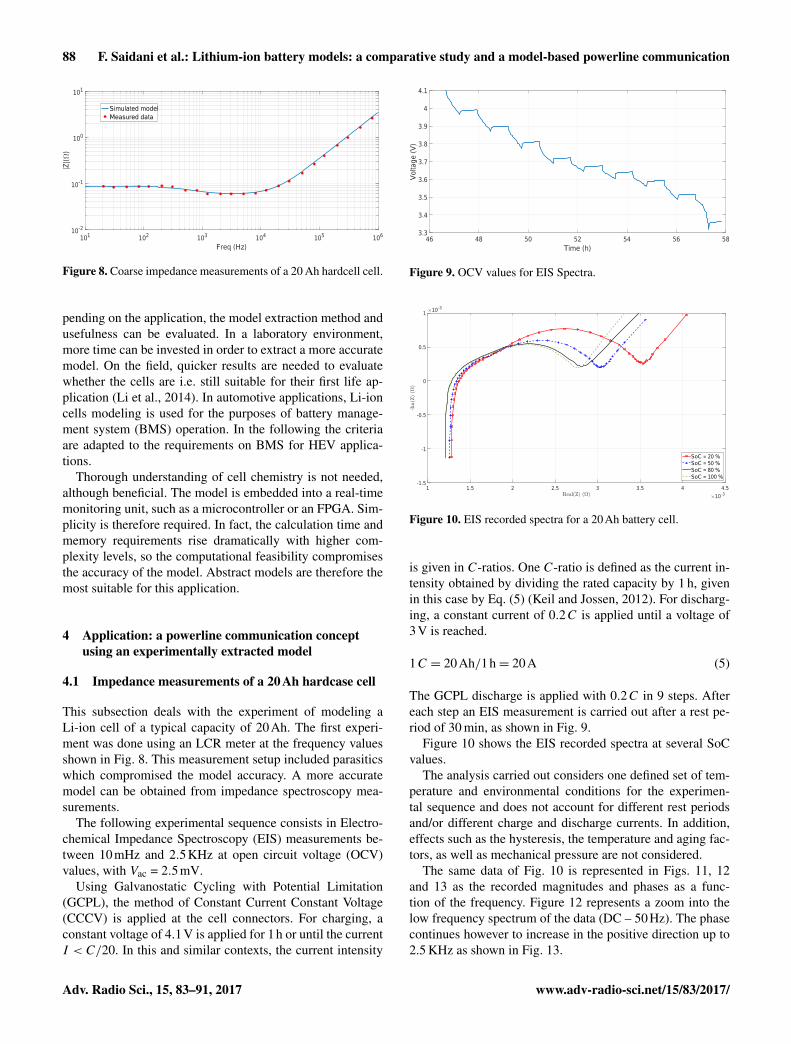
Figure 8. Coarse impedance measurements of a 20 Ah hardcell cell.
pending on the application, the model extraction method andusefulness can be evaluated. In a laboratory environment,more time can be invested in order to extract a more accuratemodel. On the field, quicker results are needed to evaluatewhether the cells are i.e. still suitable for their first life ap-plication (Li et al., 2014). In automotive applications, Li-ioncells modeling is used for the purposes of battery manage-ment system (BMS) operation. In the following the criteriaare adapted to the requirements on BMS for HEV applica-tions.
Thorough understanding of cell chemistry is not needed,although beneficial. The model is embedded into a real-timemonitoring unit, such as a microcontroller or an FPGA. Sim-plicity is therefore required. In fact, the calculation time andmemory requirements rise dramatically with higher com-plexity levels, so the computational feasibility compromisesthe accuracy of the model. Abstract models are therefore themost suitable for this application.
4 Application: a powerline communication conceptusing an experimentally extracted model
4.1 Impedance measurements of a 20Ah hardcase cell
This subsection deals with the experiment of modeling aLi-ion cell of a typical capacity of 20Ah. The first experi-ment was done using an LCR meter at the frequency valuesshown in Fig. 8. This measurement setup included parasiticswhich compromised the model accuracy. A more accuratemodel can be obtained from impedance spectroscopy mea-surements.
The following experimental sequence consists in Electro-chemical Impedance Spectroscopy (EIS) measurements be-tween 10mHz and 2.5KHz at open circuit voltage (OCV)values, with Vac = 2.5mV.
Using Galvanostatic Cycling with Potential Limitation(GCPL), the method of Constant Current Constant Voltage(CCCV) is applied at the cell connectors. For charging, aconstant voltage of 4.1V is applied for 1h or until the currentI < C/20. In this and similar contexts, the current intensity
46 48 50 52 54 56 58Time (h)
3.3
3.4
3.5
3.6
3.7
3.8
3.9
4
4.1
Vol
tage
(V
)
Figure 9. OCV values for EIS Spectra.
10-31 1.5 2 2.5 3 3.5 4 4.5
10-3
-1.5
-1
-0.5
0
0.5
1
SoC = 20 %SoC = 50 %SoC = 80 %SoC = 100 %
Figure 10. EIS recorded spectra for a 20Ah battery cell.
is given in C-ratios. One C-ratio is defined as the current in-tensity obtained by dividing the rated capacity by 1 h, givenin this case by Eq. (5) (Keil and Jossen, 2012). For discharg-ing, a constant current of 0.2C is applied until a voltage of3V is reached.
1C = 20Ah/1h= 20A (5)
The GCPL discharge is applied with 0.2C in 9 steps. Aftereach step an EIS measurement is carried out after a rest pe-riod of 30 min, as shown in Fig. 9.
Figure 10 shows the EIS recorded spectra at several SoCvalues.
The analysis carried out considers one defined set of tem-perature and environmental conditions for the experimen-tal sequence and does not account for different rest periodsand/or different charge and discharge currents. In addition,effects such as the hysteresis, the temperature and aging fac-tors, as well as mechanical pressure are not considered.
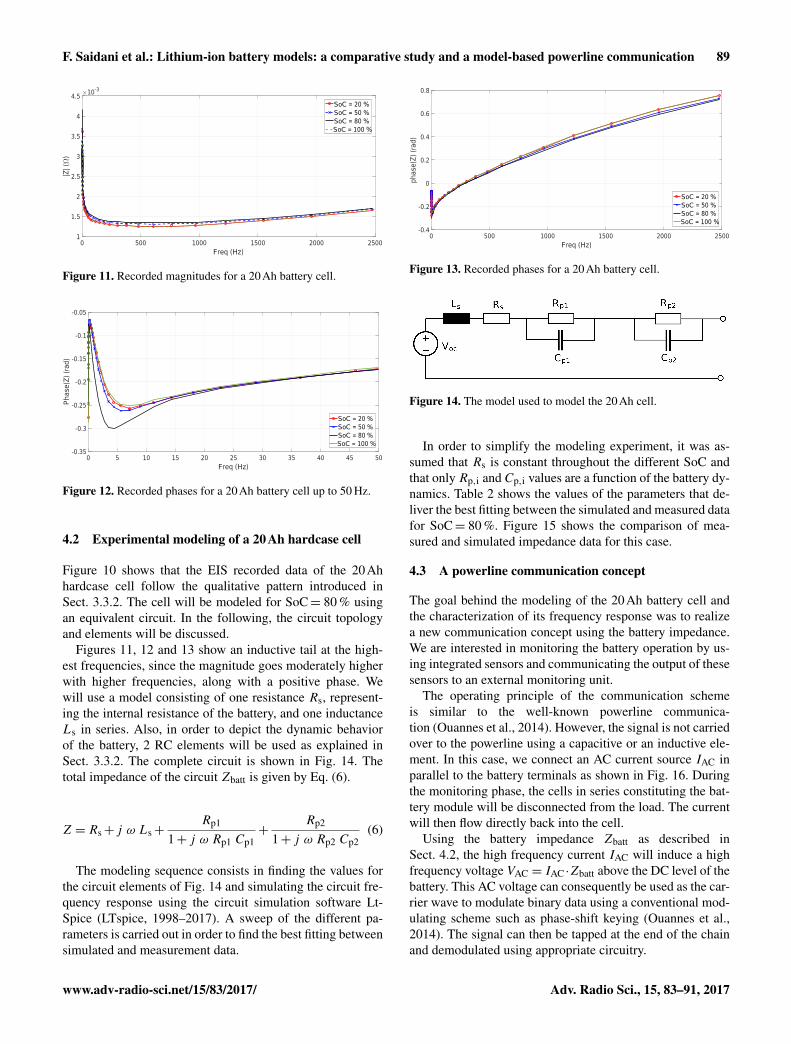
The same data of Fig. 10 is represented in Figs. 11, 12and 13 as the recorded magnitudes and phases as a func-tion of the frequency. Figure 12 represents a zoom into thelow frequency spectrum of the data (DC – 50Hz). The phasecontinues however to increase in the positive direction up to2.5 KHz as shown in Fig. 13.
Adv. Radio Sci., 15, 83–91, 2017 www.adv-radio-sci.net/15/83/2017/
F. Saidani et al.: Lithium-ion battery models: a comparative study and a model-based powerline communication 89
0 500 1000 1500 2000 2500Freq (Hz)
1
1.5
2
2.5
3
3.5
4
4.5
|Z| (
)
10-3
SoC = 20 %SoC = 50 %SoC = 80 %SoC = 100 %
Figure 11. Recorded magnitudes for a 20Ah battery cell.
0 5 10 15 20 25 30 35 40 45 50Freq (Hz)
-0.35
-0.3
-0.25
-0.2
-0.15
-0.1
-0.05
Pha
se(Z
) (r
ad)
SoC = 20 %SoC = 50 %SoC = 80 %SoC = 100 %
Figure 12. Recorded phases for a 20Ah battery cell up to 50 Hz.
4.2 Experimental modeling of a 20Ah hardcase cell
Figure 10 shows that the EIS recorded data of the 20Ahhardcase cell follow the qualitative pattern introduced inSect. 3.3.2. The cell will be modeled for SoC= 80 % usingan equivalent circuit. In the following, the circuit topologyand elements will be discussed.
Figures 11, 12 and 13 show an inductive tail at the high-est frequencies, since the magnitude goes moderately higherwith higher frequencies, along with a positive phase. Wewill use a model consisting of one resistance Rs, represent-ing the internal resistance of the battery, and one inductanceLs in series. Also, in order to depict the dynamic behaviorof the battery, 2 RC elements will be used as explained inSect. 3.3.2. The complete circuit is shown in Fig. 14. Thetotal impedance of the circuit Zbatt is given by Eq. (6).
Z = Rs+j ω Ls+Rp1
1+ j ω Rp1 Cp1+
Rp2
1+ j ω Rp2 Cp2(6)
The modeling sequence consists in finding the values forthe circuit elements of Fig. 14 and simulating the circuit fre-quency response using the circuit simulation software Lt-Spice (LTspice, 1998–2017). A sweep of the different pa-rameters is carried out in order to find the best fitting betweensimulated and measurement data.
0 500 1000 1500 2000 2500Freq (Hz)
-0.4
-0.2
0
0.2
0.4
0.6
0.8
phas
e(Z
) (r
ad)
SoC = 20 %SoC = 50 %SoC = 80 %SoC = 100 %
Figure 13. Recorded phases for a 20Ah battery cell.
Figure 14. The model used to model the 20Ah cell.
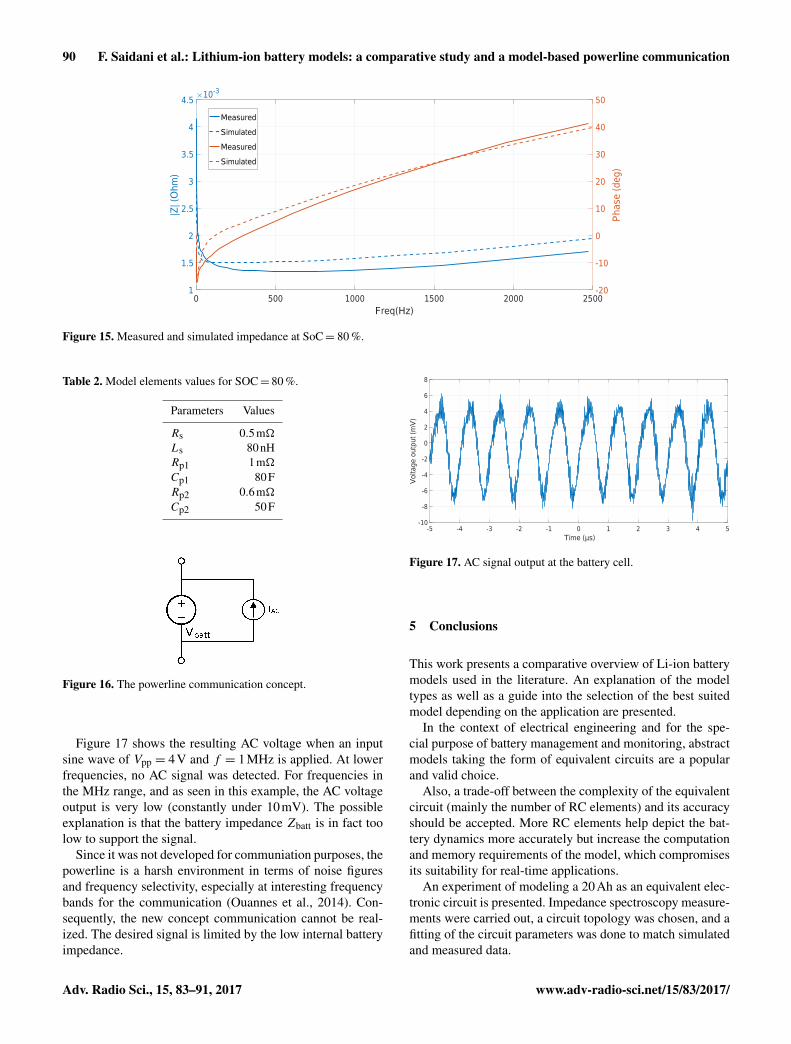
In order to simplify the modeling experiment, it was as-sumed that Rs is constant throughout the different SoC andthat only Rp,i and Cp,i values are a function of the battery dy-namics. Table 2 shows the values of the parameters that de-liver the best fitting between the simulated and measured datafor SoC= 80 %. Figure 15 shows the comparison of mea-sured and simulated impedance data for this case.
4.3 A powerline communication concept
The goal behind the modeling of the 20Ah battery cell andthe characterization of its frequency response was to realizea new communication concept using the battery impedance.We are interested in monitoring the battery operation by us-ing integrated sensors and communicating the output of thesesensors to an external monitoring unit.
The operating principle of the communication schemeis similar to the well-known powerline communica-tion (Ouannes et al., 2014). However, the signal is not carriedover to the powerline using a capacitive or an inductive ele-ment. In this case, we connect an AC current source IAC inparallel to the battery terminals as shown in Fig. 16. Duringthe monitoring phase, the cells in series constituting the bat-tery module will be disconnected from the load. The currentwill then flow directly back into the cell.
Using the battery impedance Zbatt as described inSect. 4.2, the high frequency current IAC will induce a highfrequency voltage VAC = IAC ·Zbatt above the DC level of thebattery. This AC voltage can consequently be used as the car-rier wave to modulate binary data using a conventional mod-ulating scheme such as phase-shift keying (Ouannes et al.,2014). The signal can then be tapped at the end of the chainand demodulated using appropriate circuitry.
www.adv-radio-sci.net/15/83/2017/ Adv. Radio Sci., 15, 83–91, 2017
90 F. Saidani et al.: Lithium-ion battery models: a comparative study and a model-based powerline communication
0 500 1000 1500 2000 2500Freq(Hz)
1
1.5
2
2.5
3
3.5
4
4.5
|Z| (
Ohm
)
10-3
-20
-10
0
10
20
30
40
50
Pha
se (
deg)
Measured
Simulated
Measured
Simulated
Figure 15. Measured and simulated impedance at SoC= 80 %.
Table 2. Model elements values for SOC= 80 %.
Parameters Values
Rs 0.5m�
Ls 80nHRp1 1m�
Cp1 80FRp2 0.6m�
Cp2 50F
Figure 16. The powerline communication concept.
Figure 17 shows the resulting AC voltage when an inputsine wave of Vpp = 4V and f = 1MHz is applied. At lowerfrequencies, no AC signal was detected. For frequencies inthe MHz range, and as seen in this example, the AC voltageoutput is very low (constantly under 10mV). The possibleexplanation is that the battery impedance Zbatt is in fact toolow to support the signal.
Since it was not developed for communiation purposes, thepowerline is a harsh environment in terms of noise figuresand frequency selectivity, especially at interesting frequencybands for the communication (Ouannes et al., 2014). Con-sequently, the new concept communication cannot be real-ized. The desired signal is limited by the low internal batteryimpedance.
-5 -4 -3 -2 -1 0 1 2 3 4 5Time (µs)
-10
-8
-6
-4
-2
0
2
4
6
8
Vol
tage
out
put (
mV
)
Figure 17. AC signal output at the battery cell.
5 Conclusions
This work presents a comparative overview of Li-ion batterymodels used in the literature. An explanation of the modeltypes as well as a guide into the selection of the best suitedmodel depending on the application are presented.
In the context of electrical engineering and for the spe-cial purpose of battery management and monitoring, abstractmodels taking the form of equivalent circuits are a popularand valid choice.
Also, a trade-off between the complexity of the equivalentcircuit (mainly the number of RC elements) and its accuracyshould be accepted. More RC elements help depict the bat-tery dynamics more accurately but increase the computationand memory requirements of the model, which compromisesits suitability for real-time applications.
An experiment of modeling a 20Ah as an equivalent elec-tronic circuit is presented. Impedance spectroscopy measure-ments were carried out, a circuit topology was chosen, and afitting of the circuit parameters was done to match simulatedand measured data.
Adv. Radio Sci., 15, 83–91, 2017 www.adv-radio-sci.net/15/83/2017/

F. Saidani et al.: Lithium-ion battery models: a comparative study and a model-based powerline communication 91
Finally, a new powerline communication concept is in-troduced. The new concept requires the availability of animpedance with a sufficiently high inductive component.However, the total impedance of the battery was found tobe too low to deliver the desired AC signal.
Data availability. The data used in this paper, unless cited or oth-erwise referred to, are measurements/simulations conducted in lab-oratory environments in one the institutes listed in the affiliations ofthe authors. This data is not available online.
Competing interests. The authors declare that they have no conflictof interest.
Acknowledgements. This work has been conducted within thescope of the project Smart-LiB: Intelligente Li-Ionen-Batterienin der Fertigung und Anwendung. The authors gratefully ac-knowledge the financial support of Ministerium für FinanzenBaden-Württemberg (MFW-BW). The authors would also like tothank T. Zaki for setting the first bricks of the modeling experimentsand M. Nawito for helping with the analysis of the EIS data.
Edited by: J. AndersReviewed by: two anonymous referees
References
Erdinc, O., Vural, B., and Uzunoglu, M.: A dynamic lithium-ionbattery model considering the effects of temperature and capac-ity fading, in: 2009 International Conference on Clean ElectricalPower, 383–386, 2009.
Hu, X., Li, S., and Peng, H.: A comparative study of equivalentcircuit models for Li-ion batteries, J. Power Sources, 198, 359–367, 2012.
Huria, T., Ceraolo, M., Gazzarri, J., and Jackey, R.: High fidelityelectrical model with thermal dependence for characterizationand simulation of high power lithium battery cells, in: 2012 IEEEInternational Electric Vehicle Conference, 1–8, 2012.
Jiani, D., Zhitao, L., Youyi, W., and Changyun, W.: A fuzzy logic-based model for Li-ion battery with SOC and temperature effect,in: 11th IEEE International Conference on Control Automation(ICCA), 1333–1338, 2014.
Keil, P. and Jossen, A.: Aufbau und Parametrierung vonBatteriemodellen, in: 19. DESIGN und ELEKTRONIK-Entwicklerforum, Batterien und Ladekonzepte, 2012.
Li, X., Wang, T., Pei, L., Zhu, C., and Xu, B.: A comparativestudy of sorting methods for Lithium-ion batteries, in: 2014 IEEEConference and Expo Transportation Electrification Asia-Pacific(ITEC Asia-Pacific), 1–6, 2014.
LTspice: XVII, Linear Technology, US Pacific, 1998–2017.Moss, P. L., Au, G., Plichta, E. J., and Zheng, J. P.: An Electri-
cal Circuit for Modeling the Dynamic Response of Li-Ion Poly-mer Batteries, Journal of Electrochemical Society 155 , Nr. 12,A986–A994, 2008.
Ouannes, I., Nickel, P., and Dostert, K.: Cell-wise monitoring ofLithium-ion batteries for automotive traction applications byusing power line communication: battery modeling and chan-nel characterization, in: 18th IEEE International Symposium onPower Line Communications and Its Applications, 24–29, 2014.
Rahimzei, E., Sann, K., and Moritz, V.: Kompendium: Li-Ionen-Batterien, Grundlagen, Bewertungskriterien, Gesetze und Nor-men, im BMWi Förderprogramm IKT für Elektromobilität II:Smart Car – Smart Grid – Smart Traffic, 2012.
Rahmoun, A. and Biechl, H.: Modelling of Li-ion batteries us-ing equivalent circuit diagrams, Przeglad Elektrotechniczny, 88,152–156, 2012.
Rao, R., Vrudhula, S., and Rakhmatov, D. N.: Battery Modeling forEnergy-Aware System Design, Computer, 36, 77–87, 2003.
Schmidt, J. P.: Verfahren zur Charakterisierung und Modellierungvon Lithium-Ionen Zellen, vol. 25 of Schriften des Instituts fürWerkstoffe der Elektrotechnik, Karlsruher Institut für Technolo-gie, KIT Scientific Publishing, Karlsruhe, 2013.
Smith, K. A., Rahn, C. D., and Wang, C.-Y.: Control oriented 1Delectrochemical model of lithium ion battery, Energ. Convers.Manage., 48, 2565–2578, 2007.
Van Noorden, R.: The rechargeable revolution: A better battery, Na-ture, 507, 26–28, 2014.
Verbrugge, M. W., Koch, B. J., and Schneider, E. W.: Mass Trans-port in Lithium-battery Solvents, J. Appl. Electrochem., 30, 269–275, https://doi.org/10.1023/A:1003984511421, 2000.
von Srbik, M.-T., Marinescu, M., Martinez-Botas, R. F., and Of-fera, G. J.: A physically meaningful equivalent circuit net-work model of a lithium-ion battery accounting for local elec-trochemical and thermal behaviour, variable double layer ca-pacitance and degradation, 325, 171–184, J. Power Sources,https://doi.org/10.1016/j.jpowsour.2016.05.051, 2016.
Worthman, E.: Recharging the Battery, Semicon-ductor Engineering, http://semiengineering.com/evolving-lithium-battery-technology/ (last access: 25 April2017), 2015.
Wu, T., Wang, M., Xiao, Q., and Wang, X.: The SOC Estimation ofPower Li-Ion Battery Based on ANFIS Model, Smart Grid andRenewable Energy, 3, 51–55, 2012.
Yu, J.: State-of-Health Monitoring and Prediction of Lithium-IonBattery Using Probabilistic Indication and State-Space Model,IEEE T. Instrum. Meas., 64, 2937–2949, 2015.
www.adv-radio-sci.net/15/83/2017/ Adv. Radio Sci., 15, 83–91, 2017