Embed Size (px)
Citation preview

Page 1/16
A Meta-analysis Study of Association Between FecB Polymorphism andLitter Size in SheepArsalan Barazandeh ( [email protected] )
University of Jiroft https://orcid.org/0000-0001-7716-7624Morteza Mokhtari
University of JiroftZahra Roudbari
University of JiroftRouhollah Mirmahmoudi
University of Jiroft
Research Article
Keywords: MAS, reproduction, fecundity genes, Association, Ovis aries
Posted Date: November 29th, 2021
DOI: https://doi.org/10.21203/rs.3.rs-1092365/v1
License: This work is licensed under a Creative Commons Attribution 4.0 International License. Read Full License

Page 2/16
AbstractLitter size is perhaps the main commercial trait since it has an observable effect on bene�t in the sheep industry. Fecundity genes, play a vital role inexpression of litter size. One of the most popular of these genes is the Booroola gene (FecB). In many past researches there was a dependencybetween the BMPR1B gene polymorphism and litter size of sheep. In the current study, a meta-analysis directed by coalescing outcoming of 9902cases of 26 published research wherein various breeds of sheep to assess the in�uence of the FecB gene on litter size utilizing additive, recessive,dominant, and co-dominant genetic models. The random effects model was used for data analysis according to the Cochran Q test and I2 quantity.Under additive (SMD = 0.528), dominant (SMD = 0.468) and recessive (SMD = 0.250) models, the signi�cant effect (P<0.01) of FecB genotypes hasbeen identi�ed. Furthermore, under the co-dominant (SMD = -0.050, P = 0.3332) model, the association between FecB genotypes and litter size traithad not been detected. A growth in litter size by about 0.47 lambs (Dominant model) was associated with the �rst copy of the FecB gene and 0.25lambs (Recessive model) with the second copy of this gene. Consequences of the current study support the idea that BMPR1B fundamentallyin�uenced litter size and subsequently it may be utilized for Marker-assisted selection programmers for improved genetic merit of reproductivefutures and furthermore insert this gene by crossbreeding in low proli�c breeds may improve reproductive characteristics.
IntroductionSheep farming is incompetent and unpro�table due to low e�ciency. One of the best ways to improve this situation is the improvement of thefecundity and fertility of sheep via selective practices (Li et al., 2021). One of the fundamental reproductive traits in sheep is litter size that isaffected by many unknown factors. Because of low heritability of this trait, traditional breeding strategies have been useless to increase it rapidly(Mahdavi et al., 2014; Wang et al., 2015). Consequently, researchers hold sought to seek a number of variants of candidate genes act on litter sizethat should stand helpful for marker-assisted selection (MAS) and molecular genetics techniques. Findings demonstrated that a range of differentgenes, commonly termed fecundity (Fec) genes, play an important roleon litter size. One of the most popular of these genes is Bone morphogeneticprotein receptor type IB (BMPR1B) which is famous as activin-like Kinase 6 or FecB or Booroola gene (Wilson et al. 2001, Chu et al. 2011, Plakkot etal. 2020).
Booroola gene is the member of the transforming growth factor (TGF) β super-family, which is mapped at the FecB locus existing among theOsteopontin (OPN) and epidermal growth factor (EGF) genes on chromosome 6 including a coding sequence of 1509 bp, component of ten exonsas code for 502 amino acids (Singh et al., 2020). A transition of adenine to guanine at the nucleotide site 746, result in the substitution of glutamineamino acid to arginine amino acid at location 249 (Q249R) for mutant types (Mulsant et al., 2001; Potki et al., 2020). This mutation in Fec B allele isassociated with the additive effect on ovulation rate and litter size in Booroola Merino sheep (Souza et al., 2001; Davis et al., 2002; Guan, S.-R. Liu, etal., 2007; Fogarty, 2009)Considering the importance of this gene, many researchers started out to screen other proli�c sheep breeds to identify it. TheBMPR1B mutation has been found for example in Garole and Javanese (Davis et al., 2002; Davis, 2005), Hu and Small Tail Han (Hua and Yang,2009), Kendrapada (Kumar et al., 2008) and Kalehkoohi (Mahdavi et al., 2014). However nearly all researches there was a dependency between theFecB gene polymorphism and litter size (Yang et al. 2010, Chu et al. 2011, Debnath and Singh 2014, Wang et al. 2018), but in some studies, thisassociation was not signi�cant (Hua et al., 2008; Tian et al., 2009; Hernandez H et al., 2019)A meta-analysis including random effects may clear upthe heterogeneity between the studies (Dawson et al., 2016; Delphino et al., 2021a). Meta-analysis is a helpful methodology for incorporating ofresults revealed in various researches and to give enormous informational data to survey by pooling the consequences of these investigations. Inlike manner, by leading meta-analysis, there can be remuneration for a small sample size of single researches through expanding the statisticalsensitivity and accuracy of assessments (Sutton et al., 2000; Hunter and Schmidt, 2004; Mahmoudi et al., 2019; Delphino et al., 2021a).
A meta-analysis of the in�uences of the FecB gene polymorphism on sheep litter size (Chong et al., 2019) utilized just Chinese sheep breeds, andcontrasted only FecB genotypes to evaluate appropriately the relationship between litter size and FecB polymorphism. Therefore, the current studyintended to do a meta-analysis of relationships of litter size and FecB polymorphism in sheep with four distinct genetic models including theadditive, dominant, co-dominant and recessive.
Materials And Methods
Searching strategy and screening criteria for literature reviewCriteria from the Preferred Reporting Items for Systematic Reviews and Meta-Analysis (PRISMA) checklist were used to pick quali�ed documents forthe meta-analysis (Moher et al., 2009).
In order to locate all related research studies in distinct languages, a systematic literature search was performed for electronic databases andpublications (PubMed, Science Direct, Springer, Web of Science, Google Scholar, Wiley Online Library, CNKI, Magiran and sid). The following searchterms were combined to identify appropriate studies: 'BMPR1B','BMPR-1B', ' Bone morphogenetic protein receptor 1B', 'ALK6', 'activin receptor-likekinase 6', 'fecundity' ,'FecB', 'Booroola', 'Gene polymorphism', 'association', 'sheep', ' reproductive traits', 'litter size' and 'proli�cacy', As well, to classifyeligible studies that may not have been found in the searching processes, reference lists of the documents were thoroughly investigated.
Page 3/16
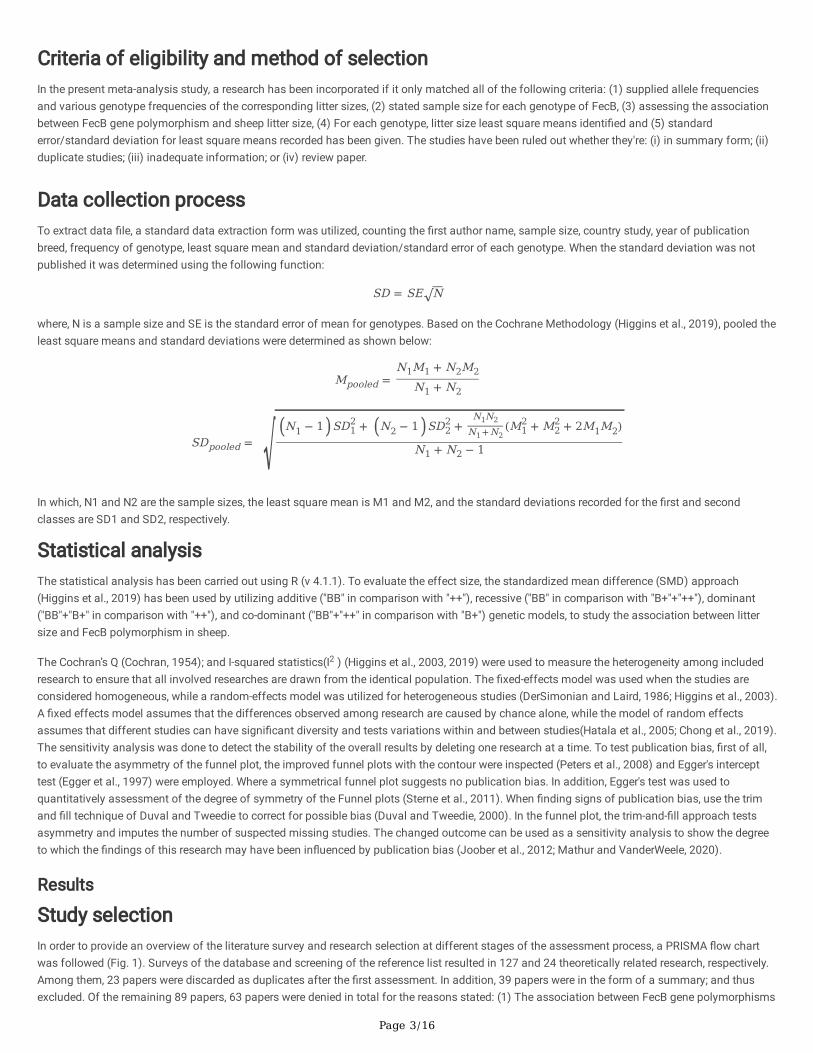
Criteria of eligibility and method of selectionIn the present meta-analysis study, a research has been incorporated if it only matched all of the following criteria: (1) supplied allele frequenciesand various genotype frequencies of the corresponding litter sizes, (2) stated sample size for each genotype of FecB, (3) assessing the associationbetween FecB gene polymorphism and sheep litter size, (4) For each genotype, litter size least square means identi�ed and (5) standarderror/standard deviation for least square means recorded has been given. The studies have been ruled out whether they're: (i) in summary form; (ii)duplicate studies; (iii) inadequate information; or (iv) review paper.
Data collection processTo extract data �le, a standard data extraction form was utilized, counting the �rst author name, sample size, country study, year of publicationbreed, frequency of genotype, least square mean and standard deviation/standard error of each genotype. When the standard deviation was notpublished it was determined using the following function:
SD = SE√N
where, N is a sample size and SE is the standard error of mean for genotypes. Based on the Cochrane Methodology (Higgins et al., 2019), pooled theleast square means and standard deviations were determined as shown below:
Mpooled =N1M1 + N2M2
N1 + N2
SDpooled =N1 − 1 SD2
1 + N2 − 1 SD22 +
N1N2N1+N2
(M21 + M2
2 + 2M1M2)
N1 + N2 − 1
In which, N1 and N2 are the sample sizes, the least square mean is M1 and M2, and the standard deviations recorded for the �rst and secondclasses are SD1 and SD2, respectively.
Statistical analysisThe statistical analysis has been carried out using R (v 4.1.1). To evaluate the effect size, the standardized mean difference (SMD) approach(Higgins et al., 2019) has been used by utilizing additive ("BB" in comparison with "++"), recessive ("BB" in comparison with "B+"+"++"), dominant("BB"+"B+" in comparison with "++"), and co-dominant ("BB"+"++" in comparison with "B+") genetic models, to study the association between littersize and FecB polymorphism in sheep.
The Cochran’s Q (Cochran, 1954); and I-squared statistics(I2 ) (Higgins et al., 2003, 2019) were used to measure the heterogeneity among includedresearch to ensure that all involved researches are drawn from the identical population. The �xed-effects model was used when the studies areconsidered homogeneous, while a random-effects model was utilized for heterogeneous studies (DerSimonian and Laird, 1986; Higgins et al., 2003).A �xed effects model assumes that the differences observed among research are caused by chance alone, while the model of random effectsassumes that different studies can have signi�cant diversity and tests variations within and between studies(Hatala et al., 2005; Chong et al., 2019).The sensitivity analysis was done to detect the stability of the overall results by deleting one research at a time. To test publication bias, �rst of all,to evaluate the asymmetry of the funnel plot, the improved funnel plots with the contour were inspected (Peters et al., 2008) and Egger's intercepttest (Egger et al., 1997) were employed. Where a symmetrical funnel plot suggests no publication bias. In addition, Egger's test was used toquantitatively assessment of the degree of symmetry of the Funnel plots (Sterne et al., 2011). When �nding signs of publication bias, use the trimand �ll technique of Duval and Tweedie to correct for possible bias (Duval and Tweedie, 2000). In the funnel plot, the trim-and-�ll approach testsasymmetry and imputes the number of suspected missing studies. The changed outcome can be used as a sensitivity analysis to show the degreeto which the �ndings of this research may have been in�uenced by publication bias (Joober et al., 2012; Mathur and VanderWeele, 2020).
Results
Study selectionIn order to provide an overview of the literature survey and research selection at different stages of the assessment process, a PRISMA �ow chartwas followed (Fig. 1). Surveys of the database and screening of the reference list resulted in 127 and 24 theoretically related research, respectively.Among them, 23 papers were discarded as duplicates after the �rst assessment. In addition, 39 papers were in the form of a summary; and thusexcluded. Of the remaining 89 papers, 63 papers were denied in total for the reasons stated: (1) The association between FecB gene polymorphisms
√ ( ) ( )

Page 4/16
and the litter size trait was not investigated. (2) Su�cient data such as genotype frequencies, standard deviation and appropriate mutation were notprovided; and (3) Concentrated on other traits, not litter size. Finally, 26 articles with 9902 sheep were chosen to be used in the meta-analysis. Therewere inquiries of more than one sheep breed in six papers thus each breed was considered as a separate research. Table 1 contains the attributes ofthe chosen research.
Heterogeneity assessment between studiesTable 2 summarizes the results of the application of Cochran's Q heterogeneity test and I-squared statistics (I2) through every genetic model. Resultsusing the Cochran Q test showed that inall model (Additive, Dominant, Codominant and recessive) P values were less than 0.005. The estimated I2
was also greater than 45% for all the considered models, Therefor the random effects model was applied to study the relationship of FecBpolymorphism and sheep litter size (Higgins et al., 2019).
Analysis of sensitivity and assessment of publication biasEvidence of data distribution asymmetry was shown by visual inspection of funnel plots in additive and recessive models (Fig. 2). This was veri�edby a substantial Egger intercept test (Table 4). Also, in contrast, in the dominant and codominant genetic models, intercept of Egger's test (Table 4)and funnel plots (Fig. 2) showed no signi�cant and no evidence of publication bias, respectively. The trim-and-�ll method was used (Duval andTweedie, 2000) to adjust the estimates for possible publication bias in additive and recessive models. For the additive model, nine missing studieswere assigned through the trim and �ll technique and the mean effect size was corrected from SMD=0.767 to SMD=0.528. Furthermore, 10 missingstudies for recessive model were imputed and modi�ed mean effect size from SMD=0.373 to SMD=0.250.
Meta-analysis of the relationship of the FecB polymorphism and litter size of sheepTable 3 and Figs. 3 to 6 illustrate the �ndings for the association between the FecB gene and the interest trait using the four genetic models. Underadditive (SMD = 0.528, P< 0.0001), dominant (SMD = 0.468, P < 0.0001) and recessive (SMD = 0.250, P= 0.0011) models, the signi�cant effect ofFecB genotypes has been identi�ed. Furthermore, under the co-dominant (SMD = -0.050, P = 0.3332) model, the association among FecB genotypesand litter size trait had not been detected.
DiscussionThe in�uence of single nucleotide polymorphisms in the FecB gene on sheep litter size has been an important �eld of study, since it is an excellentgene. In the FecB coding sequence, a missense substitution (Q249R) is associated with the Booroola phenotype of comparatively greater proli�cacy.While there has been an association between polymorphism in FecB and sheep litter size in most studies, there are still some research where thisassociation has not been identi�ed. These contradictory �ndings suggest that if a meta-analysis was done, there might be a clearer sense of anSNP-litter size association, which might be a helpful tool for evaluating whether FecB gene polymorphism was correlated with sheep litter size.
A total of 9902 cases wherein various breeds of sheep have been used to assess the in�uence of the FecB gene on sheep litter size. The �ndings ofthe genetic models of additive, dominant and recessive have been shown to have a positive relationship between the interest of FecB gene and littersize (Figs. 3-5.). Furthermore, by using the co-dominant model, there has been no association of FecB polymorphism with sheep litter size (Fig. 6).
There had been a disparity among animals with the 'BB', 'BB' and/or 'B+' genotypes as well as those with genotypes of '++', 'B+' and/or '++' in littersize (p<0.01). In addition, with using the co-dominant model for study, there was no distinction between the B+ genotype and 'BB and/or ++'genotypes (p>0.05). The �ndings suggested that a growth in litter size by about 0.47 lambs (Dominant model) was associated with the �rst copy ofthe FecB gene and 0.25 lambs (Recessive model) with the second copy of this gene, that in several sheep breeds have been consistently excellent(Fig. 4-5). These observations are in accordance with the �nding of several published pieces of research which have shown that it has a substantialimpact on the litter size (Chu et al. 2011, Debnath and Singh 2014, Mahdavi et al. 2014, Chen et al. 2015). In general, the in�uence of the secondcopy of the feb gene on the Poll Dorset sheep (Jia et al., 2005), Merino sheep (Zhu et al., 2006) and Duolang sheep gene has been further increased(Wang and Maimaitiyiming, 2011). The sample size of BB genotypes for these three breeds was so small, which may be the explanation for thisoccurrence. Chong et al. (2019) studied the in�uence of FecB polymorphism on Chinese sheep litter size by meta- analysis. They indicated that eachgene copy causes a growth in litter size of 0.4 to 0.5 lambs. The �ndings of this research were consistent with the results of their study. The resultsof the current meta-analysis were consistent with Fogarty (2009) conclusions that the FecB gene increases the litter size, but he stated that with the�rst copy of this gene the litter size increased by 0.7. The �nding of the study can be clari�ed in particular, assuming that the FecB gene is not theonly factor that controls the litter size, it includes many other factors, such as correlative functional genes, maternal inputs and environmentaleffects (Davis et al., 2006; Chen et al., 2015). Also, the �ndings of the current meta-analysis study suggest that certain other sheep breedingmolecular markers, including the BMP15, GDF9 genes and others, will also have to be assessed.

Page 5/16
Current meta-analysis varies in a variety of respects from the previous meta-analysis conducted by Chong et al. ( 2019):(i) In their research, theyincluded only Chinese sheep breeds, but this is not the case in the present study; (ii) To perform the studies, four distinct genetic models were used,including the additive, dominant, co-dominant and recessive models, but Chong et al. contrasted only FecB genotypes to evaluate appropriately theassociations between FecB polymorphism and litter size; (iii) 26 qualifying studies were included in this current study to evaluate litter size data,while the number of studies used by Chong et al. was 21; (iv) For this meta-analysis, 9902 sheep records have been used, which is higher than thenumbers used with 5089 by Chong et al. Such data may be conclusive proof that the latest meta-analysis has much greater predictive strength andprovides more accurate results.
In addition, the current meta-analysis has several strengths: (i) all studies published in different language in the meta-analysis literature have beenused; (ii) sensitivity analysis has been carried out by eliminating one study at a time to assess the consistency of the outcomes obtained;(iii) Toaccurately investigate the relationship among the FecB polymorphism and sheep litter size, four distinct genetic models containing additive,dominant, co-dominant and recessive models were used; and (iv) In order to perform the meta-analysis, have pooled a big dataset with 9902 records,which may result in more reliable results than small sample sizes.
The current meta-analysis study, however, may have some restrictions: (i) moderate to high research heterogeneity was observed under the utilizedgenetic models; (ii) The sample sizes of several studies involved were not su�ciently large; (iii) Only the in�uence of genetic factors on sheep littersize has been investigated, though litter size is a complex trait. Precautions should be taken for these considerations when interpreting the �ndingsof this meta-analysis.
In conclusion, consequences of the current review support the idea that BMPR-IB fundamentally in�uenced litter size and was related to litter size insheep and subsequently it may be utilized adequately for marker-assisted selection programmers for improving genetic merit of reproductive traitsand furthermore introgression of this gene by crossbreeding in low proli�c breeds can improve reproductive performance in sheep breeds.
DeclarationsFunding
The authors declare that no funds, grants, or other support were received during the preparation of this manuscript.
Competing Interests
The authors declare that the research was conducted in the absence of any commercial or �nancial relationships that could be construed as apotential con�ict of interest.
Author Contributions
All authors contributed to the study conception and design. All authors contributed to Material preparation and data collection. Data Analysis wasperformed by A. Barazandeh. The �rst draft of the manuscript was written by A. Barazandeh and all authors commented on previous versions of themanuscript. All authors read and approved the �nal manuscript.
Data Availability
Not Applicable
Ethics approval
This is an observational study. The XYZ Research Ethics Committee has con�rmed that no ethical approval is required.
References1. Chen, X., Sun, H., Tian, S., Xiang, H., Zhou, L., Dun, W. and Zhao, X., 2015. Increasing litter size in a sheep breed by marker-assisted selection of
BMPR1B A746G mutation Journal of Genetics, 94, 139–142
2. Chong, Y., Liu, G. and Jiang, X., 2019. Effect of BMPRIB gene on litter size of sheep in China: A meta-analysis Animal Reproduction Science, 210,106175 (Elsevier)
3. Chu, M., Jia, L., Zhang, Y., Jin, M., Chen, H., Fang, L., Di, R., Cao, G., Feng, T., Tang, Q., Ma, Y. and Li, K., 2011. Polymorphisms of coding region ofBMPR-IB gene and their relationship with litter size in sheep Molecular Biology Reports, 38, 4071–4076
4. Chu, M.X., Liu, Z.H., Jiao, C.L., He, Y.Q., Fang, L., Ye, S.C., Chen, G.H. and Wang, J.Y., 2007. Mutations in BMPR-IB and BMP-15 genes areassociated with litter size in Small Tailed Han sheep (Ovis aries) Journal of Animal Science, 85, 598–603
5. Davis, G.H., 2005. Major genes affecting ovulation rate in sheep Genetics Selection Evolution, 37, S11–S23 (EDP Sciences)

Page 6/16
�. Davis, G.H., Balakrishnan, L., Ross, I.K., Wilson, T., Galloway, S.M., Lumsden, B.M., Hanrahan, J.P., Mullen, M., Mao, X.Z., Wang, G.L., Zhao, Z.S.,Zeng, Y.Q., Robinson, J.J., Mavrogenis, A.P., Papachristoforou, C., Peter, C., Baumung, R., Cardyn, P., Boujenane, I., Cockett, N.E., Eythorsdottir, E.,Arranz, J.J. and Notter, D.R., 2006. Investigation of the Booroola (FecB) and Inverdale (FecXI) mutations in 21 proli�c breeds and strains ofsheep sampled in 13 countries Animal Reproduction Science, 92, 87–96
7. Davis, G.H., Galloway, S.M., Ross, I.K., Gregan, S.M., Ward, J., Nimbkar, B. V., Ghalsasi, P.M., Nimbkar, C., Gray, G.D., Subandriyo, Inounu, I.,Tiesnamurti, B., Martyniuk, E., Eythorsdottir, E., Mulsant, P., Lecerf, F., Hanrahan, J.P., Bradford, G.E. and Wilson, T., 2002. DNA tests in proli�csheep from eight countries provide new evidence on origin of the Booroola (FecB) mutation Biology of Reproduction, 66, 1869–1874
�. Dawson, D. V, Pihlstrom, B.L. and Blanchette, D.R., 2016. Understanding and evaluating meta-analysis The Journal of the American DentalAssociation, 147, 264–270 (Elsevier)
9. Debnath, J. and Singh, R.V., 2014. Genetic polymorphism of boorola FecB gene and its association with litter size in balangir, shahabadi andbonpala sheep breeds Indian Journal of Animal Research, 48, 307–314
10. Delphino, B., Breno, V., Fernando, L. and Pinto, B., 2021a. Meta-analysis of genetic parameters for economic traits in buffaloes LivestockScience, 251, 104614 (Elsevier B.V.)
11. Delphino, B., Breno, V., Fernando, L. and Pinto, B., 2021b. Meta-analysis of genetic parameters for economic traits in sheep Livestock Science,247, 104477 (Elsevier B.V.)
12. DerSimonian, R. and Laird, N., 1986. Meta-analysis in clinical trials Controlled clinical trials, 7, 177–188 (Elsevier)
13. Duval, S. and Tweedie, R., 2000. Trim and �ll: a simple funnel‐plot–based method of testing and adjusting for publication bias in meta‐analysisBiometrics, 56, 455–463 (Wiley Online Library)
14. Egger, M., Smith, G.D., Schneider, M. and Minder, C., 1997. Bias in meta-analysis detected by a simple, graphical test Bmj, 315, 629–634 (BritishMedical Journal Publishing Group)
15. Fang, D., Wu, J., Xu, J., Luo, Y., Zhang, L., Wang, L., Yang, L. and Lei, Z., 2010. Research on application effect in breeding of molecular marker insheep BMPR-IB gene. Xinjiang Agricultural Sciences, 47, 189–194 (In Chinese)
1�. Fogarty, N.M., 2009. A review of the effects of the Booroola gene (FecB) on sheep production Small Ruminant Research, 85, 75–84
17. Guan, F., Liu, S.-R., Shi, G.-Q. and Yang, L.-G., 2007. Polymorphism of FecB gene in nine sheep breeds or strains and its effects on litter size, lambgrowth and development Animal Reproduction Science, 99, 44–52 (Elsevier)
1�. Guan, F., Liu, S.R., Shi, G.Q. and Yang, L.G., 2007. Polymorphism of FecB gene in nine sheep breeds or strains and its effects on litter size, lambgrowth and development Animal Reproduction Science, 99, 44–52
19. Hatala, R., Keitz, S., Wyer, P. and Guyatt, G., 2005. Tips for learners of evidence-based medicine: 4. Assessing heterogeneity of primary studies insystematic reviews and whether to combine their results Cmaj, 172, 661–665
20. Hernandez H, D., Montes V, D. and De la Ossa V, J., 2019. Association of the FecB polymorphism with the natural proli�cacy of the ColombianHair Sheep Revista MVZ Córdoba, 25, 1–6
21. Higgins, J.P.T., Thomas, J., Chandler, J., Cumpston, M., Li, T., Page, M.J. and Welch, V.A., 2019. Cochrane handbook for systematic reviews ofinterventions, (John Wiley & Sons)
22. Higgins, J.P.T., Thompson, S.G., Deeks, J.J. and Altman, D.G., 2003. Measuring inconsistency in meta-analyses Bmj, 327, 557–560 (BritishMedical Journal Publishing Group)
23. Hua, G.-H. and Yang, L.-G., 2009. A review of research progress of FecB gene in Chinese breeds of sheep Animal reproduction science, 116, 1–9(Elsevier)
24. Hua, G.H., Chen, S.L., Ai, J.T. and Yang, L.G., 2008. None of polymorphism of ovine fecundity major genes FecB and FecX was tested in goatAnimal Reproduction Science, 108, 279–286
25. Hunter, J.E. and Schmidt, F.L., 2004. Methods of meta-analysis: Correcting error and bias in research �ndings, (Sage)
2�. Jia, C., Li, N., Zhao, X., Zhu, X. and Jia, Z., 2005. Association of single nucleotide polymorphisms in exon 6 region of BMPRIB gene with litter sizetraits in sheep Asian-Australasian Journal of Animal Sciences, 18, 1375–1378
27. Joober, R., Schmitz, N., Annable, L. and Boksa, P., 2012. Publication bias: what are the challenges and can they be overcome? Journal ofpsychiatry & neuroscience: JPN, 37, 149 (Canadian Medical Association)
2�. Kang, X.L., Liu, J.L., Liu, Y.Q., Wang, S.Y. and Feng, D.Z., 2017. Association between BMPR-IB polymorphism and litter size in two sheep groups.Acta Agriculturae Boreali-Occidentalis Sinica, 26, 497–502 (In Chinese)
29. Kumar, S., Mishra, A.K., Kolte, A.P., Dash, S.K. and Karim, S.A., 2008. Screening for Booroola (FecB) and Galway (FecXG) mutations in Indiansheep Small Ruminant Research, 80, 57–61
30. Li, D., Sun, W., Ni, R., Zhang, X.N., Zhang, Y.L., Chu, M.X., Zhang, Y.F., Shen, G.Z., Chen, L. and Wu, W.Z., 2012. Genetic diversity of FecB gene andassociation analysis of its litter size Journal of veterinary Medicine and Animal Sciences, 31, 1–5
31. Li, H., Xu, H., Akhatayeva, Z., Liu, H., Lin, C., Han, X., Lu, X., Lan, X., Zhang, Q. and Pan, C., 2021. Novel indel variations of the sheep FecB geneand their effects on litter size Gene, 767, 145176

Page 7/16
32. Mahdavi, M., Nanekarani, S. and Hosseini, S.D., 2014. Mutation in BMPR-IB gene is associated with litter size in Iranian Kalehkoohi sheepAnimal Reproduction Science, 147, 93–98
33. Mahmoudi, P., Rashidi, A., Rostamzadeh, J. and Razmkabir, M., 2019. Association between c . 1189G > A single nucleotide polymorphism ofGDF9 gene and litter size in goats : A meta-analysis Animal Reproduction Science, 209, 106140
34. Maskur, M., Tapaul, R. and Kasip, L., 2016. Genetic polymorphism of bone morphogenetic protein receptor 1B (BMPR-1B) gene and itsassociation with litter size in Indonesian fat-tailed sheep African Journal of Biotechnology, 15, 1315–1319
35. Mathur, M.B. and VanderWeele, T.J., 2020. Sensitivity analysis for publication bias in meta‐analyses Journal of the Royal Statistical Society:Series C (Applied Statistics), 69, 1091–1119 (Wiley Online Library)
3�. Moher, D., Liberati, A., Tetzlaff, J., Altman, D.G. and Group, P., 2009. Preferred reporting items for systematic reviews and meta-analyses: thePRISMA statement PLoS med, 6, e1000097 (Public Library of Science)
37. Mulsant, P., Lecerf, F., Fabre, S., Schibler, L., Monget, P., Lanneluc, I., Pisselet, C., Riquet, J., Monniaux, D., Callebaut, I., Cribiu, E., Thimonier, J.,Teyssier, J., Bodin, L., Cognié, Y., Chitour, N. and Elsen, J.M., 2001. Mutation in bone morphogenetic protein receptor-IB is associated withincreased ovulation rate in Booroola Mérino ewes Proceedings of the National Academy of Sciences of the United States of America, 98, 5104–5109
3�. Pan, Z.Y., Di, R., Tang, Q.Q., Jin, H.H., Chu, M.X., Huang, D.W., He, J.N., Liu, Q.Y., Hu, W.P., Wang, X.Y., Yao, Y.X., Liu, L. and Song, C.L., 2015. Tissue-speci�c mRNA expression pro�les of GDF9 , BMP15 , and BMPR1B genes in proli�c and non-proli�c goat breeds 2015, 452–458
39. Peters, J.L., Sutton, A.J., Jones, D.R., Abrams, K.R. and Rushton, L., 2008. Contour-enhanced meta-analysis funnel plots help distinguishpublication bias from other causes of asymmetry Journal of clinical epidemiology, 61, 991–996 (Elsevier)
40. Plakkot, B., Mohanan, A. and Kanakkaparambil, R., 2020. Proli�cacy in small ruminants Journal of Dairy, Veterinary & Animal Research, 9, 85–90
41. Potki, P., Mirhoseini, S.Z., Afraz, F. and Vahidi, S.M.F., 2020. A pro�le of single nucleotide polymorphisms in fecundity genes among iraniansheep breeds by using polymerase chain reaction-restriction fragment length polymorphism (PCR-RFLP) method Iranian Journal of AppliedAnimal Science, 10, 265–285
42. Ren, Y.L., Shen, Z.Q., LI, M., Xiao, N., Dong, W.Y., Li, J.L. and Wang, J.J., 2011. Association of polymorphisms in the FecB gene with litter size inWadi sheep China Animal Husbandry and Veterinary Medicine, 38, 159–162
43. Roy, J., Polley, S., De, S., Mukherjee, A., Batabyal, S., Pan, S., Brahma, B., Datta, T.K. and Goswami, S.L., 2011. Polymorphism of fecundity genes(fecb, fecx, and fecg) in the indian bonpala sheep Animal Biotechnology, 22, 151–162
44. Shao, Y., Liu, W. and Mirinisahan, K., n.d. Study on the Relationship between the Polymorphism of BMPR-IB Gene and Litter Size in Xinjiang CeleBlack Sheep
45. Shi, H.C., Niu, Z.G., Bai, J., Feng, L.J., Mu, M.R.S., Yang, Q.Y., Liu, M.J. and Jia, F., 2012. Effect on litter size of Cele black sheep and geneticregularity of BMPR-IB gene mutation Chinese Journal of Animal Science., 38, 14–17
4�. Singh, P., Deepak, S. and SatyendraPal, S., 2020. Absence of Polymorphism in Booroola (FecB) Gene in Indian Muzzafarnagari Sheep BreedJournal of Animal Research, 10, 30954
47. Souza, C.J.H., MacDougall, C., Campbell, B.K., McNeilly, A.S. and Baird, D.T., 2001. The Booroola (FecB) phenotype is associated with a mutationin the bone morphogenetic receptor type 1 B (BMPR1B) gene Journal of Endocrinology, 169, 3–8
4�. Sterne, J.A.C., Sutton, A.J., Ioannidis, J.P.A., Terrin, N., Jones, D.R., Lau, J., Carpenter, J., Rücker, G., Harbord, R.M. and Schmid, C.H., 2011.Recommendations for examining and interpreting funnel plot asymmetry in meta-analyses of randomised controlled trials Bmj, 343 (BritishMedical Journal Publishing Group)
49. Sun, H., Dun, W., Chen, X., Tian, S. and Tan, W., 2011. Relationship between Polymorphism of BMPR-IB Gene and Litter Size and Sexual Seasonfor Different Sheep Breeds Journal of Hunan Agricultural Sciences, 3 (in Chinese)
50. Sutton, A.J., Abrams, K.R., Jones, D.R., Jones, D.R., Sheldon, T.A. and Song, F., 2000. Methods for meta-analysis in medical research, (WileyChichester)
51. Tian, X., Sun, H. and Wang, Y., 2009. Genetic polymorphism of BMPR-IB gene and effect on litter size in three sheep breeds. Journal ofNorthwest A & F University-Natural Science Edition, 37, 31–36 (In Chinese)
52. Wang, W., La, Y., Zhou, X., Zhang, X., Li, F. and Liu, B., 2018. The genetic polymorphisms of TGFβ superfamily genes are associated with littersize in a Chinese indigenous sheep breed (Hu sheep) Animal reproduction science, 189, 19–29
53. Wang, W., Liu, S., Li, F., Pan, X., Li, C., Zhang, X., Ma, Y., La, Y., Xi, R. and Li, T., 2015. Polymorphisms of the ovine BMPR-IB, BMP-15 and FSHR andtheir associations with litter size in two Chinese indigenous sheep breeds International journal of molecular sciences, 16, 11385–11397
54. Wang, X. and Maimaitiyiming, B., 2011. Studies of BMPR-IB gene as a candidate gene for proli�cacy in Duolang sheep. Xinjiang AgriculturalSciences, 47, 1813–1818 (In Chinese)
55. Wilson, T., Wu, X.Y., Juengel, J.L., Ross, I.K., Lumsden, J.M., Lord, E.A., Dodds, K.G., Walling, G.A., McEwan, J.C., O’Connell, A.R., McNatty, K.P. andMontgomery, G.W., 2001. Highly proli�c Booroola sheep have a mutation in the intracellular kinase domain of bone morphogenetic protein IB

Page 8/16
receptor (ALK-6) that is expressed in both oocytes and granulosa cells Biology of Reproduction, 64, 1225–1235
5�. Yang, H., Yang, Y., Liu, S., Zhong, F., Zhang, Y. and He, Q., 2010. Analysis of Single Nucleotide Polymorphism of BMPR-IB Gene in Sheep ActaAgriculturae Boreali-Occidentalis Sinica, 9 (In Chinese)
57. Yang, Y., Feng, T., Chu, M., Yun, P., Xiao, W., Xue, Z., Zhang, J. and Meng, D., 2012. FecB mutation of BMPR-IB gene and its association with littersize and growth traits in Small Tailed Han sheep Acta Agriculturae Boreali-Sinica, 27, 38–43 (In Chinese)
5�. Zhu, E.Y., Shi, H.C., Wu, J., Liu, M.J., Jian, Z.J., Bai, J. and Xu, X.M., 2006. Study on bone morphogenetic protein receptor IB as a candidate genefor proli�cacy in sheep Acta Agriculturae Boreali-Occidentalis Sinica, 15, 20–30 (In Chinese)
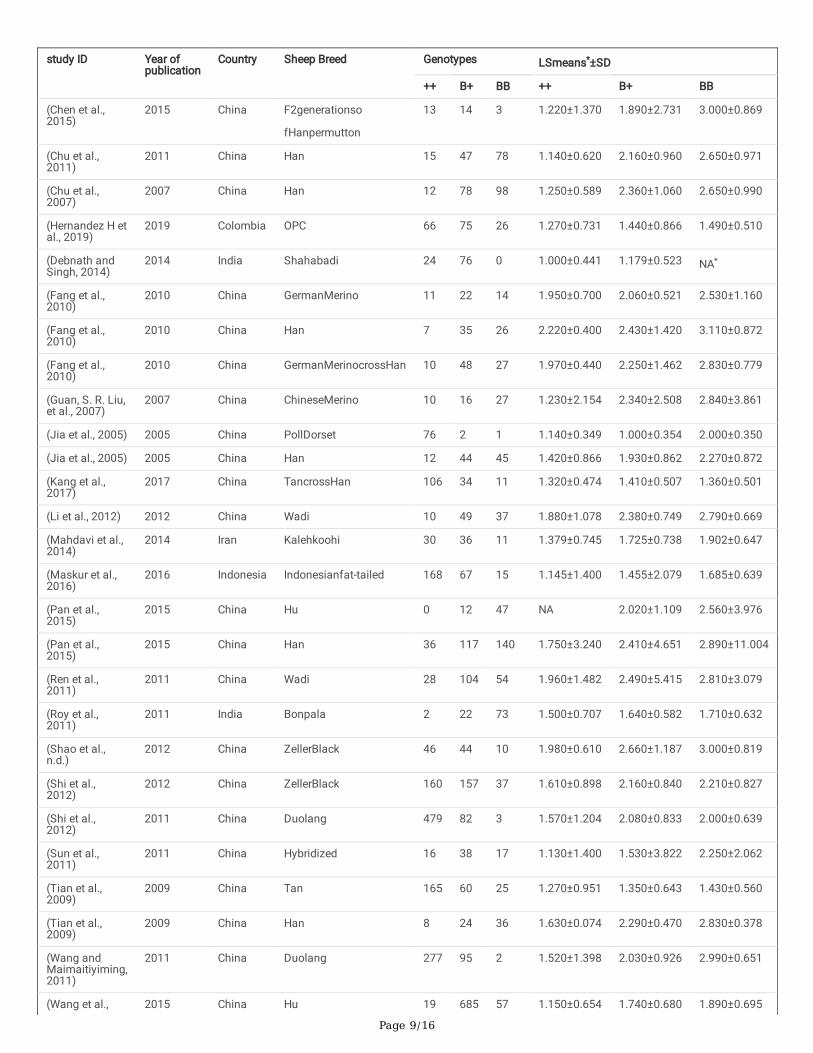
TablesTable 1: The genetic in�uence of the fecb genotypes on litter size has been included in this meta-analysis in various sheep breeds.
Page 9/16
study ID Year ofpublication
Country Sheep Breed Genotypes LSmeans*±SD
++ B+ BB ++ B+ BB
(Chen et al.,2015)
2015 China F2generationso
fHanpermutton
13 14 3 1.220±1.370 1.890±2.731 3.000±0.869
(Chu et al.,2011)
2011 China Han 15 47 78 1.140±0.620 2.160±0.960 2.650±0.971
(Chu et al.,2007)
2007 China Han 12 78 98 1.250±0.589 2.360±1.060 2.650±0.990
(Hernandez H etal., 2019)
2019 Colombia OPC 66 75 26 1.270±0.731 1.440±0.866 1.490±0.510
(Debnath andSingh, 2014)
2014 India Shahabadi 24 76 0 1.000±0.441 1.179±0.523 NA*
(Fang et al.,2010)
2010 China GermanMerino 11 22 14 1.950±0.700 2.060±0.521 2.530±1.160
(Fang et al.,2010)
2010 China Han 7 35 26 2.220±0.400 2.430±1.420 3.110±0.872
(Fang et al.,2010)
2010 China GermanMerinocrossHan 10 48 27 1.970±0.440 2.250±1.462 2.830±0.779
(Guan, S. R. Liu,et al., 2007)
2007 China ChineseMerino 10 16 27 1.230±2.154 2.340±2.508 2.840±3.861
(Jia et al., 2005) 2005 China PollDorset 76 2 1 1.140±0.349 1.000±0.354 2.000±0.350
(Jia et al., 2005) 2005 China Han 12 44 45 1.420±0.866 1.930±0.862 2.270±0.872
(Kang et al.,2017)
2017 China TancrossHan 106 34 11 1.320±0.474 1.410±0.507 1.360±0.501
(Li et al., 2012) 2012 China Wadi 10 49 37 1.880±1.078 2.380±0.749 2.790±0.669
(Mahdavi et al.,2014)
2014 Iran Kalehkoohi 30 36 11 1.379±0.745 1.725±0.738 1.902±0.647
(Maskur et al.,2016)
2016 Indonesia Indonesianfat-tailed 168 67 15 1.145±1.400 1.455±2.079 1.685±0.639
(Pan et al.,2015)
2015 China Hu 0 12 47 NA 2.020±1.109 2.560±3.976
(Pan et al.,2015)
2015 China Han 36 117 140 1.750±3.240 2.410±4.651 2.890±11.004
(Ren et al.,2011)
2011 China Wadi 28 104 54 1.960±1.482 2.490±5.415 2.810±3.079
(Roy et al.,2011)
2011 India Bonpala 2 22 73 1.500±0.707 1.640±0.582 1.710±0.632
(Shao et al.,n.d.)
2012 China ZellerBlack 46 44 10 1.980±0.610 2.660±1.187 3.000±0.819
(Shi et al.,2012)
2012 China ZellerBlack 160 157 37 1.610±0.898 2.160±0.840 2.210±0.827
(Shi et al.,2012)
2011 China Duolang 479 82 3 1.570±1.204 2.080±0.833 2.000±0.639
(Sun et al.,2011)
2011 China Hybridized 16 38 17 1.130±1.400 1.530±3.822 2.250±2.062
(Tian et al.,2009)
2009 China Tan 165 60 25 1.270±0.951 1.350±0.643 1.430±0.560
(Tian et al.,2009)
2009 China Han 8 24 36 1.630±0.074 2.290±0.470 2.830±0.378
(Wang andMaimaitiyiming,2011)
2011 China Duolang 277 95 2 1.520±1.398 2.030±0.926 2.990±0.651
(Wang et al., 2015 China Hu 19 685 57 1.150±0.654 1.740±0.680 1.890±0.695

Page 10/16
2015)
(Wang et al.,2015)
2015 China Han 19 765 85 1.210±0.741 1.780±0.719 2.060±0.719
(Wang et al.,2018)
2018 China Hu 12 182 1827 1.746±0.856 2.165±1.889 2.459±5.514
(Yang et al.,2010)
2010 China Merino 230 177 35 1.270±0.910 1.830±0.798 1.870±0.887
(Yang et al.,2012)
2012 China Han 128 719 437 1.740±1.697 2.160±4.558 2.720±2.299
(Zhu et al.,2006)
2006 China Merino 10 28 2 1.600±0.569 2.110±0.571 3.000±0.570
(Zhu et al.,2006)
2006 China Han 4 17 16 2.250±0.580 2.760±0.569 2.810±0.568
*LSmeans, the least squares mean of litter size; SD, standard deviation; NA, Not available.
Table 2: Test �ndings for heterogeneity of meta-analysis research
I2Q
Contrasts
CI_UpCI_LowEstimatedP valueEstimated
77.7%56.6%68.9%<0.0001119.00Additive (BB vs '++')
65 .2%15.4%45.8%0.00549.77Dominant ('BB'+'B+' vs '++')
79.8%58.4%71.1%<0.0001103.64 Co-dominant ('BB'+'++' vs 'B+')
63.0%21.3%46.0%0.001170.38Recessive (BB vs 'B+'+'++')
Table 3: Meta-analysis of the association of fecb polymorphism with litter size
P-value95% Con�dence IntervalSMDNo. breeds
Contrasts
Upper LimitLower Limit
< 0.00010.76350.29190.52829Additive (BB vs '++')
< 0.00010.58260.35270.46828Dominant ('BB'+'B+' vs '++')
0.33320.0538-0.1539-0.05031 Co-dominant ('BB'+'++' vs 'B+')
0.00110.39330.10700.25029Recessive (BB vs 'B+'+'++')
Table 4: outcomes of using Egger’s test to survey the prevalence of publication bias in meta-analyses
PInterceptContrasts
0.0011.21Recessive (BB vs 'B+'+'++')
0.5340.36Dominant ('BB'+'B+' vs '++')
0.7600.22 Co-dominant ('BB'+'++' vs 'B+')
0.0101.42Additive (BB vs '++')
Figures

Page 11/16
Figure 1
The PRISMA �ow chart displaying incorporation and rejection rules

Page 12/16
Figure 2
Funnel plot showing the relationship between the observed effect size (Standardized mean differences; solid circles) and its standard error fordifferent genetic models in a meta-analysis

Page 13/16
Figure 3
Forest plot for association between FecB polymorphism and litter size applying the additive model for meta-analyses the thickness and length of theblue rectangles indicate the weight and con�dence interval of each study, respectively; Diamond placed at underneath of plot illustrates thesummary effect

Page 14/16
Figure 4
Forest plot for association between FecB polymorphism and litter size applying the dominant model for meta-analyses the thickness and length ofthe blue rectangles indicate the weight and con�dence interval of each study, respectively; Diamond placed at underneath of plot illustrates thesummary effect
Page 15/16
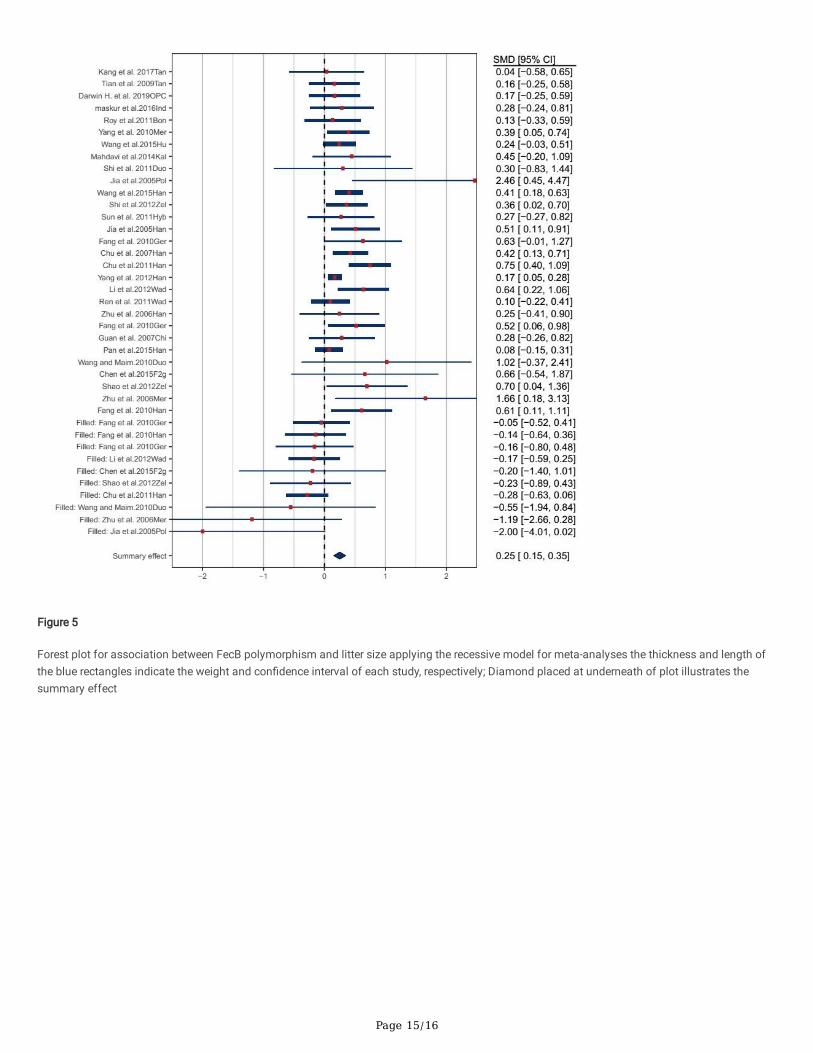
Figure 5
Forest plot for association between FecB polymorphism and litter size applying the recessive model for meta-analyses the thickness and length ofthe blue rectangles indicate the weight and con�dence interval of each study, respectively; Diamond placed at underneath of plot illustrates thesummary effect

Page 16/16
Figure 6
Forest plot for association between FecB polymorphism and litter size applying the codominant model for meta-analyses the thickness and lengthof the blue rectangles indicate the weight and con�dence interval of each study, respectively; Diamond placed at underneath of plot illustrates thesummary effect