Embed Size (px)
DESCRIPTION
Live Animal Evaluation Swine. Nick Nelson Blue Mt. Community College ANS 231 Originated by Kenneth Geuns Michigan State University Revised 2009. Swine Evaluation: Fat Indicators. Ham/ Loin Junction. Loin Edge. Shoulder. Seam of Ham. Elbow Pocket. Flank. Jowl. - PowerPoint PPT Presentation
Citation preview

Live Animal EvaluationLive Animal EvaluationSwineSwine
Nick NelsonNick NelsonBlue Mt. Community CollegeBlue Mt. Community College
ANS 231ANS 231Originated by Originated by Kenneth GeunsKenneth Geuns
Michigan State UniversityMichigan State UniversityRevised 2009Revised 2009
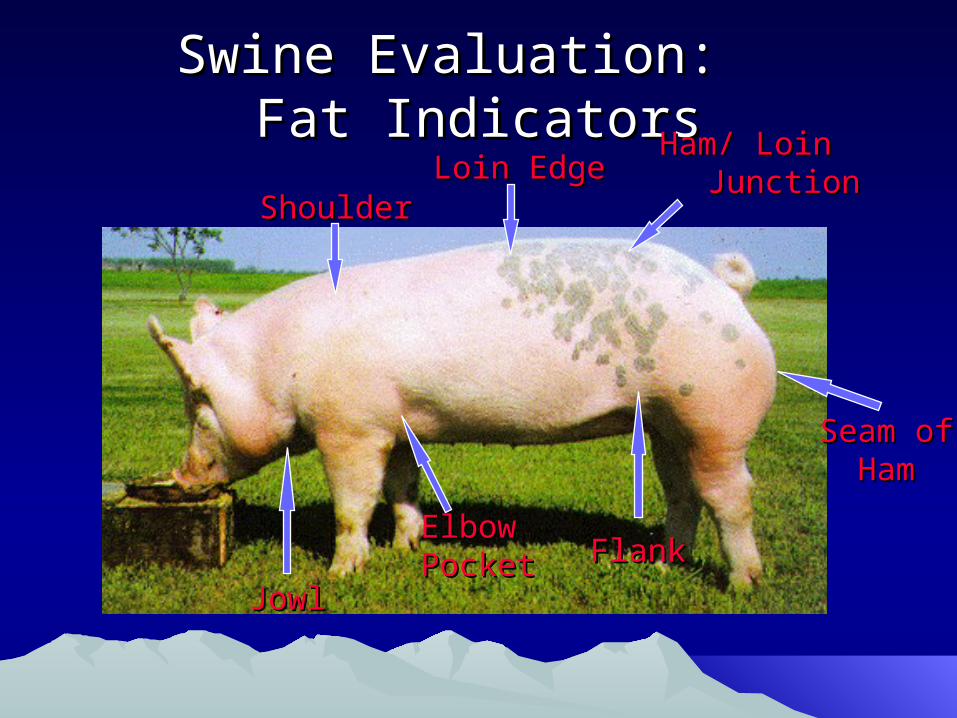
Swine Evaluation: Swine Evaluation: Fat IndicatorsFat Indicators
ShoulderShoulderLoin EdgeLoin Edge Ham/ LoinHam/ Loin
JunctionJunction
FlankFlankElbowElbowPocketPocket
JowlJowl
Seam ofSeam of HamHam

Swine Evaluation: Swine Evaluation: Muscle IndicatorsMuscle Indicators
ForearmForearm HamHam
LoinLoin
StifleStifle

WeightWeight
• Live Weight– Range: 210 lb - 300 lb– Average: 250 to 260 lb
• Carcass Weight– Weight of dressed carcass (hot or chilled)
• Chilled 1.5% less than hot– Range: 150 - 215 lb– Avg: 180 lb

Dressing PercentageDressing Percentage
• Proportion of body weight that ends up as carcass– Example: 255 lb live weight hog with 186 lb
carcass = 73% dress– Some variation in dressing % across plants
due to slaughter procedures and time of carcass weight measurement (hot or chilled)
• Range: 65 - 77%• Avg: 72%
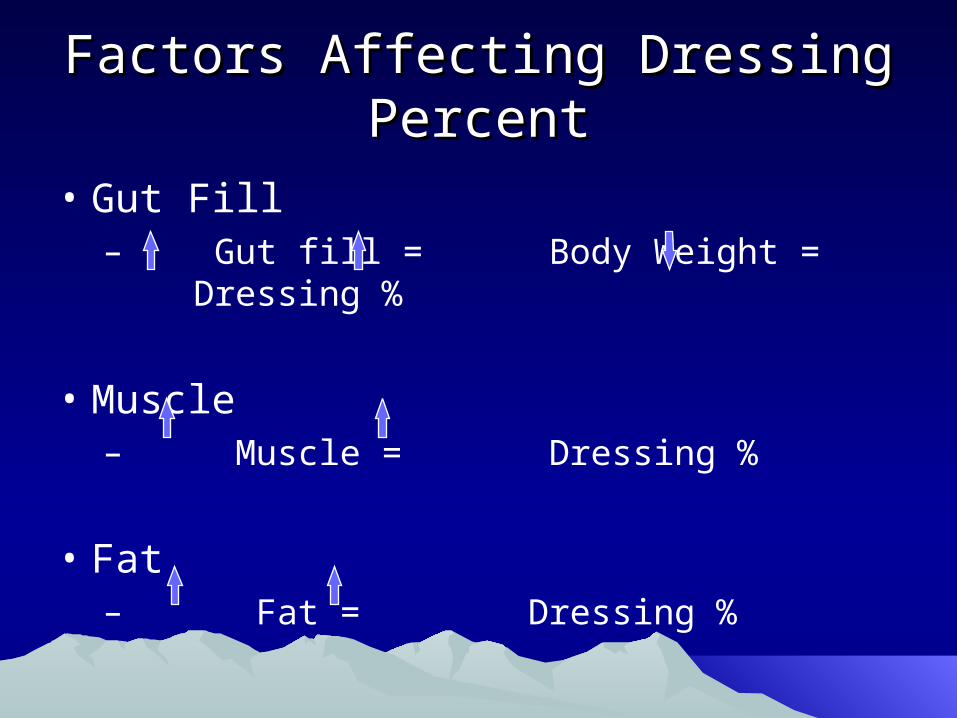
Factors Affecting Dressing PercentFactors Affecting Dressing Percent
• Gut Fill– Gut fill = Body Weight = Dressing %
• Muscle– Muscle = Dressing %
• Fat– Fat = Dressing %
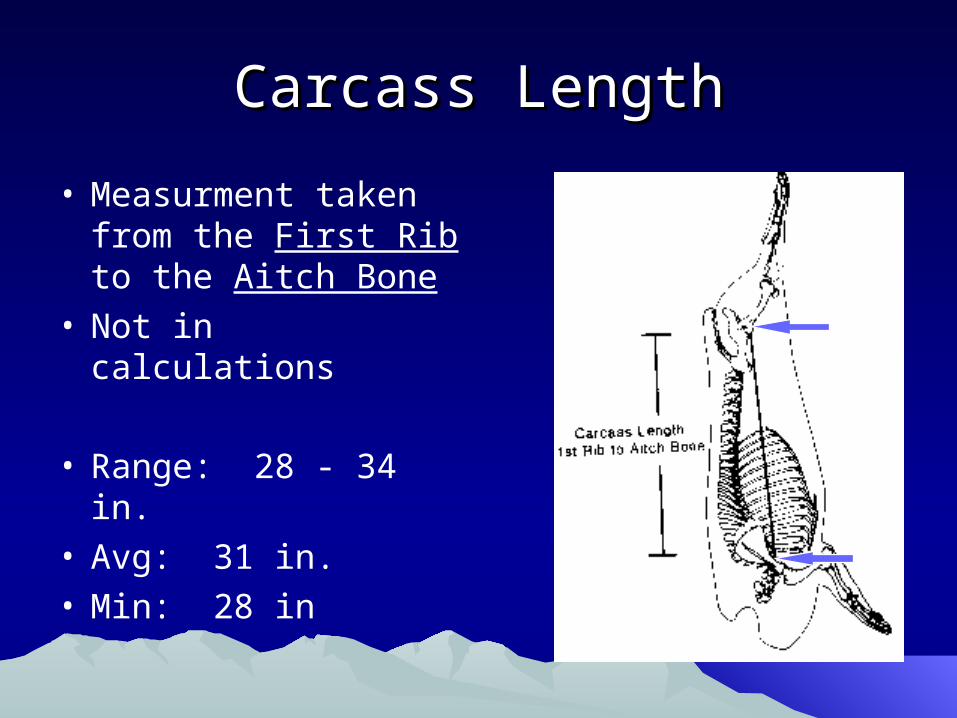
Carcass LengthCarcass Length
• Measurment taken from the First Rib to the Aitch Bone
• Not in calculations
• Range: 28 - 34 in.• Avg: 31 in.• Min: 28 in

1010thth Rib Fat Rib Fat
• Used in % Muscle Formula• Range: .50 - 1.50 in.• Avg.: .90 in

Last Rib FatLast Rib Fat
• Used in USDA Grade calculation• Range: .40 - 1.40 in.• Avg: .80 in.
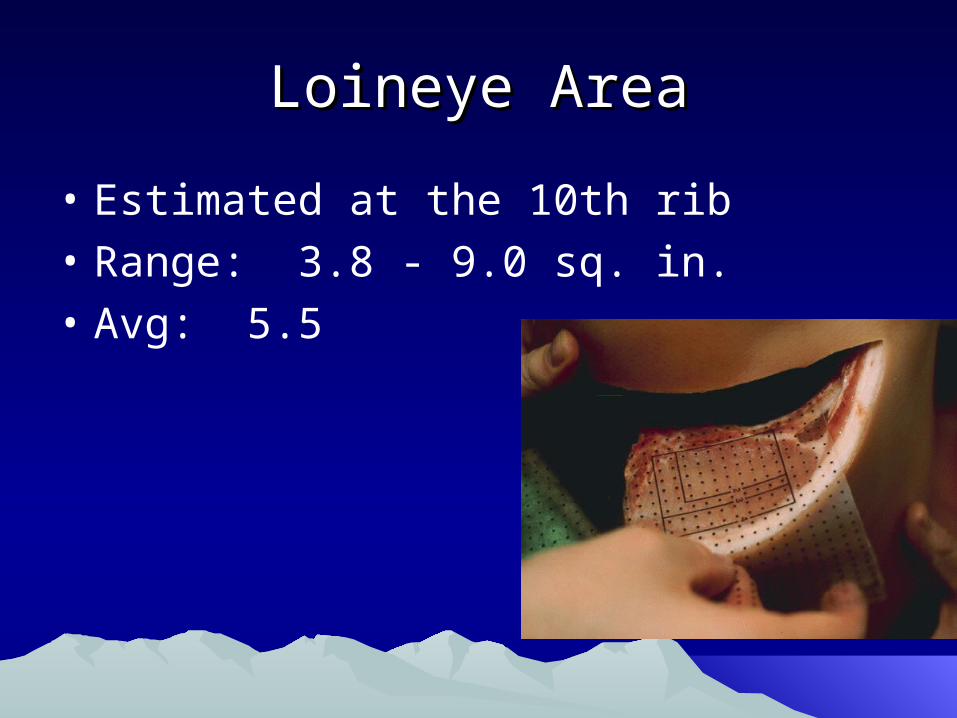
Loineye AreaLoineye Area
• Estimated at the 10th rib• Range: 3.8 - 9.0 sq. in.• Avg: 5.5
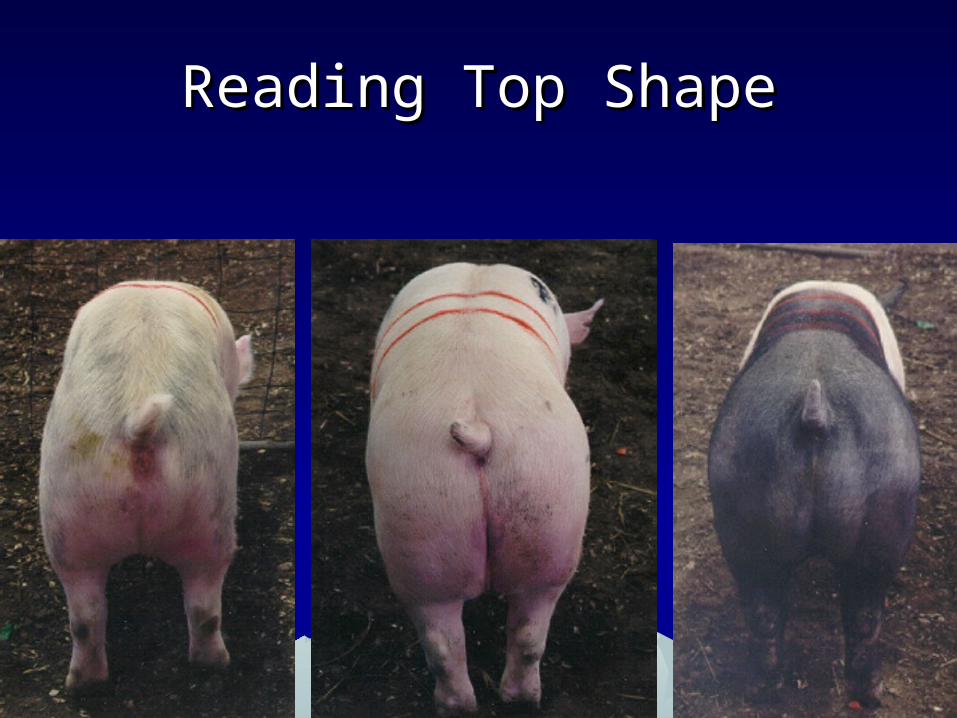
Reading Top ShapeReading Top Shape

Reading Top ShapeReading Top Shape
BF = .90 inches

Reading Top ShapeReading Top Shape
BF = 1.5 inches

Reading Top ShapeReading Top Shape
BF = .20

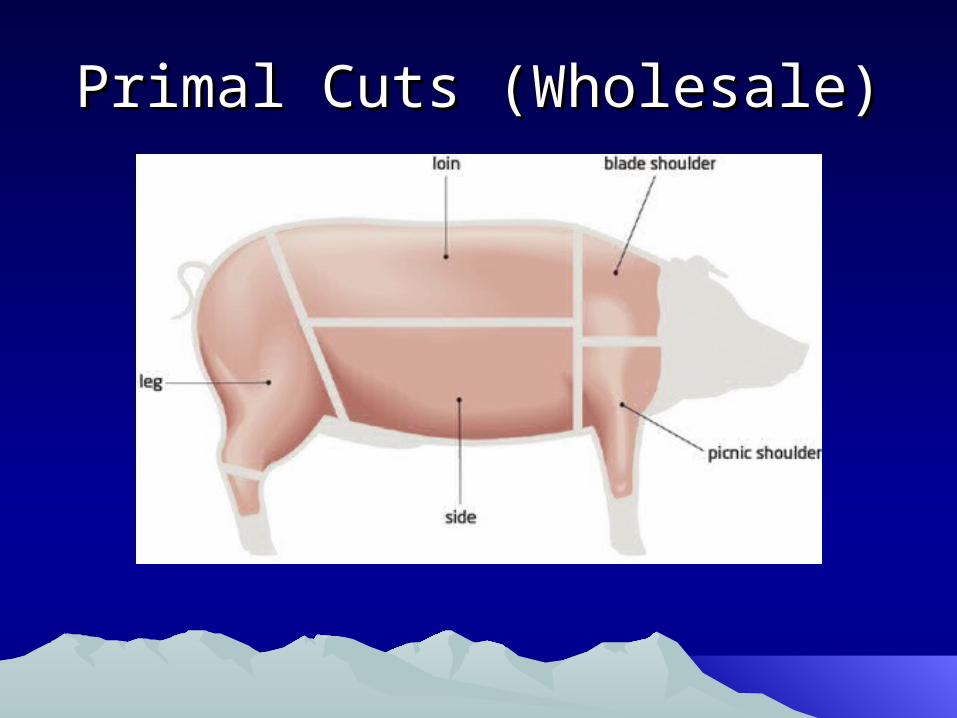
Primal Cuts (Wholesale)Primal Cuts (Wholesale)