Embed Size (px)
Citation preview
Live Sheep Export –
Brief Report
20th April 2018
Commissioned by WA Farmers Federation with support of Sheep Producers Australia
For more details contact [email protected]
Live sheep export analysis 20/04/2018
Key findings:
• The current live sheep export trade volume represents a third of the sheep and lamb offtake in Western Australia each year
• Price interdependence has been shown to exist between WA Trade Lamb, WA Mutton and Live Export markets that is comparable to the relationship that exists between WA and East coast markets
• Capacity constraints exist, in terms of available land and shearer availability, when diverting live export volumes into the wool producing sector in WA
• A proposed increase in the domestic sale and processing of WA sheep and lamb on account of a ban on live exports could see price declines in the magnitude of 18-35% for WA producers
• The lost revenue to WA producers of a ban on live sheep exports would be in
the vicinity of $80 to $150 million dollars
For more details contact [email protected]
Live sheep export analysis 20/04/2018
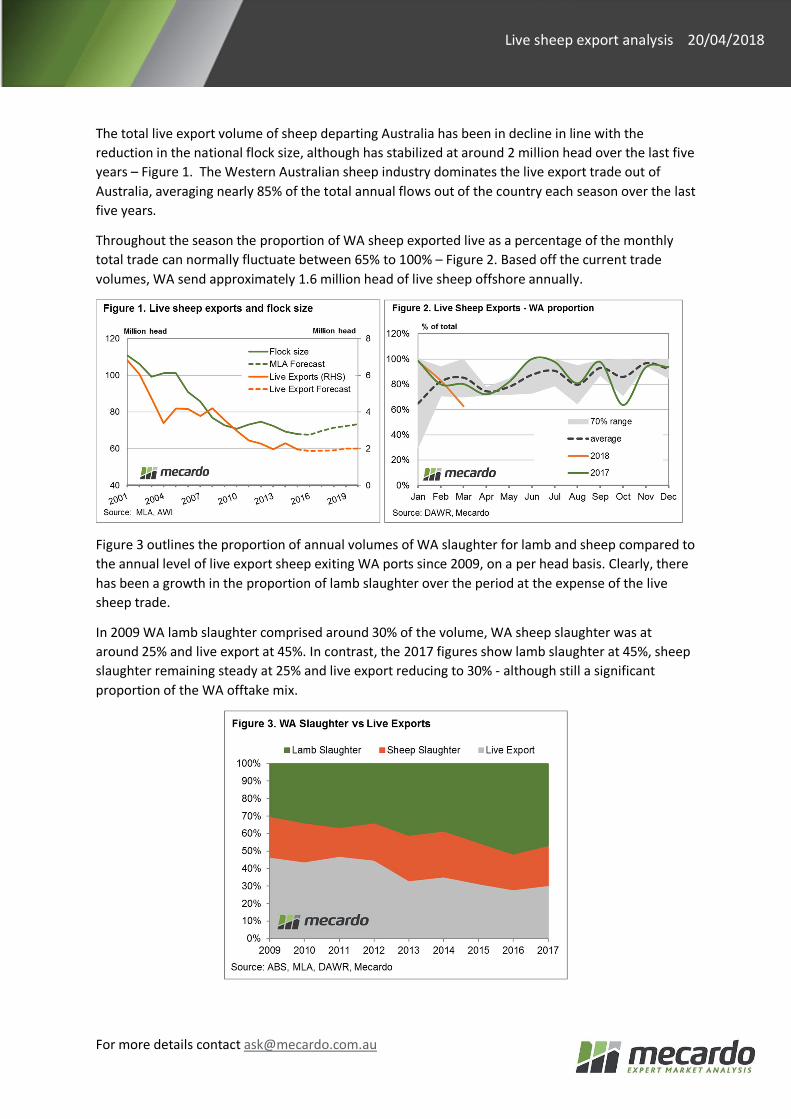
The total live export volume of sheep departing Australia has been in decline in line with the reduction in the national flock size, although has stabilized at around 2 million head over the last five years – Figure 1. The Western Australian sheep industry dominates the live export trade out of Australia, averaging nearly 85% of the total annual flows out of the country each season over the last five years.
Throughout the season the proportion of WA sheep exported live as a percentage of the monthly total trade can normally fluctuate between 65% to 100% – Figure 2. Based off the current trade volumes, WA send approximately 1.6 million head of live sheep offshore annually.
Figure 3 outlines the proportion of annual volumes of WA slaughter for lamb and sheep compared to the annual level of live export sheep exiting WA ports since 2009, on a per head basis. Clearly, there has been a growth in the proportion of lamb slaughter over the period at the expense of the live sheep trade.
In 2009 WA lamb slaughter comprised around 30% of the volume, WA sheep slaughter was at around 25% and live export at 45%. In contrast, the 2017 figures show lamb slaughter at 45%, sheep slaughter remaining steady at 25% and live export reducing to 30% - although still a significant proportion of the WA offtake mix.
For more details contact [email protected]
Live sheep export analysis 20/04/2018
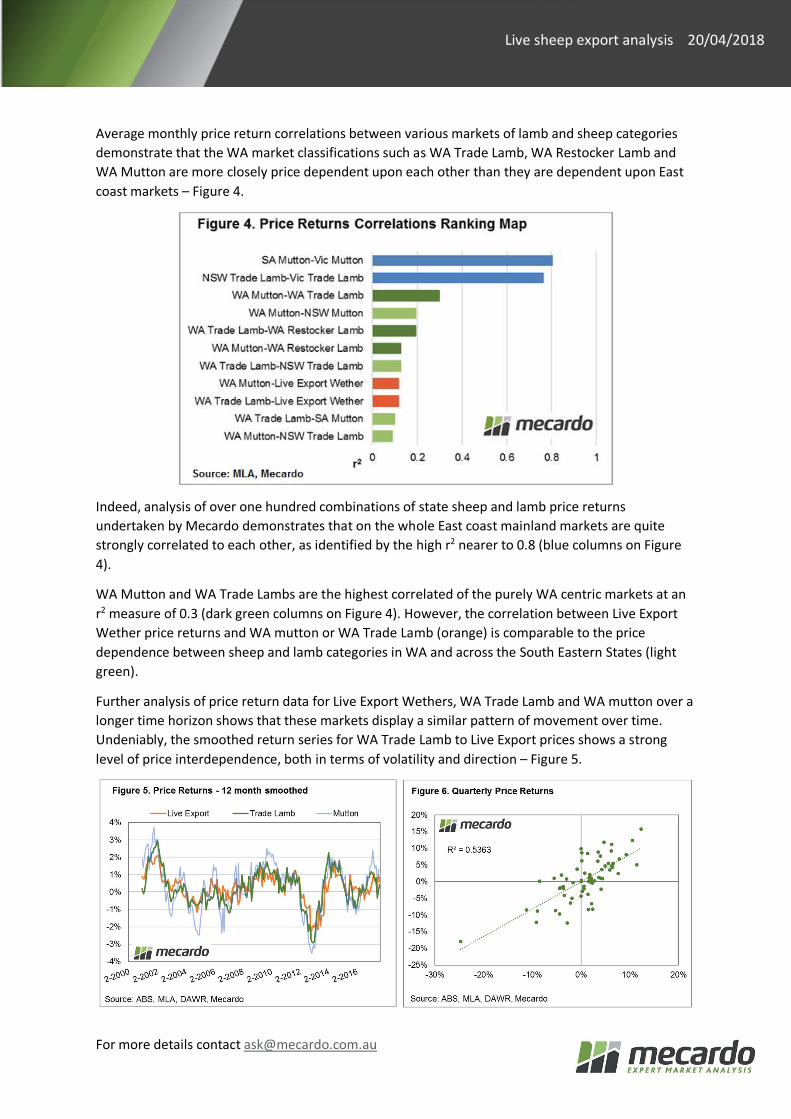
Average monthly price return correlations between various markets of lamb and sheep categories demonstrate that the WA market classifications such as WA Trade Lamb, WA Restocker Lamb and WA Mutton are more closely price dependent upon each other than they are dependent upon East coast markets – Figure 4.
Indeed, analysis of over one hundred combinations of state sheep and lamb price returns undertaken by Mecardo demonstrates that on the whole East coast mainland markets are quite strongly correlated to each other, as identified by the high r2 nearer to 0.8 (blue columns on Figure 4).
WA Mutton and WA Trade Lambs are the highest correlated of the purely WA centric markets at an r2 measure of 0.3 (dark green columns on Figure 4). However, the correlation between Live Export Wether price returns and WA mutton or WA Trade Lamb (orange) is comparable to the price dependence between sheep and lamb categories in WA and across the South Eastern States (light green).
Further analysis of price return data for Live Export Wethers, WA Trade Lamb and WA mutton over a longer time horizon shows that these markets display a similar pattern of movement over time. Undeniably, the smoothed return series for WA Trade Lamb to Live Export prices shows a strong level of price interdependence, both in terms of volatility and direction – Figure 5.
For more details contact [email protected]
Live sheep export analysis 20/04/2018
WA Mutton displays a slightly higher degree of variability, but the broad trend in returns is consistent with the pattern set by both Live Export Wethers and WA Trade Lamb.
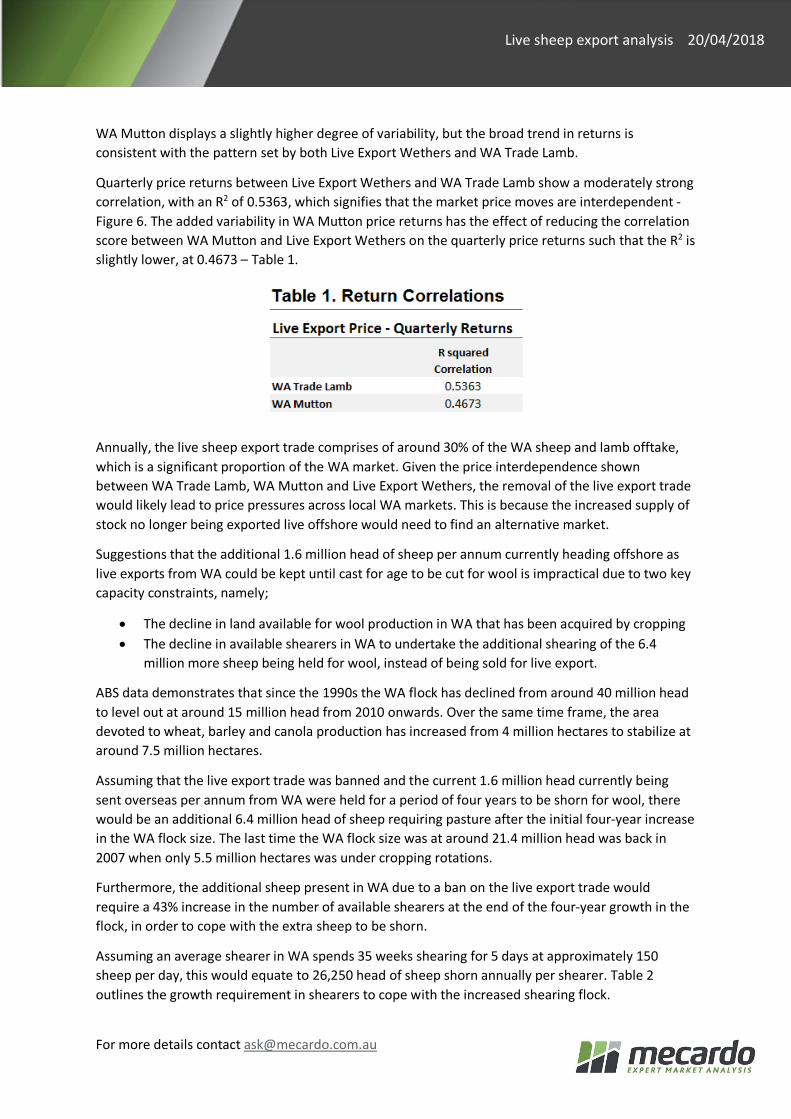
Quarterly price returns between Live Export Wethers and WA Trade Lamb show a moderately strong correlation, with an R2 of 0.5363, which signifies that the market price moves are interdependent -Figure 6. The added variability in WA Mutton price returns has the effect of reducing the correlation score between WA Mutton and Live Export Wethers on the quarterly price returns such that the R2 is slightly lower, at 0.4673 – Table 1.
Annually, the live sheep export trade comprises of around 30% of the WA sheep and lamb offtake, which is a significant proportion of the WA market. Given the price interdependence shown between WA Trade Lamb, WA Mutton and Live Export Wethers, the removal of the live export trade would likely lead to price pressures across local WA markets. This is because the increased supply of stock no longer being exported live offshore would need to find an alternative market.
Suggestions that the additional 1.6 million head of sheep per annum currently heading offshore as live exports from WA could be kept until cast for age to be cut for wool is impractical due to two key capacity constraints, namely;
• The decline in land available for wool production in WA that has been acquired by cropping • The decline in available shearers in WA to undertake the additional shearing of the 6.4
million more sheep being held for wool, instead of being sold for live export.
ABS data demonstrates that since the 1990s the WA flock has declined from around 40 million head to level out at around 15 million head from 2010 onwards. Over the same time frame, the area devoted to wheat, barley and canola production has increased from 4 million hectares to stabilize at around 7.5 million hectares.
Assuming that the live export trade was banned and the current 1.6 million head currently being sent overseas per annum from WA were held for a period of four years to be shorn for wool, there would be an additional 6.4 million head of sheep requiring pasture after the initial four-year increase in the WA flock size. The last time the WA flock size was at around 21.4 million head was back in 2007 when only 5.5 million hectares was under cropping rotations.
Furthermore, the additional sheep present in WA due to a ban on the live export trade would require a 43% increase in the number of available shearers at the end of the four-year growth in the flock, in order to cope with the extra sheep to be shorn.
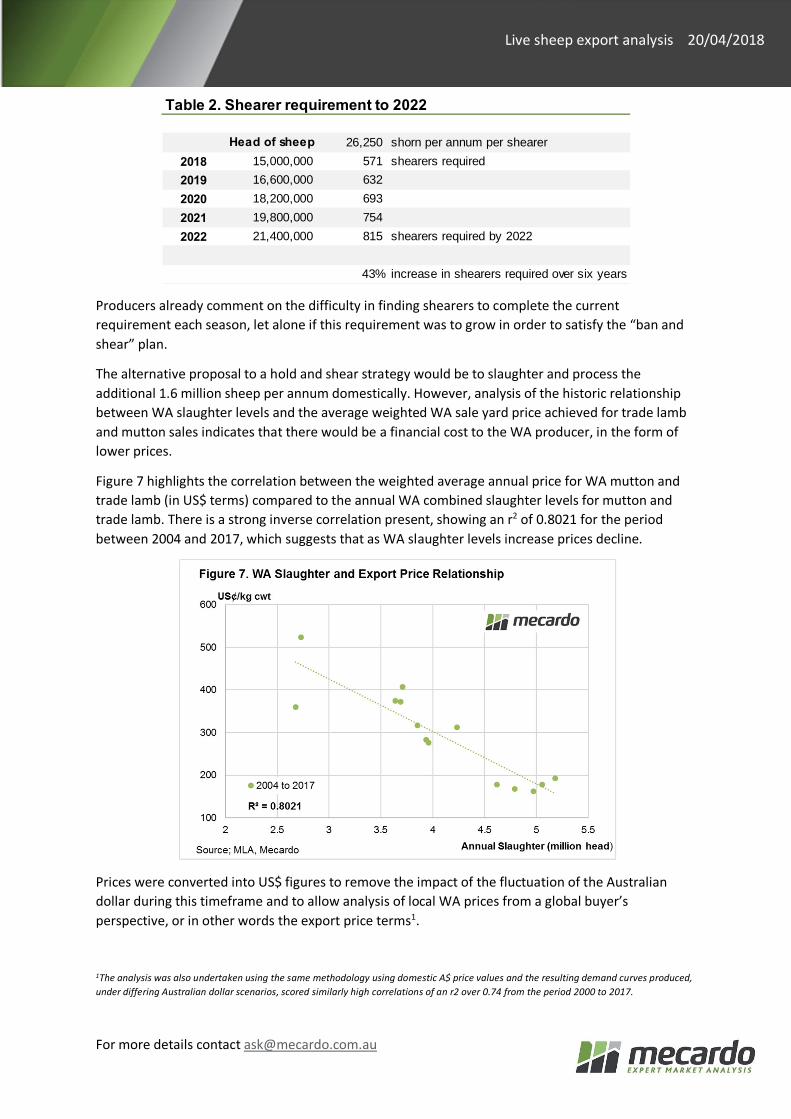
Assuming an average shearer in WA spends 35 weeks shearing for 5 days at approximately 150 sheep per day, this would equate to 26,250 head of sheep shorn annually per shearer. Table 2 outlines the growth requirement in shearers to cope with the increased shearing flock.
For more details contact [email protected]
Live sheep export analysis 20/04/2018
Producers already comment on the difficulty in finding shearers to complete the current requirement each season, let alone if this requirement was to grow in order to satisfy the “ban and shear” plan.
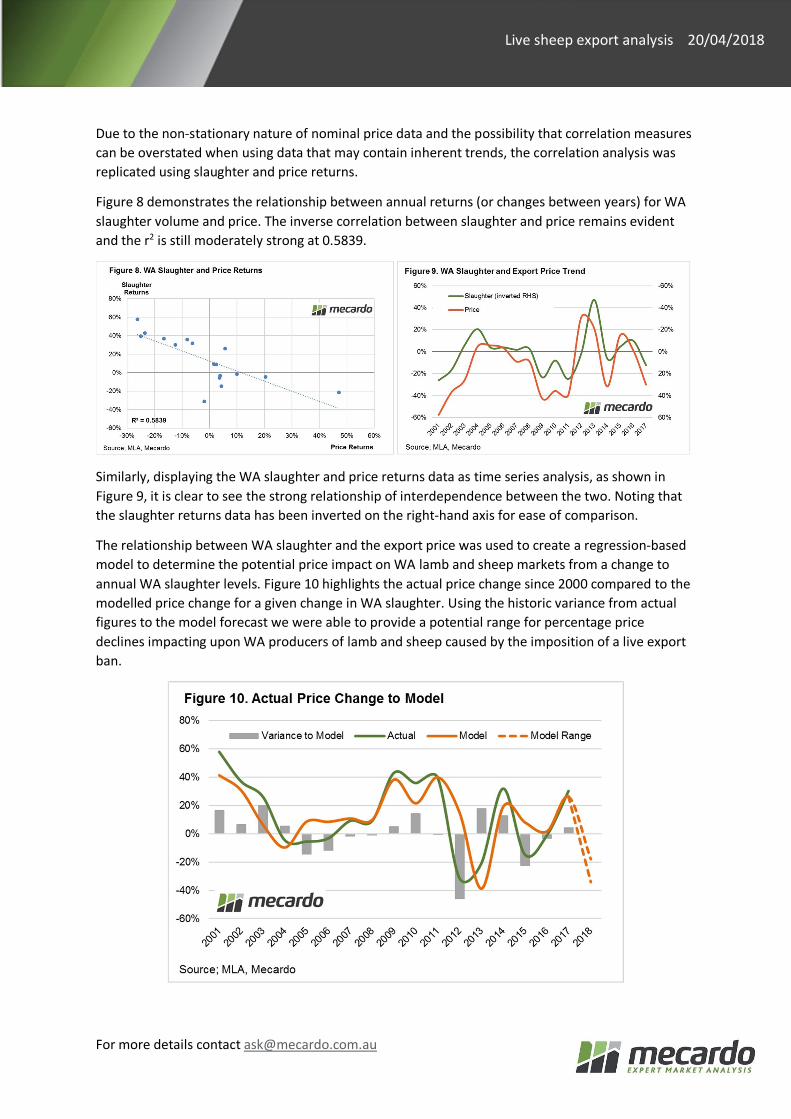
The alternative proposal to a hold and shear strategy would be to slaughter and process the additional 1.6 million sheep per annum domestically. However, analysis of the historic relationship between WA slaughter levels and the average weighted WA sale yard price achieved for trade lamb and mutton sales indicates that there would be a financial cost to the WA producer, in the form of lower prices.
Figure 7 highlights the correlation between the weighted average annual price for WA mutton and trade lamb (in US$ terms) compared to the annual WA combined slaughter levels for mutton and trade lamb. There is a strong inverse correlation present, showing an r2 of 0.8021 for the period between 2004 and 2017, which suggests that as WA slaughter levels increase prices decline.
Prices were converted into US$ figures to remove the impact of the fluctuation of the Australian dollar during this timeframe and to allow analysis of local WA prices from a global buyer’s perspective, or in other words the export price terms1.
1The analysis was also undertaken using the same methodology using domestic A$ price values and the resulting demand curves produced, under differing Australian dollar scenarios, scored similarly high correlations of an r2 over 0.74 from the period 2000 to 2017.
Table 2. Shearer requirement to 2022
Head of sheep 26,250 shorn per annum per shearer2018 15,000,000 571 shearers required2019 16,600,000 632 2020 18,200,000 693 2021 19,800,000 754 2022 21,400,000 815 shearers required by 2022
43% increase in shearers required over six years
For more details contact [email protected]
Live sheep export analysis 20/04/2018
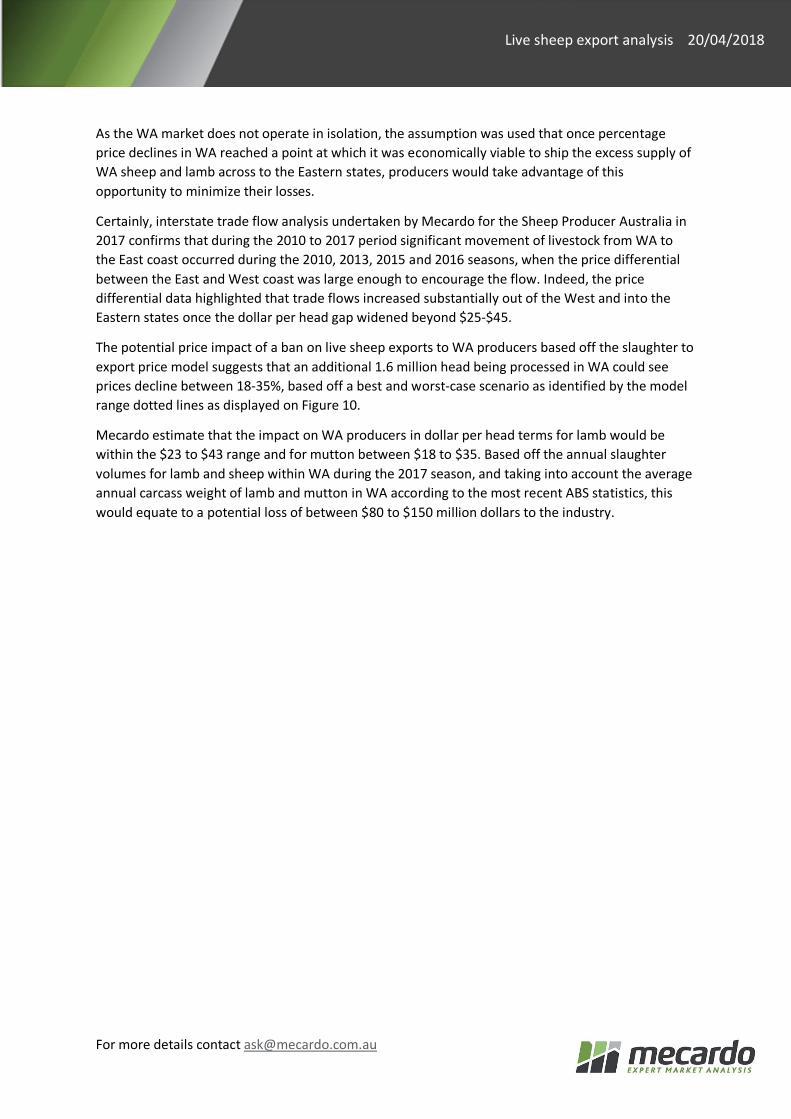
Due to the non-stationary nature of nominal price data and the possibility that correlation measures can be overstated when using data that may contain inherent trends, the correlation analysis was replicated using slaughter and price returns.
Figure 8 demonstrates the relationship between annual returns (or changes between years) for WA slaughter volume and price. The inverse correlation between slaughter and price remains evident and the r2 is still moderately strong at 0.5839.
Similarly, displaying the WA slaughter and price returns data as time series analysis, as shown in Figure 9, it is clear to see the strong relationship of interdependence between the two. Noting that the slaughter returns data has been inverted on the right-hand axis for ease of comparison.
The relationship between WA slaughter and the export price was used to create a regression-based model to determine the potential price impact on WA lamb and sheep markets from a change to annual WA slaughter levels. Figure 10 highlights the actual price change since 2000 compared to the modelled price change for a given change in WA slaughter. Using the historic variance from actual figures to the model forecast we were able to provide a potential range for percentage price declines impacting upon WA producers of lamb and sheep caused by the imposition of a live export ban.
For more details contact [email protected]
Live sheep export analysis 20/04/2018
As the WA market does not operate in isolation, the assumption was used that once percentage price declines in WA reached a point at which it was economically viable to ship the excess supply of WA sheep and lamb across to the Eastern states, producers would take advantage of this opportunity to minimize their losses.
Certainly, interstate trade flow analysis undertaken by Mecardo for the Sheep Producer Australia in 2017 confirms that during the 2010 to 2017 period significant movement of livestock from WA to the East coast occurred during the 2010, 2013, 2015 and 2016 seasons, when the price differential between the East and West coast was large enough to encourage the flow. Indeed, the price differential data highlighted that trade flows increased substantially out of the West and into the Eastern states once the dollar per head gap widened beyond $25-$45.
The potential price impact of a ban on live sheep exports to WA producers based off the slaughter to export price model suggests that an additional 1.6 million head being processed in WA could see prices decline between 18-35%, based off a best and worst-case scenario as identified by the model range dotted lines as displayed on Figure 10.
Mecardo estimate that the impact on WA producers in dollar per head terms for lamb would be within the $23 to $43 range and for mutton between $18 to $35. Based off the annual slaughter volumes for lamb and sheep within WA during the 2017 season, and taking into account the average annual carcass weight of lamb and mutton in WA according to the most recent ABS statistics, this would equate to a potential loss of between $80 to $150 million dollars to the industry.


![INDEX []...AUSTRALIAN FORESTRY COUNCIL 1975-76 Summary of Resolutions and Recommendations of the 14th Meeting, 29 August 1975 AUSTRALIAN LIVE SHEEP EXPORT TRADES 145 1981-82 Report,](https://img.pdfslide.net/doc/110x75/6005735115d7e46781703fde/index-australian-forestry-council-1975-76-summary-of-resolutions-and-recommendations.jpg)