Embed Size (px)
Citation preview
Liveable housing. Simply good.QUARTERLY REPORT AS OF 31 MARCH 2020

3 About this Report
3 Key Figures Q1 2020
4 Portfolio
8 Analysis of Net Assets, Financial Position and Results of Operations
16 Risk and Opportunity Report
16 Forecast Report
17 Consolidated financial statements
17 Consolidated statement of financial position
18 Consolidated statement of comprehensive income
19 Statement of changes in consolidated equity
20 Consolidated statement of cash flows
21 Selected notes
21 1. Basic information on the Group
21 2. Interim consolidated financial statements
21 3. Accounting policies
21 4. Changes in the Group
21 5. Judgements and estimates
23 6. Selected notes to the consolidated statement of financial position
27 7. Selected notes to the consolidated statement of comprehensive income
30 8. Notes on Group segment reporting
32 9. Financial instruments
35 10. Related-party disclosures
35 11. Other
35 12. The Management Board and the Supervisory Board
35 13. Supplementary Report
36 Responsibility statement
36 Financial calendar 2020
36 Contact Details and Imprint
2 LEG IMMOBILIEN AG Q1 2020
The pdf version of our Quarterly Report was optimised for use on a PC or tablet. The linked tables of contents and the function buttons on each page ensure easy navigation:
To the main table of contents
Search in document
Back to last page
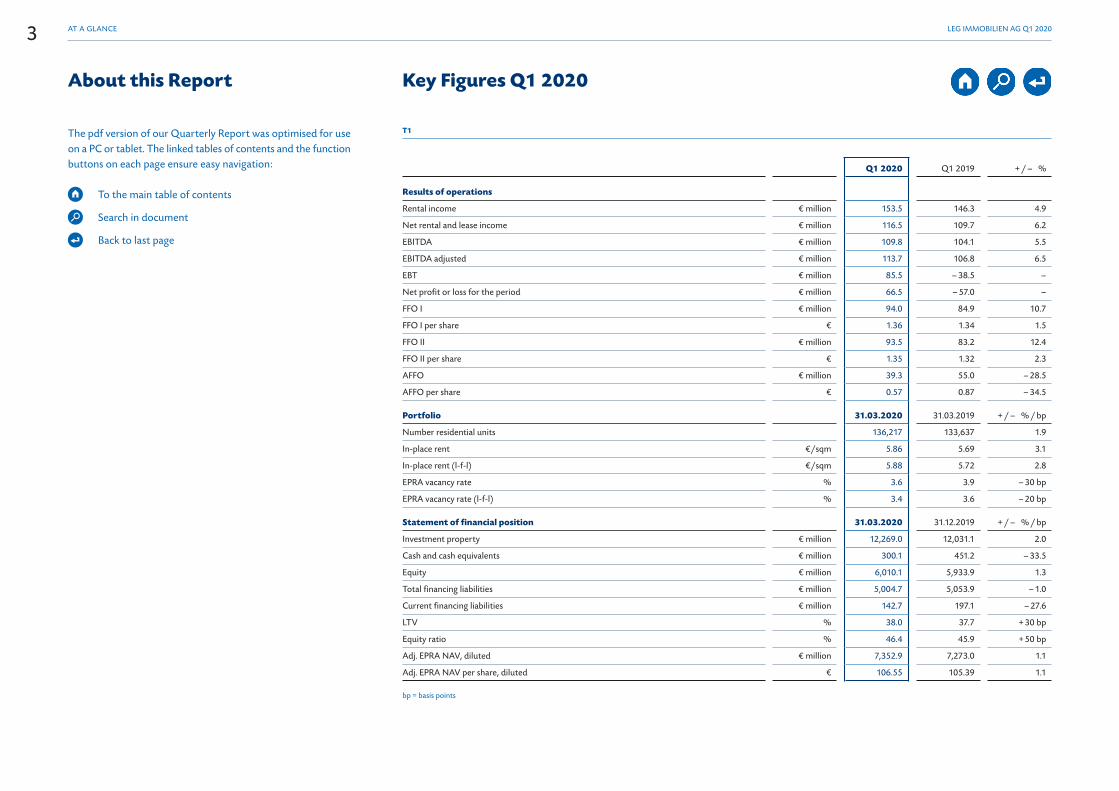
About this Report Key Figures Q1 2020
T1
Q1 2020 Q1 2019 + / – %
Results of operations
Rental income € million 153.5 146.3 4.9
Net rental and lease income € million 116.5 109.7 6.2
EBITDA € million 109.8 104.1 5.5
EBITDA adjusted € million 113.7 106.8 6.5
EBT € million 85.5 – 38.5 –
Net profit or loss for the period € million 66.5 – 57.0 –
FFO I € million 94.0 84.9 10.7
FFO I per share € 1.36 1.34 1.5
FFO II € million 93.5 83.2 12.4
FFO II per share € 1.35 1.32 2.3
AFFO € million 39.3 55.0 – 28.5
AFFO per share € 0.57 0.87 – 34.5
Portfolio 31.03.2020 31.03.2019 + / – % / bp
Number residential units 136,217 133,637 1.9
In-place rent €/sqm 5.86 5.69 3.1
In-place rent (l-f-l) €/sqm 5.88 5.72 2.8
EPRA vacancy rate % 3.6 3.9 – 30 bp
EPRA vacancy rate (l-f-l) % 3.4 3.6 – 20 bp
Statement of financial position 31.03.2020 31.12.2019 + / – % / bp
Investment property € million 12,269.0 12,031.1 2.0
Cash and cash equivalents € million 300.1 451.2 – 33.5
Equity € million 6,010.1 5,933.9 1.3
Total financing liabilities € million 5,004.7 5,053.9 – 1.0
Current financing liabilities € million 142.7 197.1 – 27.6
LTV % 38.0 37.7 + 30 bp
Equity ratio % 46.4 45.9 + 50 bp
Adj. EPRA NAV, diluted € million 7,352.9 7,273.0 1.1
Adj. EPRA NAV per share, diluted € 106.55 105.39 1.1
bp = basis points
3 LEG IMMOBILIEN AG Q1 2020AT A GLANCE
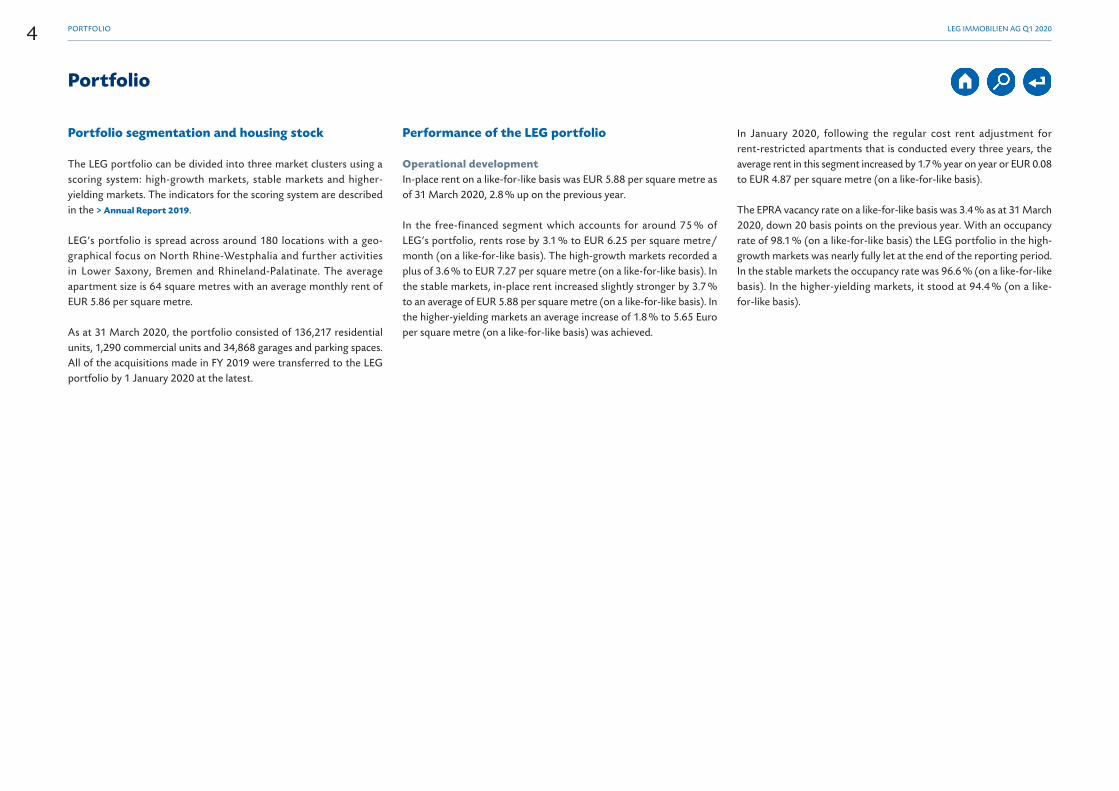
Portfolio
Portfolio segmentation and housing stock
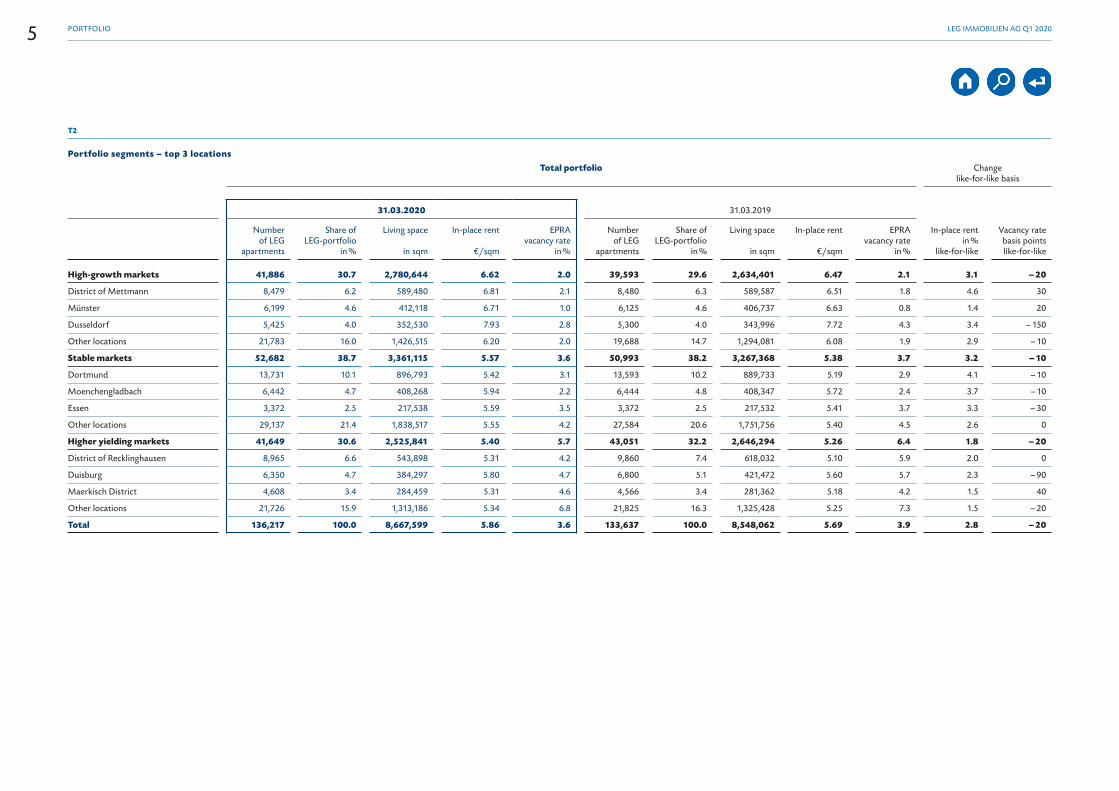
The LEG portfolio can be divided into three market clusters using a scoring system: high-growth markets, stable markets and higher- yielding markets. The indicators for the scoring system are described in the > Annual Report 2019.
LEG’s portfolio is spread across around 180 locations with a geo-graphical focus on North Rhine-Westphalia and further activities in Lower Saxony, Bremen and Rhineland-Palatinate. The average apartment size is 64 square metres with an average monthly rent of EUR 5.86 per square metre.
As at 31 March 2020, the portfolio consisted of 136,217 residential units, 1,290 commercial units and 34,868 garages and parking spaces. All of the acquisitions made in FY 2019 were transferred to the LEG portfolio by 1 January 2020 at the latest.
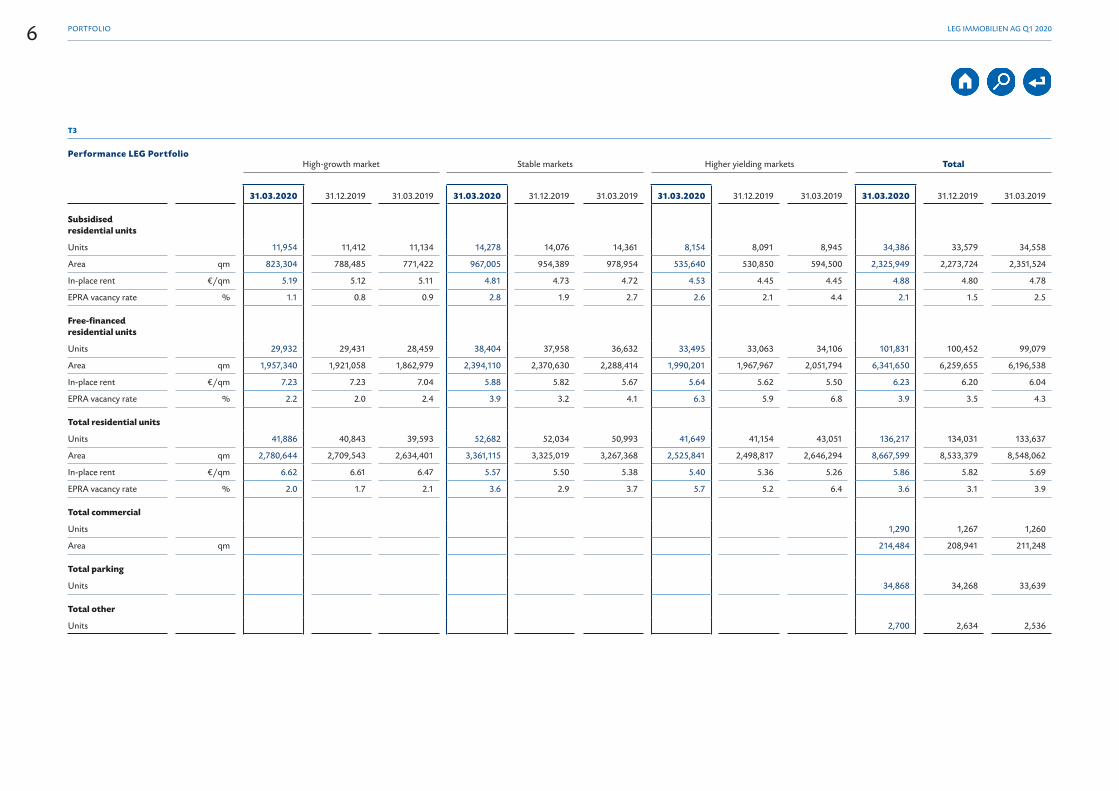
Performance of the LEG portfolio
Operational developmentIn-place rent on a like-for-like basis was EUR 5.88 per square metre as of 31 March 2020, 2.8 % up on the previous year.
In the free-financed segment which accounts for around 75 % of LEG’s portfolio, rents rose by 3.1 % to EUR 6.25 per square metre/month (on a like-for-like basis). The high-growth markets recorded a plus of 3.6 % to EUR 7.27 per square metre (on a like-for-like basis). In the stable markets, in-place rent increased slightly stronger by 3.7 % to an average of EUR 5.88 per square metre (on a like-for-like basis). In the higher-yielding markets an average increase of 1.8 % to 5.65 Euro per square metre (on a like-for-like basis) was achieved.
In January 2020, following the regular cost rent adjustment for rent-restricted apartments that is conducted every three years, the average rent in this segment increased by 1.7 % year on year or EUR 0.08 to EUR 4.87 per square metre (on a like-for-like basis).
The EPRA vacancy rate on a like-for-like basis was 3.4 % as at 31 March 2020, down 20 basis points on the previous year. With an occupancy rate of 98.1 % (on a like-for-like basis) the LEG portfolio in the high-growth markets was nearly fully let at the end of the reporting period. In the stable markets the occupancy rate was 96.6 % (on a like-for-like basis). In the higher-yielding markets, it stood at 94.4 % (on a like-for-like basis).
4 LEG IMMOBILIEN AG Q1 2020PORTFOLIO
T2
Portfolio segments – top 3 locations
Total portfolio
Change like-for-like basis
31.03.2020 31.03.2019
In-place rent in %
like-for-like
Vacancy rate basis points like-for-like
Number of LEG
apartments
Share of LEG-portfolio
in %
Living space
in sqm
In-place rent
€/sqm
EPRA vacancy rate
in %
Number of LEG
apartments
Share of LEG-portfolio
in %
Living space
in sqm
In-place rent
€/sqm
EPRA vacancy rate
in %
High-growth markets 41,886 30.7 2,780,644 6.62 2.0 39,593 29.6 2,634,401 6.47 2.1 3.1 – 20
District of Mettmann 8,479 6.2 589,480 6.81 2.1 8,480 6.3 589,587 6.51 1.8 4.6 30
Münster 6,199 4.6 412,118 6.71 1.0 6,125 4.6 406,737 6.63 0.8 1.4 20
Dusseldorf 5,425 4.0 352,530 7.93 2.8 5,300 4.0 343,996 7.72 4.3 3.4 – 150
Other locations 21,783 16.0 1,426,515 6.20 2.0 19,688 14.7 1,294,081 6.08 1.9 2.9 – 10
Stable markets 52,682 38.7 3,361,115 5.57 3.6 50,993 38.2 3,267,368 5.38 3.7 3.2 – 10
Dortmund 13,731 10.1 896,793 5.42 3.1 13,593 10.2 889,733 5.19 2.9 4.1 – 10
Moenchengladbach 6,442 4.7 408,268 5.94 2.2 6,444 4.8 408,347 5.72 2.4 3.7 – 10
Essen 3,372 2.5 217,538 5.59 3.5 3,372 2.5 217,532 5.41 3.7 3.3 – 30
Other locations 29,137 21.4 1,838,517 5.55 4.2 27,584 20.6 1,751,756 5.40 4.5 2.6 0
Higher yielding markets 41,649 30.6 2,525,841 5.40 5.7 43,051 32.2 2,646,294 5.26 6.4 1.8 – 20
District of Recklinghausen 8,965 6.6 543,898 5.31 4.2 9,860 7.4 618,032 5.10 5.9 2.0 0
Duisburg 6,350 4.7 384,297 5.80 4.7 6,800 5.1 421,472 5.60 5.7 2.3 – 90
Maerkisch District 4,608 3.4 284,459 5.31 4.6 4,566 3.4 281,362 5.18 4.2 1.5 40
Other locations 21,726 15.9 1,313,186 5.34 6.8 21,825 16.3 1,325,428 5.25 7.3 1.5 – 20
Total 136,217 100.0 8,667,599 5.86 3.6 133,637 100.0 8,548,062 5.69 3.9 2.8 – 20
5 LEG IMMOBILIEN AG Q1 2020PORTFOLIO
T3
Performance LEG PortfolioHigh-growth market Stable markets Higher yielding markets Total
31.03.2020 31.12.2019 31.03.2019 31.03.2020 31.12.2019 31.03.2019 31.03.2020 31.12.2019 31.03.2019 31.03.2020 31.12.2019 31.03.2019
Subsidised residential units
Units 11,954 11,412 11,134 14,278 14,076 14,361 8,154 8,091 8,945 34,386 33,579 34,558
Area qm 823,304 788,485 771,422 967,005 954,389 978,954 535,640 530,850 594,500 2,325,949 2,273,724 2,351,524
In-place rent €/qm 5.19 5.12 5.11 4.81 4.73 4.72 4.53 4.45 4.45 4.88 4.80 4.78
EPRA vacancy rate % 1.1 0.8 0.9 2.8 1.9 2.7 2.6 2.1 4.4 2.1 1.5 2.5
Free-financed residential units
Units 29,932 29,431 28,459 38,404 37,958 36,632 33,495 33,063 34,106 101,831 100,452 99,079
Area qm 1,957,340 1,921,058 1,862,979 2,394,110 2,370,630 2,288,414 1,990,201 1,967,967 2,051,794 6,341,650 6,259,655 6,196,538
In-place rent €/qm 7.23 7.23 7.04 5.88 5.82 5.67 5.64 5.62 5.50 6.23 6.20 6.04
EPRA vacancy rate % 2.2 2.0 2.4 3.9 3.2 4.1 6.3 5.9 6.8 3.9 3.5 4.3
Total residential units
Units 41,886 40,843 39,593 52,682 52,034 50,993 41,649 41,154 43,051 136,217 134,031 133,637
Area qm 2,780,644 2,709,543 2,634,401 3,361,115 3,325,019 3,267,368 2,525,841 2,498,817 2,646,294 8,667,599 8,533,379 8,548,062
In-place rent €/qm 6.62 6.61 6.47 5.57 5.50 5.38 5.40 5.36 5.26 5.86 5.82 5.69
EPRA vacancy rate % 2.0 1.7 2.1 3.6 2.9 3.7 5.7 5.2 6.4 3.6 3.1 3.9
Total commercial
Units 1,290 1,267 1,260
Area qm 214,484 208,941 211,248
Total parking
Units 34,868 34,268 33,639
Total other
Units 2,700 2,634 2,536
6 LEG IMMOBILIEN AG Q1 2020PORTFOLIO
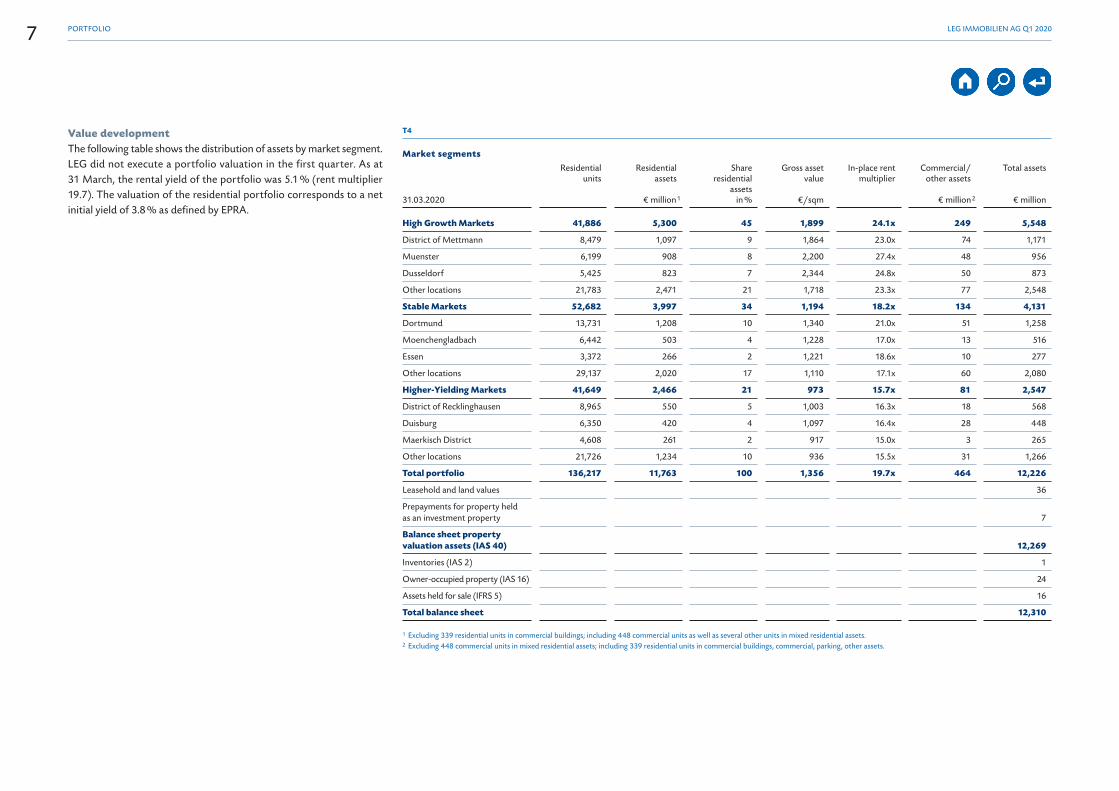
Value developmentThe following table shows the distribution of assets by market segment. LEG did not execute a portfolio valuation in the first quarter. As at 31 March, the rental yield of the portfolio was 5.1 % (rent multiplier 19.7). The valuation of the residential portfolio corresponds to a net initial yield of 3.8 % as defined by EPRA.
T4
Market segments
31.03.2020
Residential units
Residentialassets
€ million 1
Share residential
assets in %
Gross asset value
€/sqm
In-place rent multiplier
Commercial/other assets
€ million 2
Total assets
€ million
High Growth Markets 41,886 5,300 45 1,899 24.1x 249 5,548
District of Mettmann 8,479 1,097 9 1,864 23.0x 74 1,171
Muenster 6,199 908 8 2,200 27.4x 48 956
Dusseldorf 5,425 823 7 2,344 24.8x 50 873
Other locations 21,783 2,471 21 1,718 23.3x 77 2,548
Stable Markets 52,682 3,997 34 1,194 18.2x 134 4,131
Dortmund 13,731 1,208 10 1,340 21.0x 51 1,258
Moenchengladbach 6,442 503 4 1,228 17.0x 13 516
Essen 3,372 266 2 1,221 18.6x 10 277
Other locations 29,137 2,020 17 1,110 17.1x 60 2,080
Higher-Yielding Markets 41,649 2,466 21 973 15.7x 81 2,547
District of Recklinghausen 8,965 550 5 1,003 16.3x 18 568
Duisburg 6,350 420 4 1,097 16.4x 28 448
Maerkisch District 4,608 261 2 917 15.0x 3 265
Other locations 21,726 1,234 10 936 15.5x 31 1,266
Total portfolio 136,217 11,763 100 1,356 19.7x 464 12,226
Leasehold and land values 36
Prepayments for property held as an investment property 7
Balance sheet property valuation assets (IAS 40) 12,269
Inventories (IAS 2) 1
Owner-occupied property (IAS 16) 24
Assets held for sale (IFRS 5) 16
Total balance sheet 12,310
1 Excluding 339 residential units in commercial buildings; including 448 commercial units as well as several other units in mixed residential assets.2 Excluding 448 commercial units in mixed residential assets; including 339 residential units in commercial buildings, commercial, parking, other assets.
7 LEG IMMOBILIEN AG Q1 2020PORTFOLIO

Analysis of Net Assets, Financial Position and Results of Operations
Please see the > glossary in the 2019 Annual Report for a definition of individual key figures and terms.
Results of operations
T5
Condensed income statement
€ million
01.01.–31.03.2020
01.01.– 31.03.2019
Net rental and lease income 116.5 109.7
Net income from the disposal of investment properties – 0.3 – 0.3
Net income from the remeasurement of investment properties – 0.7 – 0.2
Net income from the disposal of real estate inventory – 1.4 – 0.7
Net income from other services 1.7 1.4
Administrative and other expenses – 10.3 – 9.5
Other income 0.0 0.1
Operating earnings 105.5 100.5
Interest income 0.0 0.0
Interest expenses – 22.6 – 25.6
Net income from investment securities and other equity investments 2.8 2.6
Net income from the fair value measurement of derivatives – 0.2 – 116.0
Net finance earnings – 20.0 – 139.0
Earnings before income taxes 85.5 – 38.5
Income taxes – 19.0 – 18.5
Net profit or loss for the period 66.5 – 57.0
Net rental and lease income increased primarily due to higher net cold rents by 6.2 % to EUR 116.5 million.
Adjusted EBITDA increased by 6.5 % to EUR 113.7 million. Adjusted EBITDA margin increased slightly from 73.0 % (comparative period) to 74.1 % in the reporting period.
In the reporting period, net income from the fair value measurement of derivatives resulted primarily from changes in the fair value of embedded derivatives from the convertible bond in the amount of EUR – 0.3 million (comparative period: EUR – 116.0 million).
Current income tax expenses of EUR – 1.1 million were recorded affecting net income in the reporting period.
Net rental and lease income
T6
Net rental and lease income
€ million 01.01.–
31.03.202001.01.–
31.03.2019
Net cold rent 153.5 146.3
Profit from operating expenses – 0.8 – 1.7
Maintenance for externally procured services – 12.9 – 13.8
Staff costs – 17.7 – 16.1
Allowances on rent receivables – 2.3 – 2.4
Depreciation and amortisation expenses – 2.5 – 2.0
Other – 0.8 – 0.6
Net rental and lease income 116.5 109.7
Net operating income margin in % 75.9 75.0
Non-recurring project costs – rental and lease 0.7 0.7
Depreciation 2.5 2.0
Adjusted net rental and lease income 119.7 112.4
Adjusted net operating income margin (in %) 78.0 76.8
In the reporting period, the LEG Group increased its net rental and lease income by EUR 6.8 million compared to the same period of the previous year. Main drivers of this development were the EUR 0.9 million lower maintenance for externally procured services and the EUR 7.2 million rise in net cold rents. In-place rent per square metre on a like-for-like basis rose by 2.8 % in the reporting period. This was countered by the increase in staff costs by EUR 1.6 million, which was mainly due to an increase in the number of hired workers and to tariff increase.
8 LEG IMMOBILIEN AG Q1 2020ANALYSIS OF NET ASSETS, FINANCIAL POSITION AND RESULTS OF OPERATIONS

Due to disproportionate development of net rental and lease income compared with the development of in-place rent the NOI margin increased from 75.0 % to 75.9 % in the reporting period.
The EPRA vacancy rate like-for-like as at 31 March 2020 stand slightly below the comparative period at 3.4 % (3.6 % as at 31. March 2019).
T7
EPRA vacancy rate
€ million 31.03.2020 31.03.2019
Rental value of vacant space – like-for-like 21.4 22.0
Rental value of vacant space – total 23.1 24.4
Rental value of the whole portfolio – like-for-like 619.8 605.7
Rental value of the whole portfolio – total 648.2 621.9
EPRA vacancy rate – like-for-like (in %) 3.4 3.6
EPRA vacancy rate – Total (in %) 3.6 3.9
The EPRA capex splits the capitalised expenditure of the reporting period in comparison to the comparative period in three components. On a like-for-like portfolio basis, the value-adding modernisation work as a result of the strategic investment programme surged by EUR 24.8 million to EUR 54.7 million in the reporting period. In the area of acquisitions, the upturn is due primarily to investments in portfolios already acquired before 2020. The increase in the Develop-ment area is attributable to the new construction project in Hilden.
T8
Epra capex
€ million01.01. –
31.03.202001.01. –
31.03.2019
Acquisitions 1.6 1.0
Development 1.2 0.4
Like-for-like portfolio 51.9 28.5
Capex 54.7 29.9
Due to the increase in value-adding modernisation and simultaneous decline in maintenance recognised as an expense, the capitalisation rate rose to 74.6 % in the reporting period (comparative period: 59,4 %). Despite increase in area of investment property compared to the same quarter of the previous year, in the reporting period total investments rose to EUR 8.25 per square metre (comparative period: EUR 5.74 per square metre) and without new construction activities to EUR 8.12 per square metre (comparative period: EUR 5.69 per square metre). T9
Maintenance and modernisation
€ million01.01. –
31.03.202001.01. –
31.03.2019
Maintenance expenses 18.6 20.4
thereof investment properties 18.5 20.1
Capital expenditure 54.7 29.9
thereof investment properties 54.2 28.9
Total investment 73.3 50.3
thereof investment properties 72.7 49.0
Area of investment properties in million sqm 8.88 8.77
Average investment per sqm (€/sqm) 8.25 5.74
Average investment per sqm without new construction activities (€/sqm) 8.12 5.69
Net income from the disposal of investment properties
T10
Net income from the disposal of investment properties
€ million01.01. –
31.03.202001.01. –
31.03.2019
Income from the disposal of investment 10.5 17.5
Carrying amount of the disposal of investment properties – 10.6 – 17.5
Costs of sales of investment properties – 0.2 – 0.3
Net income from the disposal of investment properties – 0.3 – 0.3
Disposals of investment properties decreased in the reporting period. Sales of investment property amounted to EUR 10.5 million and relate mainly to objects, which were reported as assets held for sale and were remeasured up to the agreed property value as of 31 December 2019.
9 LEG IMMOBILIEN AG Q1 2020ANALYSIS OF NET ASSETS, FINANCIAL POSITION AND RESULTS OF OPERATIONS

Net income from the disposal of real estate inventory
The disposal of the remaining properties of the former “Development” division continued as planned in the reporting period.
The remaining real estate inventory held as at 31 March 2020 amounted to EUR 0.4 million, of which EUR 0.4 million related to land under development.
Administrative and other expenses
T11
Administrative and other expenses
€ million01.01. –
31.03.202001.01. –
31.03.2019
Other operating expenses – 3.1 – 2.6
Staff costs – 5.6 – 5.6
Purchased services – 0.5 – 0.3
Depreciation and amortisation – 1.1 – 1.0
Administratve and other expenses – 10.3 – 9.5
Depreciation and amortisation 1.1 1.0
Non-recurring project costs and extraordinary and prior-period expenses 0.8 0.8
Adjusted administrative and other expenses – 8.4 – 7.7
The increase in other operating expenses is mainly attributable to increased costs for advice and insurance. The adjusted administrative expenses therefore increased in the first three months compared to the same period in the previous year.
Net finance earnings
T12
Net finance earnings
€ million01.01. –
31.03.202001.01. –
31.03.2019
Interest income 0.0 0.0
Interest expenses – 22.6 – 25.6
Net interest income – 22.6 – 25.6
Net income from other financial assets and other investments 2.8 2.6
Net income from the fair value measurement of derivatives – 0.2 – 116.0
Net finance earnings – 20.0 – 139.0
The interest expense decreased by EUR 3.0 million year on year to EUR 22.6 million. The decrease in interest expenses results mainly from the refinancing carried out in the 2019 financial year and the early conversion of the convertible bond in the 2019 financial year.
Year-on-year the average interest rate decreased to 1.46 % as at 31 March 2020 (1.62 % as at 31 March 2019) on an average term of 8.1 years (7.5 years as at 31 March 2019).
Dividends received from equity investments in non-consolidated and non-associated companies increased by EUR 0.2 million year-on-year to EUR 2.8 million in the reporting period.
In the reporting period, net income from the fair value measurement of derivatives resulted primarily from changes in the fair value of embedded derivatives from the convertible bond in the amount of EUR – 0.3 million (comparative period: EUR – 116.0 million).
Income tax expenses
T13
Income tax expenses
€ million01.01. –
31.03.202001.01. –
31.03.2019
Current tax expenses – 1.1 – 3.3
Deferred tax expenses – 17.9 – 15.2
Income tax expenses – 19.0 – 18.5
An effective Group tax rate of 21.7 % was assumed in the reporting period in accordance with Group tax planning (comparative period: 22.9 %).
Reconciliation to FFOFFO I is a key financial performance indicator of the LEG Group. The LEG Group distinguishes between FFO I (not including net income from the disposal of investment properties), FFO II (including net income from the disposal of investment properties) and AFFO (FFO I adjusted for capex). The calculation methods for these key figures can be found in the > glossary in the 2019 Annual Report.
10 LEG IMMOBILIEN AG Q1 2020ANALYSIS OF NET ASSETS, FINANCIAL POSITION AND RESULTS OF OPERATIONS
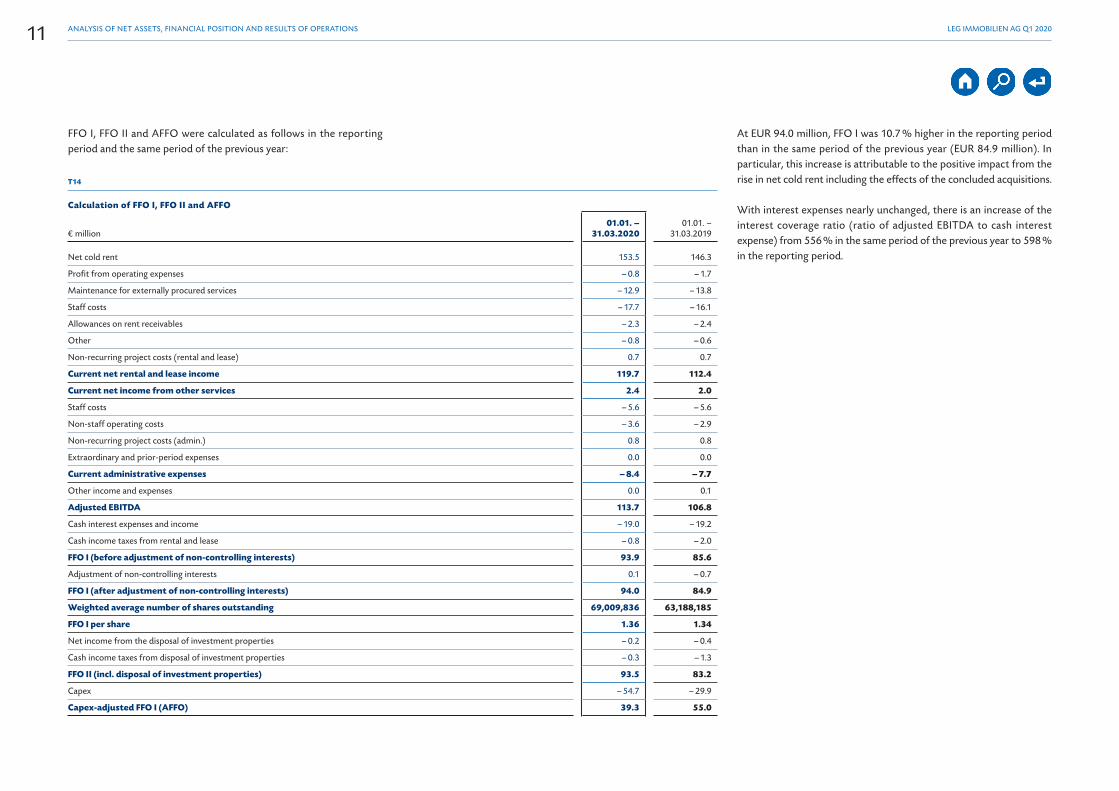
FFO I, FFO II and AFFO were calculated as follows in the reporting period and the same period of the previous year:
T14
Calculation of FFO I, FFO II and AFFO
€ million01.01. –
31.03.202001.01. –
31.03.2019
Net cold rent 153.5 146.3
Profit from operating expenses – 0.8 – 1.7
Maintenance for externally procured services – 12.9 – 13.8
Staff costs – 17.7 – 16.1
Allowances on rent receivables – 2.3 – 2.4
Other – 0.8 – 0.6
Non-recurring project costs (rental and lease) 0.7 0.7
Current net rental and lease income 119.7 112.4
Current net income from other services 2.4 2.0
Staff costs – 5.6 – 5.6
Non-staff operating costs – 3.6 – 2.9
Non-recurring project costs (admin.) 0.8 0.8
Extraordinary and prior-period expenses 0.0 0.0
Current administrative expenses – 8.4 – 7.7
Other income and expenses 0.0 0.1
Adjusted EBITDA 113.7 106.8
Cash interest expenses and income – 19.0 – 19.2
Cash income taxes from rental and lease – 0.8 – 2.0
FFO I (before adjustment of non-controlling interests) 93.9 85.6
Adjustment of non-controlling interests 0.1 – 0.7
FFO I (after adjustment of non-controlling interests) 94.0 84.9
Weighted average number of shares outstanding 69,009,836 63,188,185
FFO I per share 1.36 1.34
Net income from the disposal of investment properties – 0.2 – 0.4
Cash income taxes from disposal of investment properties – 0.3 – 1.3
FFO II (incl. disposal of investment properties) 93.5 83.2
Capex – 54.7 – 29.9
Capex-adjusted FFO I (AFFO) 39.3 55.0
At EUR 94.0 million, FFO I was 10.7 % higher in the reporting period than in the same period of the previous year (EUR 84.9 million). In particular, this increase is attributable to the positive impact from the rise in net cold rent including the effects of the concluded acquisitions.
With interest expenses nearly unchanged, there is an increase of the interest coverage ratio (ratio of adjusted EBITDA to cash interest expense) from 556 % in the same period of the previous year to 598 % in the reporting period.
11 LEG IMMOBILIEN AG Q1 2020ANALYSIS OF NET ASSETS, FINANCIAL POSITION AND RESULTS OF OPERATIONS
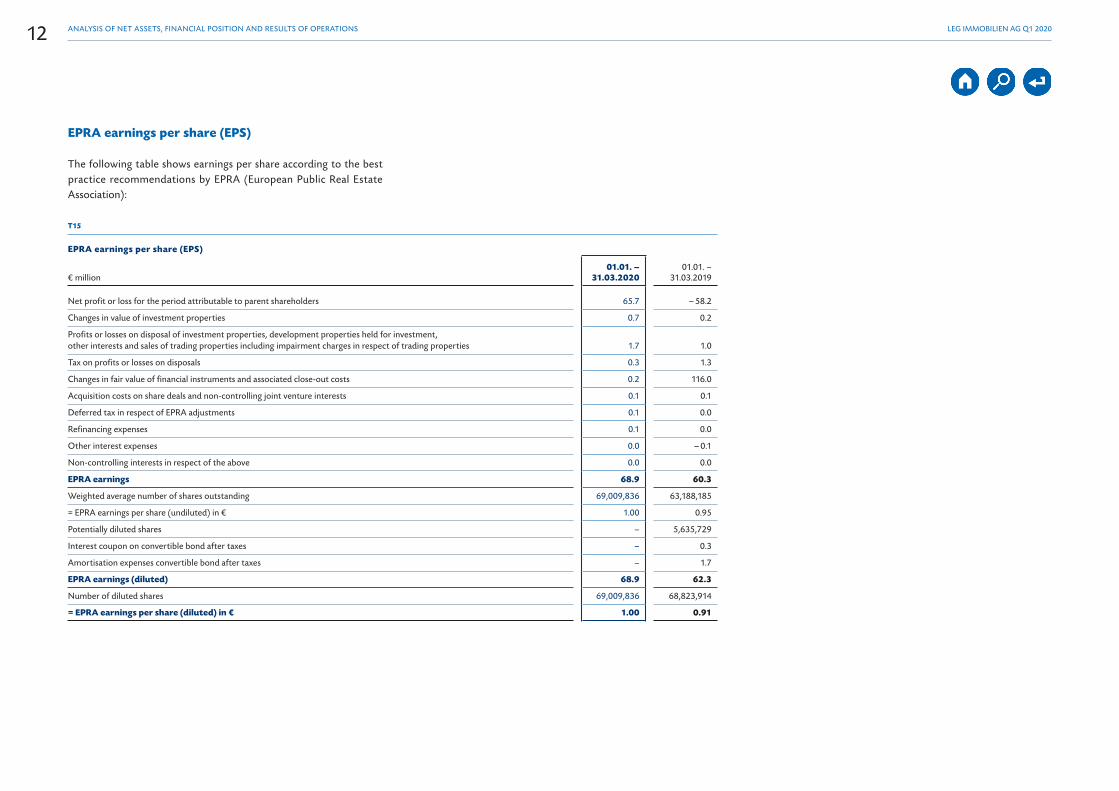
EPRA earnings per share (EPS)
The following table shows earnings per share according to the best practice recommendations by EPRA (European Public Real Estate Association):
T15
EPRA earnings per share (EPS)
€ million01.01. –
31.03.202001.01. –
31.03.2019
Net profit or loss for the period attributable to parent shareholders 65.7 – 58.2
Changes in value of investment properties 0.7 0.2
Profits or losses on disposal of investment properties, development properties held for investment, other interests and sales of trading properties including impairment charges in respect of trading properties 1.7 1.0
Tax on profits or losses on disposals 0.3 1.3
Changes in fair value of financial instruments and associated close-out costs 0.2 116.0
Acquisition costs on share deals and non-controlling joint venture interests 0.1 0.1
Deferred tax in respect of EPRA adjustments 0.1 0.0
Refinancing expenses 0.1 0.0
Other interest expenses 0.0 – 0.1
Non-controlling interests in respect of the above 0.0 0.0
EPRA earnings 68.9 60.3
Weighted average number of shares outstanding 69,009,836 63,188,185
= EPRA earnings per share (undiluted) in € 1.00 0.95
Potentially diluted shares – 5,635,729
Interest coupon on convertible bond after taxes – 0.3
Amortisation expenses convertible bond after taxes – 1.7
EPRA earnings (diluted) 68.9 62.3
Number of diluted shares 69,009,836 68,823,914
= EPRA earnings per share (diluted) in € 1.00 0.91
12 LEG IMMOBILIEN AG Q1 2020ANALYSIS OF NET ASSETS, FINANCIAL POSITION AND RESULTS OF OPERATIONS
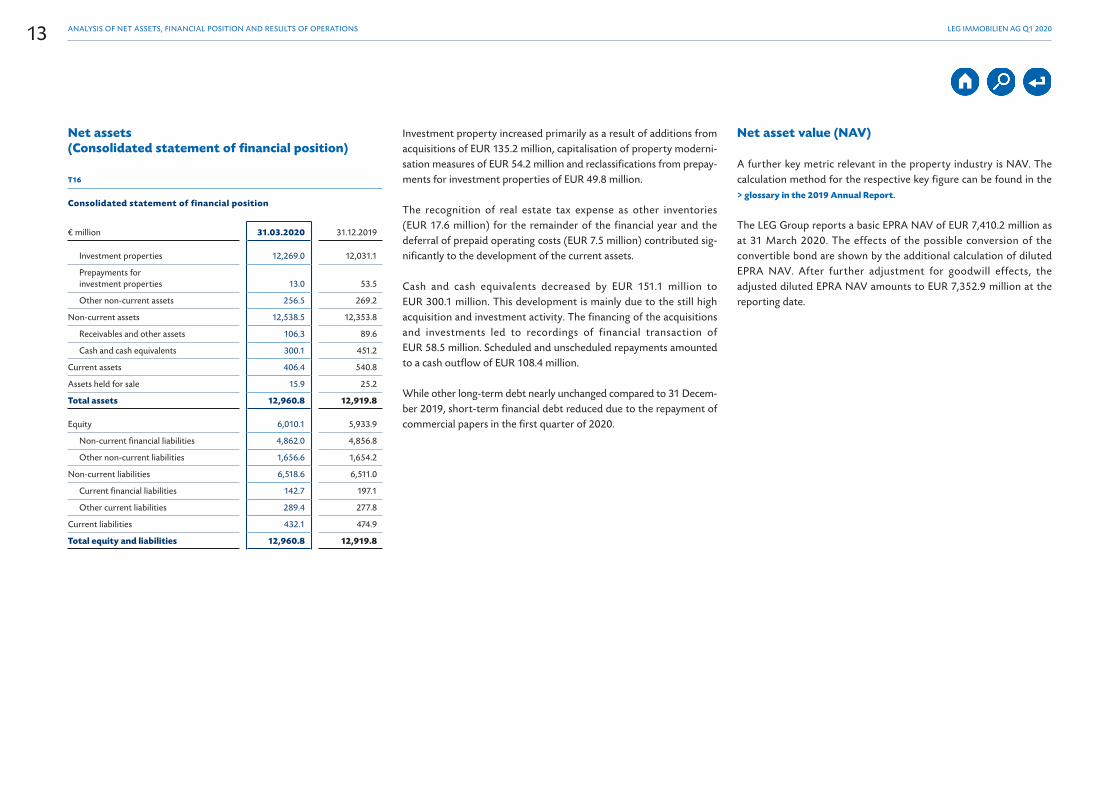
Net assets (Consolidated statement of financial position)
T16
Consolidated statement of financial position
€ million 31.03.2020 31.12.2019
Investment properties 12,269.0 12,031.1
Prepayments for investment properties 13.0 53.5
Other non-current assets 256.5 269.2
Non-current assets 12,538.5 12,353.8
Receivables and other assets 106.3 89.6
Cash and cash equivalents 300.1 451.2
Current assets 406.4 540.8
Assets held for sale 15.9 25.2
Total assets 12,960.8 12,919.8
Equity 6,010.1 5,933.9
Non-current financial liabilities 4,862.0 4,856.8
Other non-current liabilities 1,656.6 1,654.2
Non-current liabilities 6,518.6 6,511.0
Current financial liabilities 142.7 197.1
Other current liabilities 289.4 277.8
Current liabilities 432.1 474.9
Total equity and liabilities 12,960.8 12,919.8
Investment property increased primarily as a result of additions from acquisitions of EUR 135.2 million, capitalisation of property moderni-sation measures of EUR 54.2 million and reclassifications from prepay-ments for investment properties of EUR 49.8 million.
The recognition of real estate tax expense as other inventories (EUR 17.6 million) for the remainder of the financial year and the deferral of prepaid operating costs (EUR 7.5 million) contributed sig-nificantly to the development of the current assets.
Cash and cash equivalents decreased by EUR 151.1 million to EUR 300.1 million. This development is mainly due to the still high acquisition and investment activity. The financing of the acquisitions and investments led to recordings of financial transaction of EUR 58.5 million. Scheduled and unscheduled repayments amounted to a cash outflow of EUR 108.4 million.
While other long-term debt nearly unchanged compared to 31 Decem-ber 2019, short-term financial debt reduced due to the repayment of commercial papers in the first quarter of 2020.
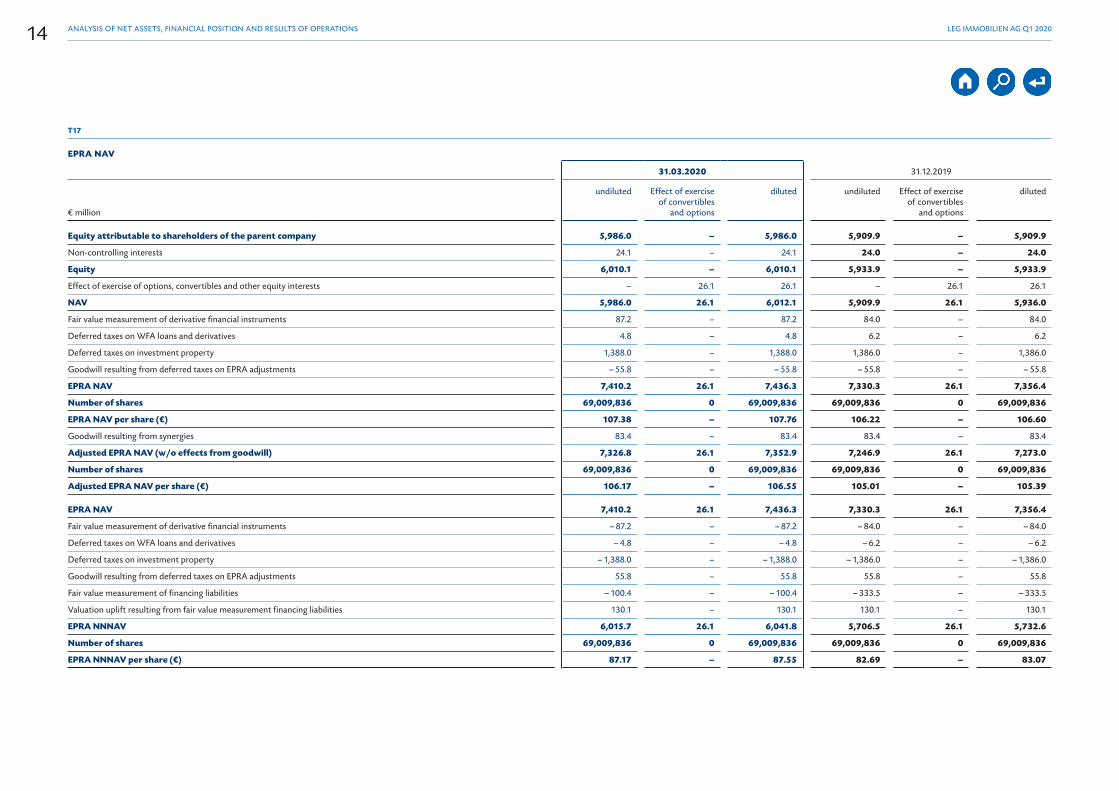
Net asset value (NAV)
A further key metric relevant in the property industry is NAV. The calculation method for the respective key figure can be found in the > glossary in the 2019 Annual Report.
The LEG Group reports a basic EPRA NAV of EUR 7,410.2 million as at 31 March 2020. The effects of the possible conversion of the convertible bond are shown by the additional calculation of diluted EPRA NAV. After further adjustment for goodwill effects, the adjusted diluted EPRA NAV amounts to EUR 7,352.9 million at the reporting date.
13 LEG IMMOBILIEN AG Q1 2020ANALYSIS OF NET ASSETS, FINANCIAL POSITION AND RESULTS OF OPERATIONS
T17
EPRA NAV
31.03.2020 31.12.2019
€ million
undiluted
Effect of exercise of convertibles
and options
diluted
undiluted
Effect of exercise of convertibles
and options
diluted
Equity attributable to shareholders of the parent company 5,986.0 – 5,986.0 5,909.9 – 5,909.9
Non-controlling interests 24.1 – 24.1 24.0 – 24.0
Equity 6,010.1 – 6,010.1 5,933.9 – 5,933.9
Effect of exercise of options, convertibles and other equity interests – 26.1 26.1 – 26.1 26.1
NAV 5,986.0 26.1 6,012.1 5,909.9 26.1 5,936.0
Fair value measurement of derivative financial instruments 87.2 – 87.2 84.0 – 84.0
Deferred taxes on WFA loans and derivatives 4.8 – 4.8 6.2 – 6.2
Deferred taxes on investment property 1,388.0 – 1,388.0 1,386.0 – 1,386.0
Goodwill resulting from deferred taxes on EPRA adjustments – 55.8 – – 55.8 – 55.8 – – 55.8
EPRA NAV 7,410.2 26.1 7,436.3 7,330.3 26.1 7,356.4
Number of shares 69,009,836 0 69,009,836 69,009,836 0 69,009,836
EPRA NAV per share (€) 107.38 – 107.76 106.22 – 106.60
Goodwill resulting from synergies 83.4 – 83.4 83.4 – 83.4
Adjusted EPRA NAV (w/o effects from goodwill) 7,326.8 26.1 7,352.9 7,246.9 26.1 7,273.0
Number of shares 69,009,836 0 69,009,836 69,009,836 0 69,009,836
Adjusted EPRA NAV per share (€) 106.17 – 106.55 105.01 – 105.39
EPRA NAV 7,410.2 26.1 7,436.3 7,330.3 26.1 7,356.4
Fair value measurement of derivative financial instruments – 87.2 – – 87.2 – 84.0 – – 84.0
Deferred taxes on WFA loans and derivatives – 4.8 – – 4.8 – 6.2 – – 6.2
Deferred taxes on investment property – 1,388.0 – – 1,388.0 – 1,386.0 – – 1,386.0
Goodwill resulting from deferred taxes on EPRA adjustments 55.8 – 55.8 55.8 – 55.8
Fair value measurement of financing liabilities – 100.4 – – 100.4 – 333.5 – – 333.5
Valuation uplift resulting from fair value measurement financing liabilities 130.1 – 130.1 130.1 – 130.1
EPRA NNNAV 6,015.7 26.1 6,041.8 5,706.5 26.1 5,732.6
Number of shares 69,009,836 0 69,009,836 69,009,836 0 69,009,836
EPRA NNNAV per share (€) 87.17 – 87.55 82.69 – 83.07
14 LEG IMMOBILIEN AG Q1 2020ANALYSIS OF NET ASSETS, FINANCIAL POSITION AND RESULTS OF OPERATIONS
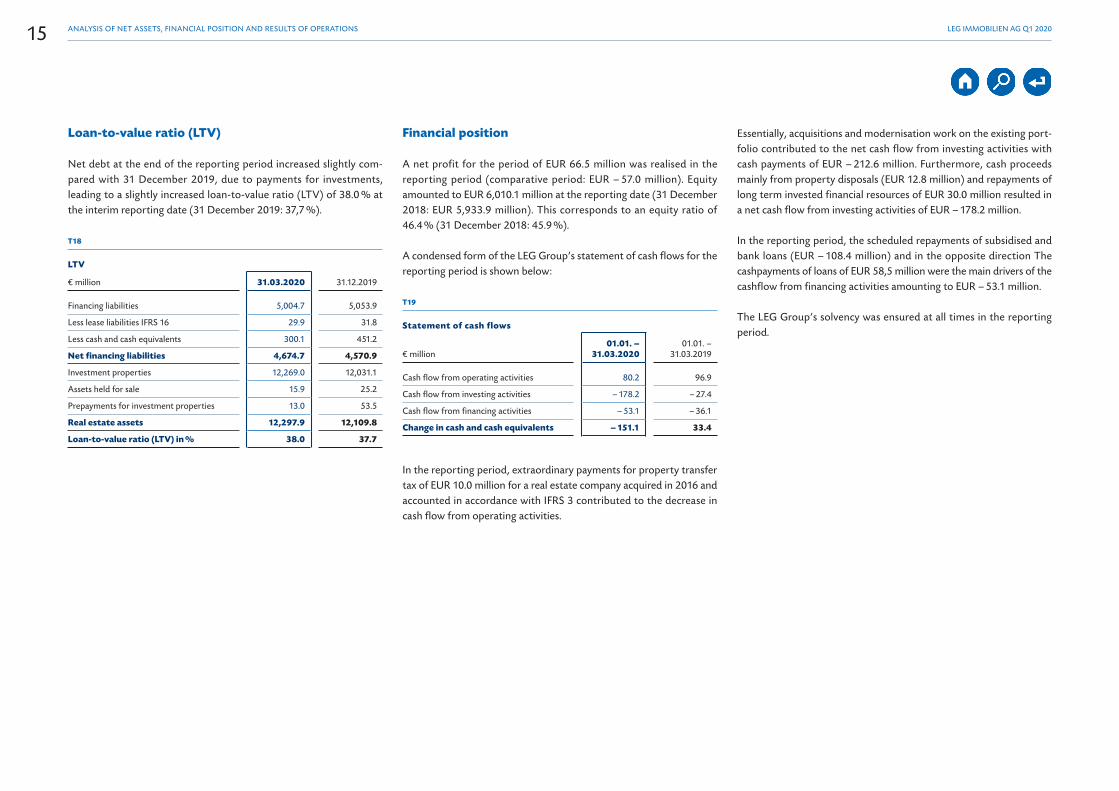
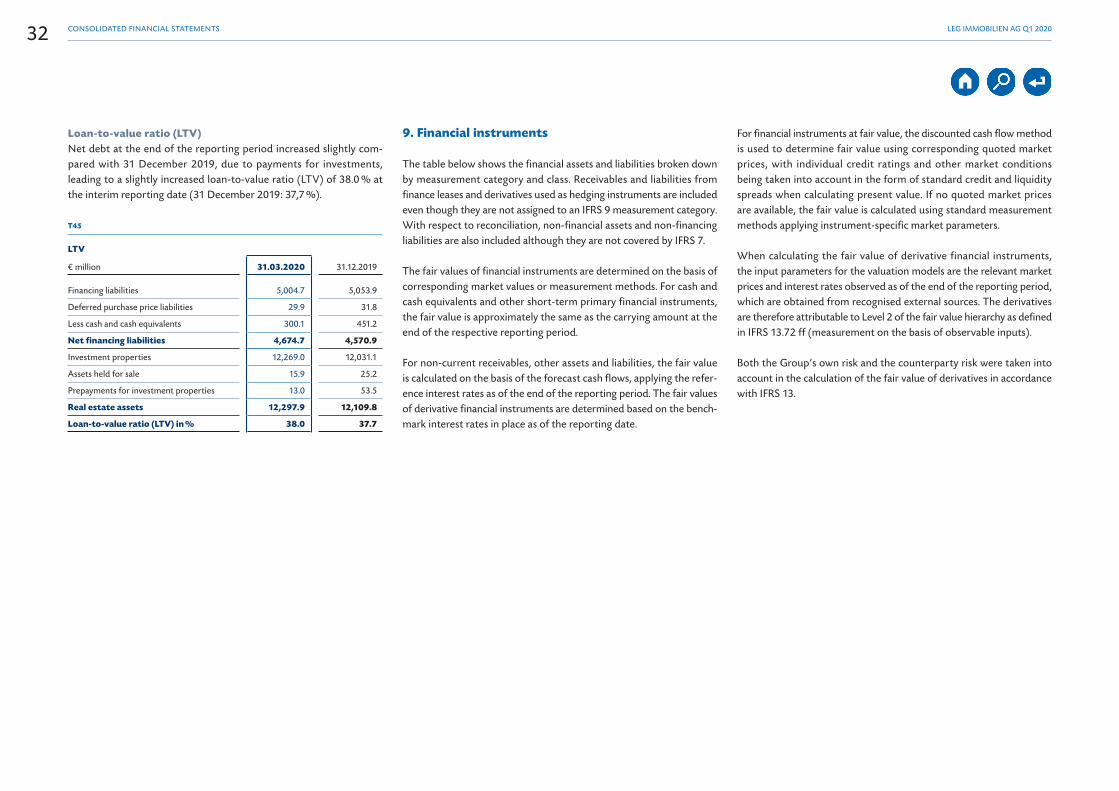
Loan-to-value ratio (LTV)
Net debt at the end of the reporting period increased slightly com-pared with 31 December 2019, due to payments for investments, leading to a slightly increased loan-to-value ratio (LTV) of 38.0 % at the interim reporting date (31 December 2019: 37,7 %).
T18
LTV
€ million 31.03.2020 31.12.2019
Financing liabilities 5,004.7 5,053.9
Less lease liabilities IFRS 16 29.9 31.8
Less cash and cash equivalents 300.1 451.2
Net financing liabilities 4,674.7 4,570.9
Investment properties 12,269.0 12,031.1
Assets held for sale 15.9 25.2
Prepayments for investment properties 13.0 53.5
Real estate assets 12,297.9 12,109.8
Loan-to-value ratio (LTV) in % 38.0 37.7
Financial position
A net profit for the period of EUR 66.5 million was realised in the reporting period (comparative period: EUR – 57.0 million). Equity amounted to EUR 6,010.1 million at the reporting date (31 December 2018: EUR 5,933.9 million). This corresponds to an equity ratio of 46.4 % (31 December 2018: 45.9 %).
A condensed form of the LEG Group’s statement of cash flows for the reporting period is shown below:
T19
Statement of cash flows
€ million 01.01. –
31.03.202001.01. –
31.03.2019
Cash flow from operating activities 80.2 96.9
Cash flow from investing activities – 178.2 – 27.4
Cash flow from financing activities – 53.1 – 36.1
Change in cash and cash equivalents – 151.1 33.4
In the reporting period, extraordinary payments for property transfer tax of EUR 10.0 million for a real estate company acquired in 2016 and accounted in accordance with IFRS 3 contributed to the decrease in cash flow from operating activities.
Essentially, acquisitions and modernisation work on the existing port-folio contributed to the net cash flow from investing activities with cash payments of EUR – 212.6 million. Furthermore, cash proceeds mainly from property disposals (EUR 12.8 million) and repayments of long term invested financial resources of EUR 30.0 million resulted in a net cash flow from investing activities of EUR – 178.2 million.
In the reporting period, the scheduled repayments of subsidised and bank loans (EUR – 108.4 million) and in the opposite direction The cashpayments of loans of EUR 58,5 million were the main drivers of the cashflow from financing activities amounting to EUR – 53.1 million.
The LEG Group’s solvency was ensured at all times in the reporting period.
15 LEG IMMOBILIEN AG Q1 2020ANALYSIS OF NET ASSETS, FINANCIAL POSITION AND RESULTS OF OPERATIONS
Risk and opportunity report
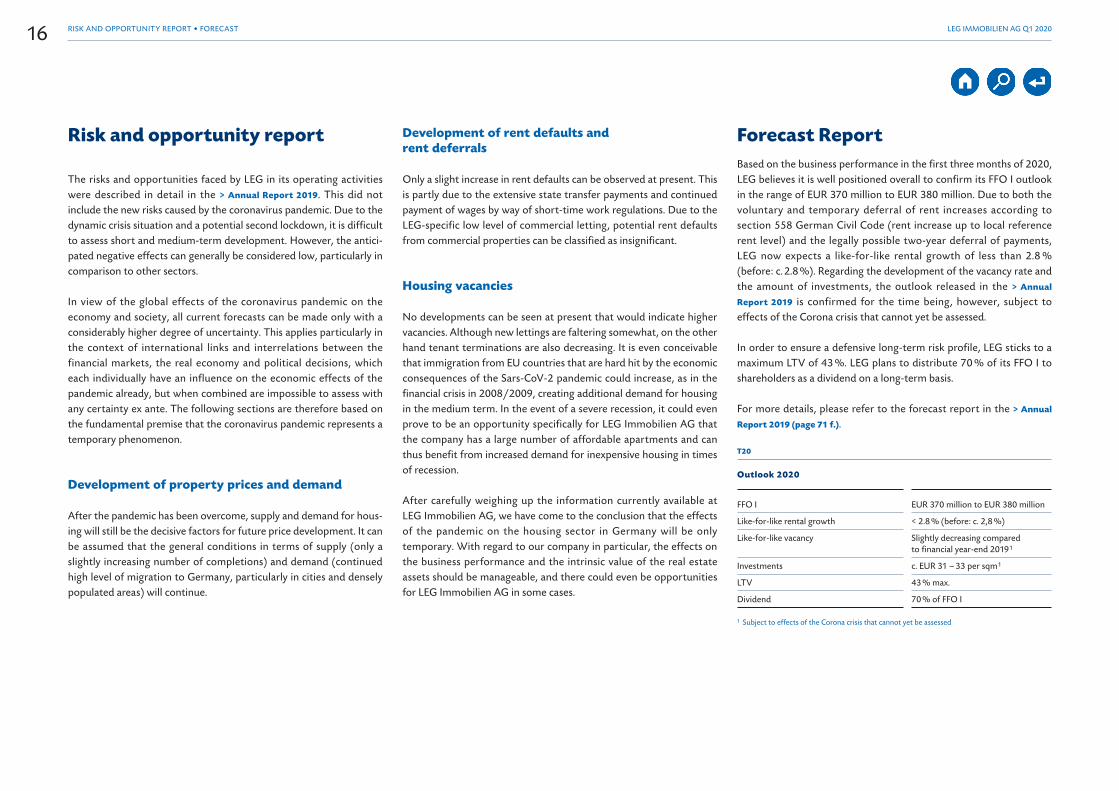
The risks and opportunities faced by LEG in its operating activities were described in detail in the > Annual Report 2019. This did not include the new risks caused by the coronavirus pandemic. Due to the dynamic crisis situation and a potential second lockdown, it is difficult to assess short and medium-term development. However, the antici-pated negative effects can generally be considered low, particularly in comparison to other sectors.
In view of the global effects of the coronavirus pandemic on the economy and society, all current forecasts can be made only with a considerably higher degree of uncertainty. This applies particularly in the context of international links and interrelations between the financial markets, the real economy and political decisions, which each individually have an influence on the economic effects of the pandemic already, but when combined are impossible to assess with any certainty ex ante. The following sections are therefore based on the fundamental premise that the coronavirus pandemic represents a temporary phenomenon.
Development of property prices and demand
After the pandemic has been overcome, supply and demand for hous-ing will still be the decisive factors for future price development. It can be assumed that the general conditions in terms of supply (only a slightly increasing number of completions) and demand (continued high level of migration to Germany, particularly in cities and densely populated areas) will continue.
Development of rent defaults and rent deferrals
Only a slight increase in rent defaults can be observed at present. This is partly due to the extensive state transfer payments and continued payment of wages by way of short-time work regulations. Due to the LEG-specific low level of commercial letting, potential rent defaults from commercial properties can be classified as insignificant.
Housing vacancies
No developments can be seen at present that would indicate higher vacancies. Although new lettings are faltering somewhat, on the other hand tenant terminations are also decreasing. It is even conceivable that immigration from EU countries that are hard hit by the economic consequences of the Sars-CoV-2 pandemic could increase, as in the financial crisis in 2008/2009, creating additional demand for housing in the medium term. In the event of a severe recession, it could even prove to be an opportunity specifically for LEG Immobilien AG that the company has a large number of affordable apartments and can thus benefit from increased demand for inexpensive housing in times of recession.
After carefully weighing up the information currently available at LEG Immobilien AG, we have come to the conclusion that the effects of the pandemic on the housing sector in Germany will be only temporary. With regard to our company in particular, the effects on the business performance and the intrinsic value of the real estate assets should be manageable, and there could even be opportunities for LEG Immobilien AG in some cases.
Forecast ReportBased on the business performance in the first three months of 2020, LEG believes it is well positioned overall to confirm its FFO I outlook in the range of EUR 370 million to EUR 380 million. Due to both the voluntary and temporary deferral of rent increases according to section 558 German Civil Code (rent increase up to local reference rent level) and the legally possible two-year deferral of payments, LEG now expects a like-for-like rental growth of less than 2.8 % (before: c. 2.8 %). Regarding the development of the vacancy rate and the amount of investments, the outlook released in the > Annual
Report 2019 is confirmed for the time being, however, subject to effects of the Corona crisis that cannot yet be assessed.
In order to ensure a defensive long-term risk profile, LEG sticks to a maximum LTV of 43 %. LEG plans to distribute 70 % of its FFO I to shareholders as a dividend on a long-term basis.
For more details, please refer to the forecast report in the > Annual
Report 2019 (page 71 f.).
T20
Outlook 2020
FFO I EUR 370 million to EUR 380 million
Like-for-like rental growth < 2.8 % (before: c. 2,8 %)
Like-for-like vacancy Slightly decreasing compared to financial year-end 2019 1
Investments c. EUR 31 – 33 per sqm 1
LTV 43 % max.
Dividend 70 % of FFO I
1 Subject to effects of the Corona crisis that cannot yet be assessed
16 LEG IMMOBILIEN AG Q1 2020RISK AND OPPORTUNITY REPORT • FORECAST
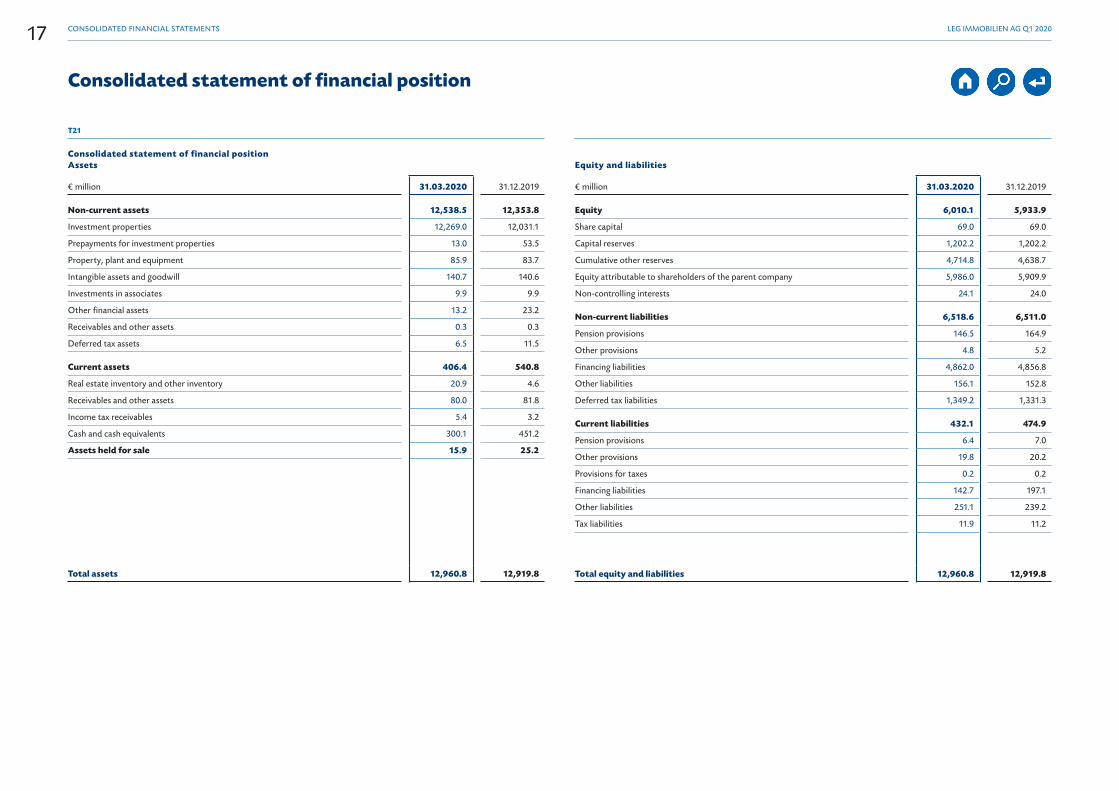
T21
Consolidated statement of financial position Assets
€ million 31.03.2020 31.12.2019
Non-current assets 12,538.5 12,353.8
Investment properties 12,269.0 12,031.1
Prepayments for investment properties 13.0 53.5
Property, plant and equipment 85.9 83.7
Intangible assets and goodwill 140.7 140.6
Investments in associates 9.9 9.9
Other financial assets 13.2 23.2
Receivables and other assets 0.3 0.3
Deferred tax assets 6.5 11.5
Current assets 406.4 540.8
Real estate inventory and other inventory 20.9 4.6
Receivables and other assets 80.0 81.8
Income tax receivables 5.4 3.2
Cash and cash equivalents 300.1 451.2
Assets held for sale 15.9 25.2
Total assets 12,960.8 12,919.8
Equity and liabilities
€ million 31.03.2020 31.12.2019
Equity 6,010.1 5,933.9
Share capital 69.0 69.0
Capital reserves 1,202.2 1,202.2
Cumulative other reserves 4,714.8 4,638.7
Equity attributable to shareholders of the parent company 5,986.0 5,909.9
Non-controlling interests 24.1 24.0
Non-current liabilities 6,518.6 6,511.0
Pension provisions 146.5 164.9
Other provisions 4.8 5.2
Financing liabilities 4,862.0 4,856.8
Other liabilities 156.1 152.8
Deferred tax liabilities 1,349.2 1,331.3
Current liabilities 432.1 474.9
Pension provisions 6.4 7.0
Other provisions 19.8 20.2
Provisions for taxes 0.2 0.2
Financing liabilities 142.7 197.1
Other liabilities 251.1 239.2
Tax liabilities 11.9 11.2
Total equity and liabilities 12,960.8 12,919.8
Consolidated statement of financial position
17 LEG IMMOBILIEN AG Q1 2020CONSOLIDATED FINANCIAL STATEMENTS
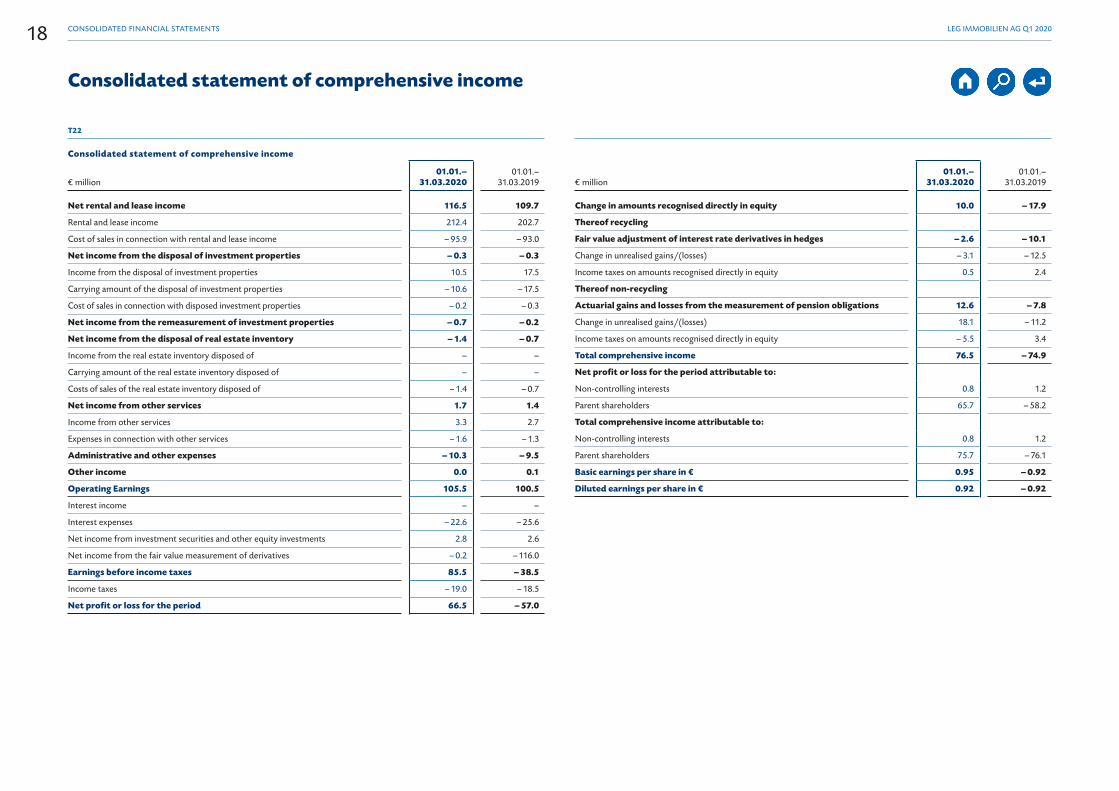
T22
Consolidated statement of comprehensive income
€ million
01.01.–31.03.2020
01.01.– 31.03.2019
Net rental and lease income 116.5 109.7
Rental and lease income 212.4 202.7
Cost of sales in connection with rental and lease income – 95.9 – 93.0
Net income from the disposal of investment properties – 0.3 – 0.3
Income from the disposal of investment properties 10.5 17.5
Carrying amount of the disposal of investment properties – 10.6 – 17.5
Cost of sales in connection with disposed investment properties – 0.2 – 0.3
Net income from the remeasurement of investment properties – 0.7 – 0.2
Net income from the disposal of real estate inventory – 1.4 – 0.7
Income from the real estate inventory disposed of – –
Carrying amount of the real estate inventory disposed of – –
Costs of sales of the real estate inventory disposed of – 1.4 – 0.7
Net income from other services 1.7 1.4
Income from other services 3.3 2.7
Expenses in connection with other services – 1.6 – 1.3
Administrative and other expenses – 10.3 – 9.5
Other income 0.0 0.1
Operating Earnings 105.5 100.5
Interest income – –
Interest expenses – 22.6 – 25.6
Net income from investment securities and other equity investments 2.8 2.6
Net income from the fair value measurement of derivatives – 0.2 – 116.0
Earnings before income taxes 85.5 – 38.5
Income taxes – 19.0 – 18.5
Net profit or loss for the period 66.5 – 57.0
€ million
01.01.–31.03.2020
01.01.– 31.03.2019
Change in amounts recognised directly in equity 10.0 – 17.9
Thereof recycling
Fair value adjustment of interest rate derivatives in hedges – 2.6 – 10.1
Change in unrealised gains/(losses) – 3.1 – 12.5
Income taxes on amounts recognised directly in equity 0.5 2.4
Thereof non-recycling
Actuarial gains and losses from the measurement of pension obligations 12.6 – 7.8
Change in unrealised gains/(losses) 18.1 – 11.2
Income taxes on amounts recognised directly in equity – 5.5 3.4
Total comprehensive income 76.5 – 74.9
Net profit or loss for the period attributable to:
Non-controlling interests 0.8 1.2
Parent shareholders 65.7 – 58.2
Total comprehensive income attributable to:
Non-controlling interests 0.8 1.2
Parent shareholders 75.7 – 76.1
Basic earnings per share in € 0.95 – 0.92
Diluted earnings per share in € 0.92 – 0.92
Consolidated statement of comprehensive income
18 LEG IMMOBILIEN AG Q1 2020CONSOLIDATED FINANCIAL STATEMENTS
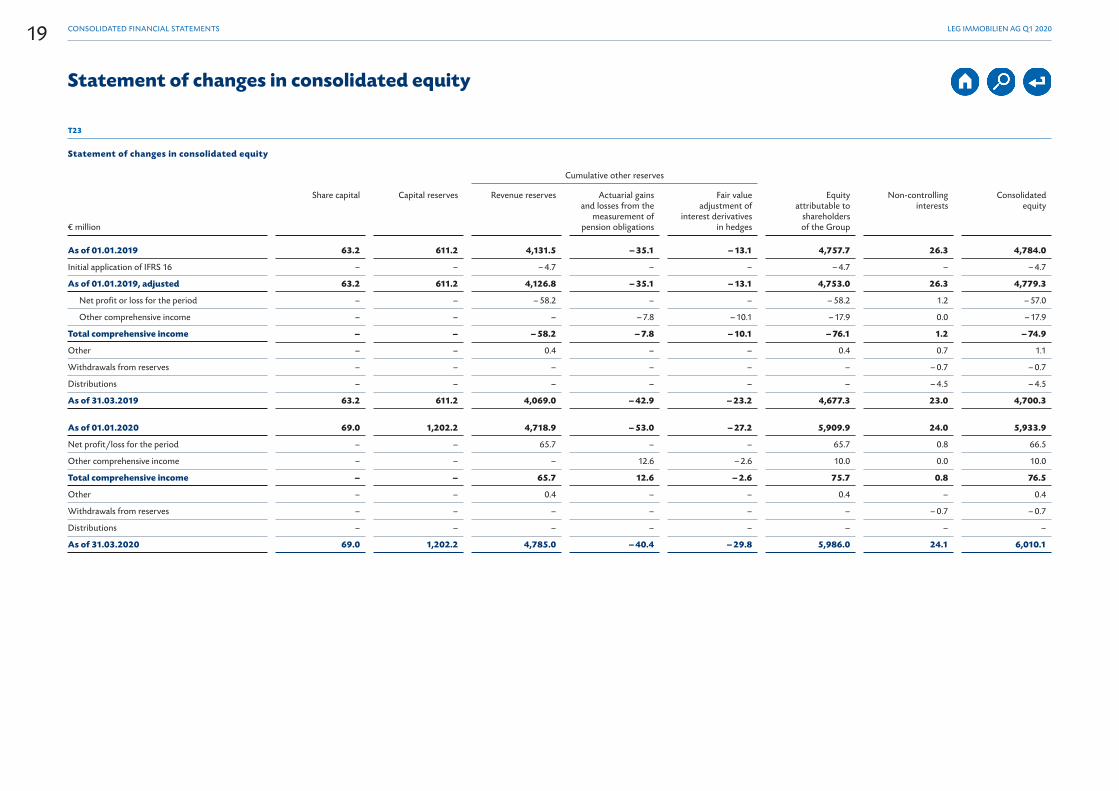
T23
Statement of changes in consolidated equity
Cumulative other reserves
€ million
Share capital
Capital reserves
Revenue reserves
Actuarial gains and losses from the
measurement of pension obligations
Fair value adjustment of
interest derivatives in hedges
Equity attributable to
shareholders of the Group
Non-controlling interests
Consolidated equity
As of 01.01.2019 63.2 611.2 4,131.5 – 35.1 – 13.1 4,757.7 26.3 4,784.0
Initial application of IFRS 16 – – – 4.7 – – – 4.7 – – 4.7
As of 01.01.2019, adjusted 63.2 611.2 4,126.8 – 35.1 – 13.1 4,753.0 26.3 4,779.3
Net profit or loss for the period – – – 58.2 – – – 58.2 1.2 – 57.0
Other comprehensive income – – – – 7.8 – 10.1 – 17.9 0.0 – 17.9
Total comprehensive income – – – 58.2 – 7.8 – 10.1 – 76.1 1.2 – 74.9
Other – – 0.4 – – 0.4 0.7 1.1
Withdrawals from reserves – – – – – – – 0.7 – 0.7
Distributions – – – – – – – 4.5 – 4.5
As of 31.03.2019 63.2 611.2 4,069.0 – 42.9 – 23.2 4,677.3 23.0 4,700.3
As of 01.01.2020 69.0 1,202.2 4,718.9 – 53.0 – 27.2 5,909.9 24.0 5,933.9
Net profit/loss for the period – – 65.7 – – 65.7 0.8 66.5
Other comprehensive income – – – 12.6 – 2.6 10.0 0.0 10.0
Total comprehensive income – – 65.7 12.6 – 2.6 75.7 0.8 76.5
Other – – 0.4 – – 0.4 – 0.4
Withdrawals from reserves – – – – – – – 0.7 – 0.7
Distributions – – – – – – – –
As of 31.03.2020 69.0 1,202.2 4,785.0 – 40.4 – 29.8 5,986.0 24.1 6,010.1
Statement of changes in consolidated equity
19 LEG IMMOBILIEN AG Q1 2020CONSOLIDATED FINANCIAL STATEMENTS

T24
Consolidated statement of cash flows
€ million
01.01. – 31.03.2020
01.01. – 31.03.2019
Operating earnings 105.5 100.5
Depreciation on property, plant and equipment and amortisation on intangible assets 4.3 3.5
(Gains)/Losses from the measurement of investment properties 0.7 0.0
(Gains)/Losses from the disposal of assets held for sale and investment properties 0.0 0.2
(Gains)/Losses from the disposal of intangible assets and property, plant and equipment 0.0 0.0
(Decrease)/Increase in pension provisions and other non-current provisions – 1.3 – 1.1
Other non-cash income and expenses 2.0 2.0
(Decrease)/Increase in receivables, inventories and other assets – 36.0 – 25.3
Decrease/(Increase) in liabilities (not including financing liabilities) and provisions 26.6 37.7
Interest paid – 19.0 – 19.2
Interest received 0.0 0.0
Received income from investments 0.0 0.0
Taxes received 0.1 0.0
Taxes paid – 2.7 – 1.4
Net cash from/(used in) operating activities 80.2 96.9
Cash flow from investing activities
Investments in investment properties – 212.6 – 43.8
Proceeds from disposals of non-current assets held for sale and investment properties 12.8 17.6
Investments in intangible assets and property, plant and equipment – 8.4 – 1.2
Change of cash investment in securities 30.0 0.0
Net cash from/(used in) investing activities – 178.2 – 27.4
€ million
01.01. – 31.03.2020
01.01. – 31.03.2019
Cash flow from financing activities
Borrowing of bank loans 58.5 127.5
Repayment of bank loans – 108.4 – 156.9
Repayment of lease liabilities – 3.2 – 2.9
Other proceeds 0.0 0.7
Distribution and withdrawal from reserves of non-controlling interest 0.0 – 4.5
Net cash from/(used in) financing activities – 53.1 – 36.1
Change in cash and cash equivalents – 151.1 33.4
Cash and cash equivalents at beginning of period 451.2 233.6
Cash and cash equivalents at end of period 300.1 267.0
Composition of cash and cash equivalents
Cash in hand, bank balances 300.1 267.0
Cash and cash equivalents at end of period 300.1 267.0
Consolidated statement of cash flows
20 LEG IMMOBILIEN AG Q1 2020CONSOLIDATED FINANCIAL STATEMENTS
1. Basic information on the Group
LEG Immobilien AG, Dusseldorf (hereinafter: “LEG Immo”), its sub-sidiary LEG NRW GmbH, Dusseldorf (hereinafter: “LEG”) and the subsidiaries of the latter company (hereinafter referred to collectively as the “LEG Group”) are among the largest residential companies in Germany. The LEG Group held a portfolio of 137,507 (31 March 2019: 134,897) residential and commercial units on 31 March 2020 (137,318 (31 March 2019: 134,787) units excluding IFRS 5 objects).
LEG Immo and its subsidiaries engage in three core activities as an integrated property company: the optimisation of the core business, the expansion of the value chain as well as the portfolio strengthening.
The interim consolidated financial statements are prepared in euros. Unless stated otherwise, all figures have been rounded to millions of Euro (EUR million). For technical reasons, tables and references can include rounded figures that differ from the exact mathematical values.
2. Interim consolidated financial statements
LEG Immo prepared the interim consolidated financial statements in accordance with the provisions of the International Financial Report-ing Standards (IFRS) for interim reporting, as endorsed in the EU, and their interpretation by the International Financial Reporting Interpre-tations Committee (IFRIC). Based on the option under IAS 34.10, the notes to the financial statements were presented in a condensed form.
The condensed interim consolidated financial statements have not been subjected to an audit or an audit review. The LEG Group primarily generates income from the rental and letting of investment properties. Rental and lease business, in essence, is unaffected by seasonal and cyclical influences.
3. Accounting policies
The accounting policies applied in the interim consolidated financial statements of the LEG Immo are the same as those presented in the IFRS consolidated financial statements of LEG Immo as of 31 Decem-ber 2019. These interim consolidated financial statements as at 31 March 2020 should therefore be read in conjunction with the con-solidated financial statements as at 31 December 2019.
The LEG Immo has fully applied the new standards and interpre-tations that are mandatory from 1 January 2020. The amendments to IFRS 3 will be considered in future business combinations. The amendments to the Interest Rate Benchmark Reform of IFRS 9, IAS 39 and IFRS 7 have no significant impact on the measurement of derivates used in hedge accounting. Within the prospective effective-ness of the hedging relationship it is assumed that the underlying ref-erence rate is not affected from the replacement of the IBOR reform.
4. Changes in the Group
There were no changes in the consolidation group as of 31 March 2020.
5. Judgements and estimates
The preparation of interim consolidated financial statements in accordance with IFRS requires assumptions and estimates to be made that affect the recognition of assets and liabilities, income and expenses and the disclosure of contingent liabilities. These assumptions and estimates particularly relate to the measurement of investment prop-erties, the recognition and measurement of pension provisions, the recognition and measurement of other provisions, the measurement of financing liabilities, and the eligibility for recognition of deferred tax assets.
Although the management believes that the assumption and esti-mates used are appropriate, any unforeseeable changes in these assumptions could impact the net assets, financial position and results of operations. The Covid-19 situation has been considered by judge-ments. There were no significant impact. Moreover, there were no triggering events for the conduct of an impairment test on goodwill during the year.
In view of the global effects of the coronavirus pandemic on the economy and society, all current forecasts can be made only with a considerably higher degree of uncertainty. This applies particularly in the context of international links and interrelations between the financial markets, the real economy and political decisions, which each individually have an influence on the economic effects of the pandemic already, but when combined are impossible to assess with any certainty ex ante. The following sections are therefore based on the fundamental premise that the coronavirus pandemic represents a temporary phenomenon.
Selected notes on the IFRS interim consolidated financial statements as at 31 March 2020
21 LEG IMMOBILIEN AG Q1 2020CONSOLIDATED FINANCIAL STATEMENTS

Development of property prices and demandAfter the pandemic has been overcome, supply and demand for hous-ing will still be the decisive factors for future price development. It can be assumed that the general conditions in terms of supply (only a slightly increasing number of completions) and demand (continued high level of migration to Germany, particularly in cities and densely populated areas) will continue.
Development of rent defaults and rent deferrals Only a slight increase in rent defaults can be observed at present. This is partly due to the extensive state transfer payments and continued payment of wages by way of short-time work regulations. Due to the LEG-specific low level of commercial letting, potential rent defaults from commercial properties can be classified as insignificant.
Housing vacanciesNo developments can be seen at present that would indicate higher vacancies. Although new lettings are faltering somewhat, on the other hand tenant terminations are also decreasing. It is even conceivable that immigration from EU countries that are hard hit by the economic consequences of the Sars-CoV-2 pandemic could increase, as in the financial crisis in 2008/2009, creating additional demand for housing in the medium term. In the event of a severe recession, it could even prove to be an opportunity specifically for LEG Immobilien AG that the company has a large number of affordable apartments and can thus benefit from increased demand for inexpensive housing in times of recession.
After carefully weighing up the information currently available at LEG Immobilien AG, we have come to the conclusion that the effects of the pandemic on the housing sector in Germany will be only temporary. With regard to our company in particular, the effects on the business performance and the intrinsic value of the real estate assets should be manageable, and there could even be opportunities for LEG Immobilien AG in some cases.
For further information, please refer to the > consolidated financial
statements as at 31 December 2019.
22 LEG IMMOBILIEN AG Q1 2020CONSOLIDATED FINANCIAL STATEMENTS
6. Selected notes to the consolidated statement of financial position
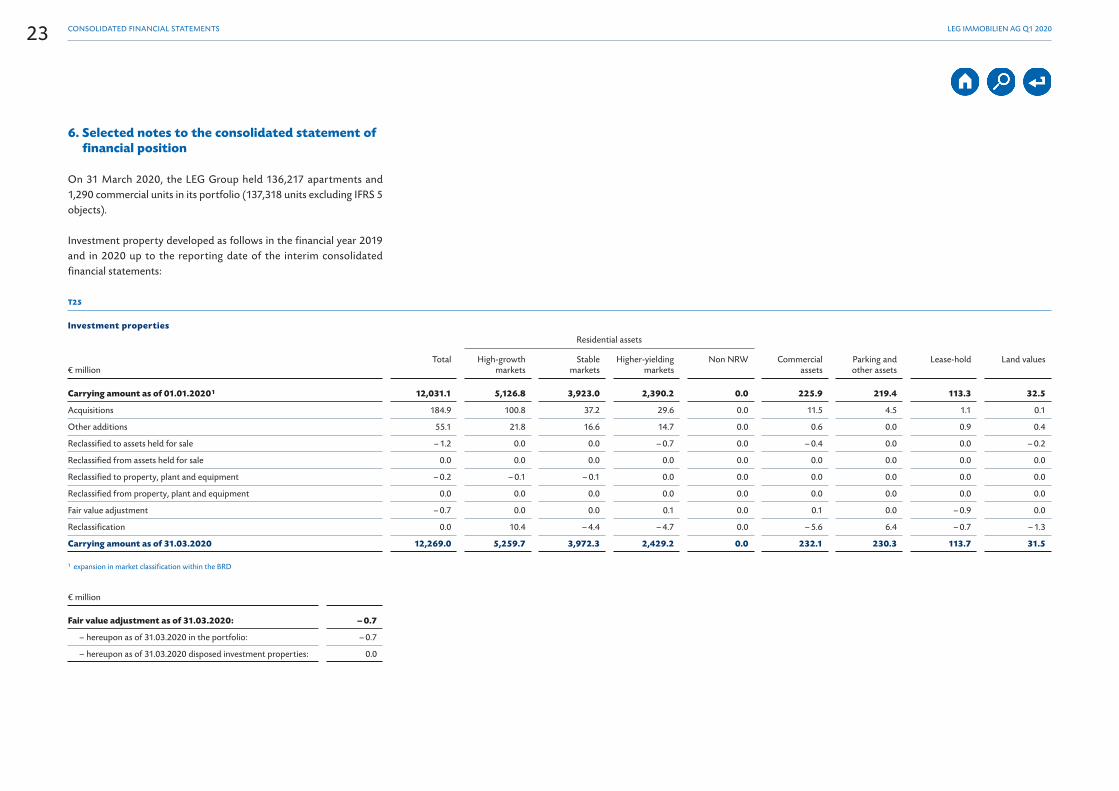
On 31 March 2020, the LEG Group held 136,217 apartments and 1,290 commercial units in its portfolio (137,318 units excluding IFRS 5 objects).
Investment property developed as follows in the financial year 2019 and in 2020 up to the reporting date of the interim consolidated financial statements:
T25
Investment properties
Residential assets
€ million Total High-growth
marketsStable
marketsHigher-yielding
marketsNon NRW Commercial
assetsParking and other assets
Lease-hold Land values
Carrying amount as of 01.01.2020 1 12,031.1 5,126.8 3,923.0 2,390.2 0.0 225.9 219.4 113.3 32.5
Acquisitions 184.9 100.8 37.2 29.6 0.0 11.5 4.5 1.1 0.1
Other additions 55.1 21.8 16.6 14.7 0.0 0.6 0.0 0.9 0.4
Reclassified to assets held for sale – 1.2 0.0 0.0 – 0.7 0.0 – 0.4 0.0 0.0 – 0.2
Reclassified from assets held for sale 0.0 0.0 0.0 0.0 0.0 0.0 0.0 0.0 0.0
Reclassified to property, plant and equipment – 0.2 – 0.1 – 0.1 0.0 0.0 0.0 0.0 0.0 0.0
Reclassified from property, plant and equipment 0.0 0.0 0.0 0.0 0.0 0.0 0.0 0.0 0.0
Fair value adjustment – 0.7 0.0 0.0 0.1 0.0 0.1 0.0 – 0.9 0.0
Reclassification 0.0 10.4 – 4.4 – 4.7 0.0 – 5.6 6.4 – 0.7 – 1.3
Carrying amount as of 31.03.2020 12,269.0 5,259.7 3,972.3 2,429.2 0.0 232.1 230.3 113.7 31.5
1 expansion in market classification within the BRD
€ million
Fair value adjustment as of 31.03.2020: – 0.7
– hereupon as of 31.03.2020 in the portfolio: – 0.7
– hereupon as of 31.03.2020 disposed investment properties: 0.0
23 LEG IMMOBILIEN AG Q1 2020CONSOLIDATED FINANCIAL STATEMENTS
T26
Investment properties
Residential assets
€ million Total High-growth
marketsStable
marketsHigher-yielding
marketsNon NRW Commercial
assetsParking and other assets
Lease-hold Land values
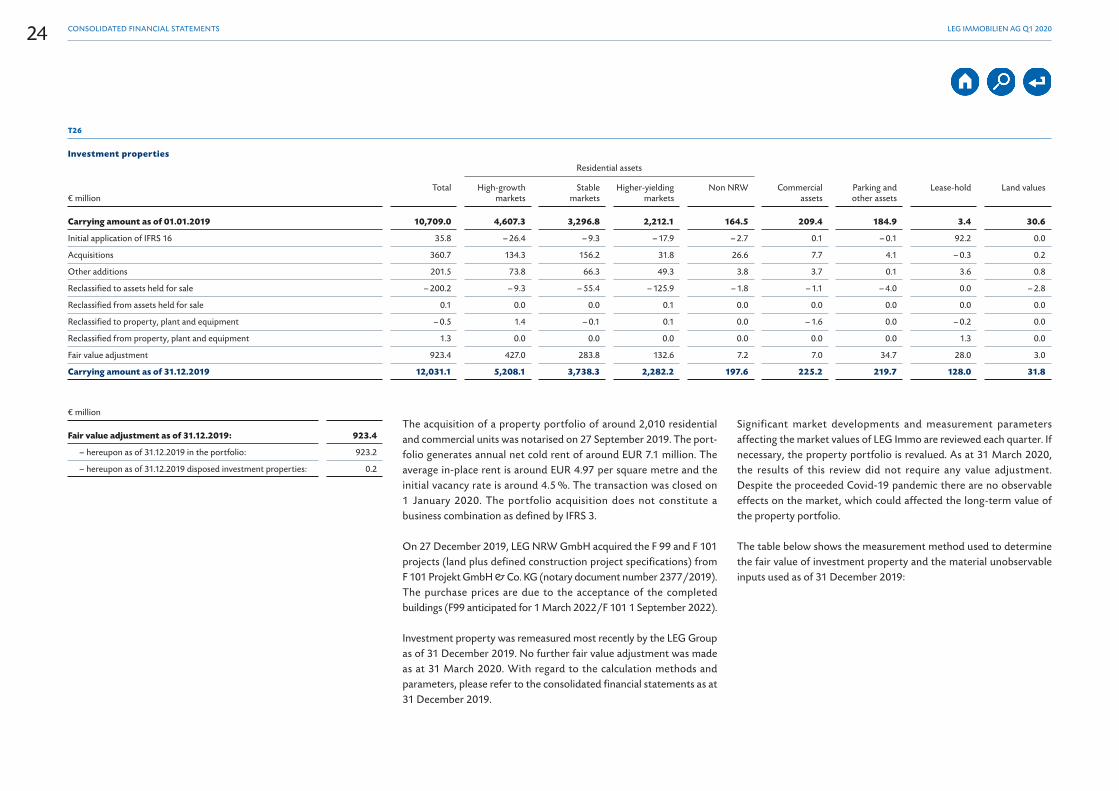
Carrying amount as of 01.01.2019 10,709.0 4,607.3 3,296.8 2,212.1 164.5 209.4 184.9 3.4 30.6
Initial application of IFRS 16 35.8 – 26.4 – 9.3 – 17.9 – 2.7 0.1 – 0.1 92.2 0.0
Acquisitions 360.7 134.3 156.2 31.8 26.6 7.7 4.1 – 0.3 0.2
Other additions 201.5 73.8 66.3 49.3 3.8 3.7 0.1 3.6 0.8
Reclassified to assets held for sale – 200.2 – 9.3 – 55.4 – 125.9 – 1.8 – 1.1 – 4.0 0.0 – 2.8
Reclassified from assets held for sale 0.1 0.0 0.0 0.1 0.0 0.0 0.0 0.0 0.0
Reclassified to property, plant and equipment – 0.5 1.4 – 0.1 0.1 0.0 – 1.6 0.0 – 0.2 0.0
Reclassified from property, plant and equipment 1.3 0.0 0.0 0.0 0.0 0.0 0.0 1.3 0.0
Fair value adjustment 923.4 427.0 283.8 132.6 7.2 7.0 34.7 28.0 3.0
Carrying amount as of 31.12.2019 12,031.1 5,208.1 3,738.3 2,282.2 197.6 225.2 219.7 128.0 31.8
€ million
Fair value adjustment as of 31.12.2019: 923.4
– hereupon as of 31.12.2019 in the portfolio: 923.2
– hereupon as of 31.12.2019 disposed investment properties: 0.2
The acquisition of a property portfolio of around 2,010 residential and commercial units was notarised on 27 September 2019. The port-folio generates annual net cold rent of around EUR 7.1 million. The average in-place rent is around EUR 4.97 per square metre and the initial vacancy rate is around 4.5 %. The transaction was closed on 1 January 2020. The portfolio acquisition does not constitute a business combination as defined by IFRS 3.
On 27 December 2019, LEG NRW GmbH acquired the F 99 and F 101 projects (land plus defined construction project specifications) from F 101 Projekt GmbH & Co. KG (notary document number 2377/2019). The purchase prices are due to the acceptance of the completed buildings (F99 anticipated for 1 March 2022/F 101 1 September 2022).
Investment property was remeasured most recently by the LEG Group as of 31 December 2019. No further fair value adjustment was made as at 31 March 2020. With regard to the calculation methods and parameters, please refer to the consolidated financial statements as at 31 December 2019.
Significant market developments and measurement parameters affecting the market values of LEG Immo are reviewed each quarter. If necessary, the property portfolio is revalued. As at 31 March 2020, the results of this review did not require any value adjustment. Despite the proceeded Covid-19 pandemic there are no observable effects on the market, which could affected the long-term value of the property portfolio.
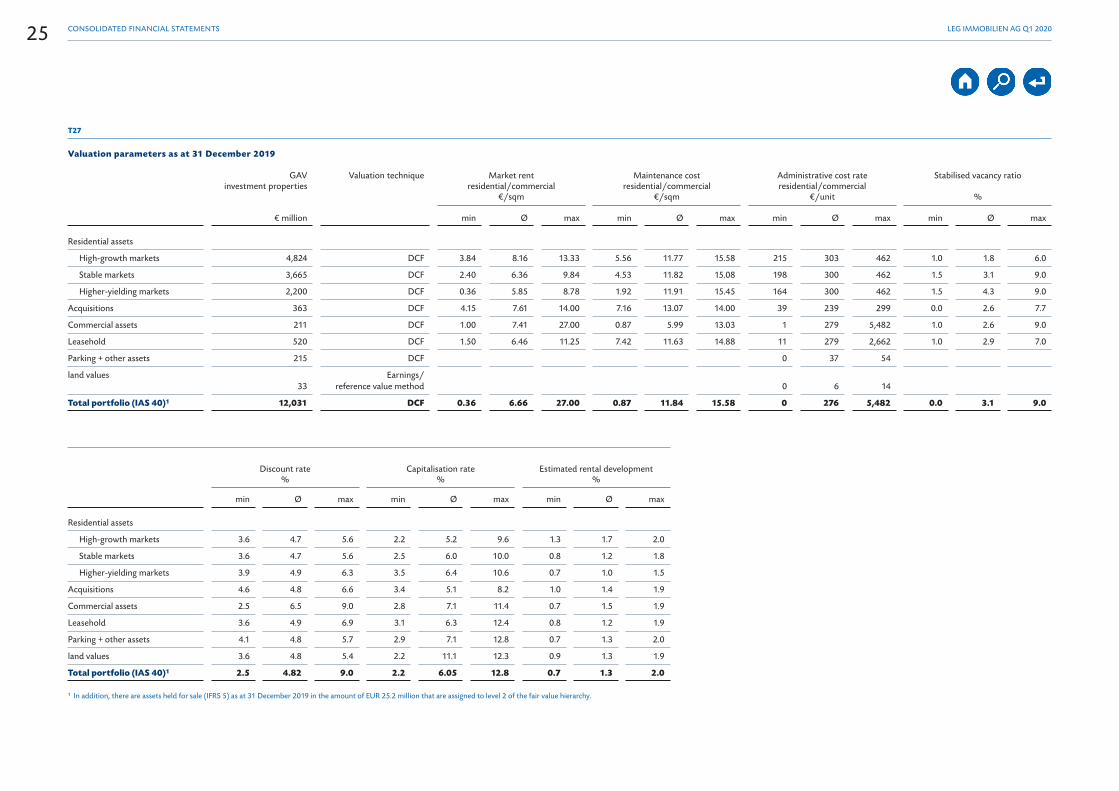
The table below shows the measurement method used to determine the fair value of investment property and the material unobservable inputs used as of 31 December 2019:
24 LEG IMMOBILIEN AG Q1 2020CONSOLIDATED FINANCIAL STATEMENTS
T27
Valuation parameters as at 31 December 2019
GAV investment properties
€ million
Valuation technique
Market rent residential/commercial
€/sqm
Maintenance cost residential/commercial
€/sqm
Administrative cost rate residential/commercial
€/unit
Stabilised vacancy ratio
%
min Ø max min Ø max min Ø max min Ø max
Residential assets
High-growth markets 4,824 DCF 3.84 8.16 13.33 5.56 11.77 15.58 215 303 462 1.0 1.8 6.0
Stable markets 3,665 DCF 2.40 6.36 9.84 4.53 11.82 15.08 198 300 462 1.5 3.1 9.0
Higher-yielding markets 2,200 DCF 0.36 5.85 8.78 1.92 11.91 15.45 164 300 462 1.5 4.3 9.0
Acquisitions 363 DCF 4.15 7.61 14.00 7.16 13.07 14.00 39 239 299 0.0 2.6 7.7
Commercial assets 211 DCF 1.00 7.41 27.00 0.87 5.99 13.03 1 279 5,482 1.0 2.6 9.0
Leasehold 520 DCF 1.50 6.46 11.25 7.42 11.63 14.88 11 279 2,662 1.0 2.9 7.0
Parking + other assets 215 DCF 0 37 54
land values 33
Earnings/ reference value method 0 6 14
Total portfolio (IAS 40)1 12,031 DCF 0.36 6.66 27.00 0.87 11.84 15.58 0 276 5,482 0.0 3.1 9.0
Discount rate
%Capitalisation rate
%Estimated rental development
%
min Ø max min Ø max min Ø max
Residential assets
High-growth markets 3.6 4.7 5.6 2.2 5.2 9.6 1.3 1.7 2.0
Stable markets 3.6 4.7 5.6 2.5 6.0 10.0 0.8 1.2 1.8
Higher-yielding markets 3.9 4.9 6.3 3.5 6.4 10.6 0.7 1.0 1.5
Acquisitions 4.6 4.8 6.6 3.4 5.1 8.2 1.0 1.4 1.9
Commercial assets 2.5 6.5 9.0 2.8 7.1 11.4 0.7 1.5 1.9
Leasehold 3.6 4.9 6.9 3.1 6.3 12.4 0.8 1.2 1.9
Parking + other assets 4.1 4.8 5.7 2.9 7.1 12.8 0.7 1.3 2.0
land values 3.6 4.8 5.4 2.2 11.1 12.3 0.9 1.3 1.9
Total portfolio (IAS 40)1 2.5 4.82 9.0 2.2 6.05 12.8 0.7 1.3 2.0
1 In addition, there are assets held for sale (IFRS 5) as at 31 December 2019 in the amount of EUR 25.2 million that are assigned to level 2 of the fair value hierarchy.
25 LEG IMMOBILIEN AG Q1 2020CONSOLIDATED FINANCIAL STATEMENTS
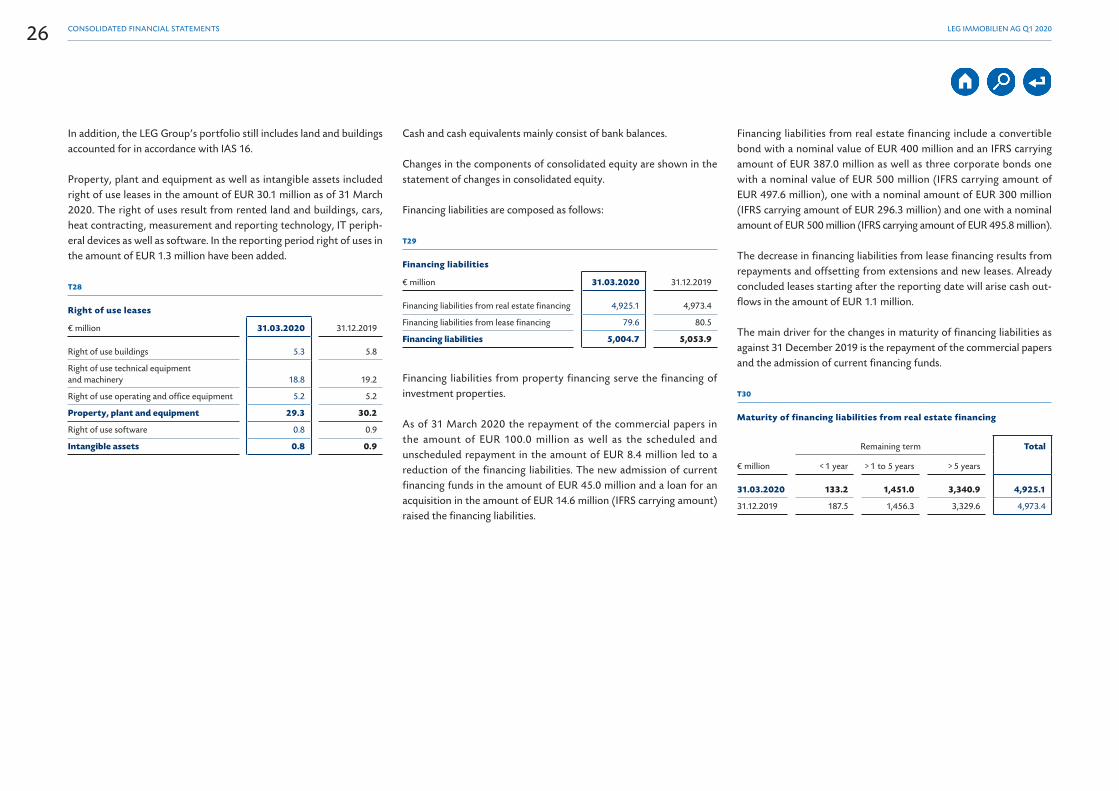
In addition, the LEG Group’s portfolio still includes land and buildings accounted for in accordance with IAS 16.
Property, plant and equipment as well as intangible assets included right of use leases in the amount of EUR 30.1 million as of 31 March 2020. The right of uses result from rented land and buildings, cars, heat contracting, measurement and reporting technology, IT periph-eral devices as well as software. In the reporting period right of uses in the amount of EUR 1.3 million have been added.
T28
Right of use leases
€ million 31.03.2020 31.12.2019
Right of use buildings 5.3 5.8
Right of use technical equipment and machinery 18.8 19.2
Right of use operating and office equipment 5.2 5.2
Property, plant and equipment 29.3 30.2
Right of use software 0.8 0.9
Intangible assets 0.8 0.9
Cash and cash equivalents mainly consist of bank balances.
Changes in the components of consolidated equity are shown in the statement of changes in consolidated equity.
Financing liabilities are composed as follows:
T29
Financing liabilities
€ million 31.03.2020 31.12.2019
Financing liabilities from real estate financing 4,925.1 4,973.4
Financing liabilities from lease financing 79.6 80.5
Financing liabilities 5,004.7 5,053.9
Financing liabilities from property financing serve the financing of investment properties.
As of 31 March 2020 the repayment of the commercial papers in the amount of EUR 100.0 million as well as the scheduled and unscheduled repayment in the amount of EUR 8.4 million led to a reduction of the financing liabilities. The new admission of current financing funds in the amount of EUR 45.0 million and a loan for an acquisition in the amount of EUR 14.6 million (IFRS carrying amount) raised the financing liabilities.
Financing liabilities from real estate financing include a convertible bond with a nominal value of EUR 400 million and an IFRS carrying amount of EUR 387.0 million as well as three corporate bonds one with a nominal value of EUR 500 million (IFRS carrying amount of EUR 497.6 million), one with a nominal amount of EUR 300 million (IFRS carrying amount of EUR 296.3 million) and one with a nominal amount of EUR 500 million (IFRS carrying amount of EUR 495.8 million).
The decrease in financing liabilities from lease financing results from repayments and offsetting from extensions and new leases. Already concluded leases starting after the reporting date will arise cash out-flows in the amount of EUR 1.1 million.
The main driver for the changes in maturity of financing liabilities as against 31 December 2019 is the repayment of the commercial papers and the admission of current financing funds.
T30
Maturity of financing liabilities from real estate financing
Remaining term Total
€ million < 1 year > 1 to 5 years > 5 years
31.03.2020 133.2 1,451.0 3,340.9 4,925.1
31.12.2019 187.5 1,456.3 3,329.6 4,973.4
26 LEG IMMOBILIEN AG Q1 2020CONSOLIDATED FINANCIAL STATEMENTS
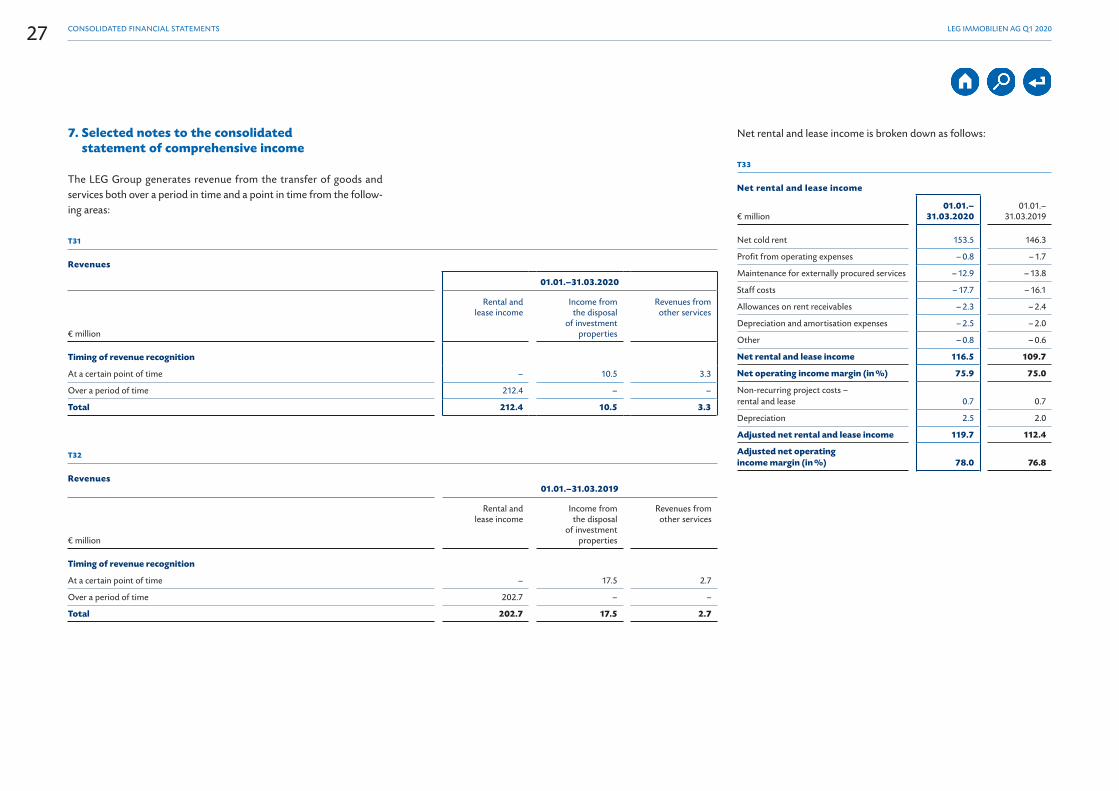
7. Selected notes to the consolidated statement of comprehensive income
The LEG Group generates revenue from the transfer of goods and services both over a period in time and a point in time from the follow-ing areas:
T31
Revenues
01.01.–31.03.2020
€ million
Rental and lease income
Income from the disposal
of investment properties
Revenues from other services
Timing of revenue recognition
At a certain point of time – 10.5 3.3
Over a period of time 212.4 – –
Total 212.4 10.5 3.3
T32
Revenues 01.01.–31.03.2019
€ million
Rental and lease income
Income from the disposal
of investment properties
Revenues from other services
Timing of revenue recognition
At a certain point of time – 17.5 2.7
Over a period of time 202.7 – –
Total 202.7 17.5 2.7
Net rental and lease income is broken down as follows:
T33
Net rental and lease income
€ million 01.01.–
31.03.202001.01.–
31.03.2019
Net cold rent 153.5 146.3
Profit from operating expenses – 0.8 – 1.7
Maintenance for externally procured services – 12.9 – 13.8
Staff costs – 17.7 – 16.1
Allowances on rent receivables – 2.3 – 2.4
Depreciation and amortisation expenses – 2.5 – 2.0
Other – 0.8 – 0.6
Net rental and lease income 116.5 109.7
Net operating income margin (in %) 75.9 75.0
Non-recurring project costs – rental and lease 0.7 0.7
Depreciation 2.5 2.0
Adjusted net rental and lease income 119.7 112.4
Adjusted net operating income margin (in %) 78.0 76.8
27 LEG IMMOBILIEN AG Q1 2020CONSOLIDATED FINANCIAL STATEMENTS

In the reporting period, the LEG Group increased its net rental and lease income by EUR 6.8 million compared to the same period of the previous year. Main drivers of this development were the EUR 0.9 mil-lion lower maintenance for externally procured services and the EUR 7.2 million rise in net cold rents. In-place rent per square metre on a like-for-like basis rose by 2.8 % in the reporting period. This was countered by the increase in staff costs by EUR 1.6 million, which was mainly due to an increase in the number of hired workers and to tariff increase.
Due to disproportionate development of net rental and lease income compared with the development of in-place rent the NOI margin increased from 75.0 % to 75.9 % in the reporting period.
In the reporting period following depreciation expenses for right of use from leases are included.
T34
Depreciation expense of leases
€ million 01.01.–
31.03.202001.01.–
31.03.2019
Right of use buildings 0.0 0.0
Right of use technical equipment and machinery 1.2 0.9
Right of use operating and office equipment 0.5 0.5
Depreciation expense of leases 1.7 1.4
In the reporting period expenses of leases of a low-value asset in the amount of EUR 0.1 million were included in the net rental and lease income (comparable period: EUR 0.1 million).
Net income from the disposal of investment properties is composed as follows:
T35
Net income from the disposal of investment properties
€ million 01.01.–
31.03.202001.01.–
31.03.2019
Income from the disposal of investment 10.5 17.5
Carrying amount of the disposal of investment properties – 10.6 – 17.5
Costs of sales of investment properties – 0.2 – 0.3
Net income from the disposal of investment properties – 0.3 – 0.3
Administrative and other expenses
T36
Administrative and other expenses
€ million01.01. –
31.03.202001.01. –
31.03.2019
Other operating expenses – 3.1 – 2.6
Staff costs – 5.6 – 5.6
Purchased services – 0.5 – 0.3
Depreciation and amortisation – 1.1 – 1.0
Administratve and other expenses – 10.3 – 9.5
Depreciation and amortisation 1.1 1.0
Non-recurring project costs and extraordinary and prior-period expenses 0.8 0.8
Adjusted administrative and other expenses – 8.4 – 7.7
The increase in other operating expenses is mainly attributable to increased costs for advice and insurance. The adjusted administrative expenses therefore increased in the first three months compared to the same period in the previous year.
In the reporting period following depreciation expenses for right of use from leases are included.
T37
Depreciation expense of leases
€ million 01.01.–
31.03.202001.01.–
31.03.2019
Right of use buildings 0.5 0.5
Right of use operating and office equipment 0.1 0.1
Right of use software 0.1 0.0
Depreciation expense of leases 0.7 0.6
28 LEG IMMOBILIEN AG Q1 2020CONSOLIDATED FINANCIAL STATEMENTS
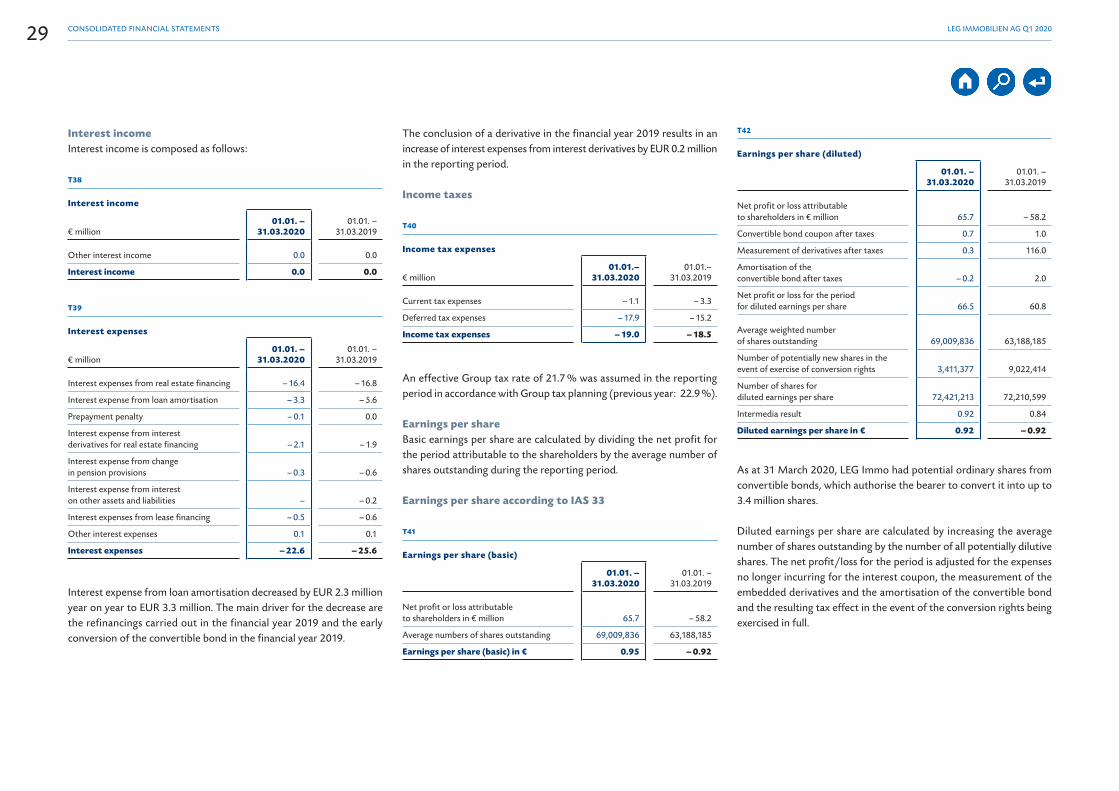
Interest incomeInterest income is composed as follows:
T38
Interest income
€ million 01.01. –
31.03.202001.01. –
31.03.2019
Other interest income 0.0 0.0
Interest income 0.0 0.0
T39
Interest expenses
€ million 01.01. –
31.03.202001.01. –
31.03.2019
Interest expenses from real estate financing – 16.4 – 16.8
Interest expense from loan amortisation – 3.3 – 5.6
Prepayment penalty – 0.1 0.0
Interest expense from interest derivatives for real estate financing – 2.1 – 1.9
Interest expense from change in pension provisions – 0.3 – 0.6
Interest expense from interest on other assets and liabilities – – 0.2
Interest expenses from lease financing – 0.5 – 0.6
Other interest expenses 0.1 0.1
Interest expenses – 22.6 – 25.6
Interest expense from loan amortisation decreased by EUR 2.3 million year on year to EUR 3.3 million. The main driver for the decrease are the refinancings carried out in the financial year 2019 and the early conversion of the convertible bond in the financial year 2019.
The conclusion of a derivative in the financial year 2019 results in an increase of interest expenses from interest derivatives by EUR 0.2 million in the reporting period.
Income taxes
T40
Income tax expenses
€ million 01.01.–
31.03.202001.01.–
31.03.2019
Current tax expenses – 1.1 – 3.3
Deferred tax expenses – 17.9 – 15.2
Income tax expenses – 19.0 – 18.5
An effective Group tax rate of 21.7 % was assumed in the reporting period in accordance with Group tax planning (previous year: 22.9 %).
Earnings per share Basic earnings per share are calculated by dividing the net profit for the period attributable to the shareholders by the average number of shares outstanding during the reporting period.
Earnings per share according to IAS 33
T41
Earnings per share (basic)
01.01. –
31.03.202001.01. –
31.03.2019
Net profit or loss attributable to shareholders in € million 65.7 – 58.2
Average numbers of shares outstanding 69,009,836 63,188,185
Earnings per share (basic) in € 0.95 – 0.92
T42
Earnings per share (diluted)
01.01. –
31.03.202001.01. –
31.03.2019
Net profit or loss attributable to shareholders in € million 65.7 – 58.2
Convertible bond coupon after taxes 0.7 1.0
Measurement of derivatives after taxes 0.3 116.0
Amortisation of the convertible bond after taxes – 0.2 2.0
Net profit or loss for the period for diluted earnings per share 66.5 60.8
Average weighted number of shares outstanding 69,009,836 63,188,185
Number of potentially new shares in the event of exercise of conversion rights 3,411,377 9,022,414
Number of shares for diluted earnings per share 72,421,213 72,210,599
Intermedia result 0.92 0.84
Diluted earnings per share in € 0.92 – 0.92
As at 31 March 2020, LEG Immo had potential ordinary shares from convertible bonds, which authorise the bearer to convert it into up to 3.4 million shares.
Diluted earnings per share are calculated by increasing the average number of shares outstanding by the number of all potentially dilutive shares. The net profit/loss for the period is adjusted for the expenses no longer incurring for the interest coupon, the measurement of the embedded derivatives and the amortisation of the convertible bond and the resulting tax effect in the event of the conversion rights being exercised in full.
29 LEG IMMOBILIEN AG Q1 2020CONSOLIDATED FINANCIAL STATEMENTS
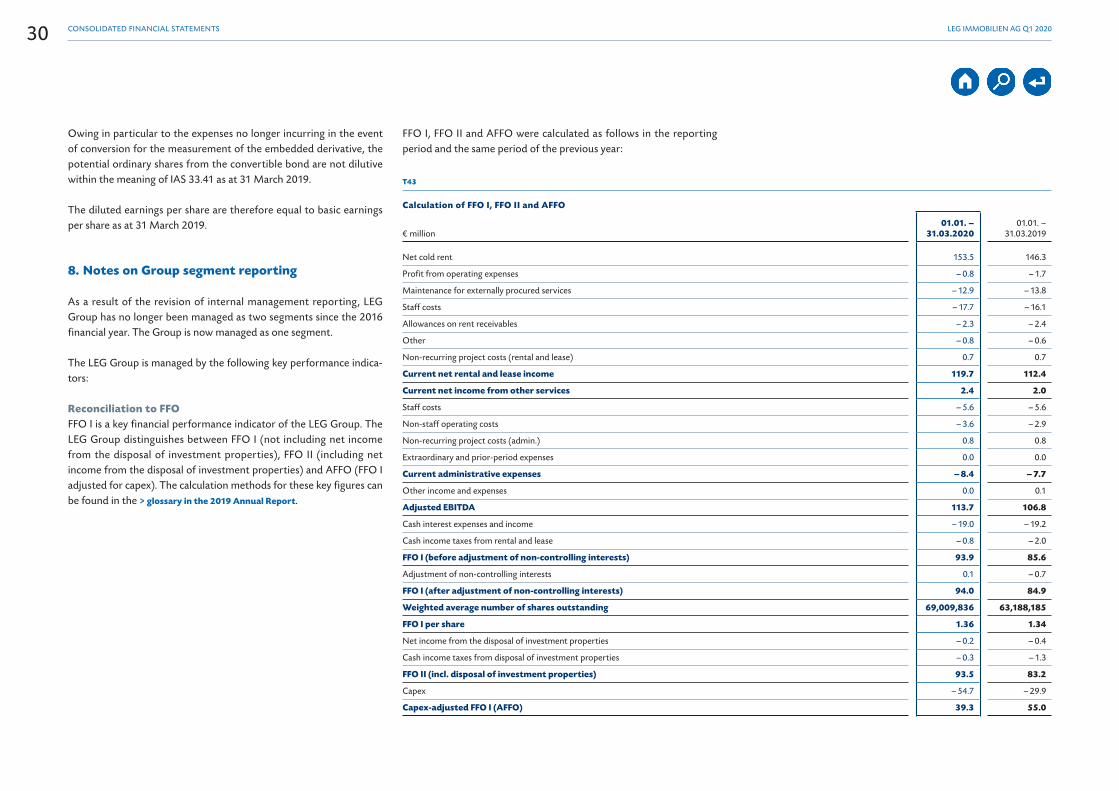
Owing in particular to the expenses no longer incurring in the event of conversion for the measurement of the embedded derivative, the potential ordinary shares from the convertible bond are not dilutive within the meaning of IAS 33.41 as at 31 March 2019.
The diluted earnings per share are therefore equal to basic earnings per share as at 31 March 2019.
8. Notes on Group segment reporting
As a result of the revision of internal management reporting, LEG Group has no longer been managed as two segments since the 2016 financial year. The Group is now managed as one segment.
The LEG Group is managed by the following key performance indica-tors:
Reconciliation to FFOFFO I is a key financial performance indicator of the LEG Group. The LEG Group distinguishes between FFO I (not including net income from the disposal of investment properties), FFO II (including net income from the disposal of investment properties) and AFFO (FFO I adjusted for capex). The calculation methods for these key figures can be found in the > glossary in the 2019 Annual Report.
FFO I, FFO II and AFFO were calculated as follows in the reporting period and the same period of the previous year:
T43
Calculation of FFO I, FFO II and AFFO
€ million01.01. –
31.03.202001.01. –
31.03.2019
Net cold rent 153.5 146.3
Profit from operating expenses – 0.8 – 1.7
Maintenance for externally procured services – 12.9 – 13.8
Staff costs – 17.7 – 16.1
Allowances on rent receivables – 2.3 – 2.4
Other – 0.8 – 0.6
Non-recurring project costs (rental and lease) 0.7 0.7
Current net rental and lease income 119.7 112.4
Current net income from other services 2.4 2.0
Staff costs – 5.6 – 5.6
Non-staff operating costs – 3.6 – 2.9
Non-recurring project costs (admin.) 0.8 0.8
Extraordinary and prior-period expenses 0.0 0.0
Current administrative expenses – 8.4 – 7.7
Other income and expenses 0.0 0.1
Adjusted EBITDA 113.7 106.8
Cash interest expenses and income – 19.0 – 19.2
Cash income taxes from rental and lease – 0.8 – 2.0
FFO I (before adjustment of non-controlling interests) 93.9 85.6
Adjustment of non-controlling interests 0.1 – 0.7
FFO I (after adjustment of non-controlling interests) 94.0 84.9
Weighted average number of shares outstanding 69,009,836 63,188,185
FFO I per share 1.36 1.34
Net income from the disposal of investment properties – 0.2 – 0.4
Cash income taxes from disposal of investment properties – 0.3 – 1.3
FFO II (incl. disposal of investment properties) 93.5 83.2
Capex – 54.7 – 29.9
Capex-adjusted FFO I (AFFO) 39.3 55.0
30 LEG IMMOBILIEN AG Q1 2020CONSOLIDATED FINANCIAL STATEMENTS

Net asset value (NAV)A further key metric relevant in the property industry is NAV. The calculation method for the respective key figure can be found in the > glossary in the 2019 Annual Report.
The LEG Group reports a basic EPRA NAV of EUR 7,410.2 million as at 31 March 2020. The effects of the possible conversion of the convertible bond are shown by the additional calculation of diluted EPRA NAV. After further adjustment for goodwill effects, the adjusted diluted EPRA NAV amounts to EUR 7,352.9 million at the reporting date.
T44
EPRA NAV
31.03.2020 31.12.2019
€ million
undiluted
Effect of exercise of convertibles
and options
diluted
undiluted
Effect of exercise of convertibles
and options
diluted
Equity attributable to shareholders of the parent company 5,986.0 – 5,986.0 5,909.9 – 5,909.9
Non-controlling interests 24.1 – 24.1 24.0 – 24.0
Equity 6,010.1 – 6,010.1 5,933.9 – 5,933.9
Effect of exercise of options, convertibles and other equity interests – 26.1 26.1 – 26.1 26.1
NAV 5,986.0 26.1 6,012.1 5,909.9 26.1 5,936.0
Fair value measurement of derivative financial instruments 87.2 – 87.2 84.0 – 84.0
Deferred taxes on WFA loans and derivatives 4.8 – 4.8 6.2 – 6.2
Deferred taxes on investment property 1,388.0 – 1,388.0 1,386.0 – 1,386.0
Goodwill resulting from deferred taxes on EPRA adjustments – 55.8 – – 55.8 – 55.8 – – 55.8
EPRA NAV 7,410.2 26.1 7,436.3 7,330.3 26.1 7,356.4
Number of shares 69,009,836 0 69,009,836 69,009,836 0 69,009,836
EPRA NAV per share (€) 107.38 – 107.76 106.22 – 106.60
Goodwill resulting from synergies 83.4 – 83.4 83.4 – 83.4
Adjusted EPRA NAV (w/o effects from goodwill) 7,326.8 26.1 7,352.9 7,246.9 26.1 7,273.0
Number of shares 69,009,836 0 69,009,836 69,009,836 0 69,009,836
Adjusted EPRA NAV per share (€) 106.17 – 106.55 105.01 – 105.39
31 LEG IMMOBILIEN AG Q1 2020CONSOLIDATED FINANCIAL STATEMENTS
Loan-to-value ratio (LTV)Net debt at the end of the reporting period increased slightly com-pared with 31 December 2019, due to payments for investments, leading to a slightly increased loan-to-value ratio (LTV) of 38.0 % at the interim reporting date (31 December 2019: 37,7 %).
T45
LTV
€ million 31.03.2020 31.12.2019
Financing liabilities 5,004.7 5,053.9
Deferred purchase price liabilities 29.9 31.8
Less cash and cash equivalents 300.1 451.2
Net financing liabilities 4,674.7 4,570.9
Investment properties 12,269.0 12,031.1
Assets held for sale 15.9 25.2
Prepayments for investment properties 13.0 53.5
Real estate assets 12,297.9 12,109.8
Loan-to-value ratio (LTV) in % 38.0 37.7
9. Financial instruments
The table below shows the financial assets and liabilities broken down by measurement category and class. Receivables and liabilities from finance leases and derivatives used as hedging instruments are included even though they are not assigned to an IFRS 9 measurement category. With respect to reconciliation, non-financial assets and non-financing liabilities are also included although they are not covered by IFRS 7.
The fair values of financial instruments are determined on the basis of corresponding market values or measurement methods. For cash and cash equivalents and other short-term primary financial instruments, the fair value is approximately the same as the carrying amount at the end of the respective reporting period.
For non-current receivables, other assets and liabilities, the fair value is calculated on the basis of the forecast cash flows, applying the refer-ence interest rates as of the end of the reporting period. The fair values of derivative financial instruments are determined based on the bench-mark interest rates in place as of the reporting date.
For financial instruments at fair value, the discounted cash flow method is used to determine fair value using corresponding quoted market prices, with individual credit ratings and other market conditions being taken into account in the form of standard credit and liquidity spreads when calculating present value. If no quoted market prices are available, the fair value is calculated using standard measurement methods applying instrument-specific market parameters.
When calculating the fair value of derivative financial instruments, the input parameters for the valuation models are the relevant market prices and interest rates observed as of the end of the reporting period, which are obtained from recognised external sources. The derivatives are therefore attributable to Level 2 of the fair value hierarchy as defined in IFRS 13.72 ff (measurement on the basis of observable inputs).
Both the Group’s own risk and the counterparty risk were taken into account in the calculation of the fair value of derivatives in accordance with IFRS 13.
32 LEG IMMOBILIEN AG Q1 2020CONSOLIDATED FINANCIAL STATEMENTS
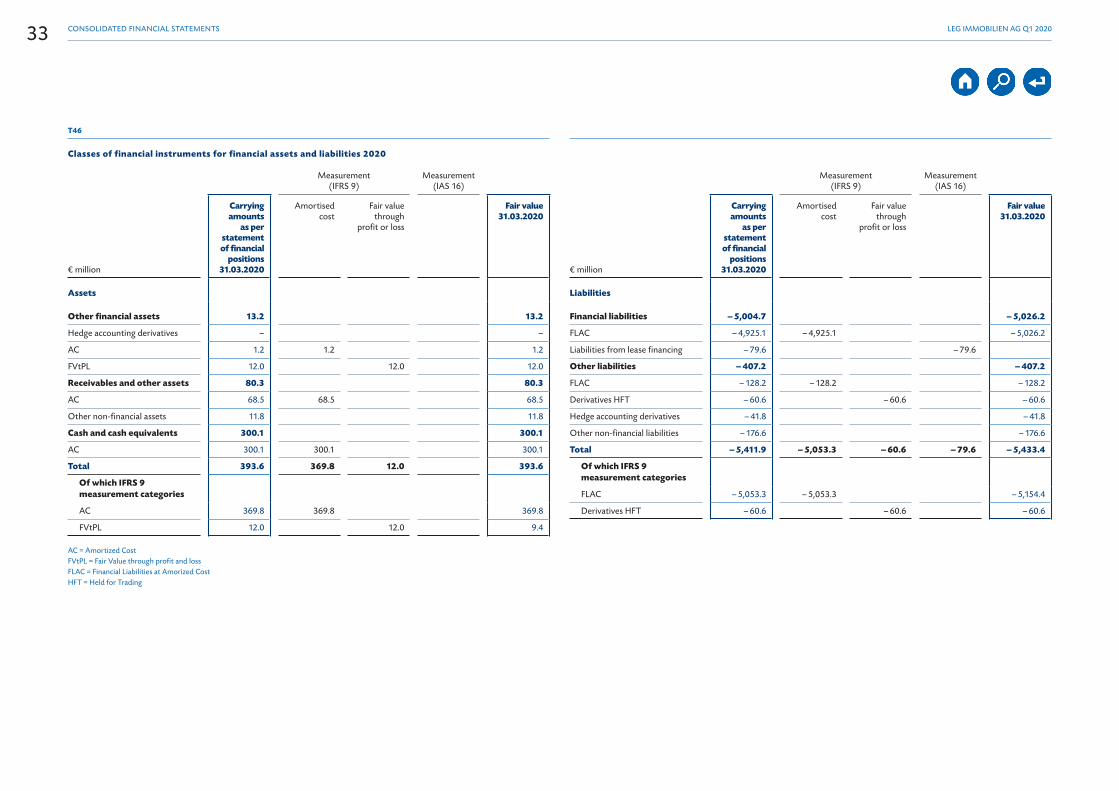
T46
Classes of financial instruments for financial assets and liabilities 2020
Measurement (IFRS 9)
Measurement (IAS 16)
€ million
Carrying amounts
as per statement of financial
positions 31.03.2020
Amortised cost
Fair value through
profit or loss
Fair value 31.03.2020
Assets
Other financial assets 13.2 13.2
Hedge accounting derivatives – –
AC 1.2 1.2 1.2
FVtPL 12.0 12.0 12.0
Receivables and other assets 80.3 80.3
AC 68.5 68.5 68.5
Other non-financial assets 11.8 11.8
Cash and cash equivalents 300.1 300.1
AC 300.1 300.1 300.1
Total 393.6 369.8 12.0 393.6
Of which IFRS 9 measurement categories
AC 369.8 369.8 369.8
FVtPL 12.0 12.0 9.4
AC = Amortized CostFVtPL = Fair Value through profit and lossFLAC = Financial Liabilities at Amorized CostHFT = Held for Trading
Measurement (IFRS 9)
Measurement (IAS 16)
€ million
Carrying amounts
as per statement of financial
positions 31.03.2020
Amortised cost
Fair value through
profit or loss
Fair value 31.03.2020
Liabilities
Financial liabilities – 5,004.7 – 5,026.2
FLAC – 4,925.1 – 4,925.1 – 5,026.2
Liabilities from lease financing – 79.6 – 79.6
Other liabilities – 407.2 – 407.2
FLAC – 128.2 – 128.2 – 128.2
Derivatives HFT – 60.6 – 60.6 – 60.6
Hedge accounting derivatives – 41.8 – 41.8
Other non-financial liabilities – 176.6 – 176.6
Total – 5,411.9 – 5,053.3 – 60.6 – 79.6 – 5,433.4
Of which IFRS 9 measurement categories
FLAC – 5,053.3 – 5,053.3 – 5,154.4
Derivatives HFT – 60.6 – 60.6 – 60.6
33 LEG IMMOBILIEN AG Q1 2020CONSOLIDATED FINANCIAL STATEMENTS
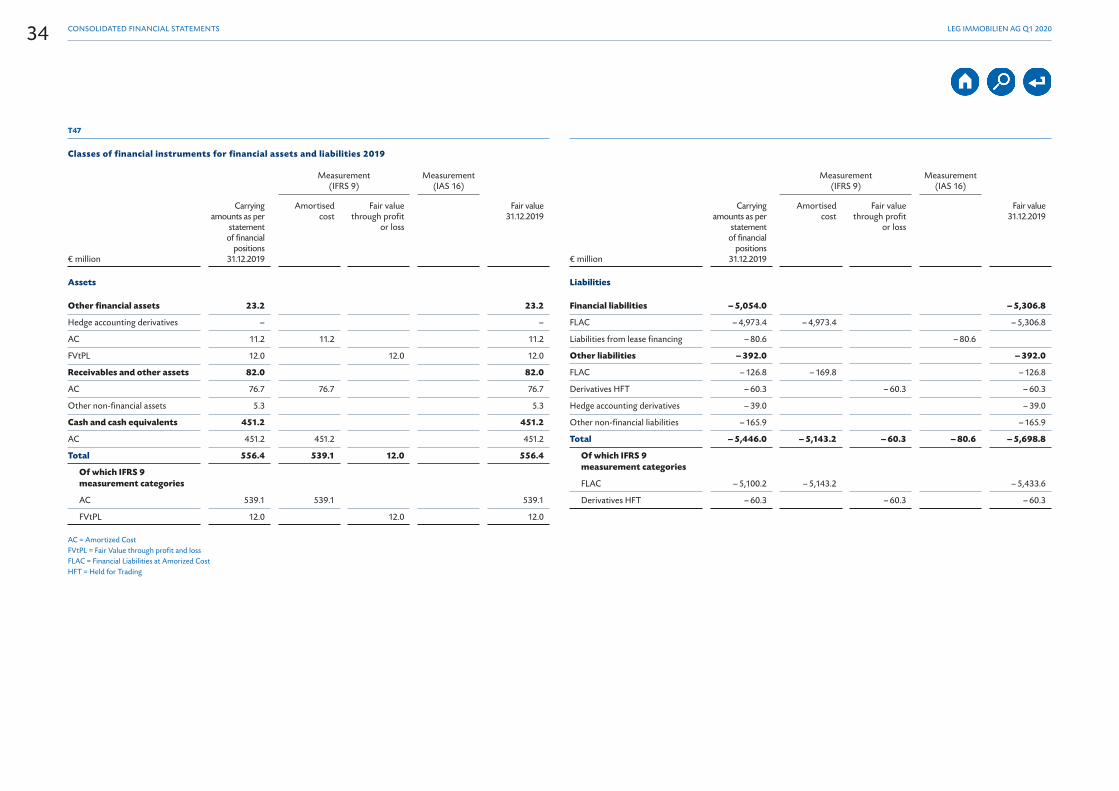
T47
Classes of financial instruments for financial assets and liabilities 2019
Measurement (IFRS 9)
Measurement (IAS 16)
€ million
Carrying amounts as per
statement of financial
positions 31.12.2019
Amortised cost
Fair value through profit
or loss
Fair value 31.12.2019
Assets
Other financial assets 23.2 23.2
Hedge accounting derivatives – –
AC 11.2 11.2 11.2
FVtPL 12.0 12.0 12.0
Receivables and other assets 82.0 82.0
AC 76.7 76.7 76.7
Other non-financial assets 5.3 5.3
Cash and cash equivalents 451.2 451.2
AC 451.2 451.2 451.2
Total 556.4 539.1 12.0 556.4
Of which IFRS 9 measurement categories
AC 539.1 539.1 539.1
FVtPL 12.0 12.0 12.0
AC = Amortized CostFVtPL = Fair Value through profit and lossFLAC = Financial Liabilities at Amorized CostHFT = Held for Trading
Measurement (IFRS 9)
Measurement (IAS 16)
€ million
Carrying amounts as per
statement of financial
positions 31.12.2019
Amortised cost
Fair value through profit
or loss
Fair value 31.12.2019
Liabilities
Financial liabilities – 5,054.0 – 5,306.8
FLAC – 4,973.4 – 4,973.4 – 5,306.8
Liabilities from lease financing – 80.6 – 80.6
Other liabilities – 392.0 – 392.0
FLAC – 126.8 – 169.8 – 126.8
Derivatives HFT – 60.3 – 60.3 – 60.3
Hedge accounting derivatives – 39.0 – 39.0
Other non-financial liabilities – 165.9 – 165.9
Total – 5,446.0 – 5,143.2 – 60.3 – 80.6 – 5,698.8
Of which IFRS 9 measurement categories
FLAC – 5,100.2 – 5,143.2 – 5,433.6
Derivatives HFT – 60.3 – 60.3 – 60.3
34 LEG IMMOBILIEN AG Q1 2020CONSOLIDATED FINANCIAL STATEMENTS
As at 31 March 2020, the fair value of the very small equity invest-ments was EUR 12.0 million, unchanged to the valuation as at 31 Decem-ber 2019.
The fair value of the very small equity investments is calculated using DCF procedures as there are no quoted prices in an active market for the relevant equity investments. The fair value calculated using valuation models is allocated to Level 3 of the IFRS 13 measurement hierarchy. Allocation to Level 3 takes place based on valuation models with inputs not observed on a market. This relates primarily to the capitalisation rate of 4.8 %. As at 31 March 2020, the fair value of the very small equity investments was EUR 12.0 million. The stress test of this parameter on the basis of plus 50 basis points results in the fair value being EUR 11.0 million lower and at minus 50 basis points EUR 13.2 million higher.
10. Related-party disclosures
Please see the IFRS consolidated financial statements as at 31 Decem-ber 2019 for the presentation of the IFRS 2 programmes for long-term incentive Management Board agreements.
11. Other
There were no changes with regard to contingent liabilities in com-parison to 31 December 2019.
12. The Management Board and the Supervisory Board
There were no changes to the composition of the Management Board and Supervisory Board as at 31 March 2020 compared with the dis-closures as at 31 December 2019.
Effective 1 July 2020, Susanne Schröter-Crossan will be CFO of LEG Immo. Since September 2019, Lars von Lackum, CEO of LEG Immo, has also managed the Finance division on a provisional basis.
13. Supplementary Report
The acquisition of a property portfolio of around 1.406 residential and commercial units was notarised on 30 January 2020. The portfolio generates annual net cold rent of around EUR 6.0 million. The average in-place rent is around EUR 5.71 per square metre and the initial vacancy rate is around 4.4 %. The transaction was closed on 1 May 2020. The portfolio acquisition does not constitute a business combination as defined by IFRS 3.
Corporate financing was closed in the amount of EUR 250 million in secured and unsecured form.
There were no other significant events after the end of the interim reporting period on 31 March 2020.
Dusseldorf, 11 May 2020
LEG Immobilien AGThe Management Board
Lars von Lackum (CEO)
Dr Volker Wiegel(COO)
35 LEG IMMOBILIEN AG Q1 2020CONSOLIDATED FINANCIAL STATEMENTS

Responsibility statement
„To the best of our knowledge, and in accordance with the applicable reporting principles for financial reporting, the consolidated financial statements give a true and fair view of the assets, liabilities, financial position and profit or loss of the LEG Group, and the management report of the Group includes a fair review of the development and performance of the business and the position of the LEG Group, together with a description of the principal opportunities and risks associated with the expected development of the LEG Group.”
Dusseldorf, 11 May 2020
LEG Immobilien AGThe Management Board
Lars von Lackum (CEO)
Dr Volker Wiegel(COO)
Financial calendar 2020
LEG Financial Calendar 2020
Release of Quarterly Report Q1 as of 31 March 2020 11 May
Annual General Meeting, Dusseldorf postponed
Release of Quarterly Report Q2 as of 30 June 2020 7 August
Release of Quarterly Statement Q3 as of 30 September 2020 12 November
For additional dates see our > website.
Contact Details and Imprint
PUBLISHER
LEG Immobilien AG Hans-Böckler-Straße 38 D - 40476 Dusseldorf Tel. + 49 (0) 2 11 45 68 - 0 [email protected] www.leg.ag
CONTACT DETAILS
Investor Relations Frank Kopfinger/Karin WidenmannTel. +49 (0) 2 11 45 68 - 400 [email protected]
CONCEPT, EDITING DESIGN
HGB Hamburger Geschäftsberichte GmbH & Co. KG, Hamburg
The quarterly report as of 31 March 2020is also available in German. In case of doubt, the German version takes precedence.
36 LEG IMMOBILIEN AG Q1 2020RESPONSIBILITY STATEMENT • FINANCIAL CALENDAR 2020 • CONTACT DETAILS AND IMPRINT

LEG Immobilien AG Hans-Böckler-Straße 38 D - 40476 Dusseldorf Tel. + 49 (0) 2 11 45 68 - 0 [email protected] www.leg.ag