Embed Size (px)
Citation preview
Livelihood Strategies and Household Resilience to
Food Insecurity: The Case of Niger
Ruben DJOGBENOU
ENSEA Abidjan
June, 2015
1
Resilience, food insecurity 2
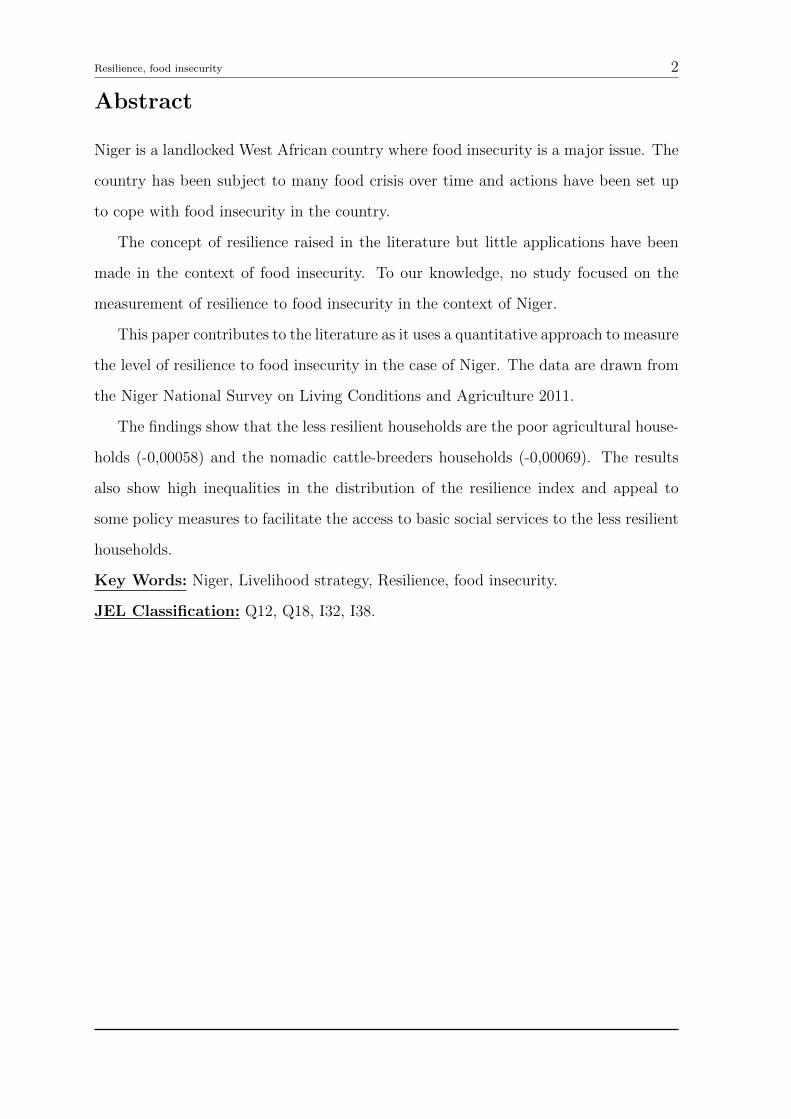
Abstract
Niger is a landlocked West African country where food insecurity is a major issue. The
country has been subject to many food crisis over time and actions have been set up
to cope with food insecurity in the country.
The concept of resilience raised in the literature but little applications have been
made in the context of food insecurity. To our knowledge, no study focused on the
measurement of resilience to food insecurity in the context of Niger.
This paper contributes to the literature as it uses a quantitative approach to measure
the level of resilience to food insecurity in the case of Niger. The data are drawn from
the Niger National Survey on Living Conditions and Agriculture 2011.
The findings show that the less resilient households are the poor agricultural house-
holds (-0,00058) and the nomadic cattle-breeders households (-0,00069). The results
also show high inequalities in the distribution of the resilience index and appeal to
some policy measures to facilitate the access to basic social services to the less resilient
households.
Key Words: Niger, Livelihood strategy, Resilience, food insecurity.
JEL Classification: Q12, Q18, I32, I38.
Resilience, food insecurity 3
1 Introduction
1.1 Problem
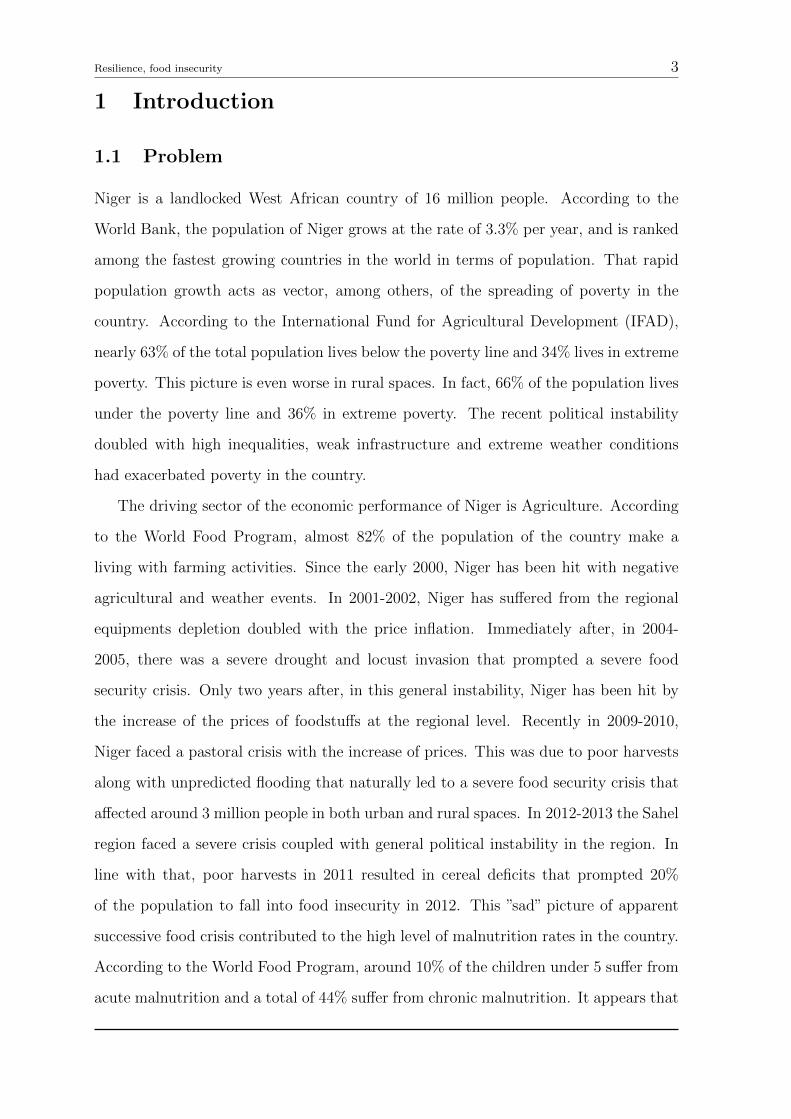
Niger is a landlocked West African country of 16 million people. According to the
World Bank, the population of Niger grows at the rate of 3.3% per year, and is ranked
among the fastest growing countries in the world in terms of population. That rapid
population growth acts as vector, among others, of the spreading of poverty in the
country. According to the International Fund for Agricultural Development (IFAD),
nearly 63% of the total population lives below the poverty line and 34% lives in extreme
poverty. This picture is even worse in rural spaces. In fact, 66% of the population lives
under the poverty line and 36% in extreme poverty. The recent political instability
doubled with high inequalities, weak infrastructure and extreme weather conditions
had exacerbated poverty in the country.
The driving sector of the economic performance of Niger is Agriculture. According
to the World Food Program, almost 82% of the population of the country make a
living with farming activities. Since the early 2000, Niger has been hit with negative
agricultural and weather events. In 2001-2002, Niger has suffered from the regional
equipments depletion doubled with the price inflation. Immediately after, in 2004-
2005, there was a severe drought and locust invasion that prompted a severe food
security crisis. Only two years after, in this general instability, Niger has been hit by
the increase of the prices of foodstuffs at the regional level. Recently in 2009-2010,
Niger faced a pastoral crisis with the increase of prices. This was due to poor harvests
along with unpredicted flooding that naturally led to a severe food security crisis that
affected around 3 million people in both urban and rural spaces. In 2012-2013 the Sahel
region faced a severe crisis coupled with general political instability in the region. In
line with that, poor harvests in 2011 resulted in cereal deficits that prompted 20%
of the population to fall into food insecurity in 2012. This ”sad” picture of apparent
successive food crisis contributed to the high level of malnutrition rates in the country.
According to the World Food Program, around 10% of the children under 5 suffer from
acute malnutrition and a total of 44% suffer from chronic malnutrition. It appears that
Resilience, food insecurity 4
food insecurity is a tough concern and a topical issue in Niger.
In the literature, food security has become a widely discussed issue. Recently, focus
has been made on the various mechanisms households could use to cope with economic
shocks that affect their food security. Actually, the coping strategy of households de-
pends on their capabilities, their assets (which include material and social resources) as
well as the different activities they develop (Alinovi and al., 2010). Dercon and Krish-
man (1996) add that household livelihood strategy is also part of the coping strategy of
households. For them, household belonging to different socioeconomic groups have dif-
ferent strategies to earn their own living. These differences in response ensures different
levels of resilience to food insecurity.
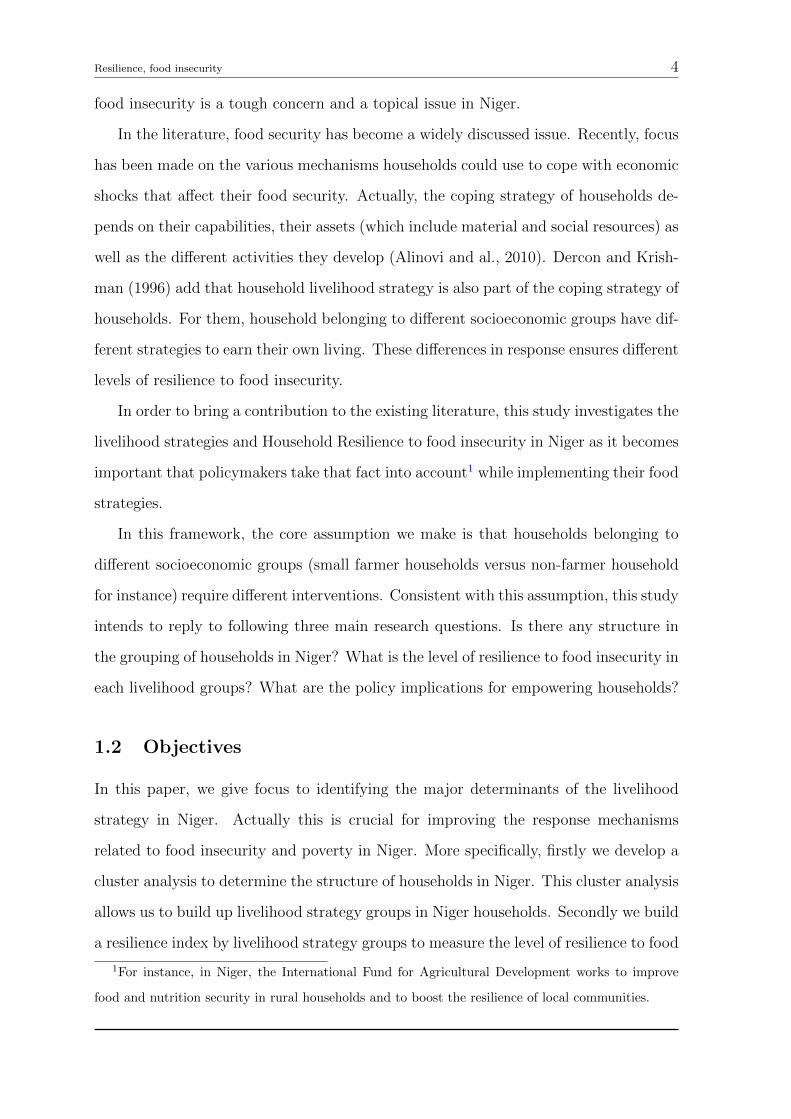
In order to bring a contribution to the existing literature, this study investigates the
livelihood strategies and Household Resilience to food insecurity in Niger as it becomes
important that policymakers take that fact into account1 while implementing their food
strategies.
In this framework, the core assumption we make is that households belonging to
different socioeconomic groups (small farmer households versus non-farmer household
for instance) require different interventions. Consistent with this assumption, this study
intends to reply to following three main research questions. Is there any structure in
the grouping of households in Niger? What is the level of resilience to food insecurity in
each livelihood groups? What are the policy implications for empowering households?
1.2 Objectives
In this paper, we give focus to identifying the major determinants of the livelihood
strategy in Niger. Actually this is crucial for improving the response mechanisms
related to food insecurity and poverty in Niger. More specifically, firstly we develop a
cluster analysis to determine the structure of households in Niger. This cluster analysis
allows us to build up livelihood strategy groups in Niger households. Secondly we build
a resilience index by livelihood strategy groups to measure the level of resilience to food
1For instance, in Niger, the International Fund for Agricultural Development works to improve
food and nutrition security in rural households and to boost the resilience of local communities.
Resilience, food insecurity 5
insecurity in Niger.
1.3 Contribution
Many empirical studies have focused on the measurement of resilience in various con-
texts. But to our knowledge, in the case of Niger, no study investigated the households
resilience to food insecurity. As food insecurity is a real issue in Niger, our study is a
major contribution to the comprehension of that ”resilience” aspect of food insecurity
in Niger. From another perspective, this study is policy-relevant since it enlightens the
efforts authorities have to do in order to cope with food insecurity in Niger.
The remainder of the paper is organized as follow. Section 2 explores the existent
literature on resilience to food insecurity. Section 3 presents the methodology adopted
to compute the resilience index in the case of Niger. Section 4 shows the main results.
Conclusions and policy implications are presented in section 5.
2 Literature Review
The purpose of this chapter is to present the theory on resilience. The literature on
the concept is very broad and diverse. We intend to give a short summary on the
theoretical considerations on the concept of resilience.
Resilience comes from the Latin ”resilientia”used in metallurgy, to reflect the ability
of a metal to return to its initial state after a shock or a continuous pressure. Etymo-
logically, resilience means therefore withstand and bounce in front of a significant and
persistent adversity.
Originally, resilience is a physical concept, adapted to social sciences, including
psychology and economics.
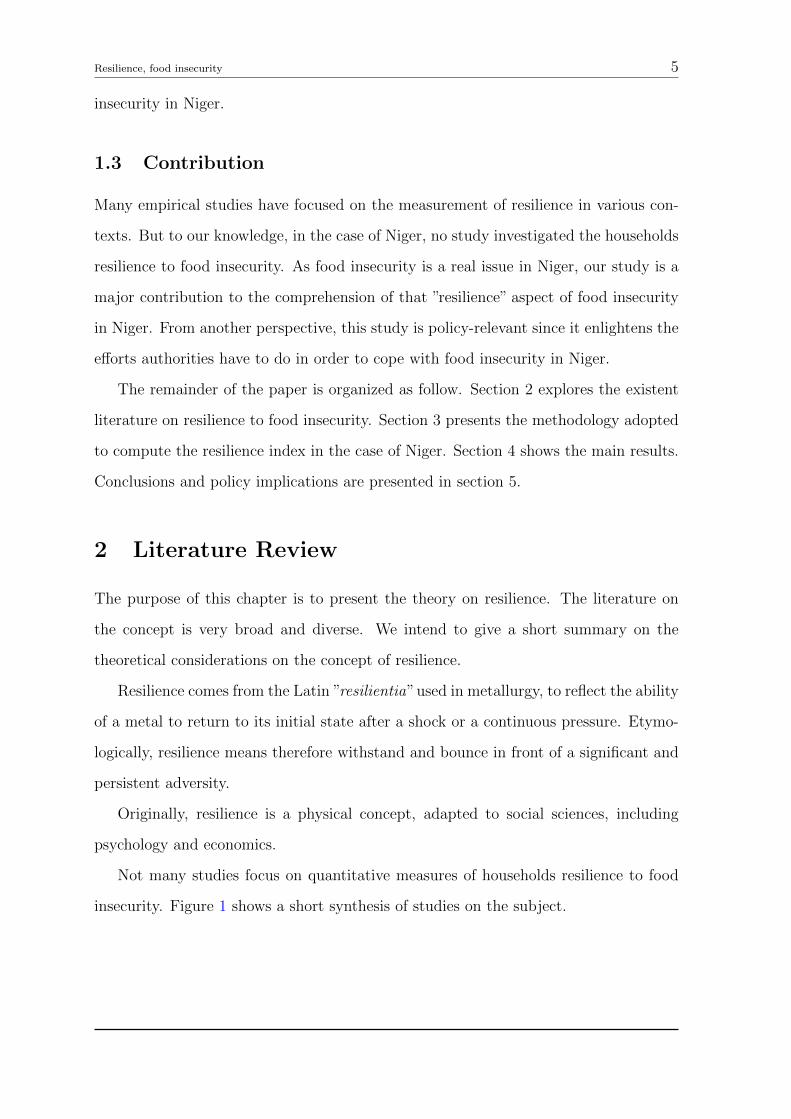
Not many studies focus on quantitative measures of households resilience to food
insecurity. Figure 1 shows a short synthesis of studies on the subject.
Resilience, food insecurity 6
Figure 1: Empirical Approaches to Resilience Measurement
Source: Ciani and Romano (2014)
In the literature, the main issue is that resilience is not directly observable. For the
purpose, in general we identify two procedures to handle the problem.
Alinovi and al. (2008, 2010) suggest a strategy in which resilience is modeled as a
multidimensional latent variable. They use data from the Kenya integrated household
budget survey. They included six (6) various components:
• Social safety nets,
• Access to public services
• Assets
• Income and food access
• Stability and
• Adaptive capacity
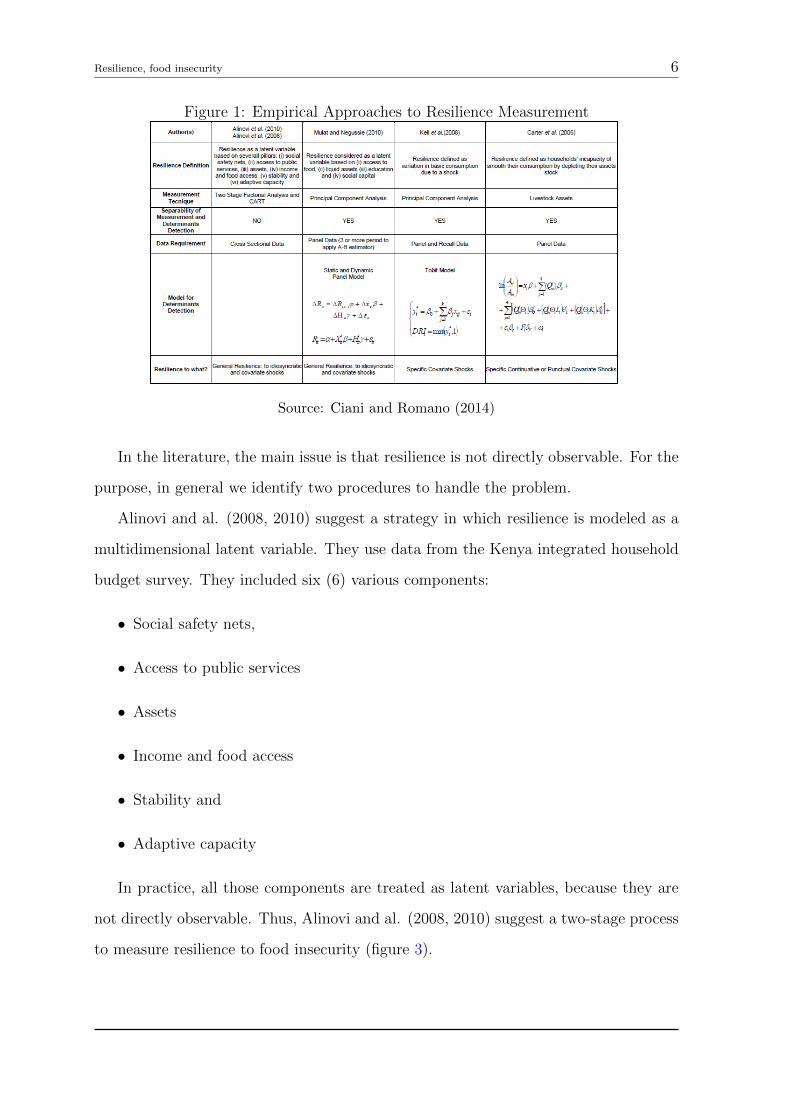
In practice, all those components are treated as latent variables, because they are
not directly observable. Thus, Alinovi and al. (2008, 2010) suggest a two-stage process
to measure resilience to food insecurity (figure 3).
Resilience, food insecurity 7
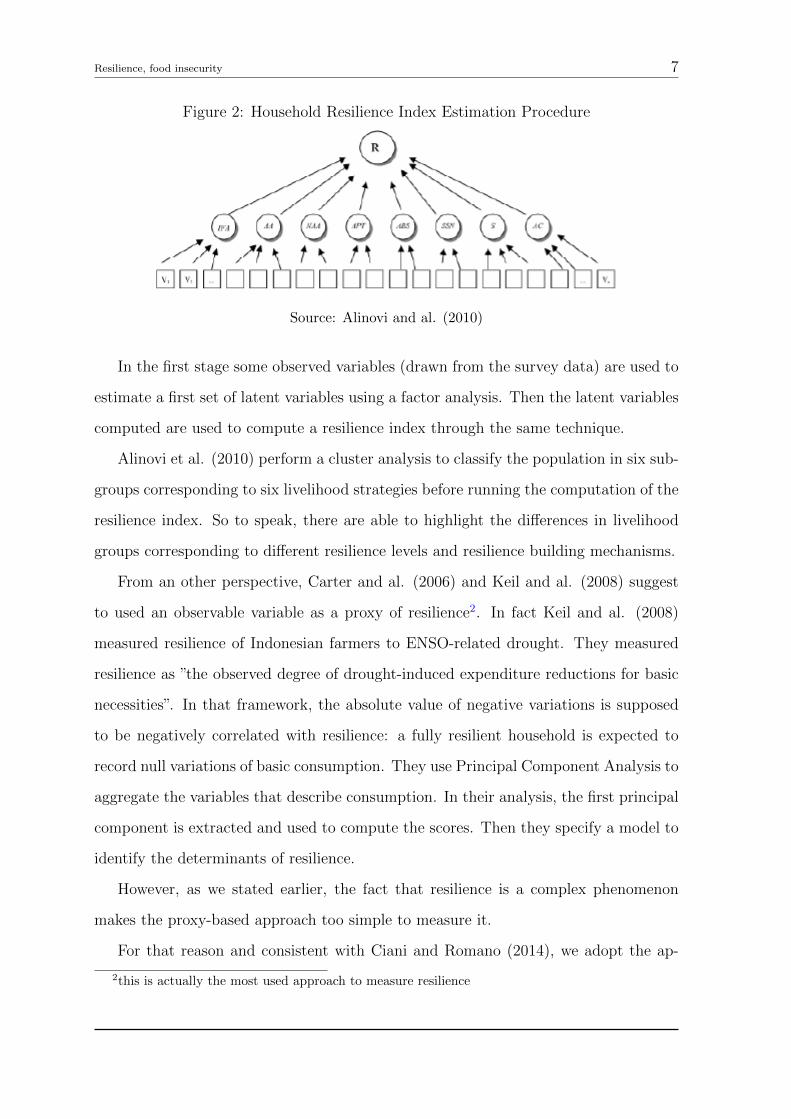
Figure 2: Household Resilience Index Estimation Procedure
Source: Alinovi and al. (2010)
In the first stage some observed variables (drawn from the survey data) are used to
estimate a first set of latent variables using a factor analysis. Then the latent variables
computed are used to compute a resilience index through the same technique.
Alinovi et al. (2010) perform a cluster analysis to classify the population in six sub-
groups corresponding to six livelihood strategies before running the computation of the
resilience index. So to speak, there are able to highlight the differences in livelihood
groups corresponding to different resilience levels and resilience building mechanisms.
From an other perspective, Carter and al. (2006) and Keil and al. (2008) suggest
to used an observable variable as a proxy of resilience2. In fact Keil and al. (2008)
measured resilience of Indonesian farmers to ENSO-related drought. They measured
resilience as ”the observed degree of drought-induced expenditure reductions for basic
necessities”. In that framework, the absolute value of negative variations is supposed
to be negatively correlated with resilience: a fully resilient household is expected to
record null variations of basic consumption. They use Principal Component Analysis to
aggregate the variables that describe consumption. In their analysis, the first principal
component is extracted and used to compute the scores. Then they specify a model to
identify the determinants of resilience.
However, as we stated earlier, the fact that resilience is a complex phenomenon
makes the proxy-based approach too simple to measure it.
For that reason and consistent with Ciani and Romano (2014), we adopt the ap-
2this is actually the most used approach to measure resilience
Resilience, food insecurity 8
proach of Alinovi and al (2010).
3 Methodology
Our methodology is built on Alinovi and al. (2010). Using a Cluster Analysis, we first
identify the livelihood strategy of households in Niger. The objective of the cluster
analysis is to assign households to groups identified as coping strategy options against
food insecurity. In our case, we adopt the hierarchical cluster analysis to group the
households of our sample data.
After building the livelihood strategies, we built the resilience to food insecurity
index based on a two-stage factor analysis: the Multiple Factor Analysis.
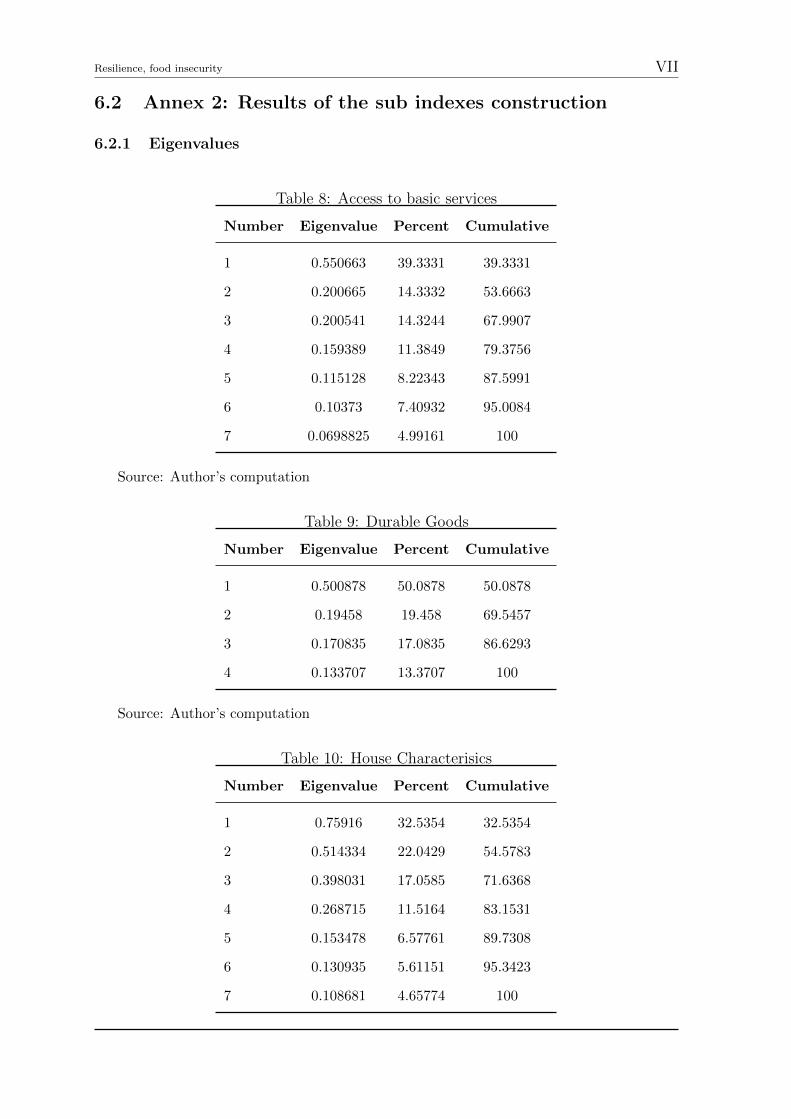
At the first stage we perform various factor analysis on the identified dimensions of
the household resilience to food insecurity. These factor analysis allow us to compute
some sub-index (IGi)(1≤i≤K) representing the K components (latent variables) of the
resilience index.
At the second stage we use a factor analysis again to compute the resilience index.
The resilience index we compute has 10 components:
• Access to basic services
• Durable Goods
• House Characteristics
• Adaptive Capacity
• Physical Connectivity
• Food security
• Agricultural Assets
• Durable Assets value
• Connectivity Assets value
Resilience, food insecurity 9
• Economics and demographics
The functional form of our Resilience Index, denoted RI is:
RI =
∑Kk=1 λkIGk∑K
k=1 λk(1)
In equation(1), λk is the weight of the component k and is drawn from the factor
loadings and the eigenvalues resulting from the Multiple Factor Analysis and IGkis the
sub index (latent variable) relative to the the component k.
The normalized resilience index (NormRI)is obtained by the following:
NormRI =RI − (minRIl)l=1,...,N
(maxRIl)l=1,...,N − (minRIl)l=1,...,N
(2)
Where N is the number of households in our sample.
3.1 Data and sources
The data are drawn from the Niger National Survey on Living Conditions and Agricul-
ture 2011. The ECVM/A is an integrated multi-topic household survey done for the
purpose of evaluating poverty and living conditions in Niger. This type of survey is
regularly done in Niger. The most two recent surveys were the QUIBB (Questionnaire
des Indicateurs de base du Bien-etre) in 2005 and the ENBC (Enquete Nationale sur le
Budget et la Consommation des Menages) in 2007/08. This survey was implemented
by the National Institute of Statistics (Institut National de la Statistique - INS) with
technical and financial assistance from the World Bank.
The survey covers a sample of 3,968 households with 1,538 in urban areas and 2,430
in rural areas. The sample was drawn using a stratified two-stage sampling, and to
cover urban areas (Niamey, Other urban) in two strata and all rural agro-ecological
zones (Agricultural, Agro-pastoral, Pastoral) in three strata. In the first stage of the
sampling, 270 enumeration areas (EA) were drawn among the nearly 10,000 EAs and
at the second stage, 12 or 18 households were drawn from each EA respectively in
urban and rural areas. Data collection was organized in two visits, a post-planting
Resilience, food insecurity 10
visit from mid-July to mid-September 2011 and a post-harvest visit in November and
December 2011. Three questionnaires were designed to collect a range of information
on households, their farms and the communities in which they live. For the household
questionnaire, the data collected concerned the household roster, health, education,
employment, non-farm enterprises, housing, non-labor income and food and non-food
consumption. The community questionnaire is dedicated to information on access to
services and market prices. As for the agriculture questionnaire, it is designed to collect
data on access to land, inputs used (seeds, fertilizers, pesticides, etc.), labor (household
and hired labor), equipment, production, marketing and farm income, and extensive
data on livestock.
For the purpose of our analysis, we concentrate on the Household heads and reduce
the sample to 3578 households.
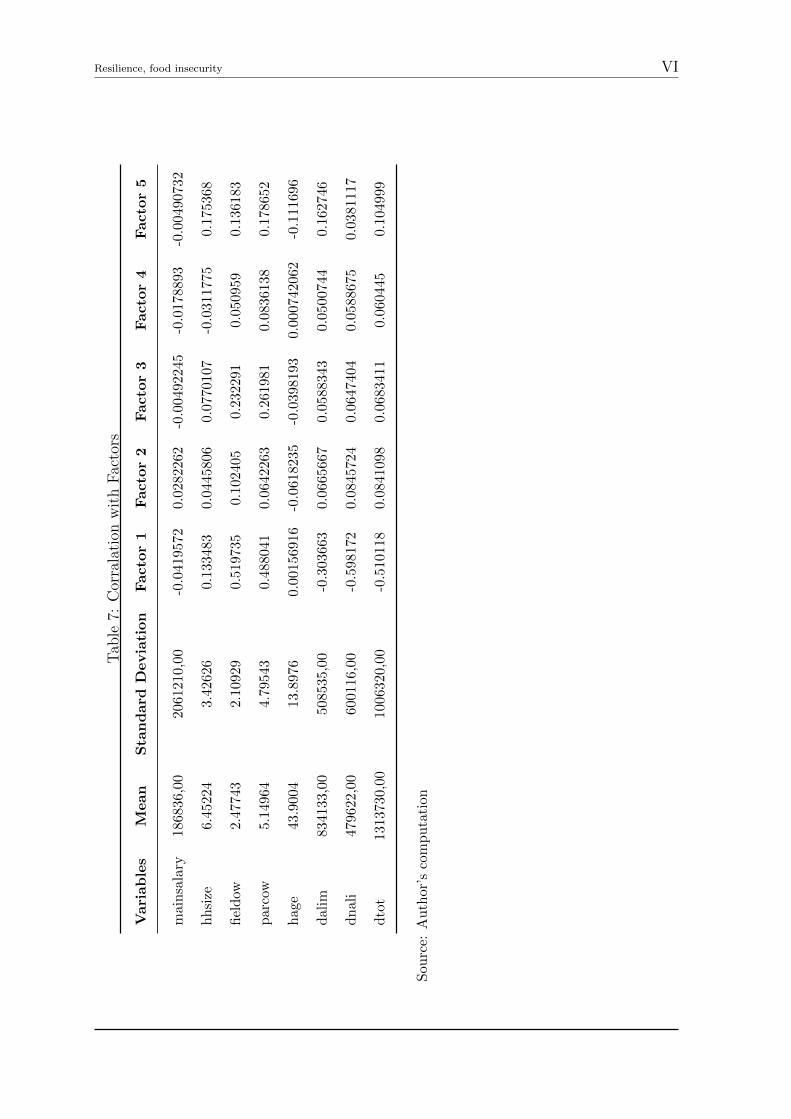
The variables used to identify the livelihood strategies are: the household head de-
mographic characteristics (age, gender, marital status, branch, socioeconomic group,
industry, socio professional category,etc.), the region, the food expenditures, the house-
hold size, the agricultural status, etc. Their descriptive statistics are presented in Annex
1.
4 Results
4.1 Livelihood groups
Our analysis identifies four (4) livelihood strategies groups in Niger households:
Resilience, food insecurity 11
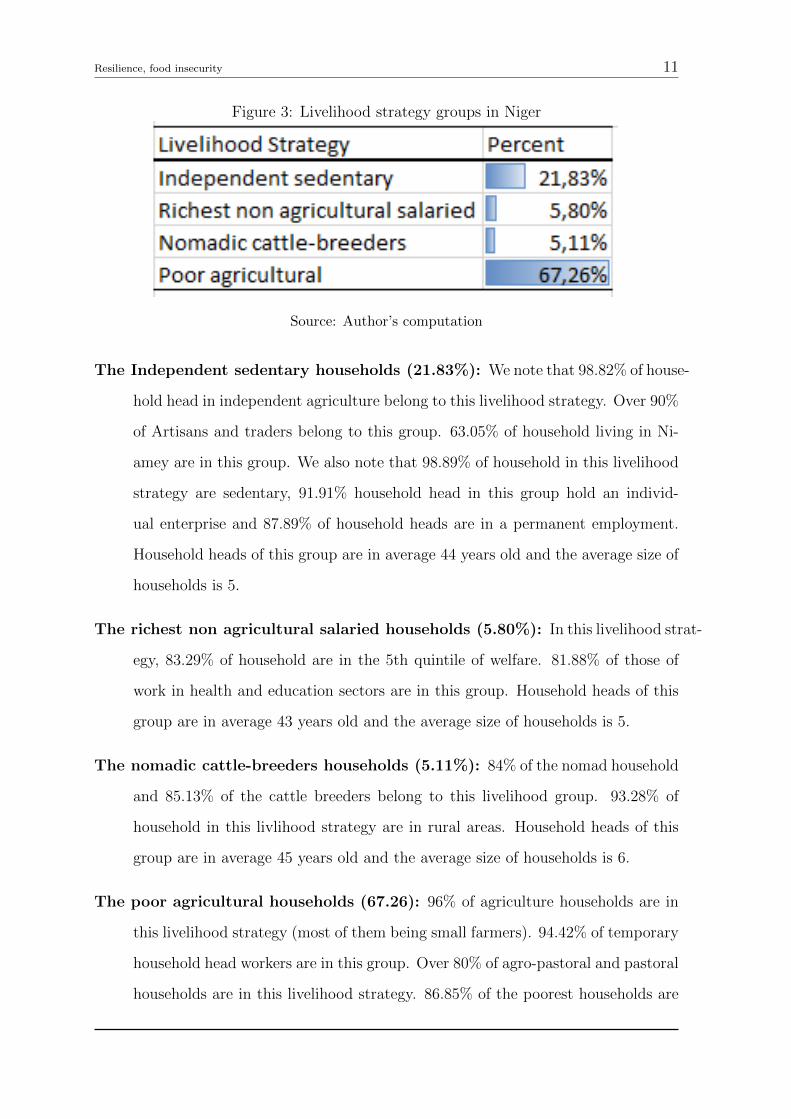
Figure 3: Livelihood strategy groups in Niger
Source: Author’s computation
The Independent sedentary households (21.83%): We note that 98.82% of house-
hold head in independent agriculture belong to this livelihood strategy. Over 90%
of Artisans and traders belong to this group. 63.05% of household living in Ni-
amey are in this group. We also note that 98.89% of household in this livelihood
strategy are sedentary, 91.91% household head in this group hold an individ-
ual enterprise and 87.89% of household heads are in a permanent employment.
Household heads of this group are in average 44 years old and the average size of
households is 5.
The richest non agricultural salaried households (5.80%): In this livelihood strat-
egy, 83.29% of household are in the 5th quintile of welfare. 81.88% of those of
work in health and education sectors are in this group. Household heads of this
group are in average 43 years old and the average size of households is 5.
The nomadic cattle-breeders households (5.11%): 84% of the nomad household
and 85.13% of the cattle breeders belong to this livelihood group. 93.28% of
household in this livlihood strategy are in rural areas. Household heads of this
group are in average 45 years old and the average size of households is 6.
The poor agricultural households (67.26): 96% of agriculture households are in
this livelihood strategy (most of them being small farmers). 94.42% of temporary
household head workers are in this group. Over 80% of agro-pastoral and pastoral
households are in this livelihood strategy. 86.85% of the poorest households are
Resilience, food insecurity 12
in this group. 85.77% of the household heads of this group have the primary
educational level. 81.40% of the rural households are in this group. Household
heads of this group are in average 44 years old and the average size of households
is 7.
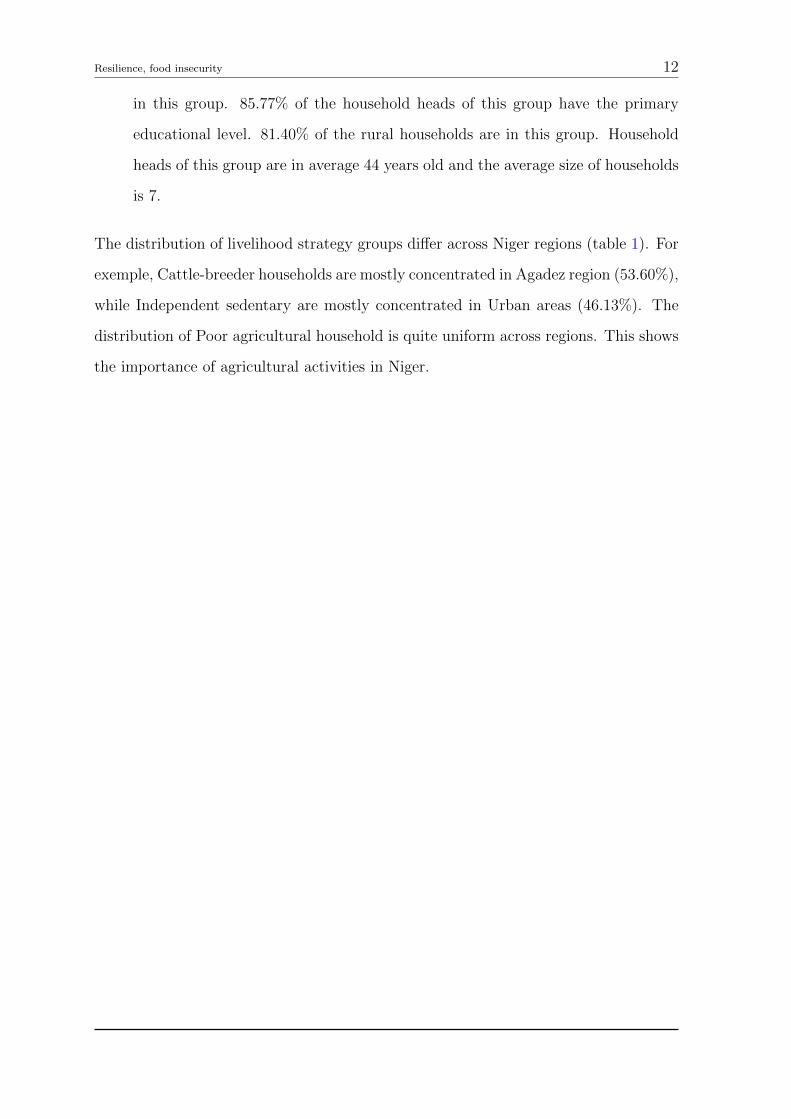
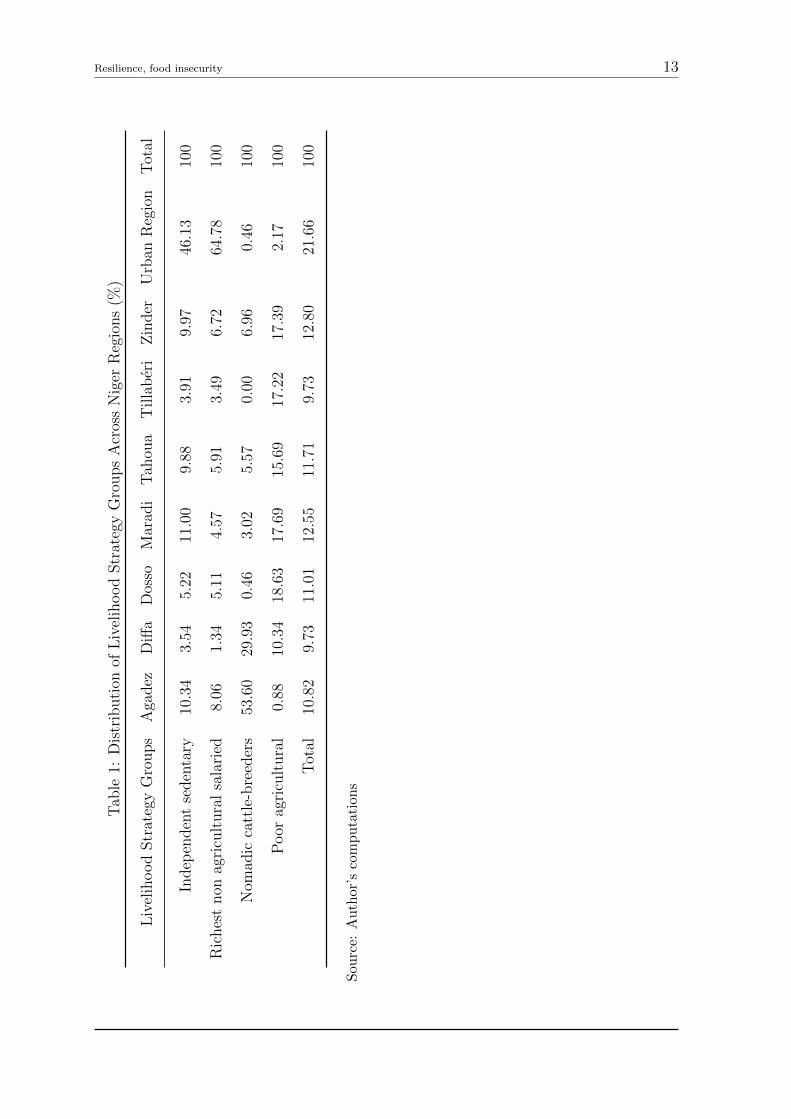
The distribution of livelihood strategy groups differ across Niger regions (table 1). For
exemple, Cattle-breeder households are mostly concentrated in Agadez region (53.60%),
while Independent sedentary are mostly concentrated in Urban areas (46.13%). The
distribution of Poor agricultural household is quite uniform across regions. This shows
the importance of agricultural activities in Niger.
Resilience, food insecurity 13
Tab
le1:
Dis
trib
uti
onof
Liv
elih
ood
Str
ateg
yG
roups
Acr
oss
Nig
erR
egio
ns
(%)
Liv
elih
ood
Str
ateg
yG
roups
Aga
dez
Diff
aD
osso
Mar
adi
Tah
oua
Tilla
ber
iZ
inder
Urb
anR
egio
nT
otal
Indep
enden
tse
den
tary
10.3
43.
545.
2211
.00
9.88
3.91
9.97
46.1
310
0
Ric
hes
tnon
agri
cult
ura
lsa
lari
ed8.
061.
345.
114.
575.
913.
496.
7264
.78
100
Nom
adic
catt
le-b
reed
ers
53.6
029
.93
0.46
3.02
5.57
0.00
6.96
0.46
100
Poor
agri
cult
ura
l0.
8810
.34
18.6
317
.69
15.6
917
.22
17.3
92.
1710
0
Tot
al10
.82
9.73
11.0
112
.55
11.7
19.
7312
.80
21.6
610
0
Sou
rce:
Au
thor
’sco
mputa
tions
Resilience, food insecurity 14
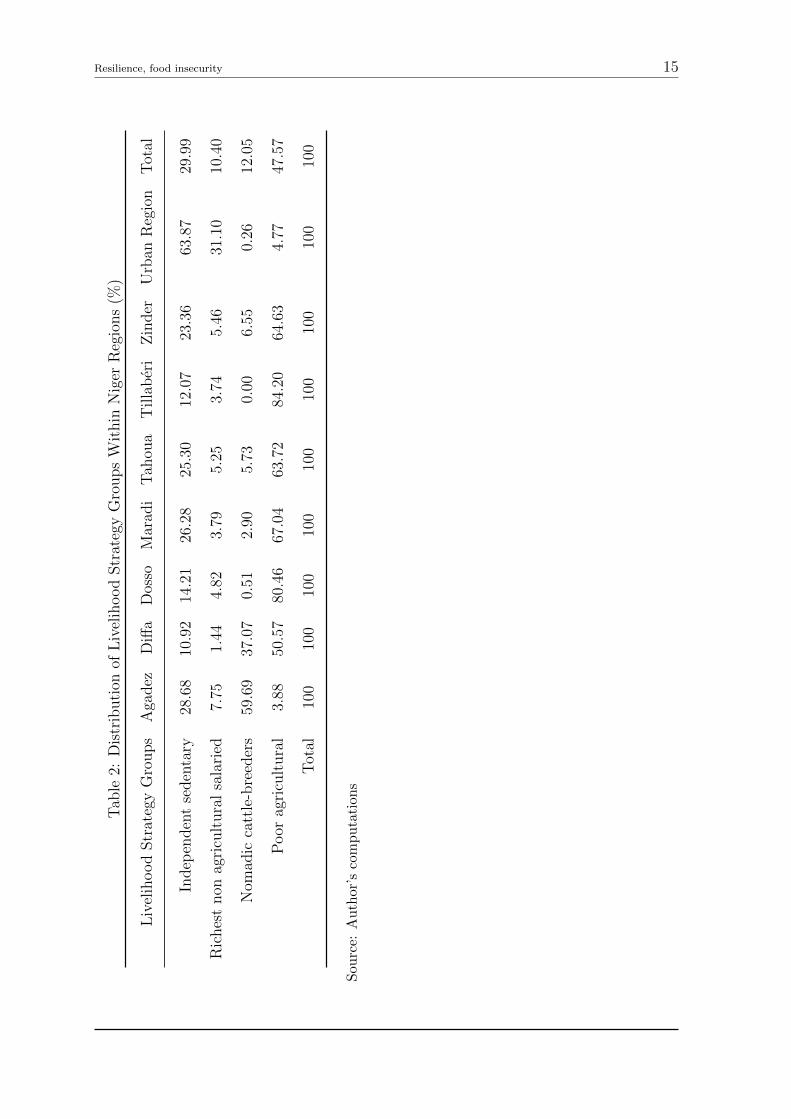
In table 2, we show the distribution of livelihood strategy groups within Niger
regions.
Resilience, food insecurity 15
Tab
le2:
Dis
trib
uti
onof
Liv
elih
ood
Str
ateg
yG
roups
Wit
hin
Nig
erR
egio
ns
(%)
Liv
elih
ood
Str
ateg
yG
roups
Aga
dez
Diff
aD
osso
Mar
adi
Tah
oua
Tilla
ber
iZ
inder
Urb
anR
egio
nT
otal
Indep
enden
tse
den
tary
28.6
810
.92
14.2
126
.28
25.3
012
.07
23.3
663
.87
29.9
9
Ric
hes
tnon
agri
cult
ura
lsa
lari
ed7.
751.
444.
823.
795.
253.
745.
4631
.10
10.4
0
Nom
adic
catt
le-b
reed
ers
59.6
937
.07
0.51
2.90
5.73
0.00
6.55
0.26
12.0
5
Poor
agri
cult
ura
l3.
8850
.57
80.4
667
.04
63.7
284
.20
64.6
34.
7747
.57
Tot
al10
010
010
010
010
010
010
010
010
0
Sou
rce:
Au
thor
’sco
mputa
tions
Resilience, food insecurity 16
It appears that the largest share of Cattle-Breeders can be found in Agadez region
(59.69%), the largest of Poor farming households is found in Tillaberi region (84.20%)
and the largest share of independent sedentary and non agricultural salaried is found
in Urban areas (63.87% and 31.10% respectively).
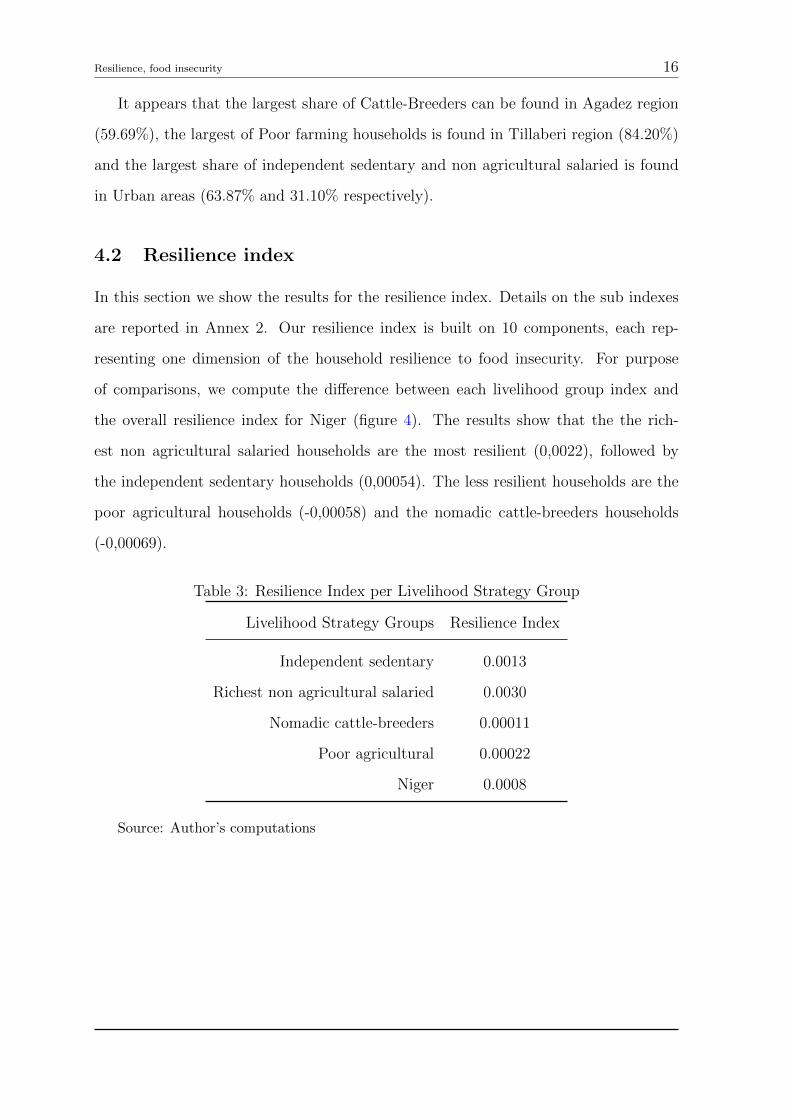
4.2 Resilience index
In this section we show the results for the resilience index. Details on the sub indexes
are reported in Annex 2. Our resilience index is built on 10 components, each rep-
resenting one dimension of the household resilience to food insecurity. For purpose
of comparisons, we compute the difference between each livelihood group index and
the overall resilience index for Niger (figure 4). The results show that the the rich-
est non agricultural salaried households are the most resilient (0,0022), followed by
the independent sedentary households (0,00054). The less resilient households are the
poor agricultural households (-0,00058) and the nomadic cattle-breeders households
(-0,00069).
Table 3: Resilience Index per Livelihood Strategy Group
Livelihood Strategy Groups Resilience Index
Independent sedentary 0.0013
Richest non agricultural salaried 0.0030
Nomadic cattle-breeders 0.00011
Poor agricultural 0.00022
Niger 0.0008
Source: Author’s computations
Resilience, food insecurity 17
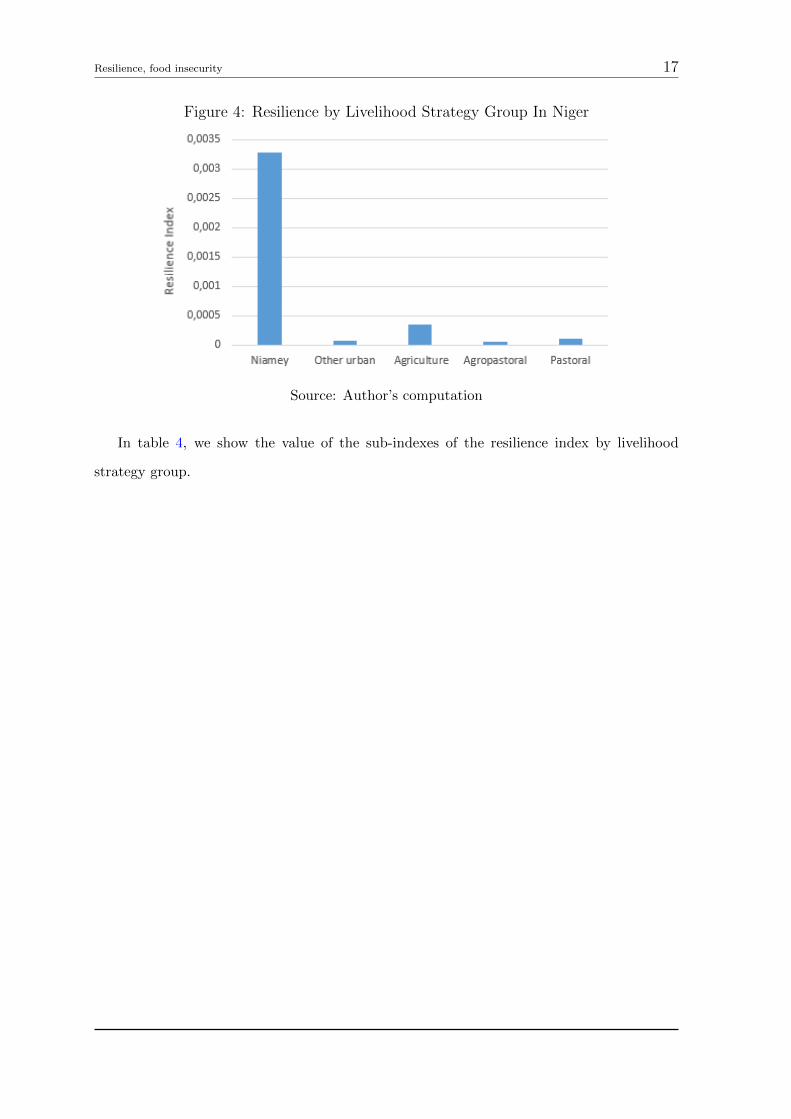
Figure 4: Resilience by Livelihood Strategy Group In Niger
Source: Author’s computation
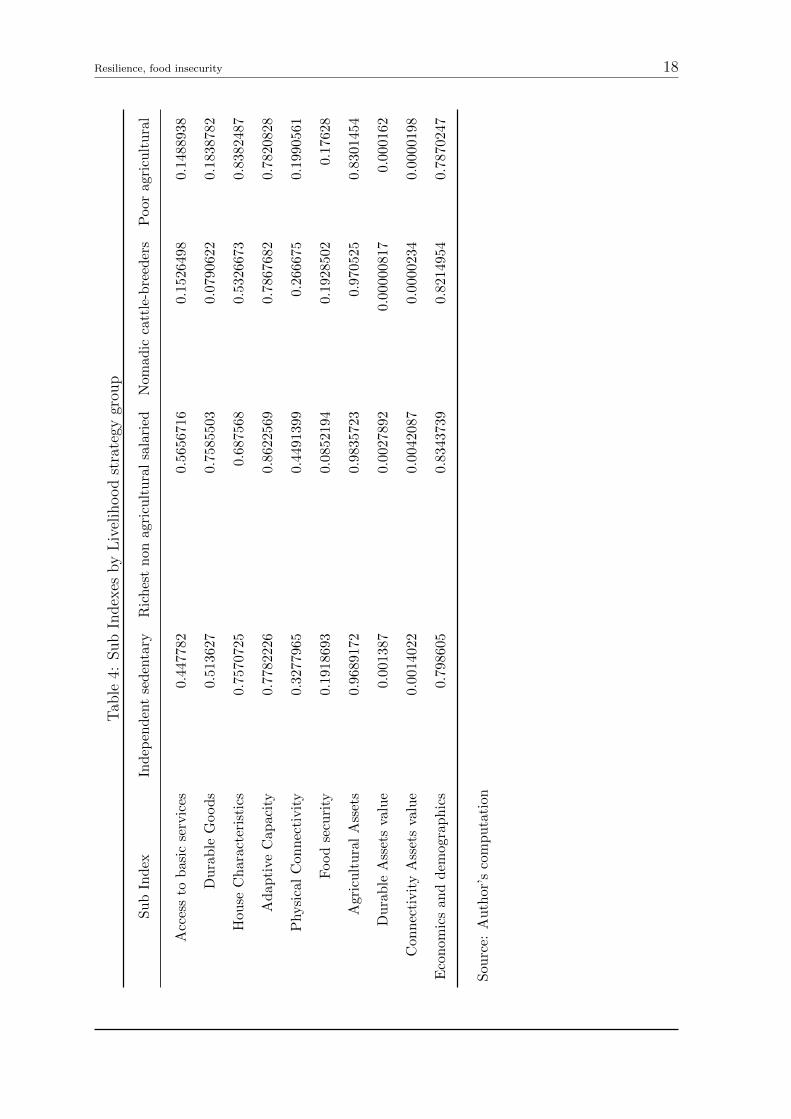
In table 4, we show the value of the sub-indexes of the resilience index by livelihood
strategy group.
Resilience, food insecurity 18
Tab
le4:
Sub
Index
esby
Liv
elih
ood
stra
tegy
grou
p
Su
bIn
dex
Ind
epen
den
tse
den
tary
Ric
hes
tn
onag
ricu
ltura
lsa
lari
edN
om
adic
catt
le-b
reed
ers
Poor
agri
cult
ura
l
Acc
ess
tobasi
cse
rvic
es0.4
4778
20.
5656
716
0.1
526498
0.1
488938
Dura
ble
Good
s0.5
1362
70.
7585
503
0.0
790622
0.1
838782
Hou
seC
hara
cter
isti
cs0.7
5707
250.
6875
680.5
326673
0.8
382487
Adap
tive
Capac
ity
0.77
8222
60.
8622
569
0.7
867682
0.7
820828
Physi
cal
Con
nec
tivit
y0.3
2779
650.
4491
399
0.2
66675
0.1
990561
Food
secu
rity
0.19
1869
30.
0852
194
0.1
928502
0.1
7628
Agri
cult
ura
lA
sset
s0.
9689
172
0.98
3572
30.9
70525
0.8
301454
Dura
ble
Ass
ets
valu
e0.
0013
870.
0027
892
0.0
0000817
0.0
00162
Con
nec
tivit
yA
sset
sva
lue
0.00
1402
20.
0042
087
0.0
000234
0.0
000198
Eco
nom
ics
and
dem
ogr
aphic
s0.
7986
050.
8343
739
0.8
214954
0.7
870247
Sou
rce:
Au
thor
’sco
mputa
tion
Resilience, food insecurity 19
For instance it appears that access to water, electricity and other basic social services
is a tough issue for the less two resilient livelihood strategy groups, namely the Nomadic
cattle-breeders and the poor agricultural households.
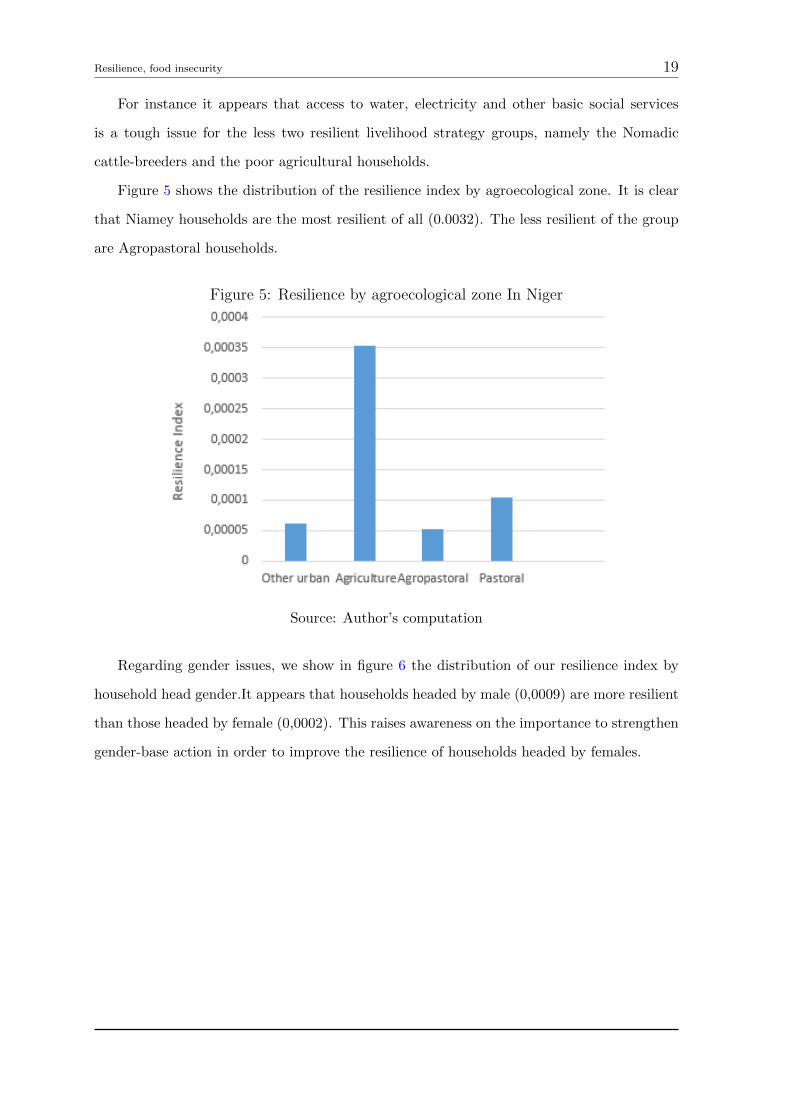
Figure 5 shows the distribution of the resilience index by agroecological zone. It is clear
that Niamey households are the most resilient of all (0.0032). The less resilient of the group
are Agropastoral households.
Figure 5: Resilience by agroecological zone In Niger
Source: Author’s computation
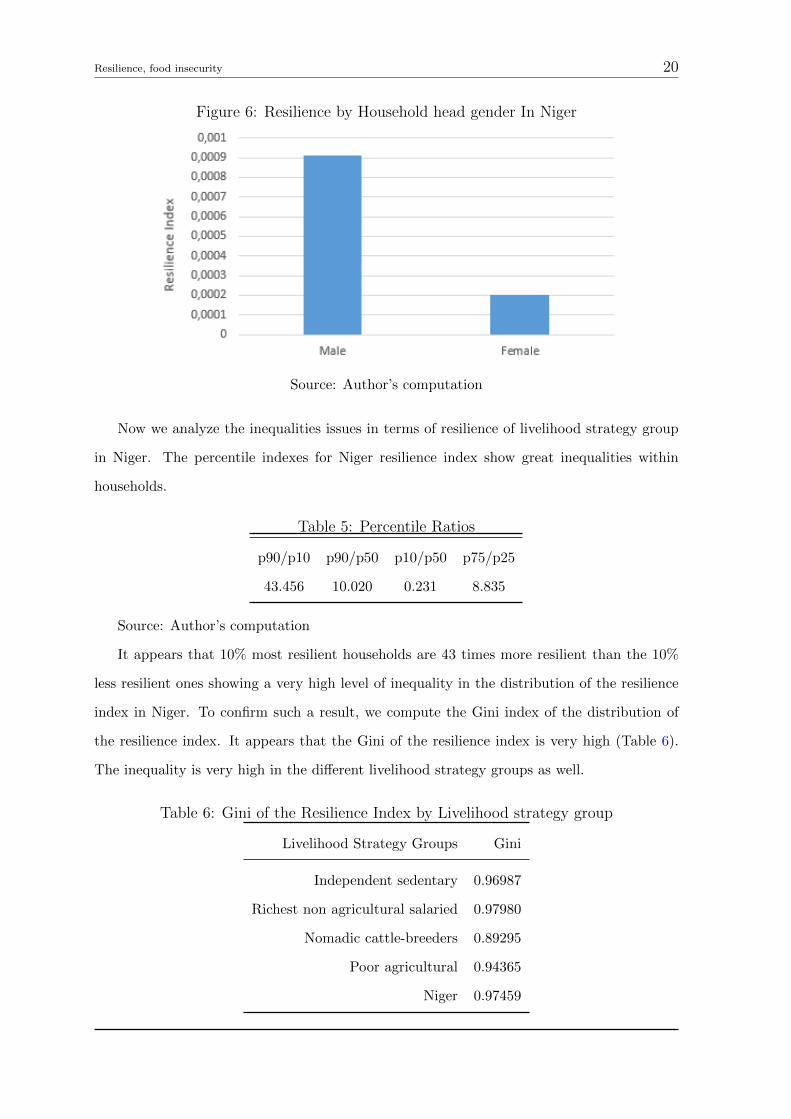
Regarding gender issues, we show in figure 6 the distribution of our resilience index by
household head gender.It appears that households headed by male (0,0009) are more resilient
than those headed by female (0,0002). This raises awareness on the importance to strengthen
gender-base action in order to improve the resilience of households headed by females.
Resilience, food insecurity 20
Figure 6: Resilience by Household head gender In Niger
Source: Author’s computation
Now we analyze the inequalities issues in terms of resilience of livelihood strategy group
in Niger. The percentile indexes for Niger resilience index show great inequalities within
households.
Table 5: Percentile Ratios
p90/p10 p90/p50 p10/p50 p75/p25
43.456 10.020 0.231 8.835
Source: Author’s computation
It appears that 10% most resilient households are 43 times more resilient than the 10%
less resilient ones showing a very high level of inequality in the distribution of the resilience
index in Niger. To confirm such a result, we compute the Gini index of the distribution of
the resilience index. It appears that the Gini of the resilience index is very high (Table 6).
The inequality is very high in the different livelihood strategy groups as well.
Table 6: Gini of the Resilience Index by Livelihood strategy group
Livelihood Strategy Groups Gini
Independent sedentary 0.96987
Richest non agricultural salaried 0.97980
Nomadic cattle-breeders 0.89295
Poor agricultural 0.94365
Niger 0.97459
Resilience, food insecurity 21
Source: Author’s computation
5 Conclusion and policy implications
This study gave focus to household resilience to food insecurity in Niger. For the purpose, a
cluster analysis double with a Multiple Factor Analysis has been conducted. The objective
of the cluster approach was to identify livelihood strategy groups with Nigerien households.
The resilience index estimates show significant differences across region and identified
livelihood strategy groups. The leading findings show that the cattle-breeders households are
the less resilient in Niger and that households led by women are less resilient than those led
by men. As policy implication, it is suggested to improve the access to basics services for
cattle-breeders and to strengthen the gender-base policy in order to empower women and to
make them more resilient to food insecurity.
Some further investigation may deepen the gender disparities in household resilience to
food insecurity.
Resilience, food insecurity I
References
[1] Alinovi, L., Erdgin, M. and Donato, R. Towards the measurement of household
resilience to food insecurity: Applying a model to palestinian household data. In R.
Sibrian (ed. 2008), Deriving Food Security Information From National Household Budget
Surveys. Experiences, Achievement, Challenges, Rome: FAO, pages 137–52, 2008.
[2] Alinovi, L., D’Errico, M., Erdgin, M. and Donato, R. Livelihoods strategies and
household resilience to food insecurity: An empirical analysis to kenya. European Report
On Development, 2010.
[3] Carter M.R., Little P.D., Mogues T., and Negatu W. Shocks, sensitivity and
resilience: Tracking the economic impacts of environmental disaster on assets in ethiopia
and honduras. DSGD Discussion Paper, No 32, Washington D.C.: IFPRI., 2006.
[4] Ciani, F., and Romano, D. Testing for household resilience to food insecurity: Ev-
idence from nicaragua. University of Florence, Department of Economics and Manage-
ment, 2014.
[5] Dercon, S., and Krishnan, P. Income portfolios in rural ethiopia and tanzania:
Choices and constraints. Journal of Development Studies, (32(6)):850–75, 1996.
[6] Keil A., Zeller M., Wida A., Sanim B. and Birner R. What determines farmers’
resilience towards enso related drought? an empirical assessment in central sulawesi,
indonesia. Climate Change, (86):291–307, 2008.
Resilience, food insecurity II
6 Annex
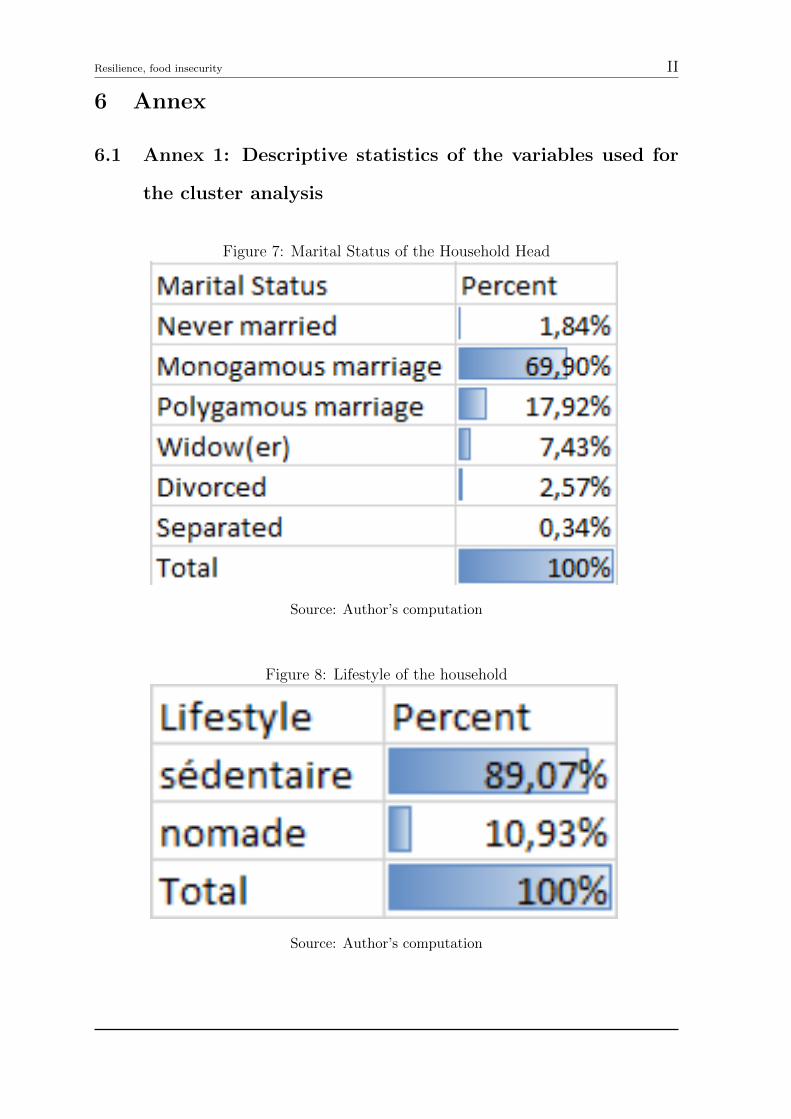
6.1 Annex 1: Descriptive statistics of the variables used for
the cluster analysis
Figure 7: Marital Status of the Household Head
Source: Author’s computation
Figure 8: Lifestyle of the household
Source: Author’s computation
Resilience, food insecurity III
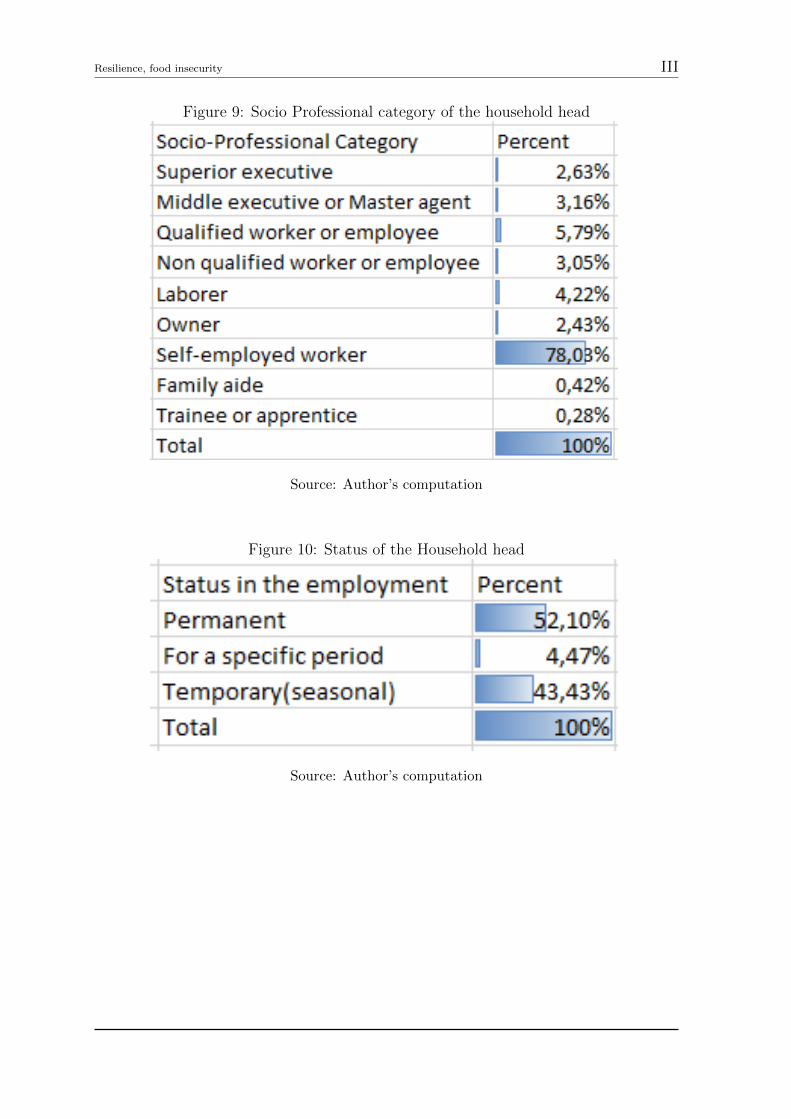
Figure 9: Socio Professional category of the household head
Source: Author’s computation
Figure 10: Status of the Household head
Source: Author’s computation
Resilience, food insecurity IV
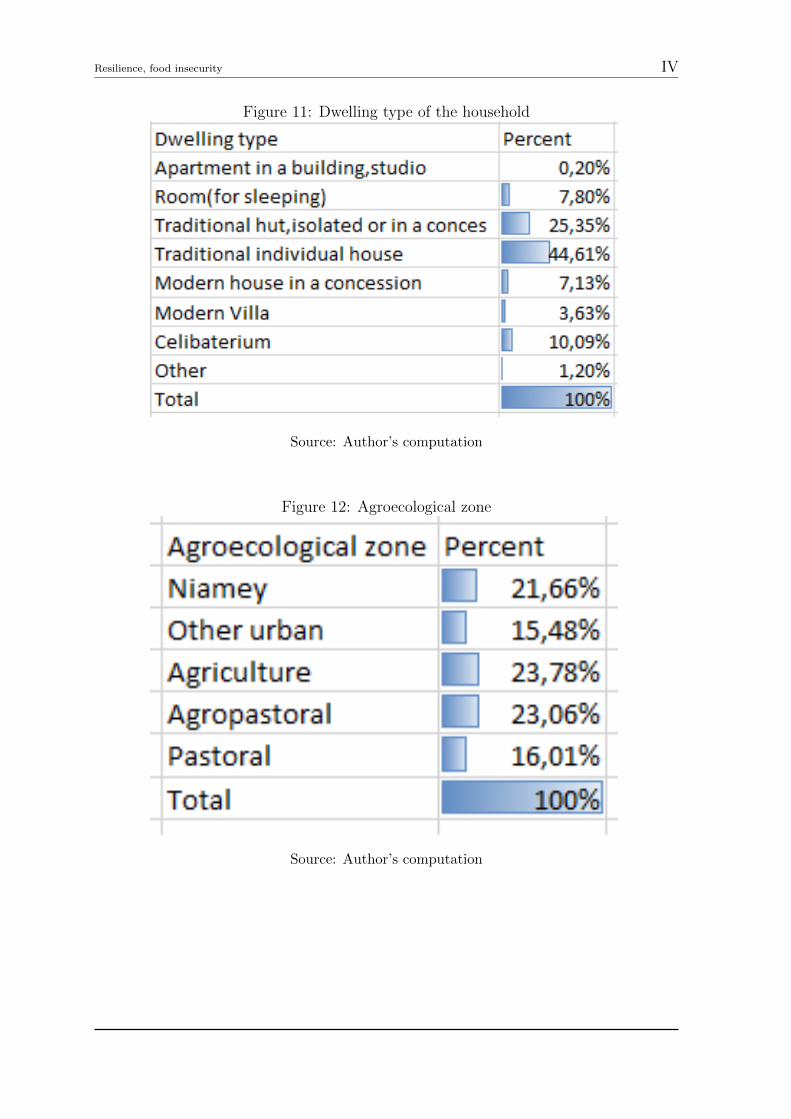
Figure 11: Dwelling type of the household
Source: Author’s computation
Figure 12: Agroecological zone
Source: Author’s computation
Resilience, food insecurity V
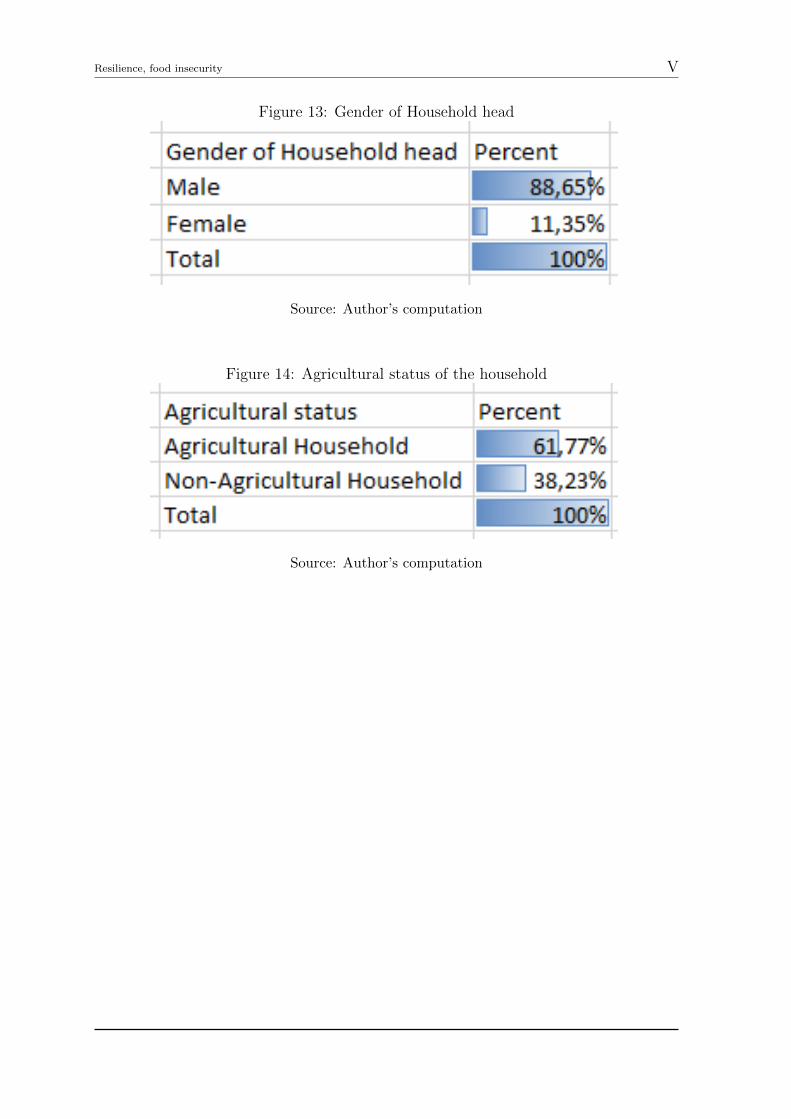
Figure 13: Gender of Household head
Source: Author’s computation
Figure 14: Agricultural status of the household
Source: Author’s computation
Resilience, food insecurity VI
Tab
le7:
Cor
rala
tion
wit
hF
acto
rs
Variables
Mean
Sta
ndard
Deviation
Facto
r1
Facto
r2
Facto
r3
Facto
r4
Facto
r5
main
sala
ry18
6836
,00
206
1210
,00
-0.0
4195
720.
0282
262
-0.0
0492
245
-0.0
178893
-0.0
0490732
hh
size
6.4
5224
3.42
626
0.13
3483
0.04
4580
60.
0770
107
-0.0
311775
0.1
75368
fiel
dow
2.4
7743
2.10
929
0.51
9735
0.10
2405
0.23
2291
0.050959
0.1
36183
parc
ow5.
1496
44.7
9543
0.48
8041
0.06
4226
30.
2619
810.
0836138
0.1
78652
hage
43.
9004
13.8
976
0.00
1569
16-0
.061
8235
-0.0
3981
930.
000742062
-0.1
11696
dalim
8341
33,0
0508
535,
00-0
.303
663
0.06
6566
70.0
5883
430.
0500744
0.1
62746
dn
ali
479
622,
0060
0116
,00
-0.5
9817
20.
0845
724
0.0
647
404
0.0
588675
0.0
381117
dto
t131
3730
,00
100
6320
,00
-0.5
1011
80.
0841
098
0.0
6834
110.
060445
0.1
04999
Sou
rce:
Au
thor
’sco
mputa
tion
Resilience, food insecurity VII
6.2 Annex 2: Results of the sub indexes construction
6.2.1 Eigenvalues
Table 8: Access to basic services
Number Eigenvalue Percent Cumulative
1 0.550663 39.3331 39.3331
2 0.200665 14.3332 53.6663
3 0.200541 14.3244 67.9907
4 0.159389 11.3849 79.3756
5 0.115128 8.22343 87.5991
6 0.10373 7.40932 95.0084
7 0.0698825 4.99161 100
Source: Author’s computation
Table 9: Durable Goods
Number Eigenvalue Percent Cumulative
1 0.500878 50.0878 50.0878
2 0.19458 19.458 69.5457
3 0.170835 17.0835 86.6293
4 0.133707 13.3707 100
Source: Author’s computation
Table 10: House Characterisics
Number Eigenvalue Percent Cumulative
1 0.75916 32.5354 32.5354
2 0.514334 22.0429 54.5783
3 0.398031 17.0585 71.6368
4 0.268715 11.5164 83.1531
5 0.153478 6.57761 89.7308
6 0.130935 5.61151 95.3423
7 0.108681 4.65774 100
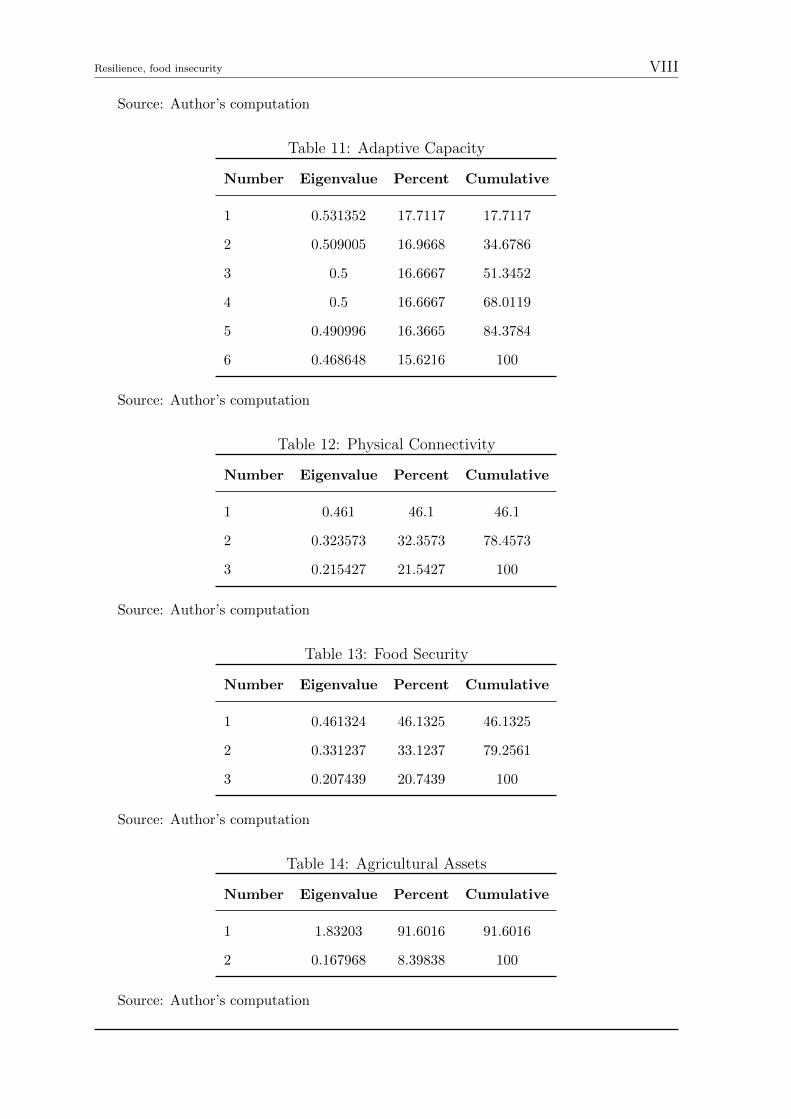
Resilience, food insecurity VIII
Source: Author’s computation
Table 11: Adaptive Capacity
Number Eigenvalue Percent Cumulative
1 0.531352 17.7117 17.7117
2 0.509005 16.9668 34.6786
3 0.5 16.6667 51.3452
4 0.5 16.6667 68.0119
5 0.490996 16.3665 84.3784
6 0.468648 15.6216 100
Source: Author’s computation
Table 12: Physical Connectivity
Number Eigenvalue Percent Cumulative
1 0.461 46.1 46.1
2 0.323573 32.3573 78.4573
3 0.215427 21.5427 100
Source: Author’s computation
Table 13: Food Security
Number Eigenvalue Percent Cumulative
1 0.461324 46.1325 46.1325
2 0.331237 33.1237 79.2561
3 0.207439 20.7439 100
Source: Author’s computation
Table 14: Agricultural Assets
Number Eigenvalue Percent Cumulative
1 1.83203 91.6016 91.6016
2 0.167968 8.39838 100
Source: Author’s computation
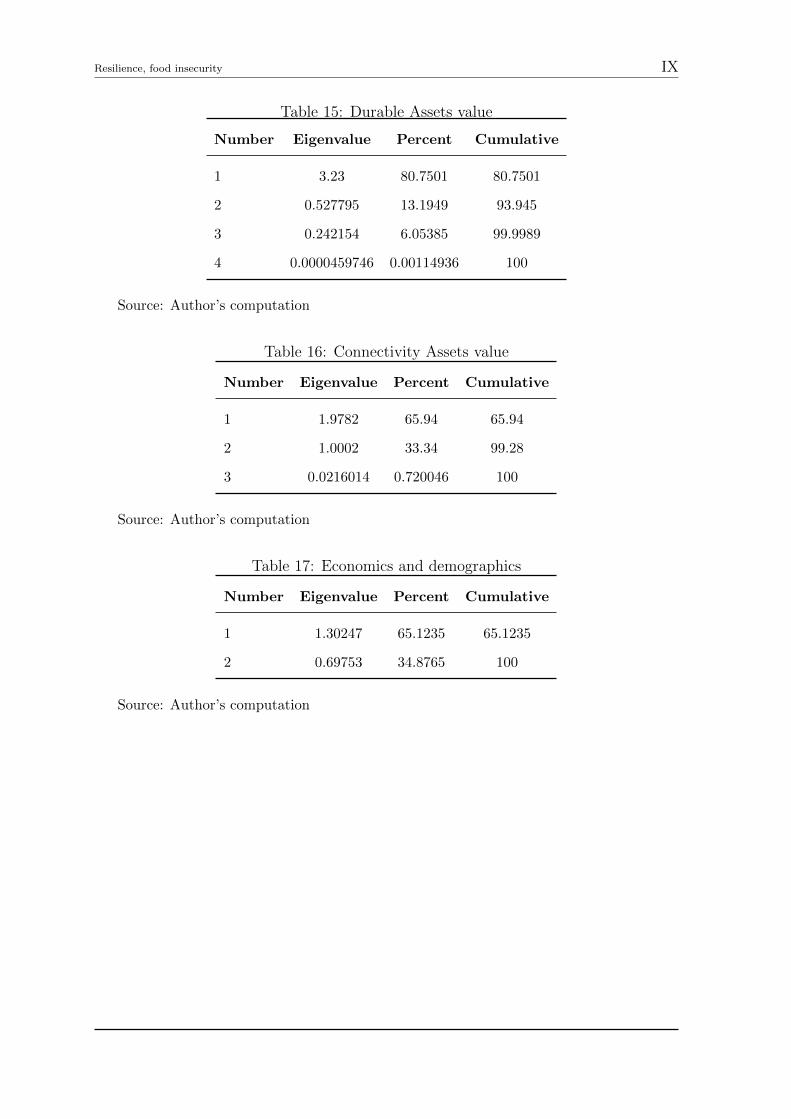
Resilience, food insecurity IX
Table 15: Durable Assets value
Number Eigenvalue Percent Cumulative
1 3.23 80.7501 80.7501
2 0.527795 13.1949 93.945
3 0.242154 6.05385 99.9989
4 0.0000459746 0.00114936 100
Source: Author’s computation
Table 16: Connectivity Assets value
Number Eigenvalue Percent Cumulative
1 1.9782 65.94 65.94
2 1.0002 33.34 99.28
3 0.0216014 0.720046 100
Source: Author’s computation
Table 17: Economics and demographics
Number Eigenvalue Percent Cumulative
1 1.30247 65.1235 65.1235
2 0.69753 34.8765 100
Source: Author’s computation