Embed Size (px)
Citation preview

LiveAction.com Page 1 of 7
Technical Data Sheet
LiveNX
Network and Application Performance Monitoring PlatformLiveNX collects and analyzes data directly from network devices to analyze and present insights to design, policy verification, and operations across the enterprise to deliver peak performance for an optimal customer experience.
Overview
End-to-end Flow Visualizations Across the NetworkLiveNX’s patented visualization technology simplifies network operations and troubleshooting. LiveNX correlates multiple data sets to provide views, graphs and maps to illustrate the current state of applications and network performance.
Application Visibility and TroubleshootingGain a deep understanding of application traffic with full visibility of protocol and application type including video, voice, instant messaging, file transfer, etc. Troubleshoot applications deployed in the data center, public cloud or SaaS. Understand how your network is being used, how applications are performing, and which sanctioned or unsanctioned applications are being used.
Intuitive Graphical Interface for QoS ControlCreate, edit and apply QoS polices for Cisco routers and Layer 3 switches on live networks consistently and confidently. QoS wizard and built-in templates are available to apply policies based on Cisco best practices or use the QoS GUI editor to build custom policies. LiveNX generates a QoS audit report to show QoS policies in detail, including configuration settings, performance issues, drops, and policy errors
Software-Defined WAN ManagementUtilize application and path visualizations to effectively validate WAN Return-on-Investment (ROI) for traditional MPLS, hybrid, or Software- Defined WAN (SD-WAN). When a network element makes a path change to protect the applications due to an Out-of-Policy (OOP) condition, LiveNX renders the end-to-end path changes graphically. Visualize the network and overlay paths from the branch-office, through the service provider(s) to the data center where the applications reside, for meaningful and actionable information.LiveNX gathers real-time data from both multi-vendor network elements as well as Cisco-specific REST APIs (DNA Center, vManage BFD (Bidirectional Forward Detection) and AppId (Application Identification to provide accurate visual analytics)).
Key Features
Rapid Incident Response with Flow to Packet AnalysisWorkflow OptimizationResolving complex incidents can be challenging when different systems, vendors, devices and software are involved. LiveNX optimizes a rapid incident response workflow with Alert notification or predictive insight where the event is identified for remediation. Within LiveNX’s Engineering Console, NetOps can easily isolate the issue with the visual analytics presented as topology, site or device views. LiveNX presents the time stamp from the Alert and problem isolation from the Flow data, should additional analysis be necessary the NetOps team can quickly cross launch Omnipeek for deep packet analysis for root cause.
Rapid Incident Response for Faster Incident Resolution

LiveAction.com Page 2 of 7
LiveNXTechnical Data Sheet
LiveWire Integration for Monitoring WAN Edge Segments
The LiveWire Network Monitoring Appliance is optimized for WAN edge applications to provide packet capture and integrated IPFIX Export solution with LiveNX. LiveWire captures and converts real-time packet data which feeds directly into the visualization engine of LiveNX.Together, LiveWire and LiveNX bring new visual insights and analytics to traditionally “dark” environments such as application classification and performance management for SD-WAN deployments or traditioal legacy multi-vendor edge switch environments. LiveWire is extremely powerful for numerous use cases including branch wireless monitoring, point-of-sale transaction troubleshooting and VoIP troubleshooting.
LiveNALiveNA is an AIOps appliance that applies machine learning and heuristics to network datasets for advanced anomaly detection and predictive analytics for deeper network understanding. Together with LiveNX it provides “expert in the box” insights. This is accomplished by baselining and trending what is normal in a network, detecting anomalies, and correlating events for deeper network and application performance insights.
Application Visibility and Control (AVC) Reports
LiveNX presents advanced network performance data with Cisco Application Control and Visibility (AVC) data. With this network data, LiveNX reports on Top Applications Performance and AVC Applications with latency, jitter, packet loss and advanced performance indicators for: sites, devices, users and service provider environments.
Alerting Enhancements – Site Availability
LiveNX — Site Availability ReportThe LiveNX Operations Dashboard now supports site availability reports and custom widgets to illustrate an aggregated alerting view. NetOps teams can now visualize the Dashboard Alerts in one location by Site, Device, or Interface for easier access with summarized views.Site availability is a helpful trend to observe. This is one where fluctuations should be very small, and KPIs controlled tightly. As a leading indicator of possible SLA violations, hazardous areas or poor deployment scenarios, Site Availability Reports are best integrated in a Service Level View and tie it together with Application performance and Network QoS Class reporting.
Cisco Integrations
LiveNX offers the broadest suite of integration for Cisco environments. In LiveNX 8, Cisco DNA Center API integration is now available for General Availability, in addition to Cisco Identity Service Engine (ISE), vManage (SD-WAN), SD-Access and PxGrid connectors. These integrations provide rich datasets for LiveNX advanced visual analytics. Real-time Topology Flow Views and forensic playback and analysis are key NetOps elements.
LiveWire — WAN Edge Continual Monitoring
LiveNX Operations Dashboard — Current Alerts by Site
LiveNX Cisco DNA Center Integration

LiveAction.com Page 3 of 7
LiveNXTechnical Data Sheet
Key Capabilities
Flow and Packet Optimized Workflow for Network TroubleshootingWith both flow and packet level analysis NetOps can now isolate problem areas quickly and have a rapid response ready for any high severity incidents.With Flow Topology Views and integrated Expert Packet Analysis, LiveNX optimizes the problem isolation to root cause incident management cycle. With integrated ServiceNow ITOM workflows, LiveNX is a key platform for NetOps to resolve incidents faster, and report on status and impact to the business.
Visual AnalyticsVisualization allows you to better understand network traffic so that you can identify trouble spots.
• Application and flow path analysis
• Multi-vendor support – NetFlow v5/v9, IPFIX, sFlow and J-Flow
• Jitter, delay, packet loss metrics for voice and video
• Application response times, round-trip time, server delay and client delay metrics
• NetFlow Secure Event Logging (NSEL)
• Wireless information including user identity
• Firewall high-speed logging
• End-system (device type, OS) and end-user information
• Integration with Network Packet Brokers
• Flow DVR for playback of historical data
• Built-in Domain Name System (DNS) name resolution
• Topology export to Visio
Software-Defined WAN MonitoringGUI-based management for SD-WAN monitoring for path control and application performance optimization.
• Path control visualization
• SD-WAN dashboard and trending
• PfRv3 multiple data center support
• Shows what Out-of-Policy reason triggers path change(s)
• Reports on traffic class/application associated
Cisco SD-WAN Support (Viptela)LiveNX consolidates a unified reporting, inventory, and alert notification. For Cisco SD-WAN, LiveNX supports:
• Cisco vEdge, cEdge and ENCS platform support
• Cisco IWAN support
• Cisco SD-WAN Site to Site Topology View
• Overlay visibility – VPN, tunnel
• Service Provider transport
• Performance Status
• Filtering by application, DSCP, VPN or Service Provider
• Cisco SD-WAN Site to Site Analysis
• Policy verification
• Application – VPN – DSCP – Service Provider service status
• Viptela device inventory, including vEdge routers and management devices like vManage, vBond and vSmart
• Add relevant interfaces for monitoring from each vEdge router.
• Device monitoring credentials, like SNMP settings
• Gather network semantic information per device and interface:
• Site association per device
• Site geo location
• WAN interfaces per device
• Service Provider associated with each WAN interface. Note: Viptela refers to the service provider information as ‘colors.’ Capacity of WAN links (inbound and outbound)
• Site IP mappings
• Determine if a device is in the data center
• Viptela VPN ID mapping to a VPN name
• vManage API: BFD (Bidirectional Forward Detection), AppId and Alarms.
Cisco IWAN Support
• PfR configuration of multiple Master Controllers
• Automatically learn semantic settings for PfRv3 monitoring to simplify setup
• PfRv3 multiple data center support
QoS MonitoringTrack QoS performance on a per-class basis. Monitoring and alerting of priority queue drops provides proactive notification of potential voice quality issues.
• NBAR2 application visualization
• Custom NBAR definitions
• Pre- and post-QoS graphs
• Detailed graphical display of interface and CBQoS statistics
• 95th/99th percentile, quarterly, yearly and collated reports

LiveAction.com Page 4 of 7
LiveNXTechnical Data Sheet
AlertingLiveNX associates Events from devices (routers, switches, firewalls, etc.) to Alerts, which are generated upon meeting specific criteria, such as a threshold, and are displayed in the Operations Dashboard.With the Event-to-Alert mapping concept, LiveNX is able to eliminate the common complaint that the number of alerts being created is too high, thereby displaying only the alerts that require immediate attention.Alerts are categorized into three severity levels:
Critical:
The highest severity, e.g., for alerts that would cause the biggest problem to the network
Warning:
A high severity, e.g., for alerts that may indicate issues that are problematic or will become problematic
Info:
A low severity, e.g., an issue that is worth knowing about but may not be that detrimental to the networkAlerts can be configured to integrate into workflows within industry incident management systems such as ServiceNow and PagerDuty.
QoS ConfigurationCreate, edit, and apply QoS policies for Cisco routers and Layer 3 switches on live networks. Use the QoS wizard and built-in templates to apply policies across multiple devices based on Cisco best practices or use the QoS GUI editor to build policies.
• Full Modular QoS configuration support including WRED, CBWFQ, and Priority Queue
• Hierarchical policy creation for advanced configurations
• Custom NBAR2-based matches including high-level attributes, HTTP URL, MIME, HOST and RTP protocols
• Built-in ACL editor
• Built-in rules for QoS settings that highlight violations
• Configuration audit trail
• System-wide QoS audit
• LAN Service Policy
LANVisualize Spanning Tree Protocol. Provide real-time Layer 2 visualizations for networks, including trunk interface, port channels, VLAN associations and bandwidth percentages. Run Layer 2 QoS reports.
RoutingReal-time routing visualizations for Cisco networks that can identify reachability problems, routing loops, and asymmetric paths affecting traffic quality. In addition, the policy-based routing viewer/editor provides a high degree of control over traffic policy to route traffic easily and predictably over user-specified paths.
IP SLACisco IOS IP SLA is easily accessible to generate and monitor synthetic network traffic to baseline network performance, test policy changes, or proactively monitor key network paths. Synthetic traffic types include data (HTTP, FTP, DNS, DHCP) and voice that can be used to measure latency, loss, jitter, and Mean Opinion Score (MOS) for VoIP. The highly interactive graphical interface delivers the functionality and flexibility of IP SLA features without the need to learn and use Cisco device command lines.
Test Types:
DHCP, DNS, ICMP Echo, FTP, HTTP, Jitter, UDP Echo, Video Operations
Latency:
MOS performance measurements, loss, jitter
Large-Scale:
Wizard-based IP SLA provisioning in full-mesh and hub/spoke configuration

LiveAction.com Page 5 of 7
LiveNXTechnical Data Sheet
Integrations and Component Architecture
LiveNXLiveNX is a network and application performance monitoring platform with patented end-to-end visualization for a global view of the network and the ability to drill-down to individual devices. Using LiveNX, enterprises gain real- time and continuous insight into network traffic based on application and user level activity. LiveNX offers the ability to gather and analyze volumes of network data at scale from every device, application and user to reduce mean time to repair, and it performs exploratory and explanatory analysis.
Omnipeek
• Deep packet analysis
• Vast library of decoders
• Expert system – suggested causes
LiveUXLiveUX monitors end-user experience of web applications. By combining the end-user experience metrics with the network performance monitoring information, you can quickly triage performance issues.
• Integrated LiveNX and LiveUX dashboard for instant visibility of site health, network devices, application usage, and application performance (incl. Unified Communications).
• Quickly identify the sites that are experiencing performance degradation and the applications impacted
• From the site, drill down to examine network conditions including bandwidth utilization, link errors, QoS metrics and applications that are competing for the bandwidth
LiveNX Monitor of MonitorsLiveNX Monitor of Monitors provides a single-pane-of-glass for server settings, system health, sites and configuration, aggregating multiple geographical or organizationally segmented LiveNX domains. Through an aggregation layer, each LiveNX server domain instance injects relevant data for summary dashboard views and management by way of a north-bound REST API.

LiveAction.com Page 6 of 7
LiveNXTechnical Data Sheet
System Requirements
Deployment Options
Component Virtual Appliance (OVA)
Virtual Appliance (Hyper-V)
Amazon Web Services (AMI) Microsoft Azure LiveNX Server
Appliance
LiveUX Application Monitoring X X X X X
LiveNX Server X X X X X
LiveNX Node X X X X X
LiveNX Deployment
Deployment OptionsLiveNX components can be deployed via the following methods: Virtual, Physical, and Cloud. The Virtual Deployment Specifications, as well as the Cisco and Multi-Vendor Device Support lists are provided below.If you are interested in deploying LiveNX in a Physical, Cloud (Azure, AWS, & Google Cloud), Hyper-V, or KVM environment, please contact LiveAction sales ([email protected]) for the specifications appropriate for those environments and your needs.
Virtual Deployment SpecificationsThe LiveNX Server is primarily deployed as a VMware OVA virtual appliance and is fully operational right out of the box. The server operating system runs on a Linux (Ubuntu) platform.
Server Platform Specifications
• VMware ESXi v5.0 or higher - VMware Hardware Version 8 (vmx-8)
• Network Hardware - At least two Physical NICS on ESXi
• Support up to 10 Gbps
• Virtual NICs on OVA are utilizing E1000
Client Platform Specifications
• Windows or macOS
• 4 Cores
• 8 GB RAM
• Web browser: IE11 and higher, Firefox, Chrome, and Safari
Proof of Concept (POC) Small Deployment Medium Deployment Large Deployment Physical Deployment
<= 25 devices or <= 25 k flows/sec.
<= 100 devices or<= 50 k flows/sec.
100 to 500 devices or<= 100 k flows/sec.
500 to 1000 devices or<= 150 k flows/sec.
Up to 1000 devices or<= 500 k flows/sec.
Min. Requirements:• 8 vCPU Xeon or i7• 16 GB RAM• Max Heap Size 8 GB• 500 GB Data Disk
Min. Requirements:• 16 vCPU Xeon or i7• 32 GB RAM*• Max Heap Size 16 GB• 2 TB Data Disks
Min. Requirements:• 16 vCPU Xeon or i7• 64 GB RAM*• Max Heap Size 31 GB• 4 TB Data Disks
Min. Requirements:• 32 vCPU Xeon or i7• 64 GB RAM*• Max Heap Size 31 GB• 8 TB Data Disks
Min. Requirements:• 64 vCPU Xeon Gold 5218• 768 GB RAM• Max Heap Size 384 GB• 32 TB Data Disks (16 TB
usable with RAID 10)
Each LiveNX server/node supports up to 76 TB disk space. It is recommended to add each disk in 10 TB increments.Server IOPS Recommendation LiveNX 8.0 - 1000 IOPS Read and 4500 IOPS Write.*For Cisco SD-WAN environments, a Large Deployment with minimum of 256 GB RAM is required for the Virtual Appliance option.
LiveAction.com Page 7 of 7
LiveNX
LiveAction Phone + eFAX: +1 888-881-1116960 San Antonio Road, Ste. 200 Email: [email protected] Alto, CA 94303 Website: www.liveaction.com
© 2021 LiveAction, Inc. All rights reserved. LiveAction, the LiveAction logo and LiveAction Software, LiveNX, LiveSensor, LiveNX Insight, LiveUX, and Omnipeek are trademarks of LiveAction, Inc.Information subject to change without notice.
#081821
Technical Data Sheet
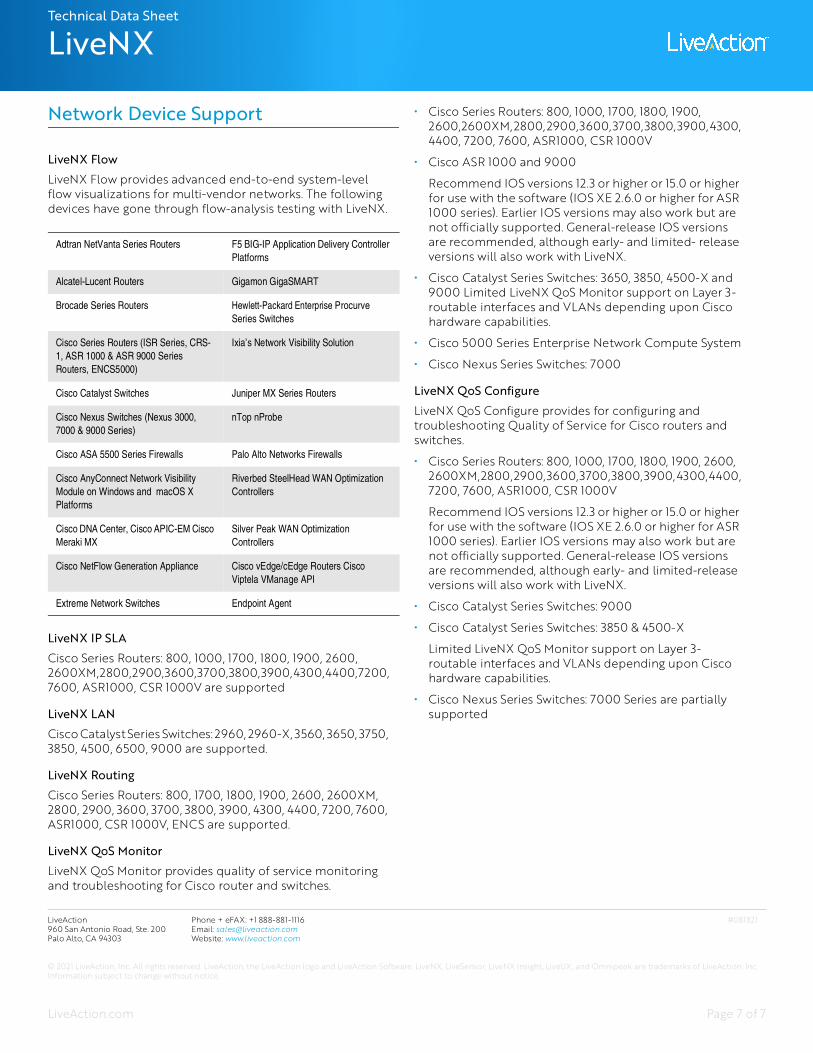
Network Device Support
LiveNX FlowLiveNX Flow provides advanced end-to-end system-level flow visualizations for multi-vendor networks. The following devices have gone through flow-analysis testing with LiveNX.
LiveNX IP SLACisco Series Routers: 800, 1000, 1700, 1800, 1900, 2600, 2600XM, 2800, 2900, 3600, 3700, 3800, 3900, 4300, 4400, 7200, 7600, ASR1000, CSR 1000V are supported
LiveNX LANCisco Catalyst Series Switches: 2960, 2960-X, 3560, 3650, 3750, 3850, 4500, 6500, 9000 are supported.
LiveNX RoutingCisco Series Routers: 800, 1700, 1800, 1900, 2600, 2600XM, 2800, 2900, 3600, 3700, 3800, 3900, 4300, 4400, 7200, 7600, ASR1000, CSR 1000V, ENCS are supported.
LiveNX QoS MonitorLiveNX QoS Monitor provides quality of service monitoring and troubleshooting for Cisco router and switches.
• Cisco Series Routers: 800, 1000, 1700, 1800, 1900, 2600,2600XM, 2800, 2900, 3600, 3700, 3800, 3900, 4300, 4400, 7200, 7600, ASR1000, CSR 1000V
• Cisco ASR 1000 and 9000
Recommend IOS versions 12.3 or higher or 15.0 or higher for use with the software (IOS XE 2.6.0 or higher for ASR 1000 series). Earlier IOS versions may also work but are not officially supported. General-release IOS versions are recommended, although early- and limited- release versions will also work with LiveNX.
• Cisco Catalyst Series Switches: 3650, 3850, 4500-X and 9000 Limited LiveNX QoS Monitor support on Layer 3-routable interfaces and VLANs depending upon Cisco hardware capabilities.
• Cisco 5000 Series Enterprise Network Compute System
• Cisco Nexus Series Switches: 7000
LiveNX QoS ConfigureLiveNX QoS Configure provides for configuring and troubleshooting Quality of Service for Cisco routers and switches.
• Cisco Series Routers: 800, 1000, 1700, 1800, 1900, 2600, 2600XM, 2800, 2900, 3600, 3700, 3800, 3900, 4300, 4400, 7200, 7600, ASR1000, CSR 1000V
Recommend IOS versions 12.3 or higher or 15.0 or higher for use with the software (IOS XE 2.6.0 or higher for ASR 1000 series). Earlier IOS versions may also work but are not officially supported. General-release IOS versions are recommended, although early- and limited-release versions will also work with LiveNX.
• Cisco Catalyst Series Switches: 9000
• Cisco Catalyst Series Switches: 3850 & 4500-X
Limited LiveNX QoS Monitor support on Layer 3-routable interfaces and VLANs depending upon Cisco hardware capabilities.
• Cisco Nexus Series Switches: 7000 Series are partially supported
Adtran NetVanta Series Routers F5 BIG-IP Application Delivery Controller Platforms
Alcatel-Lucent Routers Gigamon GigaSMART
Brocade Series Routers Hewlett-Packard Enterprise Procurve Series Switches
Cisco Series Routers (ISR Series, CRS-1, ASR 1000 & ASR 9000 Series Routers, ENCS5000)
Ixia’s Network Visibility Solution
Cisco Catalyst Switches Juniper MX Series Routers
Cisco Nexus Switches (Nexus 3000, 7000 & 9000 Series)
nTop nProbe
Cisco ASA 5500 Series Firewalls Palo Alto Networks Firewalls
Cisco AnyConnect Network Visibility Module on Windows and macOS X Platforms
Riverbed SteelHead WAN Optimization Controllers
Cisco DNA Center, Cisco APIC-EM Cisco Meraki MX
Silver Peak WAN Optimization Controllers
Cisco NetFlow Generation Appliance Cisco vEdge/cEdge Routers Cisco Viptela VManage API
Extreme Network Switches Endpoint Agent