Embed Size (px)
Citation preview
Stéphanie FRANCHI-ABELLA, MD
Service de Radiopédiatrie
Hôpital Bicêtre
Liver Elastography
Conflict of Interest
• PhD at the Institut Langevin that developsultrafast ultrasound imaging
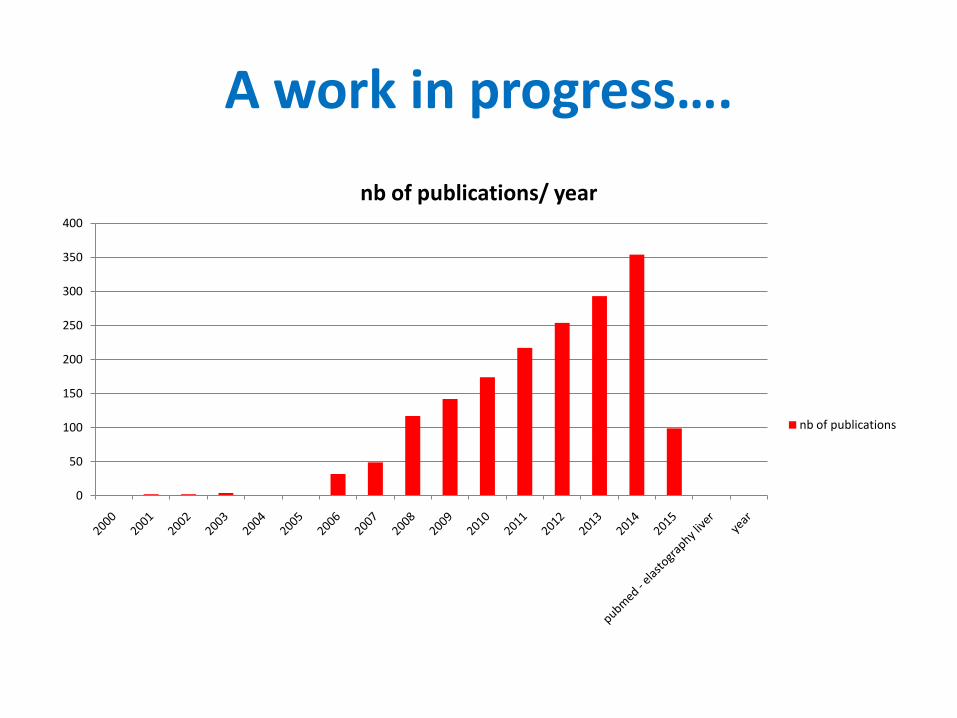
A work in progress….
0
50
100
150
200
250
300
350
400
nb of publications/ year
nb of publications
Plan
• Liver stiffness and pathology
• Technical principal of elastography
• Main validated results
• Practical examples in pediatric clinical pratice
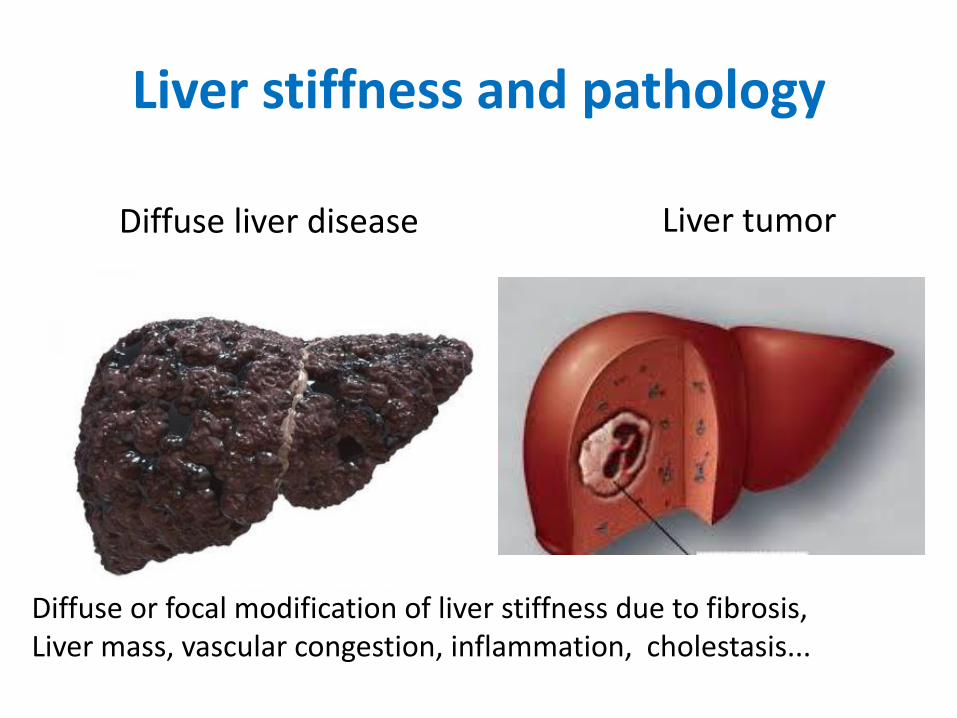
Liver stiffness and pathology
Liver tumorDiffuse liver disease
Diffuse or focal modification of liver stiffness due to fibrosis,Liver mass, vascular congestion, inflammation, cholestasis...
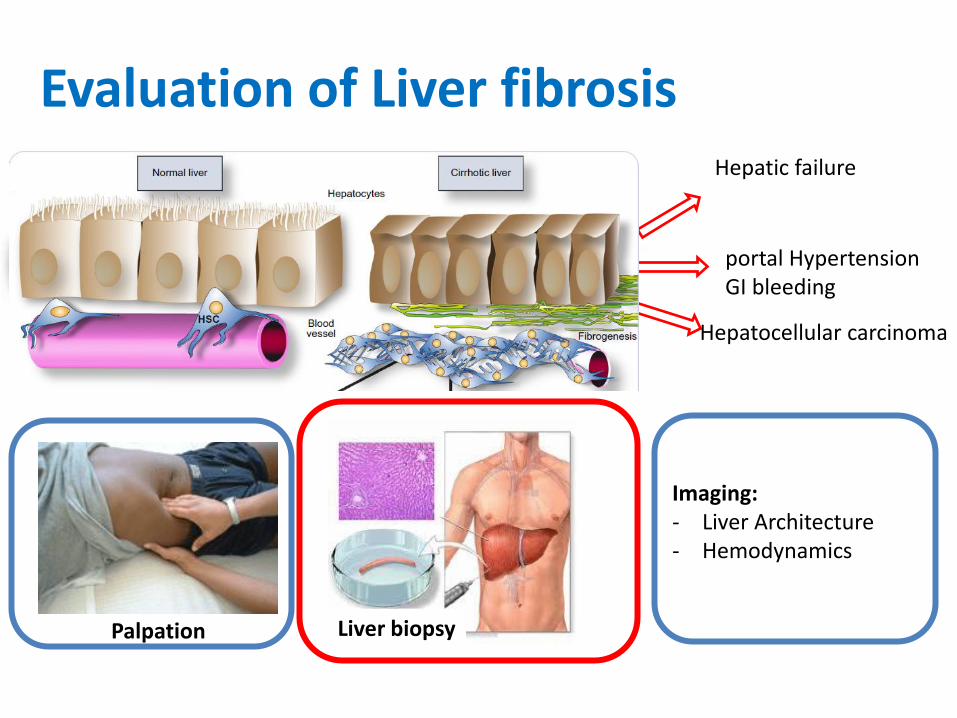
Evaluation of Liver fibrosis
Agression
= Fibrose
Palpation Liver biopsy
Imaging:- Liver Architecture - Hemodynamics
portal Hypertension GI bleeding
Hepatic failure
Hepatocellular carcinoma
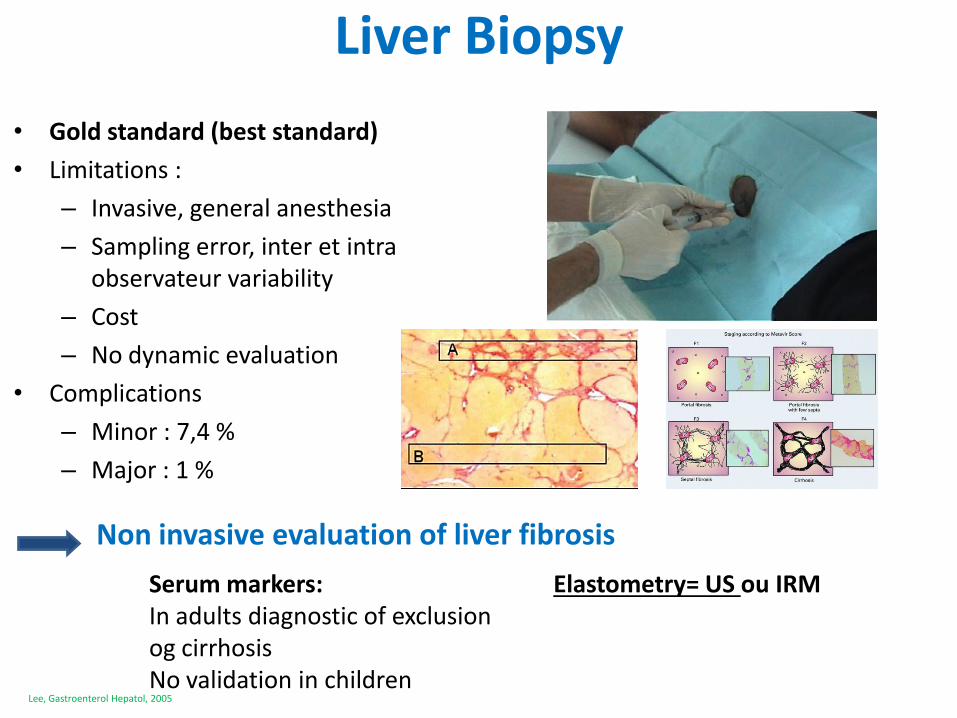
Liver Biopsy
• Gold standard (best standard)
• Limitations :
– Invasive, general anesthesia
– Sampling error, inter et intra observateur variability
– Cost
– No dynamic evaluation
• Complications
– Minor : 7,4 %
– Major : 1 %
Lee, Gastroenterol Hepatol, 2005
Non invasive evaluation of liver fibrosis
Serum markers:In adults diagnostic of exclusion og cirrhosisNo validation in children
Elastometry= US ou IRM
Non invasive evaluation of liver stiffness
• To improve characterization
• To avoid liver biopsy
• To indicate liver biopsy
• To monitorate treatment
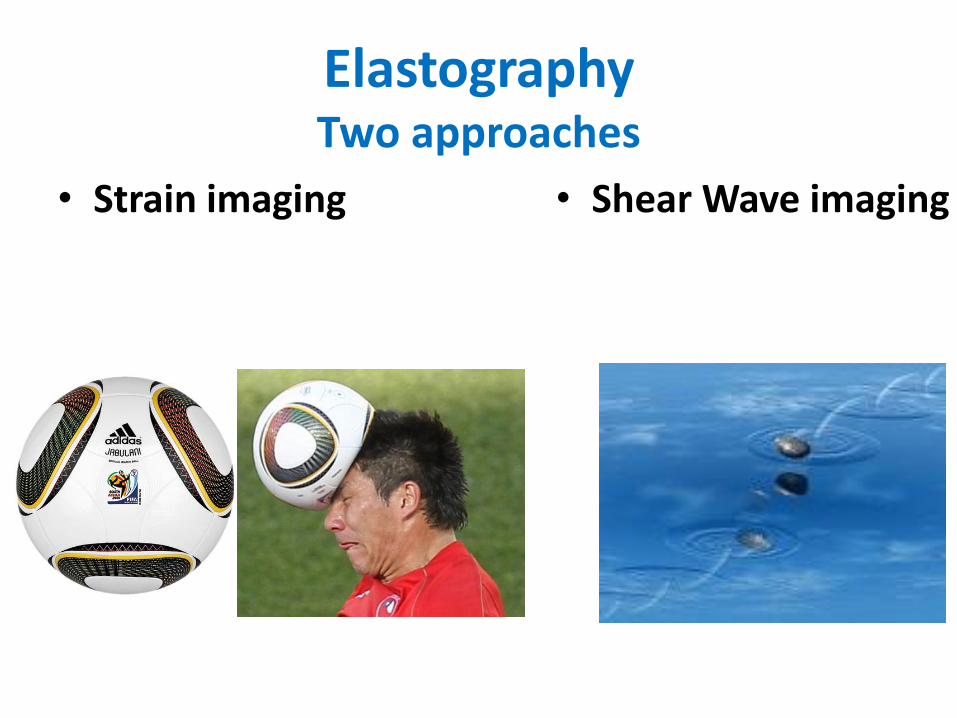
ElastographyTwo approaches
• Strain imaging • Shear Wave imaging
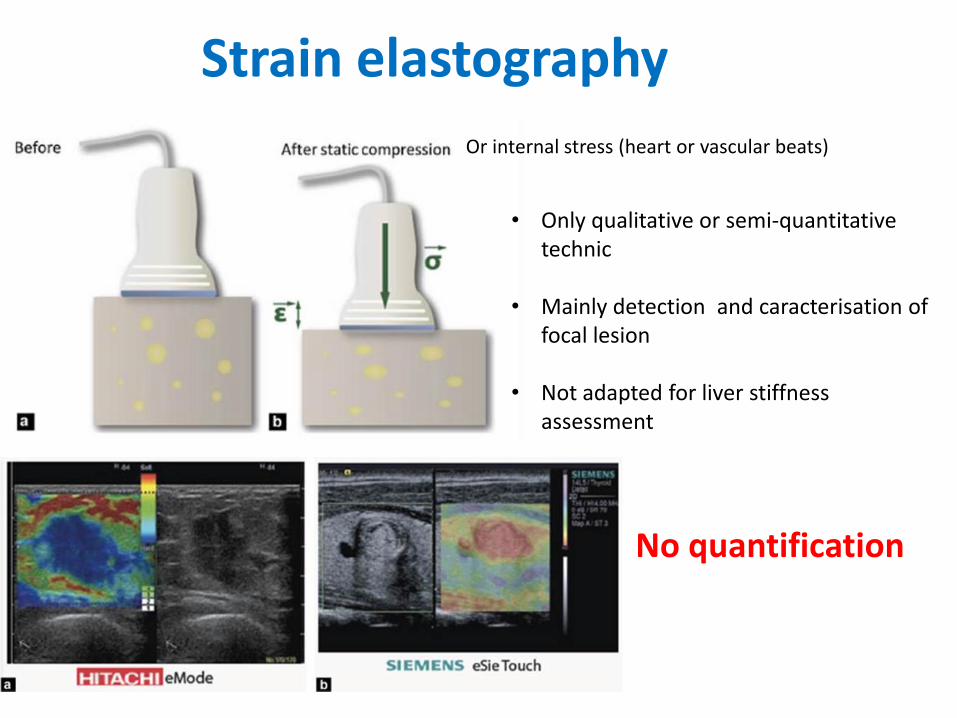
Strain elastography
• Only qualitative or semi-quantitative technic
• Mainly detection and caracterisation of focal lesion
• Not adapted for liver stiffnessassessment
No quantification
Or internal stress (heart or vascular beats)
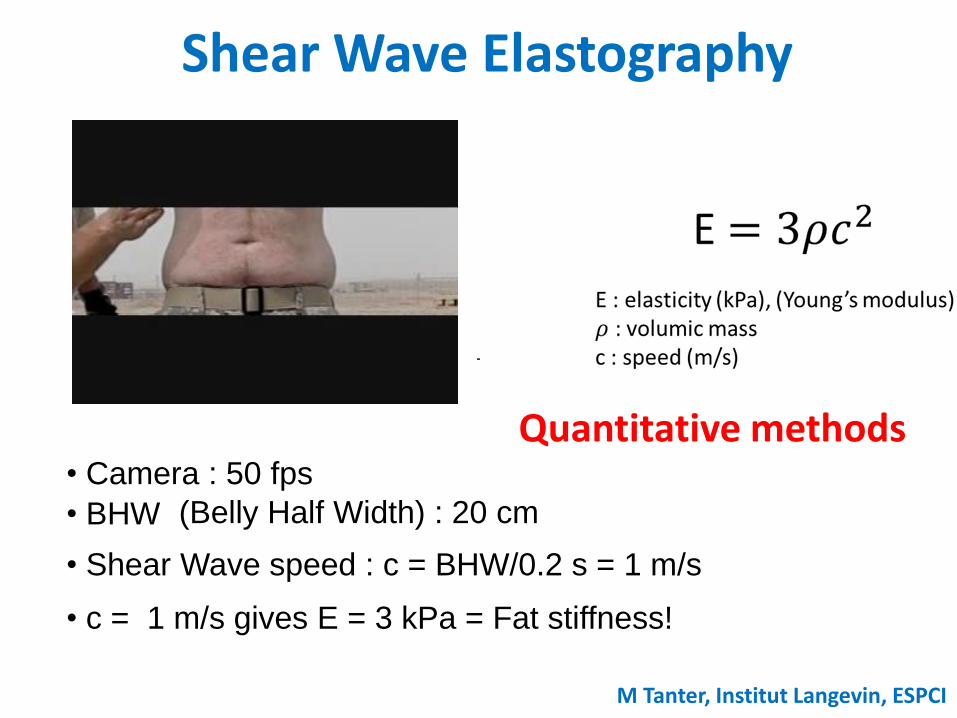
Shear Wave Elastography
• Camera : 50 fps
• BHW (Belly Half Width) : 20 cm
• Shear Wave speed : c = BHW/0.2 s = 1 m/s
• c = 1 m/s gives E = 3 kPa = Fat stiffness!
Quantitative methods
M Tanter, Institut Langevin, ESPCI
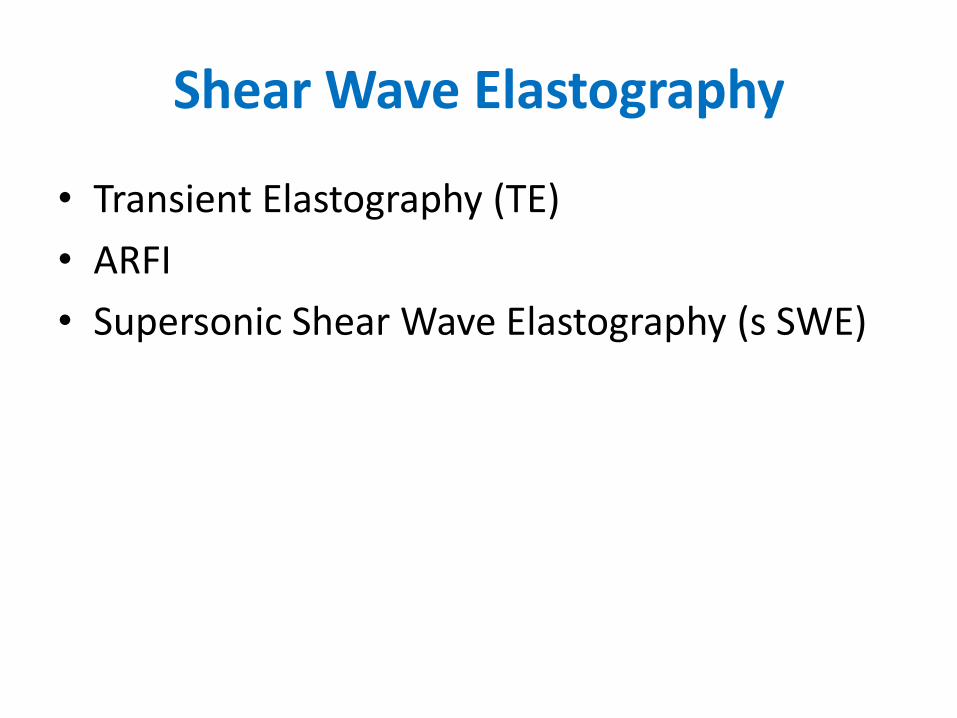
Shear Wave Elastography
• Transient Elastography (TE)
• ARFI
• Supersonic Shear Wave Elastography (s SWE)
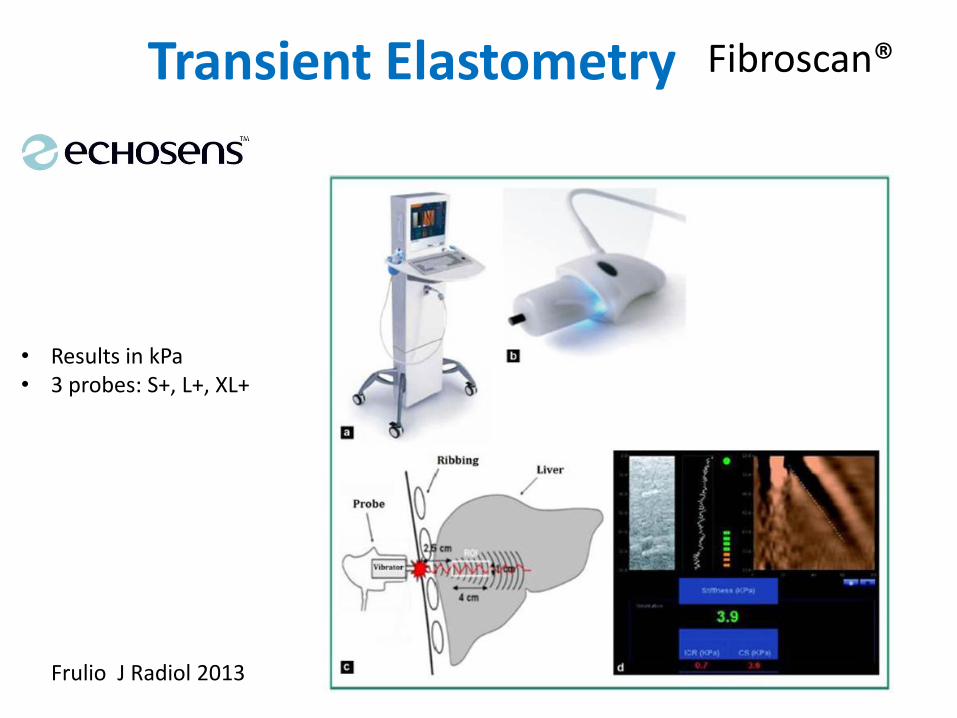
Transient Elastometry Fibroscan®
Frulio J Radiol 2013
• Results in kPa• 3 probes: S+, L+, XL+
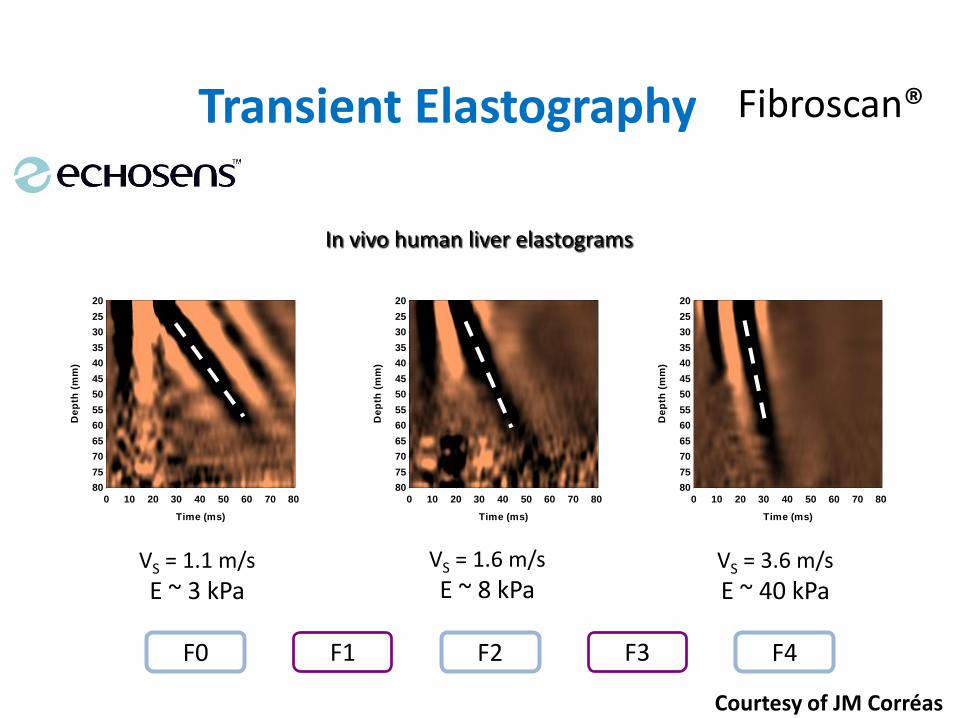
Transient Elastography
In vivo human liver elastograms
0 10 20 30 40 50 60 70 80
20
25
30
35
40
45
50
55
60
65
70
75
80
Time (ms)
De
pth
(m
m)
0 10 20 30 40 50 60 70 80
20
25
30
35
40
45
50
55
60
65
70
75
80
Time (ms)
De
pth
(m
m)
0 10 20 30 40 50 60 70 80
20
25
30
35
40
45
50
55
60
65
70
75
80
Time (ms)
De
pth
(m
m)
VS = 1.1 m/s
E ~ 3 kPaVS = 1.6 m/s
E ~ 8 kPaVS = 3.6 m/s
E ~ 40 kPa
F0 F2 F4F1 F3
Courtesy of JM Corréas
Fibroscan®
Haffar
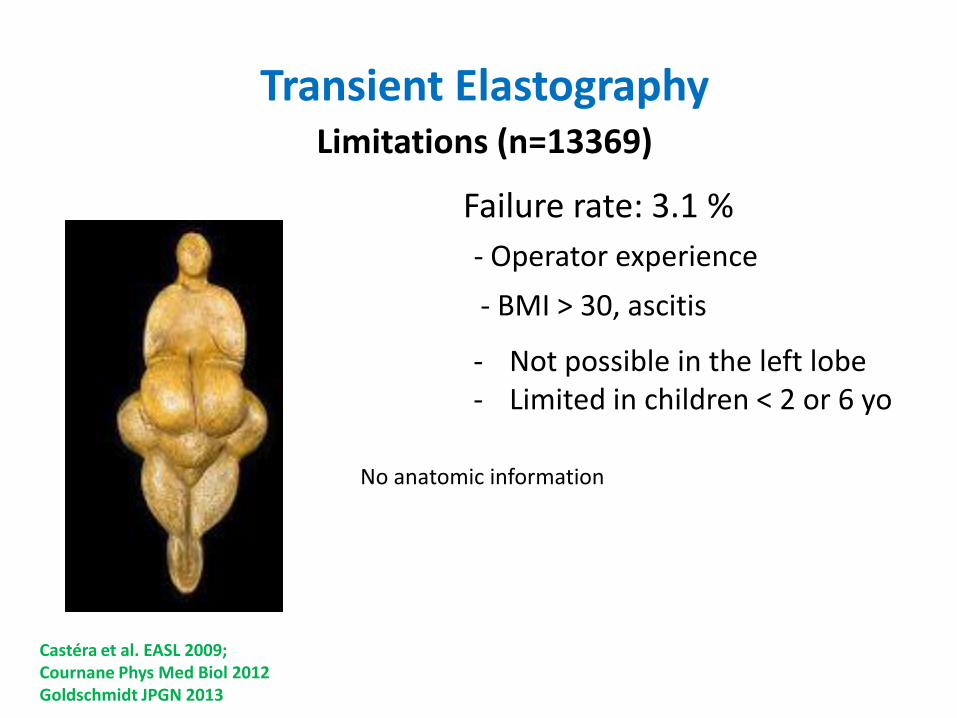
Transient ElastographyLimitations (n=13369)
Castéra et al. EASL 2009;Cournane Phys Med Biol 2012Goldschmidt JPGN 2013
Failure rate: 3.1 %
- Operator experience
- BMI > 30, ascitis
- Not possible in the left lobe- Limited in children < 2 or 6 yo
No anatomic information
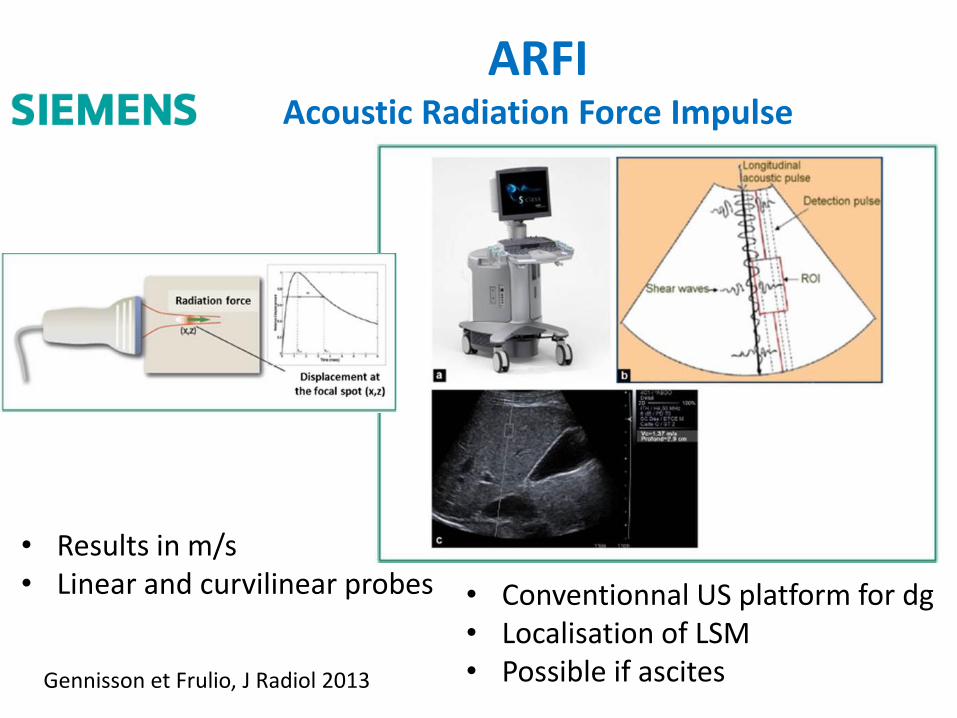
ARFIAcoustic Radiation Force Impulse
Gennisson et Frulio, J Radiol 2013
• Results in m/s• Linear and curvilinear probes • Conventionnal US platform for dg
• Localisation of LSM• Possible if ascites
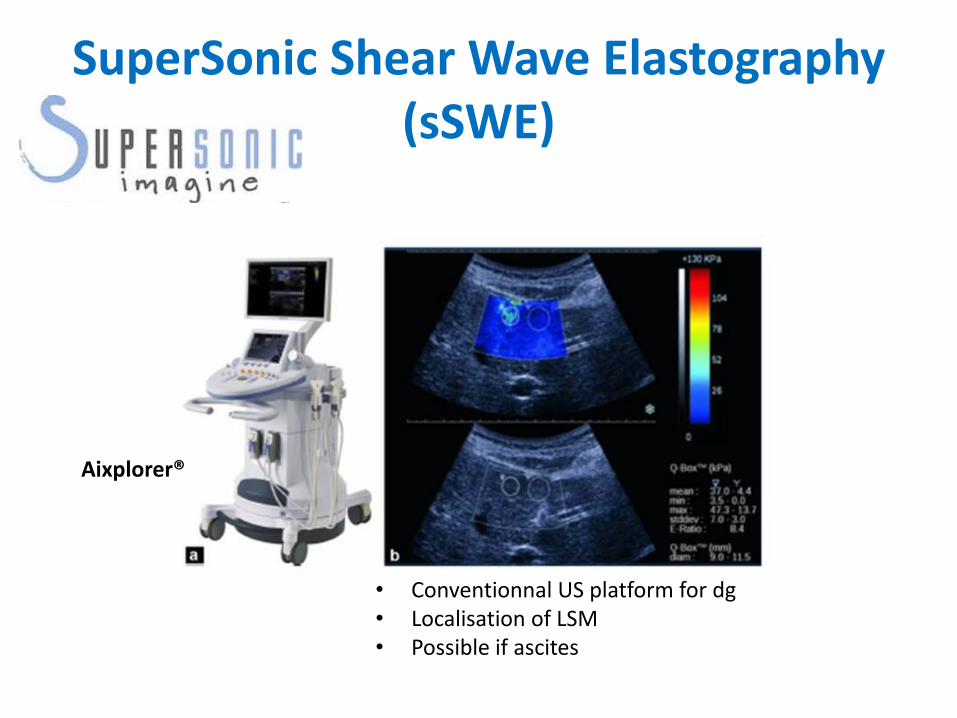
SuperSonic Shear Wave Elastography(sSWE)
Aixplorer®
• Conventionnal US platform for dg• Localisation of LSM• Possible if ascites
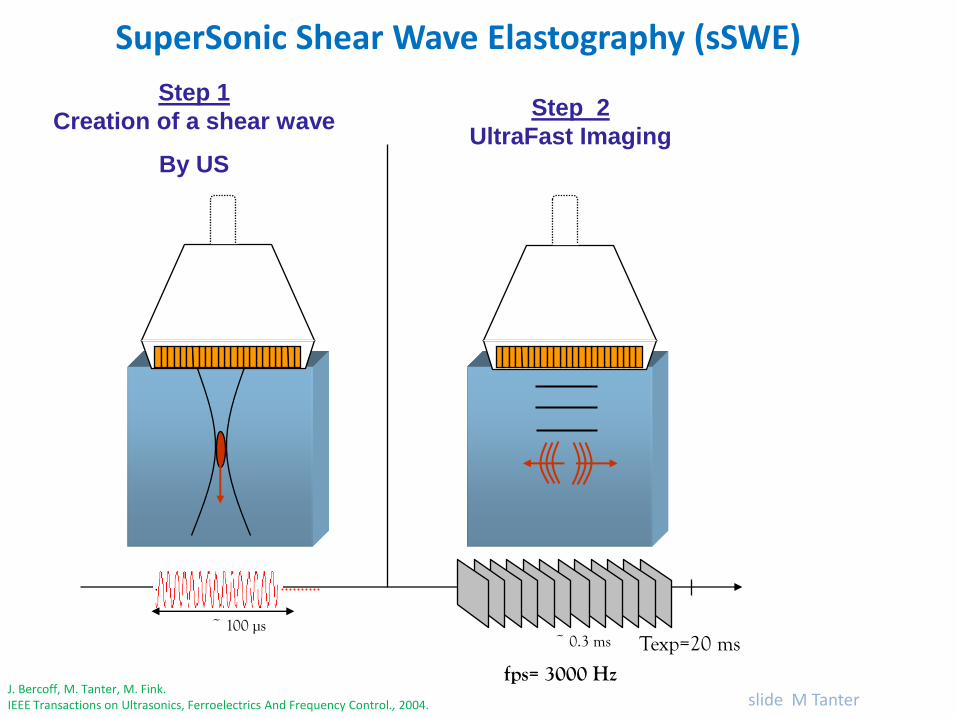
~ 100 µs
Step 1
Creation of a shear wave
By US
fps= 3000 Hz
Texp=20 ms~ 0.3 ms
Step 2
UltraFast Imaging
SuperSonic Shear Wave Elastography (sSWE)
J. Bercoff, M. Tanter, M. Fink.IEEE Transactions on Ultrasonics, Ferroelectrics And Frequency Control., 2004. slide M Tanter
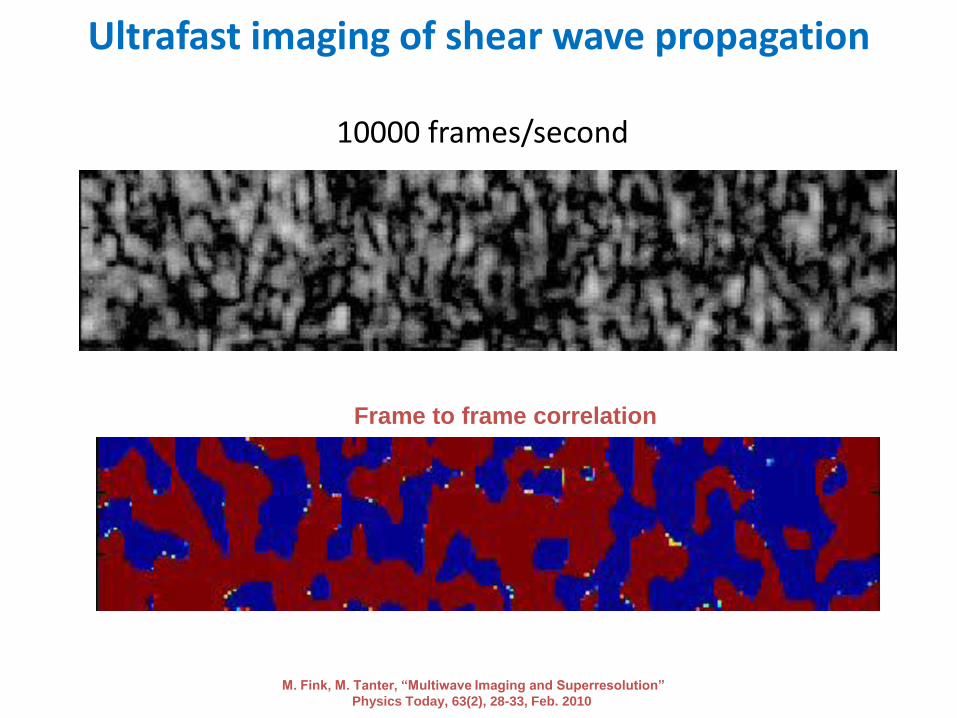
Ultrafast imaging of shear wave propagation
10000 frames/second
Frame to frame correlation
M. Fink, M. Tanter, “Multiwave Imaging and Superresolution”
Physics Today, 63(2), 28-33, Feb. 2010
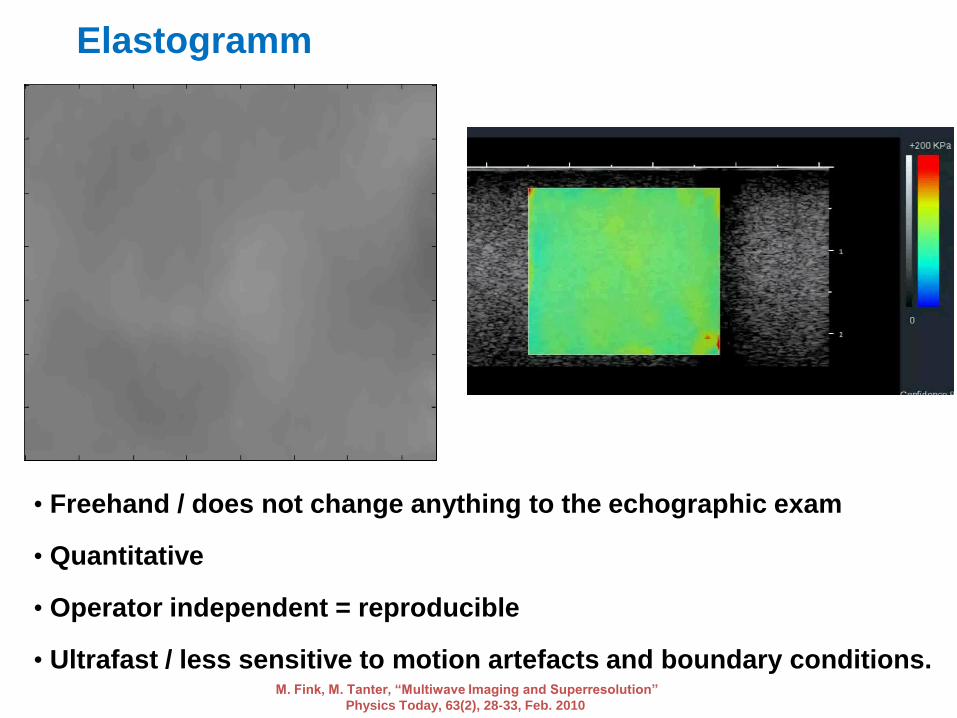
Elastogramm
• Freehand / does not change anything to the echographic exam
• Quantitative
• Operator independent = reproducible
• Ultrafast / less sensitive to motion artefacts and boundary conditions.M. Fink, M. Tanter, “Multiwave Imaging and Superresolution”
Physics Today, 63(2), 28-33, Feb. 2010
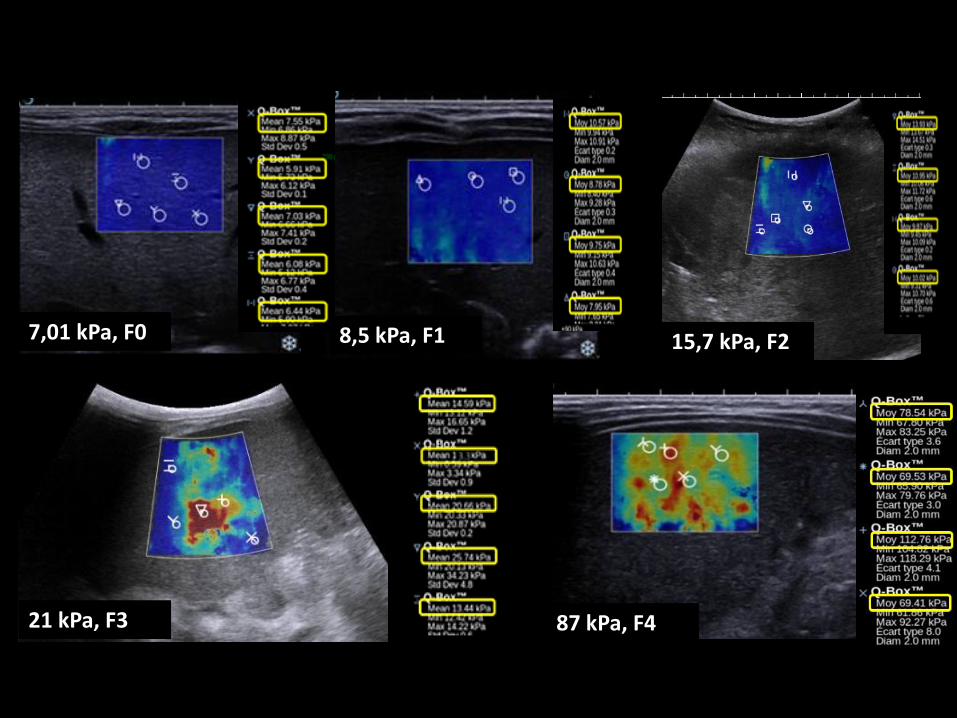
• Aucun échec de mesure
7,01 kPa, F0 8,5 kPa, F1
21 kPa, F3 87 kPa, F4
15,7 kPa, F2
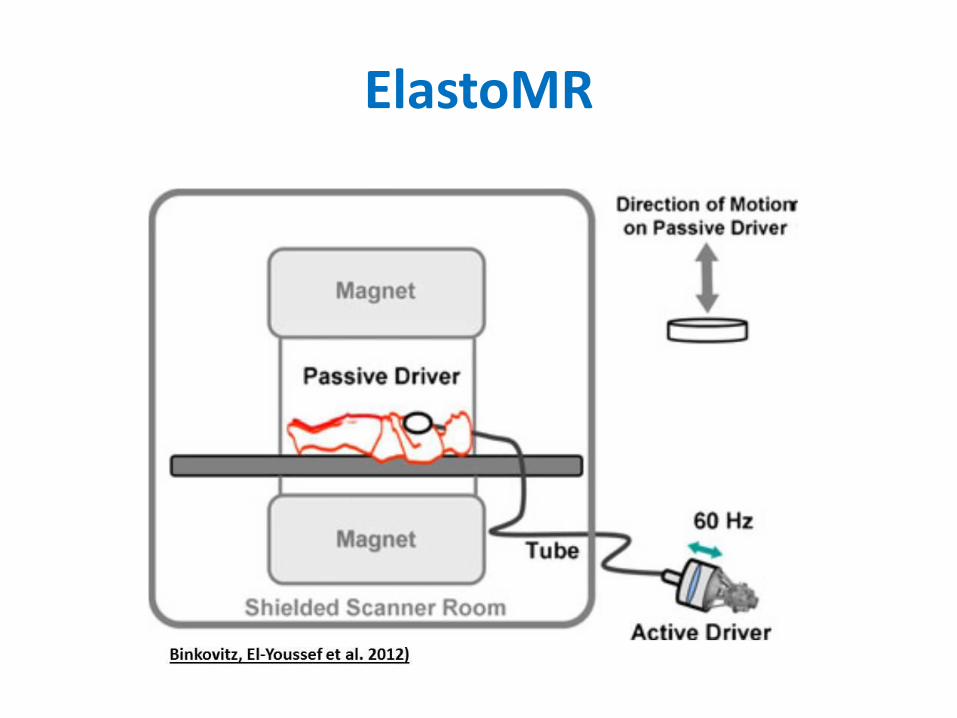
ElastoMR
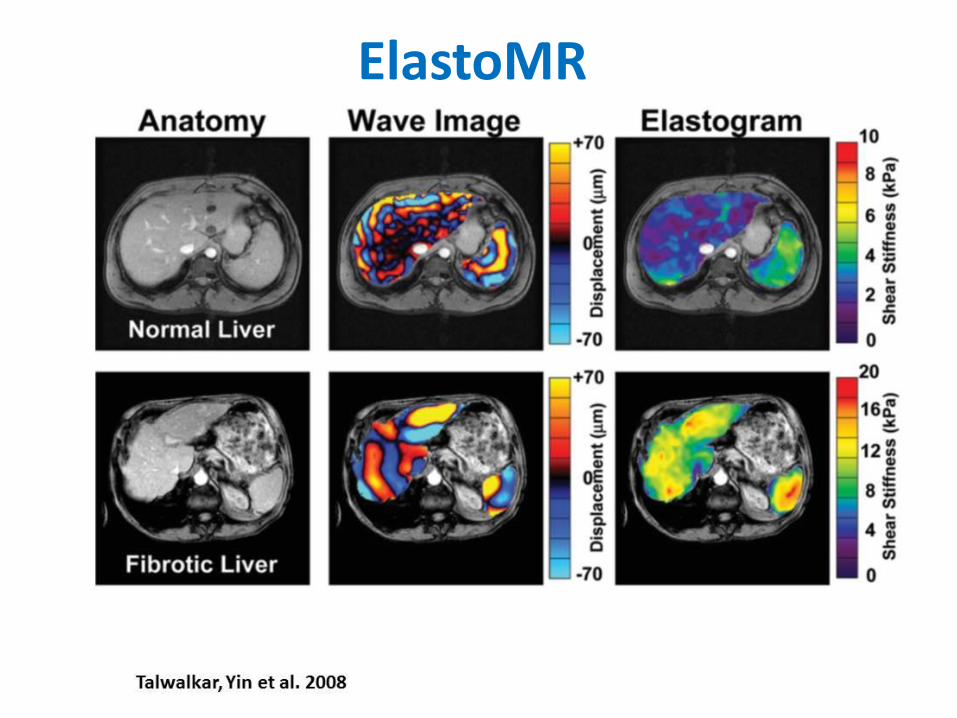
ElastoMR
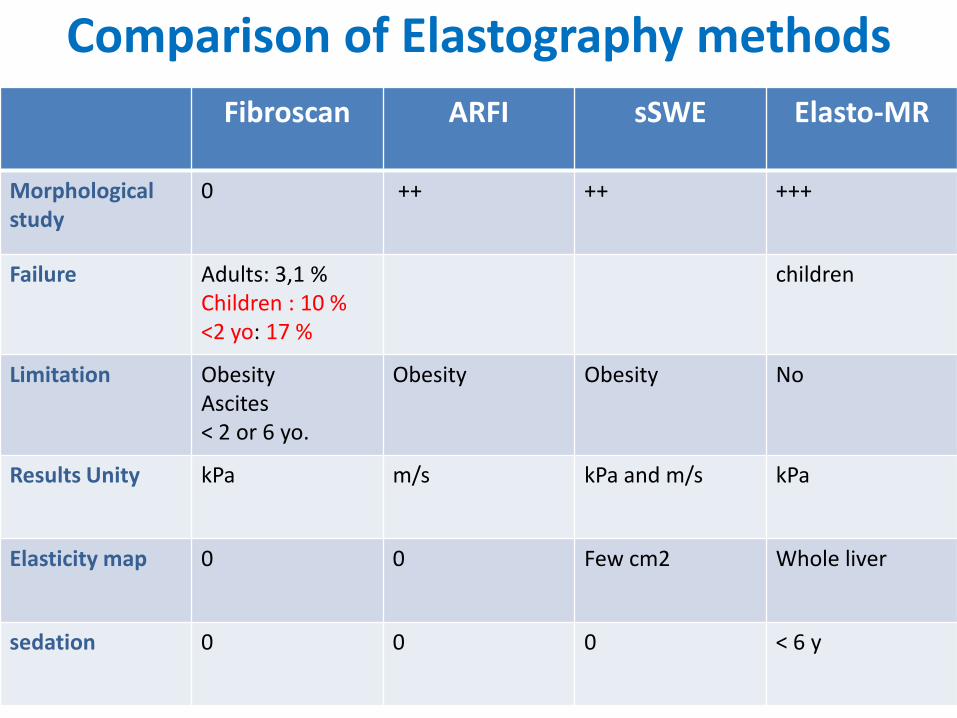
Comparison of Elastography methods
Fibroscan ARFI sSWE Elasto-MR
Morphologicalstudy
0 ++ ++ +++
Failure Adults: 3,1 %Children : 10 %<2 yo: 17 %
children
Limitation ObesityAscites< 2 or 6 yo.
Obesity Obesity No
Results Unity kPa m/s kPa and m/s kPa
Elasticity map 0 0 Few cm2 Whole liver
sedation 0 0 0 < 6 y
Interpretation of the results
• Technical conditions:
– Technique
– Frequency of the transducer
• Clinics:
–Causative disease
–Confounding factors
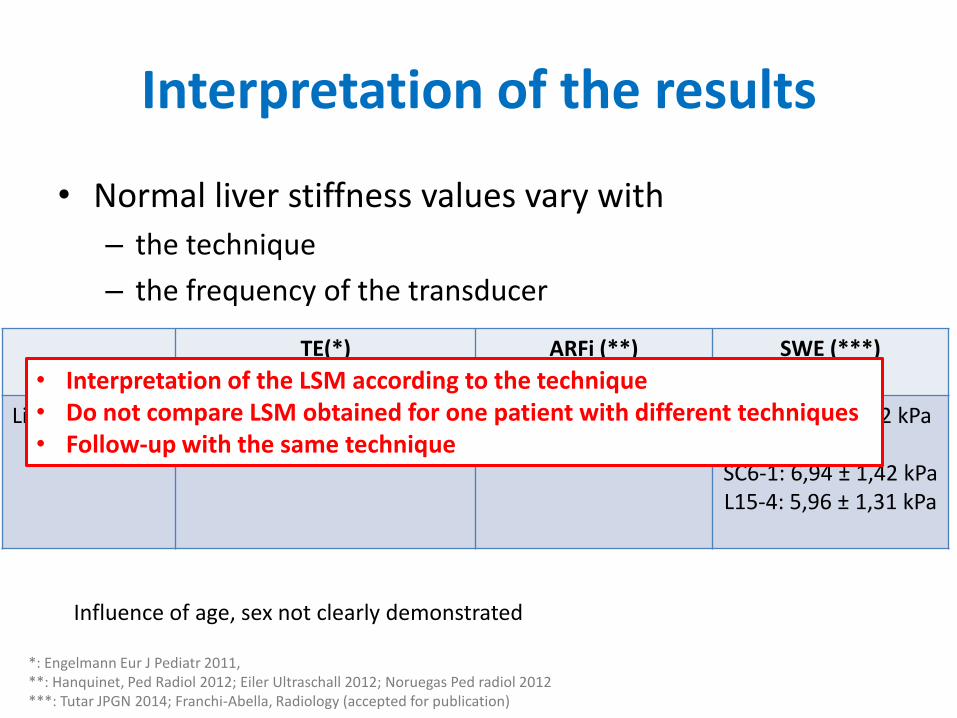
Interpretation of the results
• Normal liver stiffness values vary with
– the technique
– the frequency of the transducer
TE(*) ARFi (**) SWE (***)
Liver Stiffness 5,96 – 6,82 kPa 3,89-4 kPa (converted)1,11-1,16 m/s
SC6-1: 7,41 ± 4,2 kPa
SC6-1: 6,94 ± 1,42 kPaL15-4: 5,96 ± 1,31 kPa
*: Engelmann Eur J Pediatr 2011, **: Hanquinet, Ped Radiol 2012; Eiler Ultraschall 2012; Noruegas Ped radiol 2012***: Tutar JPGN 2014; Franchi-Abella, Radiology (accepted for publication)
Influence of age, sex not clearly demonstrated
• Interpretation of the LSM according to the technique• Do not compare LSM obtained for one patient with different techniques • Follow-up with the same technique
Interpretation of the results
• Technical conditions:– Technic
– Frequency of the transducer
• Objectives of the test : Cut-off values for pathology vary with:
– Either you select sensitivity or specificity
• Clinics:
– Causative disease
– Confounding factors
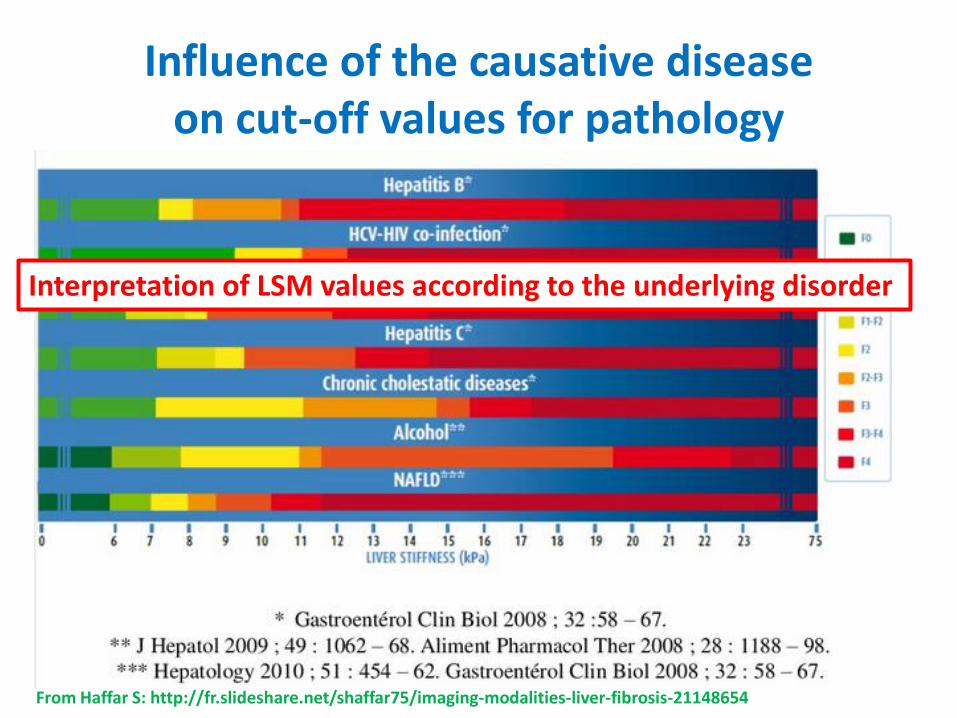
Influence of the causative diseaseon cut-off values for pathology
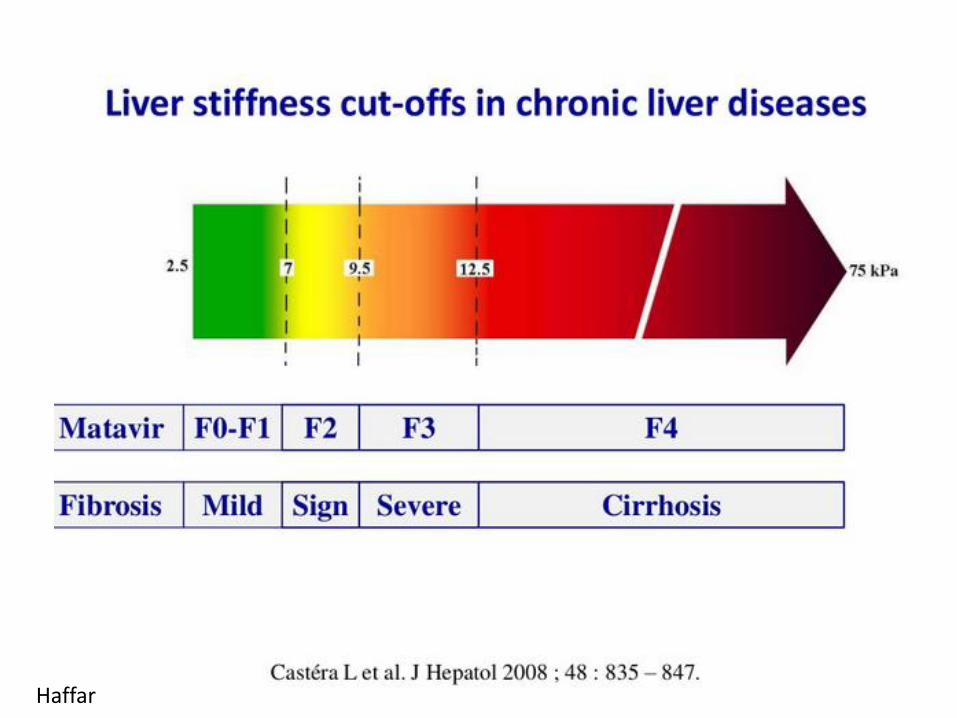
From Haffar S: http://fr.slideshare.net/shaffar75/imaging-modalities-liver-fibrosis-21148654
Interpretation of LSM values according to the underlying disorder
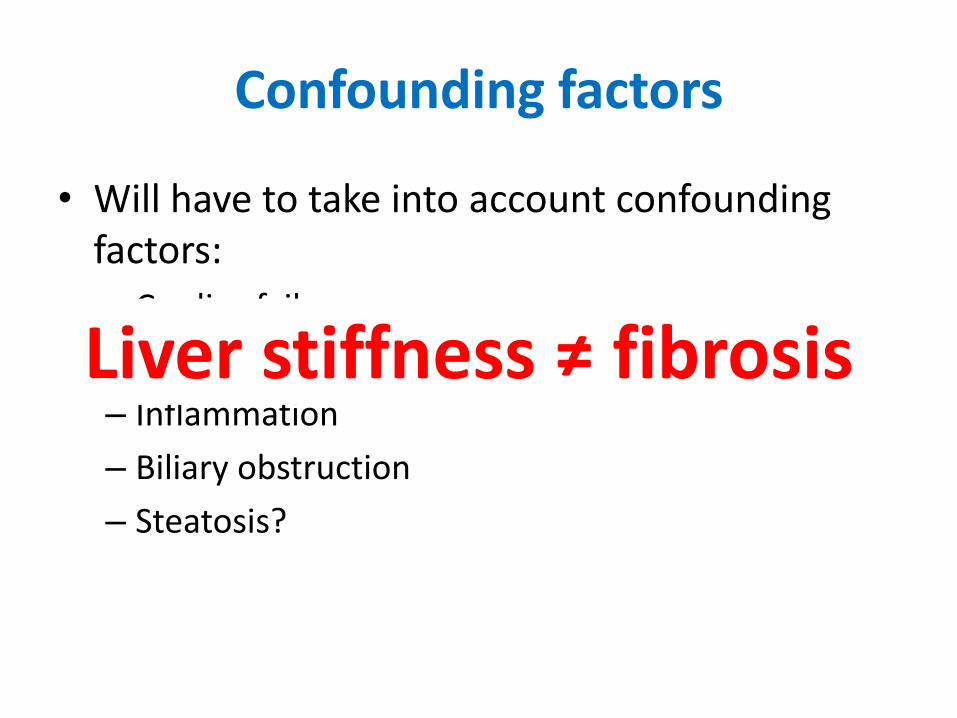
Confounding factors
• Will have to take into account confoundingfactors:
– Cardiac failure
– Hepatic vein obstruction
– Inflammation
– Biliary obstruction
– Steatosis?
Liver stiffness ≠ fibrosis
Applications and results
• Diffuse liver disorders
• Focal liver lesions
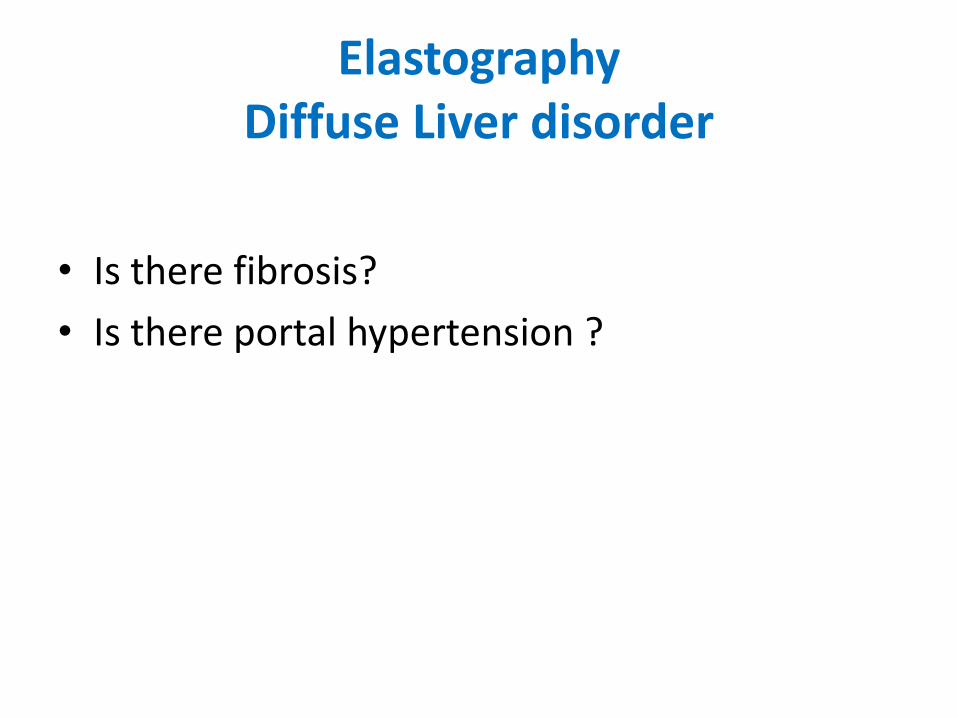
ElastographyDiffuse Liver disorder
• Is there fibrosis?
• Is there portal hypertension ?
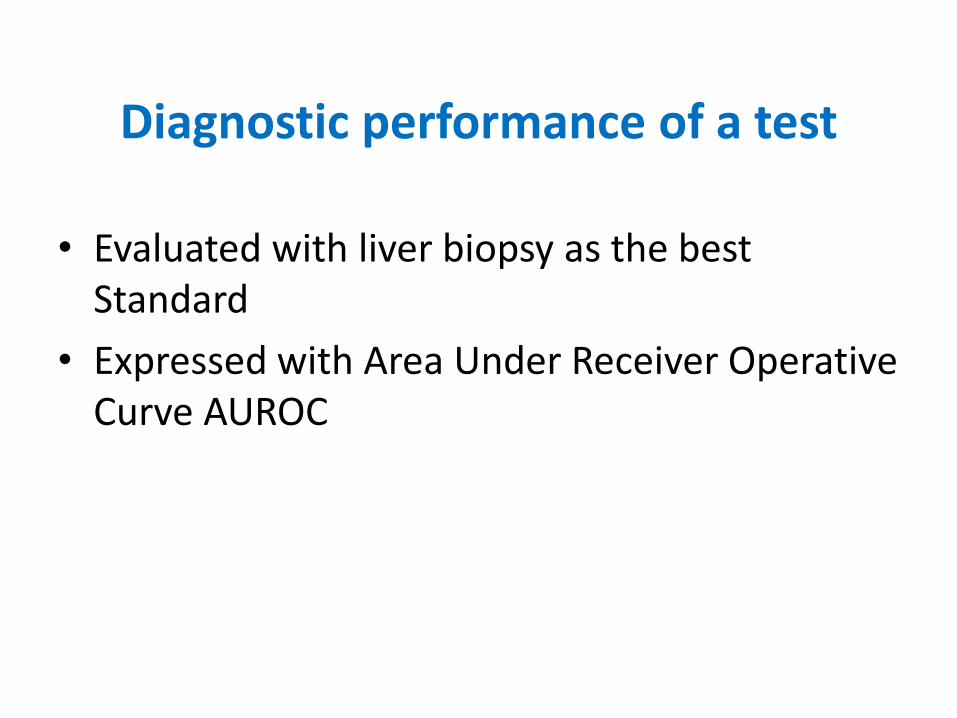
Diagnostic performance of a test
• Evaluated with liver biopsy as the best Standard
• Expressed with Area Under Receiver OperativeCurve AUROC
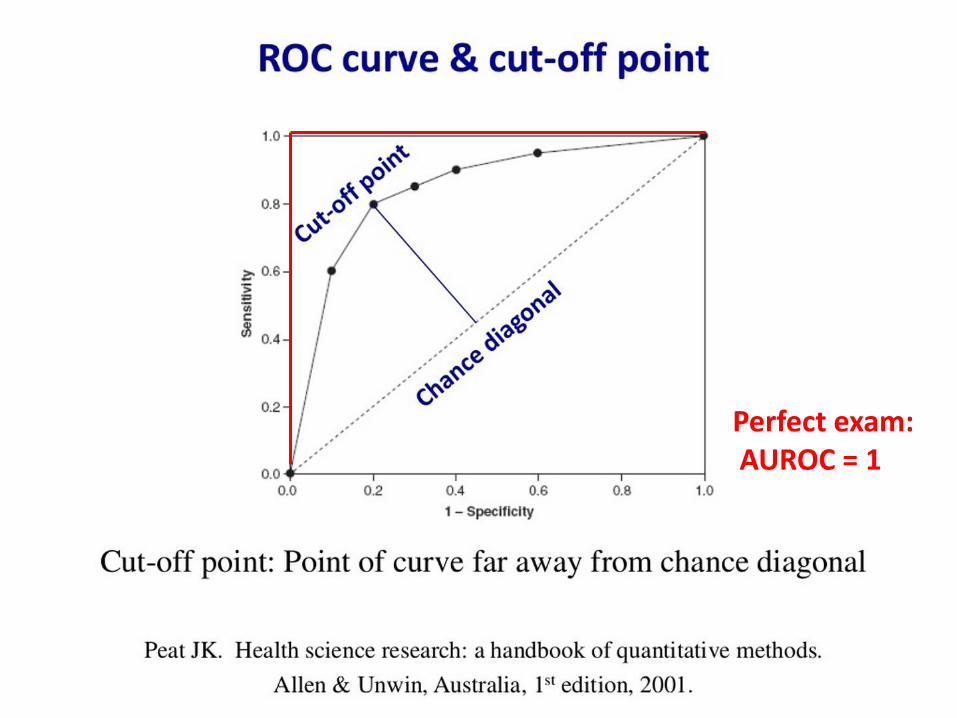
Perfect exam:AUROC = 1
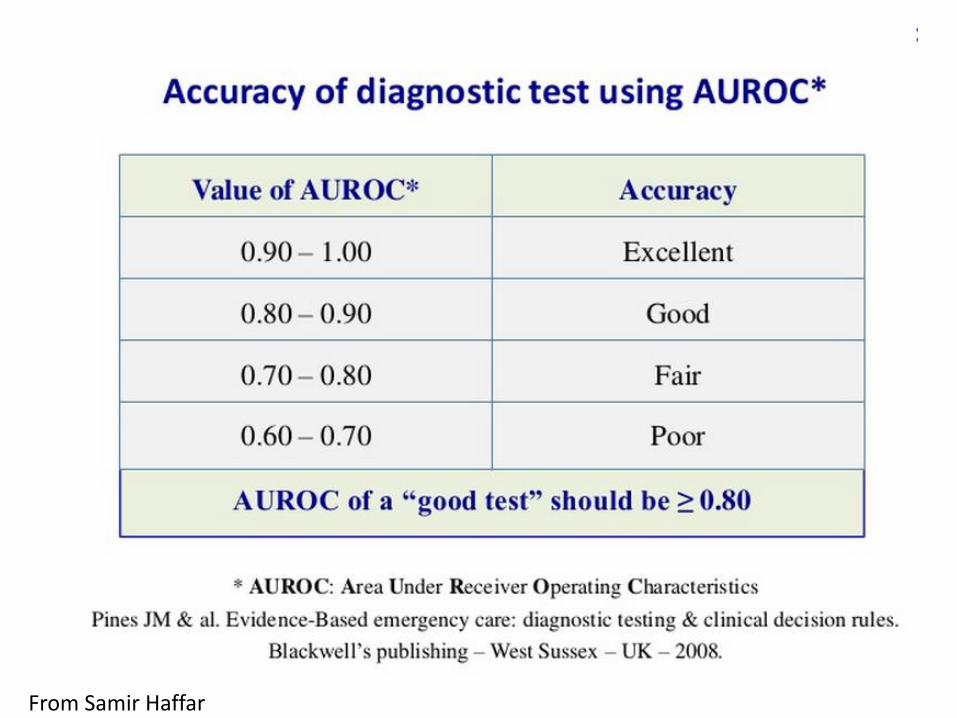
From Samir Haffar
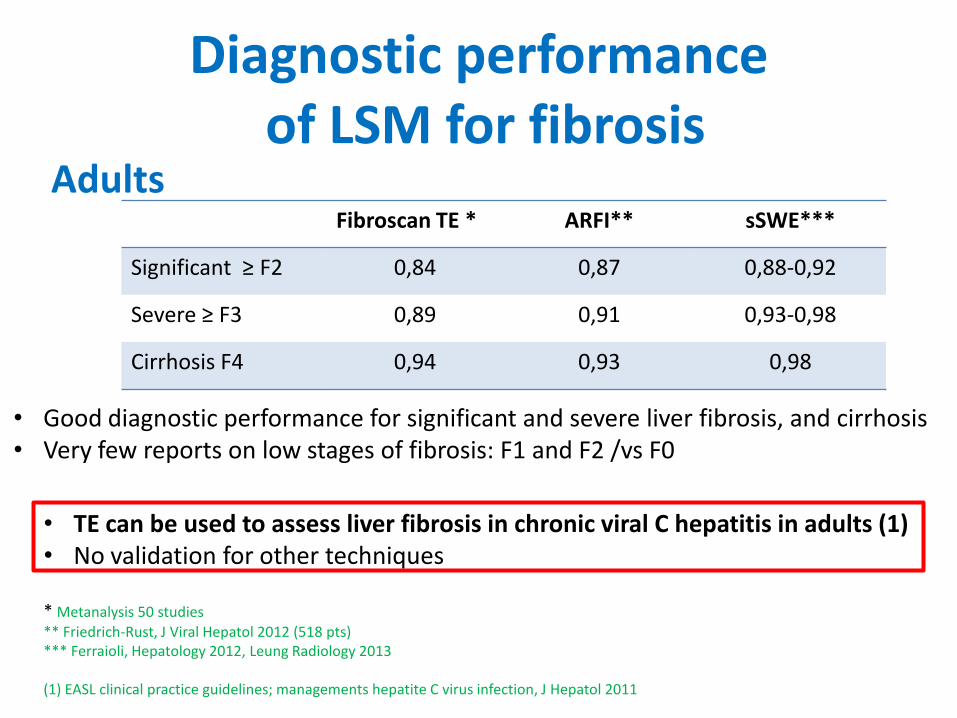
Diagnostic performanceof LSM for fibrosis
Fibroscan TE * ARFI** sSWE***
Significant ≥ F2 0,84 0,87 0,88-0,92
Severe ≥ F3 0,89 0,91 0,93-0,98
Cirrhosis F4 0,94 0,93 0,98
* Metanalysis 50 studies** Friedrich-Rust, J Viral Hepatol 2012 (518 pts)*** Ferraioli, Hepatology 2012, Leung Radiology 2013
(1) EASL clinical practice guidelines; managements hepatite C virus infection, J Hepatol 2011
• Good diagnostic performance for significant and severe liver fibrosis, and cirrhosis• Very few reports on low stages of fibrosis: F1 and F2 /vs F0
Adults
• TE can be used to assess liver fibrosis in chronic viral C hepatitis in adults (1)• No validation for other techniques
Diffuse liver disorders
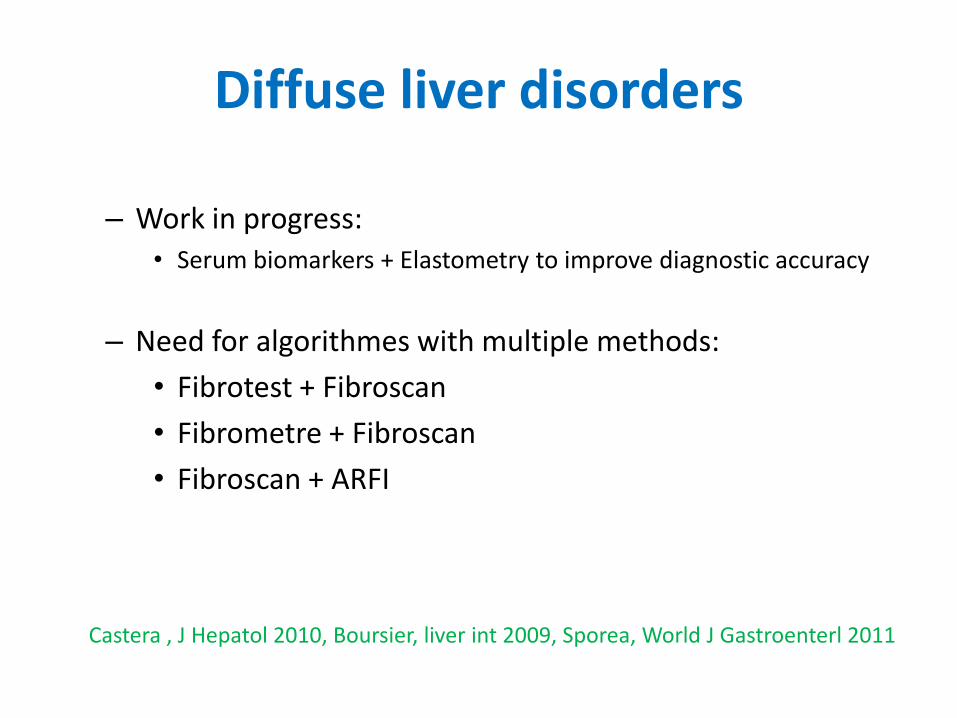
– Work in progress:• Serum biomarkers + Elastometry to improve diagnostic accuracy
– Need for algorithmes with multiple methods:
• Fibrotest + Fibroscan
• Fibrometre + Fibroscan
• Fibroscan + ARFI
Castera , J Hepatol 2010, Boursier, liver int 2009, Sporea, World J Gastroenterl 2011
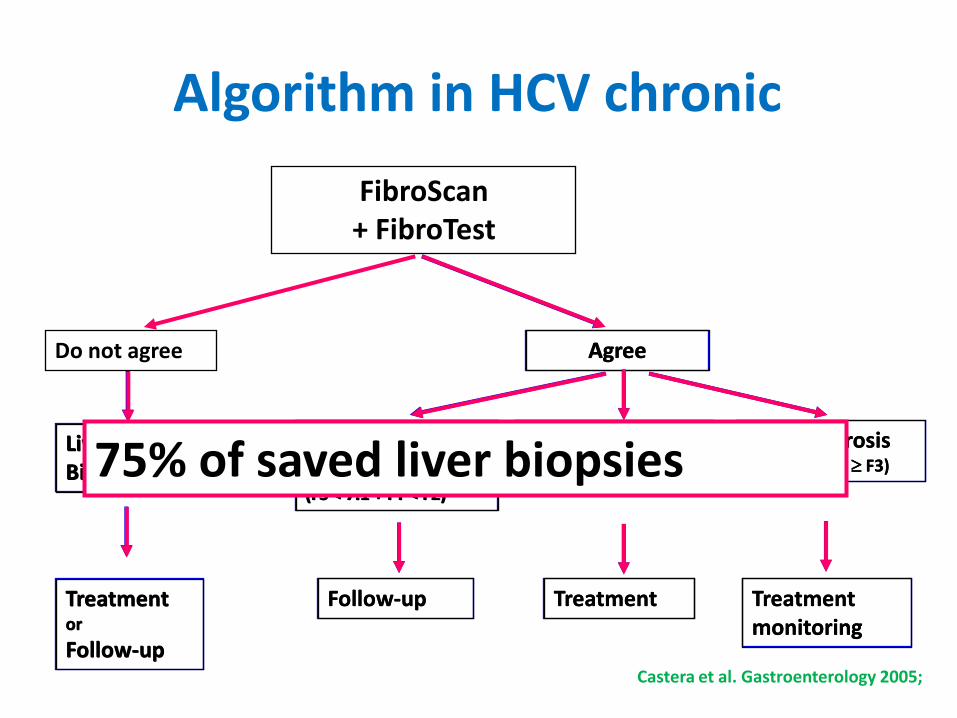
Algorithm in HCV chronic
FibroScan + FibroTest
Liver Biopsy
Treatment or
Follow-up
Follow-up Treatment
Mild fibrosis (FS < 7.1 + FT < F2)
Severe fibrosis(FS 9.5 + FT F3)
Moderate fibrosis(FS 7.1 + FT F2)
Treatment monitoring
Castera et al. Gastroenterology 2005;
Do not agree Agree
Liver Biopsy
Treatment or
Follow-up
Agree
Mild fibrosis (FS < 7.1 + FT < F2)
Follow-up
Moderate fibrosis(FS 7.1 + FT F2)
Treatment
Severe fibrosis(FS 9.5 + FT F3)
Treatment monitoring
75% of saved liver biopsies
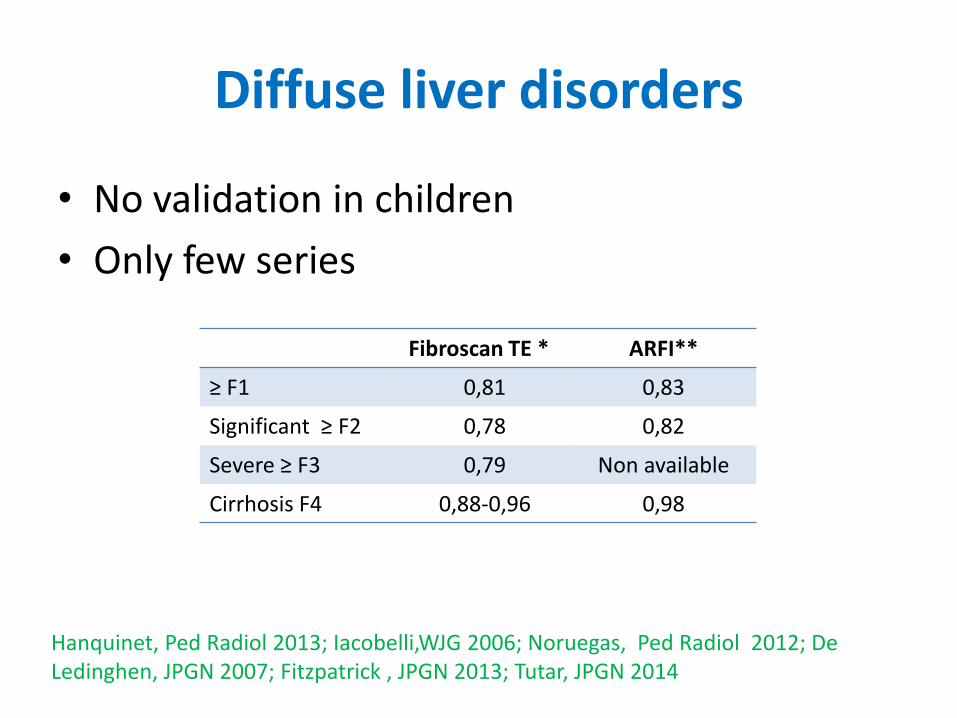
Diffuse liver disorders
• No validation in children
• Only few series
Hanquinet, Ped Radiol 2013; Iacobelli,WJG 2006; Noruegas, Ped Radiol 2012; De Ledinghen, JPGN 2007; Fitzpatrick , JPGN 2013; Tutar, JPGN 2014
Fibroscan TE * ARFI**
≥ F1 0,81 0,83
Significant ≥ F2 0,78 0,82
Severe ≥ F3 0,79 Non available
Cirrhosis F4 0,88-0,96 0,98
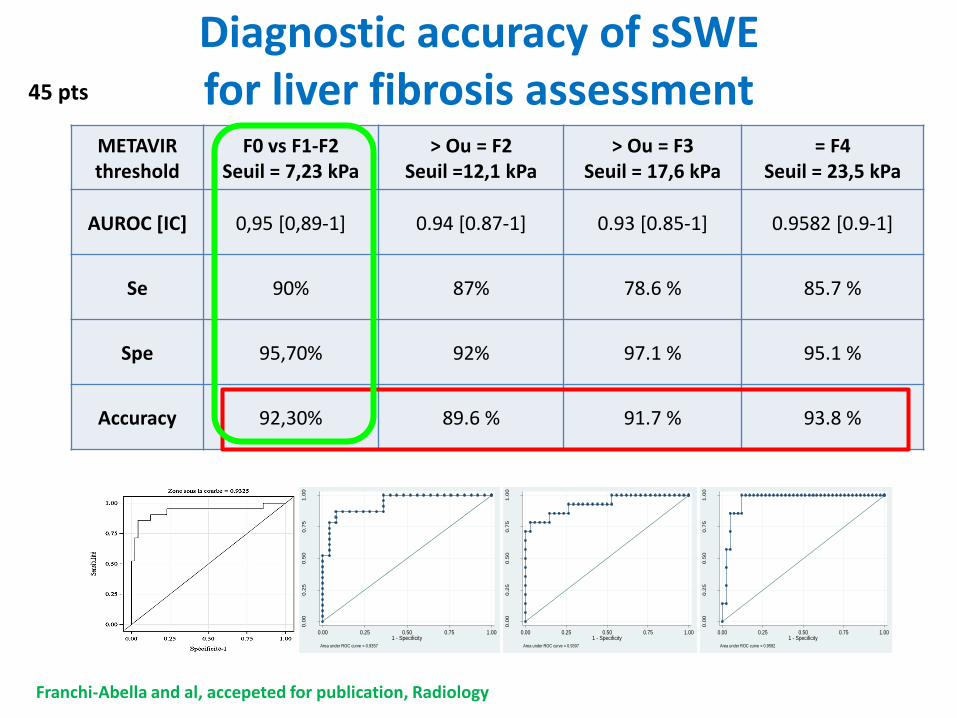
Diagnostic accuracy of sSWEfor liver fibrosis assessment
0.0
00.2
50.5
00.7
51.0
0
Sen
sitiv
ity
0.00 0.25 0.50 0.75 1.001 - Specificity
Area under ROC curve = 0.9357
0.0
00.2
50.5
00.7
51.0
0
Sen
sitiv
ity
0.00 0.25 0.50 0.75 1.001 - Specificity
Area under ROC curve = 0.9307
0.0
00.2
50.5
00.7
51.0
0
Sen
sitiv
ity
0.00 0.25 0.50 0.75 1.001 - Specificity
Area under ROC curve = 0.9582
METAVIRthreshold
F0 vs F1-F2Seuil = 7,23 kPa
> Ou = F2Seuil =12,1 kPa
> Ou = F3Seuil = 17,6 kPa
= F4Seuil = 23,5 kPa
AUROC [IC] 0,95 [0,89-1] 0.94 [0.87-1] 0.93 [0.85-1] 0.9582 [0.9-1]
Se 90% 87% 78.6 % 85.7 %
Spe 95,70% 92% 97.1 % 95.1 %
Accuracy 92,30% 89.6 % 91.7 % 93.8 %
Franchi-Abella and al, accepeted for publication, Radiology
45 pts
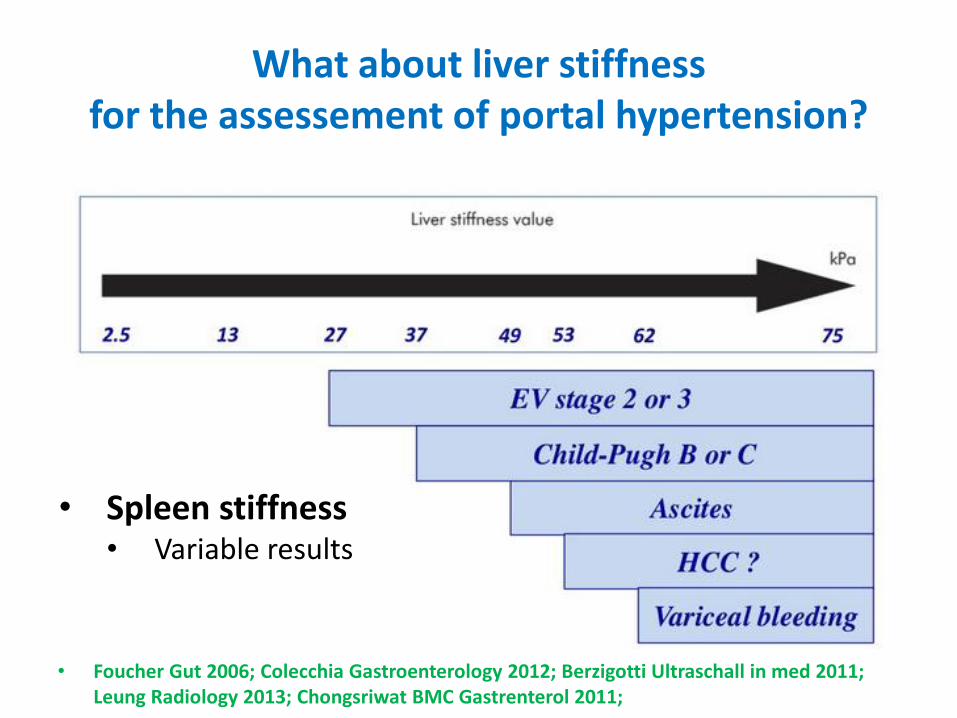
What about liver stiffnessfor the assessement of portal hypertension?
• Foucher Gut 2006; Colecchia Gastroenterology 2012; Berzigotti Ultraschall in med 2011; Leung Radiology 2013; Chongsriwat BMC Gastrenterol 2011;
• Spleen stiffness• Variable results
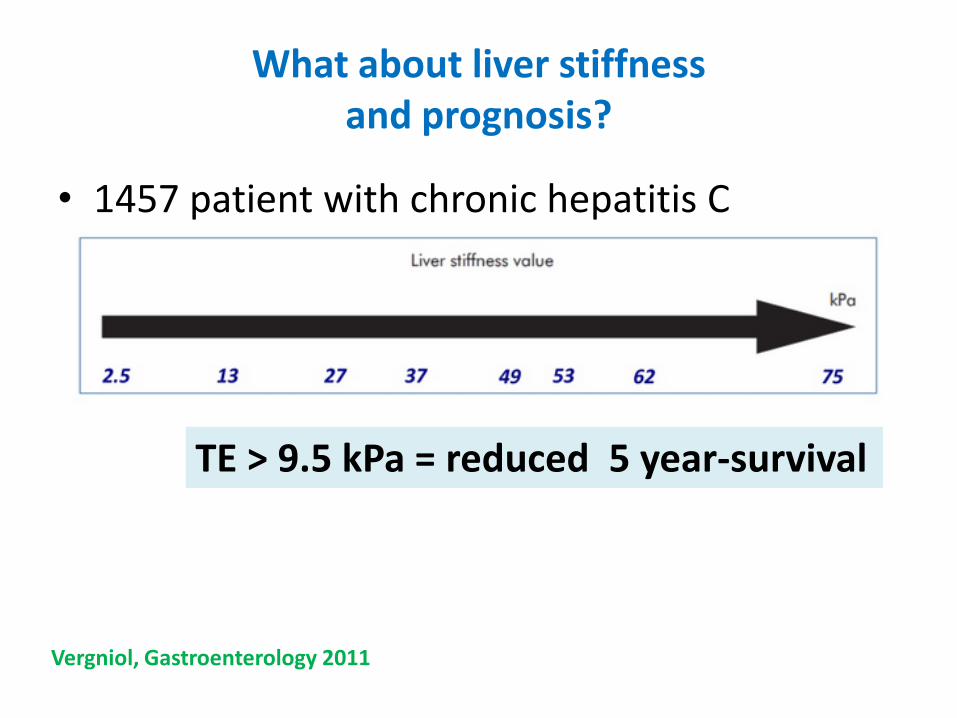
What about liver stiffnessand prognosis?
• 1457 patient with chronic hepatitis C
TE > 9.5 kPa = reduced 5 year-survival
Vergniol, Gastroenterology 2011
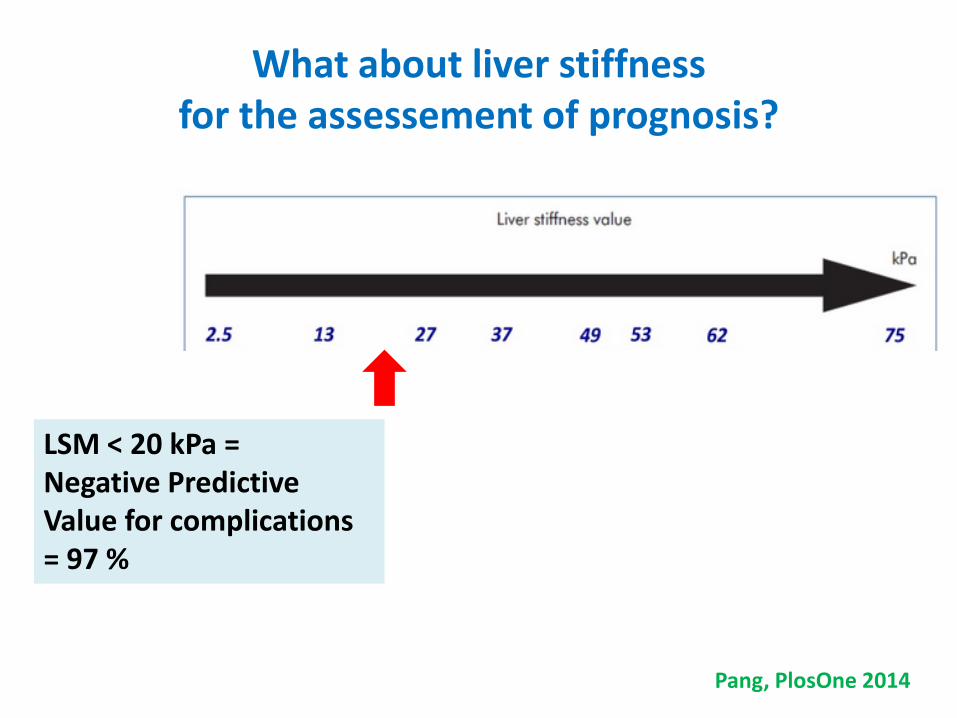
What about liver stiffnessfor the assessement of prognosis?
LSM < 20 kPa =Negative PredictiveValue for complications = 97 %
Pang, PlosOne 2014
Focal liver disorder
• Can we improve characterisation of livernodules?
Focal liver disease
• Stiffness: – FNH > Hepatocellular Adenoma
– Cholangiocarcinoma > hepatocellular carcinoma
• Overlap, No cut-off
• Evaluation of « non tumoral parenchyma » searching for underlying liver disorder
• Monitoring of percutaneous treatment?
Practical clinicalpediatric cases
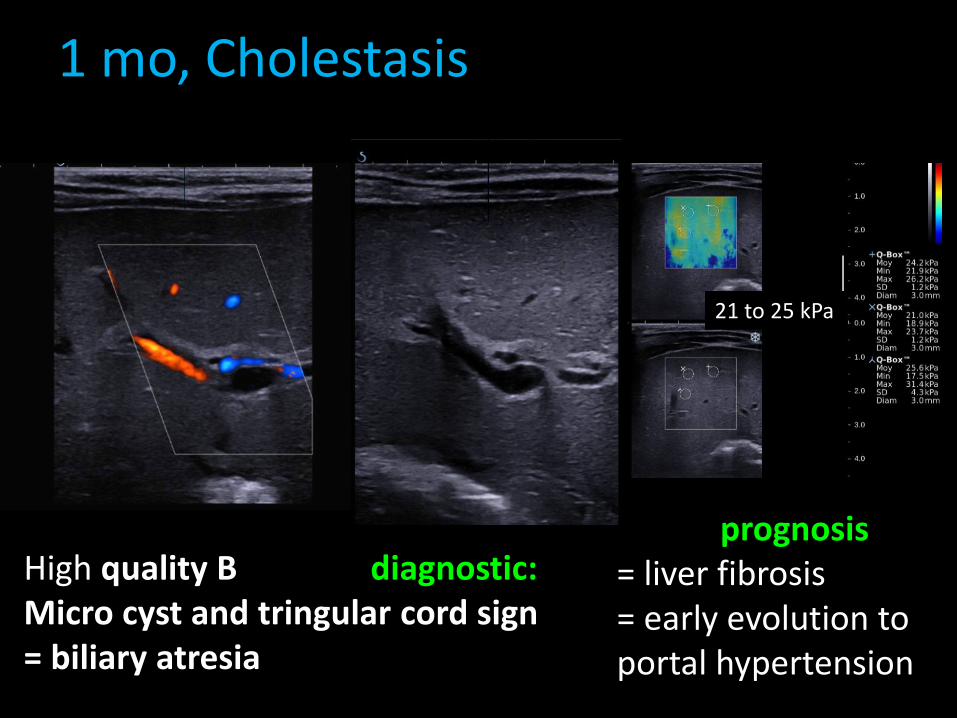
1 mo, Cholestasis
High quality B mode = diagnostic:Micro cyst and tringular cord sign= biliary atresia
SWE = prognosis= liver fibrosis= early evolution to portal hypertension
21 to 25 kPa
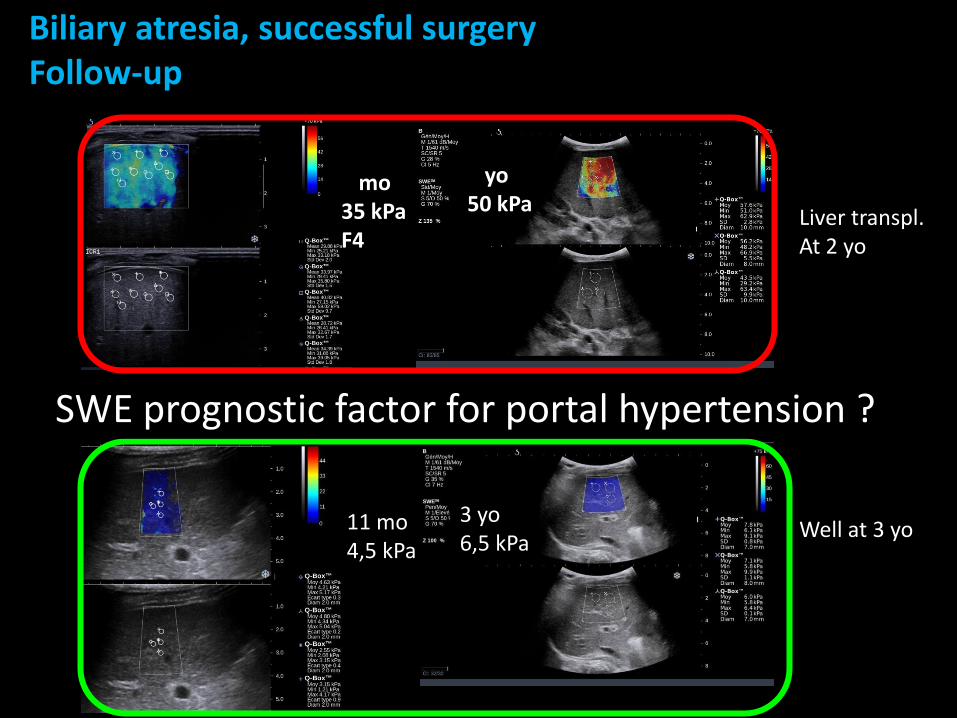
Biliary atresia, successful surgeryFollow-up
1 mo35 kPaF4
Liver transpl.At 2 yo
Well at 3 yo
2 yo50 kPa
3 yo6,5 kPa
11 mo4,5 kPa
SWE prognostic factor for portal hypertension ?
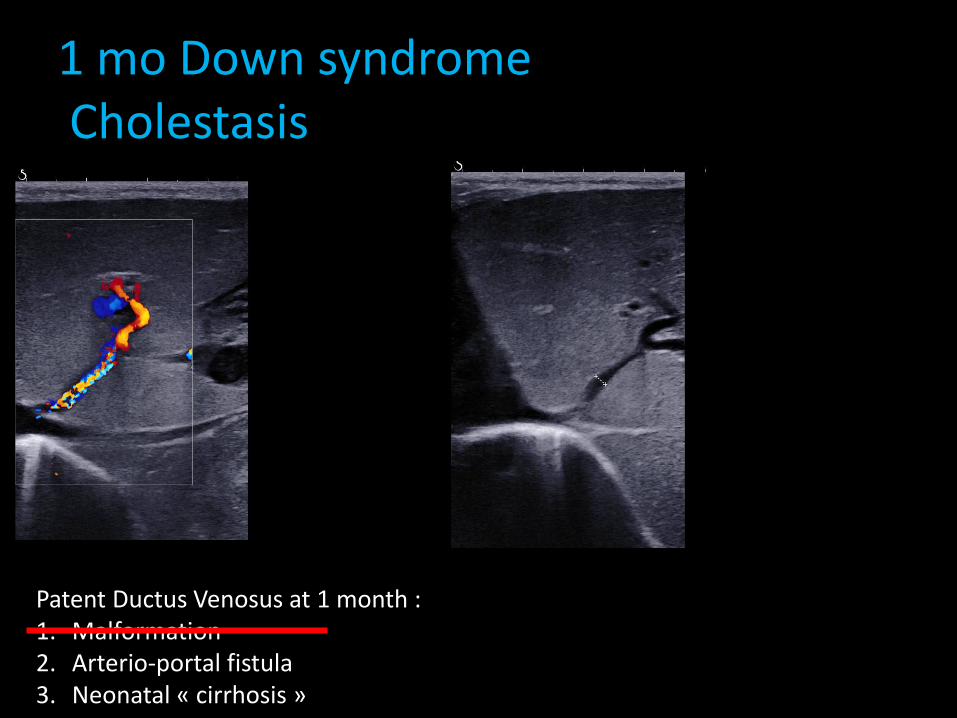
1 mo Down syndromeCholestasis
Patent Ductus Venosus at 1 month : 1. Malformation2. Arterio-portal fistula3. Neonatal « cirrhosis »
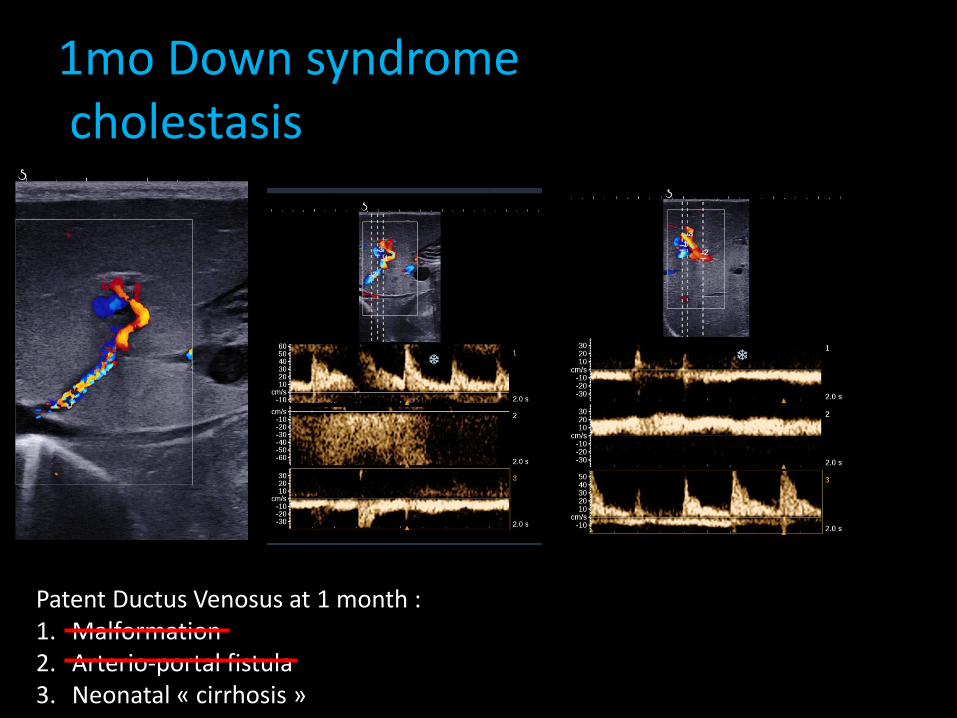
1mo Down syndromecholestasis
Patent Ductus Venosus at 1 month : 1. Malformation2. Arterio-portal fistula3. Neonatal « cirrhosis »
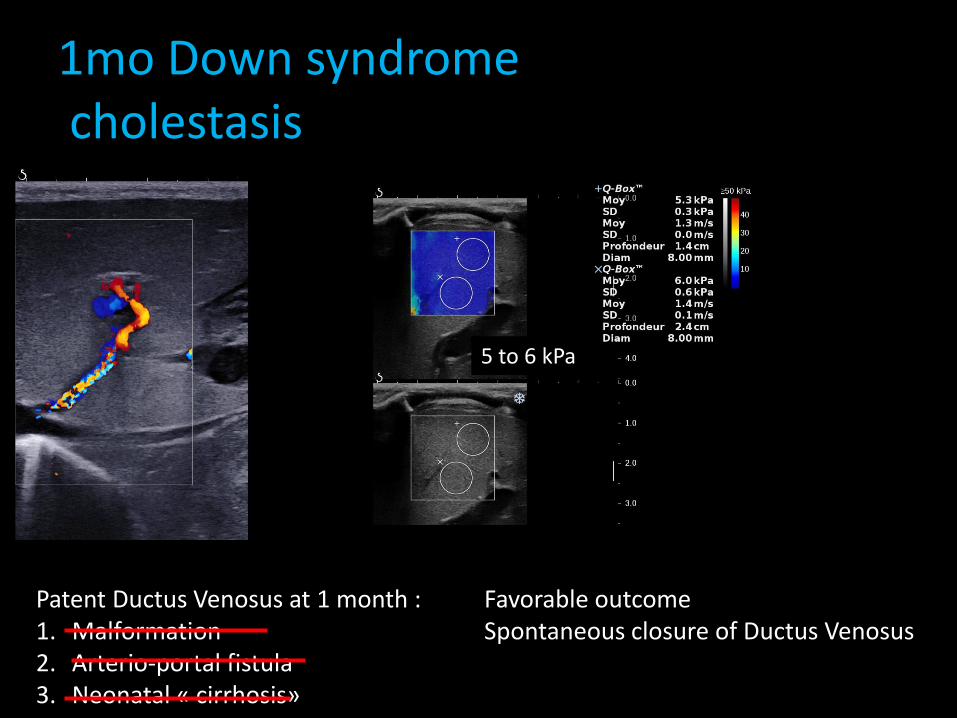
1mo Down syndromecholestasis
Patent Ductus Venosus at 1 month : 1. Malformation2. Arterio-portal fistula3. Neonatal « cirrhosis»
Favorable outcomeSpontaneous closure of Ductus Venosus
5 to 6 kPa
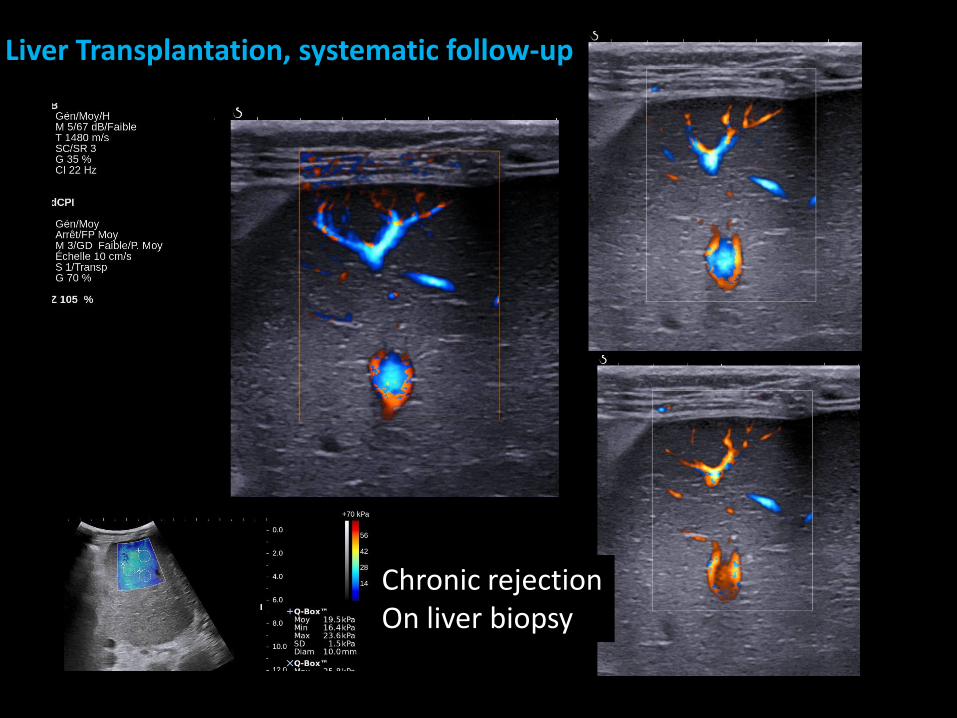
Liver Transplantation, systematic follow-up
Chronic rejectionOn liver biopsy
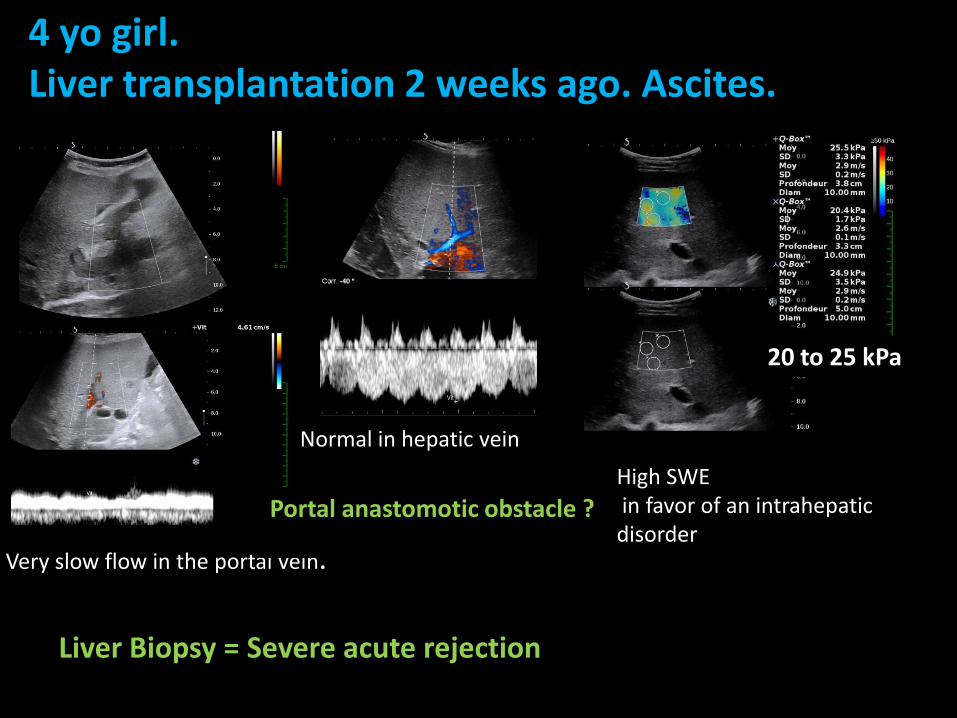
4 yo girl.Liver transplantation 2 weeks ago. Ascites.
Very slow flow in the portal vein.
Liver Biopsy = Severe acute rejection
Normal in hepatic vein
High SWE in favor of an intrahepaticdisorder
20 to 25 kPa
Portal anastomotic obstacle ?
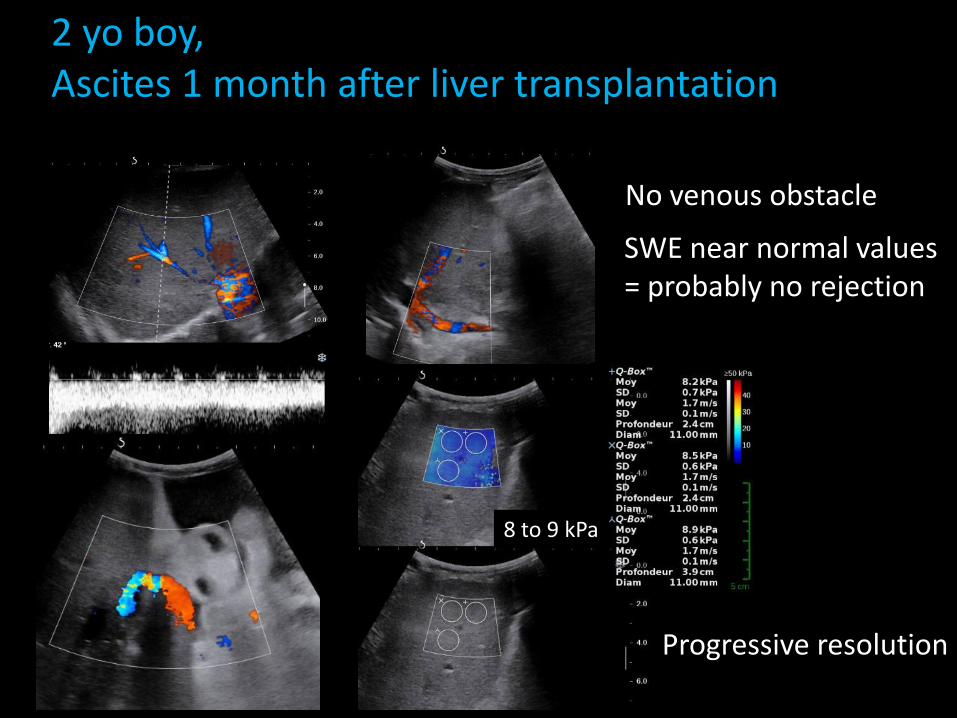
2 yo boy,Ascites 1 month after liver transplantation
No venous obstacle
SWE near normal values = probably no rejection
8 to 9 kPa
Progressive resolution
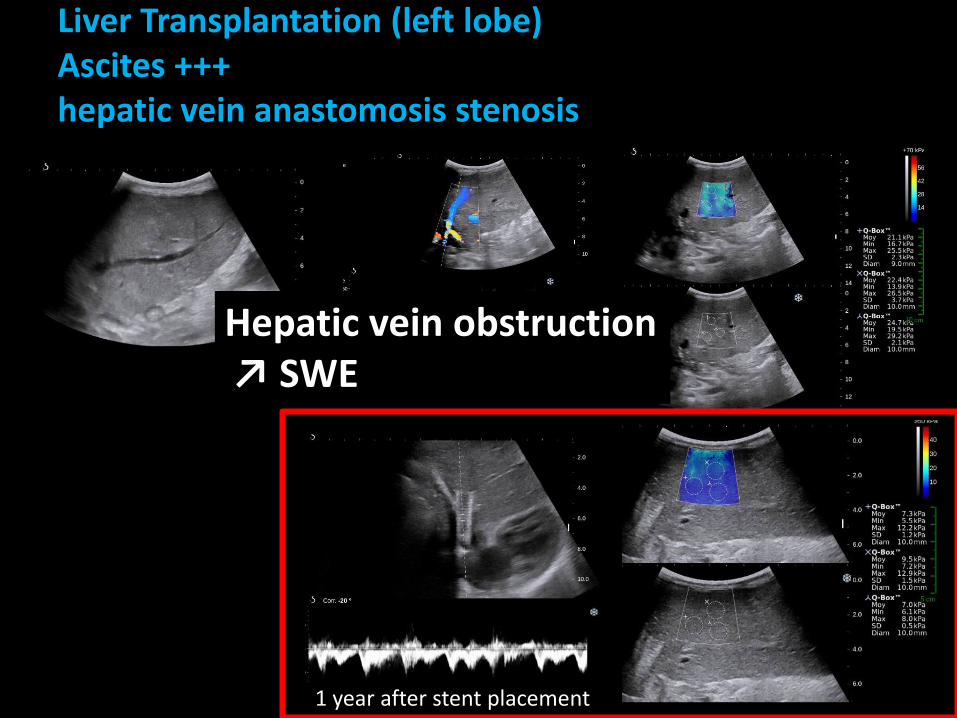
Liver Transplantation (left lobe)Ascites +++hepatic vein anastomosis stenosis
Hepatic vein obstruction↗ SWE
1 year after stent placement
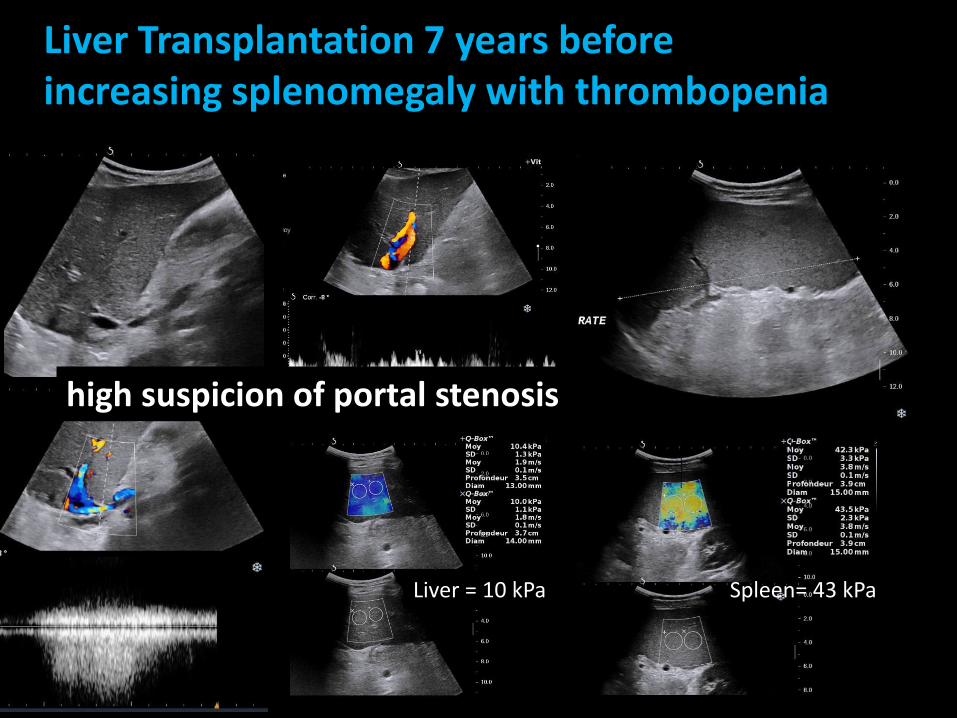
Liver Transplantation 7 years beforeincreasing splenomegaly with thrombopenia
high suspicion of portal stenosis
Liver = 10 kPa Spleen= 43 kPa
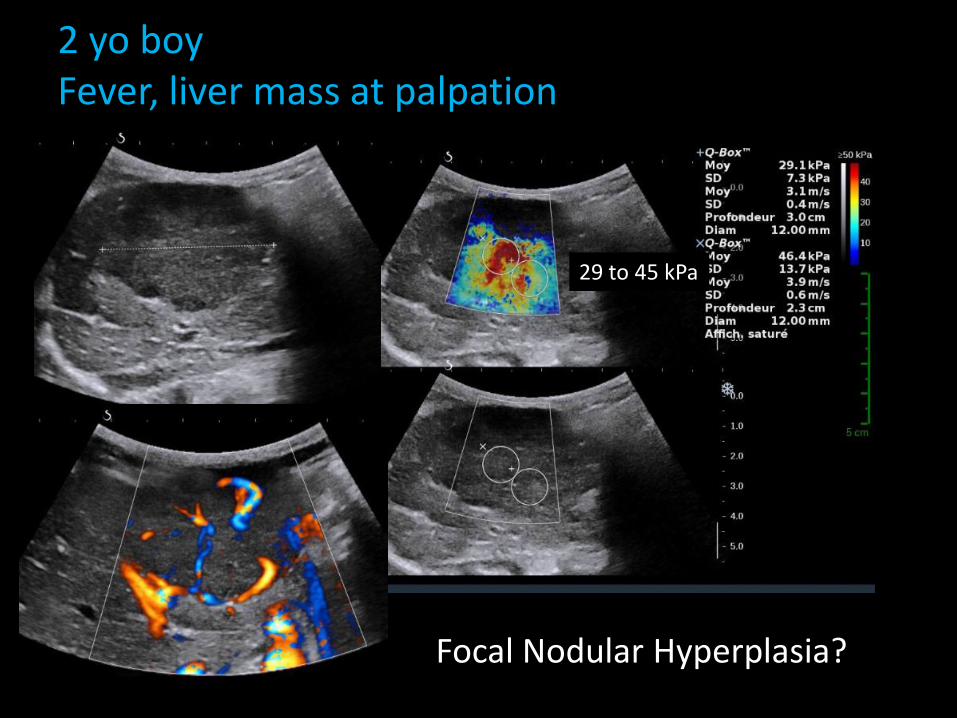
2 yo boyFever, liver mass at palpation
Focal Nodular Hyperplasia?
29 to 45 kPa
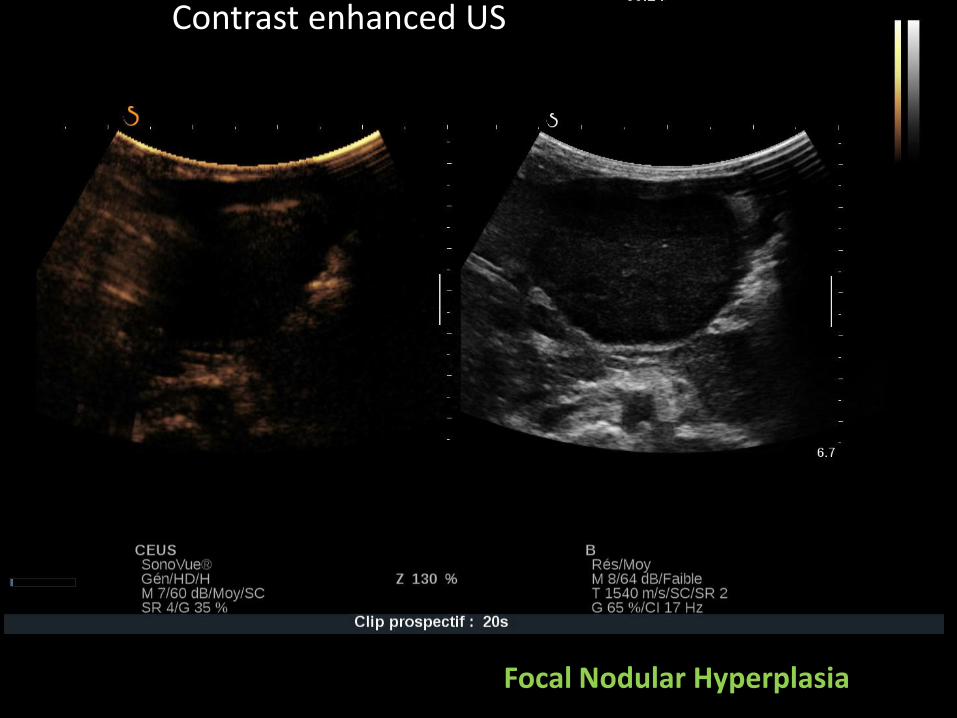
Contrast enhanced US
Focal Nodular Hyperplasia
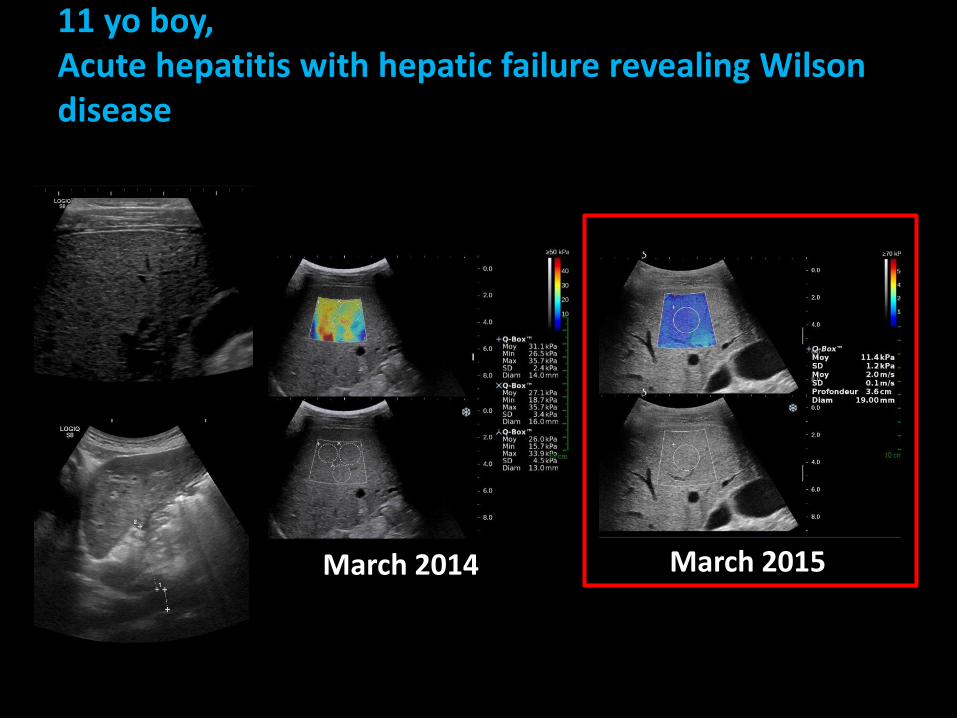
11 yo boy, Acute hepatitis with hepatic failure revealing Wilson disease
March 2014 March 2015
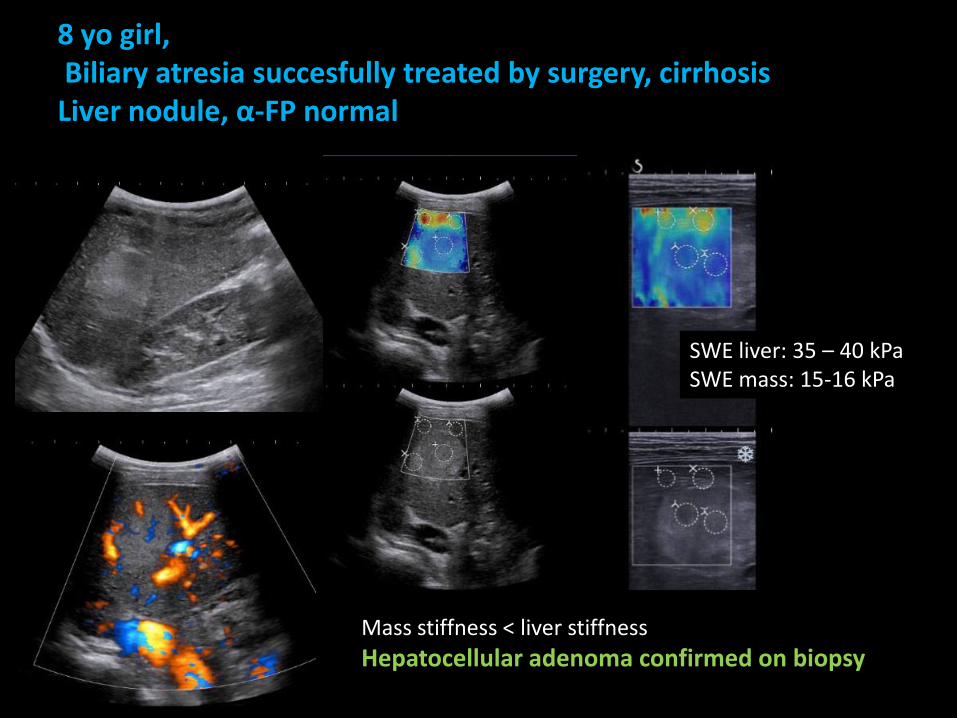
8 yo girl,Biliary atresia succesfully treated by surgery, cirrhosisLiver nodule, α-FP normal
Mass stiffness < liver stiffness
Hepatocellular adenoma confirmed on biopsy
SWE liver: 35 – 40 kPaSWE mass: 15-16 kPa
Conclusion
• US-based elastography is safe, easy to use
• Evaluation of diffuse liver disease and liver mass
• Only compare LSM obtained with the same technique and the same transducer
• Integration to the diagnostic workshop for liver diseases in children:– At diagnosis– For follow-up