Embed Size (px)
Citation preview
Approved by USDA’s World Agricultural Outlook Board
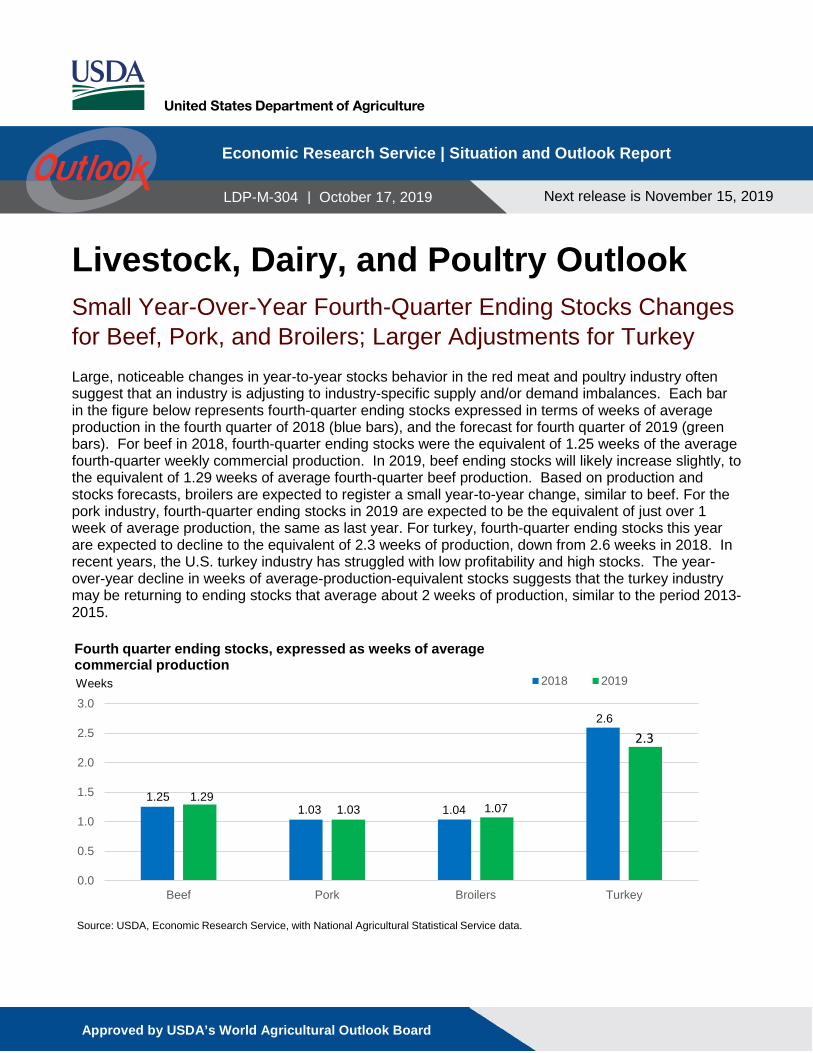
Livestock, Dairy, and Poultry Outlook Small Year-Over-Year Fourth-Quarter Ending Stocks Changes for Beef, Pork, and Broilers; Larger Adjustments for Turkey Large, noticeable changes in year-to-year stocks behavior in the red meat and poultry industry often suggest that an industry is adjusting to industry-specific supply and/or demand imbalances. Each bar in the figure below represents fourth-quarter ending stocks expressed in terms of weeks of average production in the fourth quarter of 2018 (blue bars), and the forecast for fourth quarter of 2019 (green bars). For beef in 2018, fourth-quarter ending stocks were the equivalent of 1.25 weeks of the average fourth-quarter weekly commercial production. In 2019, beef ending stocks will likely increase slightly, to the equivalent of 1.29 weeks of average fourth-quarter beef production. Based on production and stocks forecasts, broilers are expected to register a small year-to-year change, similar to beef. For the pork industry, fourth-quarter ending stocks in 2019 are expected to be the equivalent of just over 1 week of average production, the same as last year. For turkey, fourth-quarter ending stocks this year are expected to decline to the equivalent of 2.3 weeks of production, down from 2.6 weeks in 2018. In recent years, the U.S. turkey industry has struggled with low profitability and high stocks. The year-over-year decline in weeks of average-production-equivalent stocks suggests that the turkey industry may be returning to ending stocks that average about 2 weeks of production, similar to the period 2013-2015.
0.0
0.5
1.0
1.5
2.0
2.5
3.0
Beef Pork Broilers Turkey
2018 2019
Fourth quarter ending stocks, expressed as weeks of average commercial production
1.25 1.291.03 1.03 1.07
Source: USDA, Economic Research Service, with National Agricultural Statistical Service data.
Weeks
2.62.3
Economic Research Service | Situation and Outlook Report
Next release is November 15, 2019
LDP-M-304 | October 17, 2019
1.04
2 Livestock, Dairy, and Poultry Outlook, LDP-M-304, October 17, 2019
USDA, Economic Research Service
Beef/Cattle: Beef production in 2019 and 2020 remains relatively unchanged. Cattle prices appear to have recovered from the recent lows following the fire at the Tyson beef plant in August. As a result, the price forecast for 2019 was raised; this price strength was carried into early 2020. U.S. beef exports and imports were down in August. U.S. beef exports to China continue to increase from month to month. Given Asia’s growing demand for animal proteins, the 2020 forecast for beef exports was revised higher, while the 2020 forecast for beef imports was revised down. Dairy: The milk production forecast for 2019 has been raised due to higher expected cow numbers and milk per cow. With higher yield per cow expected to carry into next year, the milk production forecast for 2020 has also been raised. With additional tariffs to be assessed on imports of some products from the European Union, import forecasts for 2020 have been lowered on both the milk-fat and skim-solids milk-equivalent bases. Export forecasts for 2020 have been lowered on a milk-fat basis but raised on a skim-solids basis. The all-milk price forecast for 2019 is $18.40 per hundredweight (cwt), 5 cents higher than last month’s forecast. For 2020, the all-milk price forecast is $18.85 per cwt, unchanged from last month. Pork/Hogs: The September Quarterly Hogs and Pigs report indicated a June-August litter rate of 11.11 pigs per litter, which, when coupled with the March-May litter rate of 11 pigs per litter, points towards potentially more rapid growth in the near future. August pork exports were 16 percent higher than a year ago, with increased shipments to China\Hong Kong and South Korea offsetting reduced exports to Mexico and Japan. Poultry/Eggs: Expected third-quarter broiler production was increased on higher than expected September slaughter volumes, and the fourth quarter forecast was raised on hatchery data. For 2020, the production forecast was raised on recent broiler-type pullet chick placement data. Both the 2019 and 2020 ending stock forecasts were revised up on the latest cold storage report and the anticipated increase in production. The third-quarter price forecast was increased on recent price trends, while the 2020 price forecast was revised down on expectations that increased supply will put downward pressure on prices. The third-quarter broiler export forecast was decreased on lower-than-expected demand. The second half table egg production forecast was increased on higher-than-expected lay rates for the remainder of the year, and the 2020 table egg production forecast was also increased. The expected increase in broiler production was the basis for increasing the 2020 hatching egg forecast. Egg stocks were increased based expectations for increased production, as well as on accumulating dried egg inventories. The egg import forecast was revised down on low import volumes. The third-quarter turkey production forecast was decreased on recent data, while turkey stocks were lowered based on tighter supplies. The fourth-quarter turkey price forecast was increased slightly on recent price trends, and the export forecast was increased on expectations for higher demand.
3 Livestock, Dairy, and Poultry Outlook, LDP-M-304, October 17, 2019
USDA, Economic Research Service
Beef/Cattle Russell Knight and Christopher Davis Beef Production Relatively Unchanged for 2019 and 2020 The 2019 beef production forecast was reduced by 5 million pounds from last month but remains at a rounded 26.9 billion pounds. The reduction was based on a slower-than-expected pace of fed cattle slaughter that was partially offset by greater expected cow slaughter and slightly higher expected cattle dressed weights. The forecast for 2020 beef production was unchanged from last month at 27.7 billion pounds. However, there was a shift among the quarters due to the expected timing of cattle placements. Based on fewer expected cattle placed in feedlots in third-quarter 2019, fewer fed cattle are expected to be slaughtered in first-quarter 2020, reducing anticipated production by 90 million pounds. Further, a higher expected number of cattle placed in feedlots in fourth-quarter 2019 is expected to raise the number of fed cattle slaughtered in second-quarter 2020, increasing production by 90 million pounds. Cattle Prices Rebound On October 7 at the Oklahoma City National stockyards, sales of feeder steers weighing 750 to 800 pounds were reported at $147.26 per cwt, more than $6 above prices reported the week before the fire at Tyson’s beef plant in Holcomb, Kansas in August. Further, prices have recovered more than $12 from the recent low of $134.80 per hundredweight (cwt) the week of September 9. The National Agricultural Statistics Service Cattle on Feed report for September 2019 estimated there were about 9 percent fewer cattle placed in feedlots with 1,000 head or greater capacity and almost 2 percent fewer cattle marketed in the month of August. This led to a drop in the number of cattle on feed on September 1 of more than 1 percent compared to a year ago. Warmer-than-expected weather patterns and improved supplies of forage may have extended cattle grazing periods, slowing the pace of placements in third-quarter 2019. However, some of these feeder cattle will likely need to be moved off grass and into the feedlots in fourth-quarter 2019, keeping feeder prices under pressure in the fourth quarter. Based on recent price data, the fourth-quarter 2019 feeder steer price was raised by $4 to $137 per cwt. The 2020 annual price forecast for feeder steers was unchanged at $141 per cwt. The market price for fed steers has turned upward after the low of $100.07 per cwt reached the week ending September 15. Since then, the price for fed steers in the 5-area marketing region has increased more than 7 percent to $107.34 per cwt in the week ending October 4. However, it remains almost 6 percent below levels prior to the August 9 fire at Tyson’s beef plant. In perspective, the 5-year average decline between the first week of August and the first week of October is almost 8 percent. The Choice-Select price spread is abnormally high; if this incentivizes feedlots to keep cattle on feed longer, packers likely will have to pay higher prices to bid cattle out of the feedlots. The price forecast for fourth-quarter 2019 was raised by $7 to $110 per cwt. The first-quarter price forecast for 2020 was raised by $1 to $120 per cwt. As a result, the 2020 annual price forecast for fed steers increased by $1 to $116 per cwt.
August Beef Exports Fall In August, beef exports totaled 261 million pounds, 12 million pounds lower than July and about 27 million pounds lower than August 2018. Exports to major destinations have declined, including to Japan (-21 percent), Mexico (-18 percent), South Korea (-11 percent) and Hong Kong (-5 percent). Conversely, exports increased to several Asian countries, including Indonesia (+117 percent), China (+95 percent), Vietnam (+67 percent), and the Philippines (+42 percent). The U.S. beef export forecast for 2019 third quarter was revised down 15 million pounds to 810 million pounds. The U.S. beef export forecast for first-quarter 2020 was revised up from 725 million pounds to 765 million pounds; for second quarter from 825 million pounds to 830 million pounds; and for fourth quarter from 845 million pounds to 865 million pounds. In contrast, the beef export forecast for the third quarter of 2020 was revised down from 850 million pounds to 845 million pounds. Total exports in 2020 are forecast up 6 percent to a record 3.3 billion pounds, accounting for 12 percent of U.S. production. The United States is poised to expand market share in top markets such as Japan, South Korea, and Taiwan as key competitor Australia struggles to maintain its market shares, given its reduced exportable supplies and its dominance in filling China demand.
August Beef Imports Fall U.S. beef imports in August totaled 266 million pounds, down 2 percent from a year ago and over 1 million pounds lower than the previous month. U.S. beef imports from major suppliers year-to-year were ramped up from Brazil (+33 percent), Canada (+9 percent), and Mexico (+8 percent), but were all offset by New Zealand’s reduction in shipments to the U.S. totaling almost 15 million pounds. For 2020, U.S. imports will likely be limited by a combination of tighter supplies in Oceania and expected increased demand for beef in Asia due to African Swine Fever. As a result, U.S. beef imports were revised down for 2020 first quarter from 715 million pounds to 690 million pounds; for second quarter from 800 million pounds to 735 million pounds; and for third quarter from 770 million pounds to 745 million pounds.
4 Livestock, Dairy, and Poultry Outlook, LDP-M-304, October 17, 2019
USDA, Economic Research Service
5 Livestock, Dairy, and Poultry Outlook, LDP-M-304, October 17, 2019
USDA, Economic Research Service
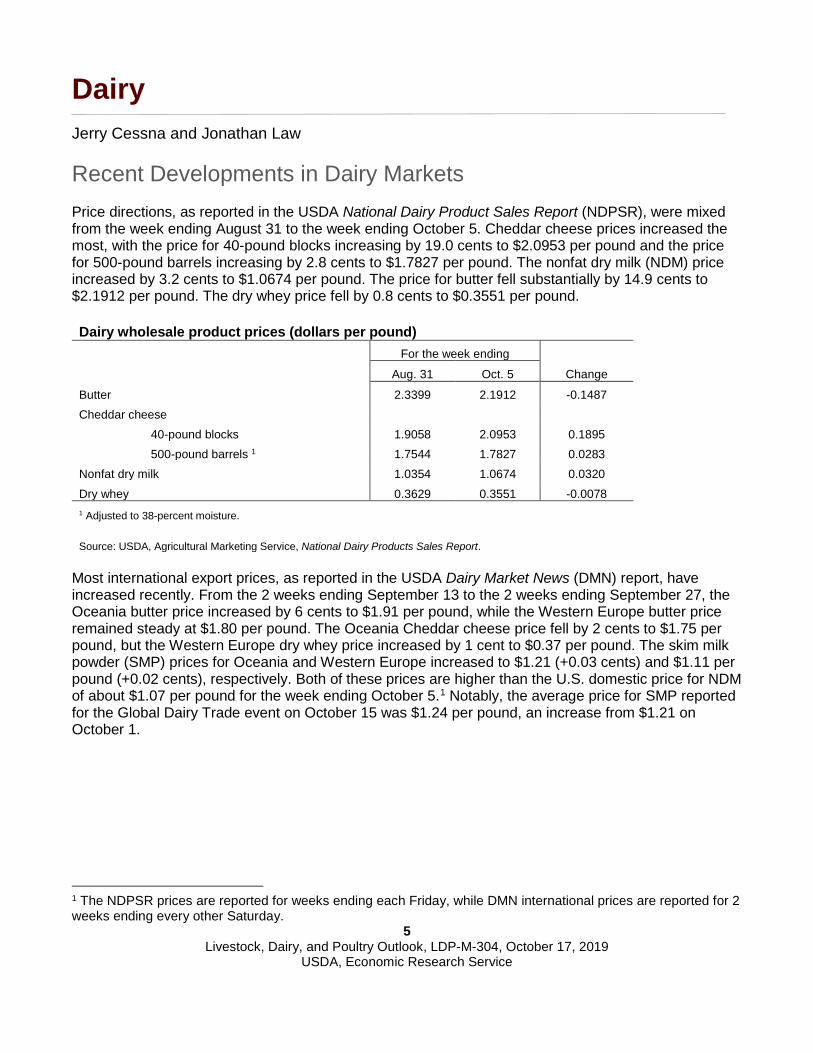
Dairy Jerry Cessna and Jonathan Law Recent Developments in Dairy Markets Price directions, as reported in the USDA National Dairy Product Sales Report (NDPSR), were mixed from the week ending August 31 to the week ending October 5. Cheddar cheese prices increased the most, with the price for 40-pound blocks increasing by 19.0 cents to $2.0953 per pound and the price for 500-pound barrels increasing by 2.8 cents to $1.7827 per pound. The nonfat dry milk (NDM) price increased by 3.2 cents to $1.0674 per pound. The price for butter fell substantially by 14.9 cents to $2.1912 per pound. The dry whey price fell by 0.8 cents to $0.3551 per pound.
Dairy wholesale product prices (dollars per pound) For the week ending
Aug. 31 Oct. 5 Change
Butter 2.3399 2.1912 -0.1487 Cheddar cheese
40-pound blocks 1.9058 2.0953 0.1895
500-pound barrels 1 1.7544 1.7827 0.0283 Nonfat dry milk 1.0354 1.0674 0.0320 Dry whey 0.3629 0.3551 -0.0078 1 Adjusted to 38-percent moisture.
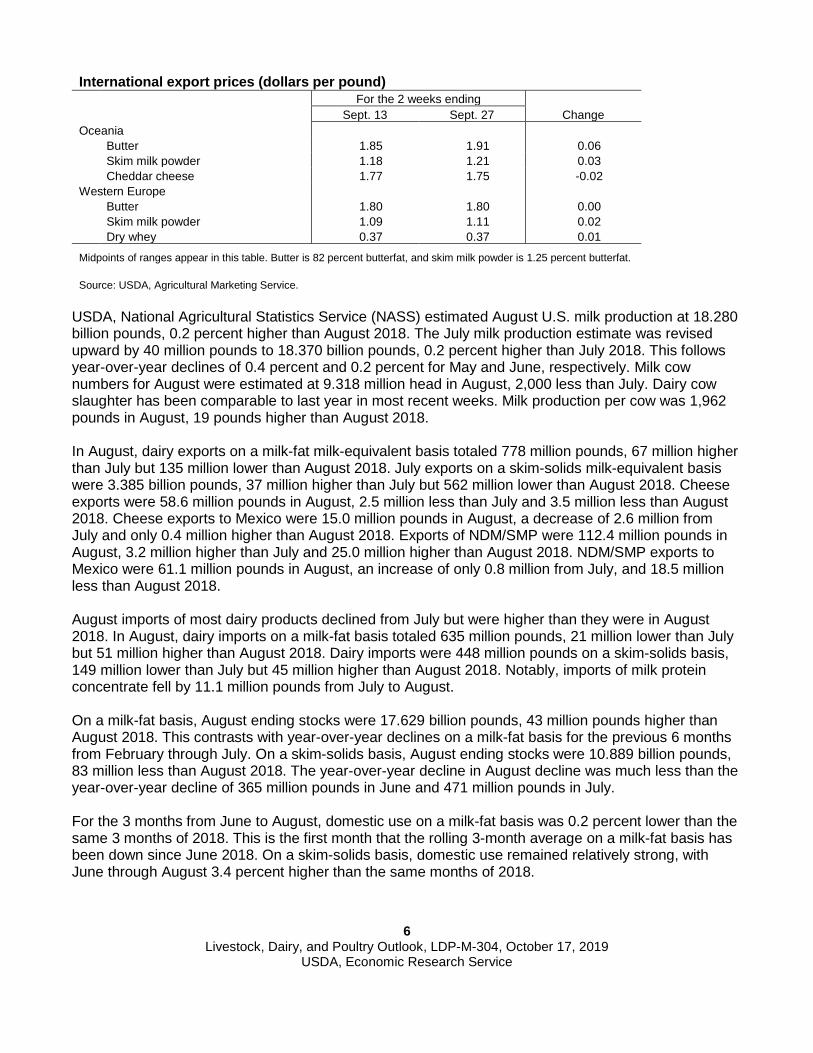
Source: USDA, Agricultural Marketing Service, National Dairy Products Sales Report. Most international export prices, as reported in the USDA Dairy Market News (DMN) report, have increased recently. From the 2 weeks ending September 13 to the 2 weeks ending September 27, the Oceania butter price increased by 6 cents to $1.91 per pound, while the Western Europe butter price remained steady at $1.80 per pound. The Oceania Cheddar cheese price fell by 2 cents to $1.75 per pound, but the Western Europe dry whey price increased by 1 cent to $0.37 per pound. The skim milk powder (SMP) prices for Oceania and Western Europe increased to $1.21 (+0.03 cents) and $1.11 per pound (+0.02 cents), respectively. Both of these prices are higher than the U.S. domestic price for NDM of about $1.07 per pound for the week ending October 5.1 Notably, the average price for SMP reported for the Global Dairy Trade event on October 15 was $1.24 per pound, an increase from $1.21 on October 1. 1 The NDPSR prices are reported for weeks ending each Friday, while DMN international prices are reported for 2 weeks ending every other Saturday.
6 Livestock, Dairy, and Poultry Outlook, LDP-M-304, October 17, 2019
USDA, Economic Research Service
International export prices (dollars per pound) For the 2 weeks ending Sept. 13 Sept. 27 Change Oceania Butter 1.85 1.91 0.06 Skim milk powder 1.18 1.21 0.03 Cheddar cheese 1.77 1.75 -0.02 Western Europe Butter 1.80 1.80 0.00 Skim milk powder 1.09 1.11 0.02 Dry whey 0.37 0.37 0.01 Midpoints of ranges appear in this table. Butter is 82 percent butterfat, and skim milk powder is 1.25 percent butterfat. Source: USDA, Agricultural Marketing Service.
USDA, National Agricultural Statistics Service (NASS) estimated August U.S. milk production at 18.280 billion pounds, 0.2 percent higher than August 2018. The July milk production estimate was revised upward by 40 million pounds to 18.370 billion pounds, 0.2 percent higher than July 2018. This follows year-over-year declines of 0.4 percent and 0.2 percent for May and June, respectively. Milk cow numbers for August were estimated at 9.318 million head in August, 2,000 less than July. Dairy cow slaughter has been comparable to last year in most recent weeks. Milk production per cow was 1,962 pounds in August, 19 pounds higher than August 2018. In August, dairy exports on a milk-fat milk-equivalent basis totaled 778 million pounds, 67 million higher than July but 135 million lower than August 2018. July exports on a skim-solids milk-equivalent basis were 3.385 billion pounds, 37 million higher than July but 562 million lower than August 2018. Cheese exports were 58.6 million pounds in August, 2.5 million less than July and 3.5 million less than August 2018. Cheese exports to Mexico were 15.0 million pounds in August, a decrease of 2.6 million from July and only 0.4 million higher than August 2018. Exports of NDM/SMP were 112.4 million pounds in August, 3.2 million higher than July and 25.0 million higher than August 2018. NDM/SMP exports to Mexico were 61.1 million pounds in August, an increase of only 0.8 million from July, and 18.5 million less than August 2018.
August imports of most dairy products declined from July but were higher than they were in August 2018. In August, dairy imports on a milk-fat basis totaled 635 million pounds, 21 million lower than July but 51 million higher than August 2018. Dairy imports were 448 million pounds on a skim-solids basis, 149 million lower than July but 45 million higher than August 2018. Notably, imports of milk protein concentrate fell by 11.1 million pounds from July to August. On a milk-fat basis, August ending stocks were 17.629 billion pounds, 43 million pounds higher than August 2018. This contrasts with year-over-year declines on a milk-fat basis for the previous 6 months from February through July. On a skim-solids basis, August ending stocks were 10.889 billion pounds, 83 million less than August 2018. The year-over-year decline in August decline was much less than the year-over-year decline of 365 million pounds in June and 471 million pounds in July. For the 3 months from June to August, domestic use on a milk-fat basis was 0.2 percent lower than the same 3 months of 2018. This is the first month that the rolling 3-month average on a milk-fat basis has been down since June 2018. On a skim-solids basis, domestic use remained relatively strong, with June through August 3.4 percent higher than the same months of 2018.
7 Livestock, Dairy, and Poultry Outlook, LDP-M-304, October 17, 2019
USDA, Economic Research Service
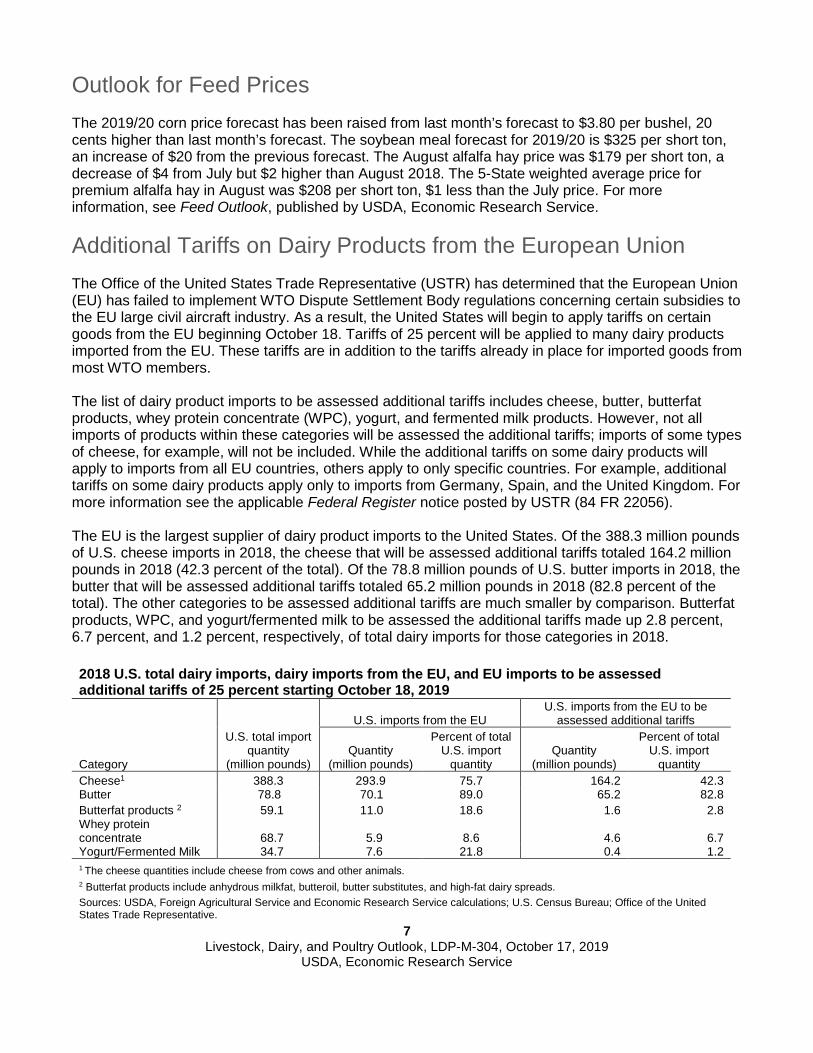
Outlook for Feed Prices The 2019/20 corn price forecast has been raised from last month’s forecast to $3.80 per bushel, 20 cents higher than last month’s forecast. The soybean meal forecast for 2019/20 is $325 per short ton, an increase of $20 from the previous forecast. The August alfalfa hay price was $179 per short ton, a decrease of $4 from July but $2 higher than August 2018. The 5-State weighted average price for premium alfalfa hay in August was $208 per short ton, $1 less than the July price. For more information, see Feed Outlook, published by USDA, Economic Research Service. Additional Tariffs on Dairy Products from the European Union The Office of the United States Trade Representative (USTR) has determined that the European Union (EU) has failed to implement WTO Dispute Settlement Body regulations concerning certain subsidies to the EU large civil aircraft industry. As a result, the United States will begin to apply tariffs on certain goods from the EU beginning October 18. Tariffs of 25 percent will be applied to many dairy products imported from the EU. These tariffs are in addition to the tariffs already in place for imported goods from most WTO members. The list of dairy product imports to be assessed additional tariffs includes cheese, butter, butterfat products, whey protein concentrate (WPC), yogurt, and fermented milk products. However, not all imports of products within these categories will be assessed the additional tariffs; imports of some types of cheese, for example, will not be included. While the additional tariffs on some dairy products will apply to imports from all EU countries, others apply to only specific countries. For example, additional tariffs on some dairy products apply only to imports from Germany, Spain, and the United Kingdom. For more information see the applicable Federal Register notice posted by USTR (84 FR 22056). The EU is the largest supplier of dairy product imports to the United States. Of the 388.3 million pounds of U.S. cheese imports in 2018, the cheese that will be assessed additional tariffs totaled 164.2 million pounds in 2018 (42.3 percent of the total). Of the 78.8 million pounds of U.S. butter imports in 2018, the butter that will be assessed additional tariffs totaled 65.2 million pounds in 2018 (82.8 percent of the total). The other categories to be assessed additional tariffs are much smaller by comparison. Butterfat products, WPC, and yogurt/fermented milk to be assessed the additional tariffs made up 2.8 percent, 6.7 percent, and 1.2 percent, respectively, of total dairy imports for those categories in 2018. 2018 U.S. total dairy imports, dairy imports from the EU, and EU imports to be assessed additional tariffs of 25 percent starting October 18, 2019
U.S. total import
quantity (million pounds)
U.S. imports from the EU U.S. imports from the EU to be
assessed additional tariffs
Category Quantity
(million pounds)
Percent of total U.S. import
quantity Quantity
(million pounds)
Percent of total U.S. import
quantity Cheese1 388.3 293.9 75.7 164.2 42.3 Butter 78.8 70.1 89.0 65.2 82.8 Butterfat products 2 59.1 11.0 18.6 1.6 2.8 Whey protein concentrate 68.7 5.9 8.6 4.6 6.7 Yogurt/Fermented Milk 34.7 7.6 21.8 0.4 1.2 1 The cheese quantities include cheese from cows and other animals. 2 Butterfat products include anhydrous milkfat, butteroil, butter substitutes, and high-fat dairy spreads. Sources: USDA, Foreign Agricultural Service and Economic Research Service calculations; U.S. Census Bureau; Office of the United States Trade Representative.
8 Livestock, Dairy, and Poultry Outlook, LDP-M-304, October 17, 2019
USDA, Economic Research Service
Dairy Forecasts for the Remainder of 2019 Based on recent data for milk cow numbers and dairy cow slaughter, milk cows for the third quarter are expected to number 9.320 million head, 5,000 higher than forecast last month. Milk per cow for the third quarter is expected to be 5,805 pounds, an increase of 15 pounds from the last forecast based on recent data. As a result of these changes, milk production for the third quarter is now expected to be 54.1 billion pounds, 0.2 billion pounds higher than the last forecast. The fourth-quarter milk production forecast is unchanged at 53.8 billion pounds. The annual milk production forecast for 2019 is 218.2 billion pounds. Annual import forecasts for 2019 on both the milk-fat and skim-solids bases are unchanged from last month’s forecast. Greater demands for butter and butterfat products are expected to be relatively strong for the remainder of the year, and importers may have increased imports from the EU before the tariffs go into effect on October 18. Export forecasts for the remainder of 2019 have been lowered due to lower expected exports of cheese and NDM/SMP to Mexico. The export forecast for 2019 on a milk-fat basis for the second half has been lowered 0.3 billion pounds, resulting in an annual forecast of 9.0 billion pounds. On a skim-solids basis, the export forecast for the second half of the year has been lowered, resulting in an annual forecast of 40.0 billion pounds. The forecast for domestic use on a milk-fat basis has been raised 0.5 billion pounds for the second half of 2019, resulting in an annual forecast of 215.7 billion pounds, as consumption should respond to lower prices for butter through the end of the year. On a skim-solids basis, domestic use in the second half of 2019 is now expected slightly lower than the previous forecast, resulting in an annual forecast of 183.1 billion pounds. The forecast for 2019 ending stocks on a milk-fat basis for the year is unchanged at 13.0 billion pounds. Ending stocks on a skim-solids basis for 2019 are now projected at 10.4 billion pounds, an increase of 0.4 billion pounds from last month’s forecast. Changes in product price forecasts for the fourth quarter of 2019 are mixed. Based on recent price movements, the fourth-quarter price for Cheddar cheese has been raised by 4 cents to $1.875 per pound, but fourth-quarter price forecasts for butter and dry whey have been lowered to $2.145 per pound (-3.0 cents) and $0.365 per pound (-0.5 cents), respectively. Due to recent domestic and international price movements, the NDM price forecast for the fourth quarter has been raised by 2 cents to $1.065 per pound. With the higher cheese price forecast more than offsetting the lower dry whey forecast, the Class III price forecast for the fourth quarter of 2019 has been raised to $17.95 per hundredweight (cwt), 35 cents higher than last month’s forecast. The increase in the NDM price forecast outweighs the decrease in the butter price forecast, resulting in a fourth-quarter Class IV forecast of $16.10 per cwt, 5 cents higher than last month’s forecast. The all-milk price for the third quarter is expected to be $19.00 per cwt, unchanged from last month’s forecast. For the fourth quarter, the all-milk price forecast has been increased by 20 cents to $19.60 per cwt. For the year, the all-milk forecast is $18.40 per cwt, 5 cents higher than last month’s projection.
9 Livestock, Dairy, and Poultry Outlook, LDP-M-304, October 17, 2019
USDA, Economic Research Service
Dairy Forecasts for 2020 The forecast for the size of the milking herd in 2020 is unchanged from last month’s forecast at 9.340 million head. Milk yield per cow for the year is now forecast at 23,725 pounds, an increase of 35 pounds from the last forecast, as more rapid yield growth in late 2019 should carry over into 2020. Due to the higher milk per cow forecast, the milk production forecast for 2020 has been raised by 0.4 billion pounds to 221.6 billion. Due to the expected impact of new tariffs on imports of some dairy products from the EU, the import forecasts for 2020 have been lowered to 6.5 billion pounds on a milk-fat basis (-0.4 billion) and to 5.5 billion pounds on a skim-solids basis (-0.1 billion). The forecast for 2020 exports on a milk-fat basis has been lowered by 0.3 billion pounds to 9.3 billion due to lower expected cheese exports. Higher exports of NDM/SMP are expected due to strong global demand and U.S. price competitiveness. Lactose exports to China are expected to increase as China takes steps to offset the impacts of African Swine Fever. With higher expected exports of NDM/SMP and lactose more than offsetting lower expected exports of cheese, the forecast for 2020 exports on a skim-solids basis has been raised to 43.0 billion pounds, 0.4 billion higher than last month’s forecast. Ending stocks for 2020 on a milk-fat basis are now projected at 12.8 billion pounds for the year, 0.2 billion pounds lower than last month’s estimate. On a skim-solids basis, ending stocks are projected at 9.5 billion pounds, a reduction of 0.3 billion pounds from the last forecast. Domestic use forecasts for 2020 have been raised on both the milk-fat and skim-solids bases to 217.8 billion pounds (+0.5 billion) and 183.8 billion pounds (+0.4 billion), respectively. With higher expected cheese prices for the fourth quarter of 2019 carrying over into 2020 and lower expected imports, the cheese price forecast for 2020 has been raised 1.5 cents to $1.790 per pound for the year. The dry whey price forecast for 2020 is unchanged at $0.375. With stronger expected global demand for NDM/SMP, the NDM price forecast has been raised half a cent to $1.040 per pound. The butter price forecast for the year is 2.5 cents lower than last month’s, at $2.20 per pound, as lower price levels in late 2019 should carry over into 2020. With a higher cheese price forecast for 2020, the Class III price forecast is $17.20 per cwt for the year, 15 cents higher than last month’s forecast. The Class IV price forecast has been lowered 5 cents to $16.10 per cwt for the year, as the lower butter price forecast more than offsets the higher NDM price forecast. The all-milk price forecast for 2020 is unchanged at $18.85 per cwt.
10 Livestock, Dairy, and Poultry Outlook, LDP-M-304, October 17, 2019
USDA, Economic Research Service
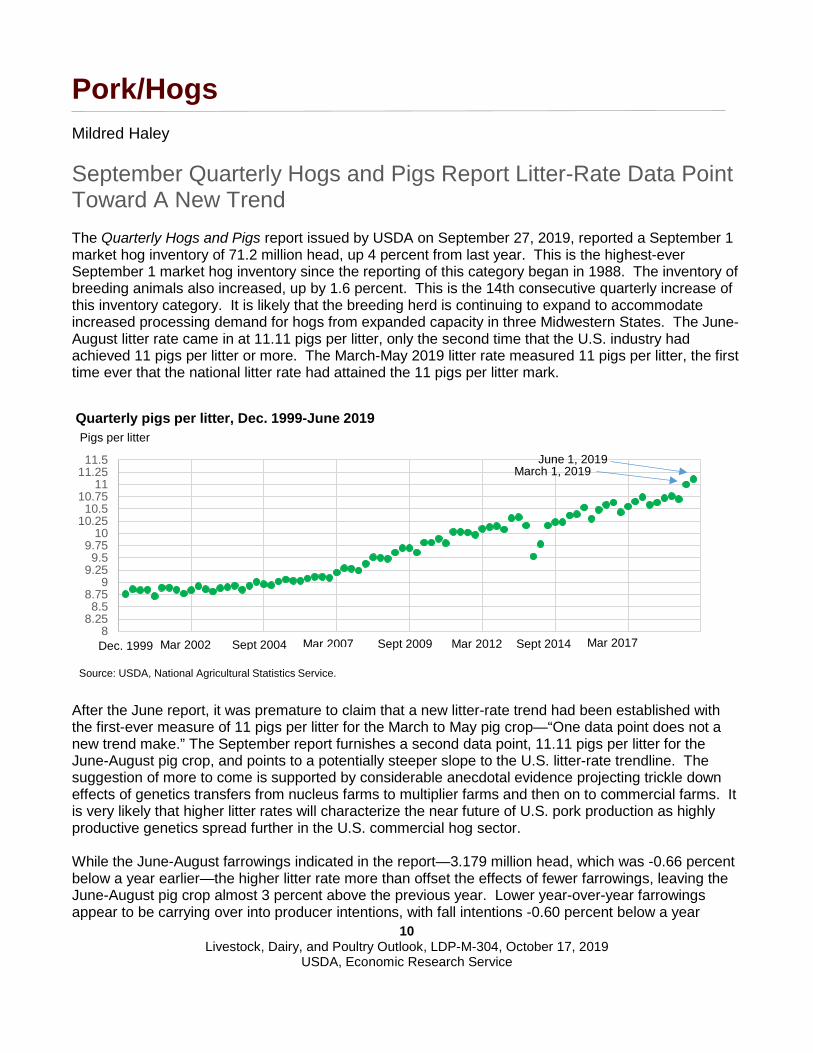
Pork/Hogs Mildred Haley September Quarterly Hogs and Pigs Report Litter-Rate Data Point Toward A New Trend The Quarterly Hogs and Pigs report issued by USDA on September 27, 2019, reported a September 1 market hog inventory of 71.2 million head, up 4 percent from last year. This is the highest-ever September 1 market hog inventory since the reporting of this category began in 1988. The inventory of breeding animals also increased, up by 1.6 percent. This is the 14th consecutive quarterly increase of this inventory category. It is likely that the breeding herd is continuing to expand to accommodate increased processing demand for hogs from expanded capacity in three Midwestern States. The June-August litter rate came in at 11.11 pigs per litter, only the second time that the U.S. industry had achieved 11 pigs per litter or more. The March-May 2019 litter rate measured 11 pigs per litter, the first time ever that the national litter rate had attained the 11 pigs per litter mark.
After the June report, it was premature to claim that a new litter-rate trend had been established with the first-ever measure of 11 pigs per litter for the March to May pig crop—“One data point does not a new trend make.” The September report furnishes a second data point, 11.11 pigs per litter for the June-August pig crop, and points to a potentially steeper slope to the U.S. litter-rate trendline. The suggestion of more to come is supported by considerable anecdotal evidence projecting trickle down effects of genetics transfers from nucleus farms to multiplier farms and then on to commercial farms. It is very likely that higher litter rates will characterize the near future of U.S. pork production as highly productive genetics spread further in the U.S. commercial hog sector. While the June-August farrowings indicated in the report—3.179 million head, which was -0.66 percent below a year earlier—the higher litter rate more than offset the effects of fewer farrowings, leaving the June-August pig crop almost 3 percent above the previous year. Lower year-over-year farrowings appear to be carrying over into producer intentions, with fall intentions -0.60 percent below a year
88.258.5
8.759
9.259.5
9.7510
10.2510.5
10.7511
11.2511.5
Dec. 1999 Mar 2002 Sept 2004 Mar 2007 Sept 2009 Mar 2012 Sept 2014 Mar 2017
Source: USDA, National Agricultural Statistics Service.
Pigs per litterQuarterly pigs per litter, Dec. 1999-June 2019
March 1, 2019June 1, 2019
11 Livestock, Dairy, and Poultry Outlook, LDP-M-304, October 17, 2019
USDA, Economic Research Service
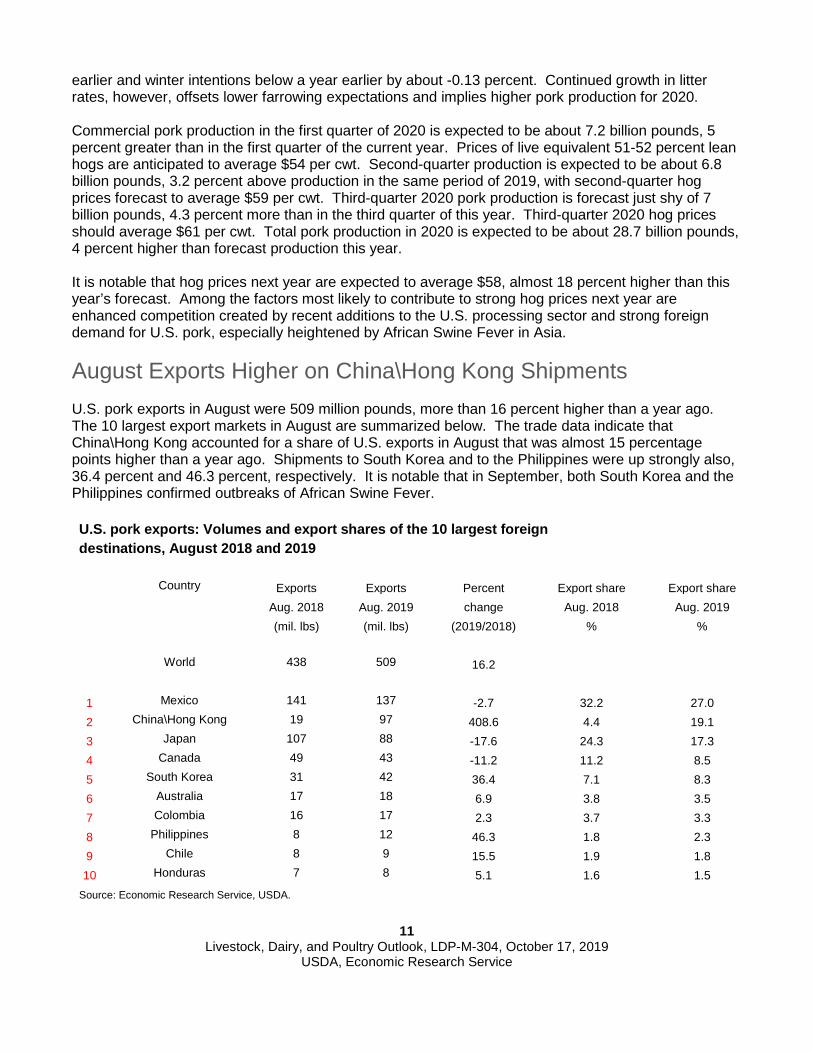
earlier and winter intentions below a year earlier by about -0.13 percent. Continued growth in litter rates, however, offsets lower farrowing expectations and implies higher pork production for 2020. Commercial pork production in the first quarter of 2020 is expected to be about 7.2 billion pounds, 5 percent greater than in the first quarter of the current year. Prices of live equivalent 51-52 percent lean hogs are anticipated to average $54 per cwt. Second-quarter production is expected to be about 6.8 billion pounds, 3.2 percent above production in the same period of 2019, with second-quarter hog prices forecast to average $59 per cwt. Third-quarter 2020 pork production is forecast just shy of 7 billion pounds, 4.3 percent more than in the third quarter of this year. Third-quarter 2020 hog prices should average $61 per cwt. Total pork production in 2020 is expected to be about 28.7 billion pounds, 4 percent higher than forecast production this year. It is notable that hog prices next year are expected to average $58, almost 18 percent higher than this year’s forecast. Among the factors most likely to contribute to strong hog prices next year are enhanced competition created by recent additions to the U.S. processing sector and strong foreign demand for U.S. pork, especially heightened by African Swine Fever in Asia. August Exports Higher on China\Hong Kong Shipments U.S. pork exports in August were 509 million pounds, more than 16 percent higher than a year ago. The 10 largest export markets in August are summarized below. The trade data indicate that China\Hong Kong accounted for a share of U.S. exports in August that was almost 15 percentage points higher than a year ago. Shipments to South Korea and to the Philippines were up strongly also, 36.4 percent and 46.3 percent, respectively. It is notable that in September, both South Korea and the Philippines confirmed outbreaks of African Swine Fever. U.S. pork exports: Volumes and export shares of the 10 largest foreign destinations, August 2018 and 2019 Country Exports Exports Percent Export share Export share
Aug. 2018 Aug. 2019 change Aug. 2018 Aug. 2019
(mil. lbs) (mil. lbs) (2019/2018) % %
World 438 509 16.2
1 Mexico 141 137 -2.7 32.2 27.0 2 China\Hong Kong 19 97 408.6 4.4 19.1 3 Japan 107 88 -17.6 24.3 17.3 4 Canada 49 43 -11.2 11.2 8.5 5 South Korea 31 42 36.4 7.1 8.3 6 Australia 17 18 6.9 3.8 3.5 7 Colombia 16 17 2.3 3.7 3.3 8 Philippines 8 12 46.3 1.8 2.3 9 Chile 8 9 15.5 1.9 1.8 10 Honduras 7 8 5.1 1.6 1.5
Source: Economic Research Service, USDA.
12 Livestock, Dairy, and Poultry Outlook, LDP-M-304, October 17, 2019
USDA, Economic Research Service
The fourth-quarter U.S. export forecast was raised to 2 billion pounds, almost 30 percent above a year ago, in anticipation of a surge in disease-related Asian demand. Total U.S. pork exports in 2019 are expected to be 6.6 billion pounds, 12 percent higher than in 2018. The impact of African Swine Fever in China and neighboring countries on domestic production, and the likely resulting needs for increased imports, prompted further increases in 2020 quarterly exports forecasts. Total exports in 2020 are expected to be 7.3 billion pounds, 11 percent greater than exports forecast for 2019.
13 Livestock, Dairy, and Poultry Outlook, LDP-M-304, October 17, 2019
USDA, Economic Research Service
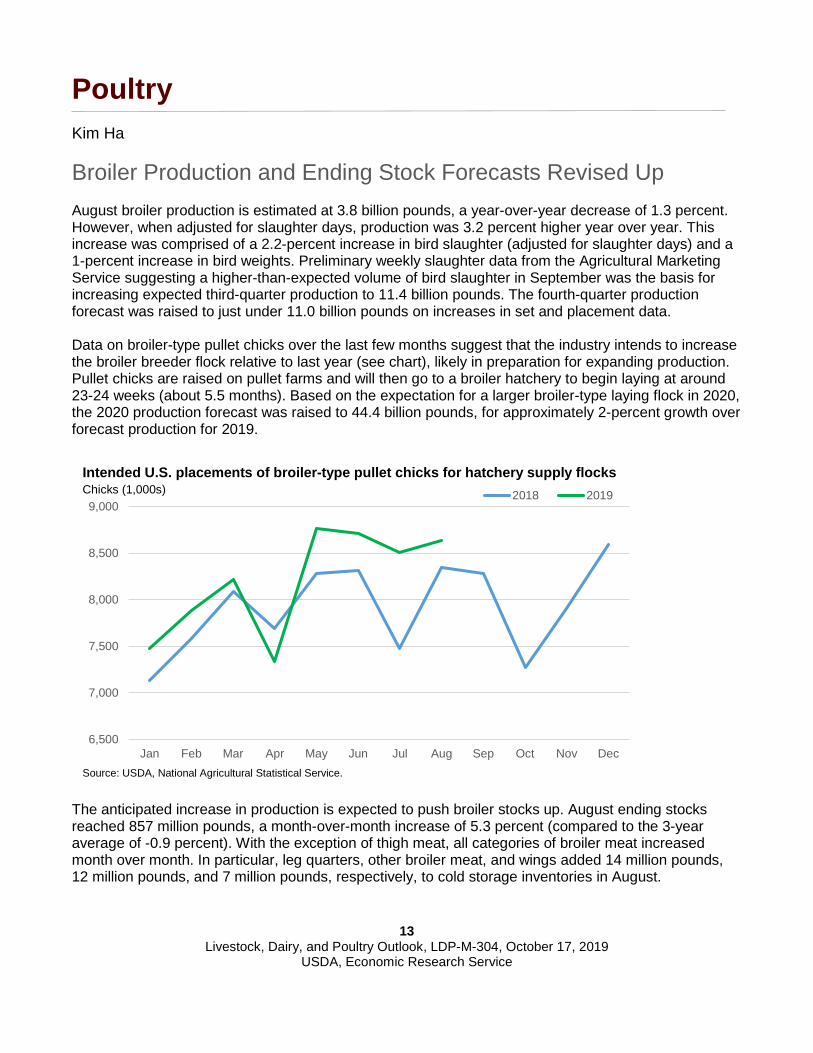
Poultry Kim Ha Broiler Production and Ending Stock Forecasts Revised Up August broiler production is estimated at 3.8 billion pounds, a year-over-year decrease of 1.3 percent. However, when adjusted for slaughter days, production was 3.2 percent higher year over year. This increase was comprised of a 2.2-percent increase in bird slaughter (adjusted for slaughter days) and a 1-percent increase in bird weights. Preliminary weekly slaughter data from the Agricultural Marketing Service suggesting a higher-than-expected volume of bird slaughter in September was the basis for increasing expected third-quarter production to 11.4 billion pounds. The fourth-quarter production forecast was raised to just under 11.0 billion pounds on increases in set and placement data. Data on broiler-type pullet chicks over the last few months suggest that the industry intends to increase the broiler breeder flock relative to last year (see chart), likely in preparation for expanding production. Pullet chicks are raised on pullet farms and will then go to a broiler hatchery to begin laying at around 23-24 weeks (about 5.5 months). Based on the expectation for a larger broiler-type laying flock in 2020, the 2020 production forecast was raised to 44.4 billion pounds, for approximately 2-percent growth over forecast production for 2019.
The anticipated increase in production is expected to push broiler stocks up. August ending stocks reached 857 million pounds, a month-over-month increase of 5.3 percent (compared to the 3-year average of -0.9 percent). With the exception of thigh meat, all categories of broiler meat increased month over month. In particular, leg quarters, other broiler meat, and wings added 14 million pounds, 12 million pounds, and 7 million pounds, respectively, to cold storage inventories in August.
6,500
7,000
7,500
8,000
8,500
9,000
Jan Feb Mar Apr May Jun Jul Aug Sep Oct Nov Dec
2018 2019
Source: USDA, National Agricultural Statistical Service.
Intended U.S. placements of broiler-type pullet chicks for hatchery supply flocks Chicks (1,000s)
14 Livestock, Dairy, and Poultry Outlook, LDP-M-304, October 17, 2019
USDA, Economic Research Service
Ending stocks reached 924 million pounds at the end of September 2018 but decreased to 845 million pounds by year end. This decrease was a result of low wholesale prices, which caused the industry to scale back production but also made U.S. broiler meat very competitive and encouraged higher export volumes. In 2019, despite low wholesale prices, there are no signs that the industry intends to scale back production during the last few months of the year. Furthermore, while 2019 exports are forecast to be slightly higher year over year, it is unlikely that there will be the same surge in fourth-quarter exports as last year (see discussion below). As a result, it is expected that stocks will accumulate in line with increased production, which was the basis for increasing the 2019 ending stocks forecast to 895 million pounds. Similarly, with production forecast to continue expanding in 2020, the 2020 ending stocks forecast was increased to 870 million pounds.
2019 Broiler Price Forecast Increased; 2020 Price Forecast Decreased The whole bird (National Composite) wholesale price averaged 76.92 cents per pound in September. Despite the average price for the month being 7.5 percent lower year over year, prices trended up in September, starting the month at 76.08 cents per pound and ending at 78.48 cents (a 3-percent increase). This increase suggests that fourth-quarter prices will likely be better than previously expected, which was the basis for increasing the fourth-quarter price forecast to 77 cents per pound. Conversely, in 2020, it is anticipated that the expected increase in production will put downward pressure on prices; thus, the 2020 price forecast was lowered to 91 cents per pound.
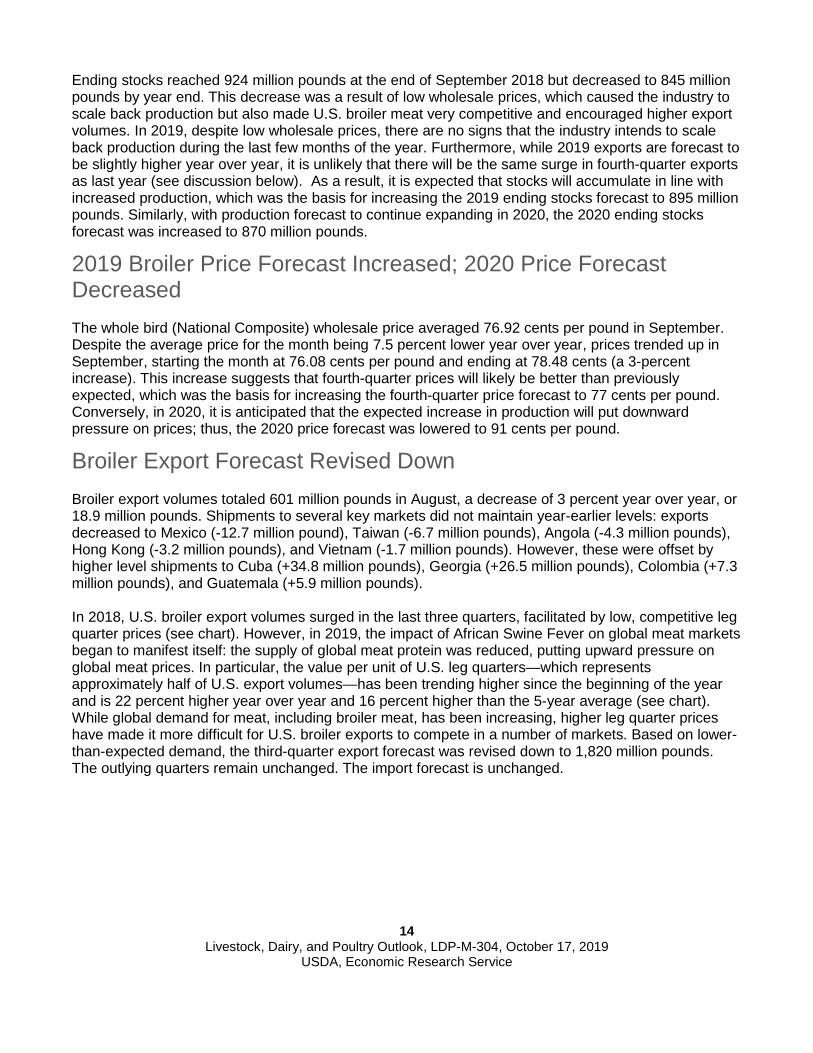
Broiler Export Forecast Revised Down Broiler export volumes totaled 601 million pounds in August, a decrease of 3 percent year over year, or 18.9 million pounds. Shipments to several key markets did not maintain year-earlier levels: exports decreased to Mexico (-12.7 million pound), Taiwan (-6.7 million pounds), Angola (-4.3 million pounds), Hong Kong (-3.2 million pounds), and Vietnam (-1.7 million pounds). However, these were offset by higher level shipments to Cuba (+34.8 million pounds), Georgia (+26.5 million pounds), Colombia (+7.3 million pounds), and Guatemala (+5.9 million pounds). In 2018, U.S. broiler export volumes surged in the last three quarters, facilitated by low, competitive leg quarter prices (see chart). However, in 2019, the impact of African Swine Fever on global meat markets began to manifest itself: the supply of global meat protein was reduced, putting upward pressure on global meat prices. In particular, the value per unit of U.S. leg quarters—which represents approximately half of U.S. export volumes—has been trending higher since the beginning of the year and is 22 percent higher year over year and 16 percent higher than the 5-year average (see chart). While global demand for meat, including broiler meat, has been increasing, higher leg quarter prices have made it more difficult for U.S. broiler exports to compete in a number of markets. Based on lower- than-expected demand, the third-quarter export forecast was revised down to 1,820 million pounds. The outlying quarters remain unchanged. The import forecast is unchanged.
15 Livestock, Dairy, and Poultry Outlook, LDP-M-304, October 17, 2019
USDA, Economic Research Service
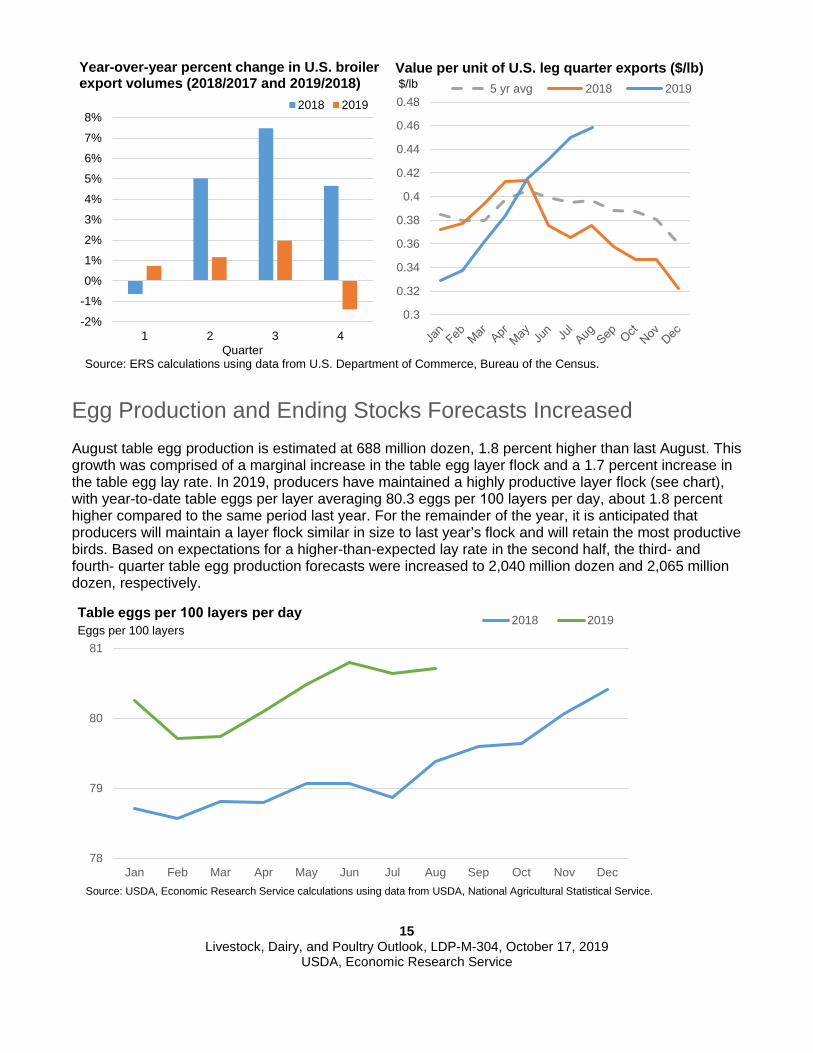
Egg Production and Ending Stocks Forecasts Increased August table egg production is estimated at 688 million dozen, 1.8 percent higher than last August. This growth was comprised of a marginal increase in the table egg layer flock and a 1.7 percent increase in the table egg lay rate. In 2019, producers have maintained a highly productive layer flock (see chart), with year-to-date table eggs per layer averaging 80.3 eggs per 100 layers per day, about 1.8 percent higher compared to the same period last year. For the remainder of the year, it is anticipated that producers will maintain a layer flock similar in size to last year’s flock and will retain the most productive birds. Based on expectations for a higher-than-expected lay rate in the second half, the third- and fourth- quarter table egg production forecasts were increased to 2,040 million dozen and 2,065 million dozen, respectively.
-2%-1%0%1%2%3%4%5%6%7%8%
1 2 3 4Quarter
2018 2019
0.3
0.32
0.34
0.36
0.38
0.4
0.42
0.44
0.46
0.485 yr avg 2018 2019
78
79
80
81
Jan Feb Mar Apr May Jun Jul Aug Sep Oct Nov Dec
2018 2019Table eggs per 100 layers per day Eggs per 100 layers
Year-over-year percent change in U.S. broiler export volumes (2018/2017 and 2019/2018)
Value per unit of U.S. leg quarter exports ($/lb) $/lb
Source: ERS calculations using data from U.S. Department of Commerce, Bureau of the Census.
Source: USDA, Economic Research Service calculations using data from USDA, National Agricultural Statistical Service.
16 Livestock, Dairy, and Poultry Outlook, LDP-M-304, October 17, 2019
USDA, Economic Research Service
The 2020 table egg production forecast is increased to 8,225 million dozen, less than 1 percent higher than the 2019 forecast. Based on expectations for increased broiler-type layers to support increased broiler production, the 2020 hatching egg forecast was revised up to 1,195 million dozen, more than 1 percent higher than the 2019 forecast. Similar to broilers, the anticipated increase in production is expected to increase ending stocks. August-ending egg stocks (cold and dried) reached 101.6 million dozen (shell egg equivalent), nearly 38 percent higher year over year. This increase in stocks is being driven by accumulating dried stock inventories, which added 24.1 million dozen (shell egg equivalent) to egg stocks compared to August 2018 (versus frozen eggs, which added 3.8 million dozen). The expected increase in production and accumulating dried egg inventories are the basis for increasing the 2019 ending stocks forecast to 104 million dozen, and the 2020 ending stocks forecast is raised to 108 million dozen. After climbing 61 cents in August, the wholesale egg price (New York, Grade A Large) decreased by 44 cents from 118 cents per dozen to 74 cents per dozen, where it remained for the end of September and into October. September egg prices averaged 90.35 cents per dozen, 17 percent lower than last September. During the last quarter, egg prices are expected to increase in line with higher demand stemming from the holiday baking season. The egg price forecast remains unchanged.
Egg Import Forecast Revised Down on Lower Volumes August import volumes of egg and egg products were 1.4 million dozen (shell egg equivalent), nearly 16 percent lower year over year. Year to date, Canada, which supplies about half of U.S. egg imports, has sent 27 percent fewer eggs to the U.S. relative to the same period last year. Based on expectations for low import volumes for the remainder of the year, the third- and fourth-quarter import forecasts were revised down to 4 million dozen each. Egg export volumes totaled 29.3 million dozen (shell egg equivalent) in August, nearly 4 percent higher than a year earlier. The increase was supported by strong shell egg exports (7 percent increase year over year), while egg product export volumes were down slightly (1 percent year over year). The export forecast remains unchanged.
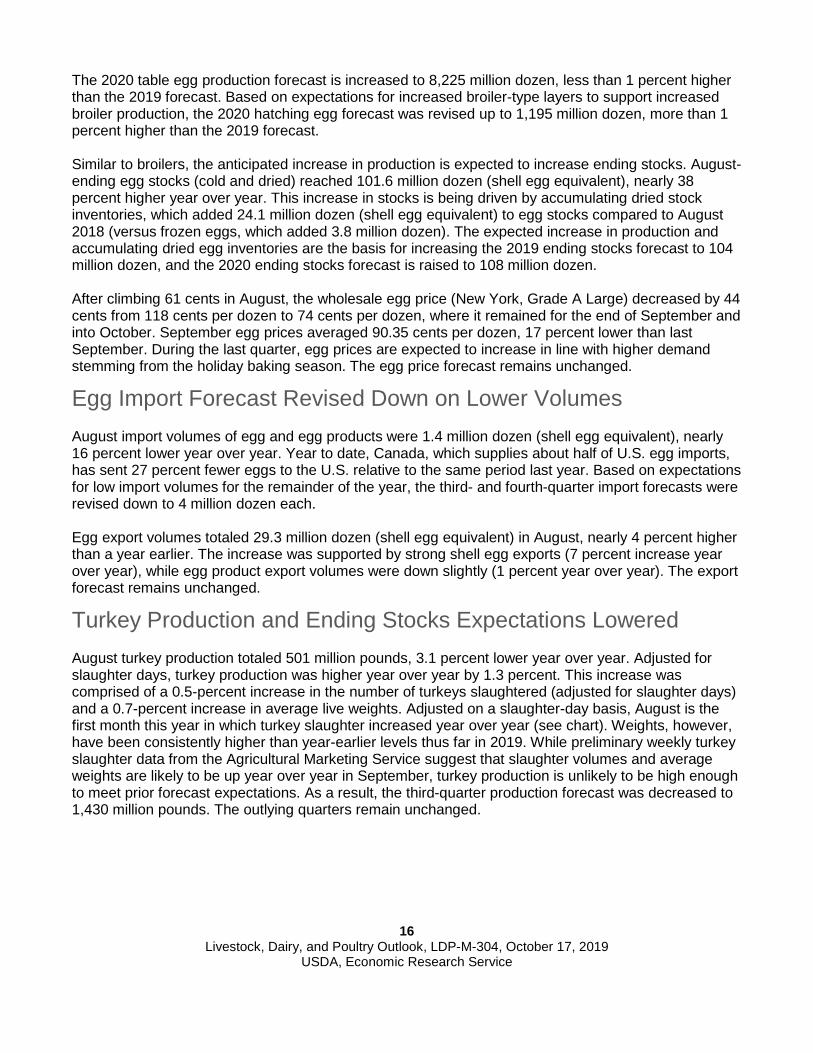
Turkey Production and Ending Stocks Expectations Lowered August turkey production totaled 501 million pounds, 3.1 percent lower year over year. Adjusted for slaughter days, turkey production was higher year over year by 1.3 percent. This increase was comprised of a 0.5-percent increase in the number of turkeys slaughtered (adjusted for slaughter days) and a 0.7-percent increase in average live weights. Adjusted on a slaughter-day basis, August is the first month this year in which turkey slaughter increased year over year (see chart). Weights, however, have been consistently higher than year-earlier levels thus far in 2019. While preliminary weekly turkey slaughter data from the Agricultural Marketing Service suggest that slaughter volumes and average weights are likely to be up year over year in September, turkey production is unlikely to be high enough to meet prior forecast expectations. As a result, the third-quarter production forecast was decreased to 1,430 million pounds. The outlying quarters remain unchanged.
17 Livestock, Dairy, and Poultry Outlook, LDP-M-304, October 17, 2019
USDA, Economic Research Service
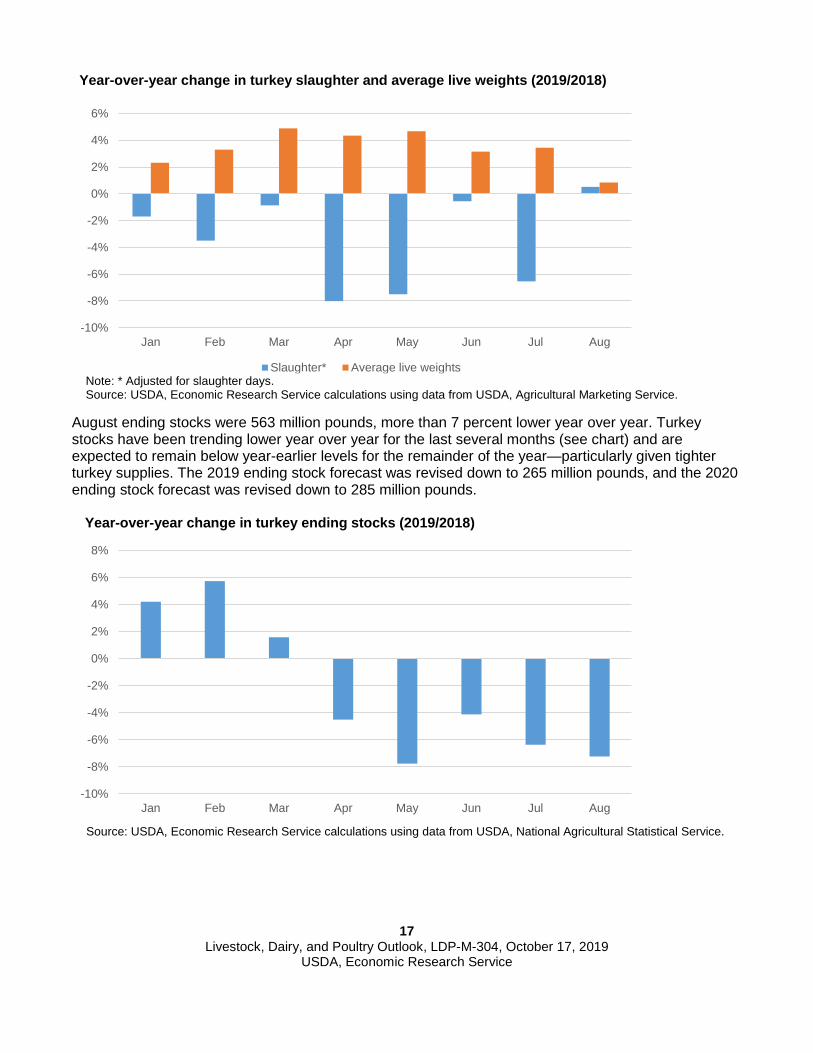
August ending stocks were 563 million pounds, more than 7 percent lower year over year. Turkey stocks have been trending lower year over year for the last several months (see chart) and are expected to remain below year-earlier levels for the remainder of the year—particularly given tighter turkey supplies. The 2019 ending stock forecast was revised down to 265 million pounds, and the 2020 ending stock forecast was revised down to 285 million pounds.
-10%
-8%
-6%
-4%
-2%
0%
2%
4%
6%
Jan Feb Mar Apr May Jun Jul Aug
Slaughter* Average live weights
-10%
-8%
-6%
-4%
-2%
0%
2%
4%
6%
8%
Jan Feb Mar Apr May Jun Jul Aug
Year-over-year change in turkey slaughter and average live weights (2019/2018)
Note: * Adjusted for slaughter days. Source: USDA, Economic Research Service calculations using data from USDA, Agricultural Marketing Service.
Year-over-year change in turkey ending stocks (2019/2018)
Source: USDA, Economic Research Service calculations using data from USDA, National Agricultural Statistical Service.
18 Livestock, Dairy, and Poultry Outlook, LDP-M-304, October 17, 2019
USDA, Economic Research Service
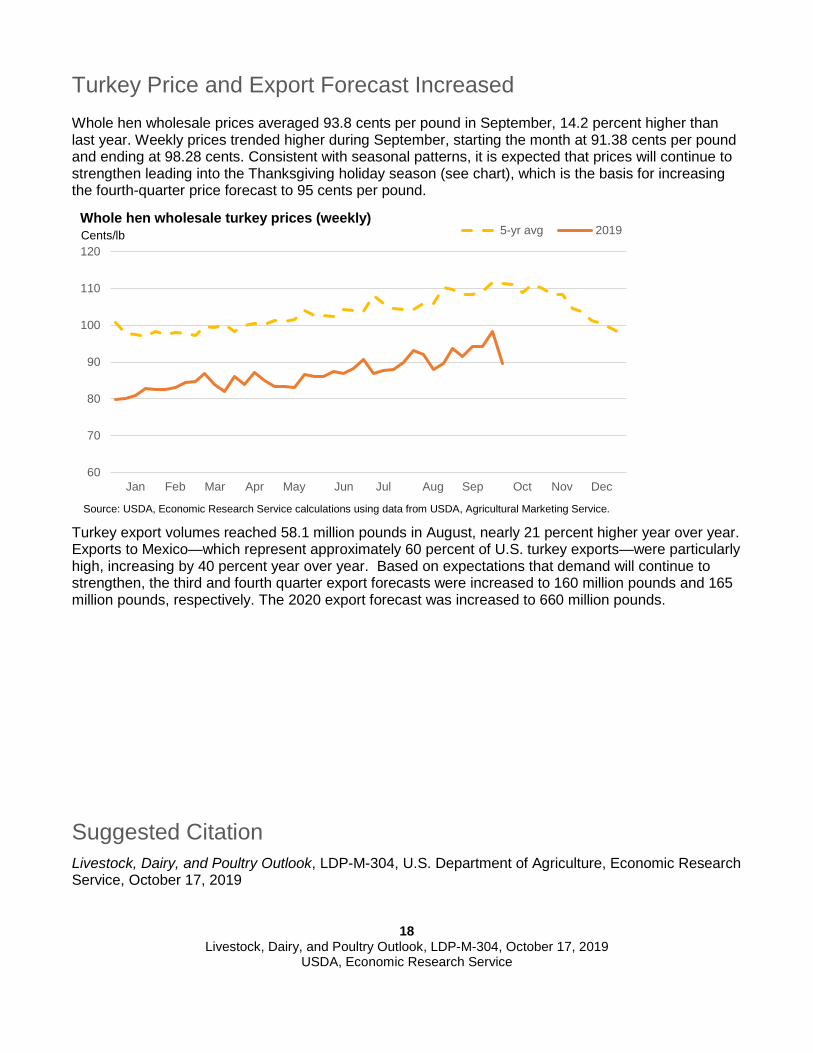
Turkey Price and Export Forecast Increased Whole hen wholesale prices averaged 93.8 cents per pound in September, 14.2 percent higher than last year. Weekly prices trended higher during September, starting the month at 91.38 cents per pound and ending at 98.28 cents. Consistent with seasonal patterns, it is expected that prices will continue to strengthen leading into the Thanksgiving holiday season (see chart), which is the basis for increasing the fourth-quarter price forecast to 95 cents per pound.
Turkey export volumes reached 58.1 million pounds in August, nearly 21 percent higher year over year. Exports to Mexico—which represent approximately 60 percent of U.S. turkey exports—were particularly high, increasing by 40 percent year over year. Based on expectations that demand will continue to strengthen, the third and fourth quarter export forecasts were increased to 160 million pounds and 165 million pounds, respectively. The 2020 export forecast was increased to 660 million pounds.
Suggested Citation Livestock, Dairy, and Poultry Outlook, LDP-M-304, U.S. Department of Agriculture, Economic Research Service, October 17, 2019
60
70
80
90
100
110
120
Jan Feb Mar Apr May Jun Jul Aug Sep Oct Nov Dec
5-yr avg 2019Whole hen wholesale turkey prices (weekly) Cents/lb
Source: USDA, Economic Research Service calculations using data from USDA, Agricultural Marketing Service.
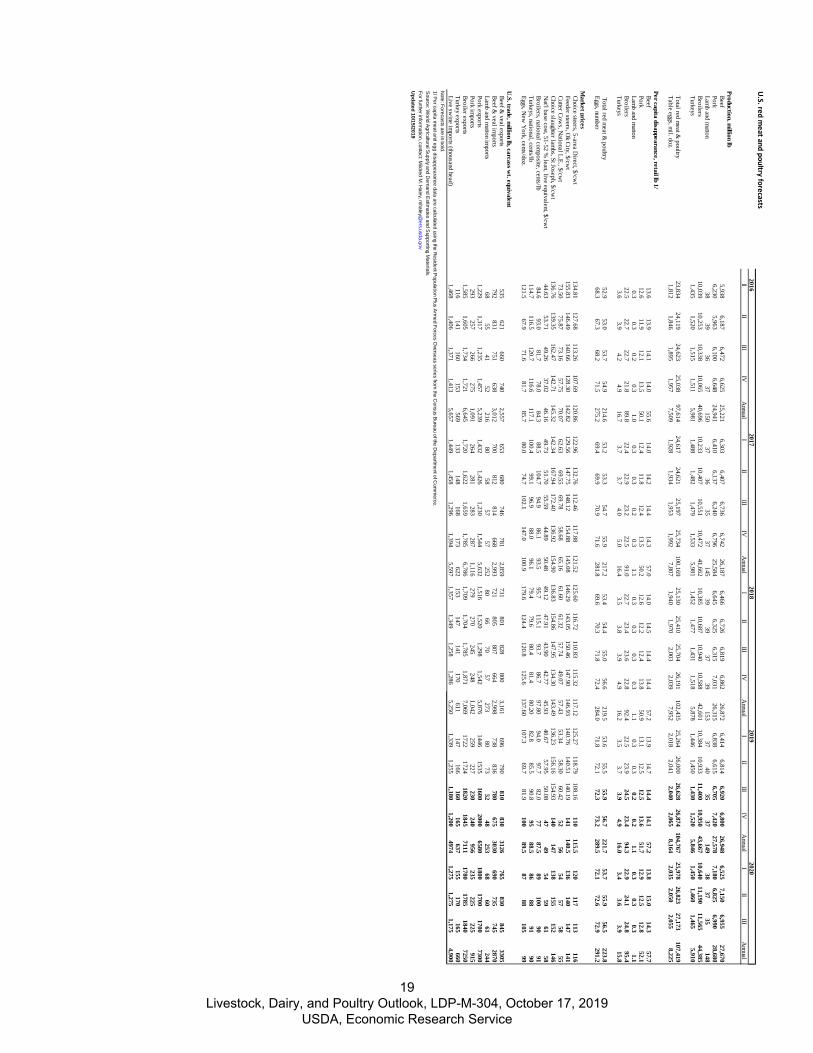
U.S. red m
eat and poultry forecasts2016
20172018
20192020
III
IIIIV
Annual
III
IIIIV
Annual
III
IIIIV
Annual
III
IIIIV
Annual
III
III A
nnual
Production, million lb
Beef5,938
6,1876,472
6,62525,221
6,3036,407
6,7366,742
26,1876,466
6,7266,819
6,86226,872
6,4146,814
6,9206,800
26,9486,525
7,1506,955
27,670 Pork
6,2305,963
6,1006,648
24,9416,410
6,1376,240
6,79625,584
6,6456,325
6,3157,031
26,3156,838
6,6156,705
7,42027,578
7,1806,825
6,99028,680
Lamb and m
utton38
3936
37150
3736
3537
14539
3937
39153
3740
3537
14938
3735
148 Broilers
10,03910,253
10,33810,065
40,69610,233
10,40710,551
10,47241,662
10,38510,687
10,94010,588
42,60110,384
10,93311,400
10,95043,667
10,64011,190
11,56544,385
Turkeys1,435
1,5201,515
1,5115,981
1,4881,482
1,4791,533
5,9811,452
1,4771,431
1,5185,878
1,4461,450
1,4301,520
5,8461,450
1,4601,465
5,910
Total red meat &
poultry23,834
24,11924,623
25,03897,614
24,61724,621
25,19725,734
100,16925,130
25,41025,704
26,191102,435
25,26426,000
26,62826,874
104,76725,978
26,82327,173
107,419 Table eggs, m
il. doz.1,812
1,8461,895
1,9577,509
1,9281,934
1,9531,992
7,8071,940
1,9702,003
2,0397,952
2,0182,041
2,0402,065
8,1642,035
2,0502,055
8,225
Per capita disappearance, retail lb 1/ Beef
13.613.9
14.114.0
55.614.0
14.214.4
14.357.0
14.014.5
14.414.4
57.213.9
14.714.4
14.157.2
13.815.0
14.357.7
Pork12.6
11.912.1
13.550.1
12.411.8
12.413.5
50.212.6
12.212.4
13.850.9
13.112.5
12.513.6
51.712.9
12.512.8
52.1 Lam
b and mutton
0.30.3
0.20.3
1.00.3
0.30.2
0.31.1
0.30.3
0.30.3
1.10.3
0.30.2
0.21.1
0.30.3
0.31.1
Broilers22.5
22.722.7
21.889.8
22.422.9
23.222.5
91.022.7
23.423.6
22.892.4
22.523.9
24.523.4
94.322.9
24.124.8
95.4 Turkeys
3.63.9
4.24.9
16.73.7
3.74.0
5.016.4
3.53.8
3.94.9
16.23.5
3.73.9
4.916.0
3.43.6
3.915.8
Total red meat &
poultry52.9
53.053.7
54.9214.6
53.253.3
54.755.9
217.253.4
54.455.0
56.6219.5
53.655.5
55.956.7
221.753.7
55.956.5
223.8 Eggs, num
ber68.3
67.368.2
71.5275.2
69.469.9
70.971.6
281.869.6
70.371.8
72.4284.0
71.872.1
72.373.2
289.572.1
72.672.9
291.2
Market prices
Choice steers, 5-area D
irect, $/cwt
134.81127.68
113.26107.69
120.86122.96
132.76112.46
117.88121.52
125.60116.72
110.83115.32
117.12125.27
118.79108.16
110115.5
120117
113116
Feeder steers, Ok City, $/cw
t155.83
146.49140.66
128.30142.82
129.56147.75
148.12154.88
145.08146.29
143.05150.46
147.90146.93
140.76140.51
140.19141
140.5136
140147
141 Cutter Cow
s, National L.E., $/cw
t73.50
75.8773.16
57.7570.07
62.6369.55
69.7858.68
65.1661.60
61.3257.74
49.0757.43
53.3458.30
60.4252
5654
5758
55 Choice slaughter lam
bs, St Joseph, $/cwt
136.76139.35
162.47142.71
145.32142.34
167.94172.40
136.92154.90
136.83154.86
147.95134.30
143.49136.23
156.16154.93
140147
138155
152146
Nat'l base cost, 51-52 %
lean, live equivalent, $/cwt
44.6353.71
49.2637.02
46.1649.73
51.7055.59
44.8950.48
49.1247.91
43.9042.77
45.9340.67
57.9550.08
4749
5459
6158
Broilers, national composite, cents/lb
84.693.0
81.778.0
84.388.5
104.794.9
86.193.5
95.7115.1
93.786.7
97.8094.0
97.782.0
7787.5
89100
9091
Turkeys, national, cents/lb114.7
116.5120.7
116.6117.1
100.499.1
96.988.0
96.179.4
79.680.4
81.480.20
82.885.5
90.895
88.586
8891
90 Eggs, N
ew Y
ork, cents/doz.121.5
67.971.6
81.785.7
80.074.7
102.1147.0
100.9179.6
124.4120.8
125.6137.60
107.369.7
81.9100
89.587
88105
99
U.S. trade, m
illion lb, carcass wt. equivalent
Beef & veal exports
535621
660740
2,557653
680746
7812,859
731801
828800
3,161696
790810
8303126
765830
8453305
Beef & veal im
ports792
831751
6383,012
700812
814668
2,993721
805807
6642,998
738836
780675
3030690
735745
2870 Lam
b and mutton im
ports68
5541
52216
8058
5757
25280
6670
57273
8073
5248
25368
6061
244 Pork exports
1,2291,317
1,2351,457
5,2391,432
1,4261,230
1,5445,632
1,5161,520
1,2981,542
5,8761446
15351600
20006580
18001700
17007300
Pork imports
293257
266275
1,091264
281283
2871,116
279270
245248
1,042259
227230
240956
235225
225915
Broiler exports1,585
1,6051,734
1,7216,645
1,7201,622
1,6591,785
6,7861,709
1,7041,785
1,8717,069
17221724
18201845
71111780
17851840
7250 Turkey exports
116141
160153
569133
148168
173622
153147
141170
611147
166160
165637
155170
165660
Live swine im
ports (thousand head)1,468
1,4061,371
1,4135,657
1,4491,458
1,2961,394
5,5971,357
1,3491,258
1,2865,250
1,3391,255
1,1801,200
49741,275
1,2751,175
4,900N
ote: Forecasts are in bold.1/ P
er capita meat and egg disappearance data are calculated using the R
esident Population P
lus Arm
ed Forces Overseas series from
the Census B
ureau of the Departm
ent of Com
merce.
Source: W
orld Agricultural S
upply and Dem
and Estim
ates and Supporting M
aterials.For further inform
ation, contact: Mildred M
. Haley, m
Updated 10/15/2019
19 Livestock, Dairy, and Poultry Outlook, LDP-M-304, October 17, 2019
USDA, Economic Research Service
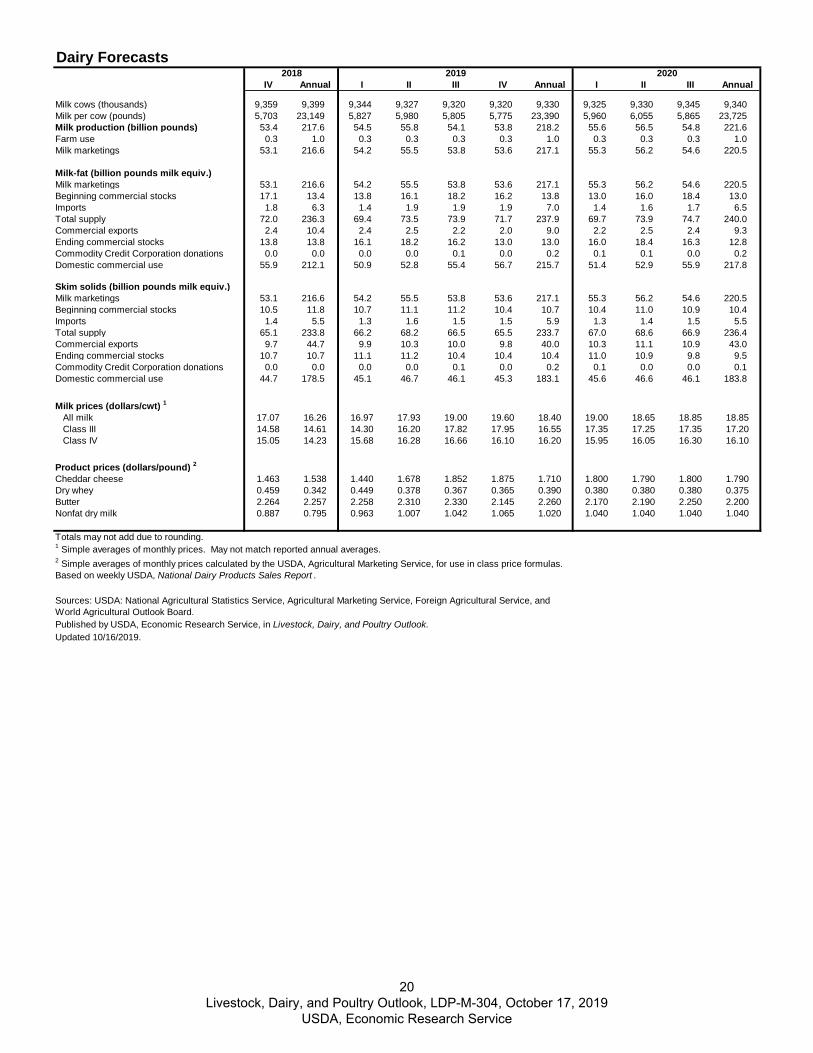
Dairy ForecastsIV Annual I II III IV Annual I II III Annual
Milk cows (thousands) 9,359 9,399 9,344 9,327 9,320 9,320 9,330 9,325 9,330 9,345 9,340Milk per cow (pounds) 5,703 23,149 5,827 5,980 5,805 5,775 23,390 5,960 6,055 5,865 23,725Milk production (billion pounds) 53.4 217.6 54.5 55.8 54.1 53.8 218.2 55.6 56.5 54.8 221.6Farm use 0.3 1.0 0.3 0.3 0.3 0.3 1.0 0.3 0.3 0.3 1.0Milk marketings 53.1 216.6 54.2 55.5 53.8 53.6 217.1 55.3 56.2 54.6 220.5
Milk-fat (billion pounds milk equiv.)Milk marketings 53.1 216.6 54.2 55.5 53.8 53.6 217.1 55.3 56.2 54.6 220.5Beginning commercial stocks 17.1 13.4 13.8 16.1 18.2 16.2 13.8 13.0 16.0 18.4 13.0Imports 1.8 6.3 1.4 1.9 1.9 1.9 7.0 1.4 1.6 1.7 6.5Total supply 72.0 236.3 69.4 73.5 73.9 71.7 237.9 69.7 73.9 74.7 240.0Commercial exports 2.4 10.4 2.4 2.5 2.2 2.0 9.0 2.2 2.5 2.4 9.3Ending commercial stocks 13.8 13.8 16.1 18.2 16.2 13.0 13.0 16.0 18.4 16.3 12.8Commodity Credit Corporation donations 0.0 0.0 0.0 0.0 0.1 0.0 0.2 0.1 0.1 0.0 0.2Domestic commercial use 55.9 212.1 50.9 52.8 55.4 56.7 215.7 51.4 52.9 55.9 217.8
Skim solids (billion pounds milk equiv.)Milk marketings 53.1 216.6 54.2 55.5 53.8 53.6 217.1 55.3 56.2 54.6 220.5Beginning commercial stocks 10.5 11.8 10.7 11.1 11.2 10.4 10.7 10.4 11.0 10.9 10.4Imports 1.4 5.5 1.3 1.6 1.5 1.5 5.9 1.3 1.4 1.5 5.5Total supply 65.1 233.8 66.2 68.2 66.5 65.5 233.7 67.0 68.6 66.9 236.4Commercial exports 9.7 44.7 9.9 10.3 10.0 9.8 40.0 10.3 11.1 10.9 43.0Ending commercial stocks 10.7 10.7 11.1 11.2 10.4 10.4 10.4 11.0 10.9 9.8 9.5Commodity Credit Corporation donations 0.0 0.0 0.0 0.0 0.1 0.0 0.2 0.1 0.0 0.0 0.1Domestic commercial use 44.7 178.5 45.1 46.7 46.1 45.3 183.1 45.6 46.6 46.1 183.8
Milk prices (dollars/cwt) 1 All milk 17.07 16.26 16.97 17.93 19.00 19.60 18.40 19.00 18.65 18.85 18.85 Class III 14.58 14.61 14.30 16.20 17.82 17.95 16.55 17.35 17.25 17.35 17.20 Class IV 15.05 14.23 15.68 16.28 16.66 16.10 16.20 15.95 16.05 16.30 16.10
Product prices (dollars/pound) 2Cheddar cheese 1.463 1.538 1.440 1.678 1.852 1.875 1.710 1.800 1.790 1.800 1.790Dry whey 0.459 0.342 0.449 0.378 0.367 0.365 0.390 0.380 0.380 0.380 0.375Butter 2.264 2.257 2.258 2.310 2.330 2.145 2.260 2.170 2.190 2.250 2.200Nonfat dry milk 0.887 0.795 0.963 1.007 1.042 1.065 1.020 1.040 1.040 1.040 1.040
Totals may not add due to rounding.1 Simple averages of monthly prices. May not match reported annual averages.
Published by USDA, Economic Research Service, in Livestock, Dairy, and Poultry Outlook.Updated 10/16/2019.
20192018
Sources: USDA: National Agricultural Statistics Service, Agricultural Marketing Service, Foreign Agricultural Service, and World Agricultural Outlook Board.
2 Simple averages of monthly prices calculated by the USDA, Agricultural Marketing Service, for use in class price formulas. Based on weekly USDA, National Dairy Products Sales Report .
2020
20 Livestock, Dairy, and Poultry Outlook, LDP-M-304, October 17, 2019
USDA, Economic Research Service
Contacts & Additional Information
Contact Information
Mildred M. Haley (coordinator)
(202) 694-5176
Kim A. Ha (poultry, sheep/lamb) (202) 694-5360 [email protected] Lekhnath Chalise (cattle/beef) (202) 694-5371 [email protected]
Russell Knight (cattle/beef) (202) 694-5566 [email protected] Mildred M. Haley (hogs/pork) (202) 694-5176 [email protected] Kim Ha (poultry, poultry trade, (202) 694-5360 [email protected] eggs) Alex Melton (turkey) (202) 694-5409 [email protected] Jerry Cessna (dairy) (202) 694-5171 [email protected] Jonathan Law (dairy) (202) 694-5544 [email protected]
Carolyn Liggon (web publishing) (202) 694-5056 [email protected]
Subscribe to ERS e-mail notification service at https://www.ers.usda.gov/subscribe-to-ers-e-newletters/ to receive timely notification of newsletter availability.
Data Products Meat Price Spreads, https://www.ers.usda.gov/data-products/meat-price-spreads/, provides monthly average values at the farm, wholesale, and retail stages of the marketing chain for selected animal products.
Livestock and Meat Trade Data, http://www.ers.usda.gov/data-products/livestock-and-meat- international-trade-data/, contains monthly and annual data for imports and exports of live cattle and hogs, beef and veal, lamb and mutton, pork, broilers, turkey, and shell eggs.
Livestock & Meat Domestic Data, http://www.ers.usda.gov/data-products/livestock-meat-domestic- data/, contains domestic supply, disappearance, and price data.
Dairy Data, https://www.ers.usda.gov/data-products/dairy-data/, includes data from multiple sources concerning supply, demand, and prices for the dairy industry.
Related Websites Livestock, Dairy, and Poultry Outlook, http://www.ers.usda.gov/publications/?page=1&topicId=0&authorId=0&seriesCode=LDPM&sort=Copyri ghtDate&sortDir=desc Animal Production and Marketing Issues, https://www.ers.usda.gov/topics/animal-products/animal-production-marketing-issues/ Cattle, https://www.ers.usda.gov/topics/animal-products/cattle-beef/ Dairy, https://www.ers.usda.gov/topics/animal-products/dairy/ Hogs, https://www.ers.usda.gov/topics/animal-products/hogs-pork/ Poultry and Eggs, https://www.ers.usda.gov/topics/animal-products/poultry-eggs/ WASDE, http://usda.mannlib.cornell.edu/MannUsda/viewDocumentInfo.do?documentID=1194
E-mail Notification Readers of ERS outlook reports have two ways they can receive an e-mail notice about release of reports and associated data.
Receive timely notification (soon after the report is posted on the web) via USDA’s Economics,
Statistics and Market Information System (which is housed at Cornell University’s Mann Library). Go to http://usda.mannlib.cornell.edu/MannUsda/aboutEmailService.do and follow the instructions to receive e-mail notices about ERS, Agricultural Marketing Service, National Agricultural Statistics Service, and World Agricultural Outlook Board products.
Receive weekly notification (on Friday afternoon) via the ERS website. Go to
https://www.ers.usda.gov/topics/farm-economy/commodity-outlook/email-notification/ and follow the instructions to receive notices about ERS outlook reports, Amber Waves magazine, and other reports and data products on specific topics. ERS also offers RSS (really simple syndication) feeds for all ERS products.
The U.S. Department of Agriculture (USDA) prohibits discrimination in all its programs and activities on the basis of race, color, national origin, age, disability, and, where applicable, sex, marital status, familial status, parental status, religion, sexual orientation, genetic information, political beliefs, reprisal, or because all or a part of an individual’s income is derived from any public assistance program. (Not all prohibited bases apply to all programs.) Persons with disabilities who require alternative means for communication of program information (Braille, large print, audiotape, etc.) should contact USDA’s TARGET Center at (202) 720-2600 (voice and TDD). To file a complaint of discrimination write to USDA, Director, Office of Civil Rights, 1400 Independence Avenue, S.W., Washington, D.C. 20250-9410 or call (800) 795-3272 (voice) or (202) 720-6382 (TDD). USDA is an equal opportunity provider and employer.