Embed Size (px)
Citation preview

ASIA AND PACIFIC COMMISSION ON AGRICULTURAL STATISTICS
TWENTY-SIXTH SESSIONThimphu, Bhutan, 15-19 February 2016
Agenda Item 6.3Livestock Statistics in Mongolia
Contributed by: Erdenesan Eldevochir, Director of Macroeconomic StatisticsNational Registration and Statistics [email protected]
APCAS/16/6.3.5
LIVESTOCK STATISTICS IN
MONGOLIA
E.Erdenesan
2February 2016
Asia and Pacific Commission on Agricultural Statistics
Twenty-Sixth Session
Thimphu, Bhutan, 15 - 19 February 2016

I. AGRICULTURAL STATISTICAL SYSTEM
II. LIVESTOCK SECTOR IN ECONOMY OF MONGOLIA
III. WAY TO FORWARD AND CHALLENGES
3
CONTENTS
4
Methodology
ü Compiled in accordance with a concept, definition and
recommendations UNFAO
Classification:
ü ISIC 4.0
ü CPC 2.0
Data producers:
ü NSOM – 3 persons
ü Provinces (Aimags and the Capital city)– 22 persons
ü Sub-provinces (Soum and Districts) – 330 persons
ü Bag and Khoroos – 1855 persons
ü In total - 2210
I. AGRICULTURAL STATISTICAL SYSTEM

5
AGRICULTURAL STATISTICS
Official Statistics
Censuses Surveys and Reports Others
Administrative Statistics
Ministry of Food and
Agriculture
Others (Ministry of Green
Development,Environment and
Tourism, Administration of
Land affairs, Geodesy & Cartography)
Livestock
Agricultural
Fence and Wells
Livestock
Crop
Other
Socio-Economic
Survey-HIES
I. AGRICULTURAL STATISTICAL SYSTEM
6
Agricultural census, every 10 years(Combined method
Coverage – HH, entities, First census in 2012)
Livestock
Price Survey on Agricultural
Products
Cost and Expenditure Survey of
Agriculture
Yield Survey for Livestock
Crop Forestry, Fishery, Hunting
Administrative unit
I.1.1 Agricultural Census
I. AGRICULTURAL STATISTICAL SYSTEM

7
By census of Agriculture(sample method)
Price Survey of Agricultural
Products
Cost and Expenditure
Survey of Agriculture
Yield Survey for Livestock
Annual Livestock
Census
I.1.1 By census of Agriculture (2015-2016)
I. AGRICULTURAL STATISTICAL SYSTEM
8
I.1.2 Livestock census, survey
1918-19231
1924-1970 2
1971-20113
FROM 20054
2008-20125
I. AGRICULTURAL STATISTICAL SYSTEM
2
1
34
5
Livestock census, survey
6
FROM 20126

1918-1924
• By provinces• Number of livestock by
type of animals (horse, cow, camel, sheep, goat)
• Data located in General Archival Authority
1
9
I. AGRICULTURAL STATISTICAL SYSTEM
I.1.2 Livestock census, survey
2
1
34
5
Livestock census, survey
6
1924-19702
10
I. AGRICULTURAL STATISTICAL SYSTEM
I.1.2 Livestock census, survey
• By provinces• Number of livestock by
type of animals (horse, cow, camel, sheep, goat)
2
1
34
5
Livestock census, survey
6

1971-20113
11
I. AGRICULTURAL STATISTICAL SYSTEM
I.1.2 Livestock census, survey
• By sub-provinces• Number of livestock by
type of animals (horse, cow, camel, sheep, goat)
• Total number of livestock husbandry, Breeding livestock, Social and cultural indicators of household, Fodder etc.
2
1
34
5
Livestock census, survey
6
FROM 2005
12
I. AGRICULTURAL STATISTICAL SYSTEM
I.1.2 Livestock census, survey
• Livestock sample survey (Index-based livestock insurance project)
• Semi-annual livestock census has been conducted”
4
2
1
34
5
Livestock census, survey
6

2008-2012
13
I. AGRICULTURAL STATISTICAL SYSTEM
I.1.2 Livestock census, survey
• By low admisnistrativeunits (Bag, Khoroos) and HHs, entities
• Number of livestock by type of animals (horse, cow, camel, sheep, goat)
• 31 indicators of 12 sets (Total number of livestock husbandry, Breeding livestock, Social and cultural indicators of household, Fodder etc.)
5
2
1
34
5
Livestock census, survey
6
FROM 2012
5
14
I. AGRICULTURAL STATISTICAL SYSTEM
I.1.2 Livestock census, survey
• On line database• By low admisnistrative
units (Bag, Khoroos) and HHs, entities
• Number of livestock by type of animals (horse, cow, camel, sheep, goat)
• 31 indicators of 12 sets (Total number of livestock husbandry, Breeding livestock, Social and cultural indicators of household, Fodder etc.)
6
2
1
34
5
Livestock census, survey
6

15
Data source: Households, Entities
Livestock Crops Others• Price on Agricultural
Products (monthly)• Rearing of young
animals (3-5, 9-12 months)
• Losses of adult animals(1-5, 9-12 months)
• Annual enterprise survey on– Fishery– Forestry– Hunting
• Veterinary reports(quarterly)
• Food security indicators– Socio-economic survey
(former HIES)– Administrative data from
related lime ministries
• Sown areas (5-7 months)• Crops (8-11 months)• Annual enterprise survey
I.2. Surveys, reports
I. AGRICULTURAL STATISTICAL SYSTEM
16
II.1 Reports from Ministry of Food and AgricultureLivestock Crop
1. Animal insemination 6. Fallow land
2. Number and utilization of wells 7. Techniques readiness for soil cultivation and sowing
3. Irrigation point 8. Techniques readiness for hay work
4. Hay making, pasture and grassland protection 9. Techniques readiness for crop
5. Intensified animal husbandry 10. Available seed
II. Administrative statistics
I. AGRICULTURAL STATISTICAL SYSTEM
II.2 OthersMinistry of Green Development,
Environment and TourismAdministration of Land affairs, Geodesy
& Cartography
1. Forest land, its usage 2. Unified land territory
17
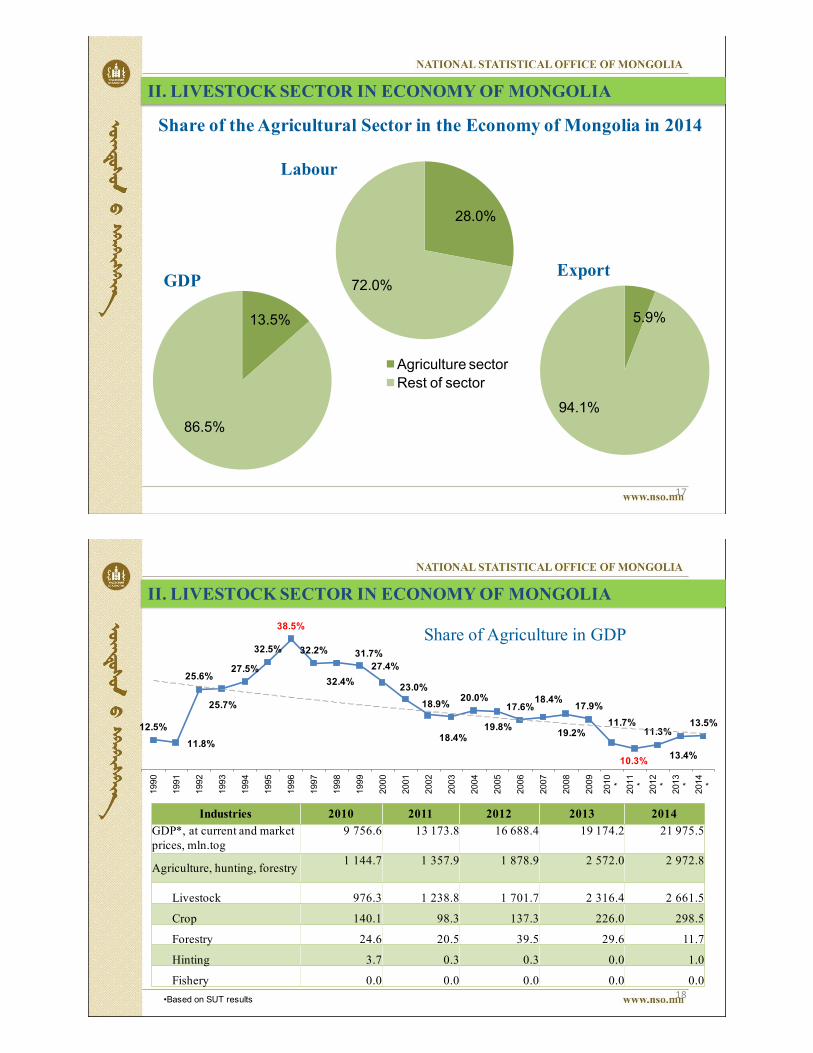
Share of the Agricultural Sector in the Economy of Mongolia in 2014
II. LIVESTOCK SECTOR IN ECONOMY OF MONGOLIA
13.5%
86.5%
28.0%
72.0%
Agriculture sectorRest of sector
5.9%
94.1%
GDP
Labour
Export
18
Share of Agriculture in GDP
II. LIVESTOCK SECTOR IN ECONOMY OF MONGOLIA
Industries 2010 2011 2012 2013 2014GDP*, at current and market prices, mln.tog
9 756.6 13 173.8 16 688.4 19 174.2 21 975.5
Agriculture, hunting, forestry 1 144.7 1 357.9 1 878.9 2 572.0 2 972.8
Livestock 976.3 1 238.8 1 701.7 2 316.4 2 661.5
Crop 140.1 98.3 137.3 226.0 298.5
Forestry 24.6 20.5 39.5 29.6 11.7
Hinting 3.7 0.3 0.3 0.0 1.0
Fishery 0.0 0.0 0.0 0.0 0.0
12.5%
11.8%
25.6%
25.7%
27.5%
32.5%
38.5%
32.2%
32.4%
31.7%
27.4%
23.0%
18.9%
18.4%
20.0%
19.8%
17.6%18.4%
19.2%
17.9%
11.7%
10.3%
11.3%
13.4%
13.5%
1990
1991
1992
1993
1994
1995
1996
1997
1998
1999
2000
2001
2002
2003
2004
2005
2006
2007
2008
2009
2010
*
2011
*
2012
*
2013
*
2014
*
•Based on SUT results

19
Number Households with Livestock in Total Households
II. LIVESTOCK SECTOR IN ECONOMY OF MONGOLIA
268.
7
256.
6
243.
2
236.
2
229.
4
225.
4
225.
4
226.
1
227.
5
226.
6
216.
6
211.
7
207.
8
209.
9
213.
4
285.
3
303.
1
325.
4
349.
4
367.
0
385.
6
407.
1
419.
5
450.
2
489.
9
525.
7
548.
2
560.
4
584.
2
610.
0
2000 2001 2002 2003 2004 2005 2006 2007 2008 2009 2010 2011 2012 2013 2014
Householdswithlivestock Otherhouseholds
Share of Agricultural Employed Persons in Total Employment
Total Employees, 2014 Agricultural Employees, 2014
53.346.7 55.644.4
II. LIVESTOCK SECTOR IN ECONOMY OF MONGOLIA
48.6% 48.3% 44.9%41.8% 40.2% 39.9% 38.8% 37.7% 36.2% 34.7% 33.5% 33.0% 35.0%
29.8%28.0%
2000 2001 2002 2003 2004 2005 2006 2007 2008 2009 2010 2011 2012 2013 2014

II. LIVESTOCK SECTOR IN ECONOMY OF MONGOLIA
Output of Main Agricultural Products
Commodities 2010 2011 2012 2013 2014*Meat, slaughter weight, thous.t 241.0 210.0 263.4 299.3 294.5
beef 45.1 54.8 59.7 57.7 54.7sheep & goat 126.9 123.1 123.5 155.0 153.2
Milk, thous.t 365.7 458.9 588.0 667.0 765.4Wool & cashmere, thous.t
wool 18.4 18.9 18.6 21.7 23.9cashmere 6.5 4.4 6.3 7.0 7.7
Hide and skin, mln.pcs** 8.1 8.7 7.8 9.9 9.3Potato 168.0 201.6 245.9 191.6 161.5Vegetables 82.3 99.1 99.0 101.9 104.9* preliminary results
**including lamb and kid skin
II. AGRICULTURE IN ECONOMY OF MONGOLIA
Main Agricultural Products Per Capita
Commodities 2010 2011 2012 2013 2014*Meat, slaughter weight, kg 73.5 90.2 92.8 103.2 99.4Milk, t 123.6 190.2 207.1 230.1 258.3Egg,pcs 20.0 25.0 20.0 22.0 24.0Cereals, kg 129.6 144.4 152.4 120.8 175.1Potato, kg 61.3 72.4 86.6 66.1 54.5Vegetables, kg 30.0 35.6 34.9 35.1 35.4* preliminary results

23
Number of Livestock, type, thous.heads
2012 2013 2014 2015
Total 40 920.9 45 144.3 51 982.6 55 957.6
Horse 2 330.4 2 619.4 2 995.8 3 294.6
Cattle 2 584.6 2 909.5 3 413.9 3 779.5
Camel 305.8 321.5 349.3 367.9
Sheep 18 141.4 20 066.4 23 214.8 24 933.4
Goat 17 558.7 19 227.6 22 008.9 23 582.2
1999 он (3824.7)
1954 он (895.3)
II. AGRICULTURE IN ECONOMY OF MONGOLIA
Number of livestock reached 56.0 mln.heads for the first time in history
Number of livestock was highest in the years, thous.heads
16.2
27.5
20.4
24.833.6
23.9
44.0
32.7
56.0
1918 1932 1941 1950 1961 1971 1981 1991 1999 2009 2015
2015 он (3294.6)
2015 он (24933.4)
2015 он (23582.2)
24
Number of Households Which Has Up To 200 Heads of Livestock, by provinces
II. AGRICULTURE IN ECONOMY OF MONGOLIA

25
II. AGRICULTURE IN ECONOMY OF MONGOLIA
Number of Households Which Has More Than 1000 Heads of Livestock, by provinces
Average daily yield of cow milk, by regions, 2011
II. AGRICULTURE IN ECONOMY OF MONGOLIA
Breed typeNational
average
Regions
KhangaiHigh
mountSteppe Gobi
Indigenous Mongol cow
Average daily output, liters 2.6 2.6 2.3 2.8 2.3
Milking times a year, mounts 6.7 6.8 7.2 6.5 5.7
Yak cow
Average daily output, liters 1.8 1.9 1.7 1.7 2.0
Milking times a year, mounts 6.7 6.0 7.2 5.1 6.3
Pure breed cow
Average daily output, liters 4.4 4.5 - 4.4 3.4
Milking times a year, mounts 8.2 8.4 - 8.1 10.0
Crossbreed cow
Average daily output, liters 3.7 3.7 3.9 4.4 -
Milking times a year, mounts 8.7 8.5 9.3 8.0 -

Average Daily Yield of Cow Milk, by type of breed and regions, liters, 2011
II. AGRICULTURE IN ECONOMY OF MONGOLIA
5.9
4.3
3.8
3.0
4.7
3.5
3.4
2.8
3.1
2.5
2.5
1.9
2.2
1.9
1.5
1.5
Summer
Fall
Spring
Winter
Crossbreed cow Pure breed cow Yak cow Indigenous Mongol cow
Average Yearly Milk Output of Female Animals, Except Cows,by type of breed and seasons, 2011
II. AGRICULTURE IN ECONOMY OF MONGOLIA
Breed typeNational
average
Regions
Khangai High mount Steppe Gobi
Mare
Average daily output, liters 2.4 2.3 2.5 2.2 2.9
Milking times a year, mounts 2.9 3.1 2.9 2.3 3.0
She-camel
Average daily output, liters 1.0 0.9 1.0 0.7 1.0
Milking times a year, mounts 5.2 5.8 3.9 3.6 7.4
Ewe
Average daily output, liters 0.3 0.3 0.3 0.4 0.2
Milking times a year, mounts 2.1 1.8 2.3 2.3 2.1
Nanny-goat
Average daily output, liters 0.3 0.3 0.3 0.4 0.3
Milking times a year, mounts 3.1 2.4 3.7 2.2 3.8
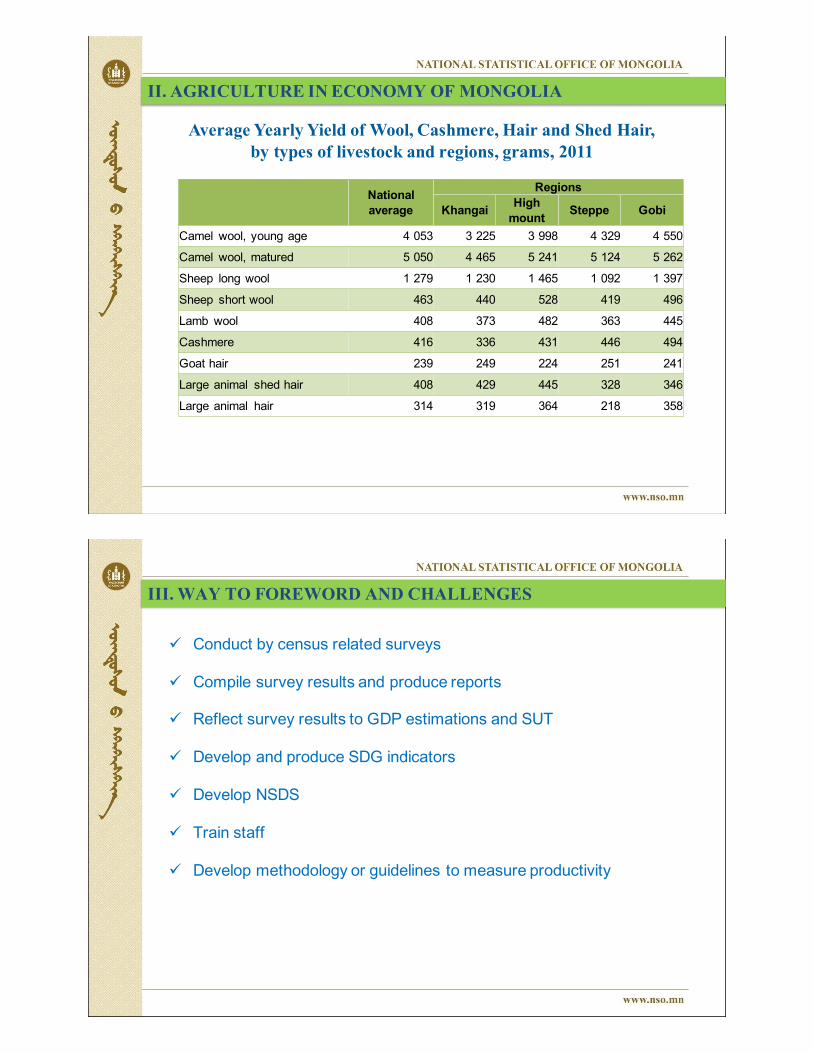
Average Yearly Yield of Wool, Cashmere, Hair and Shed Hair, by types of livestock and regions, grams, 2011
II. AGRICULTURE IN ECONOMY OF MONGOLIA
National
average
Regions
KhangaiHigh
mountSteppe Gobi
Camel wool, young age 4 053 3 225 3 998 4 329 4 550
Camel wool, matured 5 050 4 465 5 241 5 124 5 262
Sheep long wool 1 279 1 230 1 465 1 092 1 397
Sheep short wool 463 440 528 419 496
Lamb wool 408 373 482 363 445
Cashmere 416 336 431 446 494
Goat hair 239 249 224 251 241
Large animal shed hair 408 429 445 328 346
Large animal hair 314 319 364 218 358
III. WAY TO FOREWORD AND CHALLENGES
ü Conduct by census related surveys
ü Compile survey results and produce reports
ü Reflect survey results to GDP estimations and SUT
ü Develop and produce SDG indicators
ü Develop NSDS
ü Train staff
ü Develop methodology or guidelines to measure productivity