Embed Size (px)
Citation preview
Central Statistics

Central StatisticsPrivate Bag X44
Pretoria 0001
274 Schoeman StreetPretoria
Users enquiries: (012) 310-8600Fax: (012) 310-8500Main switchboard: (012) 310-8911
E-mail: [email protected] website: http://www.css.gov.za
Living in KwaZulu-Natal
Selected findings of the 1995October household survey
Central Statistics1998
Dr FM OrkinHead
Published by Central StatisticsPrivate Bag X44Pretoria0001
ISBN 0-621-27820-3
Copyright, 1998.
Data from this publication may be applied or processed, provided Central Statistics(CSS) is acknowledged as the source of the original data; that it is specified that theapplication and/or analysis is the result of the user’s independent processing of thedata; and that neither the basic data nor any reprocessed version or application thereofmay be sold or offered for sale in any form whatsoever.
Authors: Alfred Ngwane Dr Ros HirschowitzDirectorate of Analysis Chief Director, Research and DevelopmentCSS CSS
The detailed statistical tables on which this publication is based are available as‘October household survey’, CSS statistical release P0317 (South Africa as a whole),and P0317.1 to P0317.9 (the nine provinces). These can be ordered from CentralStatistics, Pretoria, in both printed and electronic format.
Other CSS reports in this series:
Living in South Africa. Selected findings of the 1995 October household survey(1996)Earning and spending in South Africa. Selected findings of the 1995 income andexpenditure survey (1997)Living in Gauteng. Selected findings of the 1995 October household survey (1997)Living in the Eastern Cape. Selected findings of the 1995 October household survey(forthcoming)Living in the Free State. Selected findings of the 1995 October household survey(forthcoming)Living in Mpumalanga. Selected findings of the 1995 October household survey(forthcoming)Living in the Northern Cape. Selected findings of the 1995 October household survey(forthcoming)Living in the Northern Province. Selected findings of the 1995 October householdsurvey (forthcoming)Living in North West. Selected findings of the 1995 October household survey(forthcoming)Living in the Western Cape. Selected findings of the 1995 October household survey(forthcoming)
Preliminary estimates of the size of the South African population, based on thepopulation census conducted in October 1996, were issued by the CSS in July1997. These indicate that there are fewer people (37,9 million) in the country,and that urbanisation (55%) has been more rapid, than was previously realised.
The new census numbers may have an effect on some of the weights andraising factors that were used in this report, since these are presently based onprojections of population and household size to 1995, using the 1991 censusestimates as baseline.
The new CSS management believes that the model used to adjust the actualcount of people found in the 1991 census probably overestimated populationgrowth rates in the country, hence overestimating the size of the populationand number of households.
The number of people, the number of households and the percentages reportedhere will therefore probably need to be modified at a later date when the CSShas more complete information about household size and distribution of thepopulation by race and age from Census‘96. Nevertheless, these overall trendsshould be accepted as indicative of the broad picture of households in SouthAfrica in general, and KwaZulu-Natal in particular, during 1995.
Contents
PageSection 1: Introduction
The research process 1Questionnaire design 2Drawing the sample 2The fieldwork 3Data capture 4Weighting the sample 4Data analysis and report writing 5
Comparison with 1994 data 5
Section 2: The main findings regarding individuals
The population of KwaZulu-Natal 7The age distribution of the population in KwaZulu-Natal 12The distribution of education in KwaZulu-Natal 16Employment and unemployment in KwaZulu-Natal 21
The economically active population 21The unemployed 22The employed 28Economic sector 32
Income from employment 34The informal economy 38
Summary 39
Section 3: The main findings regarding households
The type of dwellings in which households live 41Access to facilities and services 46
Access to electricity 46Obtaining wood for domestic use among Africans 47Water for drinking 48Sanitation 49Telephones 50Access to health facilities 50
Feelings of safety and security 52Household incomes 54Summary 55
Section 4: Disability in KwaZulu-Natal
Section 5: Conclusion
List of Figures
PageFigure 1: Population of South Africa by province (percent) 7Figure 2: Population of South Africa by province (millions) 8Figure 3: Population of South Africa and KwaZulu-Natal by population
group 9Figure 4: Population of South Africa in urban and non-urban areas by
province 10Figure 5: Population of KwaZulu-Natal in urban and non-urban areas by
population group 11Figure 6: Distribution of the national population by age-group and gender 12Figure 7: Distribution of the population in KwaZulu-Natal by age group
and gender 13Figure 8: Distribution of African population of KwaZulu-Natal by age-
group and gender 14Figure 9: Distribution of Indian population of KwaZulu-Natal by age-
group and gender 15Figure 10: Distribution of white population of KwaZulu-Natal by age-group
and gender 15Figure 11: Level of education of South Africans aged 20 years and older 17Figure 12: Level of education of residents of KwaZulu-Natal aged 20 years
and older 17Figure 13: Level of education of Africans in KwaZulu-Natal aged 20 years
and older 18Figure 14: Level of education of Indians in KwaZulu-Natal aged 20 years
and older 19Figure 15: Level of education of whites in KwaZulu-Natal aged 20 years
and older 20Figure 16: Percentage of Africans in KwaZulu-Natal aged 15 years or more
who have received no education 21Figure 17: Unemployment rates in South Africa by population group and
gender: strict definition compared with expanded definition 23Figure 18: Unemployment rates in KwaZulu-Natal by population group and
gender: strict definition compared with expanded definition 24Figure 19: Unemployment rates in South Africa by province and type of
area 25Figure 20: Unemployment rates in KwaZulu-Natal in urban and non-urban
areas by population group 26Figure 21: Distribution of the unemployed in KwaZulu-Natal by age,
population group and gender 27Figure 22: Occupations of the employed in South Africa by gender 28Figure 23: Occupations of the employed in KwaZulu-Natal by gender 29Figure 24: Occupations of employed Africans in KwaZulu-Natal by gender 30
Figure 25: Occupations of employed Indians in KwaZulu-Natal by gender 31Figure 26: Occupations of employed whites in KwaZulu-Natal by gender 32Figure 27: Percentage employed in South Africa by economic sector 33Figure 28: Percentage employed in KwaZulu-Natal by economic sector 33Figure 29: Among employees in South Africa, percentage in each monthly
income category by gender 34Figure 30: Among employees in KwaZulu-Natal, percentage in each
monthly income category by gender 35Figure 31: Among African employees in KwaZulu-Natal, percentage in each
monthly income category by gender 36Figure 32: Among Indian employees in KwaZulu-Natal, percentage in each
monthly income category by gender 37Figure 33: Among white employees in KwaZulu-Natal, percentage in each
monthly income category by gender 37Figure 34: Workers for own account in the informal sector by population
group 38Figure 35: Workers for own account in the informal sector by gender in
KwaZulu-Natal 39Figure 36: Type of dwelling in which households live in South Africa and
KwaZulu-Natal 41Figure 37: Type of dwelling in which African households live in South
Africa and KwaZulu-Natal 42Figure 38: Type of dwelling in which African households in KwaZulu-Natal
live, in urban and non-urban areas 43Figure 39: Average household size by population group in urban and non-
urban areas in KwaZulu-Natal 44Figure 40: Type of dwelling in which white households live in South Africa
and KwaZulu-Natal 45Figure 41: Source of energy for lighting in urban and non-urban African
households in KwaZulu-Natal 46Figure 42: Source of energy for cooking in urban and non-urban African
households in KwaZulu-Natal 47Figure 43: Source of drinking water in urban and non-urban African
households in KwaZulu-Natal 48Figure 44: Type of sanitation used among African households in urban and
non-urban areas in KwaZulu-Natal 49Figure 45: Access to telephone inside the dwelling in urban and non-urban
areas by population group in KwaZulu-Natal 50Figure 46: Source of health-care for households by population group in
KwaZulu-Natal 51Figure 47: Feeling safe in one’s neighbourhood by population group of head
of household in KwaZulu-Natal 52Figure 48: Feeling safe in one’s home by population group of head of
household in KwaZulu-Natal 53Figure 49: Percentage of households in each annual income quintile by
population group in KwaZulu-Natal 54
1
Section 1Introduction
South Africa’s first democratically-elected government has committed itself to creatinga better quality of life for all the country’s inhabitants. The extent of change required,both nationally and in each province, to bring this about can best be measured throughhousehold surveys. The annual October household survey (OHS) programme of theCentral Statistical Service (CSS) provides detailed information about the livingconditions and life circumstances of all South Africa’s inhabitants at national andprovincial level.
A programme of household surveys makes it possible not only to describe the situationin a country and in each province at a given point in time, but also to measure changein people’s life circumstances as and when new government policies are implemented.
The first comprehensive CSS household survey was conducted in October 1993. Itwas repeated, with modifications to the questionnaire, in 1994 and 1995. The former‘TBVC states’ (Transkei, Bophuthatswana, Venda and Ciskei) were excluded from thefirst survey, but the entire country was included thereafter.
This report presents a summary of the findings of the 1995 OHS in KwaZulu-Natal. Indoing this, it paints a picture of the province’s demographic, social and economic life.
KwaZulu-Natal has the largest population of the provinces, containing approximatelyone-fifth (21%) of all South Africans. In terms of geographical area, however, itoccupies only about 8% of the country’s land mass. Compared to other provinces,KwaZulu-Natal is relatively densely populated, with an average of 95 people persquare kilometer. Its location between the coast and mountains makes it a goodprovince for tourism development.
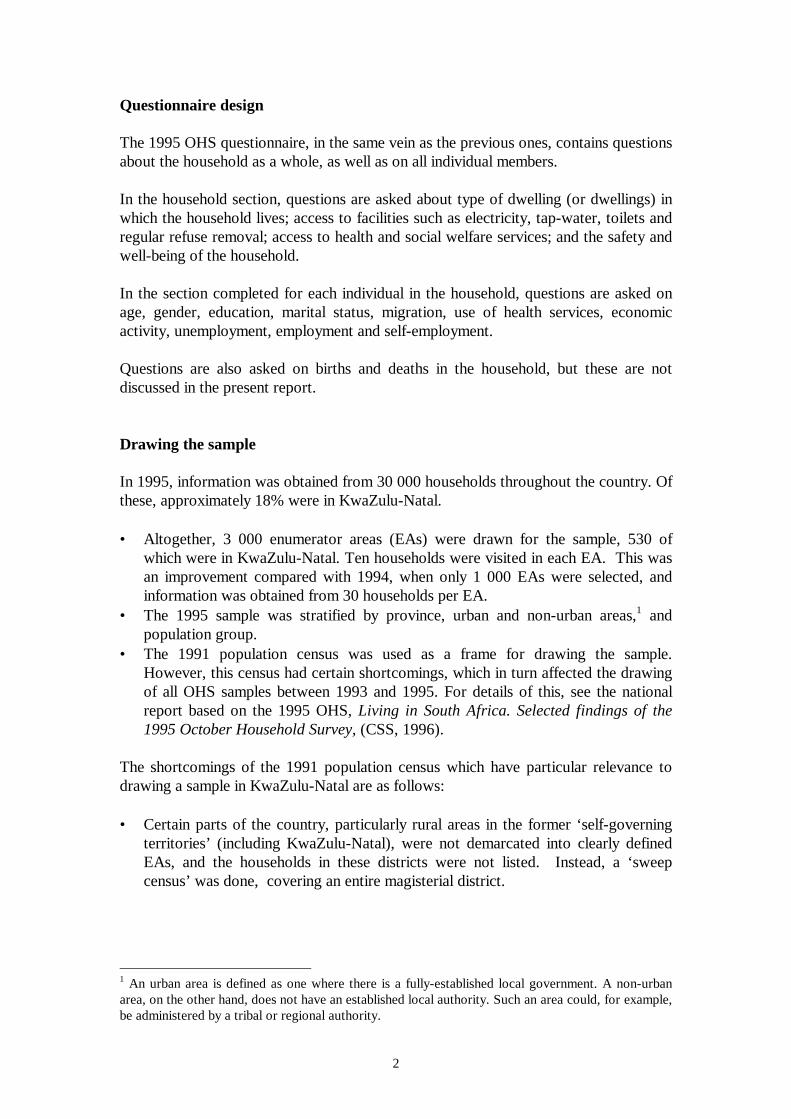
The research process
The following steps constituted the research process for the 1995 OHS:
• Questionnaire design.• Drawing a sample.• Fieldwork.• Data capture.• Weighting the sample back to the population.• Data analysis.• Report writing.
2
Questionnaire design
The 1995 OHS questionnaire, in the same vein as the previous ones, contains questionsabout the household as a whole, as well as on all individual members.
In the household section, questions are asked about type of dwelling (or dwellings) inwhich the household lives; access to facilities such as electricity, tap-water, toilets andregular refuse removal; access to health and social welfare services; and the safety andwell-being of the household.
In the section completed for each individual in the household, questions are asked onage, gender, education, marital status, migration, use of health services, economicactivity, unemployment, employment and self-employment.
Questions are also asked on births and deaths in the household, but these are notdiscussed in the present report.
Drawing the sample
In 1995, information was obtained from 30 000 households throughout the country. Ofthese, approximately 18% were in KwaZulu-Natal.
• Altogether, 3 000 enumerator areas (EAs) were drawn for the sample, 530 ofwhich were in KwaZulu-Natal. Ten households were visited in each EA. This wasan improvement compared with 1994, when only 1 000 EAs were selected, andinformation was obtained from 30 households per EA.
• The 1995 sample was stratified by province, urban and non-urban areas,1 andpopulation group.
• The 1991 population census was used as a frame for drawing the sample.However, this census had certain shortcomings, which in turn affected the drawingof all OHS samples between 1993 and 1995. For details of this, see the nationalreport based on the 1995 OHS, Living in South Africa. Selected findings of the1995 October Household Survey, (CSS, 1996).
The shortcomings of the 1991 population census which have particular relevance todrawing a sample in KwaZulu-Natal are as follows:
• Certain parts of the country, particularly rural areas in the former ‘self-governingterritories’ (including KwaZulu-Natal), were not demarcated into clearly definedEAs, and the households in these districts were not listed. Instead, a ‘sweepcensus’ was done, covering an entire magisterial district.
1 An urban area is defined as one where there is a fully-established local government. A non-urbanarea, on the other hand, does not have an established local authority. Such an area could, for example,be administered by a tribal or regional authority.
3
• In other areas of the country, particularly informal settlements (including those inKwaZulu-Natal), aerial photography was used to estimate population size, backedby small-scale surveys among households in areas where the photographs weretaken.
• No allowance was made for new informal settlements springing up all overKwaZulu-Natal to be incorporated into the sampling frame.
Some attempts were made in the 1995 OHS to overcome sampling problems occurringas a result of these difficulties with the 1991 population census. For example,magisterial districts where a ‘sweep census’ had taken place were sub-divided intosmaller units, and new informal settlements were incorporated into the boundaries ofexisting enumerator areas. However, when implementing the sampling plan,difficulties were experienced in the field. For example, field workers became confusedabout the exact boundaries of a particular EA in relation to the above changes.
In addition, the fieldwork for the 1995 OHS took place at the same time as CSS staffwere demarcating new EA boundaries for the 1996 census. As a consequence, old1991 census and new 1996 census EA boundaries were, on occasion, confused duringfieldwork for the OHS.
These problems were taken into account in the weighting procedures, as discussed in alater part of this report.
The fieldwork
Information was collected through face-to-face interviews in the 30 000 householdssampled throughout South Africa, including the 5 300 households sampled inKwaZulu-Natal. During these interviews, field workers administered a questionnaireto a responsible person in each household.
Where possible, the fieldwork for the 1995 OHS was combined with the fieldwork foran income and expenditure survey (IES). The same households were visited for boththe OHS and the IES. The field workers first administered the OHS questionnaire, andreturned at a later date to administer the IES questionnaire. However, problems wereexperienced in returning to the same household, particularly in informal settlementsand in rural areas where addresses were not available, and where demarcation of theEA or listing of households had not been undertaken for the 1991 census. Theseproblems were solved, as far as possible, during the data-capture process by matchingresponses to common questions in the two surveys.
4
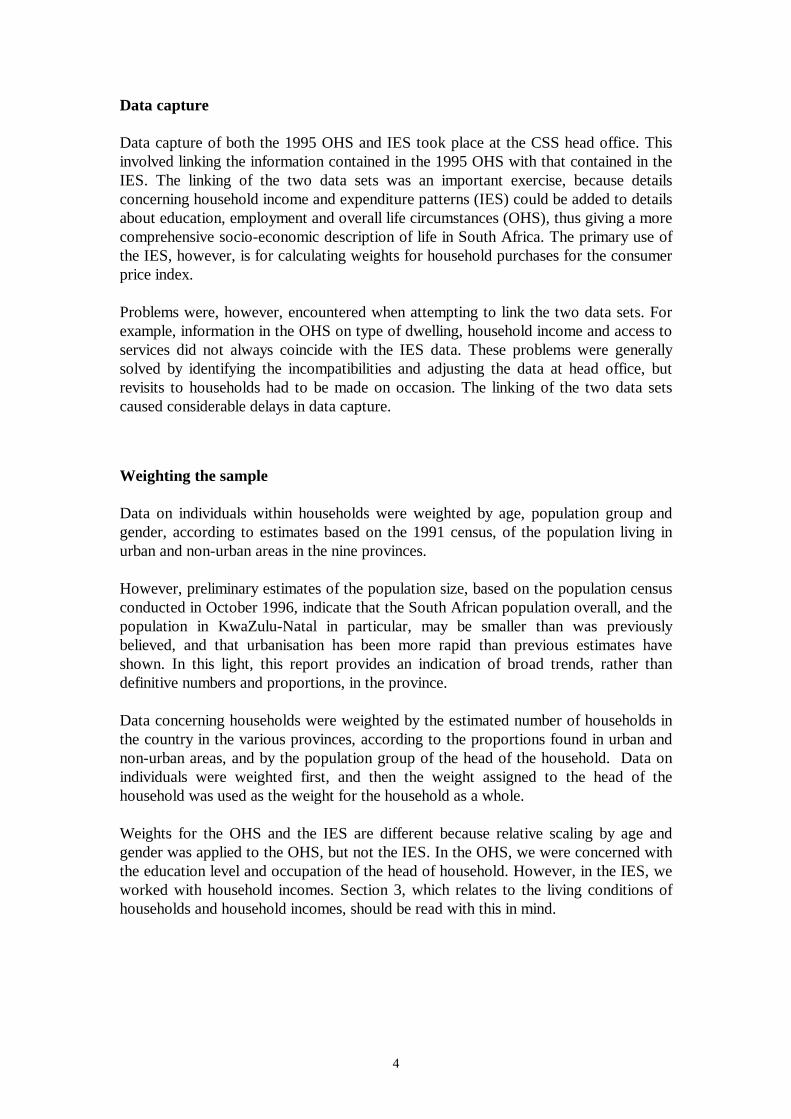
Data capture
Data capture of both the 1995 OHS and IES took place at the CSS head office. Thisinvolved linking the information contained in the 1995 OHS with that contained in theIES. The linking of the two data sets was an important exercise, because detailsconcerning household income and expenditure patterns (IES) could be added to detailsabout education, employment and overall life circumstances (OHS), thus giving a morecomprehensive socio-economic description of life in South Africa. The primary use ofthe IES, however, is for calculating weights for household purchases for the consumerprice index.
Problems were, however, encountered when attempting to link the two data sets. Forexample, information in the OHS on type of dwelling, household income and access toservices did not always coincide with the IES data. These problems were generallysolved by identifying the incompatibilities and adjusting the data at head office, butrevisits to households had to be made on occasion. The linking of the two data setscaused considerable delays in data capture.
Weighting the sample
Data on individuals within households were weighted by age, population group andgender, according to estimates based on the 1991 census, of the population living inurban and non-urban areas in the nine provinces.
However, preliminary estimates of the population size, based on the population censusconducted in October 1996, indicate that the South African population overall, and thepopulation in KwaZulu-Natal in particular, may be smaller than was previouslybelieved, and that urbanisation has been more rapid than previous estimates haveshown. In this light, this report provides an indication of broad trends, rather thandefinitive numbers and proportions, in the province.
Data concerning households were weighted by the estimated number of households inthe country in the various provinces, according to the proportions found in urban andnon-urban areas, and by the population group of the head of the household. Data onindividuals were weighted first, and then the weight assigned to the head of thehousehold was used as the weight for the household as a whole.
Weights for the OHS and the IES are different because relative scaling by age andgender was applied to the OHS, but not the IES. In the OHS, we were concerned withthe education level and occupation of the head of household. However, in the IES, weworked with household incomes. Section 3, which relates to the living conditions ofhouseholds and household incomes, should be read with this in mind.
5
The original aim was to weight the data by magisterial district, but this was notpossible because of the EA boundary problems previously described. Boundaryproblems could only be overcome by weighting the sample to a higher level, namelythe provinces. All further discussions in this report are based on weighted figures.
Data analysis and report writing
The data were made available for report writing as a series of tables and cross-tabulations. This summary report is based on these tables.
Comparison with 1994 data
The CSS is still grappling with sampling issues, based on attempts to use theincomplete sampling frame generated by the 1991 population census. Differentmethodologies were used for drawing the samples in 1994 and 1995, and diverseproblems were encountered as a result of these varying sampling techniques. As such,the 1994 and 1995 OHS data sets are not directly comparable in all respects, but areessentially separate snapshots of different parts of the country during two consecutiveyears. This applies nationally, as well as in KwaZulu-Natal.
However, there are certain similarities between these two surveys when looking atoverall broad patterns. For example, access to water and toilet facilities remainsproblematic in non-urban areas in both surveys. Unemployment remains high, and theproportion of Africans in elementary occupations such as cleaning and garbageremoval remains similar. Design effects, standard errors and confidence intervals forselected variables have, however, been calculated for both surveys. These are availablefrom the CSS.
It may be more possible to compare household survey results over time once there is amore accurate sampling frame on which to draw samples, and when we have astandardised methodology for sampling. The ability to compare household surveysover time will improve dramatically if the 1996 population census yields a bettersampling frame.
In this report, we have avoided making comparisons between the 1994 and 1995surveys: we cannot, as yet, calculate whether variations in answers are due to genuinedevelopmental changes, to sampling error, or to other sources of error such asmisunderstanding of questions.

PLEASE TURN THE PAGE
7
Section 2The main findings regarding individuals
The population of KwaZulu-Natal
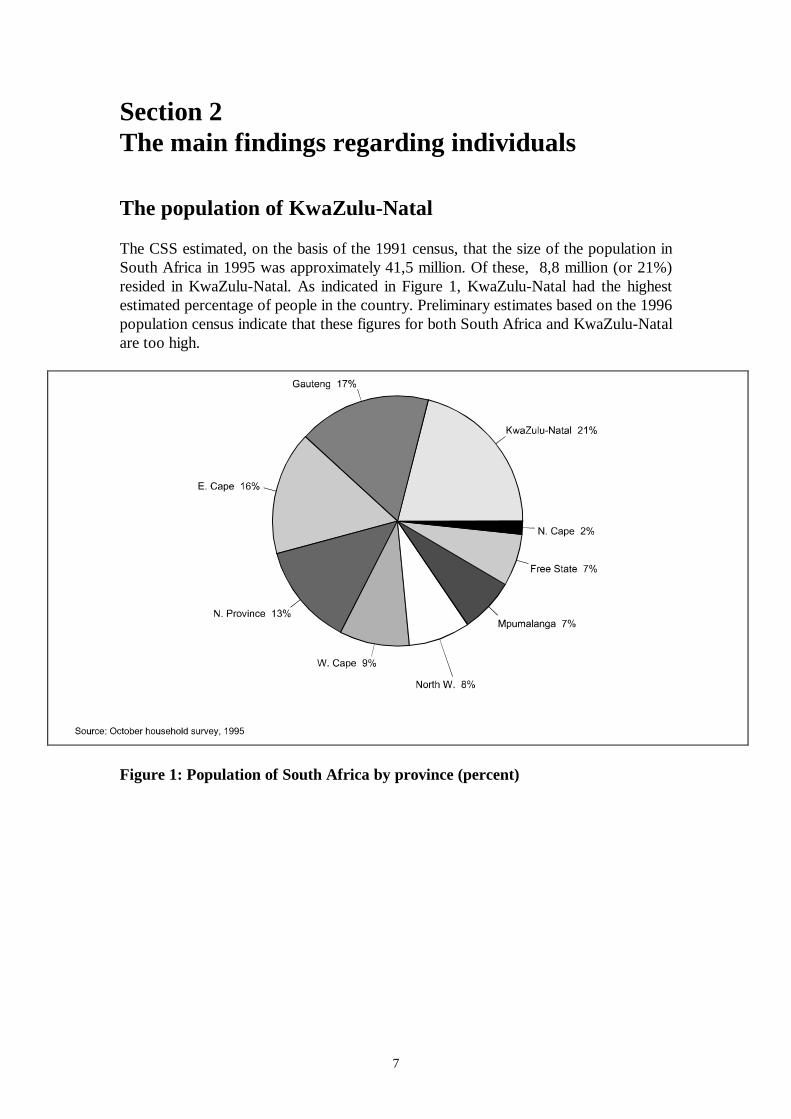
The CSS estimated, on the basis of the 1991 census, that the size of the population inSouth Africa in 1995 was approximately 41,5 million. Of these, 8,8 million (or 21%)resided in KwaZulu-Natal. As indicated in Figure 1, KwaZulu-Natal had the highestestimated percentage of people in the country. Preliminary estimates based on the 1996population census indicate that these figures for both South Africa and KwaZulu-Natalare too high.
Figure 1: Population of South Africa by province (percent)
8
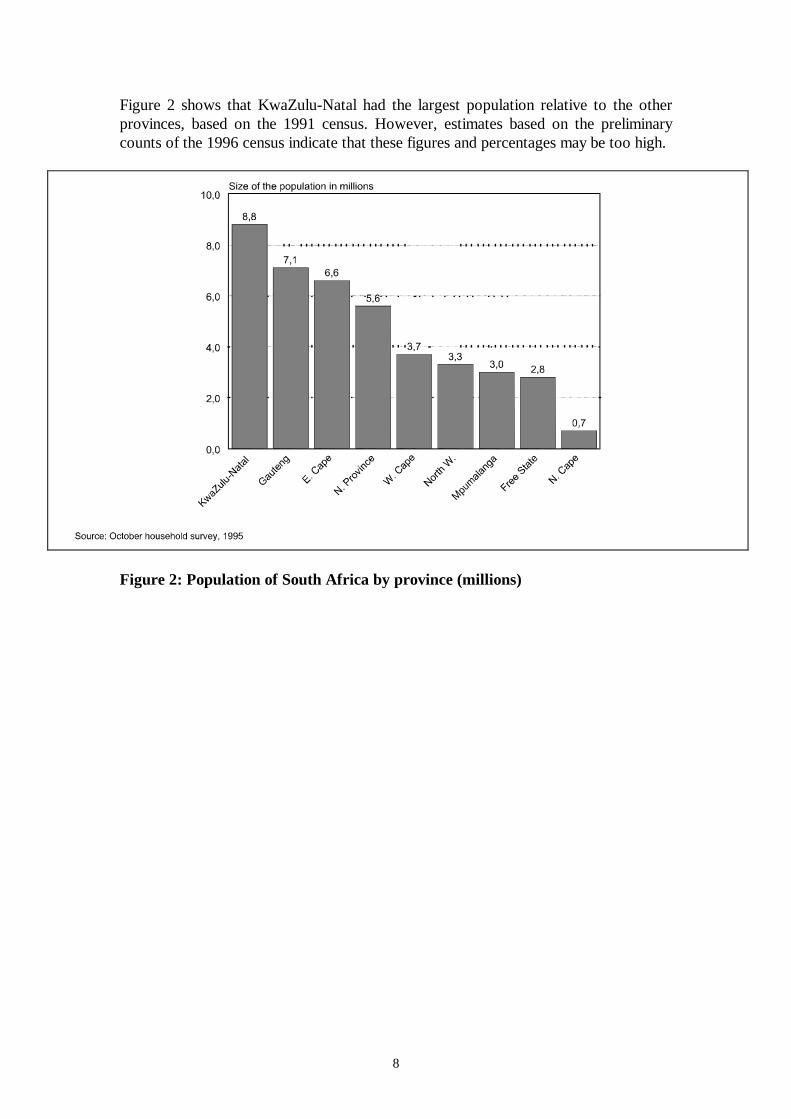
Figure 2 shows that KwaZulu-Natal had the largest population relative to the otherprovinces, based on the 1991 census. However, estimates based on the preliminarycounts of the 1996 census indicate that these figures and percentages may be too high.
Figure 2: Population of South Africa by province (millions)
9
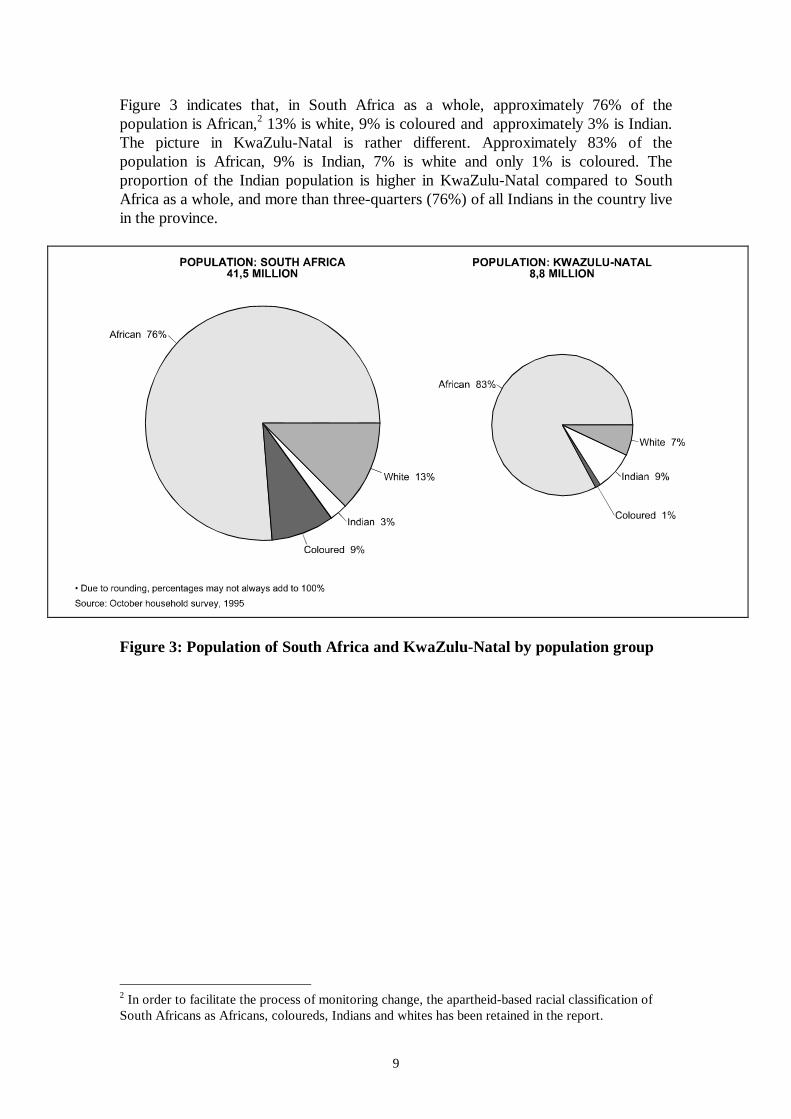
Figure 3 indicates that, in South Africa as a whole, approximately 76% of thepopulation is African,2 13% is white, 9% is coloured and approximately 3% is Indian.The picture in KwaZulu-Natal is rather different. Approximately 83% of thepopulation is African, 9% is Indian, 7% is white and only 1% is coloured. Theproportion of the Indian population is higher in KwaZulu-Natal compared to SouthAfrica as a whole, and more than three-quarters (76%) of all Indians in the country livein the province.
Figure 3: Population of South Africa and KwaZulu-Natal by population group
2 In order to facilitate the process of monitoring change, the apartheid-based racial classification ofSouth Africans as Africans, coloureds, Indians and whites has been retained in the report.
10
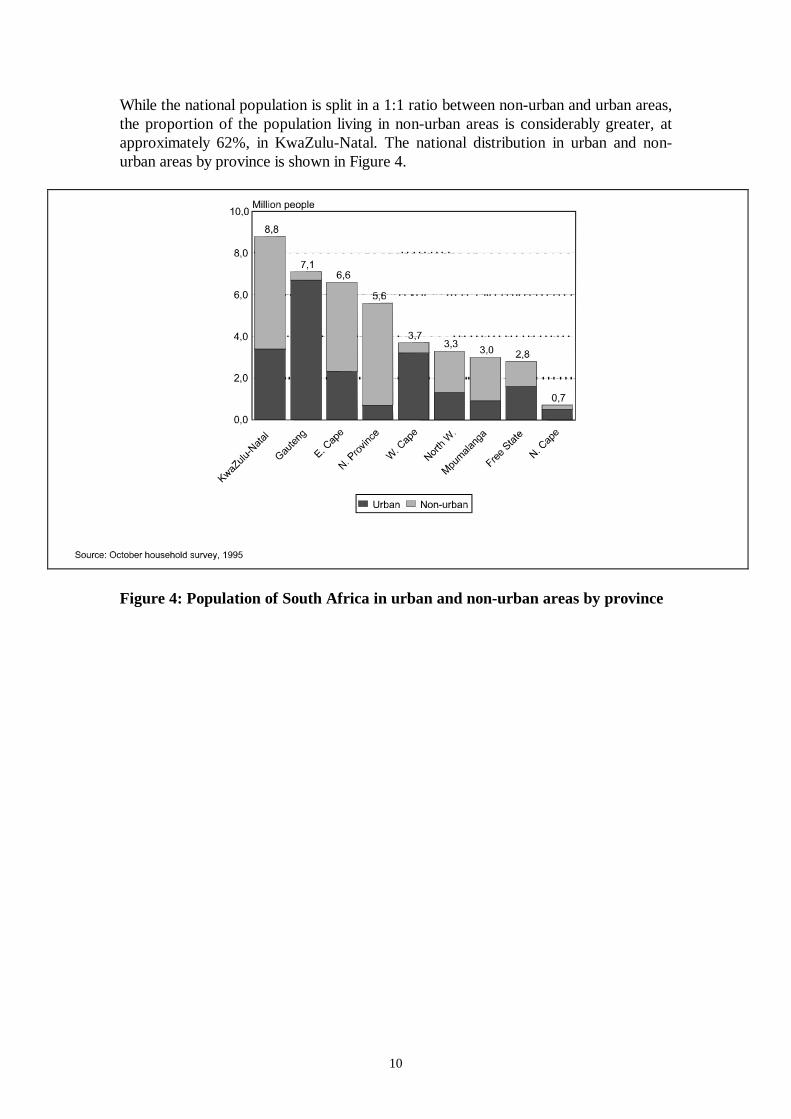
While the national population is split in a 1:1 ratio between non-urban and urban areas,the proportion of the population living in non-urban areas is considerably greater, atapproximately 62%, in KwaZulu-Natal. The national distribution in urban and non-urban areas by province is shown in Figure 4.
Figure 4: Population of South Africa in urban and non-urban areas by province
11
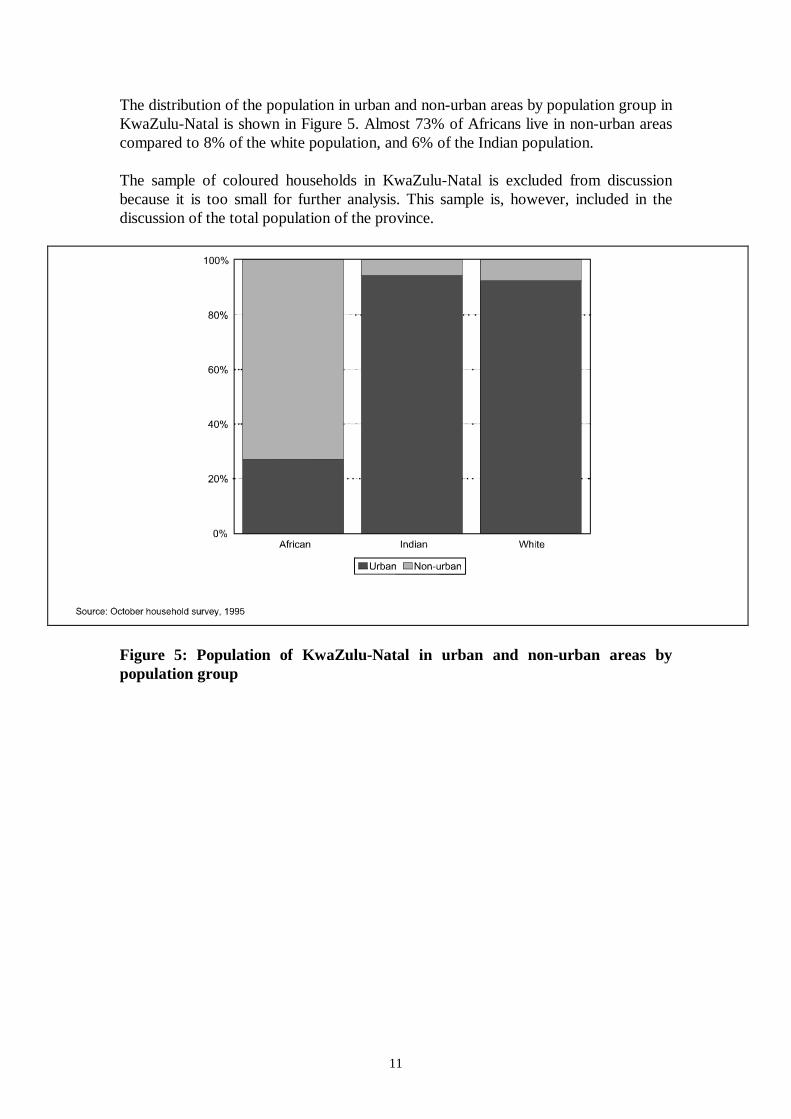
The distribution of the population in urban and non-urban areas by population group inKwaZulu-Natal is shown in Figure 5. Almost 73% of Africans live in non-urban areascompared to 8% of the white population, and 6% of the Indian population.
The sample of coloured households in KwaZulu-Natal is excluded from discussionbecause it is too small for further analysis. This sample is, however, included in thediscussion of the total population of the province.
Figure 5: Population of KwaZulu-Natal in urban and non-urban areas bypopulation group
12
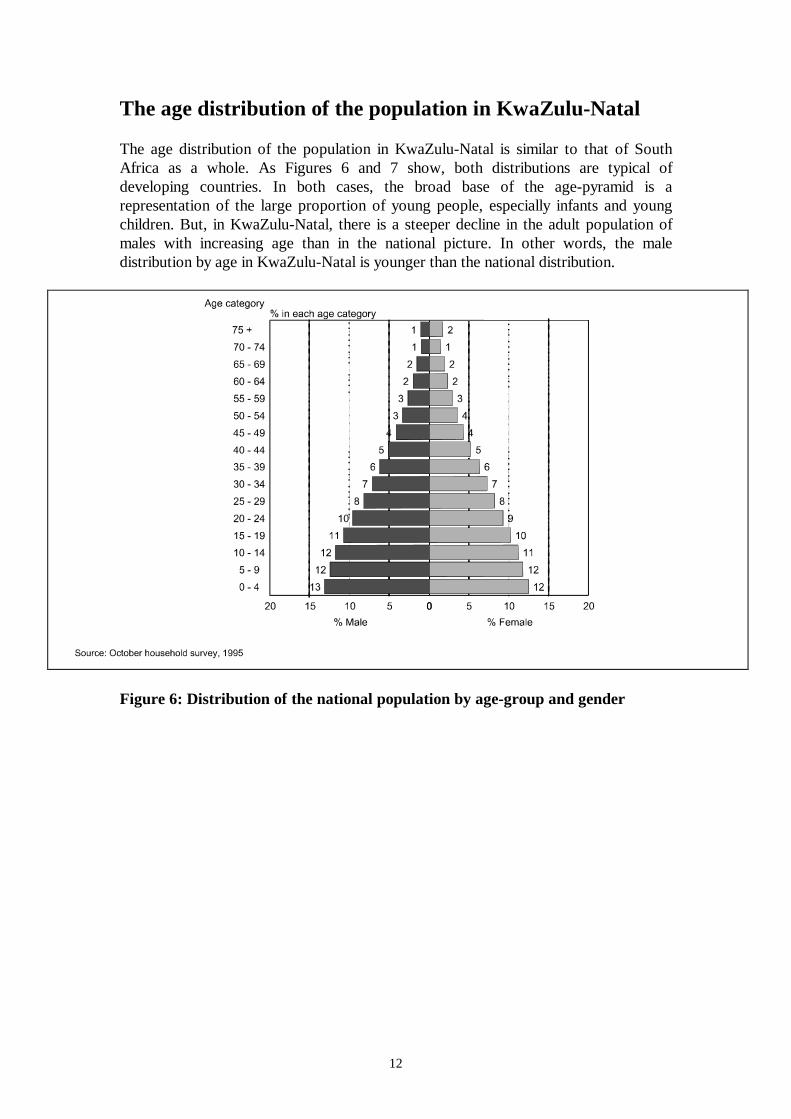
The age distribution of the population in KwaZulu-Natal
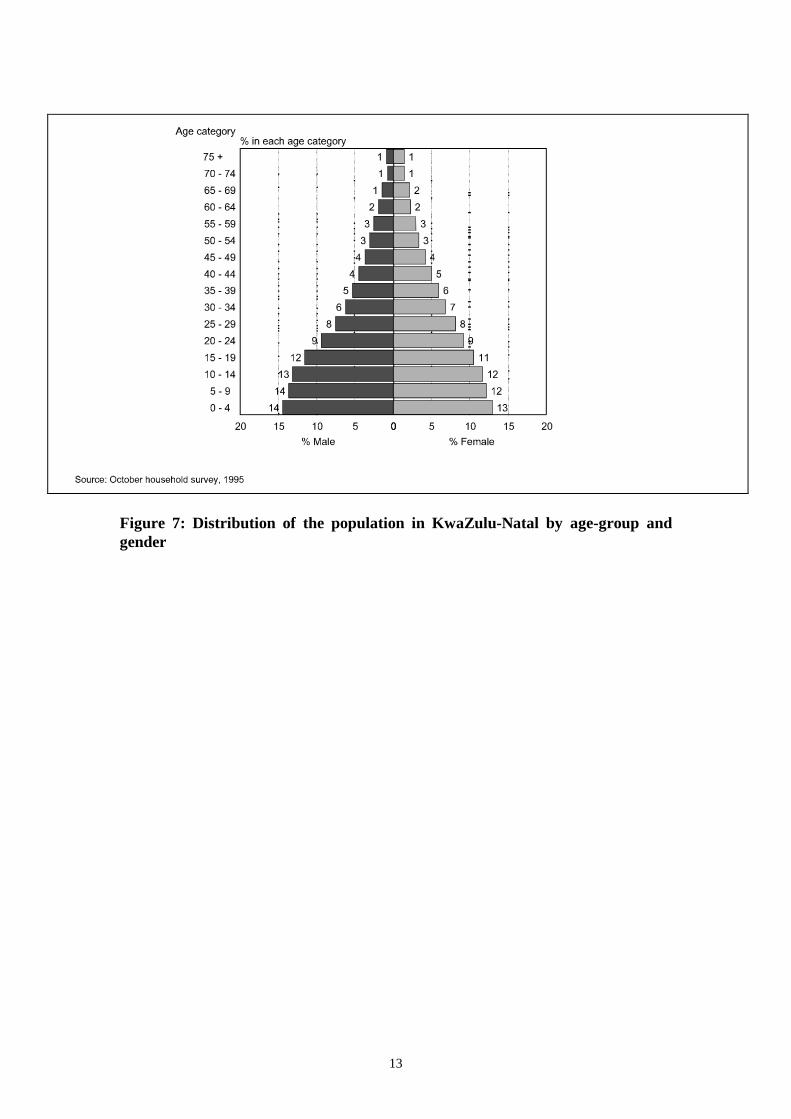
The age distribution of the population in KwaZulu-Natal is similar to that of SouthAfrica as a whole. As Figures 6 and 7 show, both distributions are typical ofdeveloping countries. In both cases, the broad base of the age-pyramid is arepresentation of the large proportion of young people, especially infants and youngchildren. But, in KwaZulu-Natal, there is a steeper decline in the adult population ofmales with increasing age than in the national picture. In other words, the maledistribution by age in KwaZulu-Natal is younger than the national distribution.
Figure 6: Distribution of the national population by age-group and gender
13
Figure 7: Distribution of the population in KwaZulu-Natal by age-group andgender
14
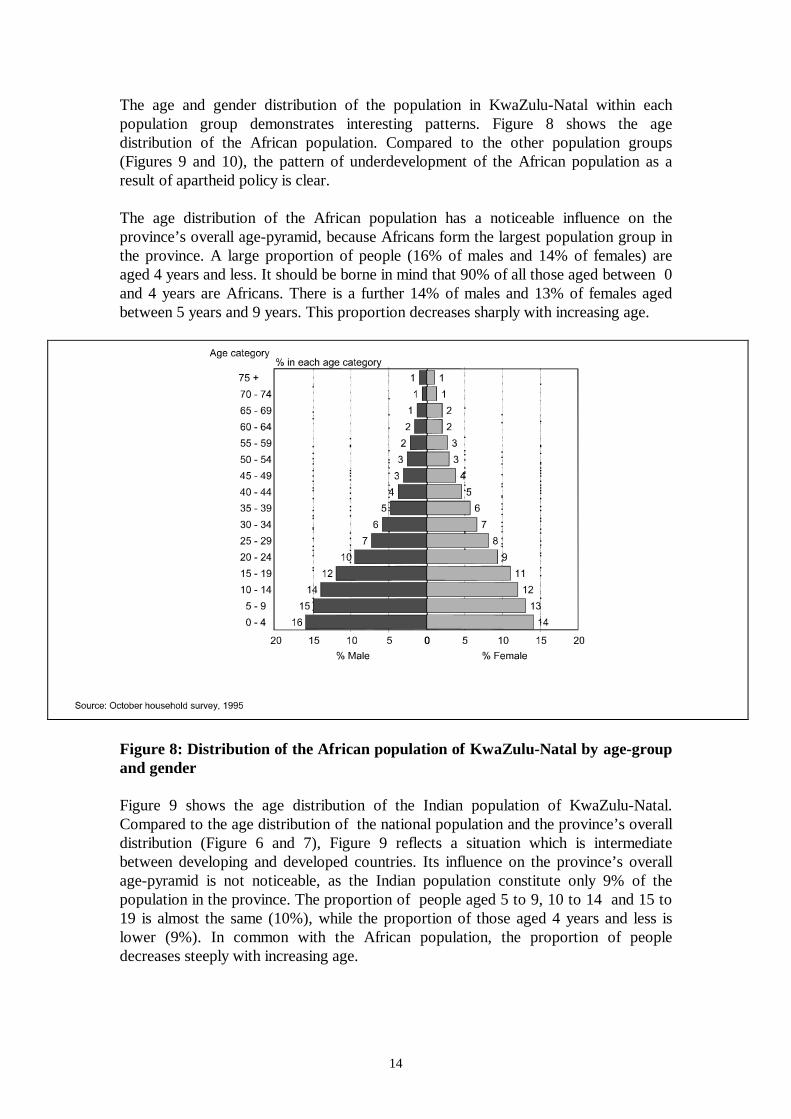
The age and gender distribution of the population in KwaZulu-Natal within eachpopulation group demonstrates interesting patterns. Figure 8 shows the agedistribution of the African population. Compared to the other population groups(Figures 9 and 10), the pattern of underdevelopment of the African population as aresult of apartheid policy is clear.
The age distribution of the African population has a noticeable influence on theprovince’s overall age-pyramid, because Africans form the largest population group inthe province. A large proportion of people (16% of males and 14% of females) areaged 4 years and less. It should be borne in mind that 90% of all those aged between 0and 4 years are Africans. There is a further 14% of males and 13% of females agedbetween 5 years and 9 years. This proportion decreases sharply with increasing age.
Figure 8: Distribution of the African population of KwaZulu-Natal by age-groupand gender
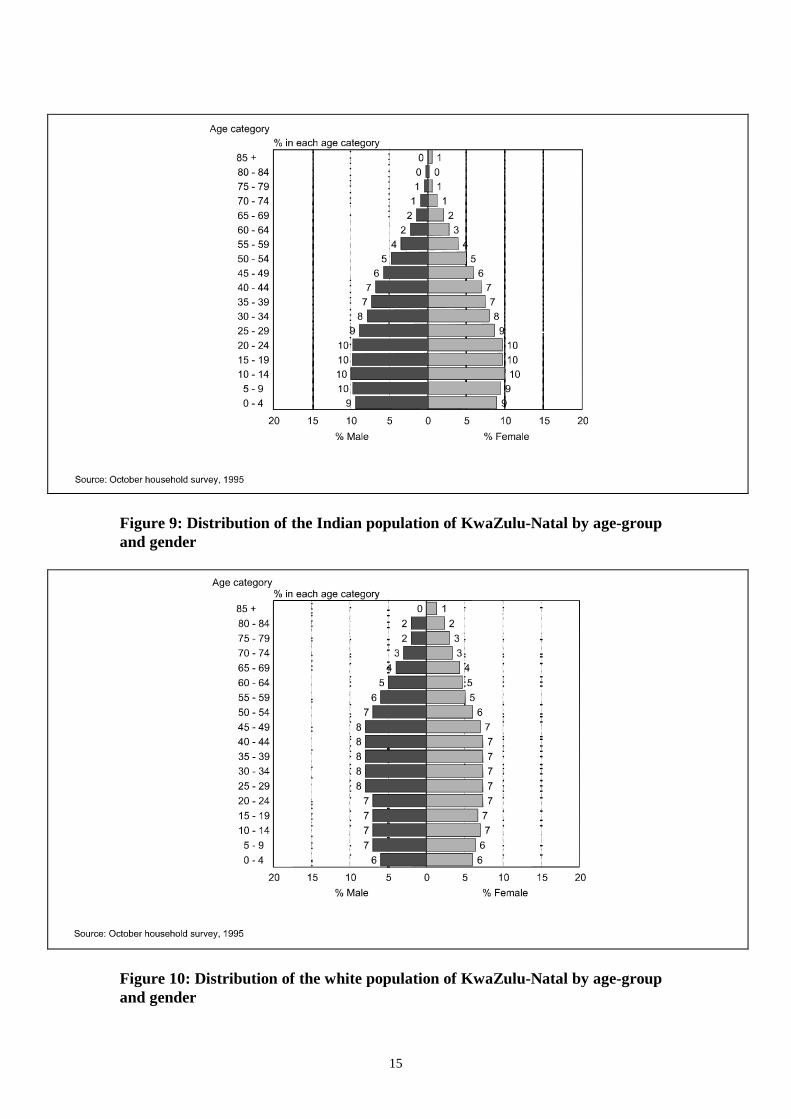
Figure 9 shows the age distribution of the Indian population of KwaZulu-Natal.Compared to the age distribution of the national population and the province’s overalldistribution (Figure 6 and 7), Figure 9 reflects a situation which is intermediatebetween developing and developed countries. Its influence on the province’s overallage-pyramid is not noticeable, as the Indian population constitute only 9% of thepopulation in the province. The proportion of people aged 5 to 9, 10 to 14 and 15 to19 is almost the same (10%), while the proportion of those aged 4 years and less islower (9%). In common with the African population, the proportion of peopledecreases steeply with increasing age.
15
Figure 9: Distribution of the Indian population of KwaZulu-Natal by age-groupand gender
Figure 10: Distribution of the white population of KwaZulu-Natal by age-groupand gender
16
Figure 10 shows the age distribution among the white population of KwaZulu-Natal.This figure differs from the age-pyramid of the overall national and provincial picture,resembling the typical age-pyramid of industrialised countries. There is a relativelysmall proportion of infants and young children and a larger proportion of older peoplecompared to the other age distributions. Approximately 6% of males and females areaged between 0 to 4 years, while a further 7% of males and 6% of females are agedbetween 5 and 9 years. There is a large proportion of people aged 35 years and above.Unlike the other population groups, the proportion of people in each successive agegroup decreases slowly and steadily. Among white males, there is a sharp decrease inthe proportion of people once the age of 50 has been reached. This decrease is moregradual among white females.
The distribution of education in KwaZulu-Natal
In the past, access to education was not equally available to all the people of SouthAfrica. Educational attainment varies not only by population group, but also by gender.
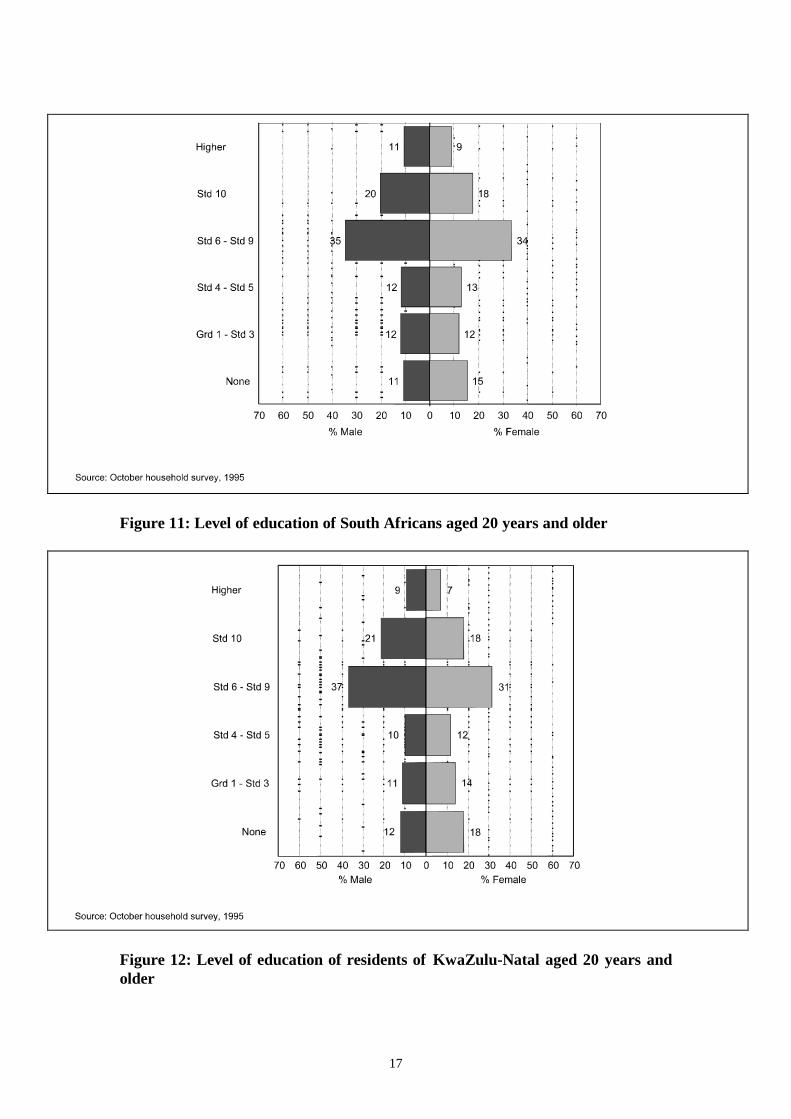
Figures 11 and 12 show the distribution of education among the national and theKwaZulu-Natal population. Little difference exists between the national and provincialdistribution. A relatively small proportion has no education, or has studied beyondStandard 10. A large proportion of the population falls in the range of Standards 6 to9.
17
Figure 11: Level of education of South Africans aged 20 years and older
Figure 12: Level of education of residents of KwaZulu-Natal aged 20 years andolder
18
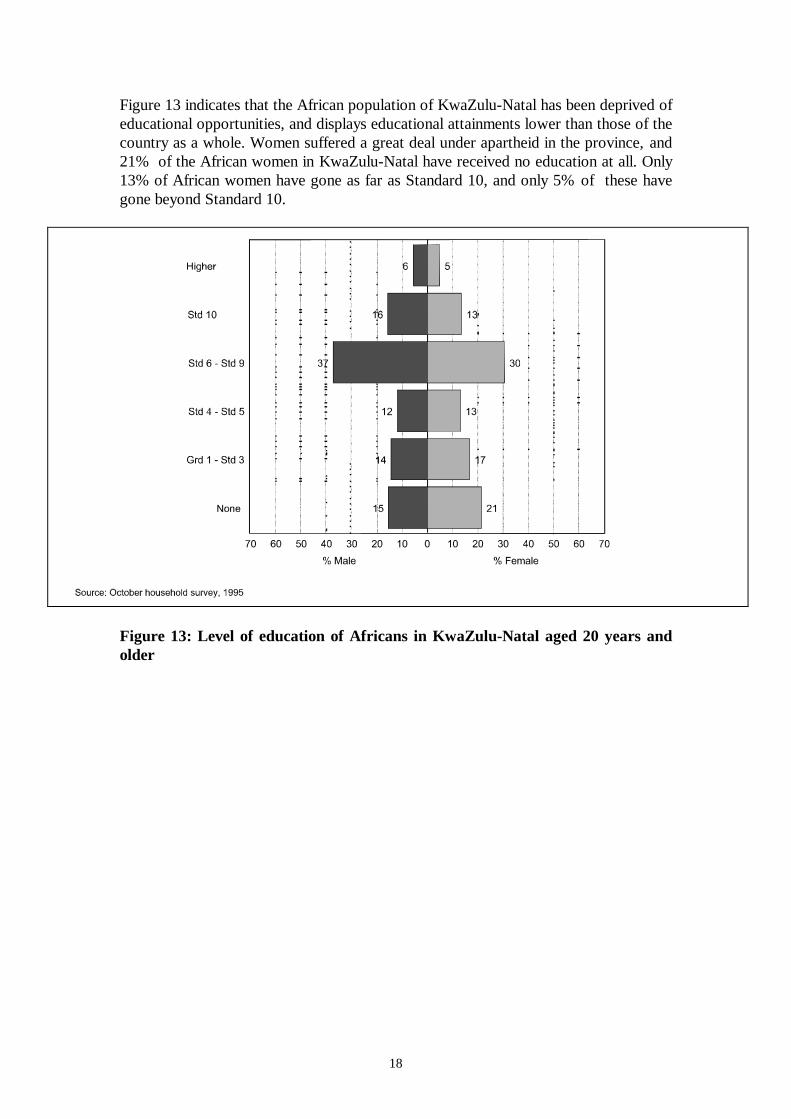
Figure 13 indicates that the African population of KwaZulu-Natal has been deprived ofeducational opportunities, and displays educational attainments lower than those of thecountry as a whole. Women suffered a great deal under apartheid in the province, and21% of the African women in KwaZulu-Natal have received no education at all. Only13% of African women have gone as far as Standard 10, and only 5% of these havegone beyond Standard 10.
Figure 13: Level of education of Africans in KwaZulu-Natal aged 20 years andolder
19
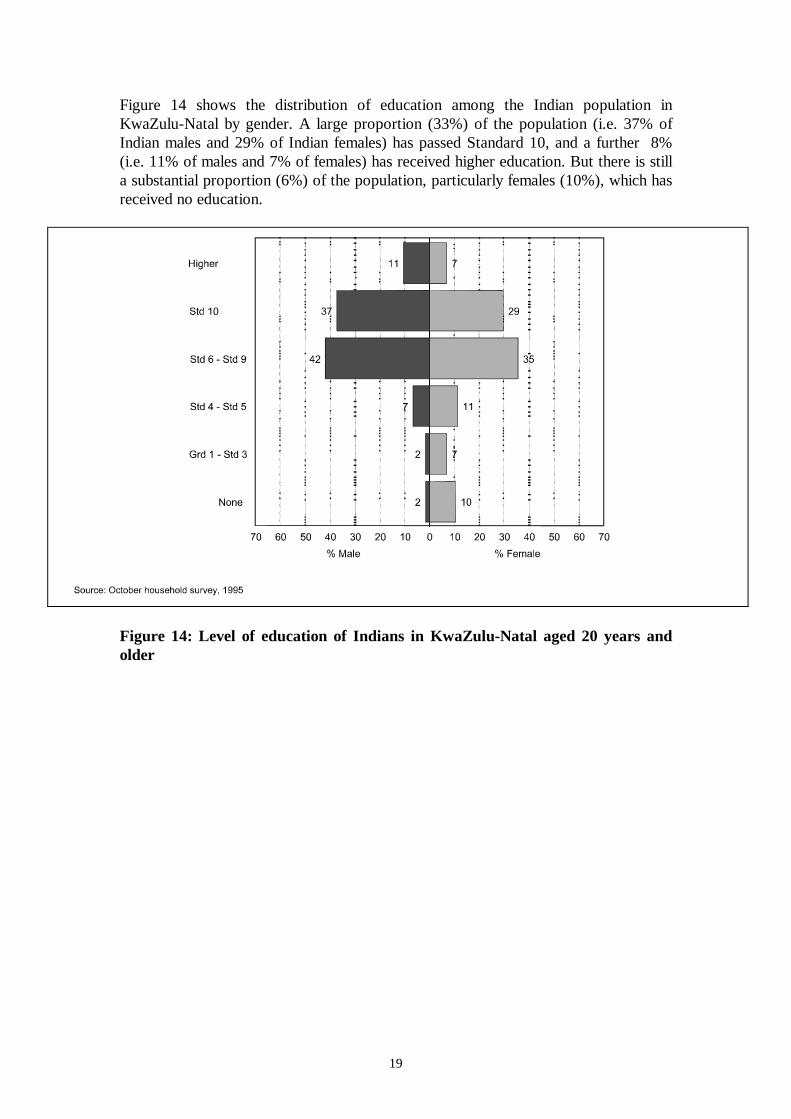
Figure 14 shows the distribution of education among the Indian population inKwaZulu-Natal by gender. A large proportion (33%) of the population (i.e. 37% ofIndian males and 29% of Indian females) has passed Standard 10, and a further 8%(i.e. 11% of males and 7% of females) has received higher education. But there is stilla substantial proportion (6%) of the population, particularly females (10%), which hasreceived no education.
Figure 14: Level of education of Indians in KwaZulu-Natal aged 20 years andolder
20
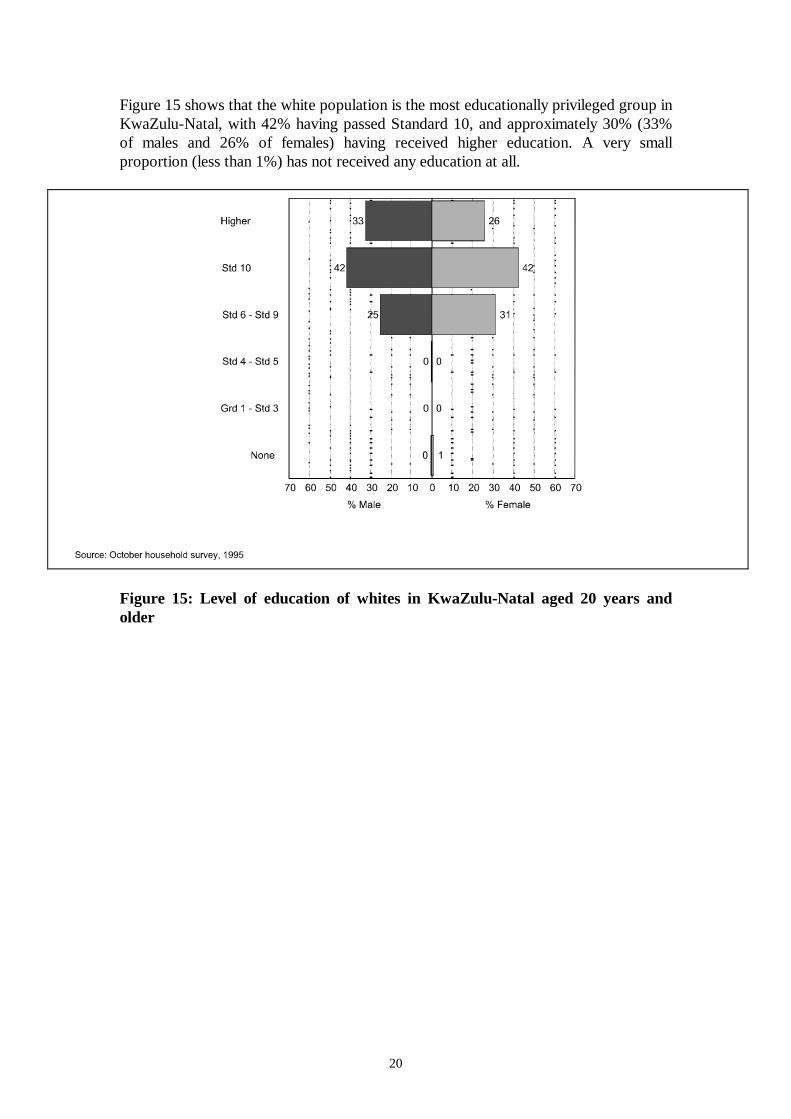
Figure 15 shows that the white population is the most educationally privileged group inKwaZulu-Natal, with 42% having passed Standard 10, and approximately 30% (33%of males and 26% of females) having received higher education. A very smallproportion (less than 1%) has not received any education at all.
Figure 15: Level of education of whites in KwaZulu-Natal aged 20 years andolder
21
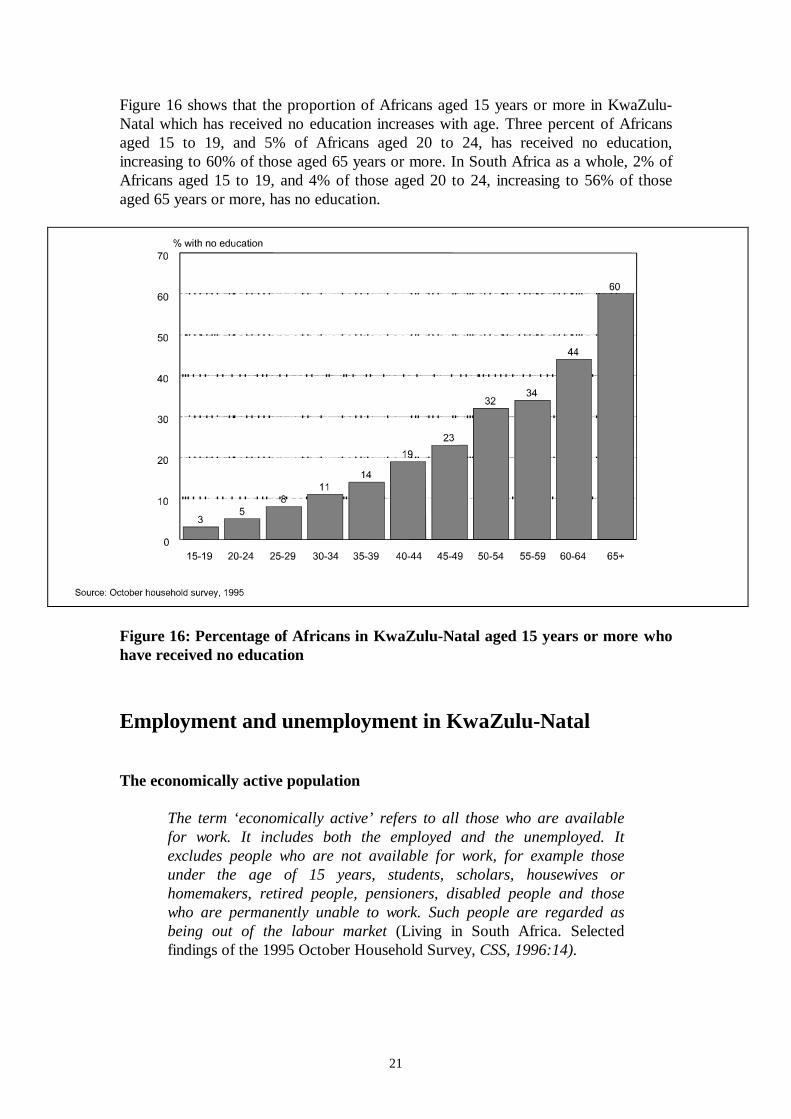
Figure 16 shows that the proportion of Africans aged 15 years or more in KwaZulu-Natal which has received no education increases with age. Three percent of Africansaged 15 to 19, and 5% of Africans aged 20 to 24, has received no education,increasing to 60% of those aged 65 years or more. In South Africa as a whole, 2% ofAfricans aged 15 to 19, and 4% of those aged 20 to 24, increasing to 56% of thoseaged 65 years or more, has no education.
Figure 16: Percentage of Africans in KwaZulu-Natal aged 15 years or more whohave received no education
Employment and unemployment in KwaZulu-Natal
The economically active population
The term ‘economically active’ refers to all those who are availablefor work. It includes both the employed and the unemployed. Itexcludes people who are not available for work, for example thoseunder the age of 15 years, students, scholars, housewives orhomemakers, retired people, pensioners, disabled people and thosewho are permanently unable to work. Such people are regarded asbeing out of the labour market (Living in South Africa. Selectedfindings of the 1995 October Household Survey, CSS, 1996:14).
22
The 1995 OHS, using estimates based on weights of the 1991 population census,found that there were approximately 5,4 million people in KwaZulu-Natal aged 15years or older. Of these, approximately 2,6 million said they were not economicallyactive, while about 2,7 million people said they were.
Of these economically active people, only 1,8 million (approximately 67%) said theywere gainfully employed, either in formal or informal work, while the remaining 33%said they were unemployed. Some were seeking work, while others were not.However, they were available for work, as discussed below.
The unemployed
Unemployment is one of the major crises facing the country.
At least two definitions are used in South Africa – the strict and theexpanded definition. Both definitions include people who are aged 15years or older, and who are not employed, but who are available forwork. But they differ from each other in the following way. Arequirement of the strict definition is that a given individual has takenspecific steps to seek employment in the four weeks prior to a givenpoint in time. The expanded definition focuses on the desire to work,and the availability for work irrespective of whether or not the personhas taken active steps to find work (Living in South Africa. Selectedfindings of the 1995 October Household Survey, CSS, 1996:15).
23
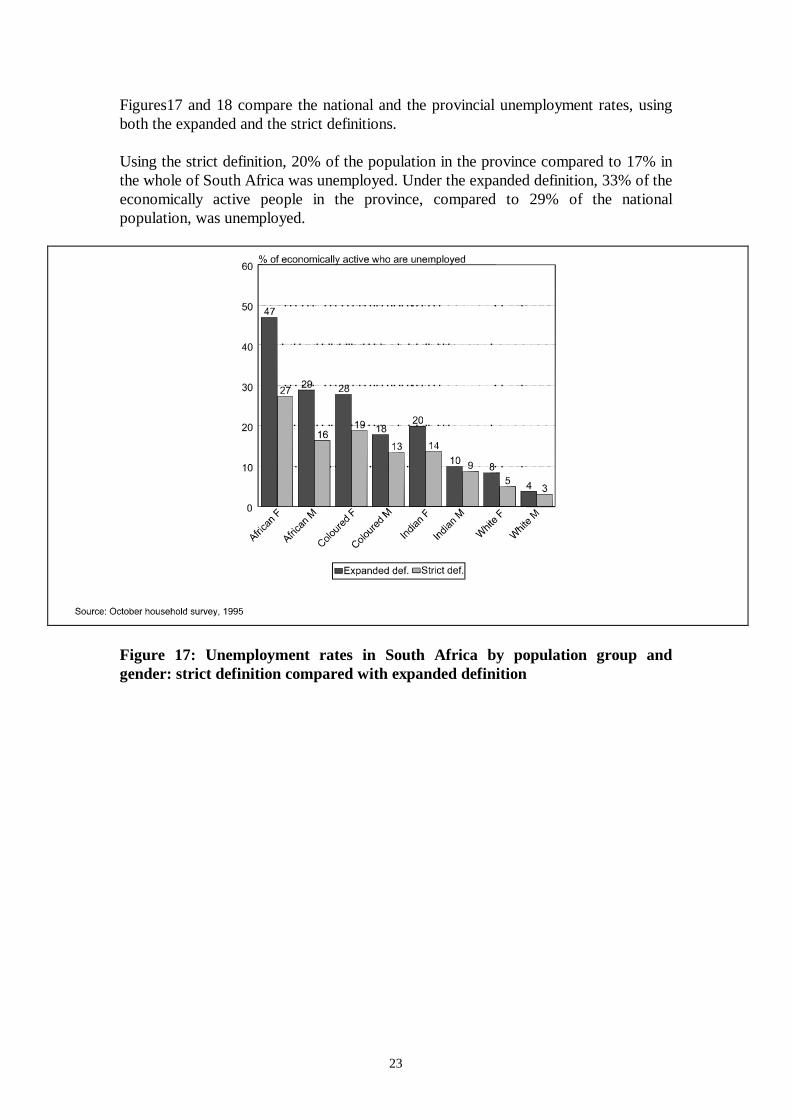
Figures17 and 18 compare the national and the provincial unemployment rates, usingboth the expanded and the strict definitions.
Using the strict definition, 20% of the population in the province compared to 17% inthe whole of South Africa was unemployed. Under the expanded definition, 33% of theeconomically active people in the province, compared to 29% of the nationalpopulation, was unemployed.
Figure 17: Unemployment rates in South Africa by population group andgender: strict definition compared with expanded definition
24
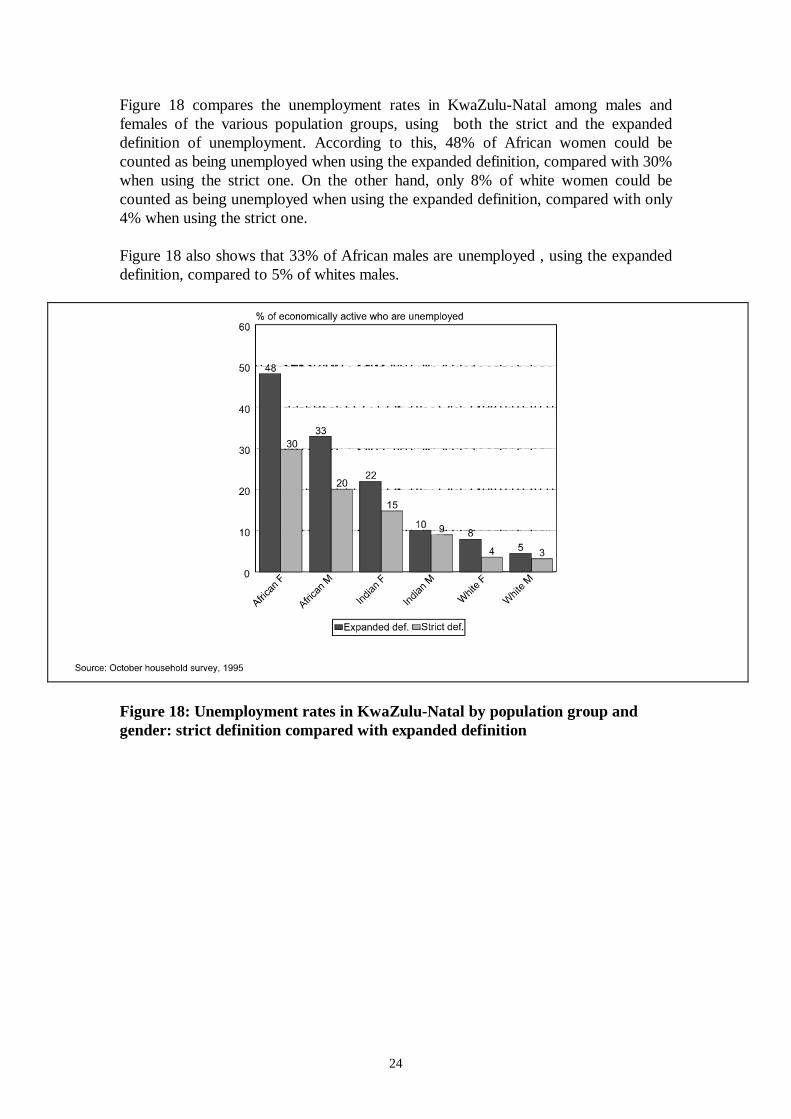
Figure 18 compares the unemployment rates in KwaZulu-Natal among males andfemales of the various population groups, using both the strict and the expandeddefinition of unemployment. According to this, 48% of African women could becounted as being unemployed when using the expanded definition, compared with 30%when using the strict one. On the other hand, only 8% of white women could becounted as being unemployed when using the expanded definition, compared with only4% when using the strict one.
Figure 18 also shows that 33% of African males are unemployed , using the expandeddefinition, compared to 5% of whites males.
Figure 18: Unemployment rates in KwaZulu-Natal by population group andgender: strict definition compared with expanded definition
25
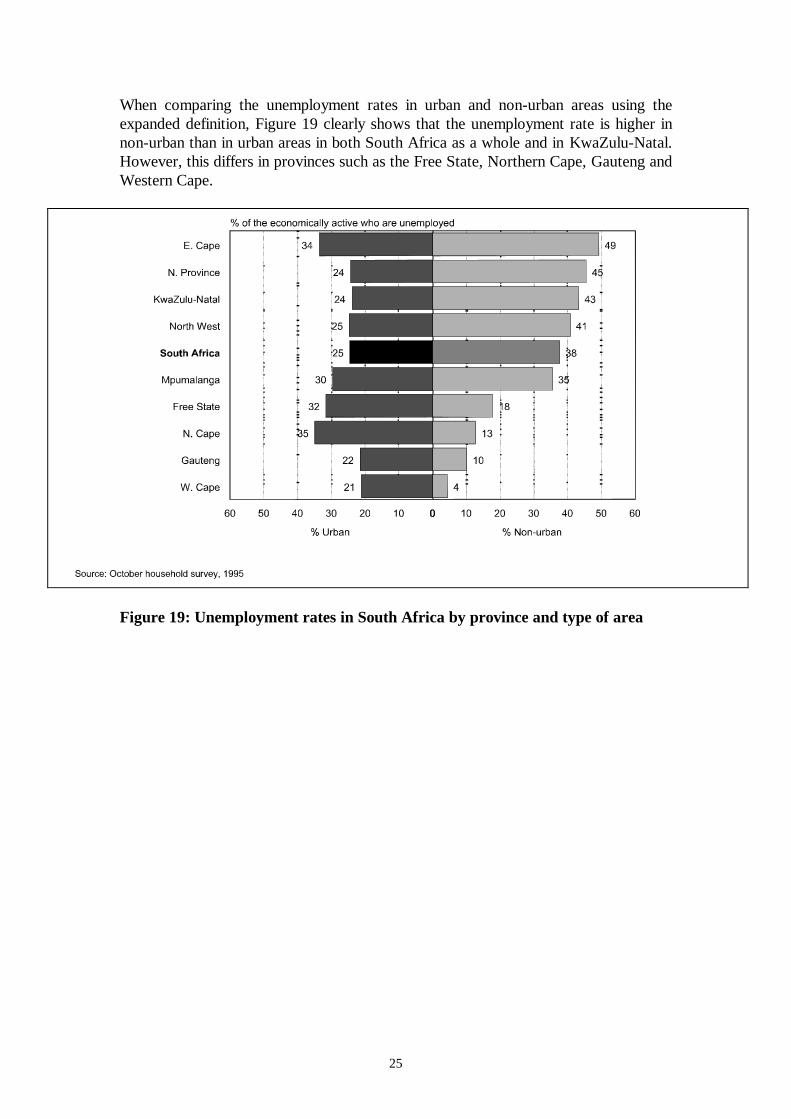
When comparing the unemployment rates in urban and non-urban areas using theexpanded definition, Figure 19 clearly shows that the unemployment rate is higher innon-urban than in urban areas in both South Africa as a whole and in KwaZulu-Natal.However, this differs in provinces such as the Free State, Northern Cape, Gauteng andWestern Cape.
Figure 19: Unemployment rates in South Africa by province and type of area
26
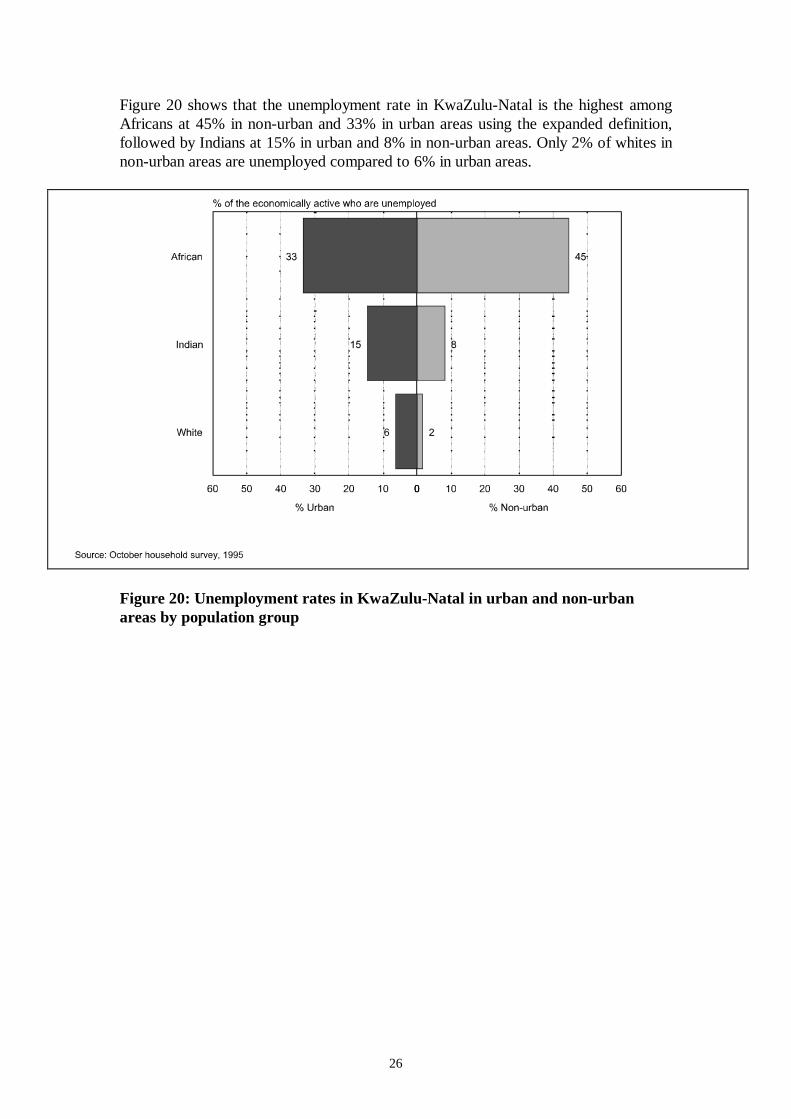
Figure 20 shows that the unemployment rate in KwaZulu-Natal is the highest amongAfricans at 45% in non-urban and 33% in urban areas using the expanded definition,followed by Indians at 15% in urban and 8% in non-urban areas. Only 2% of whites innon-urban areas are unemployed compared to 6% in urban areas.
Figure 20: Unemployment rates in KwaZulu-Natal in urban and non-urbanareas by population group
27
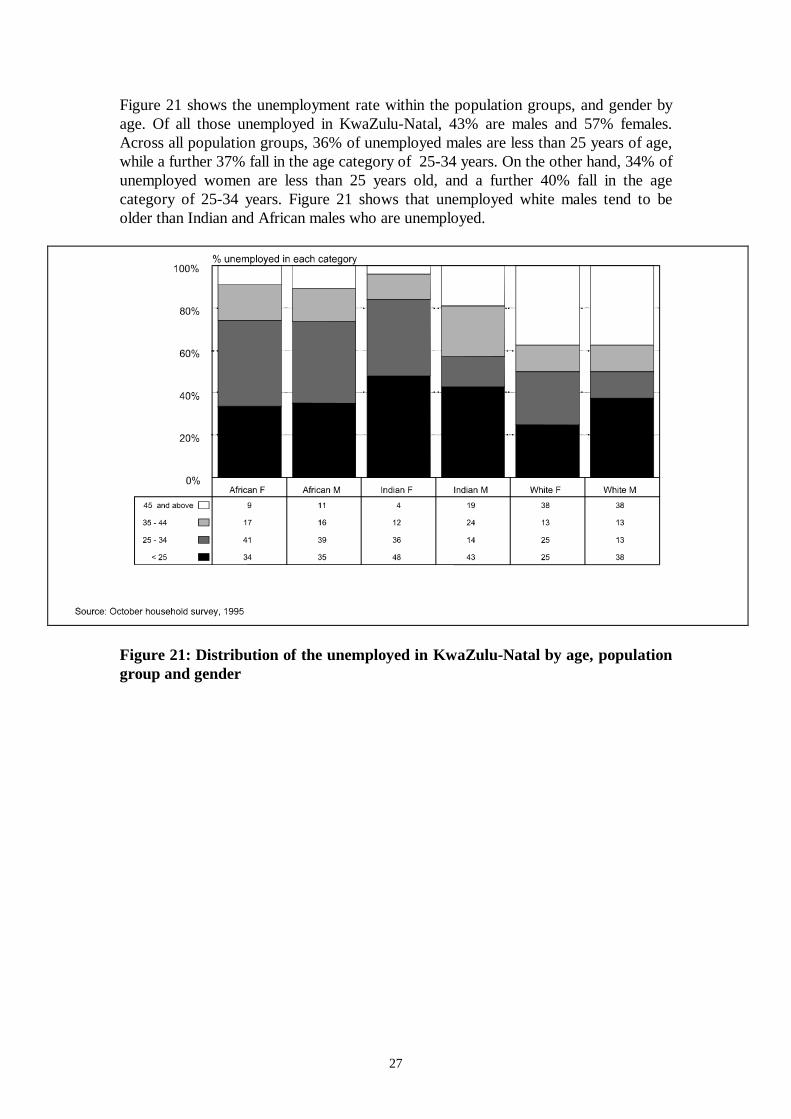
Figure 21 shows the unemployment rate within the population groups, and gender byage. Of all those unemployed in KwaZulu-Natal, 43% are males and 57% females.Across all population groups, 36% of unemployed males are less than 25 years of age,while a further 37% fall in the age category of 25-34 years. On the other hand, 34% ofunemployed women are less than 25 years old, and a further 40% fall in the agecategory of 25-34 years. Figure 21 shows that unemployed white males tend to beolder than Indian and African males who are unemployed.
Figure 21: Distribution of the unemployed in KwaZulu-Natal by age, populationgroup and gender
28
The employed
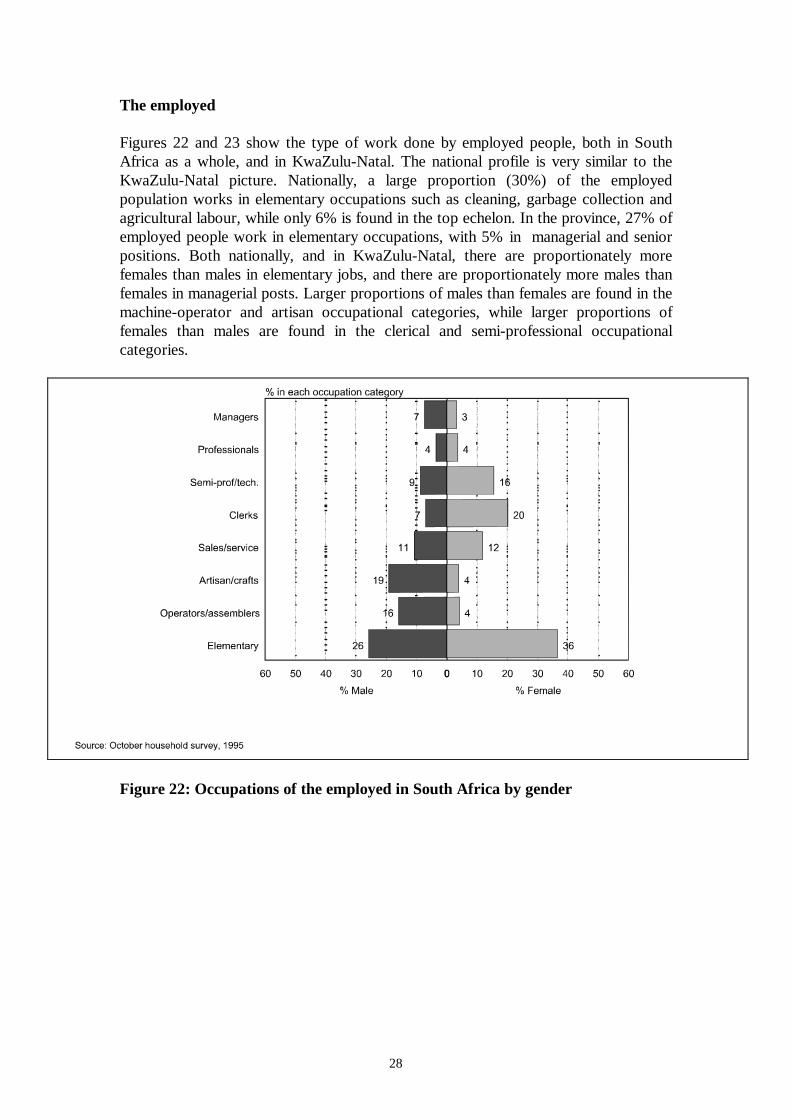
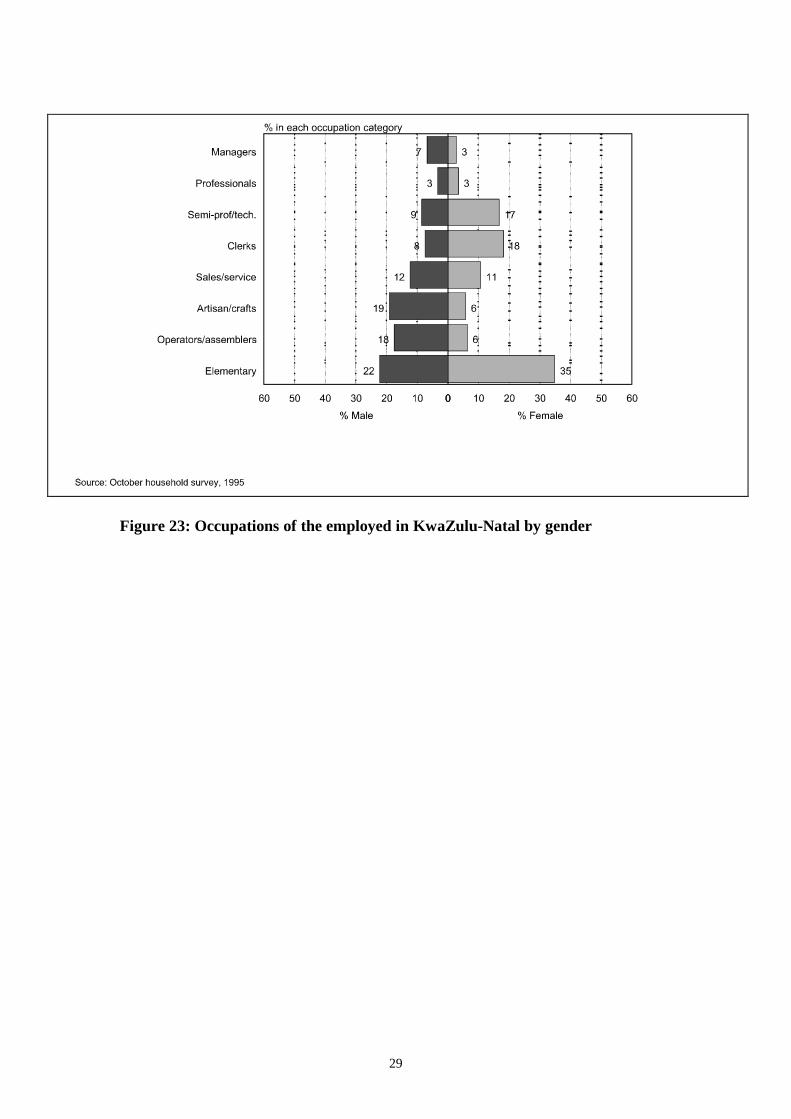
Figures 22 and 23 show the type of work done by employed people, both in SouthAfrica as a whole, and in KwaZulu-Natal. The national profile is very similar to theKwaZulu-Natal picture. Nationally, a large proportion (30%) of the employedpopulation works in elementary occupations such as cleaning, garbage collection andagricultural labour, while only 6% is found in the top echelon. In the province, 27% ofemployed people work in elementary occupations, with 5% in managerial and seniorpositions. Both nationally, and in KwaZulu-Natal, there are proportionately morefemales than males in elementary jobs, and there are proportionately more males thanfemales in managerial posts. Larger proportions of males than females are found in themachine-operator and artisan occupational categories, while larger proportions offemales than males are found in the clerical and semi-professional occupationalcategories.
Figure 22: Occupations of the employed in South Africa by gender
29
Figure 23: Occupations of the employed in KwaZulu-Natal by gender
30
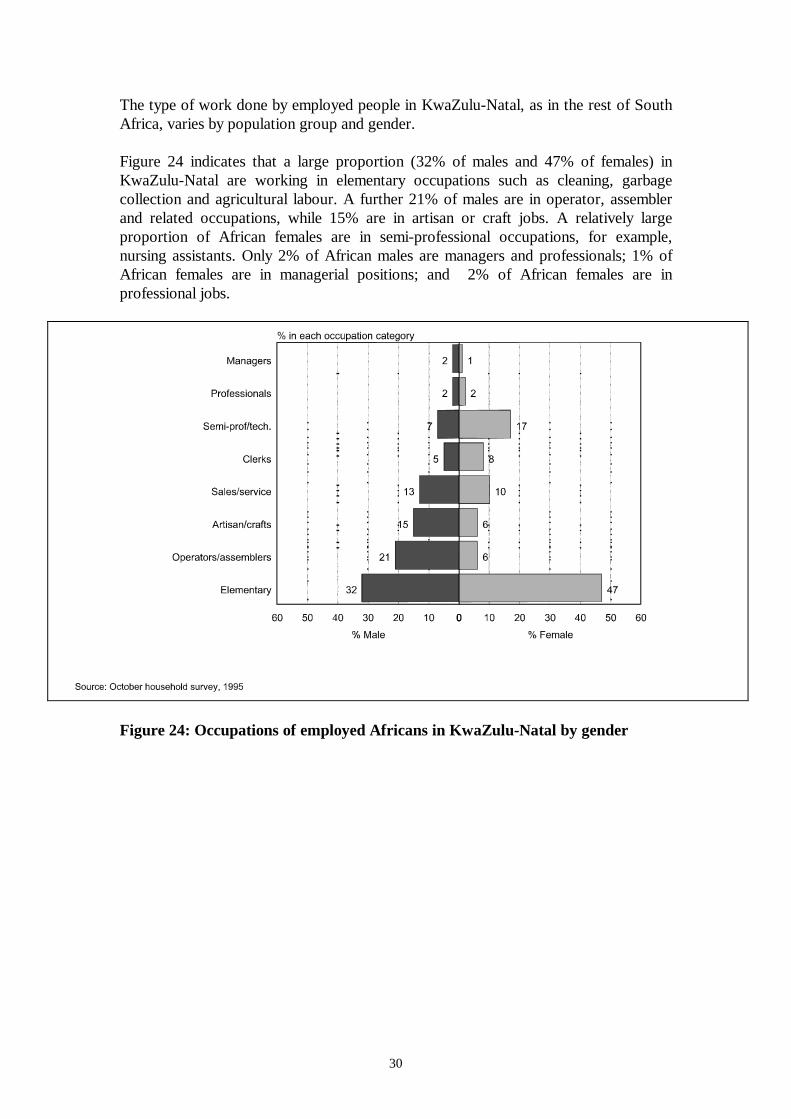
The type of work done by employed people in KwaZulu-Natal, as in the rest of SouthAfrica, varies by population group and gender.
Figure 24 indicates that a large proportion (32% of males and 47% of females) inKwaZulu-Natal are working in elementary occupations such as cleaning, garbagecollection and agricultural labour. A further 21% of males are in operator, assemblerand related occupations, while 15% are in artisan or craft jobs. A relatively largeproportion of African females are in semi-professional occupations, for example,nursing assistants. Only 2% of African males are managers and professionals; 1% ofAfrican females are in managerial positions; and 2% of African females are inprofessional jobs.
Figure 24: Occupations of employed Africans in KwaZulu-Natal by gender
31
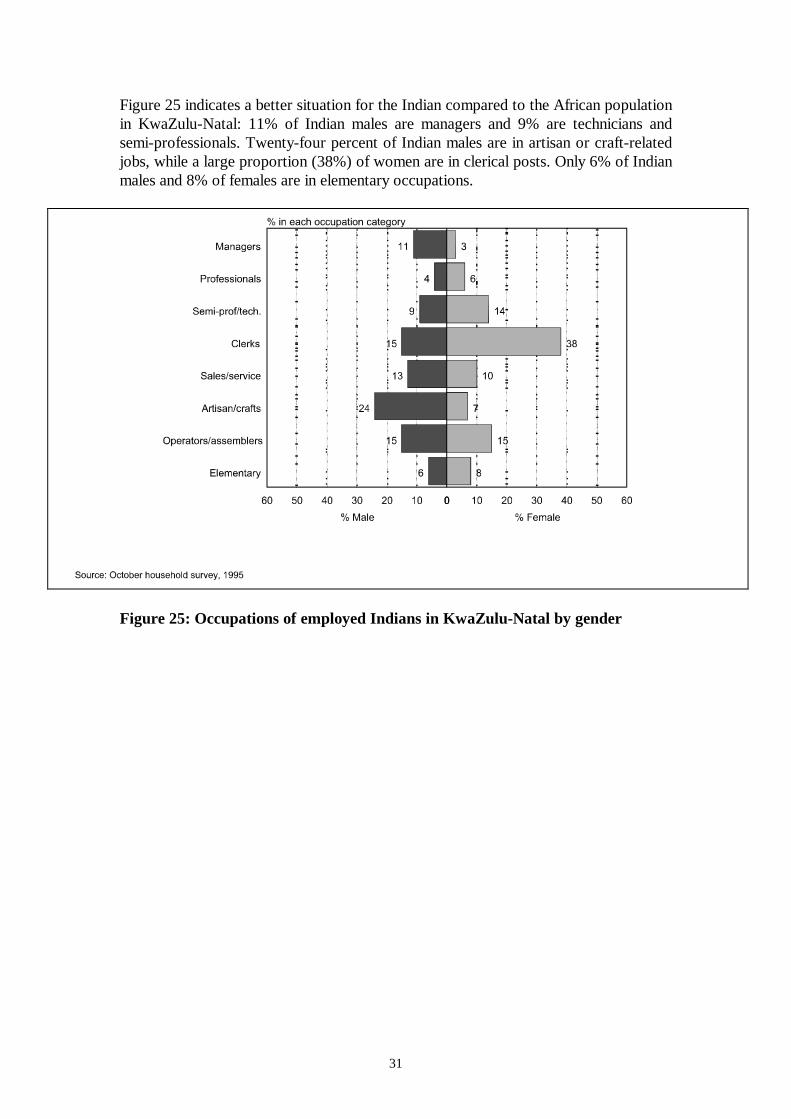
Figure 25 indicates a better situation for the Indian compared to the African populationin KwaZulu-Natal: 11% of Indian males are managers and 9% are technicians andsemi-professionals. Twenty-four percent of Indian males are in artisan or craft-relatedjobs, while a large proportion (38%) of women are in clerical posts. Only 6% of Indianmales and 8% of females are in elementary occupations.
Figure 25: Occupations of employed Indians in KwaZulu-Natal by gender
32
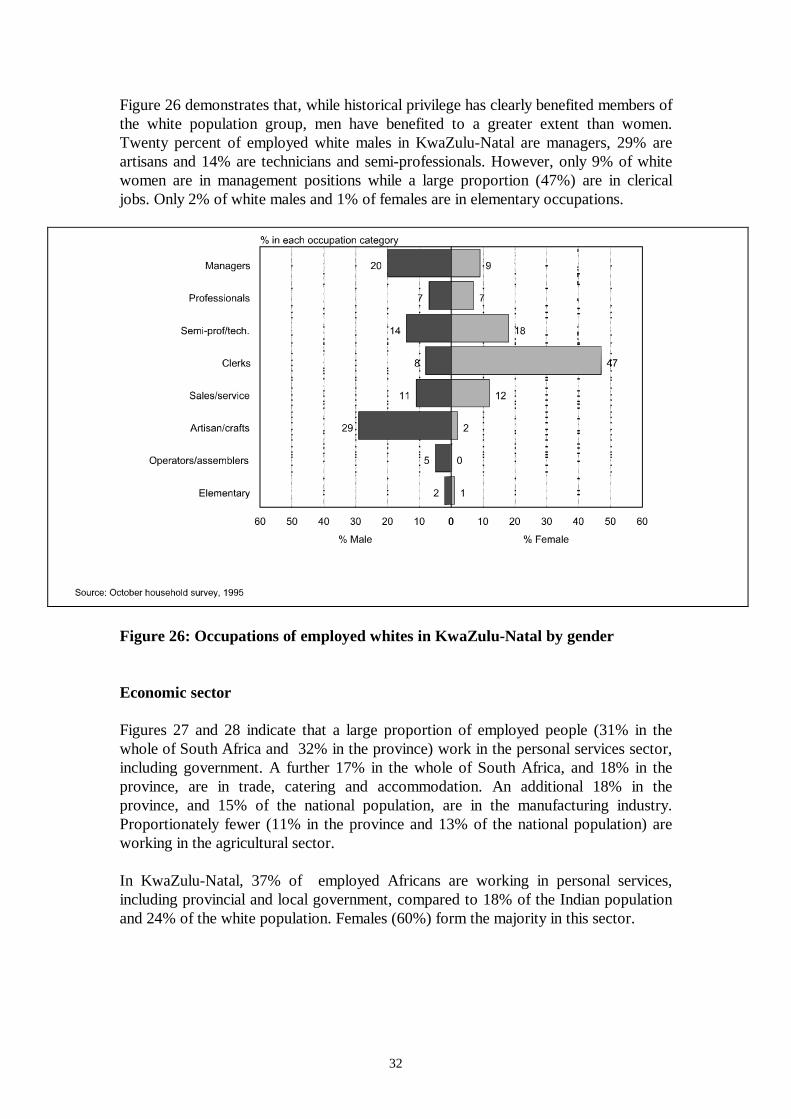
Figure 26 demonstrates that, while historical privilege has clearly benefited members ofthe white population group, men have benefited to a greater extent than women.Twenty percent of employed white males in KwaZulu-Natal are managers, 29% areartisans and 14% are technicians and semi-professionals. However, only 9% of whitewomen are in management positions while a large proportion (47%) are in clericaljobs. Only 2% of white males and 1% of females are in elementary occupations.
Figure 26: Occupations of employed whites in KwaZulu-Natal by gender
Economic sector
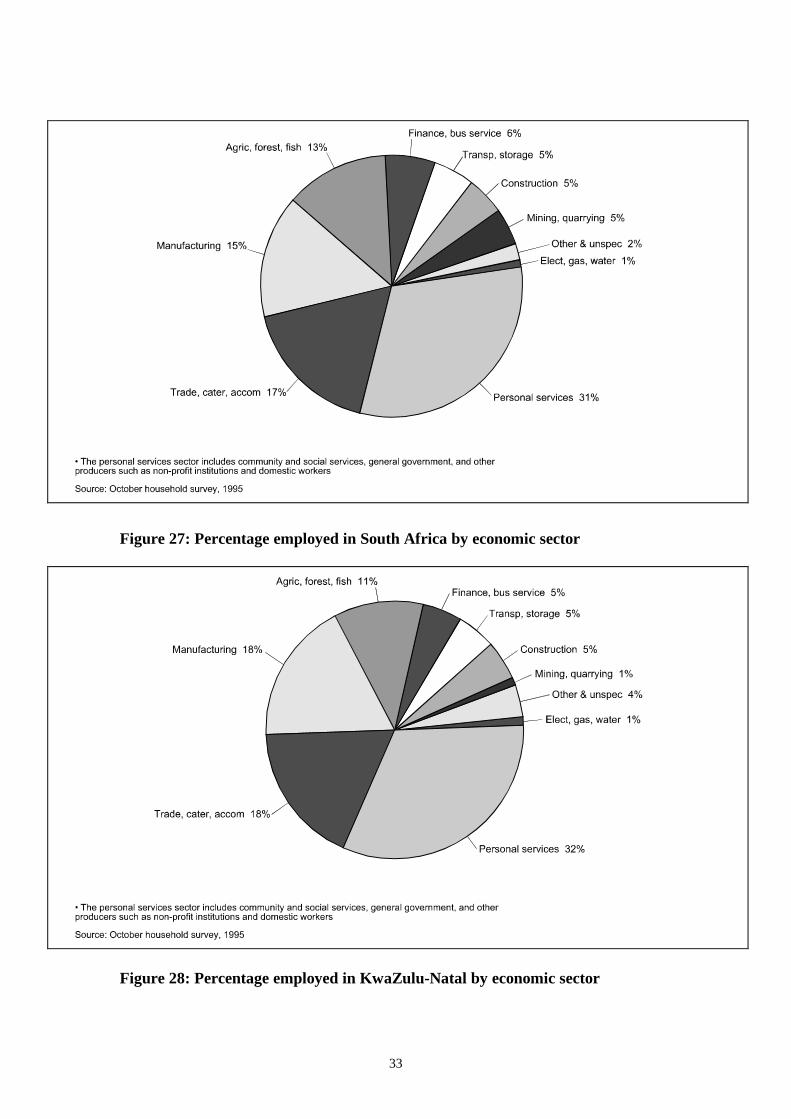
Figures 27 and 28 indicate that a large proportion of employed people (31% in thewhole of South Africa and 32% in the province) work in the personal services sector,including government. A further 17% in the whole of South Africa, and 18% in theprovince, are in trade, catering and accommodation. An additional 18% in theprovince, and 15% of the national population, are in the manufacturing industry.Proportionately fewer (11% in the province and 13% of the national population) areworking in the agricultural sector.
In KwaZulu-Natal, 37% of employed Africans are working in personal services,including provincial and local government, compared to 18% of the Indian populationand 24% of the white population. Females (60%) form the majority in this sector.
33
Figure 27: Percentage employed in South Africa by economic sector
Figure 28: Percentage employed in KwaZulu-Natal by economic sector
34
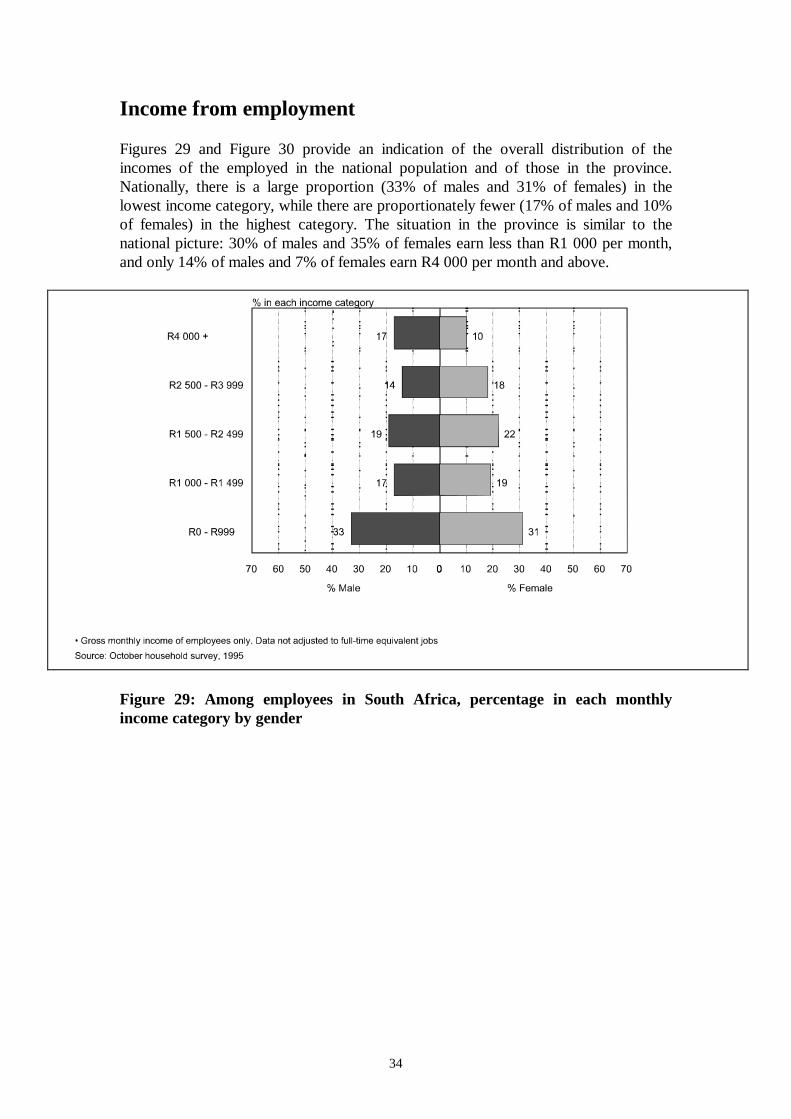
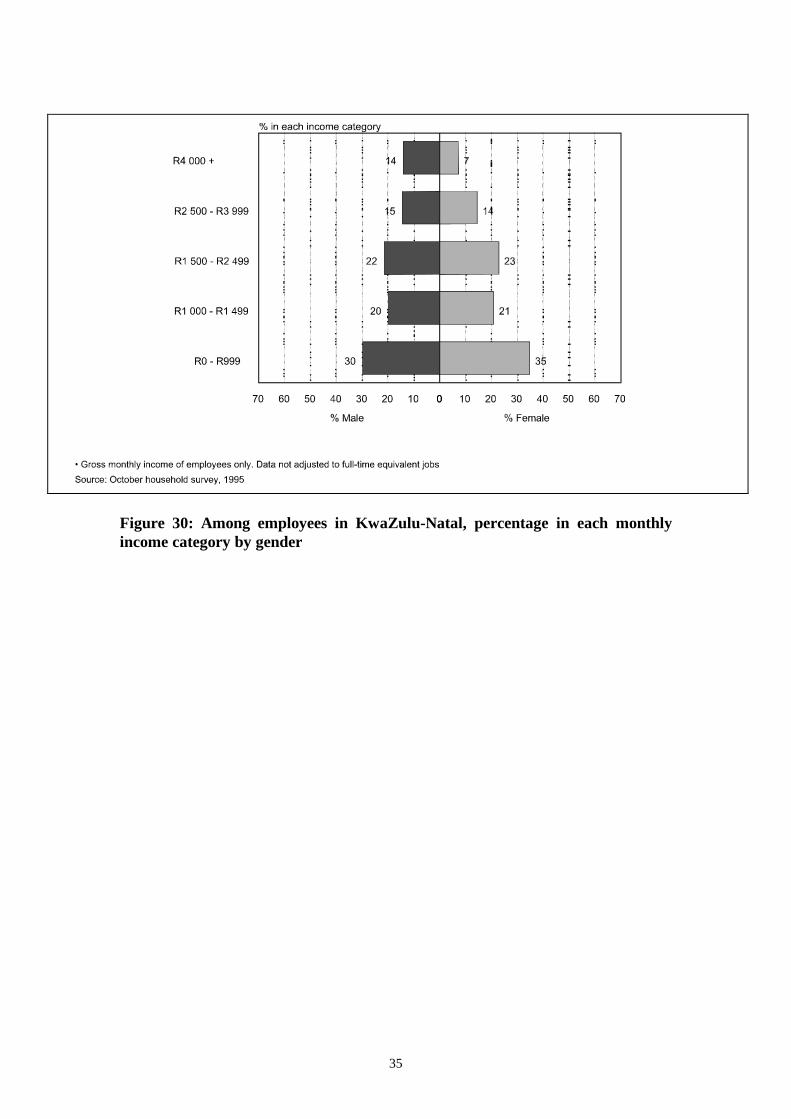
Income from employment
Figures 29 and Figure 30 provide an indication of the overall distribution of theincomes of the employed in the national population and of those in the province.Nationally, there is a large proportion (33% of males and 31% of females) in thelowest income category, while there are proportionately fewer (17% of males and 10%of females) in the highest category. The situation in the province is similar to thenational picture: 30% of males and 35% of females earn less than R1 000 per month,and only 14% of males and 7% of females earn R4 000 per month and above.
Figure 29: Among employees in South Africa, percentage in each monthlyincome category by gender
35
Figure 30: Among employees in KwaZulu-Natal, percentage in each monthlyincome category by gender
36
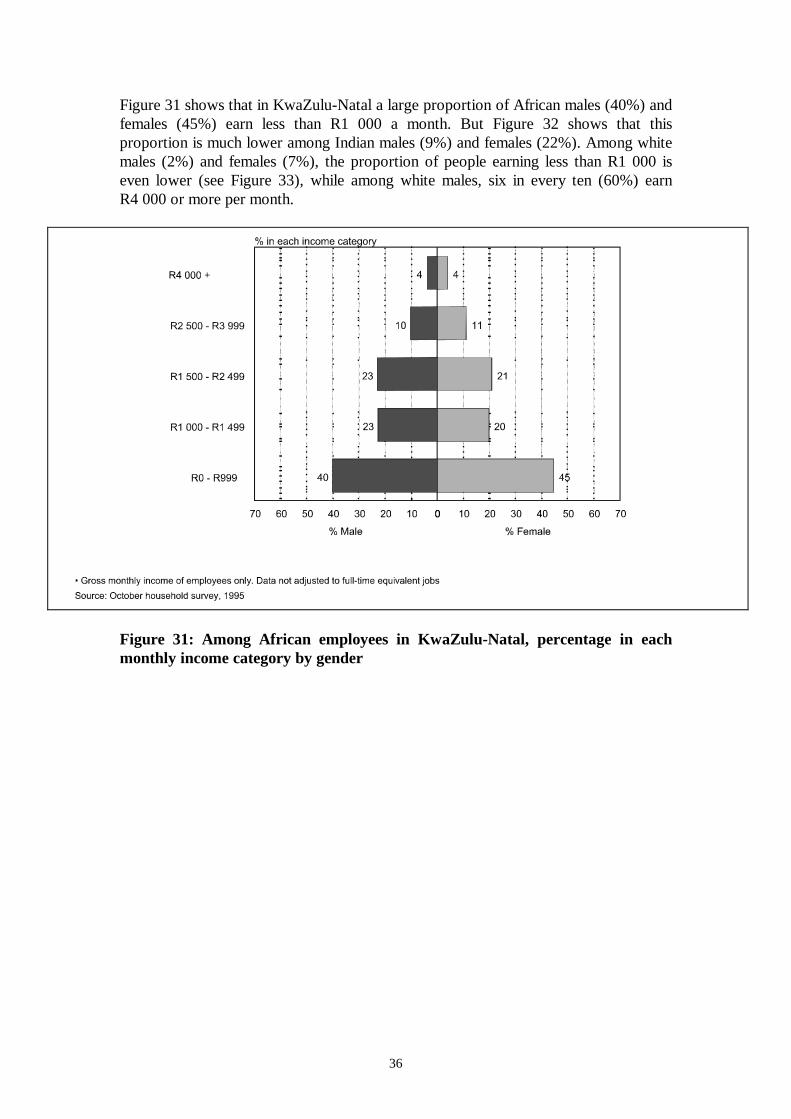
Figure 31 shows that in KwaZulu-Natal a large proportion of African males (40%) andfemales (45%) earn less than R1 000 a month. But Figure 32 shows that thisproportion is much lower among Indian males (9%) and females (22%). Among whitemales (2%) and females (7%), the proportion of people earning less than R1 000 iseven lower (see Figure 33), while among white males, six in every ten (60%) earnR4 000 or more per month.
Figure 31: Among African employees in KwaZulu-Natal, percentage in eachmonthly income category by gender
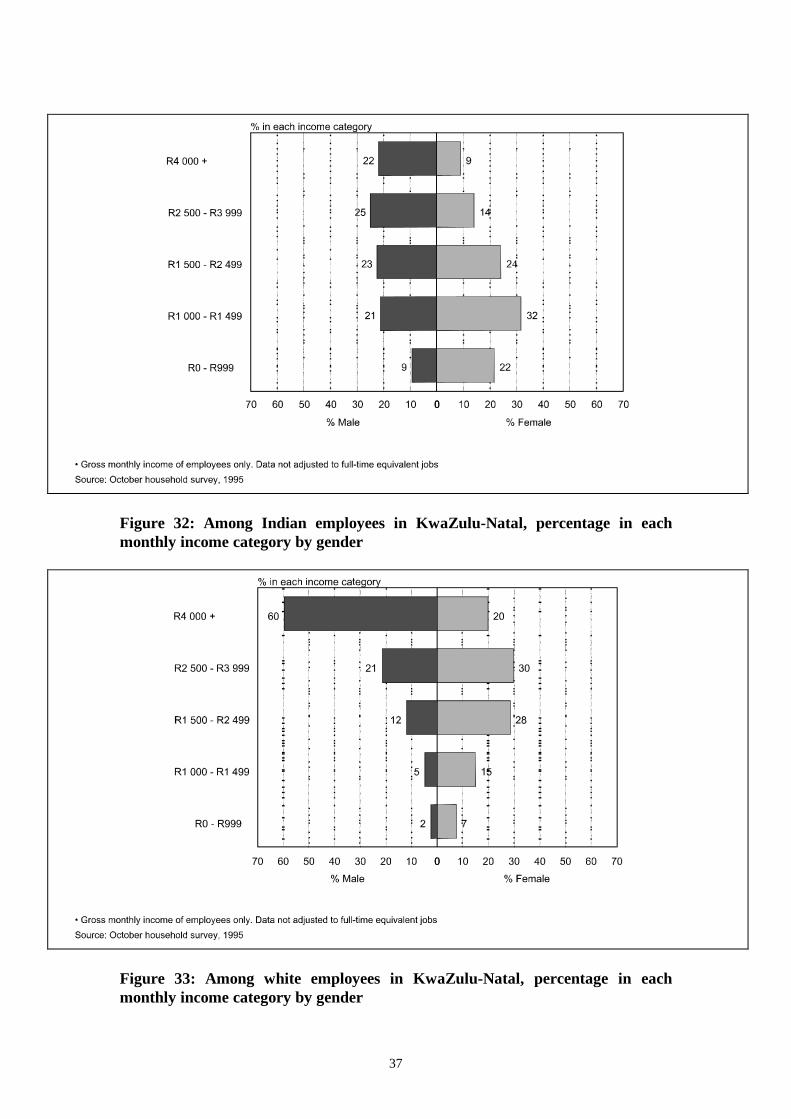
37
Figure 32: Among Indian employees in KwaZulu-Natal, percentage in eachmonthly income category by gender
Figure 33: Among white employees in KwaZulu-Natal, percentage in eachmonthly income category by gender
38
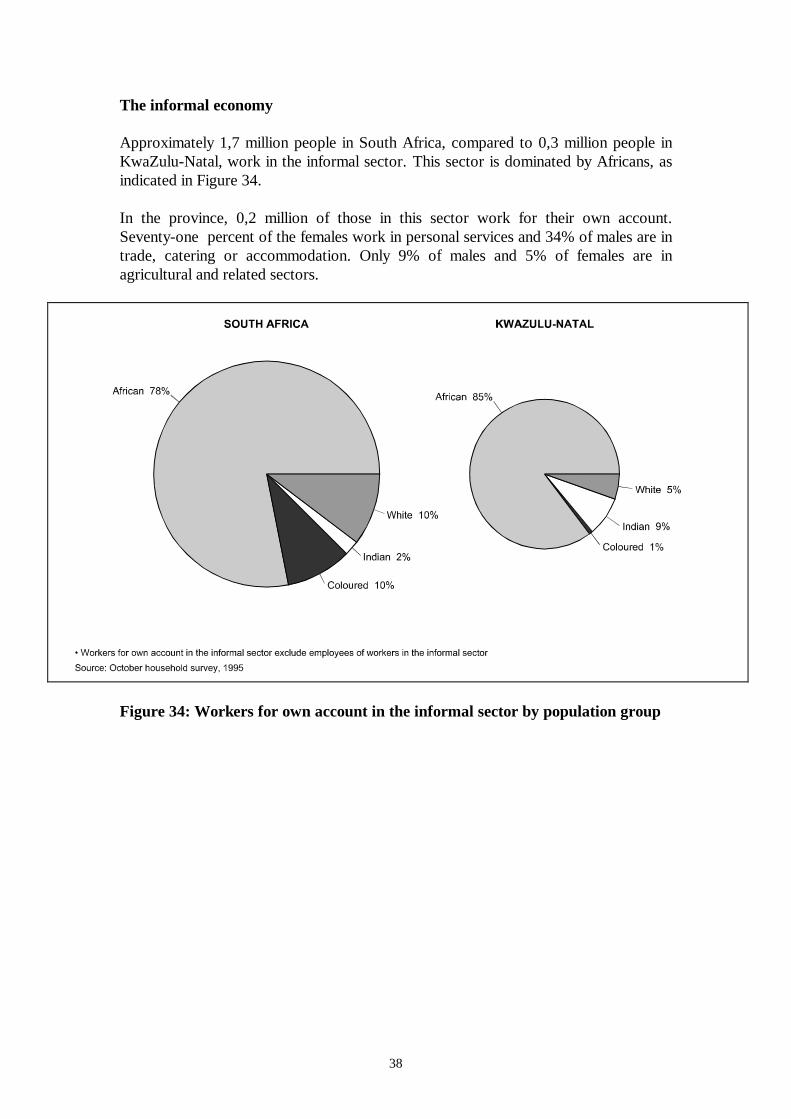
The informal economy
Approximately 1,7 million people in South Africa, compared to 0,3 million people inKwaZulu-Natal, work in the informal sector. This sector is dominated by Africans, asindicated in Figure 34.
In the province, 0,2 million of those in this sector work for their own account.Seventy-one percent of the females work in personal services and 34% of males are intrade, catering or accommodation. Only 9% of males and 5% of females are inagricultural and related sectors.
Figure 34: Workers for own account in the informal sector by population group
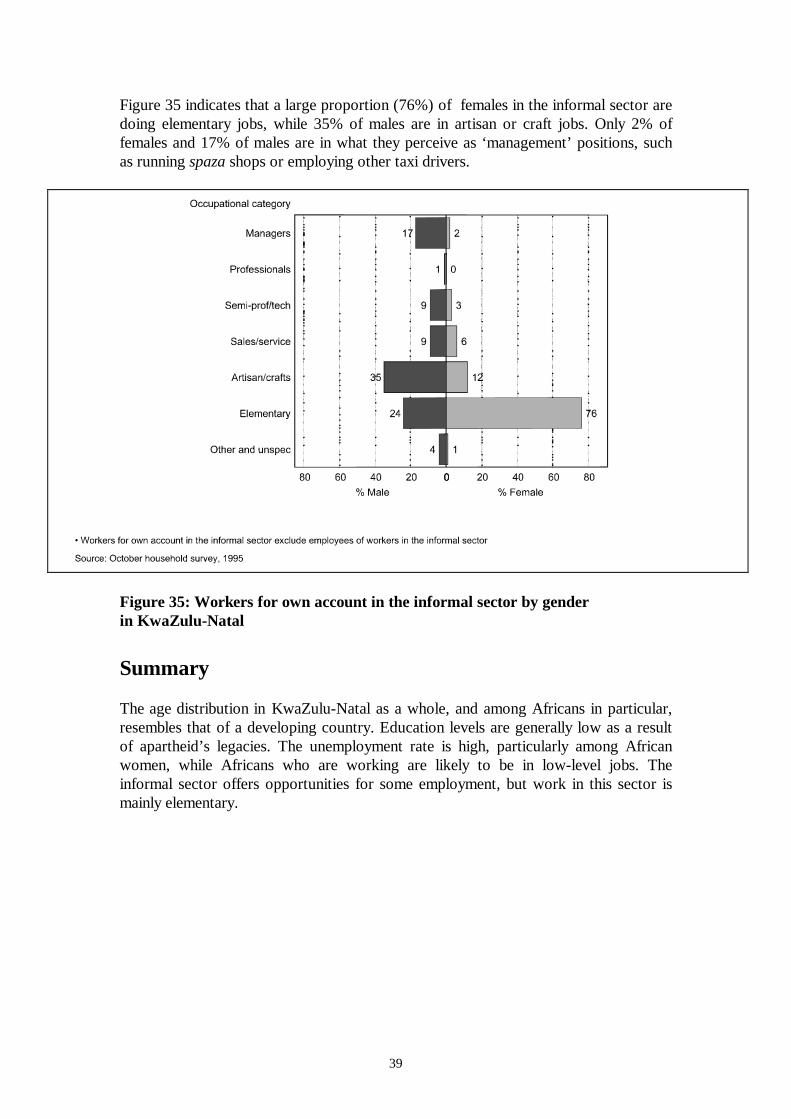
39
Figure 35 indicates that a large proportion (76%) of females in the informal sector aredoing elementary jobs, while 35% of males are in artisan or craft jobs. Only 2% offemales and 17% of males are in what they perceive as ‘management’ positions, suchas running spaza shops or employing other taxi drivers.
Figure 35: Workers for own account in the informal sector by genderin KwaZulu-Natal
Summary
The age distribution in KwaZulu-Natal as a whole, and among Africans in particular,resembles that of a developing country. Education levels are generally low as a resultof apartheid’s legacies. The unemployment rate is high, particularly among Africanwomen, while Africans who are working are likely to be in low-level jobs. Theinformal sector offers opportunities for some employment, but work in this sector ismainly elementary.

PLEASE TURN THE PAGE
41
Section 3The main findings regarding households
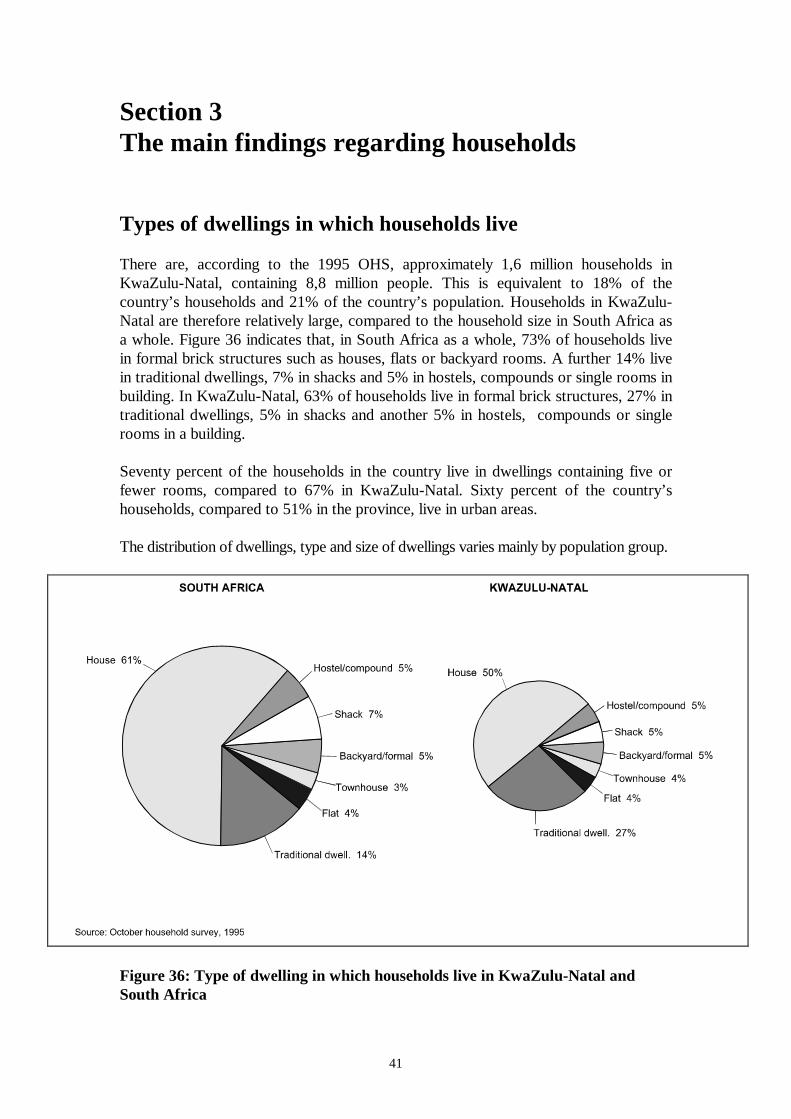
Types of dwellings in which households live
There are, according to the 1995 OHS, approximately 1,6 million households inKwaZulu-Natal, containing 8,8 million people. This is equivalent to 18% of thecountry’s households and 21% of the country’s population. Households in KwaZulu-Natal are therefore relatively large, compared to the household size in South Africa asa whole. Figure 36 indicates that, in South Africa as a whole, 73% of households livein formal brick structures such as houses, flats or backyard rooms. A further 14% livein traditional dwellings, 7% in shacks and 5% in hostels, compounds or single rooms inbuilding. In KwaZulu-Natal, 63% of households live in formal brick structures, 27% intraditional dwellings, 5% in shacks and another 5% in hostels, compounds or singlerooms in a building.
Seventy percent of the households in the country live in dwellings containing five orfewer rooms, compared to 67% in KwaZulu-Natal. Sixty percent of the country’shouseholds, compared to 51% in the province, live in urban areas.
The distribution of dwellings, type and size of dwellings varies mainly by population group.
Figure 36: Type of dwelling in which households live in KwaZulu-Natal andSouth Africa
42
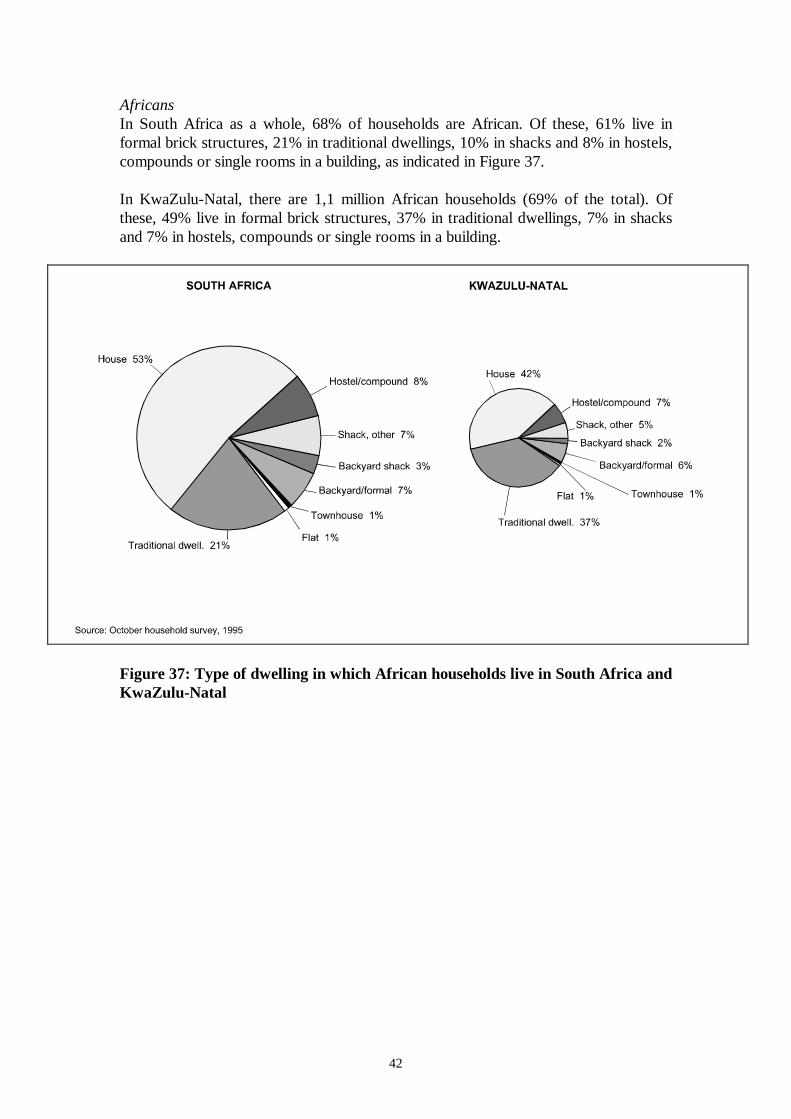
AfricansIn South Africa as a whole, 68% of households are African. Of these, 61% live informal brick structures, 21% in traditional dwellings, 10% in shacks and 8% in hostels,compounds or single rooms in a building, as indicated in Figure 37.
In KwaZulu-Natal, there are 1,1 million African households (69% of the total). Ofthese, 49% live in formal brick structures, 37% in traditional dwellings, 7% in shacksand 7% in hostels, compounds or single rooms in a building.
Figure 37: Type of dwelling in which African households live in South Africa andKwaZulu-Natal
43
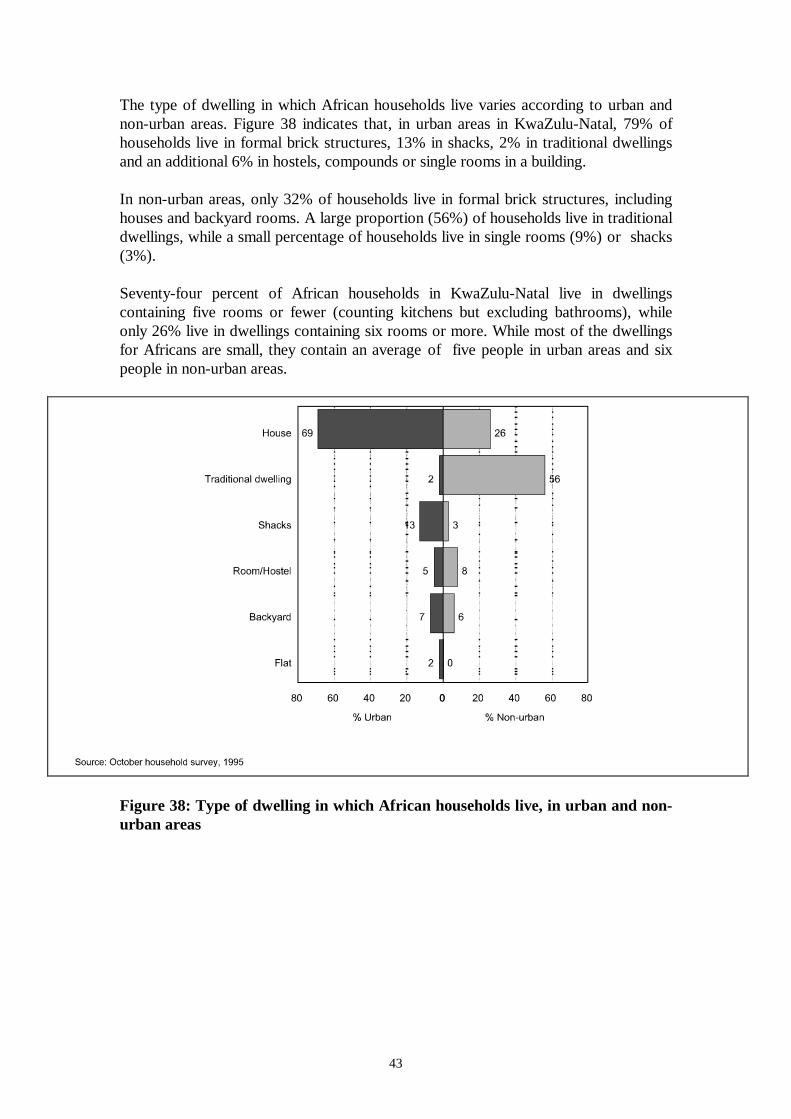
The type of dwelling in which African households live varies according to urban andnon-urban areas. Figure 38 indicates that, in urban areas in KwaZulu-Natal, 79% ofhouseholds live in formal brick structures, 13% in shacks, 2% in traditional dwellingsand an additional 6% in hostels, compounds or single rooms in a building.
In non-urban areas, only 32% of households live in formal brick structures, includinghouses and backyard rooms. A large proportion (56%) of households live in traditionaldwellings, while a small percentage of households live in single rooms (9%) or shacks(3%).
Seventy-four percent of African households in KwaZulu-Natal live in dwellingscontaining five rooms or fewer (counting kitchens but excluding bathrooms), whileonly 26% live in dwellings containing six rooms or more. While most of the dwellingsfor Africans are small, they contain an average of five people in urban areas and sixpeople in non-urban areas.
Figure 38: Type of dwelling in which African households live, in urban and non-urban areas
44
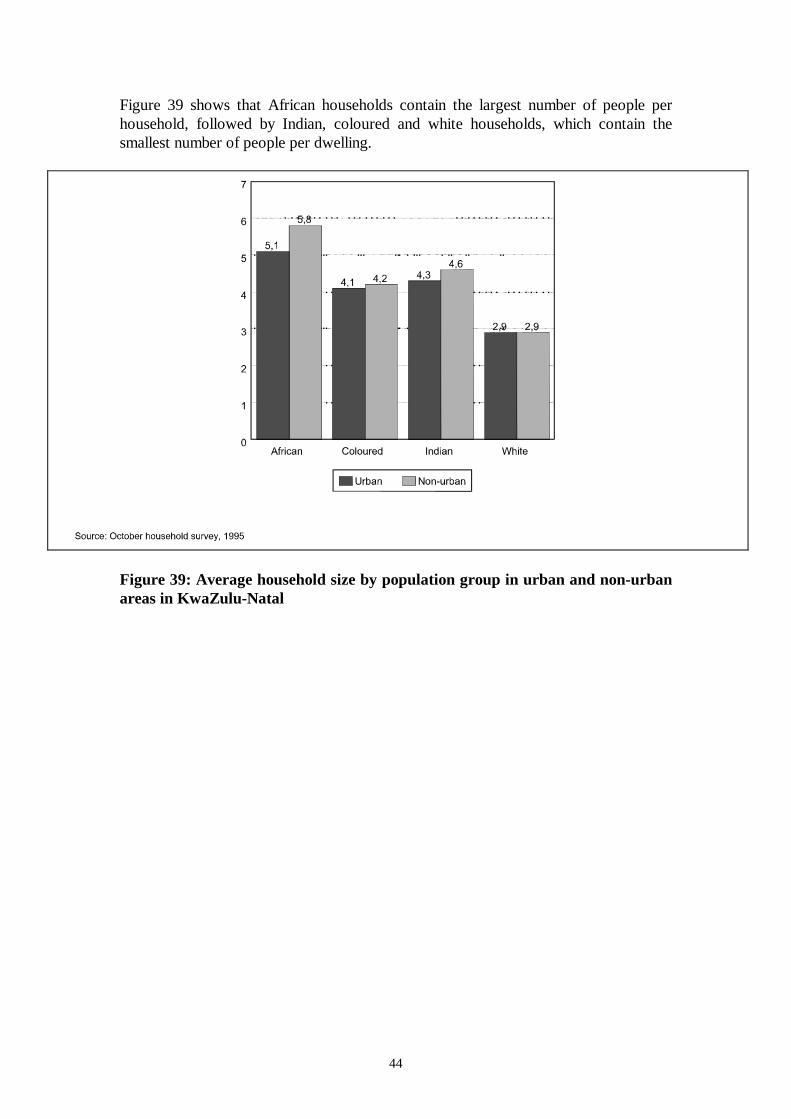
Figure 39 shows that African households contain the largest number of people perhousehold, followed by Indian, coloured and white households, which contain thesmallest number of people per dwelling.
Figure 39: Average household size by population group in urban and non-urbanareas in KwaZulu-Natal
45
IndiansThere were approximately 0,2 million Indian households containing 0,8 million peoplein KwaZulu-Natal during October 1995. Almost all of these households live in formalbrick structures. Ninety-five percent are in urban areas, of which 61% live in dwellingscontaining five rooms or fewer while the remaining 39% live in dwellings containingsix rooms or more.
While most of the households in non-urban areas live in dwellings containing five orfewer rooms, they contain an average of five people compared to four in urban areas.
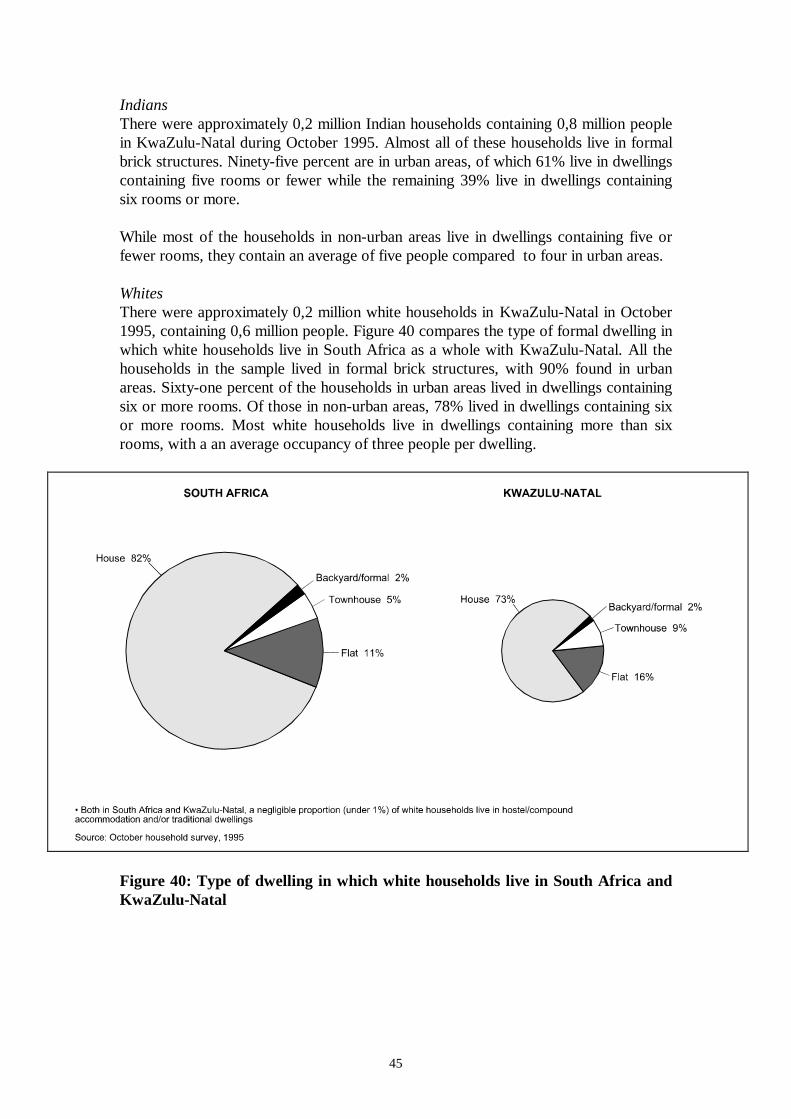
WhitesThere were approximately 0,2 million white households in KwaZulu-Natal in October1995, containing 0,6 million people. Figure 40 compares the type of formal dwelling inwhich white households live in South Africa as a whole with KwaZulu-Natal. All thehouseholds in the sample lived in formal brick structures, with 90% found in urbanareas. Sixty-one percent of the households in urban areas lived in dwellings containingsix or more rooms. Of those in non-urban areas, 78% lived in dwellings containing sixor more rooms. Most white households live in dwellings containing more than sixrooms, with a an average occupancy of three people per dwelling.
Figure 40: Type of dwelling in which white households live in South Africa andKwaZulu-Natal
46
Access to facilities and services
In comparing access to facilities and services such as electricity and piped tap water inthe dwelling, both population group differences and urban/non-urban discrepancies arenoteworthy. This is so both for KwaZulu-Natal and the country as a whole.
Access to electricity
Electricity for lighting, cooking and heating is unevenly distributed by populationgroup, both nationally and in KwaZulu-Natal.
As far as electricity for lighting is concerned, 51% of the African households in thecountry as a whole use this source of energy, as against 84% of coloured and 99% ofIndian and white households.
In KwaZulu-Natal, however, 43% of African households use electricity for lighting,compared to 99% of Indian and 100% of white households.
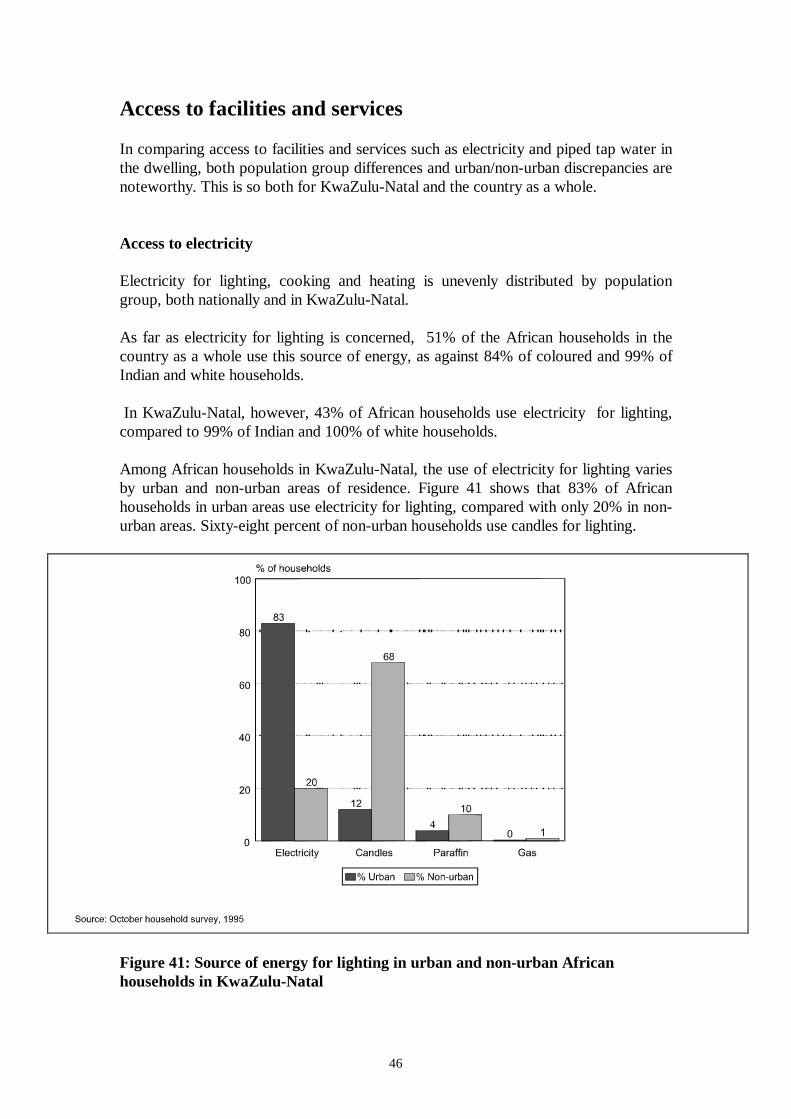
Among African households in KwaZulu-Natal, the use of electricity for lighting variesby urban and non-urban areas of residence. Figure 41 shows that 83% of Africanhouseholds in urban areas use electricity for lighting, compared with only 20% in non-urban areas. Sixty-eight percent of non-urban households use candles for lighting.
Figure 41: Source of energy for lighting in urban and non-urban Africanhouseholds in KwaZulu-Natal
47
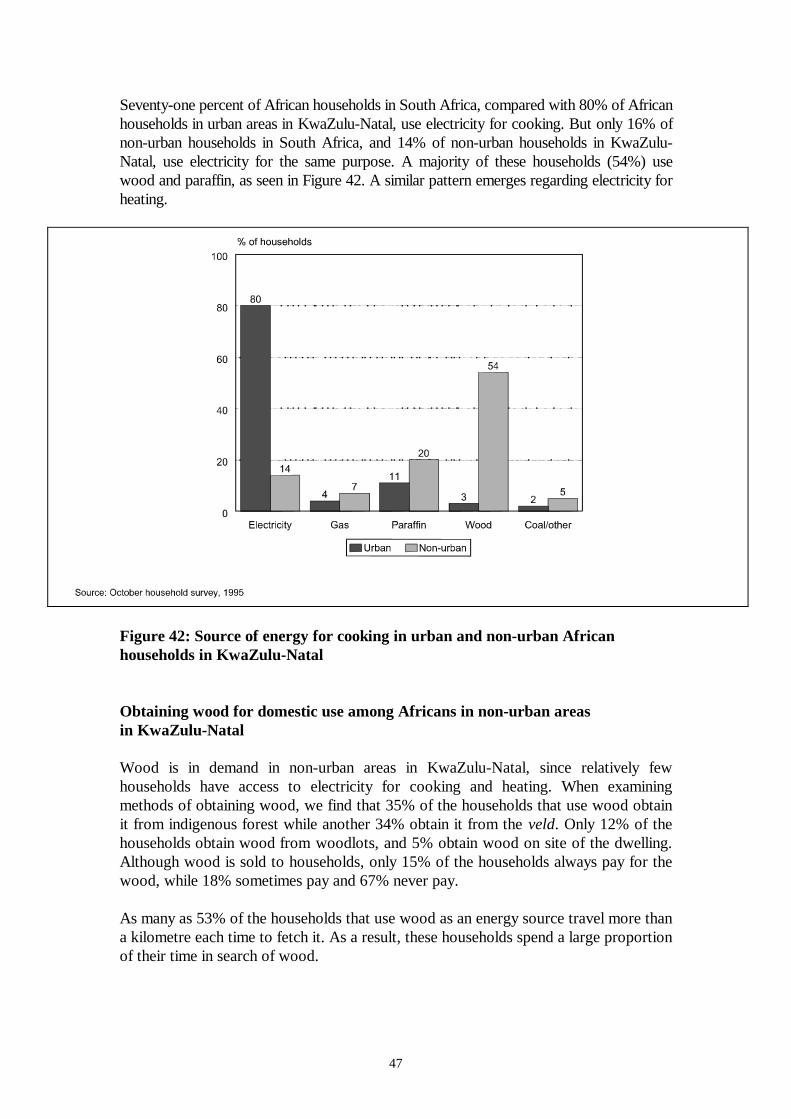
Seventy-one percent of African households in South Africa, compared with 80% of Africanhouseholds in urban areas in KwaZulu-Natal, use electricity for cooking. But only 16% ofnon-urban households in South Africa, and 14% of non-urban households in KwaZulu-Natal, use electricity for the same purpose. A majority of these households (54%) usewood and paraffin, as seen in Figure 42. A similar pattern emerges regarding electricity forheating.
Figure 42: Source of energy for cooking in urban and non-urban Africanhouseholds in KwaZulu-Natal
Obtaining wood for domestic use among Africans in non-urban areasin KwaZulu-Natal
Wood is in demand in non-urban areas in KwaZulu-Natal, since relatively fewhouseholds have access to electricity for cooking and heating. When examiningmethods of obtaining wood, we find that 35% of the households that use wood obtainit from indigenous forest while another 34% obtain it from the veld. Only 12% of thehouseholds obtain wood from woodlots, and 5% obtain wood on site of the dwelling.Although wood is sold to households, only 15% of the households always pay for thewood, while 18% sometimes pay and 67% never pay.
As many as 53% of the households that use wood as an energy source travel more thana kilometre each time to fetch it. As a result, these households spend a large proportionof their time in search of wood.
48
Water for drinking
While water is essential for survival, only 33% of African households have running tapwater inside the dwelling for drinking purposes, compared with 72% of coloured and97% of both Indian and white households in the whole of South Africa.
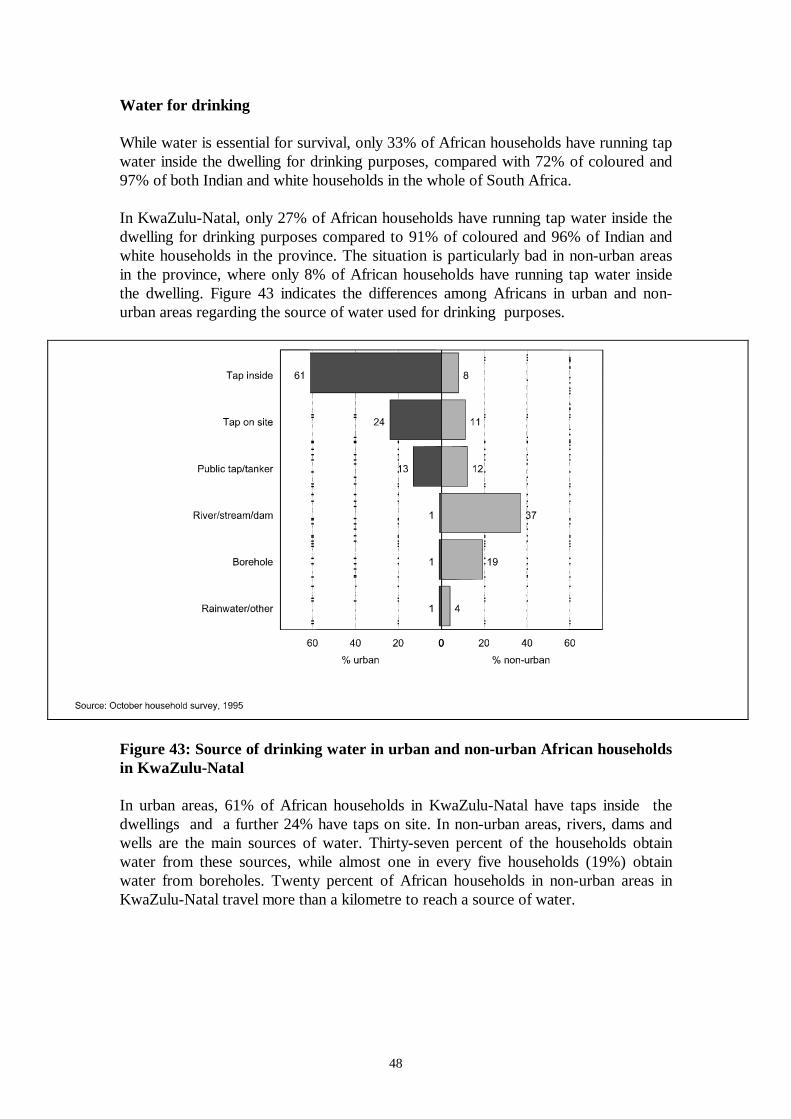
In KwaZulu-Natal, only 27% of African households have running tap water inside thedwelling for drinking purposes compared to 91% of coloured and 96% of Indian andwhite households in the province. The situation is particularly bad in non-urban areasin the province, where only 8% of African households have running tap water insidethe dwelling. Figure 43 indicates the differences among Africans in urban and non-urban areas regarding the source of water used for drinking purposes.
Figure 43: Source of drinking water in urban and non-urban African householdsin KwaZulu-Natal
In urban areas, 61% of African households in KwaZulu-Natal have taps inside thedwellings and a further 24% have taps on site. In non-urban areas, rivers, dams andwells are the main sources of water. Thirty-seven percent of the households obtainwater from these sources, while almost one in every five households (19%) obtainwater from boreholes. Twenty percent of African households in non-urban areas inKwaZulu-Natal travel more than a kilometre to reach a source of water.
49
Sanitation
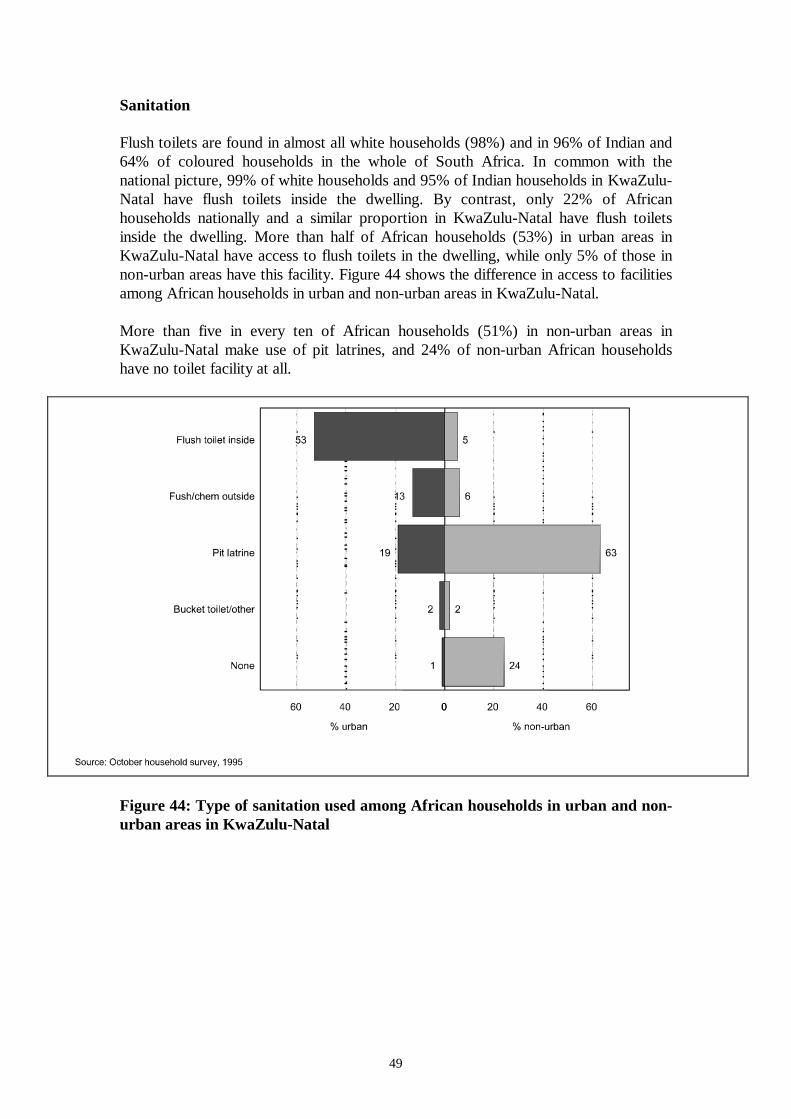
Flush toilets are found in almost all white households (98%) and in 96% of Indian and64% of coloured households in the whole of South Africa. In common with thenational picture, 99% of white households and 95% of Indian households in KwaZulu-Natal have flush toilets inside the dwelling. By contrast, only 22% of Africanhouseholds nationally and a similar proportion in KwaZulu-Natal have flush toiletsinside the dwelling. More than half of African households (53%) in urban areas inKwaZulu-Natal have access to flush toilets in the dwelling, while only 5% of those innon-urban areas have this facility. Figure 44 shows the difference in access to facilitiesamong African households in urban and non-urban areas in KwaZulu-Natal.
More than five in every ten of African households (51%) in non-urban areas inKwaZulu-Natal make use of pit latrines, and 24% of non-urban African householdshave no toilet facility at all.
Figure 44: Type of sanitation used among African households in urban and non-urban areas in KwaZulu-Natal
50
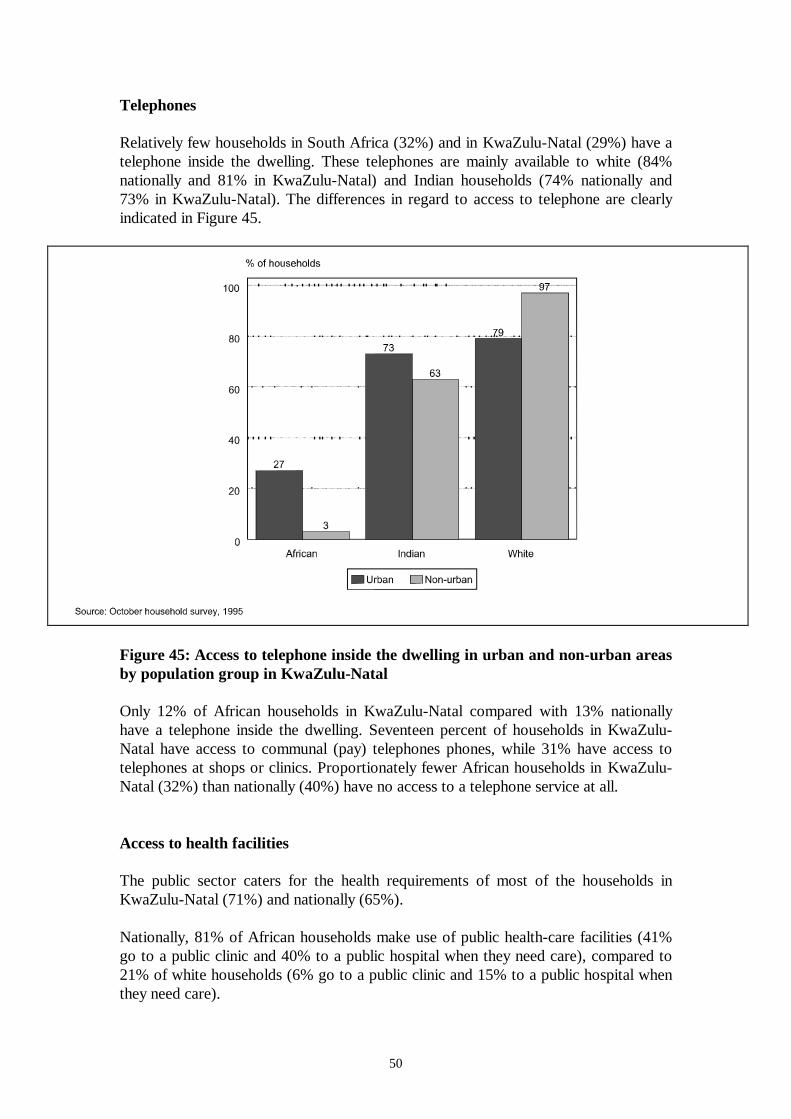
Telephones
Relatively few households in South Africa (32%) and in KwaZulu-Natal (29%) have atelephone inside the dwelling. These telephones are mainly available to white (84%nationally and 81% in KwaZulu-Natal) and Indian households (74% nationally and73% in KwaZulu-Natal). The differences in regard to access to telephone are clearlyindicated in Figure 45.
Figure 45: Access to telephone inside the dwelling in urban and non-urban areasby population group in KwaZulu-Natal
Only 12% of African households in KwaZulu-Natal compared with 13% nationallyhave a telephone inside the dwelling. Seventeen percent of households in KwaZulu-Natal have access to communal (pay) telephones phones, while 31% have access totelephones at shops or clinics. Proportionately fewer African households in KwaZulu-Natal (32%) than nationally (40%) have no access to a telephone service at all.
Access to health facilities
The public sector caters for the health requirements of most of the households inKwaZulu-Natal (71%) and nationally (65%).
Nationally, 81% of African households make use of public health-care facilities (41%go to a public clinic and 40% to a public hospital when they need care), compared to21% of white households (6% go to a public clinic and 15% to a public hospital whenthey need care).
51
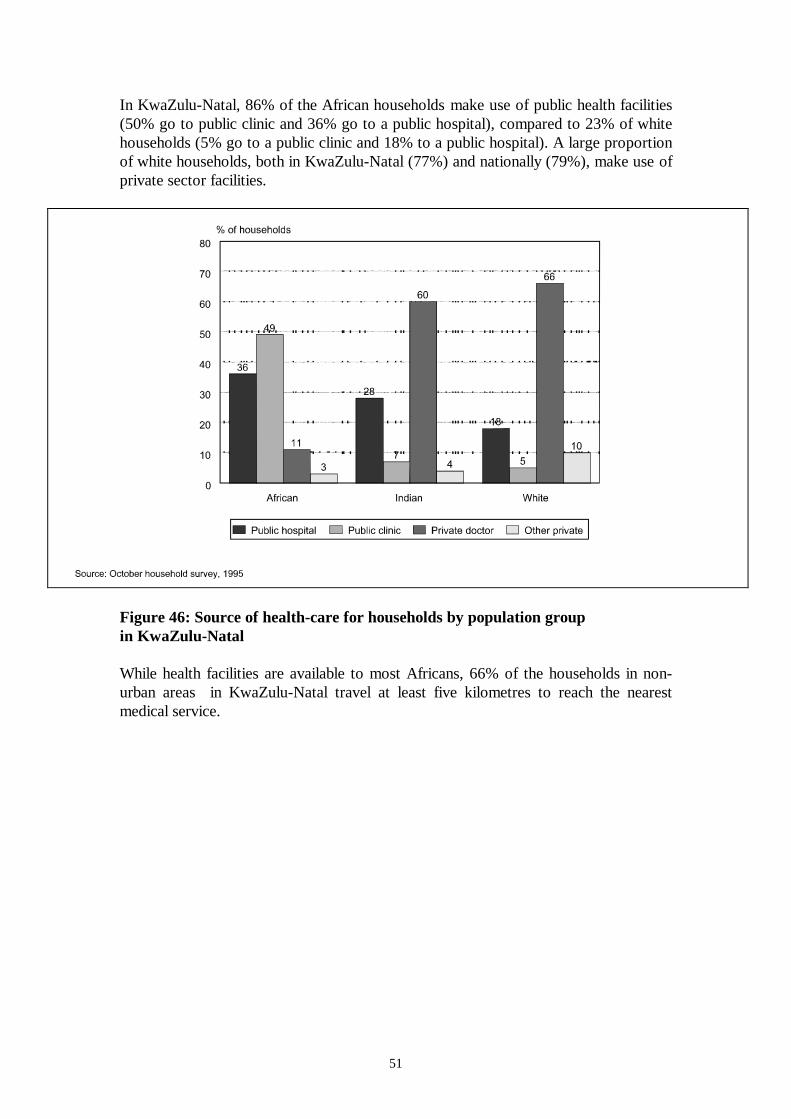
In KwaZulu-Natal, 86% of the African households make use of public health facilities(50% go to public clinic and 36% go to a public hospital), compared to 23% of whitehouseholds (5% go to a public clinic and 18% to a public hospital). A large proportionof white households, both in KwaZulu-Natal (77%) and nationally (79%), make use ofprivate sector facilities.
Figure 46: Source of health-care for households by population groupin KwaZulu-Natal
While health facilities are available to most Africans, 66% of the households in non-urban areas in KwaZulu-Natal travel at least five kilometres to reach the nearestmedical service.
52
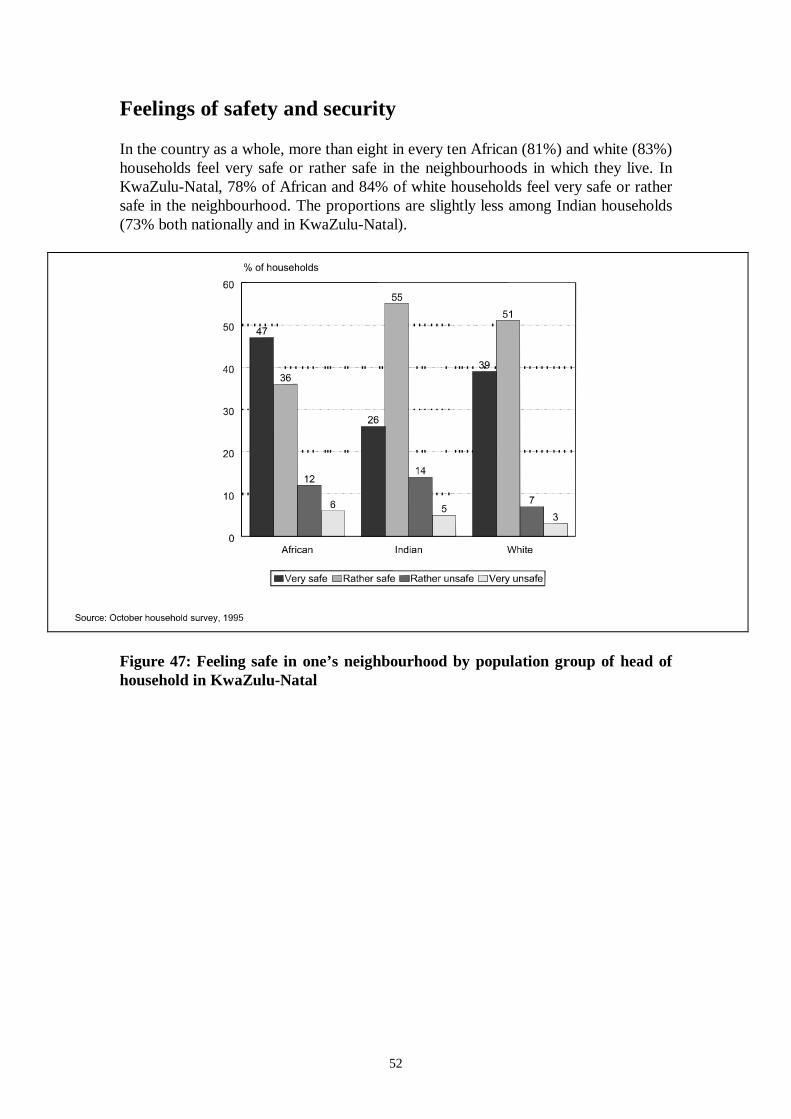
Feelings of safety and security
In the country as a whole, more than eight in every ten African (81%) and white (83%)households feel very safe or rather safe in the neighbourhoods in which they live. InKwaZulu-Natal, 78% of African and 84% of white households feel very safe or rathersafe in the neighbourhood. The proportions are slightly less among Indian households(73% both nationally and in KwaZulu-Natal).
Figure 47: Feeling safe in one’s neighbourhood by population group of head ofhousehold in KwaZulu-Natal
53
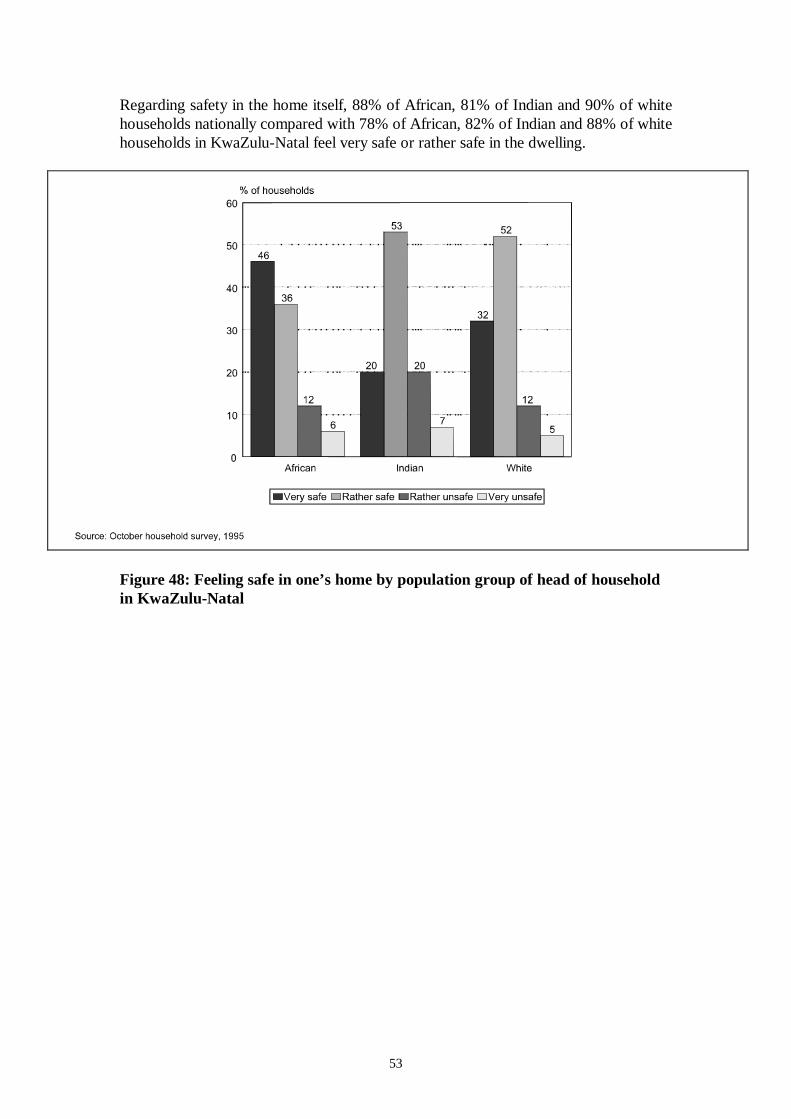
Regarding safety in the home itself, 88% of African, 81% of Indian and 90% of whitehouseholds nationally compared with 78% of African, 82% of Indian and 88% of whitehouseholds in KwaZulu-Natal feel very safe or rather safe in the dwelling.
Figure 48: Feeling safe in one’s home by population group of head of householdin KwaZulu-Natal
54
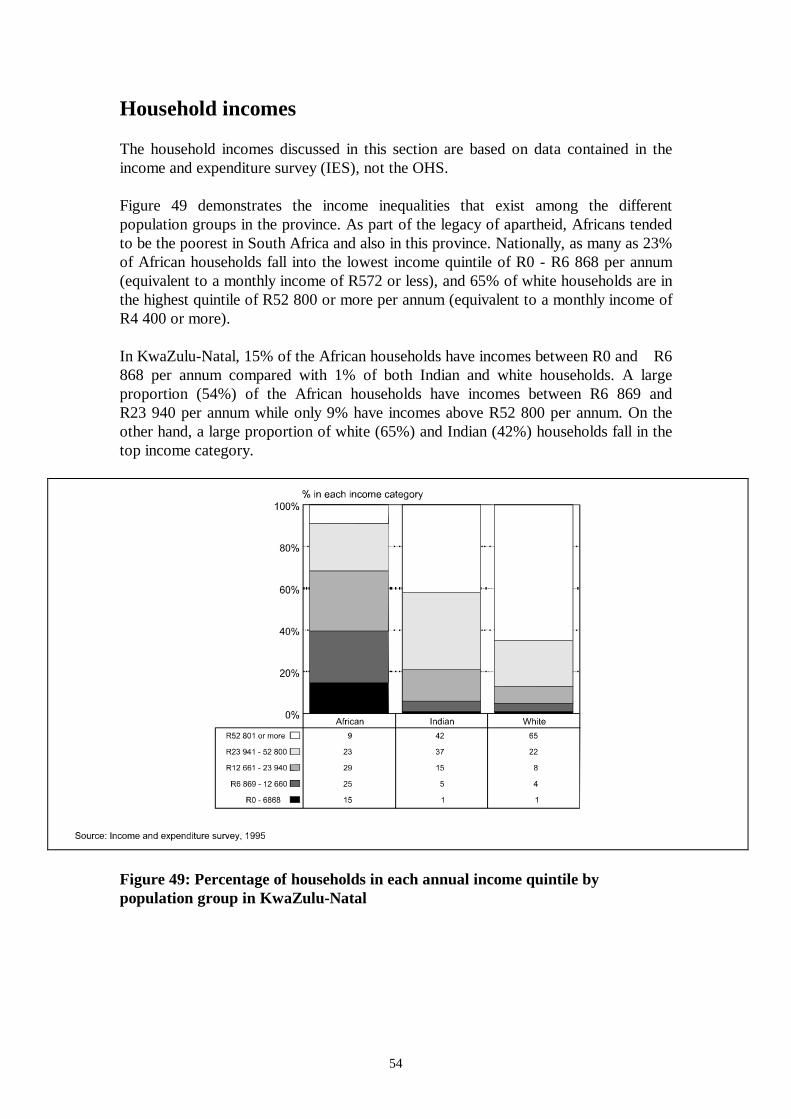
Household incomes
The household incomes discussed in this section are based on data contained in theincome and expenditure survey (IES), not the OHS.
Figure 49 demonstrates the income inequalities that exist among the differentpopulation groups in the province. As part of the legacy of apartheid, Africans tendedto be the poorest in South Africa and also in this province. Nationally, as many as 23%of African households fall into the lowest income quintile of R0 - R6 868 per annum(equivalent to a monthly income of R572 or less), and 65% of white households are inthe highest quintile of R52 800 or more per annum (equivalent to a monthly income ofR4 400 or more).
In KwaZulu-Natal, 15% of the African households have incomes between R0 and R6868 per annum compared with 1% of both Indian and white households. A largeproportion (54%) of the African households have incomes between R6 869 andR23 940 per annum while only 9% have incomes above R52 800 per annum. On theother hand, a large proportion of white (65%) and Indian (42%) households fall in thetop income category.
Figure 49: Percentage of households in each annual income quintile bypopulation group in KwaZulu-Natal
55
Summary
African households in KwaZulu-Natal, in common with those nationally, have lessaccess to facilities such as electricity, tap-water and sanitation than Indian or whitehouseholds. This applies particularly to non-urban African households, where a largeproportion of households are living in traditional dwellings with no facilities.
Fetching wood and water are time-consuming activities. African households are, onaverage, poorer than those in the other population groups. Monitoring of change in theprovince should therefore continue to focus on the African population.

PLEASE TURN THE PAGE
57
Section 4Disability in KwaZulu-Natal
Approximately 6% of those living in KwaZulu-Natal, compared to 5% nationally, arereported as being disabled. This may be an undercount, because of the possible stigmaattached to certain disabilities.
Approximately 2,6% of the population in the province have visual disability, 0,8% havehearing or speech disability, 1,8% have physical disability and 0,4 have mentaldisability.
In the province, approximately 6% of the African population, compared to 5% ofIndians and whites, are reported as being disabled. Among disabled Africans, we havethe same proportion (5,7%) in urban and non-urban areas.

PLEASE TURN THE PAGE
59
Section 5Conclusion
A number of areas of importance – racial, gender, urban and non-urban differences orinequalities, for example – have been identified in the section on the living conditionsof individuals (Section 2) and households (Section 3) of this report. This has been doneboth nationally, and for KwaZulu-Natal.
KwaZulu-Natal is the largest province in the country (in terms of population size), andis mainly non-urban. It has a greater proportion (83%) of Africans compared to thenational proportion (76%), and the Indian proportion (9%) in the province is threetimes the national proportion. Seventy-six percent of the Indian population in SouthAfrica lives in KwaZulu-Natal. This has a discernable impact on the province’s overallprofile.
The mainly non-urban nature of the province has a noticeable effect on a number ofvariables, such as education, employment and unemployment, type of dwelling, andaccess to facilities. As formal jobs are scarce in non-urban areas, the informal sector isbecoming an important source of employment.
The need for basic and essential facilities and services such as electricity, water supply,sanitation and telephones – particularly in non-urban areas – has been highlighted, ashas the importance of education on disability. This is important both to eradicatewrong perceptions about disability, and to allow for the gathering of reliable statisticson disability.
This profile of KwaZulu-Natal, presented in comparison with the national picture,forms an indispensable basis for measuring future progress of programmes to improveliving conditions in the province. In addition, it forms a basis for comparing progress inthat province compared both to other provinces, and the overall national profile.