Embed Size (px)
DESCRIPTION
The Living Planet Report (LPR) is an indicator of the state of the world’s biodiversity: it measures trends in populations of vertebrate species living in terrestrial, freshwater, and marine ecosystems around the world.
Citation preview

L I V I N G P L A N E T R E PO RT 2 0 0 0
lpr cover to pr 19/9/00 2:34 pm Page 1

5. NORWEGIAN SCHOOL OFMANAGEMENT BIElias Smiths vei 15, Box 580,N-1302 Sandvika, Norwaywww.bi.no
Published in October, 2000 byWWF–World Wide Fund ForNature (formerly World WildlifeFund), Gland, Switzerland. Anyreproduction in full or in partof this publication mustmention the title and credit theabove-mentioned publisher asthe copyright owner. © text2000 WWF. All rights reserved
ISBN: xxxxxx
A BANSON Production3 Turville StreetLondon E2 7HX, UK
Picture researcher: Michèle DéprazDesigned by: Price WatkinsDiagrams and maps: David Burles. Simon BlythPrinted by: The KPC Group, UK
Picture credits: Silvery gibbon: WWF/RodWilliams; sparrowhawk: P. de Meo/WWF/Panda Photo;lesser white-fronted goose:Claude Guihard/BIOS; gharial: WWF/RomulusWhitaker; Kemp’s ridley turtle:WWF/P.C.H. Pritchard; bluefin tuna: WWF-Canon/J.P.Sylvestre/BIOS.
Printed on recycled paper(including 75% post-consumerwaste) using vegetable-oilbased inks. When disposing ofthis publication, please try toensure that it is recycled.
LIVING PLANET REPORT 2000
Introduction 1
The Living Planet Index 2
Forest Species Population Index 4
Freshwater Species Population Index 6
Marine Species Population Index 8
The Ecological Footprint 10
Cropland Footprint 14
Grazing Land Footprint 16
Forest Footprint 18
Fishing Ground Footprint 20
Carbon Dioxide Footprint 22
Tables 24
Technical Notes 29
References 31
The material and the geographical designations in this report do not implythe expression of any opinion whatsoever on the part of WWF concerningthe legal status of any country, territory, or area, or concerning thedelimitation of its frontiers or boundaries.
C O N T E N T SAUTHORSEDITOR: Jonathan Loh1
LIVING PLANET INDEX:Martin Jenkins2
Val Kapos2
Neil Cox2
Janina Jakubowska2
Anna Morton2
Brian Groombridge2
ECOLOGICAL FOOTPRINT:Mathis Wackernagel3
Alejandro Callejas Linares4 DianaDeumling3
Niels B. Schulz3
María Antonieta Vásquez Sánchez4
Ina Susana López Falfán4
TECHNICAL ADVISER:Jørgen Randers5
1. WWF INTERNATIONALAvenue du Mont-BlancCH-1196 GlandSwitzerlandwww.panda.org
2. UNEP-WCMC219 Huntington RoadCambridge CB3 0DL, UKwww.unep-wcmc.org
3. REDEFINING PROGRESS1904 Franklin Street, 6th FloorOakland CA 94612, USAwww.rprogress.org
4. CENTER FOR SUSTAINABILITYSTUDIESObreros Textiles 57 dep.6, col.Marco Antonio Muños91060 Xalapa, Mexicowww.edg.net.mx/~mathiswa
THE UNEP WORLDCONSERVATIONMONITORING CENTREwas established in 2000 as theworld biodiversity informationand assessment centre of theUnited Nations EnvironmentProgramme. The roots of theorganisation go back to 1979,when it was founded as theIUCN Conservation MonitoringCentre. In 1988 the WorldConservation MonitoringCentre was created jointly byIUCN, WWF-International andUNEP. The financial supportand guidance of theseorganisations in the Centre'sformative years is gratefullyacknowledged. As aninternational conservationorganisation, UNEP-WCMCprovides objective,scientifically rigorous andfocused information on globalbiodiversity.
REDEFINING PROGRESSis an Oakland, California basedthink-tank that works toexpose the inadequacy ofequating economic growthwith progress; embrace'snature's limits as a path to truesustainability; promotes pricingsystems that incorporate socialand environmental costs; andadvocates care-taking ofcommon assets.
THE CENTRE FORSUSTAINABILITY STUDIESof the An·huac University ofXalapa, Mexico, is a researchinstitute that analyses humanuse of nature and offersworkshops on sustainability.

I N T R O D U C T I O NWhile the state of the Earth’s natural ecosystems has declined by about 33 per cent over thelast 30 years (see Figure 1), the ecological pressure of humanity on the Earth has increasedby about 50 per cent over the same period (see Figure 2), and exceeds the biosphere’sregeneration rate. These are the main conclusions of the Living Planet Report 2000, basedon two indices, the Living Planet Index (LPI) and the Ecological Footprint. This report hastwo principal objectives: the first is to quantify changes in the state of the Earth's naturalecosystems over time; the second is to measure the human pressures on the naturalenvironment arising from the consumption of renewable resources and pollution, and analysethe geographic patterns in those pressures.
In this year’s report we have used more data to calculate the LPI, making the indexmore reliable. Because the volume of data used in the LPI is much larger than before, theindex is now calculated regionally, or by ocean in the case of marine ecosystems.However, the overall conclusion remains unchanged: the natural wealth of the world’sforests, freshwater ecosystems, and oceans and coasts has declined rapidly, particularlyin freshwater and marine ecosystems. The Living Planet Index fell by 33 per cent between1970 and 1999.
A new feature of this year’s Living Planet Report is the index we use to estimate thepressure on the Earth resulting from humanity’s natural resource consumption. This is the“Ecological Footprint”, which measures a population’s consumption of food, materials, andenergy in terms of the area of biologically productive land or sea required to produce thoseresources and to absorb the corresponding waste. The calculation of the footprint leaves outsome pressures for which data are incomplete such as water consumption and the releaseof toxic pollutants. This means that the results are underestimates of humanity’s full impact.
We have calculated the Ecological Footprint for individual countries in 1996, as well as forthe world population from 1961 to 1997.
The Ecological Footprint method allows us not only to estimate the human pressures onthe Earth, but also to make comparisons between humanity’s demands on nature and thecapacity of the Earth to supply resources and assimilate waste.
In 1997, the Ecological Footprint of the global population was at least 30 per cent largerthan the Earth’s biological productive capacity. At some time in the 1970s, humanity as awhole passed the point at which it lived within the global regenerative capacity of the Earth,causing depletion of the Earth’s natural capital as a consequence (although locally this hasoccurred many times and in many places throughout human history). This is the ultimatecause of the decline in the natural wealth of the world’s forest, freshwater, and marineecosystems, as indicated by the LPI.
Secondly, the preliminary conclusion from the regional LPI analysis is that the steepestdeclines in all three ecosystem types have taken place in southern temperate and tropicalregions. This does not necessarily mean that the state of southern temperate and tropicalecosystems is worse than that of northern temperate ecosystems, but simply that therelative decline has been greatest in tropical ecosystems over the past 30 years. The loss ofnatural wealth in northern temperate ecosystems largely took place more than 30 years ago.By comparing the resource consumption patterns of different countries we conclude that, in1996, the Ecological Footprint of an average consumer in the industrialized world was fourtimes that of an average consumer in the lower income countries. This implies that richnations (located mainly in northern temperate zones) are primarily responsible for theongoing loss of natural wealth in the southern temperate and tropical regions of the world.
Fig. 1:LIVING PLANET INDEX, 1970–99
140
0
40
100
20
120
80
60
1960 19701965 1975 19901980 1985 1995 2000 1960 19701965 1975 19901980 1985 1995 2000
Fig. 2:WORLD ECOLOGICAL FOOTPRINT, 1961–97
0
8
12
16
4
Upperconfidence limit
Lowerconfidence limit
Available biocapacity
Available biocapacityallowing 10% fornature reserves
Bill
ion
area
uni
ts
1LIVING PLANET REPORT 2000

Fig. 1:LIVING PLANET INDEX,1970–99
140
0
100
20
80
60
120
40
1970 1975 1980 1985 1990 1995 2000
Upperconfidence limit
Lowerconfidence limit
Fig. 3:GLOBAL FOREST ECOSYSTEMSINDEX, 1970–99
140
0
100
20
80
60
120
40
1970 1975 1980 1985 1990 1995 2000
Fig. 4:FRESHWATER SPECIESPOPULATION INDEX, 1970–99
140
0
100
20
80
60
120
40
1970 1975 1980 1985 1990 1995 2000
Fig. 5:MARINE SPECIES POPULATIONINDEX, 1970–99
140
0
100
20
80
60
120
40
1970 1975 1980 1985 1990 1995 2000
T H E L I V I N G P L A N E T I N D E XThe Living Planet Index is a measure of thenatural wealth of the Earth's forests,freshwater ecosystems, and oceans andcoasts. Figure 1 shows that the index fell byabout 33 per cent between 1970 and 1999.The LPI is the average of three indices whichmonitor the changes over time in populationsof animal species in forest, freshwater, andmarine ecosystems respectively (see Figures3-5). More details on how these indices arecalculated are given on pages 4-9.
Each ecosystem index measures the changeover time of a population that is typical of thesample of species in the index. The forestindex includes 319 species populations, andshows a decline of about 12 per cent from1970 to 1999. The freshwater index includesabout 194 species populations and fell byabout 50 per cent between 1970 and 1999.
The marine index includes about 217 speciespopulations which declined by about 35 percent on average over the same period. Thesespecies were not selected as being the bestindicators of their respective habitats, butrepresent all those for which time-seriespopulation data could be found.
Previous editions of the Living PlanetReport used species populations to measurechanges in freshwater and marineecosystems, but not in forest ecosystems.Instead we used changes in forest area. Inthis report, all three ecosystem indexes arecalculated in the same way. While thisalteration improves the methodologicalconsistency of the LPI, it does notsignificantly alter the overall result. Theforest species population index declined byabout 12 per cent between 1970 and 1999
while the forest area declined byapproximately 11 per cent.
With the larger number of species includedin the Living Planet Index, the threeecosystems indices are now calculated on aregional basis. The forest species populationindex is the average of separate trends intemperate and tropical forests. The freshwaterspecies population index combines averagetrends from six continents, and the marinespecies population index is based on trends in six regional oceans. There is a differencebetween average trends of northern andsouthern species populations in the freshwaterand marine indices, and between temperateand tropical populations in the forest indices.In all three ecosystem types, the most severedeclines have been in the southern or tropicalregions of the world.
This does not imply that the northerntemperate ecoregions of the world are in abetter state than tropical or southern temperateecoregions, but that the northern temperateecoregions have shown less change over thelast 30 years (although there have been manyexamples of local declines). Much of the lossof biodiversity in northern temperateecosystems took place prior to 1970, especiallyfrom the early 19th century onwards, and so isnot recorded in the LPI. However, there are farfewer population data available for southerntemperate and tropical species than northerntemperate ones, and the trends shown in theregional sub-indices need to be corroborated by more data.
Boxes 1–6 on the opposite page giveexamples of a selection of species populationsused in calculating the LPI.
LIVING PLANET REPORT 20002

3LIVING PLANET REPORT 2000
The silvery gibbon is endemic to thetropical rainforests of western andcentral Java,Indonesia. Thespecies has declined throughsevere encroachmenton forest habitats byJava’s humanpopulation. There are possibly fewerthan 3 000 silverygibbons remaining,many of which occurin the reserves ofUjung Kulon andGunung Halimun.
The lesser white-fronted goosebreeds in the taigaand tundra zones of northern andwestern Eurasia and winters in thesteppe zone ofsoutheast Europe. It is believed that the main causes ofits decline are theloss of its feedinghabitat and huntingpressure at thestaging andwintering grounds..
Kemp’s ridley is themost endangered seaturtle species. Itgenerally occurs in thewaters of the westernAtlantic and almostexclusively nests at asingle beach inMexico. Predation oneggs, catching ofadults, and incidentalcatch in fishing gearhas greatly reducedthe turtle’s population.Ongoing intensiveconservation measuresappear to havestemmed the declineand numbers ofnesting females aregradually increasing.
The bluefin tuna is found on bothsides of the Atlantic and boththe eastern and western Pacific.Overfishing has led to a decline intuna populationsthroughout therange. In the western Atlantic the population offish over ten yearsold may havedeclined by up to 95 per cent since 1970.
The gharial is one of the largest livingcrocodilians. Thespecies is restrictedto northern parts ofthe Indian sub-continent whereit inhabits deep, fast-flowing rivers.While the gharialremains one of themost endangeredcrocodilians, itspopulation hasgreatly increasedsince the 1970s,largely because of conservationprogrammes initiated over much of its range.
The sparrowhawkoccurs throughout theforests and openwoodland habitats ofEurasia and northernparts of Africa. Thewidespread use oforganochlorinepesticides in Europeduring the 1950s and1960s killed many birdsof prey and reducedtheir breeding success.These pesticides werebanned in the 1970s ina number of countries,and several sparrow-hawk populations, suchas those in the UK, have since shown agradual recovery.
Box 1: SILVERY GIBBON(Hylobates moloch) in Indonesia
Box 2: SPARROWHAWK(Accipiter nisus) in the UK
Box 3: LESSER WHITE-FRONTED GOOSE(Anser erythropus) in Eurasia
Box 5: KEMP’S RIDLEYTURTLE(Lepidochelys kempi) in Mexico
Box 4: GHARIAL(Gavialis gangeticus) in southern Asia
Box 6: BLUEFIN TUNA(Thunnus thynnus) in thewestern Atlantic
1970 1980 1990 2000
Pop
ulat
ion
Pop
ulat
ion
1970 1980 1990 2000
Pop
ulat
ion
1970 1980 1990 2000
Pop
ulat
ion
1970 1980 1990 2000
Pop
ulat
ion
1970 1980 1990 20001970 1980 1990 2000
Pop
ulat
ion

F O R E S T S P E C I E S P O P U L A T I O N I N D E X
Fig. 6:FOREST SPECIES POPULATION INDICES,1970–99
140
0
100
20
80
60
120
40
1970 1975 1980 1985 1990 1995 2000
Fig. 7:NATURAL FOREST COVER,ORIGINAL AND 1970–2000
70
0
50
10
40
30
60
20
Temperate
Tropical
Forest Ecosystems Index
Mill
ion
squa
re k
ilom
etre
s
Asia/PacificAfricaLatin America and the CaribbeanNorth AmericaEurope (excl. Russian Federation)Russian Federation
1970Originalforest cover
1975 1980 1985 1990 1995 2000
The Forest Species Population Index measuresthe average change over time in 319 forestspecies populations, and shows a decline ofabout 12 per cent from 1970–99. The index isthe average of two sub-indices which relate totemperate and tropical forests, respectively.Figure 6 shows that the sub-index for tropicalforest has declined by about 25 per cent overthe period 1970-1999 while the sub-index fortemperate forests increased slightly. Thisclosely parallels the trends in the area oftropical and temperate forests over the sameperiod (see Figure 7). The temperate andtropical forest components are given equalweighting in the overall forest index. This isbecause temperate and tropical forests
currently occupy approximately equal areas ofthe Earth’s surface.
Although there has been no overall declinein the temperate forests index since 1970, thisdoes not imply that temperate forests are in abetter state than tropical forests. It means that,on average worldwide, there has been littlechange in temperate forests over the last 30years, although locally there are exceptions,such as the temperate rainforests on the Pacificcoasts of Canada, the United States, and Chile.Most deforestation in temperate countries tookplace before the 20th century.
If the forest index could be extended backover 300 or 3 000 years rather than merely 30,a large overall decline for temperate forests
would become apparent (see Figure 7). Beforehumans began modifying natural ecosystems togrow crops and graze animals around 8 000–10 000 years ago, the world’s forests wouldhave covered twice their current area,assuming that climatic conditions then weresimilar to today’s. Both temperate and tropicalforest areas have declined by about 50 per centsince the advent of agriculture. In contrast withtemperate forests, however, most of the loss oftropical forests has taken place within the last100 years, and is still continuing.
Species used in the index include antelopes,Asian elephant, Baird’s tapir, brush-tailedpossum, canids, cats, deer, flying foxes, giantpanda, gibbons, great apes, hares and rabbits,
kangaroos, jumping mouse, lemurs, mustelids,new world monkeys, old world monkeys,pipistrelle bat, rhinoceroses, shrews, sifaka,squirrels, tamarins, voles, bustards, creepers,cuckoos, doves, dunnock, falcons, finches,flycatchers, grouse, hawks, kinglets andthrushes, kiwis, jays and crows, mockingbirdsand thrashers, new world warblers, nuthatches,old world warblers, owls, parrots and macaws,pheasants, sparrows, blackbirds, cowbirds andwarblers, starling, tits, tree pipit, waxwing,woodcock, woodpeckers, wren, vireos, andseveral invertebrate species.
Map 1 shows the location of the world’s forests,which currently cover approximately 30 millionkm2, about one-fifth of the Earth’s land surface.
4 LIVING PLANET REPORT 2000

Map 1:CURRENT FOREST COVER
5LIVING PLANET REPORT 2000
Tropical forests Temperate and boreal forests
Montane forest
Lowland evergreen broadleaf forest
Semi-evergreen moist broadleaf forest
Mixed needleleaf/broadleaf forest
Needleleaf forest
Sclerophyllous dry forest
Deciduous/semi-deciduous broadleaf forest
Deciduous broadleaf forest
Sclerophyllous dry forest
Evergreen needleleaf forest
Deciduous needleleaf forest
Mixed broadleaf/needleleaf forest
Broadleaf evergreen forest
Disturbed natural forest

6 LIVING PLANET REPORT 2000
F R E S H W A T E R S P E C I E S P O P U L A T I O N I N D E XThe Freshwater Species Population Index fellby about 50 per cent from 1970 to 1999 (seeFigure 4), the most rapid decline of all threespecies population indices. It measures theaverage change over time in the populationsof around 194 species of freshwater birds,mammals, reptiles, amphibians, and fishes.The index is the average of six sub-indiceswhich relate to freshwater species populationsfrom Africa, Asia-Pacific, Australasia, Europe,Latin America and the Caribbean, and NorthAmerica respectively (see Figure 8).
Although the decline in European andNorth American freshwater species since1970 has been much less severe than in other
regions of the world, this does not imply thatfreshwater ecosystems in Europe and NorthAmerica are in a better state than in otherregions. It simply means that there has beenless of a decline over the last 30 years. Muchof the loss and degradation of freshwaterecosystems in the industrialized world tookplace prior to 1970.
The status of freshwater bird and mammalpopulations is better known than that of othergroups, and waterfowl are among the mostclosely monitored of any wild species. Muchless is known about population trends infreshwater fishes and amphibians, althoughmany biologists believe these to be among the
most threatened classes of species in the world.Recent evidence suggest that there has been asignificant decline in amphibian populations inmany parts of the world since the 1950s.
Species used in the index include Europeanbeaver, hippopotamus, Russian desman, riverdolphins, saimaa seal, otter, reed bunting,cranes, ducks, geese and swans, flamingos,grebes, gulls and terns, eagles, herons andbitterns, ibises and spoonbills, common loon,pelicans, coots and swamphen, storks, snipeand redshank, South American river turtle,alligators and caimans, crocodiles, gharial,pond turtles, lungless salamanders, molesalamanders, narrowmouth toad, New Zealand
frogs, newts, spadefoot toad, true toads,treefrogs, true frogs, ayu, carps and minnows,eel, galaxias, herrings and shads, perches, pike,salmons and trouts, splitfin, sturgeons, suckers,crayfish, and several other invertebrate species.
Map 2 shows the location of six major typesof freshwater ecosystems around the world.Freshwater comprises only about 2.5 per cent ofall water on Earth, and 99 per cent of that islocked up either in ice caps or below the ground.Freshwater ecosystems such as rivers, lakes, andwetlands occupy less than 2 per cent of the totalland surface, yet they provide a wide range ofhabitat types for a significant proportion of theworld’s plant and animal species.
Fig. 4:FRESHWATER SPECIES POPULATION INDEX,1970–99
140
0
100
20
80
60
120
40
1970 1975 1980 1985 1990 1995 2000
Upperconfidence limit
Lowerconfidence limit
Fig. 8:REGIONAL FRESHWATER SPECIES POPULATIONINDICES, 1970–99
140
0
100
20
80
60
120
40
1970 1975 1980 1985 1990 1995 2000
North AmericaLatin AmericaEuropeAfricaAsia/PacificAustralasiaFreshwater Species Population Index

7LIVING PLANET REPORT 2000
Map 2:MAJOR FRESHWATER AREAS OF THE WORLD
Freshwater marshes and floodplains
Inland open waters
Peatlands
Seasonally flooding inland systems
Swamp forest
Unclassified wetland areas

8 LIVING PLANET REPORT 2000
M A R I N E S P E C I E S P O P U L A T I O N I N D E XThe Marine Species Population Indexcalculates the average changes in populationsof 217 species of marine mammals, birds,reptiles, and fishes, and shows a decline ofabout 35 per cent from 1970 to 1999 (seeFigure 5). The index is the average of six sub-indices which relate to the North Pacific,North Atlantic, Indian, South Pacific, SouthAtlantic, and Southern Oceans respectively(see Figure 9).
Like the forest and freshwater species, themarine species population declines have beenmore pronounced in the southern temperateand tropical oceans than in the northern
temperate oceans. This does not mean that thenorthern oceans are in a better state, butsimply that there has been a steeper relativedecline in the southern and tropical oceansover the last 30 years than in the north.
Marine species are generally more difficultto monitor than terrestrial ones, andassessments are often based on catch sizes ofharvested species. The exceptions are thosespecies which nest or breed on land, such asseals and sea lions, seabirds, and marineturtles. Although fishes constitute over 90 percent of marine vertebrate species, far more isknown about the status of birds and mammals,
and consequently these groups are over-represented in the index.
Species used in the marine index includebeluga whale, bowhead whale, Caribbeanmanatee, dolphins, dugong, earless seals, furseals and sea lions, grey whale, polar bear,rorqual whales, sea otter, sperm whale, vaquita,walrus, albatrosses, Bermuda petrel, boobiesand gannets, brown pelican, cormorants andshags, eider duck, gulls and terns, parasiticjaeger, penguins, puffins, murrelets, auklets andguillemots, sandpipers, storm petrels,anchovies, atka mackerel, Bombay duck,capelin, cod icefishes, cods and haddocks,
common sole, crocodile icefishes, dogfish, flatheadmullet, goosefishes, herrings, shads, sardines andmenhadens, jacks and pompanos, lane snapper,mackerels and tunas, merluccid hakes, porgies,righteye flounders, rockfishes, rockcods andthornyheads, sablefish, sandlance, scopthalmidflatfishes, summer flounder, swordfish, white hake,marine turtles, and several invertebrate species.
Map 3 and Figure 10 show the location andapproximate areas of coral reef and mangroveecosystems in the world’s oceans. Coral reefs andmangroves are among the most productive,biologically diverse, and gravely threatenedmarine and coastal ecosystems.
Fig. 5:MARINE SPECIES POPULATION INDEX,1970–99
140
0
100
20
80
60
120
40
1970 1975 1980 1985 1990 1995 2000
Upperconfidence limit
Lowerconfidence limit
Fig. 9:MARINE SPECIES POPULATION INDICESBY OCEAN, 1970–99
140
0
100
20
80
60
120
40
1970 1975 1980 1985 1990 1995 2000
North PacificSouth PacificNorth AtlanticSouth AtlanticIndian OceanSouthern OceanMarine Species Population Index
Fig. 10:CORAL REEF AND MANGROVEECOSYSTEMSPacific
Southeast Asia
Indian Ocean
Atlantic (excluding Caribbean)
Caribbean
Middle East
0 20 40 60
Million square kilometres
80 100 120
Coral reefsMangroves

9LIVING PLANET REPORT 2000
Map 4:CORAL REEFS AND MANGROVE ECOSYSTEMS
Coral
Mangrove

Fig. 13:ECOLOGICAL FOOTPRINTBY COUNTRY, 1996
Fig. 11:WORLD ECOLOGICAL FOOTPRINT, 1961–97
Fig. 12:ECOLOGICAL FOOTPRINT BY REGION, 1996
UN
ITE
D A
RA
B E
MIR
ATE
S
SIN
GA
PO
RE
UN
ITE
D S
TATE
S
KU
WA
IT
DE
NM
AR
K
NE
W Z
EA
LAN
D
IRE
LAN
D
AU
STR
ALI
A
FIN
LAN
D
CA
NA
DA
SW
ED
EN
FRA
NC
E
HO
NG
KO
NG
(CH
INA
)
ES
TON
IA
SW
ITZ
ER
LAN
D
GE
RM
AN
Y
CZ
EC
H R
EP
.
UN
ITE
D K
ING
DO
M
SA
UD
I AR
AB
IA
NO
RW
AY
JAP
AN
BE
LGIU
M/L
UX
EM
BO
UR
G
NE
THE
RLA
ND
S
KO
RE
A, R
EP
.
GR
EE
CE
ITA
LY
SP
AIN
AU
STR
IA
SLO
VE
NIA
ISR
AE
L
PO
LAN
D
RU
SS
IAN
FE
DE
RA
TIO
N
BE
LAR
US
HU
NG
AR
Y
PO
RTU
GA
L
UR
UG
UA
Y
LITH
UA
NIA
UK
RA
INE
KA
ZA
KH
STA
N
LIB
YA
TAIW
AN
(CH
INA
)
MO
NG
OLI
A
SO
UTH
AFR
ICA
SLO
VA
KIA
YU
GO
SLA
VIA
BU
LGA
RIA
AR
GE
NTI
NA
LATV
IA
MA
LAY
SIA
TUR
KM
EN
ISTA
N
RO
MA
NIA
CH
ILE
OM
AN
MA
CE
DO
NIA
LEB
AN
ON
VE
NE
ZU
ELA
PA
RA
GU
AY
CO
STA
RIC
A
TUR
KE
Y
THA
ILA
ND
ME
XIC
O
JAM
AIC
A
UZ
BE
KIS
TAN
BR
AZ
IL
SY
RIA
IRA
N
MO
LDO
VA
MA
UR
ITIU
S
TRIN
IDA
D A
ND
TO
BA
GO
CR
OA
TIA
PA
NA
MA
TUN
ISIA
EC
UA
DO
R
AZ
ER
BA
IJA
N
CU
BA
0
18
4
2
8
12
10
14
16
6Are
a un
its p
er p
erso
n
16
0
12
0
Bill
ion
area
uni
ts
Built-up land
Carbon dioxide
Fishing ground
Forest
Grazing land
Cropland
Are
a un
its p
er p
erso
n
8
12
4
10
6
4
8
2
1960 1965 1970 1975 1980 1985 1990 1995 299 384 343 307 484 3 222Population (millions)
710
OE
CD
Non
-OE
CD
North AmericaWestern EuropeCentral and Eastern EuropeMiddle East and Central AsiaLatin America and the CaribbeanAsia/PacificAfrica
10 LIVING PLANET REPORT 2000
T H E E C O L O G I C A L F O O T P R I N TThe Ecological Footprint is a conservativeestimate of human pressure on globalecosystems. It represents the biologicallyproductive area required to produce the foodand wood people consume, to give room for infrastructure, and to absorb the CO2emitted from burning fossil fuels, which isthe primary cause of climate change, asexplained further on the following pages.The Ecological Footprint is expressed in“area units”. Each unit corresponds to onehectare of biologically productive space with “world average productivity” (see page
12 for a more detailed explanation). Aspeople use resources from all over the world, and affect faraway places with theirpollution, the footprint is the sum of theseareas wherever they are on the planet.
The world’s Ecological Footprint changes inproportion to global population size, averageconsumption per person, and the resourceintensity of the technology being used.Technology can alter the productivity of land, or the efficiency with which resourcesare used to produce goods and services. Thefootprint calculations are conservative
estimates of human impact since insufficientdata are available on some uses of thebiosphere. Also, the calculations assume thatthe technologies used in resource exploitationare the average of those prevailing in theworld today, and do not make distinctionsbetween the use of more sustainableexploitation in some places and lesssustainable exploitation in others. This maydistort the size of some countries’ footprints,but does not affect the global result.
Figure 11 shows the growth of theEcological Footprint of the world’s population
from 1961 to 1997. Figure 12 shows the size of the Ecological Footprints of sevenregions of the world in 1996. The size ofeach box is proportional to the footprint of each region: the height of the box isproportional to the region’s averageEcological Footprint per person and thewidth of the box is proportional to thepopulation of the region. Figure 13 showsthe size of the Ecological Footprint perperson in all countries with populationsgreater than one million. The national andregional data relate to the year 1996, as this

GA
BO
N
KO
RE
A, D
.P.R
.
CO
LOM
BIA
KY
RG
YZ
STA
N
ALB
AN
IA
CH
INA
(MA
INLA
ND
)
ALG
ER
IA
IRA
Q
JOR
DA
N
EG
YP
T
BO
TSW
AN
A
MO
RO
CC
O
EL
SA
LVA
DO
R
IND
ON
ES
IA
ZIM
BA
BW
E
HO
ND
UR
AS
PH
ILIP
PIN
ES
GU
ATE
MA
LA
PA
PU
A N
EW
GU
INE
A
DO
MIN
ICA
N R
EP
.
PE
RU
NIG
ER
IA
BO
LIV
IA
BO
SN
IA A
ND
HE
RZ
EG
OV
INA
NIC
AR
AG
UA
MA
UR
ITA
NIA
ZA
MB
IA
LIB
ER
IA
AR
ME
NIA
KE
NY
A
CO
NG
O
SU
DA
N
GE
OR
GIA
CE
NTR
AL
AFR
ICA
N R
EP
.
GH
AN
A
PA
KIS
TAN
MY
AN
MA
R
IND
IA
SE
NE
GA
L
TAN
ZA
NIA
NE
PA
L
GA
MB
IA, T
HE
NIG
ER
SO
MA
LIA
BE
NIN
CÔ
TE D
’IVO
IRE
VIE
T N
AM
SR
I LA
NK
A
MA
DA
GA
SC
AR
LAO
S
BU
RK
INA
FA
SO
TAJI
KIS
TAN
RW
AN
DA
CA
ME
RO
ON
UG
AN
DA
MA
LAW
I
MA
LI
ETH
IOP
IA
GU
INE
A
CA
MB
OD
IA
TOG
O
AN
GO
LA
GU
INE
A-B
ISS
AU
BH
UTA
N
HA
ITI
MO
ZA
MB
IQU
E
BU
RU
ND
I
CH
AD
SIE
RR
A L
EO
NE
LES
OTH
O
CO
NG
O, D
EM
. RE
P. (
ZA
IRE
)
YE
ME
N
NA
MIB
IA
BA
NG
LAD
ES
H
AFG
HA
NIS
TAN
ER
ITR
EA
Existing biologically productive area per person
LIVING PLANET REPORT 2000 1111
6.0 and over
4.0 – 6.0
2.0 – 4.0
1.0 – 2.0
less than 1.0
insufficent data
Map 4:ECOLOGICAL FOOTPRINT BY COUNTRYArea units per person, 1996

12 LIVING PLANET REPORT 2000
T H E E C O L O G I C A L F O O T P R I N T continuedwas the most recent year for which UNstatistics were available for all countries at the time of writing.
Extrapolating from the trend shows that,by the year 2000, the global footprint islikely to have increased slightly. This can becrudely estimated using population growth,assuming that the global average footprintper person has remained fairly constant (as it did from 1985 to 1996). As the worldpopulation has increased from 5.7 billion to6.0 billion people since 1996, the globalfootprint is likely to have increased by about5 per cent.
It is possible to compare the EcologicalFootprint of a population with the biologicalcapacity which is available to thatpopulation. In short, how much space doesa population need compared with what isavailable?
In 1996 there were 12.6 billion hectares of biologically productive land on theplanet, covering roughly one quarter of theEarth’s surface. These consisted of 1.3billion hectares of cropland, 4.6 billionhectares of grazing land, 3.3 billion hectaresof forest land, 3.2 billion hectares of fishinggrounds, and 0.2 billion hectares of built-upland (see Table 1 on opposite page). Thisamounts to 2.2 hectares for each of theworld’s 5.7 billion people in 1996: 0.2hectares of cropland, 0.8 hectares of grazing land, 0.6 hectares of forests, and 0.5 hectares of productive ocean areas, mostof which are located along coasts.
If we assume, for the sake of argument,that 10 per cent of all biologicallyproductive space should be left undisturbedfor other species, the available space perperson shrinks from 2.2 to 2.0 area units. In
contrast, the world average footprint was2.85 area units per person in 1996. Thisexceeds the existing biologically productivespace per person by about 30 per cent, ormore if some space is reserved exclusivelyfor other species. In other words, the arearequired to produce food and wood, to giveroom for infrastructure, and to absorb theCO2 emissions associated with energy usewas at least 30 per cent larger than the areaavailable. This overshoot leads to thedepletion of the Earth’s natural capital stock,as reflected by the decline in the LPI.
Actions needed to reduce the EcologicalFootprint: ■ Establish natural capital (or“biological capacity”) accounts in each country,and set specific targets for natural capital use. ■ Phase out perverse subsidies that promoteresource use, pollution, and population growth.■ Encourage policies to incorporateenvironmental costs in the price of goods andservices. ■ Promote the development oftechnologies that increase the efficiency of theuse of resources. ■ Encourage educationalinitiatives that teach about opportunities toreduce human pressures on ecosystems. ■ Develop humane, equitable, and widelyacceptable policies to reduce human population. ■ Establish international trade agreements whichdiscourage countries from externalizing theirecological costs. ■ Redirect governmentprocurement towards sustainable alternatives toset good examples and stimulate new markets.
key questions answeredWHAT ARE “AREA UNITS”?
The Ecological Footprint is measured in “areaunits”. One “area unit” is equivalent to onehectare of biologically productive space withworld average productivity. Land variesgreatly in productivity; the most productiveland is generally used to grow crops, whilethe least productive is used to graze animals.
One “area unit” is equivalent to about 0.3 hectares of cropland of world averageproductivity. It is also equivalent to 0.6hectares of average forest, or 2.7 hectares of average grazing land, or 16.3 hectares of sea (coastal and upwelling zones) withaverage productivity. Thus a hectare of highly productive land represents more
“area units” than the same amount of lessproductive land.
All land areas are scaled according to theircapacity to produce biomass. Sea ismeasured in terms of its capacity to produceprotein for human consumption. Area unitsallow the meaningful comparison of theEcological Footprints of different countries,which use different qualities and mixes ofcropland, grazing land, and forest.
HOW MUCH LAND IS NEEDED TO ABSORB CARBON DIOXIDEEMISSIONS?
The Ecological Footprint methodology askshow much bigger the biosphere would needto be in order to absorb the CO2 emitted byburning fossil fuels. Alternatively we couldask how large an area would be needed tosupply the same amount of energy using onlybiomass fuel.
Either method yields similar results (in fact,the one we use gives the lower estimate). Bychoosing a method that is based on presentCO2 sequestration rates, we are notadvocating that forests should be planted tocounteract increasing concentrations of CO2in the atmosphere. Rather, we show thatsequestration can only be a partial solution
at best, since there is not enough land on Earth available to provide this function. Byexpressing fossil fuel use in terms of CO2sequestration, we can compare the fossil fuel footprint with other human pressures on the biosphere, and aggregate them into a single index.
13LIVING PLANET REPORT 2000
capacity per person, ecologicallysustainable? Is Egypt, which has a perperson footprint smaller than the globalaverage biological capacity, yet larger thanits domestic biological capacity? Clearly, ifeveryone in the world led the same lifestyleas the average Swede, the Earth would notbe able to sustain its human population forvery long. Nor would humanity besustainable if all countries ran an ecologicaldeficit like Egypt.
Does this mean that people should livewithin the world's average biologicalcapacity, or their national biologicalcapacity? Footprint calculations do notanswer these questions, but try to quantify
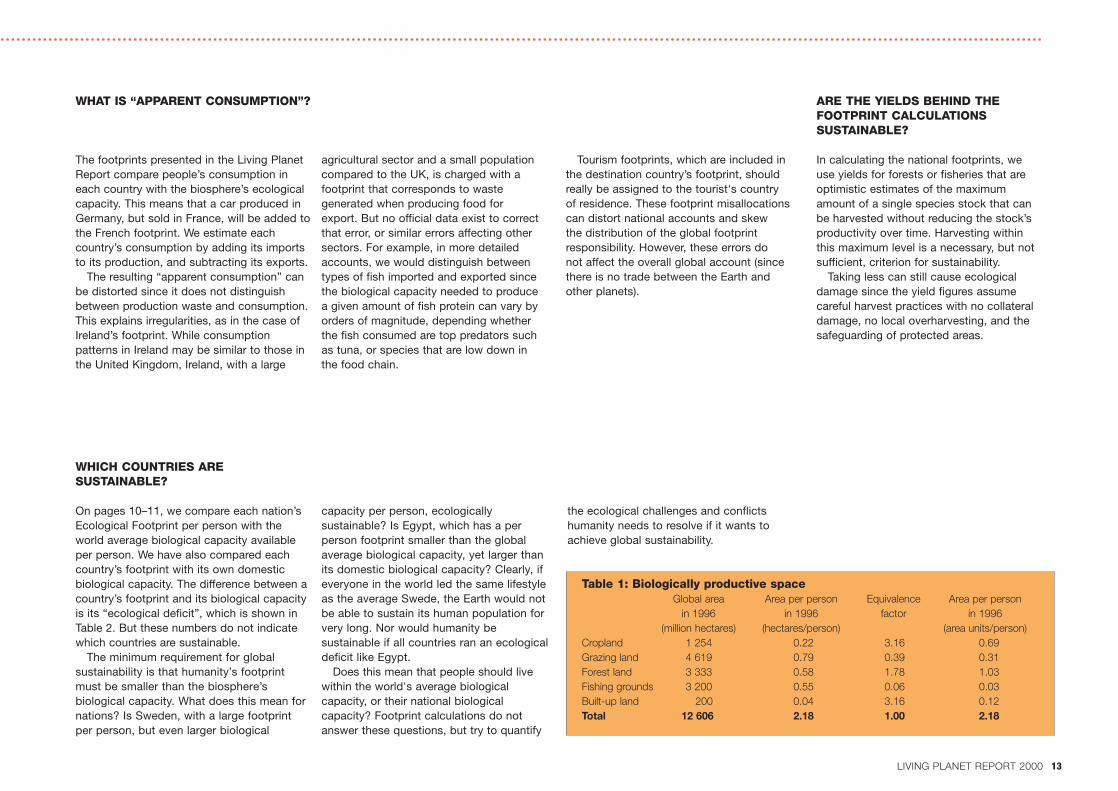
Table 1: Biologically productive spaceGlobal area Area per person Equivalence Area per person
in 1996 in 1996 factor in 1996(million hectares) (hectares/person) (area units/person)
Cropland 1 254 0.22 3.16 0.69 Grazing land 4 619 0.79 0.39 0.31 Forest land 3 333 0.58 1.78 1.03 Fishing grounds 3 200 0.55 0.06 0.03 Built-up land 200 0.04 3.16 0.12 Total 12 606 2.18 1.00 2.18
WHAT IS “APPARENT CONSUMPTION”?
The footprints presented in the Living PlanetReport compare people’s consumption ineach country with the biosphere’s ecologicalcapacity. This means that a car produced inGermany, but sold in France, will be added tothe French footprint. We estimate each country’s consumption by adding its importsto its production, and subtracting its exports.
The resulting “apparent consumption” canbe distorted since it does not distinguishbetween production waste and consumption.This explains irregularities, as in the case ofIreland’s footprint. While consumptionpatterns in Ireland may be similar to those inthe United Kingdom, Ireland, with a large
agricultural sector and a small populationcompared to the UK, is charged with afootprint that corresponds to wastegenerated when producing food for export. But no official data exist to correctthat error, or similar errors affecting othersectors. For example, in more detailedaccounts, we would distinguish betweentypes of fish imported and exported since the biological capacity needed to produce a given amount of fish protein can vary byorders of magnitude, depending whether the fish consumed are top predators such as tuna, or species that are low down in the food chain.
Tourism footprints, which are included in the destination country’s footprint, shouldreally be assigned to the tourist's country of residence. These footprint misallocations can distort national accounts and skew the distribution of the global footprintresponsibility. However, these errors do not affect the overall global account (sincethere is no trade between the Earth and other planets).
ARE THE YIELDS BEHIND THE FOOTPRINT CALCULATIONS SUSTAINABLE?
In calculating the national footprints, we use yields for forests or fisheries that areoptimistic estimates of the maximum amount of a single species stock that can be harvested without reducing the stock’sproductivity over time. Harvesting within this maximum level is a necessary, but notsufficient, criterion for sustainability.
Taking less can still cause ecologicaldamage since the yield figures assumecareful harvest practices with no collateraldamage, no local overharvesting, and thesafeguarding of protected areas.
the ecological challenges and conflictshumanity needs to resolve if it wants toachieve global sustainability.
WHICH COUNTRIES ARESUSTAINABLE?
On pages 10–11, we compare each nation’sEcological Footprint per person with theworld average biological capacity availableper person. We have also compared eachcountry’s footprint with its own domesticbiological capacity. The difference between acountry’s footprint and its biological capacityis its “ecological deficit”, which is shown inTable 2. But these numbers do not indicatewhich countries are sustainable.
The minimum requirement for globalsustainability is that humanity’s footprintmust be smaller than the biosphere’sbiological capacity. What does this mean fornations? Is Sweden, with a large footprintper person, but even larger biological

14 LIVING PLANET REPORT 2000
C R O P L A N D F O O T P R I N T
Fig. 16:CROPLAND FOOTPRINTBY COUNTRY, 1996
Fig. 14:WORLD CROPLAND FOOTPRINT, 1961–97
Fig. 15:CROPLAND FOOTPRINT BY REGION, 1996
IRE
LAN
D
ES
TON
IA
DE
NM
AR
K
SP
AIN
CA
NA
DA
HU
NG
AR
Y
GR
EE
CE
HO
NG
KO
NG
(CH
INA
)
UN
ITE
D S
TATE
S
PO
LAN
D
ITA
LY
LITH
UA
NIA
FRA
NC
E
TUN
ISIA
BE
LAR
US
TAIW
AN
(CH
INA
)
PO
RTU
GA
L
AU
STR
IA
CZ
EC
H R
EP
.
UN
ITE
D A
RA
B E
MIR
ATE
S
SLO
VE
NIA
YU
GO
SLA
VIA
SW
ED
EN
ISR
AE
L
TUR
KE
Y
LEB
AN
ON
UN
ITE
D K
ING
DO
M
FIN
LAN
D
KO
RE
A, R
EP
.
AU
STR
ALI
A
RO
MA
NIA
GE
RM
AN
Y
LATV
IA
MO
RO
CC
O
MO
LDO
VA
SY
RIA
BE
LGIU
M/L
UX
EM
BO
UR
G
BU
LGA
RIA
ME
XIC
O
LIB
YA
UR
UG
UA
Y
JAP
AN
SW
ITZ
ER
LAN
D
KU
WA
IT
NO
RW
AY
MA
CE
DO
NIA
SA
UD
I AR
AB
IA
EG
YP
T
UK
RA
INE
THA
ILA
ND
NE
THE
RLA
ND
S
IRA
N
CO
STA
RIC
A
MA
UR
ITIU
S
KA
ZA
KH
STA
N
CH
INA
(MA
INLA
ND
)
ALB
AN
IA
MY
AN
MA
R
BR
AZ
IL
SO
UTH
AFR
ICA
NE
W Z
EA
LAN
D
CU
BA
ALG
ER
IA
CH
ILE
JOR
DA
N
PA
NA
MA
JAM
AIC
A
BO
SN
IA A
ND
HE
RZ
EG
OV
INA
NIG
ER
IA
IND
ON
ES
IA
NIG
ER
DO
MIN
ICA
N R
EP
.
CR
OA
TIA
PH
ILIP
PIN
ES
SIN
GA
PO
RE
0
2.5(0.79)
1.0(0.32)
0.5(0.16)
2.0(0.63)
1.5(0.47)
Are
a un
its (h
ecta
res)
per
per
son
1.4
0
Are
a un
its p
er p
erso
n
1.2
0.4
1.0
0.2
0.8
0.6
0.4
0
Hec
tare
s p
er p
erso
n
0.2
0.3
0.1
299 384 343 307 484 3 222Population (millions)
710
OE
CD
Non
-OE
CD
North AmericaWestern EuropeCentral and Eastern EuropeMiddle East and Central AsiaLatin America and the CaribbeanAsia/Pacific Africa
4
0
Bill
ion
area
uni
ts
Bill
ion
hect
ares
2
3
1
0.50
1.00
0.75
0.25
1.25
01960 1965 1970 1975 1980 1985 1990 1995
The cropland footprint of an individual is the area (of “world average” cropland)required to produce all the crops which thatindividual consumes. This includes allcereals, fruit and vegetables, roots andtubers, pulses, nuts, tea and coffee, sugar,margarine, and vegetable oils, as well astobacco, cotton, jute, and rubber. It alsoincludes crops fed to poultry and pigs, whichare converted to meat and consumed in theform of chicken or pigmeat.
To calculate the cropland footprint of acountry, it is necessary to convert the dietaryhabits of the population into the area of
average cropland required to produce thisdiet. This has been done for most of theworld’s countries and the results are shown in Figures 15 and 16, measured in bothhectares of average crop land and “area units”per person (see more detailed explanation onpage 12).
Figure 14 shows the growth in the world’scropland footprint since 1961. There wereapproximately 1.5 billion hectares of croplandavailable worldwide in 1996, of which about1.3 billion hectares were used for growingcrops, and the rest for grazing animals.Dividing 1.3 billion hectares by the world’s
population gives an average cropland footprint of 0.22 hectares, or 0.69 area units,per person.
The cropland footprint of the average NorthAmerican was more than twice the worldaverage, at 1.44 area units, whereas thecropland footprint of an average African orAsian was less than 0.60 area units. However,the cropland footprint shows less variancebetween nations than other components of theEcological Footprint.
Actions needed to reduce the world'scropland footprint: ■ Move to sustainablefarming systems that do not systematicallydegrade biological capacity; protect soil fromerosion and degradation caused by intensiveagriculture, overgrazing, or salinization. ■ Preserveexisting croplands for agriculture, rather thanurban and industrial development, road building,or non-essential crops such as tobacco. ■ Useagricultural chemicals in a way that takes accountof the assimilative capacity of agro-ecosystems,stop the use of hazardous pesticides andincrease the use of biological control and pest-resistant varieties. ■ Eliminate export subsidies.

15LIVING PLANET REPORT 2000
EC
UA
DO
R
VIE
T N
AM
IRA
Q
TRIN
IDA
D A
ND
TO
BA
GO
VE
NE
ZU
ELA
CO
LOM
BIA
KO
RE
A, D
.P.R
.
ZIM
BA
BW
E
UZ
BE
KIS
TAN
SLO
VA
KIA
CA
MB
OD
IA
GE
OR
GIA
IND
IA
PA
RA
GU
AY
EL
SA
LVA
DO
R
KY
RG
YZ
STA
N
GA
BO
N
TUR
KM
EN
ISTA
N
SE
NE
GA
L
NE
PA
L
MA
UR
ITA
NIA
MA
LAW
I
BE
NIN
RW
AN
DA
LAO
S
SU
DA
N
GU
INE
A
BU
RU
ND
I
TOG
O
AZ
ER
BA
IJA
N
GU
INE
A-B
ISS
AU
NIC
AR
AG
UA
PA
KIS
TAN
UG
AN
DA
AR
ME
NIA
GH
AN
A
OM
AN
GU
ATE
MA
LA
BU
RK
INA
FA
SO
PE
RU
HO
ND
UR
AS
MA
DA
GA
SC
AR
BA
NG
LAD
ES
H
ETH
IOP
IA
GA
MB
IA, T
HE
BO
TSW
AN
A
SIE
RR
A L
EO
NE
TAN
ZA
NIA
LES
OTH
O
CÔ
TE D
’IVO
IRE
AR
GE
NTI
NA
MA
LI
RU
SS
IAN
FE
DE
RA
TIO
N
AN
GO
LA
ZA
MB
IA
NA
MIB
IA
SR
I LA
NK
A
HA
ITI
YE
ME
N
CH
AD
CE
NTR
AL
AFR
ICA
N R
EP
.
MA
LAY
SIA
BO
LIV
IA
LIB
ER
IA
CO
NG
O
CA
ME
RO
ON
PA
PU
A N
EW
GU
INE
A
MO
ZA
MB
IQU
E
ER
ITR
EA
TAJI
KIS
TAN
CO
NG
O, D
EM
. RE
P. (
ZA
IRE
)
AFG
HA
NIS
TAN
MO
NG
OLI
A
KE
NY
A
BH
UTA
N
SO
MA
LIA
Existing cropland area per person
1.00 and over
0.70 – 1.00
0.50 – 0.70
0.40 – 0.50
less than 0.40
insufficent data
Map 5:CROPLAND FOOTPRINT BY COUNTRYArea units per person, 1996

16 LIVING PLANET REPORT 2000
G R A Z I N G L A N D F O O T P R I N T
Fig. 19:GRAZING LAND FOOTPRINTBY COUNTRY, 1996
Fig. 17:WORLD GRAZING LAND FOOTPRINT, 1961–97
NE
W Z
EA
LAN
D
UR
UG
UA
Y
IRE
LAN
D
AR
GE
NTI
NA
AU
STR
ALI
A
ITA
LY
MO
NG
OLI
A
NE
THE
RLA
ND
S
UN
ITE
D S
TATE
S
TAIW
AN
(CH
INA
)
YU
GO
SLA
VIA
SW
ITZ
ER
LAN
D
BE
LAR
US
ALB
AN
IA
FRA
NC
E
DE
NM
AR
K
NO
RW
AY
FIN
LAN
D
CA
NA
DA
PA
RA
GU
AY
BE
LGIU
M/L
UX
EM
BO
UR
G
GR
EE
CE
SW
ED
EN
ES
TON
IA
KA
ZA
KH
STA
N
BR
AZ
IL
AU
STR
IA
LITH
UA
NIA
UN
ITE
D A
RA
B E
MIR
ATE
S
SLO
VE
NIA
GE
RM
AN
Y
PO
RTU
GA
L
UN
ITE
D K
ING
DO
M
KO
RE
A, R
EP
.
UK
RA
INE
RU
SS
IAN
FE
DE
RA
TIO
N
KY
RG
YZ
STA
N
CO
STA
RIC
A
CH
ILE
SP
AIN
UZ
BE
KIS
TAN
PO
LAN
D
RO
MA
NIA
LATV
IA
TUR
KM
EN
ISTA
N
ISR
AE
L
CO
LOM
BIA
CZ
EC
H R
EP
.
PA
NA
MA
ME
XIC
O
BO
LIV
IA
EC
UA
DO
R
BU
LGA
RIA
KU
WA
IT
SO
MA
LIA
BO
TSW
AN
A
SLO
VA
KIA
SU
DA
N
VE
NE
ZU
ELA
HU
NG
AR
Y
TUR
KE
Y
GE
OR
GIA
LEB
AN
ON
CE
NTR
AL
AFR
ICA
N R
EP
.
AR
ME
NIA
MA
UR
ITIU
S
PA
PU
A N
EW
GU
INE
A
JAP
AN
MA
UR
ITA
NIA
SO
UTH
AFR
ICA
PA
KIS
TAN
NA
MIB
IA
HO
NG
KO
NG
(CH
INA
)
CR
OA
TIA
AZ
ER
BA
IJA
N
0
3.5(9.1)
1.0(2.6)
0.5(1.3)
2.5(6.5)
2.0(5.2)
3.0(7.8)
1.5(3.9)
Are
a un
its (h
ecta
res)
per
per
son
1.0
0
Are
a un
its p
er p
erso
n
0.6
0.4
0.8
0.2
2.5
0
Hec
tare
s p
er p
erso
n
1.5
1.0
2.0
0.5
299 384 343 307 484 3 222Population (millions)
710
OE
CD
Non
-OE
CD
North AmericaWestern EuropeCentral and Eastern EuropeMiddle East and Central AsiaLatin America and the CaribbeanAsia/PacificAfrica
2.0
0
Bill
ion
area
uni
ts
Bill
ion
hect
ares
1.0
1.5
0.5
2
4
3
1
5
01960 1965 1970 1975 1980 1985 1990 1995
Fig. 18:GRAZING LAND FOOTPRINT BY REGION, 1996
The grazing land footprint of an individual is the area (of “world average” grazing land)that is required to produce the animalproducts which that individual consumes.This includes all meat and dairy productsfrom cattle, sheep, and goats, as well ashides and wool (pigmeat and chicken areaccounted for under the cropland footprint –see page 14).
To calculate the grazing land footprint of a country, it is necessary to convert thenational consumption of animal products into the area of “average” grazing land
required to produce them. The results areshown in Figures 18 and 19, expressed inhectares of average grazing land and “areaunits” per person.
Figure 17 shows that the size of the worldgrazing land has increased slowly since the1960s. This is largely a result of clearing offorest land. There were approximately 4.6billion hectares of grazing land on the Earthin 1996, giving a world average availabilityof about 0.79 hectares of grazing land, or0.31 area units, per person. Assuming thatthis area was fully utilized, the world average
grazing land footprint in 1996 was also 0.31area units per person.
However, there was a fourfold disparitybetween the sizes of the grazing landfootprints of consumers in OECD and non-OECD countries, because of the greateremphasis on meat and dairy products in thediets of the richer nations. The exceptions arethe few lower-income countries, such asMongolia, with less productive land that isonly suitable for grazing.
Actions needed to reduce the world’sgrazing land footprint: ■ Reduce meat anddairy product consumption, especially in high-income countries. ■ Maintain traditionalgrazing systems that encourage and conservebiodiversity. ■ Change eating habits away fromresource-intensive foods. ■ Eliminate exportsubsidies.

17LIVING PLANET REPORT 2000
KE
NY
A
MA
CE
DO
NIA
MO
LDO
VA
SY
RIA
DO
MIN
ICA
N R
EP
.
CU
BA
IRA
N
MA
LI
OM
AN
EL
SA
LVA
DO
R
TUN
ISIA
MA
DA
GA
SC
AR
EG
YP
T
TAJI
KIS
TAN
ALG
ER
IA
BO
SN
IA A
ND
HE
RZ
EG
OV
INA
LIB
YA
SA
UD
I AR
AB
IA
HO
ND
UR
AS
NIC
AR
AG
UA
JAM
AIC
A
THA
ILA
ND
SIN
GA
PO
RE
ZIM
BA
BW
E
MO
RO
CC
O
NE
PA
L
TAN
ZA
NIA
PE
RU
CH
AD
SE
NE
GA
L
LES
OTH
O
GU
ATE
MA
LA
AFG
HA
NIS
TAN
GA
BO
N
IND
IA
CA
ME
RO
ON
JOR
DA
N
NIG
ER
UG
AN
DA
ETH
IOP
IA
AN
GO
LA
BU
RK
INA
FA
SO
CH
INA
(MA
INLA
ND
)
TRIN
IDA
D A
ND
TO
BA
GO
MA
LAY
SIA
ZA
MB
IA
GU
INE
A-B
ISS
AU
HA
ITI
BE
NIN
ER
ITR
EA
LAO
S
GA
MB
IA, T
HE
CO
NG
O
NIG
ER
IA
YE
ME
N
PH
ILIP
PIN
ES
IRA
Q
CÔ
TE D
’IVO
IRE
BH
UTA
N
MY
AN
MA
R
CA
MB
OD
IA
RW
AN
DA
GU
INE
A
SR
I LA
NK
A
BA
NG
LAD
ES
H
VIE
T N
AM
MO
ZA
MB
IQU
E
TOG
O
IND
ON
ES
IA
KO
RE
A, D
.P.R
.
BU
RU
ND
I
SIE
RR
A L
EO
NE
GH
AN
A
MA
LAW
I
LIB
ER
IA
CO
NG
O, D
EM
. RE
P. (
ZA
IRE
)
Existing grazing land area per person
1.00 and over
0.60 – 1.00
0.30 – 0.60
0.10 – 0.30
less than 0.10
insufficent data
Map 6:GRAZING LAND FOOTPRINT BY COUNTRYArea units per person, 1996

18 LIVING PLANET REPORT 2000
F O R E S T F O O T P R I N T
Fig. 22:FOREST FOOTPRINTBY COUNTRY, 1996
Fig. 20:WORLD FOREST FOOTPRINT, 1961–97
Fig. 21:FOREST FOOTPRINT BY REGION, 1996
FIN
LAN
D
SW
ED
EN
UN
ITE
D S
TATE
S
NO
RW
AY
CA
NA
DA
HO
NG
KO
NG
(CH
INA
)
NE
W Z
EA
LAN
D
AU
STR
IA
BE
LAR
US
PA
RA
GU
AY
DE
NM
AR
K
LIB
ER
IA
LATV
IA
CO
STA
RIC
A
ZA
MB
IA
JAP
AN
MA
LAY
SIA
GA
BO
N
BR
AZ
IL
SLO
VE
NIA
CH
ILE
AU
STR
ALI
A
KE
NY
A
CO
NG
O
GH
AN
A
UR
UG
UA
Y
PO
RTU
GA
L
LITH
UA
NIA
BE
LGIU
M/L
UX
EM
BO
UR
G
GU
ATE
MA
LA
SLO
VA
KIA
PA
PU
A N
EW
GU
INE
A
TAN
ZA
NIA
EC
UA
DO
R
FRA
NC
E
NE
THE
RLA
ND
S
IRE
LAN
D
HO
ND
UR
AS
SW
ITZ
ER
LAN
D
NIG
ER
IA
CZ
EC
H R
EP
.
CA
ME
RO
ON
BE
NIN
GA
MB
IA, T
HE
CO
NG
O, D
EM
. RE
P. (
ZA
IRE
)
GE
RM
AN
Y
SO
MA
LIA
BO
TSW
AN
A
CÔ
TE D
’IVO
IRE
MO
ZA
MB
IQU
E
RW
AN
DA
CE
NTR
AL
AFR
ICA
N R
EP
.
LAO
S
BU
RK
INA
FA
SO
SIN
GA
PO
RE
UN
ITE
D K
ING
DO
M
ITA
LY
MA
LAW
I
NE
PA
L
UG
AN
DA
BH
UTA
N
PO
LAN
D
SP
AIN
ETH
IOP
IA
IND
ON
ES
IA
SO
UTH
AFR
ICA
KO
RE
A, R
EP
.
NIC
AR
AG
UA
HA
ITI
EL
SA
LVA
DO
R
RO
MA
NIA
THA
ILA
ND
ZIM
BA
BW
E
GU
INE
A
BU
RU
ND
I0
Existingforest areaper person
2.5(1.40)
0.5(0.28)
1.0(0.56)
1.5(0.84)
2.0(1.12)
Are
a un
its (h
ecta
res)
per
per
son
1.2
0
Are
a un
its p
er p
erso
n
1.0
0.6
0.4
0.8
0.2
0.7
0
Hec
tare
s p
er p
erso
n0.5
0.3
0.2
0.4
0.1
0.6
299 384 343 307 484 3 222Population (millions)
710
OE
CD
Non
-OE
CD
North AmericaWestern EuropeCentral and Eastern EuropeMiddle East and Central AsiaLatin America and the CaribbeanAsia/PacificAfrica
2.0
0
Bill
ion
area
uni
ts
Bill
ion
hect
ares
1.0
1.5
0.5
0.6
1.0
0.8
0.4
0.2
1.2
01960 1965 1970 1975 1980 1985 1990 1995
The forest footprint of an individual is thearea (of “world average” forest land) requiredto produce the wood products which thatindividual consumes. This includes all thefuelwood and charcoal, roundwood (whetherin the form of sawnwood, wood-based panels,or fibreboard), paper, and paperboard.
To calculate the national forest footprint,it is necessary to convert the nationalconsumption of wood products into the areaof “average” forest land required to producethose products. The results are shown inFigures 21 and 22, expressed in hectares ofaverage forest land and “area units” per
person. The ranking does not refer to thequality of forests or sustainability of forestryactivities in each country; it only reflects eachcountry’s demand on forests worldwide.
There were approximately 3.3 billionhectares of forest in 1996, giving a worldaverage availability of forest land of about0.58 hectares per person. This translates into1.03 area units per person. The world averagewood product consumption in 1996 was 0.41m3 of wood raw material equivalent perperson per year. At average forestproductivity, this equates to a forest footprintof 0.28 area units per person. The forest
footprint of consumers in OECD countrieswas, on average, over three times larger thanthat of consumers in non-OECD countries.
Figure 20 shows the growth of the world’sforest footprint since 1961. The total forestfootprint of the global population adds up toapproximately 30 per cent of the world’scurrent forest cover. However, industrialforestry, which produces most of the world’stimber and pulp for paper, is concentrated in afew areas where the forest is not alwaysmanaged sustainably.
Actions needed to reduce pressure onforests: ■ Establish a network of ecologicallyrepresentative protected areas covering at least10 per cent of each forest type. ■ Ensure forestsoutside protected areas are well managedaccording to standards set by the ForestStewardship Council. ■ Stop all illegal logging. ■ Develop ecologically and socially appropriateforest restoration programmes. ■ Reduce forestdamage from pollution and climate change. ■ Promote the recycling and reuse of wood andpaper products.

19LIVING PLANET REPORT 2000
SIE
RR
A L
EO
NE
CH
AD
RU
SS
IAN
FE
DE
RA
TIO
N
ES
TON
IA
CA
MB
OD
IA
ISR
AE
L
UN
ITE
D A
RA
B E
MIR
ATE
S
CR
OA
TIA
MA
DA
GA
SC
AR
AN
GO
LA
SE
NE
GA
L
MA
LI
PH
ILIP
PIN
ES
NIG
ER
TAIW
AN
(CH
INA
)
SU
DA
N
TOG
O
SR
I LA
NK
A
CO
LOM
BIA
GU
INE
A-B
ISS
AU
HU
NG
AR
Y
MY
AN
MA
R
TUN
ISIA
TUR
KE
Y
VIE
T N
AM
AR
GE
NTI
NA
LEB
AN
ON
MA
CE
DO
NIA
GR
EE
CE
PA
NA
MA
BU
LGA
RIA
AFG
HA
NIS
TAN
MO
NG
OLI
A
PE
RU
CU
BA
CH
INA
(MA
INLA
ND
)
KU
WA
IT
LES
OTH
O
UK
RA
INE
IND
IA
ME
XIC
O
JAM
AIC
A
YU
GO
SLA
VIA
TRIN
IDA
D A
ND
TO
BA
GO
BA
NG
LAD
ES
H
MA
UR
ITIU
S
PA
KIS
TAN
BO
LIV
IA
SA
UD
I AR
AB
IA
SY
RIA
LIB
YA
IRA
N
KO
RE
A, D
.P.R
.
MO
RO
CC
O
ALG
ER
IA
DO
MIN
ICA
N R
EP
.
VE
NE
ZU
ELA
OM
AN
EG
YP
T
ALB
AN
IA
MO
LDO
VA
JOR
DA
N
KA
ZA
KH
STA
N
YE
ME
N
KY
RG
YZ
STA
N
AZ
ER
BA
IJA
N
BO
SN
IA A
ND
HE
RZ
EG
OV
INA
MA
UR
ITA
NIA
IRA
Q
TUR
KM
EN
ISTA
N
TAJI
KIS
TAN
UZ
BE
KIS
TAN
AR
ME
NIA
ER
ITR
EA
GE
OR
GIA
NA
MIB
IA
0.60 and over
0.40 – 0.60
0.30 – 0.40
0.15 – 0.30
less than 0.15
insufficent data
Map 7:FOREST FOOTPRINT BY COUNTRYArea units per person, 1996

F I S H I N G G R O U N D F O O T P R I N T
Fig. 25:FISHING GROUND FOOTPRINTBY COUNTRY, 1996
Fig. 23:WORLD FISHING GROUND FOOTPRINT, 1961–97
Fig. 24:FISHING GROUND FOOTPRINT BY REGION, 1996
NO
RW
AY
DE
NM
AR
K
CH
ILE
JAP
AN
PE
RU
PO
RTU
GA
L
KO
RE
A, R
EP
.
MA
LAY
SIA
FIN
LAN
D
SIN
GA
PO
RE
HO
NG
KO
NG
(CH
INA
)
GA
BO
N
THA
ILA
ND
TAIW
AN
(CH
INA
)
SP
AIN
LATV
IA
KO
RE
A, D
.P.R
.
PA
NA
MA
LITH
UA
NIA
GR
EE
CE
ES
TON
IA
NE
W Z
EA
LAN
D
AU
STR
ALI
A
PH
ILIP
PIN
ES
FRA
NC
E
SW
ED
EN
NE
THE
RLA
ND
S
ITA
LY
UN
ITE
D A
RA
B E
MIR
ATE
S
JAM
AIC
A
MA
UR
ITIU
S
OM
AN
SO
UTH
AFR
ICA
RU
SS
IAN
FE
DE
RA
TIO
N
ISR
AE
L
GA
MB
IA, T
HE
CA
NA
DA
SE
NE
GA
L
CH
INA
(MA
INLA
ND
)
UN
ITE
D S
TATE
S
BE
LGIU
M/L
UX
EM
BO
UR
G
UN
ITE
D K
ING
DO
M
SW
ITZ
ER
LAN
D
VE
NE
ZU
ELA
YU
GO
SLA
VIA
SR
I LA
NK
A
CZ
EC
H R
EP
.
IRE
LAN
D
IND
ON
ES
IA
SLO
VA
KIA
CO
NG
O
HU
NG
AR
Y
PO
LAN
D
MO
RO
CC
O
GH
AN
A
AU
STR
IA
MY
AN
MA
R
MA
UR
ITA
NIA
GE
RM
AN
Y
SLO
VE
NIA
RO
MA
NIA
CÔ
TE D
’IVO
IRE
TRIN
IDA
D A
ND
TO
BA
GO
LEB
AN
ON
KU
WA
IT
MA
CE
DO
NIA
IRA
N
TUR
KE
Y
TOG
O
CU
BA
PA
PU
A N
EW
GU
INE
A
AR
GE
NTI
NA
DO
MIN
ICA
N R
EP
.
ME
XIC
O
SIE
RR
A L
EO
NE
0
0.6(9.6)
0.1(1.6)
0.4(6.4)
0.3(4.8)
0.5(8.0)
0.2(3.2)
Are
a un
its (h
ecta
res)
per
per
son
0.10
0
Are
a un
its p
er p
erso
n
0.06
0.04
0.08
0.02
1.6
0
Hec
tare
s p
er p
erso
n
0.8
1.2
0.4
299 384 343 307 484 3 222Population (millions)
710
OE
CD
Non
-OE
CD
North AmericaWestern EuropeCentral and Eastern EuropeMiddle East and Central AsiaLatin America and the CaribbeanAsia/Pacific Africa
0.30
0
Bill
ion
area
uni
ts
Bill
ion
hect
ares
0.15
0.25
0.20
0.10
0.05
3
4
2
1
5
01960 1965 1970 1975 1980 1985 1990 1995
The fishing ground footprint of an individualis the area (of “world average” fishingground) required to produce the marine fishand seafood products which that individualconsumes. This includes all the sea fish,crustaceans, and cephalopods, as well as allfishmeal and oils that are fed to animals. Italso includes an additional 25 per cent toallow for bycatch, which is generallydiscarded back to the sea.
To calculate the fishing ground footprint of a country, it is necessary to convert thenational consumption of marine fish andseafood into the area of “average” fishing
grounds required to produce it. The resultsare shown in Figures 24 and 25, expressed in hectares of average fishing grounds and“area units”.
There were approximately 3.2 billionhectares of fishing grounds in 1996, giving a world average availability of about 0.55hectares, or 0.03 area units per person.
Figure 23 shows the growth in the world’sfishing ground footprint since 1961. Theworld average marine fish and seafoodconsumption in 1996 was 23kg per personper year. At average productivity, thisequates to a fishing ground footprint of
0.04 area units per person. The total fishingground footprint of the world’s populationtherefore exceeded the availability of theworld’s fishing grounds by approximately 30 per cent. In other words, the level ofconsumption exceeded the productivecapacity of the world’s fishing grounds byalmost a third. The average fishing groundfootprint of an OECD country consumer was about three times that of an average non-OECD country consumer.
Actions needed to reduce pressure onfisheries: ■ Reduce the incidental killing ofunwanted fish and other marine wildlife thataccounts for more than a quarter of the worldcatch. ■ Eliminate destructive fishing practices,such as cyanide and blast fishing on coral reefs.■ Cut the government subsidies that contribute tooverfishing. ■ Support management schemesthat protect artisinal fisheries and local economies.■ Promote market incentives for sustainable fishing,such as the Marine Stewardship Council. ■ Designate marine protected areas to safeguardmarine ecosystems and give depleted fishpopulations a chance to recover.
20 LIVING PLANET REPORT 2000

21LIVING PLANET REPORT 2000
TUN
ISIA
GU
INE
A
LIB
YA
EC
UA
DO
R
CO
LOM
BIA
AN
GO
LA
VIE
T N
AM
SA
UD
I AR
AB
IA
BE
LAR
US
BR
AZ
IL
CA
ME
RO
ON
YE
ME
N
UR
UG
UA
Y
BO
TSW
AN
A
CR
OA
TIA
NIG
ER
IA
UK
RA
INE
GU
INE
A-B
ISS
AU
JOR
DA
N
EG
YP
T
CO
STA
RIC
A
LES
OTH
O
ZIM
BA
BW
E
BE
NIN
ALG
ER
IA
HO
ND
UR
AS
MA
DA
GA
SC
AR
CA
MB
OD
IA
BU
LGA
RIA
CO
NG
O, D
EM
. RE
P. (
ZA
IRE
)
LIB
ER
IA
IND
IA
EL
SA
LVA
DO
R
PA
KIS
TAN
HA
ITI
NIC
AR
AG
UA
BA
NG
LAD
ES
H
MO
ZA
MB
IQU
E
GU
ATE
MA
LA
TAN
ZA
NIA
SO
MA
LIA
ALB
AN
IA
ER
ITR
EA
GE
OR
GIA
BO
SN
IA A
ND
HE
RZ
EG
OV
INA
ZA
MB
IA
KA
ZA
KH
STA
N
SY
RIA
PA
RA
GU
AY
LAO
S
BO
LIV
IA
MO
LDO
VA
BU
RK
INA
FA
SO
KE
NY
A
KY
RG
YZ
STA
N
SU
DA
N
MA
LI
NIG
ER
MA
LAW
I
BU
RU
ND
I
NA
MIB
IA
CE
NTR
AL
AFR
ICA
N R
EP
.
IRA
Q
RW
AN
DA
CH
AD
UZ
BE
KIS
TAN
TUR
KM
EN
ISTA
N
MO
NG
OLI
A
TAJI
KIS
TAN
AZ
ER
BA
IJA
N
NE
PA
L
ETH
IOP
IA
AFG
HA
NIS
TAN
AR
ME
NIA
BH
UTA
N
UG
AN
DA
Existing fishing ground area per person
0.10 and over
0.05 – 0.10
0.03 – 0.05
0.01 – 0.03
less than 0.01
insufficent data
Map 8:FISHING GROUND FOOTPRINT BY COUNTRYArea units per person, 1996

C A R B O N D I O X I D E F O O T P R I N T
Fig. 28:CARBON DIOXIDE FOOTPRINTBY COUNTRY, 1996
Fig. 26:WORLD CARBON DIOXIDE FOOTPRINT, 1961–97
Fig. 27:CARBON DIOXIDE FOOTPRINT BY REGION, 1996
UN
ITE
D A
RA
B E
MIR
ATE
S
SIN
GA
PO
RE
KU
WA
IT
UN
ITE
D S
TATE
S
DE
NM
AR
K
SA
UD
I AR
AB
IA
AU
STR
ALI
A
IRE
LAN
D
HO
NG
KO
NG
(CH
INA
)
FRA
NC
E
CZ
EC
H R
EP
.
SW
ITZ
ER
LAN
D
ES
TON
IA
GE
RM
AN
Y
UN
ITE
D K
ING
DO
M
JAP
AN
CA
NA
DA
RU
SS
IAN
FE
DE
RA
TIO
N
KO
RE
A, R
EP
.
ISR
AE
L
LIB
YA
BE
LGIU
M/L
UX
EM
BO
UR
G
FIN
LAN
D
NE
W Z
EA
LAN
D
SW
ED
EN
PO
LAN
D
NE
THE
RLA
ND
S
KA
ZA
KH
STA
N
SLO
VE
NIA
UK
RA
INE
GR
EE
CE
MO
NG
OLI
A
OM
AN
SO
UTH
AFR
ICA
TUR
KM
EN
ISTA
N
MA
LAY
SIA
SP
AIN
SLO
VA
KIA
ITA
LY
HU
NG
AR
Y
BU
LGA
RIA
AU
STR
IA
LITH
UA
NIA
BE
LAR
US
PO
RTU
GA
L
MA
CE
DO
NIA
NO
RW
AY
VE
NE
ZU
ELA
JAM
AIC
A
TAIW
AN
(CH
INA
)
TRIN
IDA
D A
ND
TO
BA
GO
YU
GO
SLA
VIA
LEB
AN
ON
UZ
BE
KIS
TAN
RO
MA
NIA
AR
GE
NTI
NA
IRA
N
AZ
ER
BA
IJA
N
THA
ILA
ND
LATV
IA
SY
RIA
MA
UR
ITIU
S
CR
OA
TIA
ME
XIC
O
KO
RE
A, D
.P.R
.
IRA
Q
CH
ILE
UR
UG
UA
Y
TUR
KE
Y
CU
BA
PA
NA
MA
MO
LDO
VA
JOR
DA
N
CH
INA
(MA
INLA
ND
)
ALG
ER
IA
0
14(38.3)
2(5.5)
6(16.4)
8(21.9)
10(27.4)
12(32.9)
4(11.0)
Are
a un
its p
er p
erso
n (to
nnes
of C
O2
per
per
son
per
yea
r) 6
4
2
8
0
Are
a un
its p
er p
erso
n
20
0
Tonn
es o
f CO
2 p
er p
erso
n p
er y
ear
299 384 343 307 484 3 222Population (millions)
710
OE
CD
Non
-OE
CD
North AmericaWestern EuropeCentral and Eastern EuropeMiddle East and Central AsiaLatin America and the CaribbeanAsia/PacificAfrica
8
0
Bill
ion
area
uni
ts
Bill
ion
tonn
es o
f CO
2 p
er y
ear
4
6
2
15
10
5
15
10
5
20
01960 1965 1970 1975 1980 1985 1990 1995
The carbon dioxide (CO2) footprint of anindividual is the area (of “world average”forest) which would be required to absorb allCO2 emissions resulting from that individual’senergy consumption. This includes the directuse of coal, oil, or gas as fuel in the home orfor private transport, and indirect use from theconsumption of electricity (other than fromrenewable sources), public transport,manufactured goods, or other services.
To calculate the CO2 footprint of a country, itis necessary to take the national consumption ofenergy from fossil fuels plus the net import of“embodied energy” in manufactured products.
The total energy consumption is then convertedinto the area of average forest land required toabsorb the resulting CO2 emissions, using thepresent rate of carbon absorption by the world’sforests. This has been done for most of theworld’s countries and the results are shown inFigures 27 and 28, measured in both tonnes ofCO2 emitted per person per year and “areaunits” per person. Scientists believe, however,that the CO2 sequestration rate of forests willdecline in future decades as the atmosphericCO2 level and global temperature increase.
Figure 26 shows that global CO2 emissionsstood at 24 billion tonnes per year in 1996, a
Actions needed to reduce energyconsumption and CO2 emissions: ■ Increasethe use of energy-saving technologies; eliminatewasteful energy consumption in transport, industry,and the home. ■ Increase the supply of energyfrom sources which reduce or eliminate pollution,especially renewable sources such as solar andwind. ■ Assist lower-income countries to invest insustainable energy technologies. ■ Increaseenergy prices to cover the full environmental costsof energy use, and remove government subsidieson energy. ■ Stop deforestation and promotereforestation of deforested areas in an ecologicallyand socially appropriate manner.
threefold increase since 1961. The worldaverage CO2 emission in 1996 was about 4tonnes per person per year. At average forestproductivity, this equates to a CO2 absorptionfootprint of 1.41 area units per person. TheIntergovernmental Panel on Climate Change hasstated that global CO2 emissions must be cut toat least 50 per cent of the 1990 level by the year2050 in order to stabilize the atmospheric CO2concentration at its present level.
International disparities in per capita emissionsare greater than in any other sector. The OECDconsumer’s average CO2 footprint was morethan five times that of the non-OECD consumer.
LIVING PLANET REPORT 200022

EC
UA
DO
R
CO
STA
RIC
A
GA
BO
N
CO
LOM
BIA
EG
YP
T
PH
ILIP
PIN
ES
KY
RG
YZ
STA
N
TUN
ISIA
EL
SA
LVA
DO
R
PA
RA
GU
AY
BR
AZ
IL
BO
TSW
AN
A
BO
SN
IA A
ND
HE
RZ
EG
OV
INA
ZIM
BA
BW
E
DO
MIN
ICA
N R
EP
.
BO
LIV
IA
IND
ON
ES
IA
PE
RU
MA
UR
ITA
NIA
HO
ND
UR
AS
TAJI
KIS
TAN
GU
ATE
MA
LA
NIC
AR
AG
UA
MO
RO
CC
O
IND
IA
SR
I LA
NK
A
YE
ME
N
AR
ME
NIA
PA
KIS
TAN
PA
PU
A N
EW
GU
INE
A
BH
UTA
N
NIG
ER
IA
ALB
AN
IA
CO
NG
O
VIE
T N
AM
GE
OR
GIA
SE
NE
GA
L
GH
AN
A
CÔ
TE D
’IVO
IRE
KE
NY
A
TOG
O
AN
GO
LA
ZA
MB
IA
BA
NG
LAD
ES
H
GU
INE
A-B
ISS
AU
MY
AN
MA
R
GA
MB
IA, T
HE
MA
LAW
I
NIG
ER
SU
DA
N
GU
INE
A
LIB
ER
IA
HA
ITI
MA
DA
GA
SC
AR
MO
ZA
MB
IQU
E
BU
RK
INA
FA
SO
CE
NTR
AL
AFR
ICA
N R
EP
.
SIE
RR
A L
EO
NE
CO
NG
O, D
EM
. RE
P. (
ZA
IRE
)
RW
AN
DA
NE
PA
L
BE
NIN
ETH
IOP
IA
TAN
ZA
NIA
LAO
S
AFG
HA
NIS
TAN
UG
AN
DA
BU
RU
ND
I
CA
MB
OD
IA
MA
LI
CH
AD
CA
ME
RO
ON
SO
MA
LIA
ER
ITR
EA
LES
OTH
O
NA
MIB
IA
Maximum average level of CO2 emissions per personto stabilize atmospheric concentrations
4.0 and over
2.0 – 4.0
1.0 – 2.0
0.1 – 1.0
less than 0.1
insufficent data
Map 9:CARBON DIOXIDE FOOTPRINT BY COUNTRYArea units per person, 1996
LIVING PLANET REPORT 2000 23

0 = negligible I.D. = insufficient data n.a. = not applicable Totals may not add up due to rounding
Table 2: E C O L O G I C A L F O O T P R I N T D A TA , 1996
Population Cropland Grazing land Forest Fishing CO2 Built-up Total 1 ha local 1 ha local 1 ha local Existing Nationalfootprint footprint footprint ground footprint land ecological cropland grazing forest biological ecological
footprint footprint footprint land capacity deficit(area units (area units (area units (area units (area units (area units (area units (in area (in area (in area (area units (area units
(thousands) per person) per person) per person) per person) per person) per person) per person) units) units) units) per person) per person)
World 5 744 872 0.69 0.31 0.28 0.04 1.41 0.12 2.85 2.18
OECD 1 091 037 1.18 0.79 0.64 0.09 4.08 0.43 7.22 3.42 -3.80 NON-OECD 4 658 746 0.55 0.22 0.20 0.03 0.75 0.05 1.81 1.82 0.01
AFRICA 709 988 0.48 0.16 0.32 0.02 0.34 0.01 1.33 1.73 0.40 Algeria 28 719 0.63 0.23 0.07 0.01 0.84 0.01 1.79 1.67 0.17 1.08 0.58 -1.21 Angola 11 342 0.32 0.12 0.25 0.02 0.09 0.01 0.82 1.23 0.02 1.22 2.74 1.92 Benin 5 480 0.42 0.09 0.42 0.01 0.03 0.00 0.97 1.65 0.74 1.29 1.55 0.58 Botswana 1 509 0.36 0.44 0.40 0.02 0.45 0.02 1.68 0.56 0.02 0.61 1.92 0.24 Burkina Faso 10 704 0.38 0.12 0.37 0.00 0.04 0.00 0.90 1.07 0.08 0.99 0.79 -0.11 Burundi 6 265 0.41 0.04 0.28 0.00 0.02 0.00 0.75 2.66 0.24 1.11 0.50 -0.25 Cameroon 13 549 0.29 0.14 0.42 0.02 0.00 0.01 0.89 1.68 0.09 2.57 4.23 3.35 Central African Republic 3 354 0.30 0.38 0.39 0.00 0.03 0.02 1.12 1.14 0.06 1.56 14.51 13.38 Chad 6 899 0.30 0.17 0.28 0.00 0.00 0.00 0.75 0.84 0.02 0.89 1.54 0.79 Congo, Rep. 2 634 0.29 0.08 0.54 0.04 0.18 0.01 1.15 1.92 0.01 2.66 20.04 18.89 Côte d’Ivoire 13 816 0.34 0.08 0.40 0.03 0.10 0.00 0.95 1.29 0.08 1.75 2.00 1.05 Egypt 63 497 0.75 0.23 0.06 0.01 0.61 0.04 1.70 8.12 11.41 1.08 0.64 -1.06 Eritrea 3 300 0.26 0.09 I.D. 0.00 I.D. 0.00 0.35 0.80 0.05 n.a. 0.24 -0.11 Ethiopia 56 789 0.37 0.12 0.34 0.00 0.02 0.00 0.85 1.63 0.32 1.40 0.68 -0.18 Gabon 1 107 0.45 0.15 0.61 0.13 0.68 0.03 2.06 1.56 0.00 2.09 33.77 31.72 Gambia 1 150 0.36 0.09 0.42 0.06 0.06 0.00 0.99 1.30 0.41 1.14 0.40 -0.60 Ghana 18 154 0.39 0.03 0.53 0.04 0.11 0.01 1.12 1.95 0.06 1.51 1.20 0.08 Guinea 7 275 0.41 0.06 0.29 0.02 0.05 0.00 0.85 1.69 0.03 1.55 1.60 0.75 Guinea-Bissau 1 111 0.40 0.09 0.22 0.01 0.07 0.00 0.80 1.68 0.32 1.31 2.92 2.12 Kenya 27 851 0.19 0.30 0.55 0.00 0.10 0.01 1.15 1.87 0.22 1.52 0.57 -0.59 Lesotho 1 970 0.35 0.16 0.13 0.01 I.D. 0.04 0.70 1.56 0.21 n.a. 0.45 -0.24 Liberia 2 198 0.29 0.02 0.79 0.01 0.05 0.00 1.16 1.63 0.02 2.32 5.10 3.95 Libya 5 086 0.82 0.23 0.08 0.02 3.20 0.01 4.36 0.93 0.07 1.08 0.58 -3.78 Madagascar 14 183 0.37 0.24 0.26 0.01 0.05 0.01 0.93 2.25 0.11 2.08 2.93 2.00 Malawi 9 835 0.42 0.03 0.36 0.00 0.06 0.00 0.87 1.84 0.15 1.29 0.77 -0.10 Mali 10 186 0.33 0.26 0.25 0.00 0.02 0.00 0.86 0.95 0.08 0.90 1.27 0.41 Mauritania 2 394 0.43 0.35 0.00 0.04 0.41 0.00 1.22 1.07 0.02 n.a. 0.62 -0.60 Mauritius 1 124 0.70 0.37 0.09 0.07 1.22 0.01 2.45 3.17 0.61 n.a. 2.23 -0.23 Morocco 26 417 0.92 0.19 0.08 0.04 0.32 0.02 1.56 2.12 0.18 1.08 0.99 -0.57 Mozambique 17 950 0.26 0.05 0.39 0.00 0.04 0.00 0.76 1.11 0.02 0.90 1.11 0.35 Namibia 1 583 0.32 0.32 I.D. 0.00 I.D. 0.02 0.66 0.53 0.02 0.61 1.83 1.17 Niger 9 454 0.54 0.13 0.24 0.00 0.05 0.00 0.97 0.48 0.12 0.61 0.42 -0.56 Nigeria 101 413 0.58 0.08 0.43 0.01 0.20 0.00 1.31 1.76 0.19 1.70 0.88 -0.43 Rwanda 5 475 0.42 0.06 0.39 0.00 0.03 0.00 0.90 1.90 0.34 1.61 0.42 -0.48 Senegal 8 548 0.44 0.16 0.25 0.06 0.14 0.00 1.06 0.95 0.15 1.00 0.95 -0.11
LIVING PLANET REPORT 200024

Population Cropland Grazing land Forest Fishing CO2 Built-up Total 1 ha local 1 ha local 1 ha local Existing Nationalfootprint footprint footprint ground footprint land ecological cropland grazing forest biological ecological
footprint footprint footprint land capacity deficit(area units (area units (area units (area units (area units (area units (area units (in area (in area (in area (area units (area units
(thousands) per person) per person) per person) per person) per person) per person) per person) units) units) units) per person) per person)
Sierra Leone 4 289 0.35 0.04 0.28 0.03 0.03 0.00 0.73 1.63 0.07 2.58 1.40 0.67 Somalia 8 467 0.11 0.46 0.40 0.00 0.00 0.00 0.97 0.50 0.07 n.a. 0.74 -0.23 South Africa 38 126 0.65 0.33 0.33 0.07 2.59 0.08 4.04 2.80 0.17 1.08 1.39 -2.65 Sudan 27 160 0.42 0.42 0.24 0.00 0.05 0.01 1.14 0.82 0.09 0.93 1.76 0.62 Tanzania 30 700 0.35 0.17 0.47 0.00 0.02 0.00 1.02 1.77 0.13 1.04 1.34 0.33 Togo 4 172 0.41 0.05 0.23 0.03 0.10 0.00 0.82 1.08 0.21 1.40 0.83 0.00 Tunisia 9 081 1.32 0.24 0.20 0.03 0.48 0.01 2.27 1.87 0.56 1.08 1.22 -1.05 Uganda 19 464 0.39 0.12 0.34 I.D. 0.02 0.00 0.88 1.47 0.69 1.58 1.01 0.13 Zaire (Congo, DR) 46 772 0.22 0.01 0.41 0.01 0.03 0.01 0.69 1.47 0.01 2.88 6.94 6.25 Zambia 8 389 0.32 0.09 0.67 0.00 0.08 0.05 1.21 2.20 0.02 1.06 4.24 3.03 Zimbabwe 11 045 0.47 0.19 0.30 0.01 0.44 0.04 1.45 1.88 0.11 0.02 0.68 -0.77
MIDDLE EAST ANDCENTRAL ASIA 307 001 0.69 0.33 0.09 0.02 1.55 0.06 2.73 0.91 -1.82 Afghanistan 20 368 0.22 0.16 0.17 I.D. 0.02 0.02 0.58 1.44 0.10 0.16 0.38 -0.19 Armenia 3 564 0.39 0.37 I.D. I.D. 0.26 0.14 1.16 2.34 1.13 0.19 0.69 -0.47 Azerbaijan 7 609 0.40 0.30 0.01 0.00 1.36 0.10 2.18 1.89 0.67 0.16 0.64 -1.54 Georgia 5 187 0.46 0.39 I.D. 0.00 0.16 0.11 1.14 2.02 1.00 0.64 1.22 0.08 Iran 63 469 0.70 0.26 0.08 0.03 1.37 0.02 2.47 2.27 0.27 1.08 0.76 -1.71 Iraq 20 608 0.49 0.08 0.00 0.00 1.14 0.02 1.73 1.13 0.30 1.08 0.35 -1.38 Israel 5 722 1.10 0.52 0.26 0.06 3.33 0.13 5.40 3.05 15.12 1.08 0.76 -4.64 Jordan 5 938 0.61 0.14 0.04 0.01 0.89 0.02 1.71 1.57 0.54 1.08 0.21 -1.50 Kazakhstan 16 436 0.68 0.77 0.03 0.00 2.87 0.11 4.45 0.81 0.08 0.15 2.05 -2.40 Kuwait 1 686 0.78 0.46 0.13 0.03 8.49 0.42 10.31 5.80 1.97 1.08 0.65 -9.67 Kyrgyzstan 4 596 0.45 0.62 0.01 0.00 0.48 0.29 1.87 2.64 0.36 0.16 1.50 -0.37 Lebanon 3 083 1.04 0.38 0.18 0.03 1.49 0.06 3.19 4.23 8.10 1.08 0.69 -2.50 Oman 2 230 0.39 0.26 0.06 0.07 2.60 0.02 3.39 2.90 0.30 n.a. 0.70 -2.69 Saudi Arabia 18 829 0.77 0.22 0.08 0.02 4.97 0.08 6.15 4.28 0.02 1.08 0.41 -5.74 Syria 14 571 0.90 0.28 0.08 0.00 1.28 0.02 2.56 2.35 0.48 1.08 1.10 -1.46 Tajikistan 5 836 0.23 0.23 0.00 0.00 0.34 0.11 0.90 2.04 0.30 0.16 0.47 -0.44 Turkey 62 332 1.10 0.41 0.20 0.03 0.97 0.03 2.73 2.80 0.76 0.98 1.49 -1.24 Turkmenistan 4 156 0.45 0.53 0.00 0.00 2.48 0.15 3.62 1.86 0.08 0.02 1.02 -2.60 United Arab Emirates 2 260 1.17 0.70 0.26 0.08 13.58 0.20 15.99 8.53 3.35 1.08 0.68 -15.31 Uzbekistan 22 848 0.47 0.56 0.00 0.00 1.47 0.16 2.65 2.82 0.81 0.01 0.96 -1.70 Yemen 15 674 0.31 0.08 0.01 0.02 0.27 0.00 0.69 1.44 0.08 1.08 0.27 -0.42
ASIA/PACIFIC 3 222 295 0.58 0.16 0.18 0.05 0.78 0.03 1.78 1.11 -0.67Australia 18 141 0.98 1.60 0.58 0.09 4.79 0.44 8.49 2.63 0.11 1.08 9.42 0.93 Bangladesh 120 594 0.37 0.06 0.10 0.00 0.07 0.00 0.60 3.11 0.63 3.60 0.08 -0.52 Bhutan 1 893 0.14 0.07 0.34 I.D. 0.23 0.01 0.79 1.42 0.14 1.97 2.60 1.82 Cambodia 10 234 0.46 0.07 0.26 0.01 0.02 0.02 0.83 2.08 0.18 2.31 3.12 2.29 China (mainland) 1 232 456 0.68 0.11 0.13 0.06 0.84 0.02 1.84 5.77 0.36 1.08 0.89 -0.96 Hong Kong (China) 6 363 1.43 0.31 1.02 0.14 4.24 0.01 7.14 n.a. 19.45 n.a. 0.08 -67.07 India 949 997 0.46 0.15 0.12 0.01 0.31 0.01 1.06 2.64 4.25 2.30 0.74 -0.32
25LIVING PLANET REPORT 2000

Indonesia 200 415 0.58 0.05 0.33 0.05 0.42 0.06 1.48 4.70 0.32 4.84 3.18 1.70 Japan 125 769 0.80 0.35 0.63 0.23 3.75 0.18 5.94 7.35 20.89 1.08 0.86 -5.08 Korea, DPR 22 610 0.47 0.04 0.08 0.11 1.17 0.05 1.92 3.78 0.76 1.08 0.73 -1.19 Korea, Rep. 45 345 1.02 0.66 0.32 0.17 3.36 0.07 5.60 7.63 n.a. 1.08 0.74 -4.86 Lao PDR 4 902 0.42 0.09 0.37 0.00 0.02 0.01 0.91 3.01 0.26 2.69 7.29 6.39 Malaysia 20 549 0.29 0.10 0.61 0.17 2.45 0.07 3.68 3.44 0.03 4.89 3.97 0.29 Mongolia 2 495 0.20 1.23 0.16 0.00 2.68 0.02 4.30 0.90 0.67 1.08 5.67 1.37 Myanmar 43 393 0.67 0.07 0.20 0.04 0.07 0.02 1.07 3.39 0.50 2.97 2.71 1.65 Nepal 21 791 0.44 0.18 0.35 0.00 0.03 0.00 1.01 2.37 1.44 2.29 0.94 -0.07 New Zealand 3 720 0.65 3.39 1.00 0.10 3.09 1.31 9.54 6.63 2.02 1.08 15.80 6.26 Pakistan 140 055 0.39 0.33 0.08 0.01 0.26 0.01 1.09 2.63 4.12 1.19 0.68 -0.40 Papua New Guinea 4 399 0.28 0.36 0.48 0.03 0.23 0.01 1.40 1.75 0.01 3.79 31.60 30.20 Philippines 69 902 0.51 0.08 0.25 0.09 0.49 0.01 1.42 2.93 0.47 4.39 0.89 -0.54 Singapore 3 375 0.50 0.19 0.36 0.14 11.03 0.13 12.35 3.17 n.a. 4.91 0.13 -12.21 Sri Lanka 18 096 0.31 0.06 0.23 0.05 0.28 0.02 0.95 3.47 0.51 2.35 0.52 -0.43 Taiwan 21 471 1.28 1.08 0.24 0.13 1.60 0.02 4.34 3.17 0.32 1.08 0.20 -4.14 Thailand 59 172 0.74 0.20 0.31 0.13 1.30 0.03 2.70 2.94 0.57 2.55 1.35 -1.35 Viet Nam 75 159 0.50 0.05 0.19 0.02 0.17 0.02 0.95 4.09 2.06 1.91 0.65 -0.30
LATIN AMERICA ANDTHE CARIBBEAN 483 837 0.59 0.62 0.35 0.04 0.77 0.08 2.46 6.39 3.93 Argentina 35 219 0.34 1.68 0.18 0.03 1.39 0.17 3.79 3.40 0.37 1.08 5.10 1.31 Bolivia 7 593 0.29 0.48 0.08 0.00 0.42 0.02 1.29 2.12 0.08 2.05 13.25 11.96 Brazil 161 533 0.65 0.74 0.61 0.02 0.46 0.12 2.60 3.13 0.56 2.91 11.56 8.96 Chile 14 421 0.61 0.61 0.58 0.32 1.13 0.14 3.39 5.23 0.34 1.08 2.01 -1.38 Colombia 39 288 0.48 0.52 0.22 0.02 0.61 0.04 1.90 3.77 0.47 3.55 5.66 3.76 Costa Rica 3 652 0.70 0.62 0.68 0.01 0.72 0.04 2.77 4.68 0.87 2.73 2.16 -0.60 Cuba 11 018 0.64 0.27 0.14 0.03 0.96 0.05 2.10 2.33 0.56 1.69 1.11 -0.98 Dominican Republic 7 961 0.53 0.28 0.07 0.03 0.42 0.03 1.37 3.49 0.87 2.35 1.03 -0.34 Ecuador 11 699 0.50 0.47 0.46 0.02 0.77 0.03 2.26 2.30 0.54 3.10 4.00 1.74 El Salvador 5 789 0.46 0.25 0.32 0.01 0.46 0.05 1.55 2.76 1.59 2.37 0.68 -0.87 Guatemala 10 244 0.38 0.16 0.49 0.00 0.33 0.03 1.40 2.69 0.33 3.41 1.76 0.36 Haiti 7 689 0.31 0.09 0.32 0.01 0.05 0.00 0.78 1.39 1.08 2.09 0.30 -0.48 Honduras 5 816 0.37 0.21 0.45 0.01 0.37 0.02 1.43 2.12 0.25 2.37 2.26 0.83 Jamaica 2 495 0.60 0.20 0.12 0.07 1.66 0.03 2.68 3.41 0.95 2.67 0.73 -1.95 Mexico 92 718 0.83 0.48 0.12 0.03 1.19 0.04 2.69 3.06 0.40 1.29 1.65 -1.04 Nicaragua 4 552 0.40 0.20 0.32 0.01 0.32 0.02 1.26 2.36 0.27 3.04 4.22 2.96 Panama 2 677 0.61 0.48 0.17 0.11 0.94 0.05 2.35 2.49 0.57 3.00 4.18 1.82 Paraguay 4 957 0.46 0.83 0.92 0.00 0.46 0.18 2.84 2.89 0.20 1.53 5.53 2.68 Peru 23 944 0.38 0.17 0.14 0.22 0.41 0.02 1.33 3.26 0.08 3.17 9.23 7.90 Trinidad & Tobago 1 270 0.48 0.11 0.11 0.03 1.58 0.11 2.43 3.47 0.16 3.78 0.77 -1.66 Uruguay 3 242 0.81 2.37 0.52 0.02 1.00 0.19 4.91 3.79 0.82 1.08 5.13 0.22 Venezuela 22 311 0.48 0.42 0.07 0.05 1.73 0.13 2.88 3.41 0.36 2.68 5.89 3.01
Population Cropland Grazing land Forest Fishing CO2 Built-up Total 1 ha local 1 ha local 1 ha local Existing Nationalfootprint footprint footprint ground footprint land ecological cropland grazing forest biological ecological
footprint footprint footprint land capacity deficit(area units (area units (area units (area units (area units (area units (area units (in area (in area (in area (area units (area units
(thousands) per person) per person) per person) per person) per person) per person) per person) units) units) units) per person) per person)
26 LIVING PLANET REPORT 2000

27
Population Cropland Grazing land Forest Fishing CO2 Built-up Total 1 ha local 1 ha local 1 ha local Existing Nationalfootprint footprint footprint ground footprint land ecological cropland grazing forest biological ecological
footprint footprint footprint land capacity deficit(area units (area units (area units (area units (area units (area units (area units (in area (in area (in area (area units (area units
(thousands) per person) per person) per person) per person) per person) per person) per person) units) units) units) per person) per person)
NORTH AMERICA 299 385 1.44 1.06 1.23 0.06 7.06 0.91 11.77 6.13 -5.64 Canada 29 947 1.70 0.84 1.05 0.06 3.62 0.40 7.66 3.55 0.11 0.78 11.16 3.50 United States of America 269 439 1.41 1.09 1.26 0.06 7.45 0.97 12.22 6.29 0.76 1.37 5.57 -6.66
WESTERN EUROPE 384 458 1.20 0.85 0.47 0.08 3.30 0.37 6.28 2.93 -3.35Austria 8 053 1.20 0.74 0.96 0.04 2.15 0.36 5.45 6.81 4.61 3.88 4.15 -1.30 Belgium-Luxembourg 10 521 0.86 0.81 0.49 0.06 3.17 0.49 5.88 9.60 12.63 3.01 2.30 -3.58 Denmark 5 241 1.95 0.89 0.83 0.35 5.48 0.38 9.88 7.55 10.19 3.67 5.68 -4.19 Finland 5 126 1.02 0.84 2.44 0.17 3.16 0.82 8.45 4.16 1.06 1.79 9.77 1.32 France 58 251 1.32 0.91 0.46 0.09 4.00 0.50 7.27 9.11 3.66 2.42 4.27 -3.01 Germany 81 909 0.93 0.70 0.40 0.04 3.85 0.39 6.31 7.65 7.27 3.52 2.48 -3.83 Greece 10 532 1.53 0.81 0.17 0.10 2.75 0.23 5.58 4.36 2.68 0.27 2.31 -3.27 Ireland 3 634 2.01 1.87 0.46 0.05 4.79 0.24 9.43 8.71 3.83 2.73 6.71 -2.72 Italy 57 366 1.33 1.24 0.36 0.08 2.34 0.16 5.51 5.98 4.04 2.50 1.92 -3.59 Netherlands 15 541 0.73 1.18 0.46 0.08 2.95 0.36 5.75 9.69 18.09 3.23 2.41 -3.35 Norway 4 372 0.78 0.88 1.11 0.55 1.83 0.98 6.13 4.81 5.23 1.54 6.14 0.01 Portugal 9 859 1.27 0.69 0.51 0.18 1.95 0.38 4.99 2.59 1.84 1.95 2.23 -2.76 Spain 39 593 1.83 0.59 0.34 0.13 2.40 0.21 5.50 4.08 0.88 1.58 2.52 -2.98 Sweden 8 832 1.10 0.78 1.58 0.08 3.04 0.96 7.53 6.08 1.19 1.91 8.02 0.48 Switzerland 7 198 0.80 1.01 0.45 0.05 3.87 0.45 6.63 8.74 4.33 2.82 2.31 -4.33 United Kingdom 58 431 1.03 0.69 0.36 0.05 3.80 0.37 6.29 8.95 2.73 2.22 1.83 -4.46
CENTRAL ANDEASTERN EUROPE 342 817 0.73 0.62 0.28 0.05 2.87 0.34 4.89 2.96 3.14 -1.75 Albania 3 151 0.67 0.91 0.06 0.00 0.18 0.03 1.86 3.01 3.48 0.46 1.38 -0.48 Belarus 10 379 1.28 0.95 0.94 0.02 1.96 0.12 5.27 3.08 2.13 1.60 3.47 -1.80 Bosnia and Herzegovina 3 422 0.59 0.23 0.01 0.00 0.45 0.02 1.29 3.32 0.83 0.97 1.39 0.10 Bulgaria 8 448 0.85 0.46 0.17 0.01 2.19 0.13 3.81 2.33 1.02 1.82 2.01 -1.80 Croatia 4 488 0.51 0.31 0.26 0.01 1.20 0.07 2.35 5.07 0.70 2.30 2.19 -0.17 Czech Rep. 10 316 1.20 0.51 0.43 0.05 3.88 0.24 6.30 5.25 3.18 3.72 2.93 -3.37 Estonia 1 466 1.97 0.77 0.27 0.10 3.87 0.15 7.12 2.68 1.14 1.73 4.03 -3.10 Hungary 10 193 1.64 0.41 0.21 0.04 2.31 0.39 5.01 4.92 1.38 2.85 3.07 -1.94 Latvia 2 499 0.92 0.54 0.72 0.12 1.28 0.17 3.74 2.65 1.42 2.25 4.08 0.33 Lithuania 3 715 1.33 0.73 0.51 0.11 1.98 0.10 4.76 3.05 1.71 2.85 3.72 -1.04 Macedonia 1 975 0.77 0.29 0.18 0.03 1.91 0.06 3.24 3.12 0.66 0.48 1.19 -2.05 Moldova 4 376 0.92 0.29 0.06 0.00 0.91 0.30 2.47 2.71 1.56 1.27 1.70 -0.77 Poland 38 659 1.39 0.55 0.34 0.04 2.98 0.09 5.40 3.80 3.04 2.45 2.35 -3.05 Romania 22 633 0.98 0.55 0.31 0.04 1.45 0.17 3.49 2.95 1.42 2.65 2.39 -1.10 Russian Federation 147 876 0.33 0.64 0.27 0.06 3.56 0.49 5.36 3.37 0.46 0.52 4.09 -1.26 Slovakia 5 365 0.46 0.42 0.49 0.04 2.36 0.17 3.94 5.49 1.22 2.83 2.02 -1.92 Slovenia 1 995 1.15 0.70 0.60 0.04 2.84 0.07 5.40 5.34 2.70 2.35 2.63 -2.77 Ukraine 51 254 0.74 0.65 0.13 0.01 2.77 0.45 4.76 2.67 1.54 1.08 2.26 -2.49 Yugoslavia 10 607 1.13 1.02 0.12 0.05 1.52 0.01 3.85 3.85 2.38 1.08 1.84 -2.01
LIVING PLANET REPORT 2000

LIVING PLANET REPORT 2000
L I V I N G P L A N E T I N D E XTable 3: LIVING PLANET INDEX: 1970-1999
Year 1970 1975 1980 1985 1990 1995 1999
Forest Species Population Index 100.0 95.0 100.4 94.7 93.0 83.6 87.6upper confidence limit 110.7 113.0 107.0 103.6 99.4 113.7lower confidence limit 81.5 89.1 83.8 83.4 70.3 67.5Freshwater Species Population Index 100.0 97.4 89.4 77.7 71.7 57.5 49.1upper confidence limit 122.3 104.5 94.5 92.7 83.8 56.5lower confidence limit 77.6 76.4 63.8 55.4 39.4 42.6Marine Species Population Index 100.0 95.0 93.7 84.3 74.1 67.9 64.5upper confidence limit 132.6 119.4 113.5 105.2 85.1 79.8lower confidence limit 68.0 73.5 62.6 52.2 54.2 52.1Living Planet Index 100.0 95.8 94.5 85.5 79.6 69.7 67.0upper confidence limit 121.9 112.3 105.0 100.5 89.4 83.3lower confidence limit 75.7 79.7 70.1 63.7 54.6 54.0
28

LIVING PLANET REPORT 2000 29
T E C H N I C A L N O T E S
LIVING PLANET INDEX
The LPI is generated by averaging three separateindices for forest, freshwater, and marine speciespopulations. Each is set at 100 in 1970 and givenan equal weighting. The species population dataused in Boxes 1-6 (page 3) come from thefollowing sources. The silvery gibbon comes fromNowak and Paradiso (1983), Kool (1992), andNijman and van Balen (1998); Kemp's ridley turtlefrom Marquéz et al. (1999); lesser white-frontedgoose from Scott and Rose (1996); sparrowhawkfrom Crick et al. (1997); gharial from CrocodileSpecialist Group (1996), Groombridge (1987),Groombridge (1982), and Thorbjarnson (1992);bluefin tuna from Ransom Myers fish populationdatabase online. The population data for all otherspecies used in the LPI come from data sourcestoo numerous to include in this report, but a fulllist can be found on the WCMC website atwww.unep-wcmc.org.
FOREST SPECIES POPULATION INDEXThe forest species population index is theaverage of two indices relating to temperate andtropical forests, respectively. The temperate forestcomponent of the index is calculated from thechange over time in the populations of 275temperate forest species. The tropical forestcomponent is based on the change over time inpopulations of 44 tropical forest species. Thespecies in the index are predominantly birds andmammals. These 319 species represent all thosefor which we were able to find populationestimates for more than one point in time. Thebias in the data towards temperate forests andbirds and mammals reflects the concentration ofresearch effort over the past 30 years. In manycases the data are not for an entire species, butjust one sub-population of that species.
The last four years of the index, 1995-99, arebased on far fewer population datasets than thepart of the index covering 1970-95. The reliabilityof this recent part of the index is therefore muchlower. It will improve as new data becomeavailable in future years. The upturn in the tropicalforest index from 1995 to 1999, and thedownturn in temperate forests, could be anartefact of the small number of datasets availablefor this period.
Deforestation. Data for 1990 are WCMC figuresfor current forest area for each region. Thesecome from a variety of national and internationalsources, including remote sensing, and a varietyof dates. Forest cover is defined as closed forest,which in general refers to canopy cover of morethan 30 per cent.
Time series data were generated by projectingdeforestation rates back and forward from 1990.For Africa, Asia/Pacific, and Latin America andthe Caribbean, deforestation rates for 1980–95are from the Forest Resources Assessment of theUnited Nations Food and Agriculture Organization(FAO) (1995) and State of the World’s Forests(FAO 1997). For 1970–80, deforestation ratesfrom Singh and Marzoli (1995) have been appliedto each region. The latter only applied to thetropical parts of these regions. For Europe,changes are taken from the Dobris Assessment(European Commission 1995) which has figuresfor changes in forest extent for 29 Europeancountries, including Eastern Europe, for thedecades between 1960 and 1990. Figures forchanges in Australasia and North America arefrom the FAO (1995). Data are missing for forestchanges in North America before 1980 so it isassumed that no overall change has taken place.It is also assumed that there was no change inforest area in the Russian Federation from 1980to 1990. The deforestation rates for the period1995 to 2000 are estimates based on regionalchanges in forest cover from 1990 to 1995according to the FAO (1997). These numbersmay well underestimate the actual extent ofdeforestation as there has been an increase in thenumber and severity of forest fires over the lastfive years, especially in the tropics.
Original forest cover was compiled from sixpotential vegetation datasets which, betweenthem, cover the globe (Bohn and Katenina 1994,Carnahan n.d., Dinerstein et al. 1995, Kuusela1994, Milanova and Kushlin 1993, and White1983). The map of current forest cover is adaptedfrom WCMC (2000).
FRESHWATER SPECIES POPULATION INDEXThe freshwater species population index is theaverage of six regional indices relating to Africa,Asia/Pacific, Australasia, Europe, Latin Americaand the Caribbean, and North America,
respectively. The six indices between themcontain time series data on 194 speciespopulations, comprising 7 African species, 32Asia-Pacific species, 8 Australasian species, 55European species, 11 Latin American andCaribbean species, and 81 North Americanspecies. These include all those for which timeseries data could be found. In many cases thedata are not for an entire species, but just onesub-population of that species. More data areavailable from Europe and North America thanany other region of the world, which is a reflectionof research effort over the past 30 years. Theindex is the average of all six regional sub-indices,with equal weight given to each region. The lastfour years of the index, 1995–99, are based onfar fewer population datasets than the part of theindex relating to the years 1970–95. The reliabilityof this part of the index is therefore much lower. It will improve as new data become available infuture years. Some of the species used incalculating the index are given on page 6.
Evidence for global amphibian populationdeclines comes from Houlahan et al. (2000). Themap of freshwater ecosystems of the world isadapted from WCMC (2000).
MARINE SPECIES POPULATION INDEXThe Marine Species Population Index is theaverage of six sub-indices which relate to theNorth Pacific, North Atlantic, Indian, SouthPacific, South Atlantic, and Southern Oceans,respectively. The six indices contain time seriesdata on 217 species populations, comprising 72North Pacific species, 65 North Atlantic species,16 Indian Ocean species, 17 South Atlanticspecies, 35 South Pacific species, and 12Southern Ocean species. The 217 species in the index include all those for which time seriespopulation data could be found. In many cases,the data are not for an entire species, but justone sub-population of that species. Inevitably, the index is dominated by those species whichresearchers have an interest in monitoring. Farmore data are available on populations fromnorthern temperate waters than from southerntemperate or tropical waters. To give equal weightto data from different oceans, the Marine SpeciesPopulation Index is the average of all six oceansub-indices. The last four years of the index,
1995–99, are based on fewer populationsdatasets than the part of the index relating to theyears 1970–95. The reliability of this part of theindex is therefore much lower. Reliability willimprove as new data become available in futureyears. Some of the species in the index are givenon page 8.
The areas of coral reef and mangroveecosystems in the world’s oceans are taken fromWCMC (2000) and Spalding et al. (1997); themap is adapted from WCMC (2000).
ECOLOGICAL FOOTPRINT
The Ecological Footprint analysis measures theamount of the globe’s biological productivity anindividual or a country occupies in a given year.The analysis is based on data published byUnited Nations agencies and theIntergovernmental Panel on Climate Change.
The method achieves this by measuring theecological impact of humanity in terms of thebiologically productive land and water arearequired to produce the resources consumed andto assimilate the wastes generated by humanity,using prevailing technology. This area, called theEcological Footprint, represents the fraction of thebiosphere necessary to maintain the currentmaterial throughput of the human economy,under current management and productionpractices.
Ecological Footprint calculations are based onfive assumptions: ■ it is possible to keep track of most of the
resources people consume and many of thewastes people generate;
■ most of these resource and waste flows canbe converted into the biologically productivearea that is required to maintain these flows;
■ these different areas can be expressed in thesame unit once they are scaled proportionallyto their biomass productivity. In other words,each particular hectare can be expressed asthe equivalent area of world-average landproductivity;
■ since these areas stand for mutually exclusiveuses, and each standardized hectarerepresents the same amount of biomassproductivity, they can be added up to a total –this total represents humanity’s demand;

30 LIVING PLANET REPORT 2000
T E C H N I C A L N O T E S c o n t i n u e d
■ this area for total human demand can becompared with nature’s supply of ecologicalservices since it is also possible to assess thearea on the planet that is biologicallyproductive.
The results underestimate human impact andoverestimate the available biological capacity by: ■ counting each area only once, even if the area
provides two or more ecological services atonce;
■ choosing the more conservative estimateswhen in doubt;
■ including current agricultural practices as ifcurrent industrial yields would not cause anysignificant long-term damage to the soilproductivity;
■ leaving out some human activities for which wehave insufficient data;
■ excluding those activities that systematicallyerode nature’s capacity to regenerate. Theyconsist of:■ uses of materials for which the biosphere
has no significant assimilation capacity (e.g.plutonium, polychorinated biphenyls (PCBs),chlorofluorocarbons (CFCs)).
■ processes that irreversibly damage thebiosphere (e.g. species extinction, aquiferdestruction, deforestation, desertification).
A nation’s consumption is calculated by addingimports to, and subtracting exports from,domestic production. To put it in mathematicalterms: apparent consumption = production +imports – exports (see explanation of apparentconsumption on page 13). This balance iscomputed for 72 categories, such as cereals,timber, fishmeal, coal, and cotton. These resourceuses are translated into area units by dividing thetotal amount consumed in each category by itsecological productivity (or yield). In the case of CO2emissions, the total is divided by the assimilationcapacity of forests. Some of the resource andwaste categories are primary resource uses (suchas raw timber or milk), while others aremanufactured products that are derived from theprimary ones (such as paper or cheese). Forexample, if one tonne of pork meat is exported,the amount of cereals and energy required toproduce this tonne of pork is translated into acorresponding biologically productive area andthen subtracted from the exporting country’s
footprint. This amount is added to the importingcountry’s ecological footprint.
Biomass yields, measured in dry weight, aretaken from statistics from the FAO. In the case ofsea space, the production of fish protein isdirectly compared to the animal proteinproduction of grain-fed poultry. World-averagespace has consequently an equivalence factorand a yield factor of 1. Thus, the physicalextensions of the global areas of biologicallyproductive space and those areas adjusted withthe equivalence and yield factors add up to thesame global total. Every year has its own set ofequivalence factors since land-use productivitieschange over time.
The land-use types of the ecological footprint Our accounts include six land-use types forhuman activities. All compete for biologicallyproductive space. They are: ■ growing crops for food, animal feed, fibre, oil
crops, and rubber■ grazing animals for meat, hides, wool, and milk■ harvesting timber for wood fibre and fuelwood■ fishing ■ accommodating infrastructure for housing,
transportation, capturing solar, wind, andhydro energy, and industrial production
■ burning fossil fuel.Once the human impacts are expressed in thestandardized area units, these footprintcomponents are added up.Growing crops occupies arable land, the mostproductive land of all. The FAO estimates thattoday there are about 1.3 billion hectares ofarable land worldwide – not including arable landused as pasture. Using FAO harvest and yielddata for 18 categories of crops, we traced theuse of arable land for crop production (FAO1998(3), 1997 (4), 1999 (8)). These accounts areunderestimates since due to lack of consistentdatasets other impacts from current agriculturalpractices are not accounted for; these includelong-term damage from topsoil erosion;salination; and contamination of aquifers withagro-chemicals. Grazing animals requires pastures. We combinepasture and wooded (= lightly forested) area intoone land-use type, and assume that deforestationincreases the size of this type. Worldwide, there
are 4.6 billion hectares of pasture and woodedarea, including the arable land used as pasture.We calculated the demand for pasture using FAOdata (1998(3), 1997(4), 1999(8)). Harvesting timber requires natural forests orplantation forests. Worldwide there are 3.3 billionhectares of such forests according to current FAOland-use statistics. We estimated forest areas andproductivities using a variety of sources (IPCC1997, FAO 1997b, Dixon et al. 1994, FAO1997c). Consumption figures for timber andfuelwood come from FAO (1998 (5)).Fishing requires productive fishing grounds. Ofthe total ocean area, the 8 per cent concentratedalong the world’s continental coasts providesover 95 per cent of the marine catch (Pauly andChristensen 1995). This translates into 3.2 billionbiologically productive hectares of sea space outof the 36.3 billion hectares of ocean area thatexist on the planet. We used FAO fish catchfigures (1999 (8)), and compared them withFAO’s “sustainable yield” figure of 93 milliontonnes per year. The accounts include both fishcatch for fishmeal as well as fish for direct humanconsumption. Conversion ratios from fresh fish tofishmeal were calculated from input to outputdata provided by FAO (1999 (8)). Whereinsufficient data were available to calculate alocal conversion ratio, we used the globalaverage. Also, we assumed an additionalbycatch of 25 per cent for all countries, exceptNorway, where fishing vessels are required toland their bycatch.Accommodating infrastructure for housing,transportation, industrial production, andcapturing hydro energy occupies built-up land.This space is the least well documented, sincesatellite images often do not have thenecessary resolution to capture dispersedinfrastructure. We used the global total of 0.2billion hectares of built-up land, consulting avariety of sources including data from DigitalChart of the World (ESRI 1993), Eurostat(2000), the World Resources Institute (1994),and Costanza et al. (1997). As most humansettlements are located in the most fertileareas of a country, we assume that built-upland uses arable land.Burning fossil fuel adds CO2 to the atmosphere.We calculate the CO2 footprint by estimating the
biologically productive area which would be neededto sequester enough carbon emissions to avoid anincrease in atmospheric CO2. Since the world’soceans absorb CO2 equivalent to about 35 percent of the emissions from fossil fuel combustion(Watson et al. 2000), we account only for theremaining 65 per cent, based on each year’scapacity of world-average forests to sequestercarbon. This capacity is estimated by taking aweighted average across 26 main forest biomes(IPCC 1997, FAO 1997b, Dixon et al. 1994).
Sequestration capacity is expected to declineas the atmospheric CO2 level and globaltemperature increase over the next century.Alternatively, we could calculate the spacerequirement for a fossil fuel substitute provided bybiomass, but such an approach would lead toeven larger space demands. Apart from fossilfuel, nuclear power is the other commercialenergy that is included in this category. Tosimplify, we calculate thermal nuclear at par withthermal fossil energy. The net embodied trade iscalculated by trade statistics broken down into109 categories. The energy intensities used forcalculating the embodied energy stem from avariety of sources (IVEM 1999, Hofstetter 1992).
The footprint and biodiversity?Conservationists should be suspicious when theysee the ecological systems of the world beingreduced to a few ecosystem categories, as in theEcological Footprint analysis. The calculations’crude simplifications aim to obtain a first-orderestimate of humanity’s ecological demand onnature and measure it in units that can becompared with the biosphere’s supply ofecosystem services. The footprint shows the extentto which people appropriate nature’s productivity.By reducing nature to biomass production, manyessential features of the natural world are lost orblurred. Nevertheless, drawing on biomass only tothe extent that nature can regenerate is anecessary condition for sustainability.
Quantitative footprint accounts need to beaccompanied by qualitative assessments. Still,footprints tell a story about the human threat tobiodiversity. They document the dominance of the human species on this planet. The criticalconsequence is that people’s consumption takesavailable space away from other species.

31LIVING PLANET REPORT 2000
R E F E R E N C E S
The footprint of non-renewable resources,toxic substances and waterNon-renewable resources from the Earth’s crustare included in these accounts only to the extentthat their use damages the biosphere, forinstance through mining, processing, andburning of fossil fuels. We classify these non-renewable resource stocks as financial ratherthan ecological assets, because they do not addecological capacity to the biosphere. After all,non-renewable resources are not used up. Theyare only diluted and dispersed. Ultimately, itwould be a matter of investing energy toconcentrate themagain. Therefore, embodiedenergy is a good proxy measure of theirEcological Footprint (as long as the substancesare not toxic).
Two significant categories of human demandson nature are not included in the presentedaccounts: the use of freshwater and the releaseof solid, liquid, and gaseous waste (apart fromCO2). Freshwater collection and wasteassimilation can be secondary functions of landareas. But in many cases they are not. In aridparts of the world where water is a limitingfactor, water use competes directly with otherprimary ecosystem functions. Similarly,excessive waste emissions can start tocompromise primary functions. However, wehave not been able to identify reliable datasources that document this impact and havetherefore not included them. This leads to afurther underestimate of the true impact ofhuman activities on the planet.
LPI DATA SOURCES
WWF and UNEP-WCMC gratefully acknowledge theinvaluable assistance of many researchers whocontributed species population data for the LPI. Thelist is too long to mention each individually, but a fulllist is provided at www.unep-wcmc.org.
Bohn, U. and Katenina, G.D. 1994. Map of NaturalVegetation. Scale 1:2,500,000. Komarov BotanicalInstitute, St Petersburg, Russian Federation.
Carnahan, J.A. n.d. Australia – Natural Vegetation.Australian Surveying and Land Information Group,Department of Administrative Services. 1:5 million scale.
Crick, H.Q.P., Baillie, S.R., Balmer, D.E., Bashford,R.I., Dudley, C., Glue, D.E., Gregory, R.D.,Marchant, J.H., Peach, W.J., and Wilson, A.M.1997. Breeding birds in the wider countryside: theirconservation status (1971–1995). BTO ResearchReport No.187. British Trust for Ornithology, Norfolk,UK. pp165.
Crocodile Specialist Group. 1996. Status Surveyand Conservation Action Plan: Revised Action Planfor Crocodiles 1996. J.P. Ross (ed). IUCN-The WorldConservation Union, Gland, Switzerland. World WideWeb Edition.
Dinerstein, E., Olson, D.M., Graham, D.J.,Webster, A.L., Primm, S.A., Bookbinder, M.P., andLedec, G. 1995. A Conservation Assessment of theTerrestrial Ecoregions of Latin America and theCaribbean. Published in association with The WorldWildlife Fund. The World Bank, Washington, DC,USA.
European Commission. 1995. Europe'sEnvironment: Statistical Compendium to the DobrisAssessment. Office for Official Publications of theEuropean Communities.
Food and Agriculture Organization of the UN(FAO). 1995. Forest Resources Assessment 1990;Global Synthesis. FAO Forestry Paper 124. FAO,Rome, Italy.
Food and Agriculture Organization of the UN(FAO). 1997. State of the World's Forests 1997.FAO, Rome, Italy.
Gaston, K.J. (ed) 1996. Biodiversity: A Biology ofNumbers and Difference. Blackwell Science, Oxford,UK.
Groombridge, B. 1987. The distribution and statusof world crocodilians. In: Webb, G.J.W., Manolis,S.C., and Whitehead, P.J. (eds). 1987. WildlifeManagement: Crocodiles and Alligators. SurreyBeatty & Sons Pty Limited, New South Wales,Australia.
Groombridge, B. (ed). 1982. The IUCN Amphibia-Reptilia Red Data Book Part 1: Testudines,Crocodylia and Rhynchocephalia. IUCN, Gland,Switzerland.
Houlahan, J.E., Findlay, C.S., Schmidt, B.R.,Meyer, A.H., and Kuzmin, S.L. 2000. Quantitativeevidence for global amphibian population declines.Nature 404: 752-755.
Kool, K.M. 1992. The status of endangered primatesin Gunung Halimun Reserve, Indonesia. Oryx 26: 29.
Kuusela, K. 1994. Forest Resources in Europe,1950-1990. European Forest Research InstituteResearch Report 1. Cambridge University Press,Cambridge, UK.
Marquéz, R., et al. 1999. Results of the Kemp'sridley nesting beach conservation efforts in Mexico.Marine Turtle Newsletter 85: 2-4.
Milanova, E.V. and Kushlin, A.V. (eds). 1993. World Map of Present-Day Landscapes. AnExplanatory Note. Prepared by Moscow StateUniversity and the United Nations EnvironmentProgramme.
Nijman, V. and van Balen, S. 1998. A faunal surveyof the Dieng Mountains, Central Java, Indonesia:Distribution and conservation of endemic primatetaxa. Oryx 32: 145.
Nowak, R.M. and Paradiso, J.L . 1983. Walker'sMammals of the World, vols. 1 and 2. 4th edition.Johns Hopkins University Press, Baltimore, MD,USA.
Ransom Myers fish population database on line(http://www.mscs.dal.ca/~myers/about_site.html).
GLOSSARYarea unit one hectare of biologically productive space with world-average productivity. In 1996 thebiosphere had 12.6 billion hectares of biologically productive space corresponding to roughly onequarter of the planet’s surface. These 12.6 billion hectares of biologically productive space include 3.2 billion hectares of ocean and 9.4 billion hectares of land. The land space is composed of 1.3 billion hectares of cropland, 4.6 billion hectares of grazing land, 3.3 billion hectares of forest land, and 0.2 billion hectares of built-up land. available biological capacity the amount of biologically productive space that is available for humanuse.biological capacity the total biological production capacity per year of a biologically productive space, for example inside a country. It can be expressed in “area units”, i.e. the equivalent area ofspace with world-average productivity.biologically productive space the land and water area that is biologically productive. It is land or water with significant photosynthetic activity. Marginal areas with patchy vegetation and non-productive areas are not included. ecological deficit the amount by which the ecological footprint of a population (e.g. a country orregion) exceeds the biological capacity of the space available to that population. ecological footprint a measure of how much productive land and water an individual, a city, a country, or humanity requires to produce all the resources it consumes and to absorb all the waste it generates, using prevailing technology. This land could be anywhere in the world. The ecologicalfootprint is measured in “area units”. equivalence factor a factor which translates the specific land use (such as world-average cropland)into a generic biologically productive area (global average space) by adjusting for biomass productivity(see also “yield factor”).overshoot the situation when human demand exceeds nature’s supply at the local, national, or global scale.yield factor a factor which describes the extent to which a local land-use category (e.g. cropland) is more productive than the world average in that same category (see also “equivalence factor”).

LIVING PLANET REPORT 200032
Scott, D.A. and Rose, P.M. 1996. Atlas of AnatidaePopulations in Africa and Western Eurasia. WetlandsInternational Publication No. 41, WetlandsInternational, Wageningen, The Netherlands.
Singh, K.D. and Marzoli, A. 1995. DeforestationTrends in the Tropics: a Time Series Analysis. Paperpresented at WWF Conference on the PotentialImpacts of Climate Change on Tropical Forests,Puerto Rico, April 1995.
Spalding, M.D., Blasco, F., and Field, C.D. (eds).1997. World Mangrove Atlas. The InternationalSociety for Mangrove Ecosystems, Okinawa, Japan.
Thorbjarnson, J. 1992. Crocodiles. An Action Planfor their Conservation. H. Messel, F.W. King and J.P.Ross (eds). IUCN-The World Conservation Union,Gland, Switzerland.
White, F. 1983. The Vegetation of Africa. UNESCO,Paris, France.
World Conservation Monitoring Centre. 1992.Global Biodiversity: Status of the Earth’s LivingResources. Chapman and Hall, London, UK.
World Conservation Monitoring Centre. 2000.Global Biodiversity: Earth’s living resources in the21st century. By: Groombridge, B. and Jenkins,M.D. World Conservation Press, Cambridge, UK.
ECOLOGICAL FOOTPRINT DATA SOURCES
A book of spreadsheets contains all the calculationsand can be downloaded from the RedefiningProgress website (www.rprogress.org).
All the main sources used in the calculations areUnited Nations’ documents. The codes in thespreadsheet reference columns point to thepublication used. The first number of the referencecode indicates the data source (see below), thesecond the page and the third the classificationnumber within the data source. The data sources are:
(1) United Nations. 1998. 1996 International TradeStatistics Yearbook, Vol. 1. Department for Economicand Social Information and Policy Analysis, StatisticalDivision, New York, USA.
(2) United Nations Conference on Trade andDevelopment (UNCTAD). 1996. UNCTADCommodity Yearbook 1996. United Nations, NewYork, USA, and Geneva, Switzerland.
(3) Food and Agriculture Organization of theUnited Nations (FAO). 1998. FAO Yearbook:Production 1997, Vol. 51. FAO, Rome, Italy.
(4) Food and Agriculture Organization of theUnited Nations (FAO). 1997. FAO Yearbook: Trade1996, Vol. 50. FAO, Rome, Italy.
(5) Food and Agriculture Organization of theUnited Nations (FAO). 1998. FAO Yearbook: ForestProduction 1996. FAO, Rome, Italy.
(6) United Nations. 1998. 1996 Energy StatisticsYearbook. Department for Economic and SocialInformation and Policy Analysis, Statistical Division,New York, USA.
(7) International Energy Agency (IEA). 1998. CO2Emissions from Fossil Fuel Combustion 1971-1996.OECD/IEA, Paris, France.
(8) Food and Agriculture Organization of theUnited Nations (FAO). 1999. FAOSTAT 98 CD-ROM. (FAO Statistical Databases). FAO, Rome, Italy,or see http://apps.fao.org.
(9) United Nations Population Division. 1998.Annual Populations, 1950-2050 (The 1998 Revision).Dataset on diskette. United Nations, Department ofSocial and Economic Affairs, New York, USA.
(10) World Resources Institute (WRI). 1998. WorldResources 1998-1999. World Resources Institute,UNEP, UNDP, The World Bank, Washington DC, USA.
Further, we used:
Costanza, R., et al. 1997. The value of the world’secosystem services and natural capital. Nature 387:253-260.
Council of Agriculture. 1996. Basic AgriculturalStatistics. Council of Agriculture, Executive Yuan,Taipei.
Dixon, R. K., et al. 1994. Carbon pools and flux ofglobal forest ecosystems. Science 263: 185-190.
ESRI. 1993. Digital Chart of the World (DCW)Database.
European Commission. 2000. TowardsEnvironmental Pressure Indicators for the EU.Eurostat.
Food and Agriculture Organization of the UnitedNations (FAO). 1997a. The State of the World'sFisheries and Aquaculture 1996. FAO FisheriesDepartment, Rome, Italy.
Food and Agriculture Organization of the UnitedNations (FAO). 1997b. State of the World's Forests1997. FAO, Rome, Italy.
Food and Agriculture Organization of the UnitedNations (FAO). 1997c. Forest and Forest Industries,Country Fact Sheets. Timber Section, UN-ECE/FAOSecretariat, New York, USA, and Geneva,Switzerland.
Hofstetter, P. 1992. Personliche Energie und CO2Bilanz. (Personal Energy and CO2 Balance), Seconddraft. Büro für Analyse und Okologie, Zurich,Switzerland.
Intergovernmental Panel on Climate Change(IPCC). 1997. Revised 1996 IPCC Guidelines forNational Greenhouse Gas Inventories: Workbook.Volume 2. UK Meteorological Office: IPCC,Organisation for Economic Cooperation andDevelopment (OECD) & International Energy Agency (IEA).
IVEM (Interfacultaire Vakgroep Energie enMilieukunde, Center for Energy and EnvironmentalStudies). 1999. Groningen, Netherlands.
Pauly, D. and Christensen, V. 1995. Primaryproduction required to sustain global fisheries. Nature374: 255-257.
Watson, R., et al. (eds). 2000. Land Use, Land-useChange, and Forestry. Cambridge University Press,Cambridge, UK.
World Resources Institute (WRI), United Nations Environment Programme (UNEP), United Nations Development Programme (UNDP).1994. World Resources 1994-95: A Guide to theGlobal Environment. Oxford University Press, NewYork, USA.
For further reading on the Ecological Footprint:
Chambers, N., Simmons, C., and Wackernagel, M. 2000. Sharing Nature’s Interest.Earthscan, London, UK.
Sturm, A., Wackernagel, M., and Müller, K. 2000.The Winners and Losers in Global Competition: WhyEco-Efficiency Reinforces Competitiveness: A Studyof 44 Nations, Verlag, Rüegger, Chur/Zurich,Switzerland.
Wackernagel, M., Lewan, L., and BorgströmHansson, C. 1999. Evaluating the use of naturalcapital with the ecological footprint: applications inSweden and subregions. Ambio 28 (7): 604-612.
Wackernagel, M., et al. 1999. National naturalcapital accounting with the ecological footprintconcept. Ecological Economics 29 (3): 375-390.
Wackernagel, M. and Rees, W. 1996. OurEcological Footprint: Reducing Human Impact on theEarth. New Society Publishers, Gabriola Island, B.C.
ACKNOWLEDGEMENTS
The authors gratefully acknowledge Simon Blyth,Wim Braakhekke, John Cederroth, Michel Chevallier,Chris Elliott, Anton Fernhout, Biksham Gujja, ChrisHails, Christine Hawkins, Jenny Heap, Martin Hiller,Makoto Hoshino, Jean-Paul Jeanrenaud, UweKievelitz, Tim Johnson, Tom Lippman, Tony Long,Richard Mott, Yaa Ntiamoa-Baidu, Lennart Nyman,Julian Scola, Stephan Singer, Magnus Sylvén, ChrisTydeman, Bart Ullstein, and Alex Yau for their help.We would also like to thank Columbia Foundation,Merck Family Fund, and Union Bancaire Privée fortheir support of the Ecological Footprint analysis. Any errors, however, remain the responsibility ofthe authors.
R E F E R E N C E S

W W FWWF INTERNATIONALAvenue du Mont-BlancCH-1196 Gland, SwitzerlandTel: +41 22 364 91 11Fax: +41 22 364 53 58E-mail: [email protected]: www.panda.org
NATIONAL ORGANIZATIONS
WWF-AUSTRALIAGPO Box 528, Sydney NSW 2001Tel: +61 2 9281 5515
WWF-AUSTRIAPostfach 1, 1162 ViennaTel: +43 1 488 170
WWF-BELGIUM608 Chaussée de Waterloo1050 BrusselsTel: +32 2 340 09 99
WWF-BRAZILSHIS EQ QL 6/8Conjunto E – 2˚ andar71620-430 BrasiliaTel: +55 61 248 2899
WWF-CANADA245 Eglinton Avenue EastSuite 410, TorontoOntario M4P 3J1Tel: +1 416 489 8800
WWF-DENMARKRyesgade 3 F, 2200 Copenhagen NTel: +45 35 36 36 35
WWF-FINLANDLintulahdenkatu 10 00500 Helsinki 50Tel: +358 9 774 0100
WWF-FRANCE188 rue de la Roquette, 75011ParisTel: +33 1 55 25 84 84
WWF-GERMANYPO Box 190 440, Rebstocker Str. 5560326 Frankfurt a/MainTel: +49 69 79 14 40
WWF-GREECEFilellinon St 26, 10558 AthensTel: +30 1 331 4893
WWF-HONG KONGGPO Box 12721, Hong KongTel: +852 2526 1011
WWF-INDIA172-B Lodi RoadNew Delhi 110 003Tel: +91 11 469 1760-62
WWF-INDONESIAPO Box 5020 JKTM 12700 JakartaTel: +62 21 576 1070
WWF-ITALYVia Po 25/c, 00198 RomeTel: +39 06 844 971
WWF-JAPANNihonseimei AkabanebashiBuilding3-1-14 Shiba, Minato-ku Tokyo 105-0014Tel: +81 3 3769 1711
WWF-MALAYSIA49 Jalan SS23/1547301 Petaling JayaTel: +60 3 703 3772
WWF-NETHERLANDSPostbus 7, 3700 AA ZeistTel: +31 30 6937 333
WWF-NEW ZEALANDPO Box 6237, WellingtonTel: +64 4 499 2930
WWF-NORWAYPostboks 6784St Olavs plass, 0130 OsloTel: +47 22 03 65 00
WWF-PAKISTANPO Box 5180, Ferozepur RoadLahore 54600 Tel: +92 42 586 2360/9429
WWF-PHILIPPINESNo 23-A Maalindog Street UP Village, Diliman Quezon City 1101Tel: +632 433 3220-22
WWF-SOUTH AFRICAPO Box 456Stellenbosch 7599Tel: +27 21 887 2801
WWF-SPAIN, ADENASanta Engracia 6-2°Izd 28010 MadridTel: +34 91 308 23 09/10
WWF-SWEDENUlriksdals Slott, 170 81 SolnaTel: +46 8 624 74 00
WWF-SWITZERLANDPostfach8010 ZürichTel: +41 1 297 21 21
WWF-UNITED KINGDOMPanda House, Weyside ParkGodalming Surrey GU7 1XRTel: +44 1483 426 444
WWF-UNITED STATES1250 24th Street, NWWashington, DC 20037-1175Tel: +1 202 293 4800
ASSOCIATES
ARGENTINAFUNDACION VIDA SILVESTREDefensa 245/51, 6 Piso1065 Capital Federal Buenos AiresTel: +54 114 343 3778
ECUADORFUNDACION NATURACasilla 17-01-253, QuitoTel: +593 2 503 369/370
NIGERIANIGERIAN CONSERVATION FOUNDATIONPO Box 74638Victoria Island, LagosTel: +234 1 2642 498/ 2600 600
TURKEY DHKDPK 971, Sirkeci 34436, IstanbulTel: +90 212 528 20 30
VENEZUELA FUDENAApartado Postal 70376Caracas 1071-ATel: +58 2 238 2930/1720/1761/
1793/235 9454
PROGRAMME OFFICES
BHUTANPost Box 210, ThimphuTel: +975 2 323 528/316
BOLIVIAPO Box 1633, Calle Guemes No 4Barrio Equipetrol, Santa CruzTel: +591 3 365326/378317
CAMEROONBP 6776, Yaoundé Tel: +237 21 70 83/84
CENTRAL AFRICABP 9144, Libreville, GabonTel: +241 73 00 28
CENTRAL AMERICATurrialba7170 CATIE, Costa RicaTel: +506 556 1383/1737
CHINARoom 701, The GatewayNo 10 Yabao RoadChaoyang District, Beijing 100020Tel: +86 10 6591 5732-38
COLOMBIACarrera 35 No 4A-25San Fernando, Cali, ValleTel: +57 2 558 2577/86/87
DANUBE/CARPATHIANPostfach 1, 1162 ViennaAustriaTel: +431 488 17 253
EASTERN AFRICAPO Box 62440, Nairobi, KenyaTel: +254 2 577 355
EUROPEAN POLICY36, Avenue de Tervuren - B121040 Brussels, BelgiumTel: +32 2 743 88 00
HUNGARYNémetvölgyi út 78/b 1124 BudapestTel: +36 1 214 5554/212 3041
INDOCHINAInternational PO Box 151Hanoi, VietnamTel: +84 4 8220 640/641
MACROECONOMICS FOR SUSTAINABLEDEVELOPMENT1250 24th Street, NWWashington, DC 20037-1175 USATel: +1 202 778 9752
MADAGASCARBP 738 Antananarivo 101Tel: +261 20 22 34885/30 23 88805/6/7
MEDITERRANEANVia Po 25/c00198 Rome, Italy Tel: +39 06 844 97227
MEXICOAve Mexico No 51Col Hipodromo Condesa06170 Mexico, DFTel: +525 286 5631/5634
NEPALPost Box 7660Lal Durbar, Kathmandu 2Tel: +977 1 434820/434970
PERUCasilla Postal 11-0205Lima 11Tel: +51 1 261 5300/5301
RUSSIAFrom Europe:Account No WWF 232PO Box 289WeybridgeSurrey KT 13 8WJ United KingdomFrom the USA:Account No WWF 232208 East 51st StreetSuite 295New York, NY 10022, USATel: +7 095 727 0939
SOUTHERN AFRICAPO Box CY 1409Causeway, HarareZimbabweTel: +263 4 252533/
252534/703902
SOUTH PACIFICPrivate Mail BagGPO Suva, FijiTel: +679 31 55 33
TANZANIAPO Box 63117Dar es SalaamTel: +255 22 2700077/2772455
THAILANDAsian Institute of Technology104 Outreach BuildingBangkok 10501PO Box 4Klong Luang 12120Tel: +66 2 524 6129
WESTERN AFRICA08 BP 1776Abidjan 08 Côte d’IvoireTel: +225 44 87 86

WWF is the world’s largest and most experienced independent conservation organization. It has 4.7 million regular supporters and a global network active in 96 countries.
WWF’s mission is to stop the degradation of the planet’s natural environment and to builda future in which humans live in harmony with nature by: – conserving the world’s biological diversity– ensuring that the use of renewable natural resources is sustainable – promoting the reduction of pollution and wasteful consumption.
Let’s leave our children a living planet
WWF International
Avenue du Mont-Blanc 1196 GlandSwitzerland
Tel: +41 22 364 9111Fax: +41 22 364 5829www.panda.org
© 1986, W
WF–W
orld W
ide Fund
For Nature (Form
erly World
Wild
life Fund) ®
WW
FR
egistered Trad
emark ow
ner 09.00(6)
lpr cover to pr 19/9/00 2:34 pm Page 2