Embed Size (px)
Citation preview
University of Milano - Bicocca
Department of Materials Science
Living radical polymerization for the
preparation of innovative
macromolecular architectures
Alberto Bianchi
Ph.D. School in Material Science - XXV cycle
Thesis presented for the degree of Doctor Europaeus
Supervisor: Dr. Roberto Simonutti
Tutor: Dr. Raffaella Donetti
Dean of the Doctorate: Prof. Gian Paolo Brivio
January 2013

2
Dedicated to the memory
of my father, Michele
3
Contents
Abstract ...................................................................................... 7
Chapter 1. RAFT polymerization ..........................................12
1.1. Description ........................................................................................ 12
1.2. History of RAFT polymerization ...................................................... 13
1.3. Mechanisms of the RAFT polymerization ........................................ 15
1.4. RAFT agents ...................................................................................... 25
1.4.1. Z group ......................................................................................... 25
1.4.2. R group ......................................................................................... 28
1.5. Design of RAFT agents ..................................................................... 30
1.6. Polymer architecture .......................................................................... 33
1.6.1. Synthesis of Copolymers .............................................................. 34
1.6.2. Grafting ........................................................................................ 37
1.6.2.1. R-approach .................................................................... 37
1.6.2.2. Z-approach .................................................................... 39
Chapter 2. RAFT agents .........................................................43
2.1. Why have different agents? ............................................................... 43
2.2. Synthesis and characterizations ......................................................... 45
2.2.1. DDAT ........................................................................................... 45
2.2.2. BSPA ............................................................................................ 49
2.2.3. BTmePT ....................................................................................... 52
4
2.2.4. BTetPT ......................................................................................... 54
2.2.5. BPTT ............................................................................................ 55
Chapter 3. Synthesis of block copolymers ............................57
3.1. General RAFT polymerization of Polystyrene .................................. 57
3.2. General RAFT polymerization of block copolymer PS-b-PDMA .... 61
3.3. Synthesis of block copolymer PS-b-PAA ......................................... 65
Chapter 4. Self-assembly of the block copolymers ..............67
4.1. Introduction ....................................................................................... 67
4.1.1. Molecular rotors ........................................................................... 70
4.2. Self assembly of PS105PDMA817 ........................................................ 74
4.2.1. NMR and TEM measurements in different selective solvent. ..... 75
4.2.2. Fluorescence spectroscopy ........................................................... 77
4.2.3. Conclusion of characterization ..................................................... 81
4.3. Self assembly of PS62PDMA10 .......................................................... 82
4.3.1. TEM ............................................................................................. 83
4.3.2. SEM .............................................................................................. 84
4.3.3. Lifetime measurements ................................................................ 84
4.3.4. AFM ............................................................................................. 85
4.3.5. FIB enhanced SEM experiments .................................................. 88
4.3.6. Hydrolysis .................................................................................... 90
4.3.7. Conclusion of characterization ..................................................... 93
5
Chapter 5. Synthesis of the block copolymers for Quasi
Solid-State Dye-Sensitized Solar Cells ..................................96
5.1. Introduction ....................................................................................... 96
5.2. Synthesis and characterization of triblock copolymers ................... 102
5.2.1. Synthesis DDAT-PEO-DDAT ................................................... 102
5.2.2. RAFT polymerization of copolymers ......................................... 104
5.3. Preparation and fabrication of DSSCs ............................................. 109
5.4. Photovoltaic performance measurements ........................................ 111
5.5. Conclusion ....................................................................................... 115
Chapter 6. Rutile–PS composite with high dielectric
constant ..................................................................................117
6.1. Introduction ..................................................................................... 118
6.2. RAFT polymerization of the PS@TiO2 nanoparticles .................... 120
6.2.1. Synthesis of CTA@ TiO2 ........................................................... 122
6.2.2. RAFT polymerization of styrene on TiO2 nanoparticles. ........... 124
6.3. Fabrication of the device ................................................................. 134
6.3.1. Thin films deposition ................................................................. 134
6.3.2. Microscopic analysis .................................................................. 135
6.4. Dielectric characterization ............................................................... 139
6.5. Conclusion ....................................................................................... 145
Chapter 7. Functionalization of SiO2 with PI for application
in tyres ....................................................................................146

6
7.1. Introduction ..................................................................................... 146
7.2. Synthesis of SiO2 with different RAFT agents ................................ 149
7.2.1. Synthesis of DDAT@SiO2 ......................................................... 150
7.2.2. Synthesis of BTmePT@SiO2 and BTetPT@SiO2 ...................... 151
7.3. Raft polymerization mediated by CTAs@SiO2 ............................... 153
7.3.1. Styrene polymerization .............................................................. 153
7.3.2. Isoprene polymerization ............................................................. 155
7.4. Nanocomposite ................................................................................ 157
Conclusions ............................................................................160
Supporting information ........................................................162
Acknowledgments .................................................................166
References ..............................................................................167
7
Abstract
In this thesis I have dealt with the synthesis of different macromolecular
structures in order to create innovative devices. The heart of the process of
synthesis has been the RAFT polymerization, a recent polymerization technique
which allows the compatibilization of various chemical systems.
The aim of this work is the improvement of innovative devices already on
the market with good performance, but that possess limitations both as what
regards specific technical properties and commercial exploitation. The aspect
which has to be improved isn’t related to the device’s functional materials, rather
to the compatibilization between them. Often, materials with remarkable absolute
performances are used in a device, but these state-of-the-art components suffer
from a partial quenching of their properties when incorporated in the final device.
For this reason, in recent years, many studies have focused on materials that
compatibilize different chemicals structures. For example polymeric composite
materials combine the various functional properties of inorganic materials
(metals and metal oxides) with mechanical properties of structural polymers. The
different chemical nature of these two classes of materials leads to
incompatibility, un-mixing and then to the worsening of the final performance in
the operating conditions of the device. So it is essential to find materials that
allow the different structures to chemically recognize each other through their
surfaces.
The materials used in this context are the surfactants, namely compounds
that possess both polar and non-polar moieties. The same mechanism is at the
base of the natural world in which, for example, liposomes form cell membranes
which are fundamental for life itself.
8
With this in mind, I focused to the synthesis of amphiphilic materials that
possess hydrophilic and hydrophobic parts, therefore affinity with inorganic
materials, or water based, and organic materials. This type of structure can be
found in macromolecular materials. Access to such complex polymer structures -
and concomitantly access to carefully tunable polymer properties - has been
greatly enhanced with the advent of living free radical polymerization (LFRP)
protocols that allow for the synthesis of multifunctional “chain transfer” agents
that can serve as molecular machinery for obtaining polymers with complex
architecture. The most prominent among LFRP techniques are Reversible
Addition–Fragmentation chain Transfer (RAFT),1 Atom Transfer Radical
Polymerization (ATRP)2,3
and Nitroxide-Mediated Polymerization (NMP).4,5
In
particular, the strength of RAFT chemistry lies in its high tolerance to functional
monomers and the non-demanding reaction conditions (e.g. tolerance to oxygen
and low temperatures) under which the polymerizations can be carried out. In
addition, a wide range of monomers with varying reactivity can be used. RAFT
polymerization offers substantial versatility when it comes to the synthesis of
block copolymers, star polymers, polymer brushes, and other complex polymer
systems.6 The critical key to their synthesis is the presence of chain transfer agent
(RAFT agent or CTA) with a thiocarbonylthio end group.
Undesired bimolecular termination reactions, high initiator concentrations,
or chain transfer to monomer or solvent can reduce the amount of RAFT end
capped polymer chains. If carefully designed, RAFT polymerization opens the
door to a range of polymer architectures by variable approaches.
Similar to other living radical polymerization techniques, block
copolymers, star and comb polymers, as well as graft polymers are accessible by
attaching the controlling moiety to a (multi)functional core linking moiety. In
addition, block structures are obtained by chain extension of the RAFT moiety
capped block. Unique to the RAFT process are the possible modes of attaching
the RAFT group covalently to the (multi)functional moiety.
9
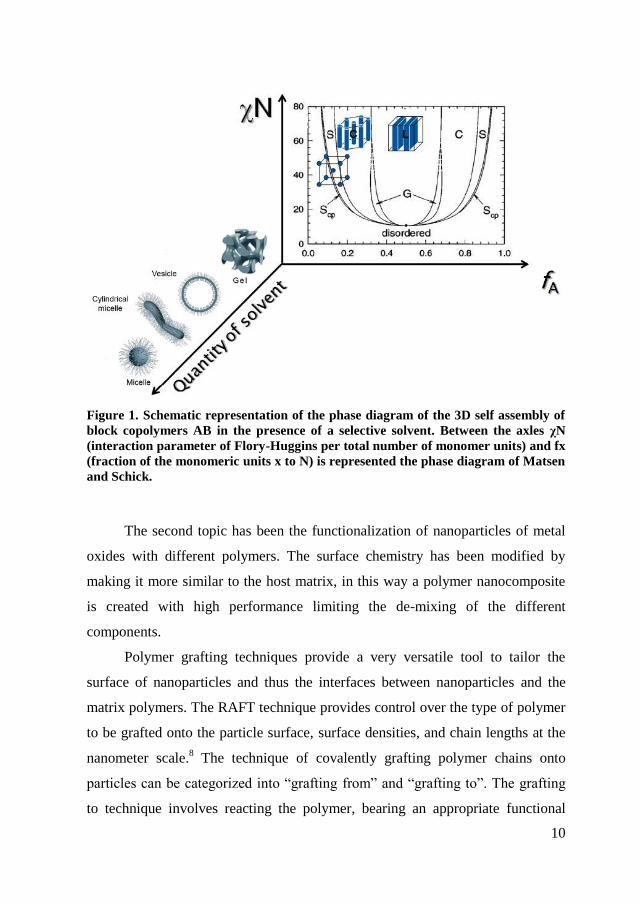
The first aspect analyzed was the self-assembly of amphiphilic block
copolymers into complex architectures. As known block copolymers in the solid
state have a separation of phases in the order of nanometers7. In addition, by
varying the chemical composition of the blocks and their relationship, it is
possible to generate a variety of morphologies (spherical, cylindrical, lamellar or
gyroidal). This behavior is described by the diagram of Matsen and Schick (see
Figure 1) and relates to polymers in their thermodynamic minimum. The
introduction of a solvent in the system can be interpreted as a third dimension in
the diagram. Thus, in addition to the variation of χN (Flory-Huggins interaction
parameter times total number of monomer units) and fx (fraction of the
monomeric units x), we can introduce the quantity of solvent. The interaction
between the solvent and the chemistry of the block copolymer is a key parameter
to determine in what way the self assembly occurs. In the case of complete
solubility the polymer will be completely dissolved while selective (or partial)
solubility occurs if a single block is dissolved. The latter leads to the formation of
particular structures that depend on all previous parameters in addition to
temperature and the environmental conditions. Therefore, amphiphilic block
copolymers can self-assemble into structures such as micelles, spheres, worm-
like assemblies, toroids and polymer gels, depending on the ratio of the selective
solvent.
With RAFT technique, I have synthesized diblock copolymers constituted
by polystyrene and polydimethylacrylamide with different total block length and
studied their self-assembly in different solvents and concentrations, with the aim
of introducing functional molecules in incompatible matrices (Chapter 4). Also, I
produced the triblock copolymer polystyrene-polyethylene oxide and used as a
polymer gel for electrolyte in dye-sensitized solar cells (Chapter 5). The
advantage of this technique is that the polymer is free from the contamination of
metal catalyst.
10
Figure 1. Schematic representation of the phase diagram of the 3D self assembly of
block copolymers AB in the presence of a selective solvent. Between the axles χN
(interaction parameter of Flory-Huggins per total number of monomer units) and fx
(fraction of the monomeric units x to N) is represented the phase diagram of Matsen
and Schick.
The second topic has been the functionalization of nanoparticles of metal
oxides with different polymers. The surface chemistry has been modified by
making it more similar to the host matrix, in this way a polymer nanocomposite
is created with high performance limiting the de-mixing of the different
components.
Polymer grafting techniques provide a very versatile tool to tailor the
surface of nanoparticles and thus the interfaces between nanoparticles and the
matrix polymers. The RAFT technique provides control over the type of polymer
to be grafted onto the particle surface, surface densities, and chain lengths at the
nanometer scale.8 The technique of covalently grafting polymer chains onto
particles can be categorized into “grafting from” and “grafting to”. The grafting
to technique involves reacting the polymer, bearing an appropriate functional
11
group, with the particles to chemically attach the polymer chains.9 Because of the
steric hindrance imposed by the already grafted chains, it becomes increasingly
difficult for the incoming polymer chains to diffuse to the surface against the
concentration gradient of the existing grafted polymers, which intrinsically
results in low graft densities. In contrast, the grafting from technique uses
initiators that have been initially anchored to the particle surface, followed by the
polymerization from the surface. Since the existing grafted polymers will not
hinder the diffusion of the small-sized monomers, significantly higher graft
densities can be achieved with this technique. In this study, I was involved in the
growth of the polymer to the surface (grafting from) to ensure a high coating
density.
I have synthesized a polymer shell of polystyrene on nanoparticles of
titania to create a nanocomposite TiO2/PS (Chapter 6), which has been tested as a
material with high dielectric properties. I also polymerized isoprene on
commercial SiO2 in order to introduce it in the production of compounds for tyres
and thereby increase the dispersion and improve the dispersion of filler in the
rubber matrix (Chapter 7).
12
Chapter 1. RAFT
polymerization
In this chapter I will describe the Radical Addition-Frammentation chain
Trasfer (RAFT) polymarization, in particular the birth and evolution of the
technique until to our days, the mechanism that governs the polymerization and
its potentialities. Finally, I will spend a large part on RAFT agents and their
roles.
1.1. Description
RAFT polymerization processes are a recent discovery and arise from the
need to combine the advantages of the radical polymerizations with those of
anionic living polymerizations, minimizing the problems related to them10
.
The radical polymerizations, although having the advantage of being very
simple to perform, are not suitable for processes for which it is necessary to have
a high selectivity and uniformity of the products obtained, as they are poorly
controllable and provide polymers of with broad molecular weight distributions.
In addition, as mentioned, the anionic polymerizations have the disadvantage of
being able to be used only with a limited number of monomers and require
expensive catalysts and harsh reaction conditions.
This type of synthesis is distinguished by its versatility: in fact, it can be
used with a wide range of monomers and in different reaction conditions,
providing polymers with a good control of average molecular weight and
molecular weight distribution. In addition, polymerizations can be carried out in
solution, emulsion and bulk by using the common peroxide or nitrogen initiators.
Typically, a RAFT polymerization system consists of a radical source (e.g.
13
thermochemical initiator or the interaction of gamma radiation with some
reagent), monomer, RAFT agent and a solvent (not strictly required if the
monomer is a liquid). A temperature is chosen such that chain growth occurs at
an appropriate rate, the chemical initiator (radical source) delivers radicals at an
appropriate rate and the central RAFT equilibrium (see paragraph 1.3) favors the
active rather than dormant state to an acceptable extent.
1.2. History of RAFT polymerization
The first reports of radical addition-fragmentation processes appeared in
the synthetic organic chemistry literature in the early 1970s11
. Now well-known
examples of processes that involve a reaction step with an SH2 mechanism
include allyl transfer reactions with allyl sulfides12
and Stannanes (the Keck
reaction) and the Bartone McCombie deoxygenation process with xanthates13
. A
survey of these reactions is included in the review by Colombani and Chaumont.
The first reports of the direct use of addition-fragmentation transfer agents to
control radical polymerization appeared in the 1980s14,15
. Polymerizations with
reversible addition–fragmentation chain transfer which showed some of the
characteristics of living polymerization were first reported in 1995.
The term RAFT polymerization was coined in 1998 when the use of
thiocarbonylthio RAFT agents was first reported in the open literature16
. This
article is the real founder of the technique, and has been cited 1405 times, so far.
RAFT polymerization is also reviewed within works which deal more
generically with radical polymerization. The literature through 2005 is
comprehensively reviewed within the chapter “Living radical polymerization in
the chemistry of radical polymerization”17
and is given substantial coverage in
many recent works that relate more generically to polymer synthesis, living
polymerization or novel architectures. Other relevant reviews include those
focusing on the synthesis and organic chemistry of dithioesters and other
14
thiocarbonylthio compounds in a non-polymerization context18
and the use of
RAFT in organic synthesis19
. The literature is expanding very rapidly; an update
review20
covering the period mid 2005 to mid 2006 revealed more than 200
papers dealing directly with the use and application of RAFT polymerization.
First communication on RAFT with trithiocarbonyl compounds16
now has more
than1000 citations and is one of the most highly cited papers in Macromolecules
and the first RAFT patent21
was seventh on the list of most cited patents in the
field of chemistry and related science in 2005.
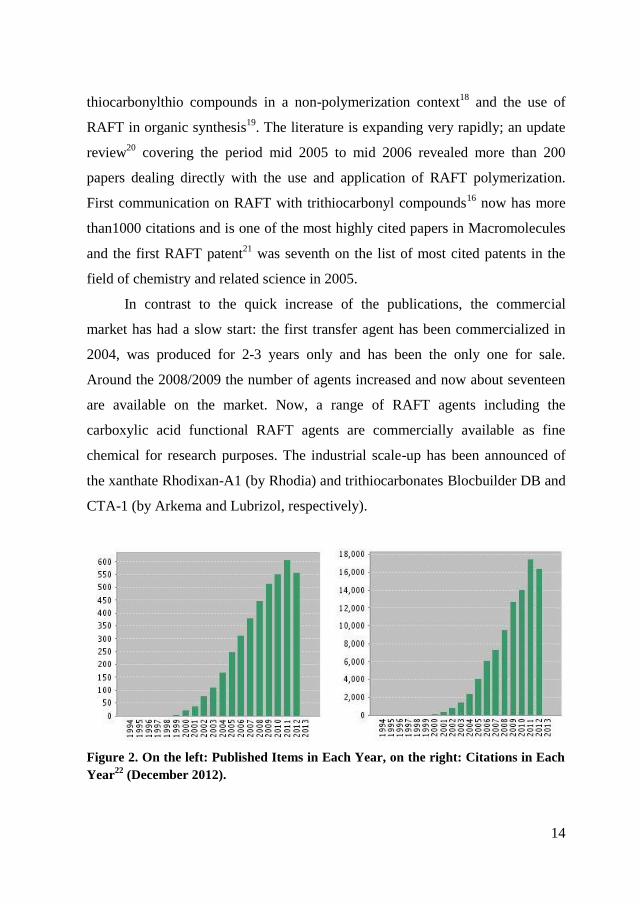
In contrast to the quick increase of the publications, the commercial
market has had a slow start: the first transfer agent has been commercialized in
2004, was produced for 2-3 years only and has been the only one for sale.
Around the 2008/2009 the number of agents increased and now about seventeen
are available on the market. Now, a range of RAFT agents including the
carboxylic acid functional RAFT agents are commercially available as fine
chemical for research purposes. The industrial scale-up has been announced of
the xanthate Rhodixan-A1 (by Rhodia) and trithiocarbonates Blocbuilder DB and
CTA-1 (by Arkema and Lubrizol, respectively).
Figure 2. On the left: Published Items in Each Year, on the right: Citations in Each
Year22
(December 2012).
15
The popularity of the RAFT process has steadily increased since the first
report in 1998 (2245 times cited). Figure 2 gives the number of RAFT-related
papers as function of the year (up to November 2012). It is clear that the research
interest in the RAFT process continues to be very strong.
1.3. Mechanisms of the RAFT polymerization
In literature there are many papers and reviews concerning the mechanism
of polymerization RAFT, which not always have a comprehensive explanation of
the phenomenon. This section describes the process starting from simple
Addition-Fragmentation in order to explain the reversible and termination
phenomena.
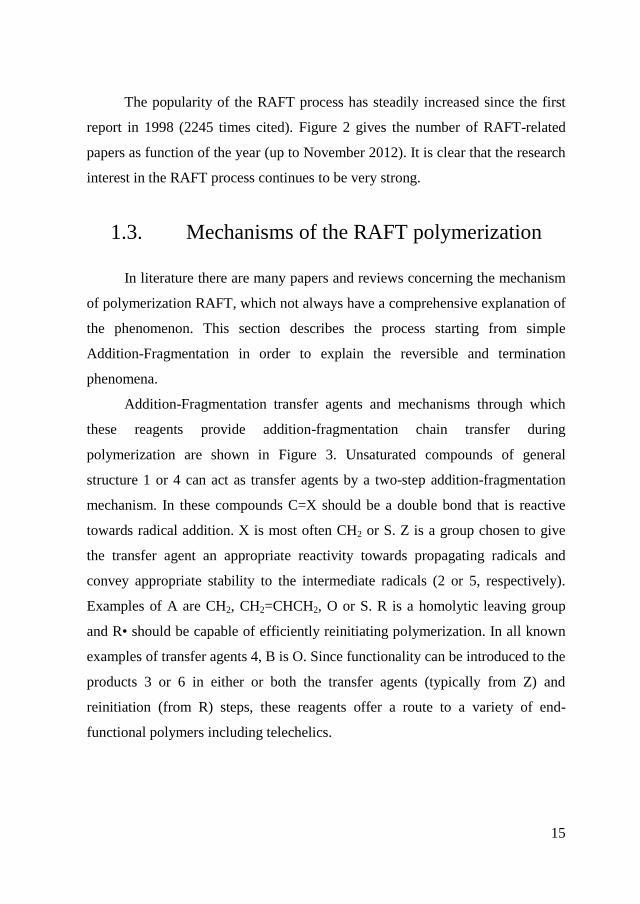
Addition-Fragmentation transfer agents and mechanisms through which
these reagents provide addition-fragmentation chain transfer during
polymerization are shown in Figure 3. Unsaturated compounds of general
structure 1 or 4 can act as transfer agents by a two-step addition-fragmentation
mechanism. In these compounds C=X should be a double bond that is reactive
towards radical addition. X is most often CH2 or S. Z is a group chosen to give
the transfer agent an appropriate reactivity towards propagating radicals and
convey appropriate stability to the intermediate radicals (2 or 5, respectively).
Examples of A are CH2, CH2=CHCH2, O or S. R is a homolytic leaving group
and R• should be capable of efficiently reinitiating polymerization. In all known
examples of transfer agents 4, B is O. Since functionality can be introduced to the
products 3 or 6 in either or both the transfer agents (typically from Z) and
reinitiation (from R) steps, these reagents offer a route to a variety of end-
functional polymers including telechelics.
16
Figure 3. Scheme of mechanisms for addition-fragmentation chain transfer
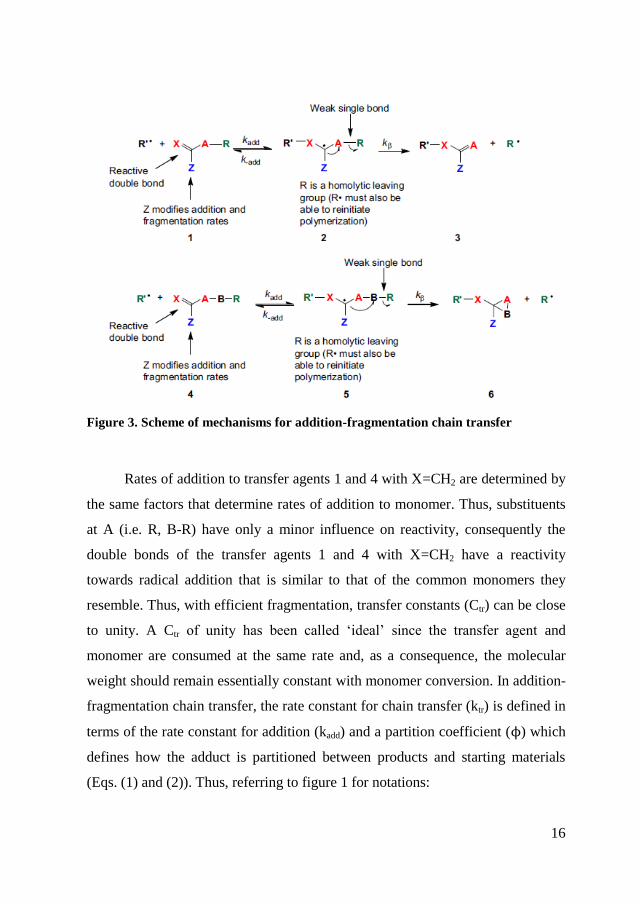
Rates of addition to transfer agents 1 and 4 with X=CH2 are determined by
the same factors that determine rates of addition to monomer. Thus, substituents
at A (i.e. R, B-R) have only a minor influence on reactivity, consequently the
double bonds of the transfer agents 1 and 4 with X=CH2 have a reactivity
towards radical addition that is similar to that of the common monomers they
resemble. Thus, with efficient fragmentation, transfer constants (Ctr) can be close
to unity. A Ctr of unity has been called ‘ideal’ since the transfer agent and
monomer are consumed at the same rate and, as a consequence, the molecular
weight should remain essentially constant with monomer conversion. In addition-
fragmentation chain transfer, the rate constant for chain transfer (ktr) is defined in
terms of the rate constant for addition (kadd) and a partition coefficient (ϕ) which
defines how the adduct is partitioned between products and starting materials
(Eqs. (1) and (2)). Thus, referring to figure 1 for notations:
17
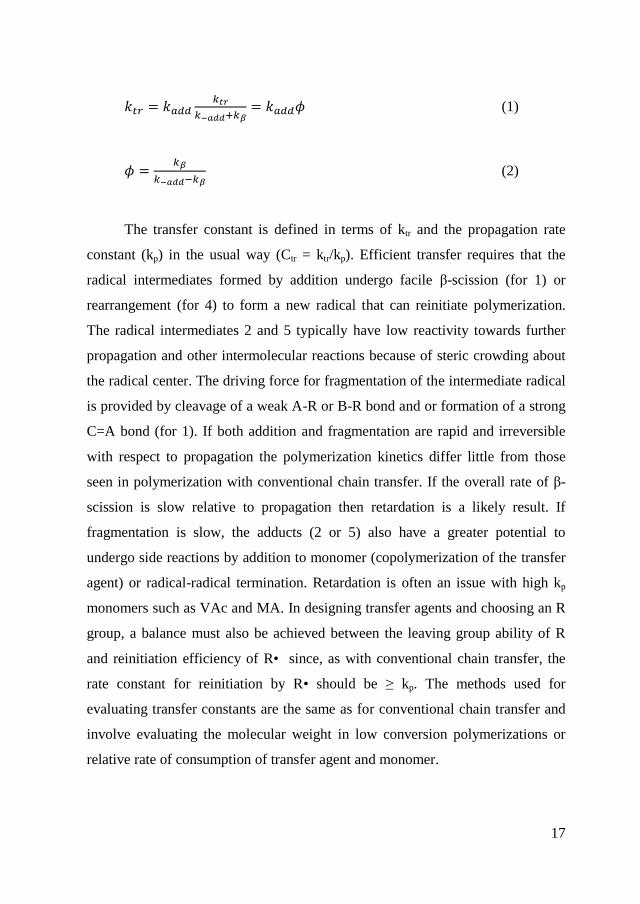
(1)
(2)
The transfer constant is defined in terms of ktr and the propagation rate
constant (kp) in the usual way (Ctr = ktr/kp). Efficient transfer requires that the
radical intermediates formed by addition undergo facile β-scission (for 1) or
rearrangement (for 4) to form a new radical that can reinitiate polymerization.
The radical intermediates 2 and 5 typically have low reactivity towards further
propagation and other intermolecular reactions because of steric crowding about
the radical center. The driving force for fragmentation of the intermediate radical
is provided by cleavage of a weak A-R or B-R bond and or formation of a strong
C=A bond (for 1). If both addition and fragmentation are rapid and irreversible
with respect to propagation the polymerization kinetics differ little from those
seen in polymerization with conventional chain transfer. If the overall rate of β-
scission is slow relative to propagation then retardation is a likely result. If
fragmentation is slow, the adducts (2 or 5) also have a greater potential to
undergo side reactions by addition to monomer (copolymerization of the transfer
agent) or radical-radical termination. Retardation is often an issue with high kp
monomers such as VAc and MA. In designing transfer agents and choosing an R
group, a balance must also be achieved between the leaving group ability of R
and reinitiation efficiency of R• since, as with conventional chain transfer, the
rate constant for reinitiation by R• should be ≥ kp. The methods used for
evaluating transfer constants are the same as for conventional chain transfer and
involve evaluating the molecular weight in low conversion polymerizations or
relative rate of consumption of transfer agent and monomer.
18
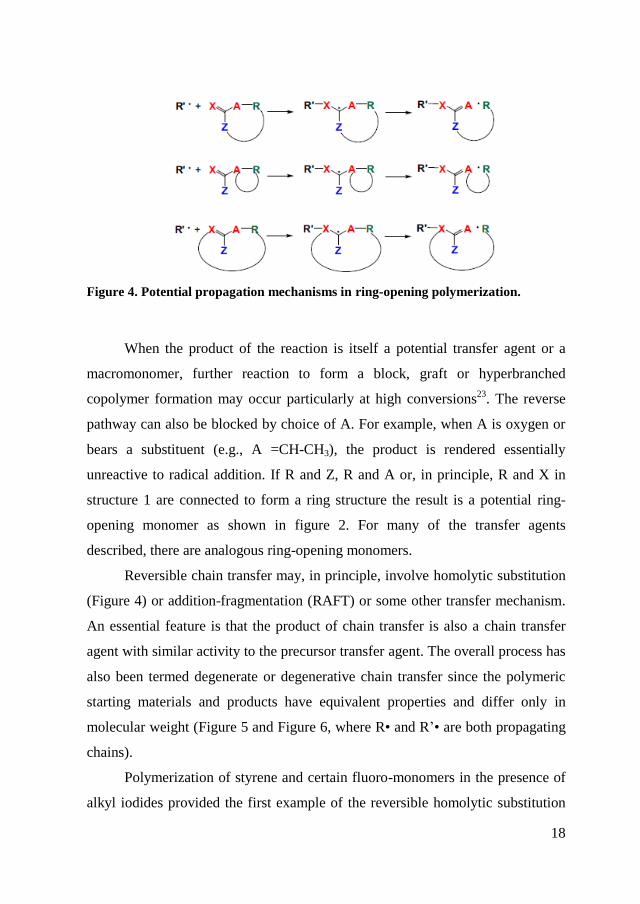
Figure 4. Potential propagation mechanisms in ring-opening polymerization.
When the product of the reaction is itself a potential transfer agent or a
macromonomer, further reaction to form a block, graft or hyperbranched
copolymer formation may occur particularly at high conversions23
. The reverse
pathway can also be blocked by choice of A. For example, when A is oxygen or
bears a substituent (e.g., A =CH-CH3), the product is rendered essentially
unreactive to radical addition. If R and Z, R and A or, in principle, R and X in
structure 1 are connected to form a ring structure the result is a potential ring-
opening monomer as shown in figure 2. For many of the transfer agents
described, there are analogous ring-opening monomers.
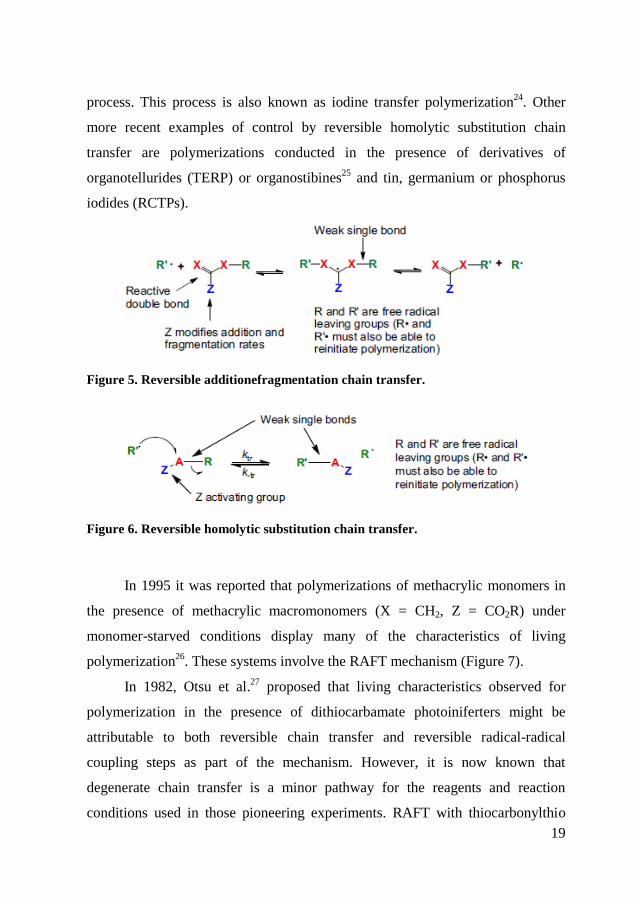
Reversible chain transfer may, in principle, involve homolytic substitution
(Figure 4) or addition-fragmentation (RAFT) or some other transfer mechanism.
An essential feature is that the product of chain transfer is also a chain transfer
agent with similar activity to the precursor transfer agent. The overall process has
also been termed degenerate or degenerative chain transfer since the polymeric
starting materials and products have equivalent properties and differ only in
molecular weight (Figure 5 and Figure 6, where R• and R’• are both propagating
chains).
Polymerization of styrene and certain fluoro-monomers in the presence of
alkyl iodides provided the first example of the reversible homolytic substitution
19
process. This process is also known as iodine transfer polymerization24
. Other
more recent examples of control by reversible homolytic substitution chain
transfer are polymerizations conducted in the presence of derivatives of
organotellurides (TERP) or organostibines25
and tin, germanium or phosphorus
iodides (RCTPs).
Figure 5. Reversible additionefragmentation chain transfer.
Figure 6. Reversible homolytic substitution chain transfer.
In 1995 it was reported that polymerizations of methacrylic monomers in
the presence of methacrylic macromonomers (X = CH2, Z = CO2R) under
monomer-starved conditions display many of the characteristics of living
polymerization26
. These systems involve the RAFT mechanism (Figure 7).
In 1982, Otsu et al.27
proposed that living characteristics observed for
polymerization in the presence of dithiocarbamate photoiniferters might be
attributable to both reversible chain transfer and reversible radical-radical
coupling steps as part of the mechanism. However, it is now known that
degenerate chain transfer is a minor pathway for the reagents and reaction
conditions used in those pioneering experiments. RAFT with thiocarbonylthio
20
compounds (X = S) was first reported in 1998 and is the most versatile and well
known process of this class. It is compatible with most monomer types and with
a very wide range of reaction conditions.
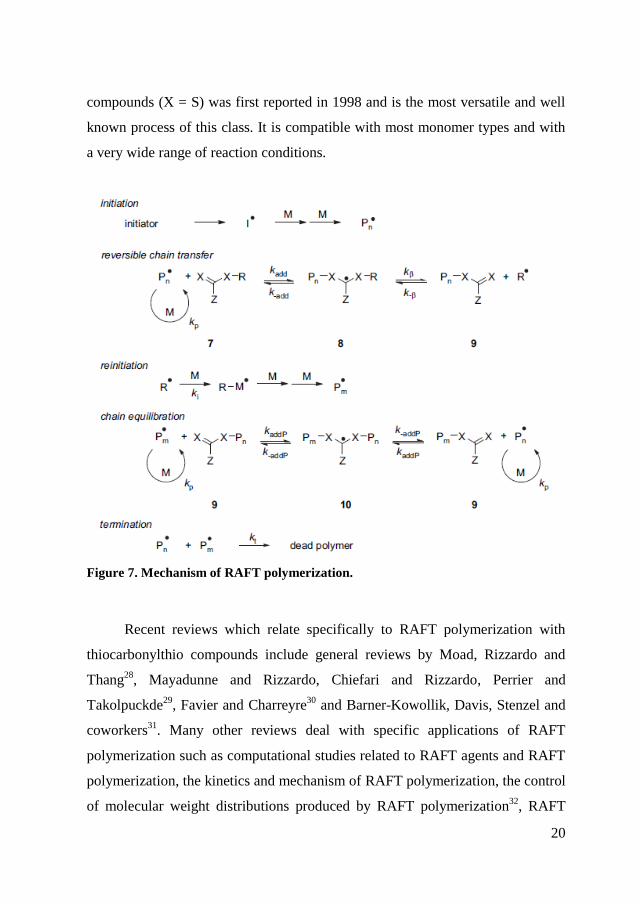
Figure 7. Mechanism of RAFT polymerization.
Recent reviews which relate specifically to RAFT polymerization with
thiocarbonylthio compounds include general reviews by Moad, Rizzardo and
Thang28
, Mayadunne and Rizzardo, Chiefari and Rizzardo, Perrier and
Takolpuckde29
, Favier and Charreyre30
and Barner-Kowollik, Davis, Stenzel and
coworkers31
. Many other reviews deal with specific applications of RAFT
polymerization such as computational studies related to RAFT agents and RAFT
polymerization, the kinetics and mechanism of RAFT polymerization, the control
of molecular weight distributions produced by RAFT polymerization32
, RAFT
21
polymerization in aqueous media33
, the use of RAFT polymerization in
heterogeneous media, the synthesis of end-functional polymers by RAFT
polymerization34
, star polymer synthesis35
, the synthesis and properties of stimuli
responsive block and other polymers and the preparation of honeycomb
structures36
.
The key feature of the mechanism of RAFT polymerization with
thiocarbonylthio compounds is the sequence of addition-fragmentation
equilibrium shown in Figure 737
. Initiation and radical-radical termination occur
as in conventional radical polymerization. In the early stages of the
polymerization, addition of a propagating radical (P•n) to the thiocarbonylthio
compound [RSC(Z)=S (7)] followed by fragmentation of the intermediate radical
provides a polymeric thiocarbonylthio compound [PnSC(Z)=S (9)] and a new
radical (R•). Reaction of this radical (R•) with monomer forms a new propagating
radical (P•m). Rapid equilibrium between the active propagating radicals (P
•n and
P•m) and the dormant polymeric thiocarbonylthio compounds (9) provides equal
probability for all chains to grow and allows for the production of narrow
polydispersity polymers. When the polymerization is complete (or stopped), the
vast majority of chains retains the thiocarbonylthio end group and can be isolated
as stable materials.
The reactions associated with RAFT equilibria shown in Figure 7 are in
addition to those (i.e. initiation, propagation and termination) that occur during
conventional radical polymerization. In an ideal RAFT process, the RAFT agent
should behave as an ideal transfer agent. Thus, as with radical polymerization
with conventional chain transfer, the kinetics of polymerization should not be
directly affected beyond those effects attributable to the differing molecular
weights of the reacting species. Radical-radical termination is not directly
suppressed by the RAFT process. Living characteristics are imparted only when
the molecular weight of the polymer formed is substantially lower than that
which might be formed in the absence of a RAFT agent and the number of
22
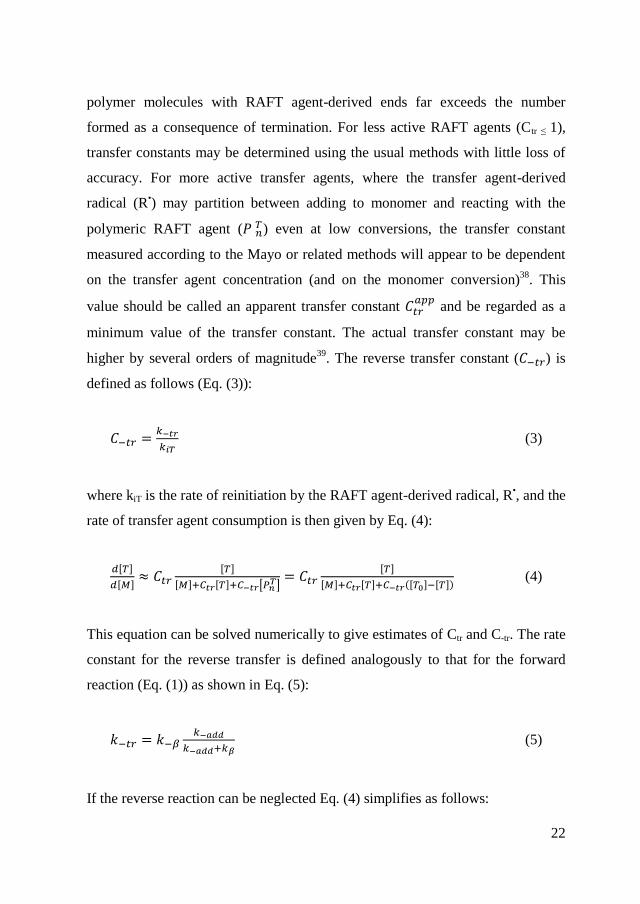
polymer molecules with RAFT agent-derived ends far exceeds the number
formed as a consequence of termination. For less active RAFT agents (Ctr ≤ 1),
transfer constants may be determined using the usual methods with little loss of
accuracy. For more active transfer agents, where the transfer agent-derived
radical (R•) may partition between adding to monomer and reacting with the
polymeric RAFT agent ( ) even at low conversions, the transfer constant
measured according to the Mayo or related methods will appear to be dependent
on the transfer agent concentration (and on the monomer conversion)38
. This
value should be called an apparent transfer constant
and be regarded as a
minimum value of the transfer constant. The actual transfer constant may be
higher by several orders of magnitude39
. The reverse transfer constant ( ) is
defined as follows (Eq. (3)):
(3)
where kiT is the rate of reinitiation by the RAFT agent-derived radical, R•, and the
rate of transfer agent consumption is then given by Eq. (4):
(4)
This equation can be solved numerically to give estimates of Ctr and C-tr. The rate
constant for the reverse transfer is defined analogously to that for the forward
reaction (Eq. (1)) as shown in Eq. (5):
(5)
If the reverse reaction can be neglected Eq. (4) simplifies as follows:
23
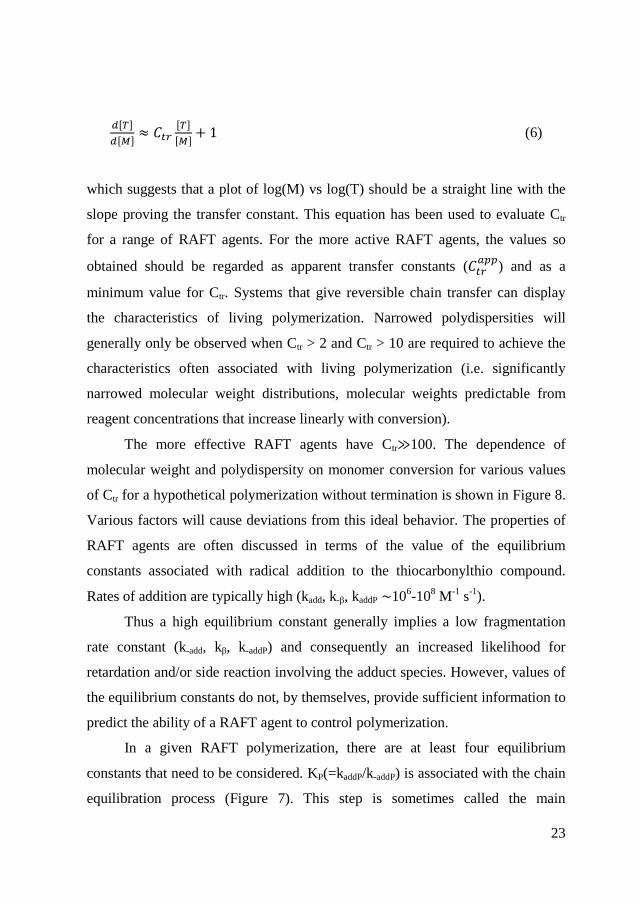
(6)
which suggests that a plot of log(M) vs log(T) should be a straight line with the
slope proving the transfer constant. This equation has been used to evaluate Ctr
for a range of RAFT agents. For the more active RAFT agents, the values so
obtained should be regarded as apparent transfer constants (
) and as a
minimum value for Ctr. Systems that give reversible chain transfer can display
the characteristics of living polymerization. Narrowed polydispersities will
generally only be observed when Ctr > 2 and Ctr > 10 are required to achieve the
characteristics often associated with living polymerization (i.e. significantly
narrowed molecular weight distributions, molecular weights predictable from
reagent concentrations that increase linearly with conversion).
The more effective RAFT agents have Ctr 100. The dependence of
molecular weight and polydispersity on monomer conversion for various values
of Ctr for a hypothetical polymerization without termination is shown in Figure 8.
Various factors will cause deviations from this ideal behavior. The properties of
RAFT agents are often discussed in terms of the value of the equilibrium
constants associated with radical addition to the thiocarbonylthio compound.
Rates of addition are typically high (kadd, k-β, kaddP 106-10
8 M
-1 s
-1).
Thus a high equilibrium constant generally implies a low fragmentation
rate constant (k-add, kβ, k-addP) and consequently an increased likelihood for
retardation and/or side reaction involving the adduct species. However, values of
the equilibrium constants do not, by themselves, provide sufficient information to
predict the ability of a RAFT agent to control polymerization.
In a given RAFT polymerization, there are at least four equilibrium
constants that need to be considered. KP(=kaddP/k-addP) is associated with the chain
equilibration process (Figure 7). This step is sometimes called the main

24
equilibrium. K(=kadd/k-add) and Kβ(=k-β/kβ) are associated with the initial
reversible chain transfer step sometimes known as the pre-equilibrium.
KR(=kaddR/k-addR)is associated with the reaction of the expelled radical with the
initial RAFT agent (Figure 5, where X=S). This process only becomes significant
if the intermediate formed has a significant lifetime. There may be other
equilibrium constants to consider if penultimate group effects are significant
(there is theoretical data40
and some experimental evidence41
to indicate that this
is the case). There are also a further series of reactions that need to be considered
that involve initiator radical-derived RAFT agents. In principle, RAFT agents of
differing reactivity might be derived from each radical species present.
Figure 8. Predicted dependence of (a) degree of polymerization and (b)
polydispersity on conversion in polymerizations involving reversible chain transfer
as a function of the chain transfer constant (Ctr). Predictions are based on equations
proposed by Müller et al.
It should be possible to estimate values of K by determining the
concentrations of the radical intermediates in RAFT polymerization by EPR (or
ESR) spectrometry and some effort has been directed to this end42
. Coote and
coworkers43
have devised methods for calculating absolute values of K by
applying ab initio methods. Values of K have also been estimated on the basis of
25
simulation of the polymerization kinetics44
. Values of K estimated on the basis of
the measured concentrations of the radical intermediates are substantially lower
than those predicted by theoretical calculations.
1.4. RAFT agents
The design of transfer agents, that give reversible addition-fragmentation
chain transfer, has provided one of the more successful approaches to living
radical polymerization and is described in the next section.
The effectiveness of RAFT agent depends on the monomer being
polymerized and depends strongly on the properties of the radical leaving group
R and the group Z which can be chosen to activate or deactivate the thiocarbonyl
double bond and to modify the stability of the intermediate radicals. For an
efficient RAFT polymerization: the RAFT agents must have a reactive C=S
double bond (high kadd), the intermediate radicals must fragment rapidly (high kβ,
weak X-R bonds) and give no side reactions, the intermediate must partition in
favors of products (kβ≥ k-add) and finally the expelled radicals (R•) must
efficiently reinitiate polymerization.
1.4.1. Z group
The Z group modifies both the rate of addition of propagating radicals (P
•n)
to the thiocarbonyl and the rate of fragmentation of the intermediate radicals. The
rate constant kadd can be “adjusted” over some 5 orders of magnitude through
manipulation of Z. The most reactive RAFT agents include the dithioesters and
trithiocarbonates which have carbon or sulfur adjacent to the thiocarbonylthio
group. RAFT agents with a lone pair on nitrogen or oxygen adjacent to the
thiocarbonyl, such as the O-alkyl xanthates, N,N-dialkyldithiocarbamates, and N-
alkyl-N-aryldithiocarbamates, have dramatically lower reactivity toward radical
26
addition. The interaction between the lone pair and the C=S double bond both
reduces the double-bond character of the thiocarbonyl group and stabilizes the
RAFT agent relative to the RAFT adduct radical. Dithiocarbamates where the
nitrogen lone pair is not as available because it is part of an aromatic ring system
(such as a pyrrole) or where a carbonyl is α to the nitrogen lone pair have
reactivity similar to that of the dithioesters and trithiocarbonates. The
effectiveness of xanthates is similarly sensitive to the nature of substituents on
oxygen. Monomers can be considered as belonging to one of two broad classes.
The “more activated” monomers (MAMs) are those where the double bond is
conjugated to an aromatic ring (e.g., styrene (St), vinylpyridine), a carbonyl
group (e.g., methyl methacrylate (MMA), methyl acrylate (MA), acrylamide
(AM)), or a nitrile (e.g., acrylonitrile (AN)). The “less activated” monomers
(LAMs) are those where the double bond is adjacent to saturated carbon (e.g.,
diallyldimethylammonium chloride), an oxygen, or nitrogen lone pair (e.g., vinyl
acetate (VAc) or N-vinylpyrrolidone (NVP)) or the heteroatom of a
heteroaromatic ring (e.g., N-vinylcarbazole (NVC)). Propagating radicals with a
terminal more active monomer (MAM) unit are less reactive in radical addition
(lower kp, lower kadd), and one of the more active RAFT agents is required for
good control. The poly(MAM) propagating radicals are relatively good
homolytic leaving groups; therefore, retardation solely due to slow fragmentation
is unlikely. The more active RAFT agents such as the dithioesters,
trithiocarbonates, and aromatic dithiocarbamates allow the preparation of low
dispersity polymers from MAMs, whereas the N-alkyl-N-aryldithiocarbamates
and the O-alkyl xanthates typically have lower transfer constants and provide
poor control. Propagating radicals with a terminal less-activated monomer
(LAM) unit are highly reactive in radical addition (higher kp, higher kadd).
Accordingly, addition to less active transfer agents such as the N-alkyl-N-
aryldithiocarbamates and the O-alkyl xanthates is sufficient that these RAFT
agents have high transfer constants in LAM polymerization. However, the
27
poly(LAM) propagating radicals are relatively poor homolytic leaving groups.
Thus, when more active RAFT agents, such as dithioesters, are used in LAM
polymerization, fragmentation is slow and inhibition or retardation is likely.
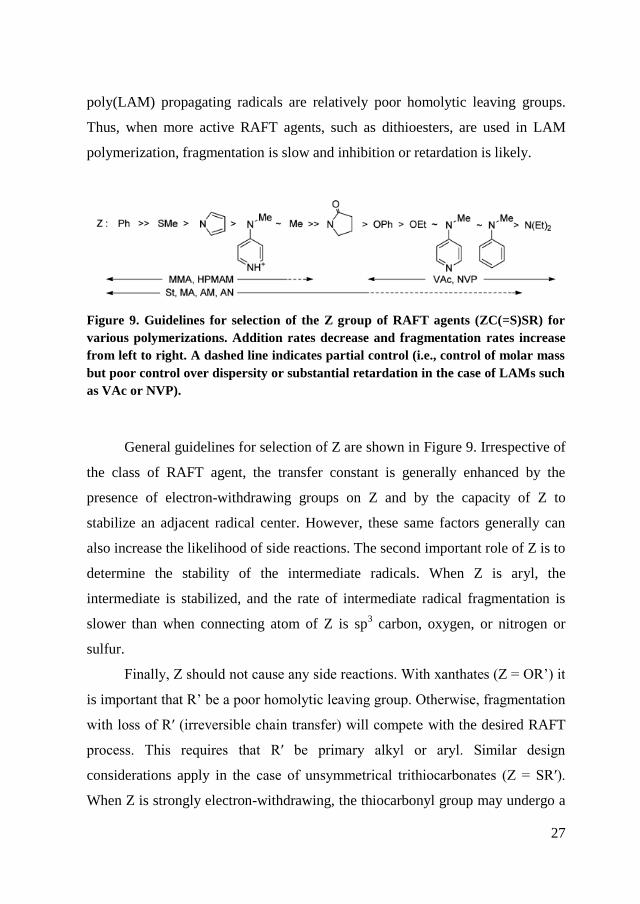
Figure 9. Guidelines for selection of the Z group of RAFT agents (ZC(=S)SR) for
various polymerizations. Addition rates decrease and fragmentation rates increase
from left to right. A dashed line indicates partial control (i.e., control of molar mass
but poor control over dispersity or substantial retardation in the case of LAMs such
as VAc or NVP).
General guidelines for selection of Z are shown in Figure 9. Irrespective of
the class of RAFT agent, the transfer constant is generally enhanced by the
presence of electron-withdrawing groups on Z and by the capacity of Z to
stabilize an adjacent radical center. However, these same factors generally can
also increase the likelihood of side reactions. The second important role of Z is to
determine the stability of the intermediate radicals. When Z is aryl, the
intermediate is stabilized, and the rate of intermediate radical fragmentation is
slower than when connecting atom of Z is sp3 carbon, oxygen, or nitrogen or
sulfur.
Finally, Z should not cause any side reactions. With xanthates (Z = OR’) it
is important that R’ be a poor homolytic leaving group. Otherwise, fragmentation
with loss of R′ (irreversible chain transfer) will compete with the desired RAFT
process. This requires that R′ be primary alkyl or aryl. Similar design
considerations apply in the case of unsymmetrical trithiocarbonates (Z = SR′).
When Z is strongly electron-withdrawing, the thiocarbonyl group may undergo a
28
direct reaction with monomers. Thus, RAFT agents where Z is alkylsulfonyl or
phenylsulfonyl group Z = PhSO2 undergo direct reaction with (meth)acrylate
monomers (BA, MA, tBA, and MMA) under polymerization conditions with
consumption of the thiocarbonylthio group and ultimately little control over the
polymerization. The presence of electron-withdrawing groups on Z, which lead
to higher transfer coefficients, increases the likelihood of side reactions such as
hydrolysis or aminolysis and participation in cycloaddition reactions such as the
hetero-Diels−Alder reaction with diene monomers and 1,3-dipolar cycloaddition.
This is an important consideration in some RAFT agent syntheses, can be critical
to the choice of RAFT agent for specific polymerization conditions (e.g., in
aqueous media or in emulsion polymerization) and determines the ease of end-
group transformation processes that may be required post-RAFT polymerization.
1.4.2. R group
The role of R group is determining the partition coefficient ϕ (eq 2). For
optimal control of a polymerization, the R group of the RAFT agent (ZC(=S)SR)
must be a good homolytic leaving group with respect to P•n, such that the
intermediate, formed by addition of P•n to ZC(=S)SR, both fragments rapidly and
partitions in favor of PnSC(=S)Z and R•. The expelled radical (R
•) must also be
able to reinitiate polymerization efficiently (i.e., ki,R > kp); otherwise, retardation
is likely. Radical stability is important in determining fragmentation rates.
Experimental findings that the transfer coefficient and the value of ϕ increase in
the series primary < secondary < tertiary and with the introduction of substituents
which are capable of delocalizing the radical center are consistent with this view.
It is not sufficient for R to be a monomeric analogue of the propagating
radical because penultimate unit effects are substantial, particularly when R is
tertiary. RAFT agents with R = 2-ethoxycarbonyl-2-propyl, which can be
considered as a monomeric model for a methacrylate chain, provide only poor
29
control over the polymerization of MMA and other methacrylates because R is a
poor homolytic leaving group with respect to the PMMA propagating radical. For
similar reasons, RAFT agent with R = t-butyl is poor with respect to RAFT agent
with R = t-octyl. These differences in RAFT agent activity are attributed to steric
factors. Polar effects are also extremely important in determining the partition
coefficient ϕ. Electron-withdrawing groups on R both decrease rates of addition
to the thiocarbonyl group and increase rates of fragmentation. The relatively high
transfer constants of cyanoalkyl RAFT agents (Figure 10) vs. similar benzylic
RAFT agents is attributed to the influence of polar factors.
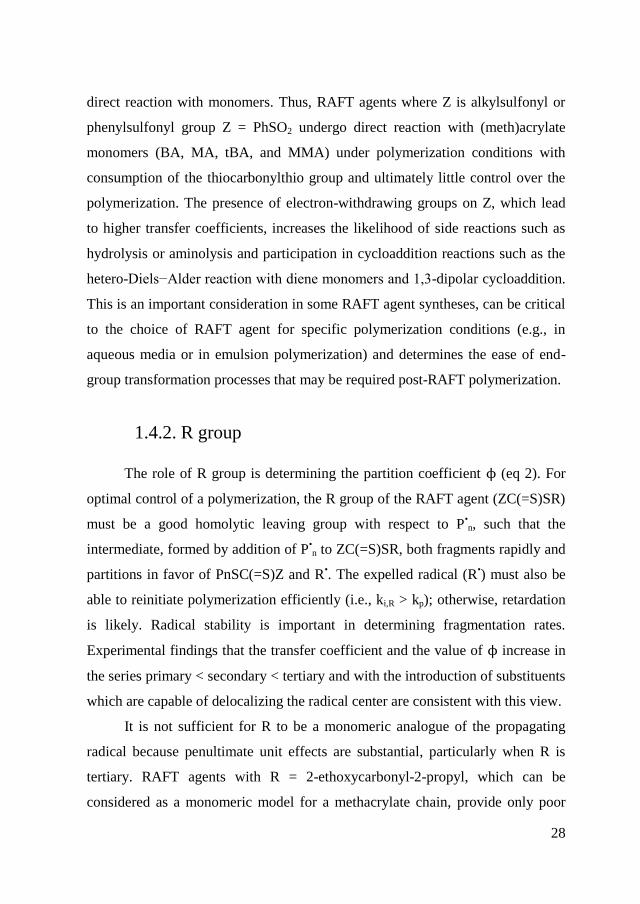
Figure 10. Guidelines for selection of the R group of RAFT agents (ZC(=S)SR) for
various polymerizations. Transfer coefficients decrease from left to right.
Fragmentation rates also decrease from left to right. A dashed line indicates partial
control (i.e., control of molar mass but poor control over dispersity or substantial
retardation in the case of VAc, NVC, or NVP).
Thus, control over the polymerization of methacrylates and
methacrylamides usually requires that R to be tertiary (e.g., 2-cyano-2-propyl or
cumyl) or secondary aralkyl (e.g., α-cyanobenzyl). However, polymerization of
monomers with high propagation rate constants (kp) such as acrylates,
acrylamides, vinyl esters (e.g., vinyl acetate), and vinyl amides are best
controlled with RAFT agents with primary or secondary R groups. Tertiary
radicals, such as 2-cyano-2-propyl radical, are inefficient in reinitiating
polymerization since ki,R is often lower than kp.
The order shown is based on measurements of
for dithiobenzoate
RAFT agents in St and MMA polymerization and seems general based on limited
data for other classes of RAFT agent. The benzylic radicals and tertiary alkyl
30
radicals add to most LAMs very slowly (with reference to kp) and an inhibition
period is often observed with these R groups. In the synthesis of a block
copolymer comprising segments of a 1,1-disubstuted monomer and a
monosubstituted monomer the block comprising the 1,1- disubstuted monomer
should be prepared first. Similarly, in synthesizing a poly(MAM)-block-poly-
(LAM), using switchable RAFT, the poly(MAM) block should be made first
because poly(LAM) propagating radicals are relatively poor homolytic leaving
groups, however, poly(MAM) propagating radicals are slow to reinitiate LAM
polymerization.
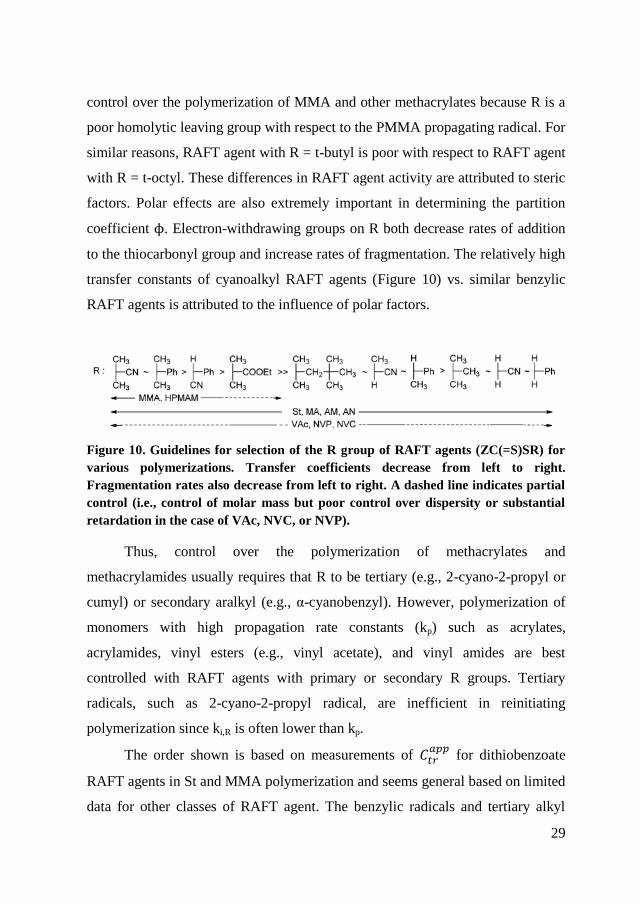
1.5. Design of RAFT agents
The RAFT agents can differentiate mainly into four different classes as
dithioesters, trithiocarbonates, xanthates and dithiocarbamates (Figure 11).
Moreover there are other compounds (bis- and multi-RAFT agents) that premises
to give complex architectures, for example the symmetrical trithiocarbonates can
make copolymers as ABBA and star-trithiocarbonates produce dendritic
polymers. When a transfer agent is used for the formation of a homopolymer
(which then is located at terminals) and when it is chemically bonded to a
different macromolecule is called “macrotransfer” or macro-RAFT. A classic
example is represented by the transfer members joined to polyetilene oxide
(PEO), used for the synthesis of amphiphilic copolymers.
Figure 11. Structure of thiocarbonylthio transfer agents.
31
The choice of transfer agent must carry the following conditions: that there
is polymerization, that the molecular weight should be controlled and that
polydispersity obtained should be less than or equal to 1.4. These criteria are
dependent on polymerization conditions. It should be pointed out that a broad
molecular weight distribution is not by itself an indication that there is a low
fraction of living chains and thus it should not be taken as an indication that the
RAFT agent is not useful for preparing block copolymers or for preparing end-
functional polymers based on the indicated monomer. A more quantitative
indication of effectiveness is provided by the transfer constant data. However,
such data are, as yet, available for few systems.
A wide range of dithioester RAFT agents have been reported in literature.
Examples of unprotected functionality that have been incorporated into the ‘R’
fragment of dithiobenzoate RAFT agents include hydroxy, carboxylic
acid/carboxylate, sulfonic acid/sulfonate, azide, olefin and siloxane. Bis- and
multi-dithioester RAFT agents that may be used for triblock or star synthesis.
Bis-dithioesters can be used to synthesize triblock copolymers in a two-step
process. Dithiobenzoates and similar dithioesters with Z=aryl are amongst the
most active RAFT agents, and with appropriate choice of ‘R’, have general
applicability in the polymerization of (meth)acrylic and styrenic monomers.
However, their use can give retardation, particularly when used in high
concentrations (to provide lower molecular weight polymers) and with high kp
monomers (acrylates, acrylamides). They are also more sensitive to hydrolysis
and decomposition by Lewis acids than other RAFT agents.
The utility of trithiocarbonate RAFT agents was disclosed in the first
RAFT patent and many papers now describe their application. Trithiocarbonates
are less active than dithiobenzoate and similar RAFT agents yet still provide
good control over the polymerization of (meth)acrylic and styrenic monomers.
More importantly, they give substantially less retardation, are less prone to
hydrolytic degradation and, typically, are more readily synthesized. Ideally, to
32
avoid odour issues with the RAFT agent and polymer the ‘Z’, and preferably the
‘R(S)’groups, should be based on thiols with low volatility. Awide range of
trithiocarbonate RAFT agents have now been reported, two classes are
distinguished. Non-symmetrical trithiocarbonates have only one good homolytic
leaving group. The other S-substituent is typically primary alkyl. Symmetrical
trithiocarbonates have two good homolytic leaving groups and the
trithiocarbonate group remains in the centre of the structure.
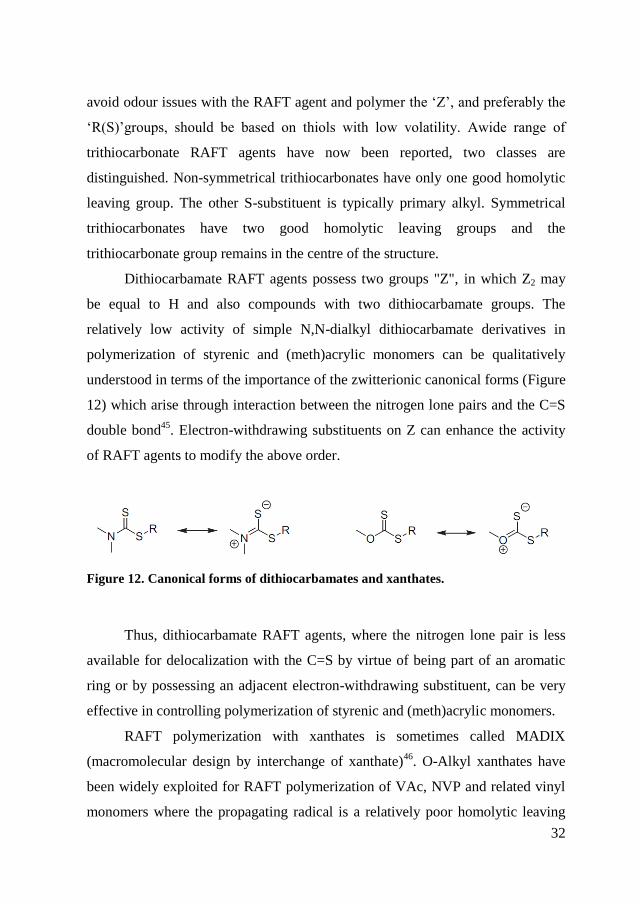
Dithiocarbamate RAFT agents possess two groups "Z", in which Z2 may
be equal to H and also compounds with two dithiocarbamate groups. The
relatively low activity of simple N,N-dialkyl dithiocarbamate derivatives in
polymerization of styrenic and (meth)acrylic monomers can be qualitatively
understood in terms of the importance of the zwitterionic canonical forms (Figure
12) which arise through interaction between the nitrogen lone pairs and the C=S
double bond45
. Electron-withdrawing substituents on Z can enhance the activity
of RAFT agents to modify the above order.
Figure 12. Canonical forms of dithiocarbamates and xanthates.
Thus, dithiocarbamate RAFT agents, where the nitrogen lone pair is less
available for delocalization with the C=S by virtue of being part of an aromatic
ring or by possessing an adjacent electron-withdrawing substituent, can be very
effective in controlling polymerization of styrenic and (meth)acrylic monomers.
RAFT polymerization with xanthates is sometimes called MADIX
(macromolecular design by interchange of xanthate)46
. O-Alkyl xanthates have
been widely exploited for RAFT polymerization of VAc, NVP and related vinyl
monomers where the propagating radical is a relatively poor homolytic leaving
33
group. They are generally less effective (have low transfer constants) in
polymerization of styrenic and acrylic monomers and offer no control for
methacrylic polymers. This can be qualitatively understood in terms of the
importance of the zwitterionic canonical forms (Figure 12). As is the case with
N,N-dialkyl dithiocarbamates, electron-withdrawing substituents on Z can
enhance the activity of RAFT agents so that they are more effective in
polymerization of styrenic and (meth)acrylic monomers. Thus transfer constants
of the O-aryl xanthates are higher than those of simple O-alkyl xanthates. Those
of fluorinated xanthates are higher than those of non-fluorinated analogues. O-
Alkyl xanthates with appropriate selection of R have transfer constants with
acrylates in the range 2-7. This is sufficient to provide end group control at high
conversion (it may be possible to make block copolymers) and some trend for
increase in molecular weight with conversion. It is not sufficient to provide very
narrow molecular weight distributions.
1.6. Polymer architecture
Through the technique of RAFT polymerization very complex polymeric
systems can be formed: in this paragraph the synthesis of block copolymers and
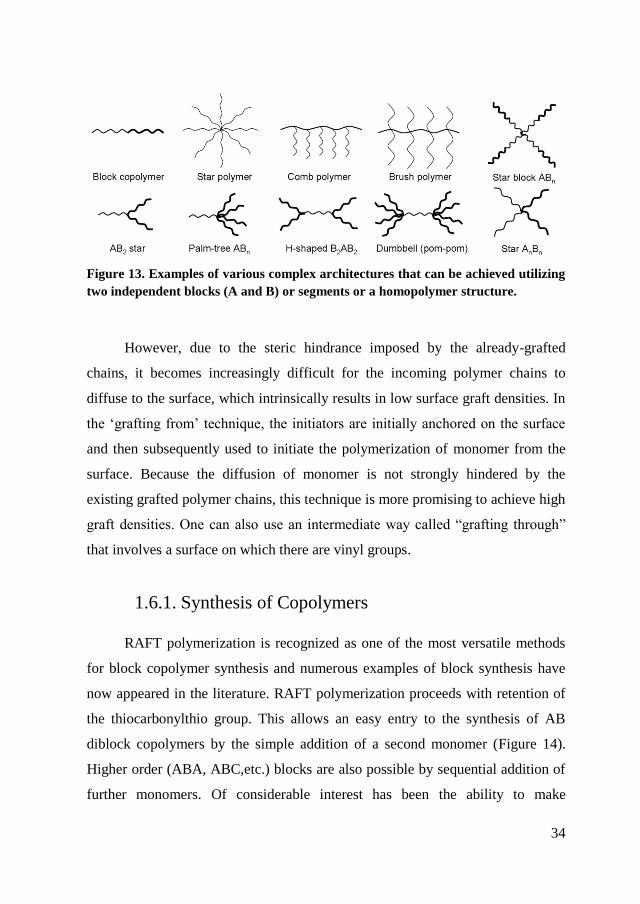
the growth of polymers from surface of oxides or metal are described. As shown
in Figure 13, through suitable RAFT agents and two different monomers (A and
B), endless macromolecular architectures can be obtained. From the most simple
linear block copolymers to branched polymers of different nature as palm-tree
ABn, H-shaped B2AB2, dumb-bell (pom-pom), ring diblock, starblock (AB)n.
In general, polymer grafting techniques provide a versatile tool to
covalently modify the surface of materials or oxides47,48
. These techniques can be
categorized into ‘grafting to’ and ‘grafting from’. In the ‘grafting-to’ technique,
the polymer, bearing an appropriate functional group, reacts with the material
surfaces to form chemically attached chains.
34
Figure 13. Examples of various complex architectures that can be achieved utilizing
two independent blocks (A and B) or segments or a homopolymer structure.
However, due to the steric hindrance imposed by the already-grafted
chains, it becomes increasingly difficult for the incoming polymer chains to
diffuse to the surface, which intrinsically results in low surface graft densities. In
the ‘grafting from’ technique, the initiators are initially anchored on the surface
and then subsequently used to initiate the polymerization of monomer from the
surface. Because the diffusion of monomer is not strongly hindered by the
existing grafted polymer chains, this technique is more promising to achieve high
graft densities. One can also use an intermediate way called “grafting through”
that involves a surface on which there are vinyl groups.
1.6.1. Synthesis of Copolymers
RAFT polymerization is recognized as one of the most versatile methods
for block copolymer synthesis and numerous examples of block synthesis have
now appeared in the literature. RAFT polymerization proceeds with retention of
the thiocarbonylthio group. This allows an easy entry to the synthesis of AB
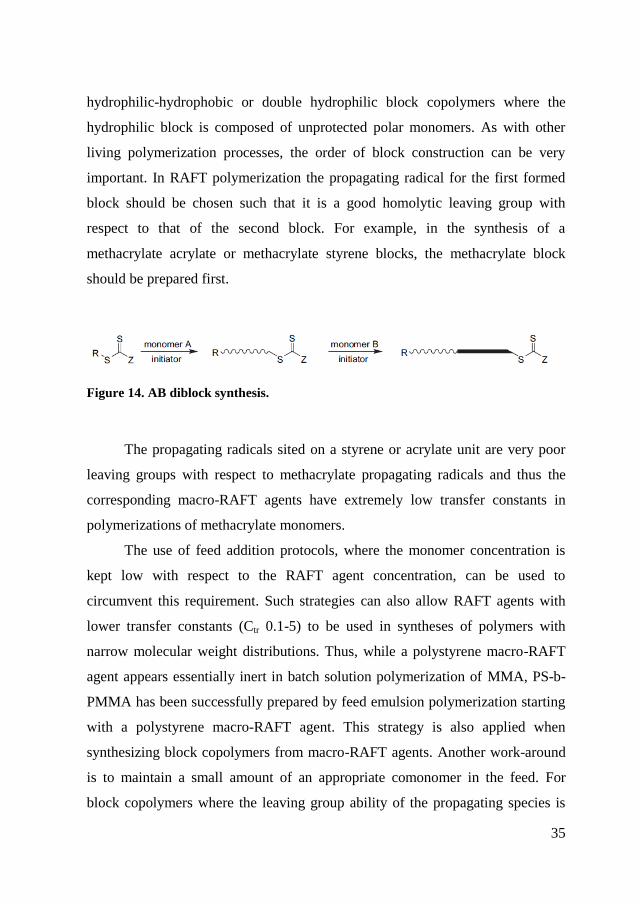
diblock copolymers by the simple addition of a second monomer (Figure 14).
Higher order (ABA, ABC,etc.) blocks are also possible by sequential addition of
further monomers. Of considerable interest has been the ability to make
35
hydrophilic-hydrophobic or double hydrophilic block copolymers where the
hydrophilic block is composed of unprotected polar monomers. As with other
living polymerization processes, the order of block construction can be very
important. In RAFT polymerization the propagating radical for the first formed
block should be chosen such that it is a good homolytic leaving group with
respect to that of the second block. For example, in the synthesis of a
methacrylate acrylate or methacrylate styrene blocks, the methacrylate block
should be prepared first.
Figure 14. AB diblock synthesis.
The propagating radicals sited on a styrene or acrylate unit are very poor
leaving groups with respect to methacrylate propagating radicals and thus the
corresponding macro-RAFT agents have extremely low transfer constants in
polymerizations of methacrylate monomers.
The use of feed addition protocols, where the monomer concentration is
kept low with respect to the RAFT agent concentration, can be used to
circumvent this requirement. Such strategies can also allow RAFT agents with
lower transfer constants (Ctr 0.1-5) to be used in syntheses of polymers with
narrow molecular weight distributions. Thus, while a polystyrene macro-RAFT
agent appears essentially inert in batch solution polymerization of MMA, PS-b-
PMMA has been successfully prepared by feed emulsion polymerization starting
with a polystyrene macro-RAFT agent. This strategy is also applied when
synthesizing block copolymers from macro-RAFT agents. Another work-around
is to maintain a small amount of an appropriate comonomer in the feed. For
block copolymers where the leaving group ability of the propagating species is
36
similar the order of construction is less critical. Thus, in synthesis of block
copolymers of styrene with acrylic acid or with acrylate esters either block can be
made first.
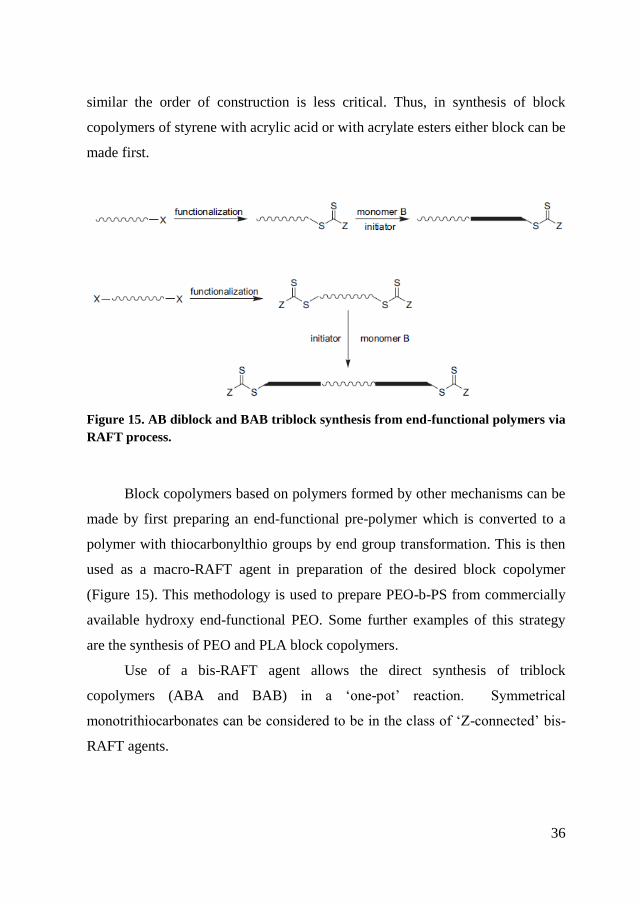
Figure 15. AB diblock and BAB triblock synthesis from end-functional polymers via
RAFT process.
Block copolymers based on polymers formed by other mechanisms can be
made by first preparing an end-functional pre-polymer which is converted to a
polymer with thiocarbonylthio groups by end group transformation. This is then
used as a macro-RAFT agent in preparation of the desired block copolymer
(Figure 15). This methodology is used to prepare PEO-b-PS from commercially
available hydroxy end-functional PEO. Some further examples of this strategy
are the synthesis of PEO and PLA block copolymers.
Use of a bis-RAFT agent allows the direct synthesis of triblock
copolymers (ABA and BAB) in a ‘one-pot’ reaction. Symmetrical
monotrithiocarbonates can be considered to be in the class of ‘Z-connected’ bis-
RAFT agents.
37
1.6.2. Grafting
As said above, the RAFT agents have different R and Z groups, which may
feature different functionalities that can be used to bind the transfer agent to a
surface. The polymerization is greatly influenced in the case in which the group
thiocarbonyl is always close to the surface (Z-approach) or on the terminal of the
growing polymer (R-approach). It must be considered that since the RAFT
technique is relatively new it is difficult to judge which one of the two
approaches R- or Z-group approach is better. Decision must be made on a case-
by-case basis.
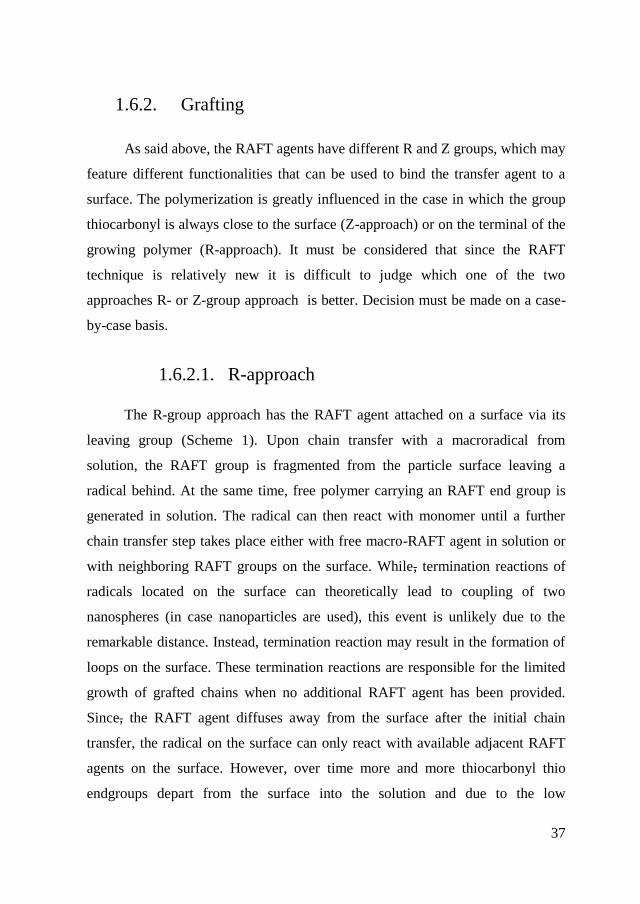
1.6.2.1. R-approach
The R-group approach has the RAFT agent attached on a surface via its
leaving group (Scheme 1). Upon chain transfer with a macroradical from
solution, the RAFT group is fragmented from the particle surface leaving a
radical behind. At the same time, free polymer carrying an RAFT end group is
generated in solution. The radical can then react with monomer until a further
chain transfer step takes place either with free macro-RAFT agent in solution or
with neighboring RAFT groups on the surface. While, termination reactions of
radicals located on the surface can theoretically lead to coupling of two
nanospheres (in case nanoparticles are used), this event is unlikely due to the
remarkable distance. Instead, termination reaction may result in the formation of
loops on the surface. These termination reactions are responsible for the limited
growth of grafted chains when no additional RAFT agent has been provided.
Since, the RAFT agent diffuses away from the surface after the initial chain
transfer, the radical on the surface can only react with available adjacent RAFT
agents on the surface. However, over time more and more thiocarbonyl thio
endgroups depart from the surface into the solution and due to the low
38
concentrations of RAFT agent in the solution are not very likely to be replaced.
Consequently, more and more chains on the surface terminate and therefore stop
growing. The termination between two adjacent radicals is dependent on the
concentration of immobilized RAFT agents since a high grafting density
increases the likelihood of the occurrence of recombinant graft chains. By adding
free RAFT agent to the monomer solution the macroradical on the surface can
regain the RAFT functionality from the surrounding solution, therefore
maintaining the living process. Subsequent cleavage of the grafted chain from the
surface for further analysis confirms that the molecular weight of the grafted
chain is similar to the molecular weight of free polymer, though the PDI of the
grafted chains tend to be higher.
Scheme 1. R- approach scheme.
Studies of T. Fukuda et al.49
show that the high occurrence of termination
events on the surface at a high graft density requires the addition of free RAFT
agent to the monomer solution. By reducing the RAFT agent density, and
therefore the number of grafted chains, extensive ‘‘surface radical migration’’
can be reduced. As a consequence, the molecular weight and PDIs of the chains
on the surface was observed to be similar to the RAFT controlled polymerization
in bulk solution.50
39
To maintain a living behavior it is therefore crucial to tailor the amount of
immobilized RAFT agents on the surface or to add sacrificial free RAFT agent to
the monomer solution. In many cases when grafting via R-group approach, the
molecular weight on the surface is measured to be close to the molecular weight
in solution. However, the polymer in solution is not always a mirror image of
the grafted one. Effects such as a higher rate of polymerization of surface
grafted chains in combination with narrower molecular weight distribution
compared to solution polymerization can be explained by the unique structure
and steric environment of the surface anchored intermediate macro-RAFT agent
radical and also the localized high RAFT agent concentration effect.51
Many
investigations using the R-group approach have been undertaken using silica gel
particles.52
Also other nanoparticles such as gold53
or CdSe54
were successfully
used to generate core–shell nanoparticles with a well-defined brush layer on the
surface. Obviously, termination events on the surface between two macroradicals
are the main obstacle in the generation of well-defined surface brushes via R-
group approach.
1.6.2.2. Z-approach
The Z-group approach, in contrast, has never radicals located on the
surface (Scheme 2). With the initiation of the polymerization, the macroradical
needs to diffuse to the surface to undergo chain transfer. After the addition
fragmentation step a grafted chain leaves the surface and can diffuse into the
solution. Here, the macroradical is subject to termination events if an RAFT
agent cannot be reached in time.55
Investigations by P. Vana ed al.56
on surface
grafted RAFT agents, which were dispersed in a monomer–initiator solution,
confirmed indeed the presence of a significant amount of polymeric solution. The
macroradical generated in solution was not able to arrive at the surface
immobilized thiocarbonyl thio functionality and underwent instead free radical
40
polymerization. The substantial amount of polymer generated in solution could
have two reasons: either the macroradical could not contact the surface since the
distance between macroradical and surface was too high or the macroradical was
not able to penetrate though the brush layer on the surface and underwent instead
termination. In contrast to the R-group approach where thiocarbonyl thio groups
migrate into the solution, the dead polymer in solution is colorless indicating the
absence of any RAFT group. The distance for a macroradical to travel from
solution to surface can be reduced by increasing the concentration of the
nanoparticles, thus increasing the surface concentration: this significantly reduces
the amount of dead polymer. It is interesting to note that the molecular weight in
solution nevertheless increases linearly with conversion.
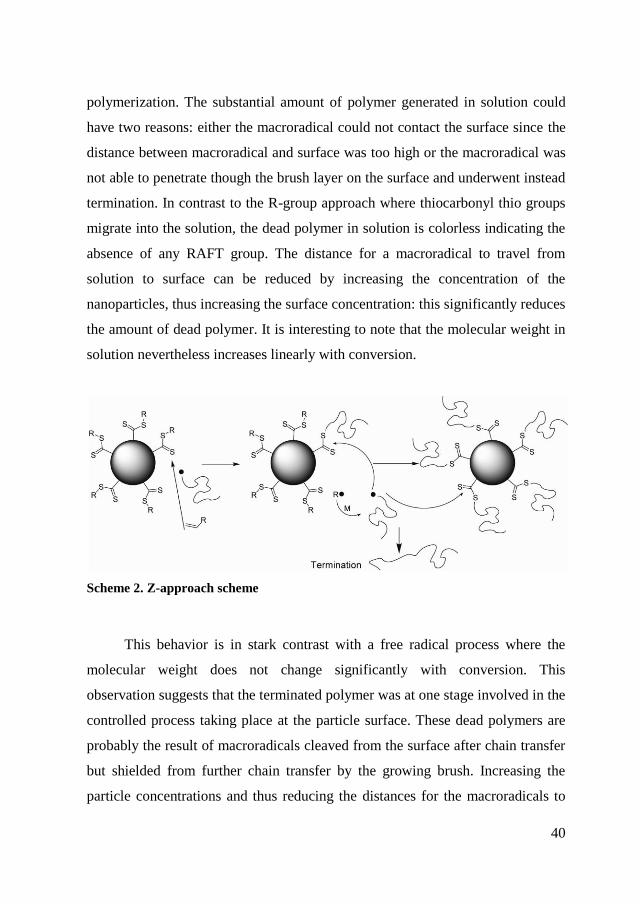
Scheme 2. Z-approach scheme
This behavior is in stark contrast with a free radical process where the
molecular weight does not change significantly with conversion. This
observation suggests that the terminated polymer was at one stage involved in the
controlled process taking place at the particle surface. These dead polymers are
probably the result of macroradicals cleaved from the surface after chain transfer
but shielded from further chain transfer by the growing brush. Increasing the
particle concentrations and thus reducing the distances for the macroradicals to
41
diffuse can reduce termination events in solution, which will lead to a decrease in
molecular weight and a narrowing of the molecular weight distribution of the
solution polymer. However, the grafted chain had a lower than expected
molecular weight considering the monomer conversion57
or it was typically
smaller than the molecular weight of the free polymer. A more striking feature
was that the molecular weight distribution of the grafted polymer was
significantly broadened. Better control can be achieved by adding sacrificial free
RAFT agent to the monomer solution. The molecular weight distribution of the
grafted chain and the polymer in solution was observed to be narrower in size
indicating a better control. In addition, the amount of free polymer was
significantly reduced. Depending on the system, almost matching molecular
weights of the polymer in solution with the grafted polymer close to the expected
values were obtained confirming a sufficient control of the surface grafted RAFT
agent. But success is not always guaranteed and the molecular weight of the
surface grafted chain lags behind the theoretical value. While the molecular
weight may be very close to the theoretical value at low conversions, it quickly
deviates from the expected linear increase remaining well below the expected
molecular weight. At the same time, the free polymer increases, sometimes
exponentially, in size. The reduction of the growth of the grafted polymer can be
explained by steric hindrance, which prevents the macroradical from re-entering
the surface brush. Reducing the loading of surface immobilized RAFT agents
does not necessarily improve the grafting process. It was observed that reducing
the amount of RAFT agent on the surface -which would lead to brushes of lower
density- does result in the opposite effect with the grafted chain increasing even
less in molecular weight with conversion. This suggests that the process is
indisputably more complicated than expected. It may even be the case that high
RAFT agent loading result in a dense brush where the macroradical cannot leave
the surface. The entangled macroradical is then in close surrounding of the
thiocarbonyl thio group and will feed from monomers diffusing into the brush.

42
Due to the limited movement of the macroradical in the brush termination
reaction may be reduced. Effects caused by chain dynamics should not be
underestimated as seen in polymerizations in good and poor solvents. The
molecular weight of the grafted chain was found to be increased, when the
polymerization was carried out in a bad solvent.
43
Chapter 2. RAFT agents
The first part of this chapter describes the type of RAFT agent used and
the reason for their choice, in particular it is described the difference between the
functional groups. Then the synthesis and characterization of the five RAFT
agents are reported.
2.1. Why have different agents?
As mentioned in the previous chapter, there are many different types of
RAFT agents that differ, beside R and Z groups, also in the "core" of the
molecule, which is the part that allows the equilibrium of addition and
fragmentation.
In this work RAFT agents of the family of trithiocabonate were
investigated because they seemed the most tunable and stable. Moreover, the
presence of many studies in literature with similar transfer agents has allowed
greater control over the polymerization product. The five synthesized agents
were chosen according to Z and R groups functionalities: in particular, functional
groups related to the used monomers (styrene, dimethylacrylamide and isoprene)
and that would give stable bonds to metal oxides (TiO2 and SiO2) and hydroxyl
groups, were selected.
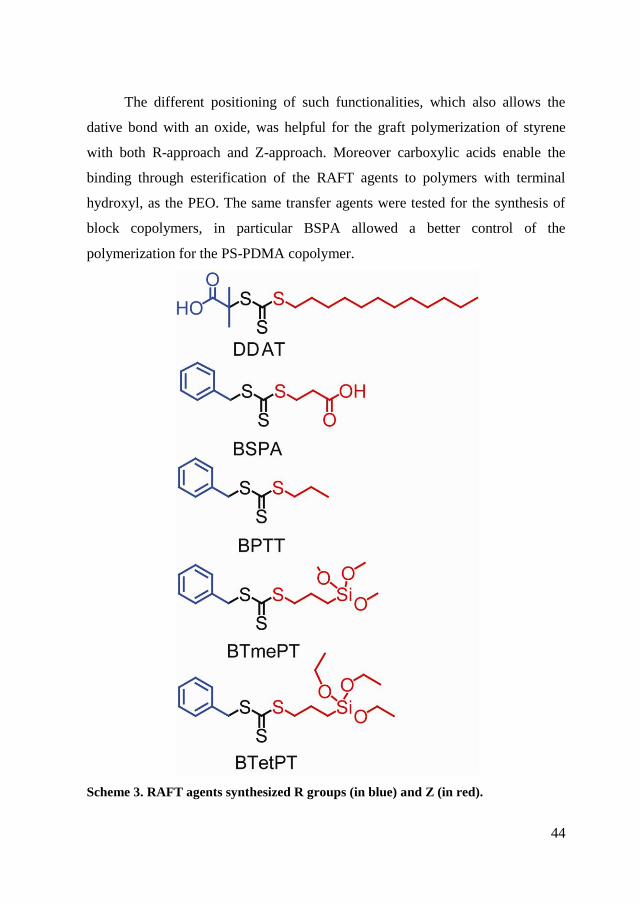
In Scheme 3 RAFT agents are shown, with R and Z groups highlighted in
blue and red, respectively. In particular, S-1-Dodecyl-S'-(,’-dimethyl-’’-acetic
acid) trithiocarbonate (DDAT) is constituted by a functional end with carboxylic
acid in the R group in contrast to the 3-benzylsulfanylthiocarbonylsufanyl
propionic acid (BSPA) that has acid functionality on Z.
44
The different positioning of such functionalities, which also allows the
dative bond with an oxide, was helpful for the graft polymerization of styrene
with both R-approach and Z-approach. Moreover carboxylic acids enable the
binding through esterification of the RAFT agents to polymers with terminal
hydroxyl, as the PEO. The same transfer agents were tested for the synthesis of
block copolymers, in particular BSPA allowed a better control of the
polymerization for the PS-PDMA copolymer.
Scheme 3. RAFT agents synthesized R groups (in blue) and Z (in red).
45
RAFT agents S-Benzyl S’-trimethoxysilylpropyltrithiocarbonate
(BTmePT) and S-Benzyl S’-triethoxysilylpropyltrithiocarbonate (BTetPT) were
synthesized for grafting polymerization of SiO2 as they exhibit siloxane
functionality, which forms a covalent bond on the surface of the oxide and
therefore gives a greater stability between the surface and the RAFT agent.
Finally, benzyl S-propyltrithiocarbonate (BPTT) has been produced to have a
transfer agent similar to the other two but without siloxane functionality. As
discussed in the literature, a RAFT agent in solution, in a process of grafting
from via RAFT polymerization, should lead to an improvement of the efficiency
of polymerization.
2.2. Synthesis and characterizations
The synthesis of the five RAFT agents was performed as follows. S-1-
Dodecyl-S’-(,’-dimethyl-’’-acetic acid) trithiocarbonate58
(DDAT) and 3-
benzylsulfanylthiocarbonylsufanylpropionic acid59,60,61
(BSPA) were synthesized
in a similar way to the reported procedure. S-Benzyl S-
trimethoxysilylpropyltrithiocarbonate62,63
(BTmePT) and S-benzyl S-
propyltrithiocarbonate (BPTT) were prepared in accordance with Perrier et
al.64
,65
,66
The last RAFT agent, S-Benzyl S-triethoxysilylpropyltrithiocarbonate
(BTetPT), is a newly synthesized compound obtained modifying BTmePT
synthetic protocol. The characterization was carried out with 1H NMR,
13C NMR,
DSC and FT-IR ATR.
2.2.1. DDAT
In a jacketed reactor with mechanical stirring, 48.07 ml of 1-
Dodecanethiol (0.20 mol), 120 ml of acetone and 3.24 g of Aliquot
(tricaprylylmethylammonium chloride, 8.0 mmol) were added and cooled to 10
46
°C under a argon atmosphere. Sodium hydroxide solution 50%, (8.38 ml, 0.21
mol) was added dropwise in 20 min. The color changed to white while the
reaction was stirred for 15 min. Then, a solution of 24.54 ml of acetone (0.33
mol) and 12.07 ml of carbon disulfide (0.20 mol) were added dropwise in 20
min, and during this time the color turned red. Twenty minutes later, 24.36 ml of
chloroform (0.30 mol) was added, followed by dropwise addition of 50% sodium
hydroxide solution (40 ml, 1.53 mol) over 30 min. The reaction was stirred
overnight. 600 mL of distilled water was added at room temperature, followed by
50 mL of concentrated HCl (37%) to acidify the aqueous solution. The reactor
was purged with a nitrogen flow during vigorous stirring to help evaporate off
acetone. The solid was collected with a Buchner funnel and then dissolved in 600
ml of 2-propanol. The undissolved solid (recognized as S,S’-bis(1-dodecyl)
trithiocarbonate, dimer of DDAT) was filtered off three times. The 2-propanol
solution was dried with mechanical vacuum, and the resulting solid was
recrystallized from hexane two times.
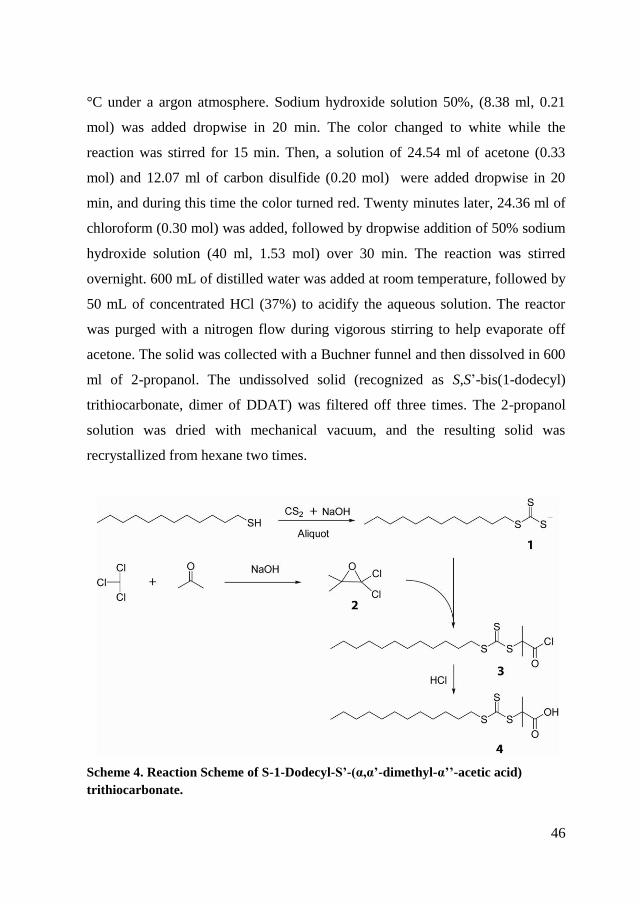
Scheme 4. Reaction Scheme of S-1-Dodecyl-S’-(α,α’-dimethyl-α’’-acetic acid)
trithiocarbonate.
47
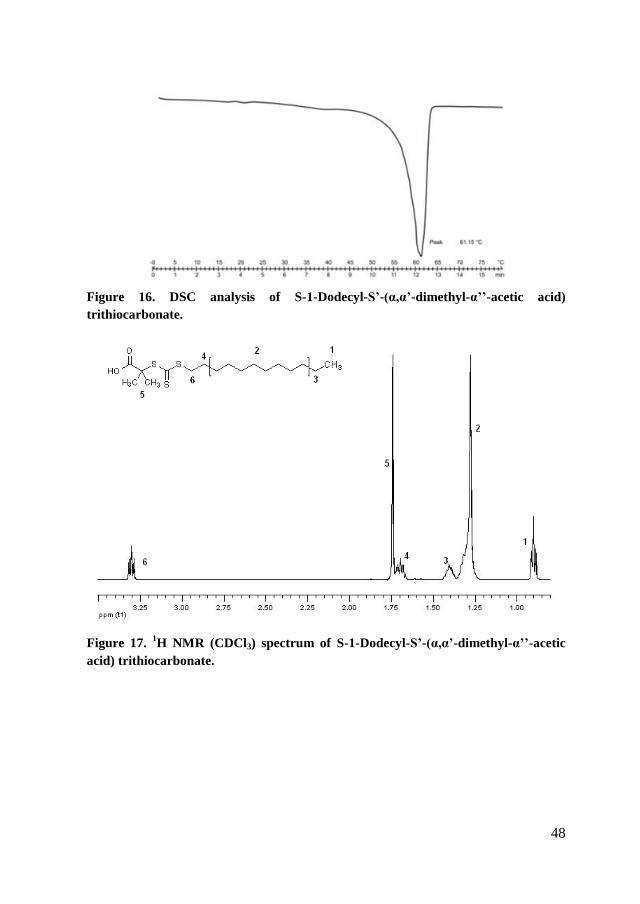
Yield 47.12 % of yellow crystalline solid; Tm = 61.15 °C was determined
by DSC. FT-IR ATR: 1060 cm-1
C=S groups, 1703 cm-1
C=O groups. 1H NMR
(CDCl3): 0.90 (t, 3H, -CH3), 1.28 (m, 16H, -(CH2)8-), 1.40 (m, 2H, CH3-CH2-),
1.70 (m, 2H, -S-CH2-CH2-), 1.74 (s, 6H, -CH3), 3.37 (t, 2H, -S-CH2-), 11.90 (s,
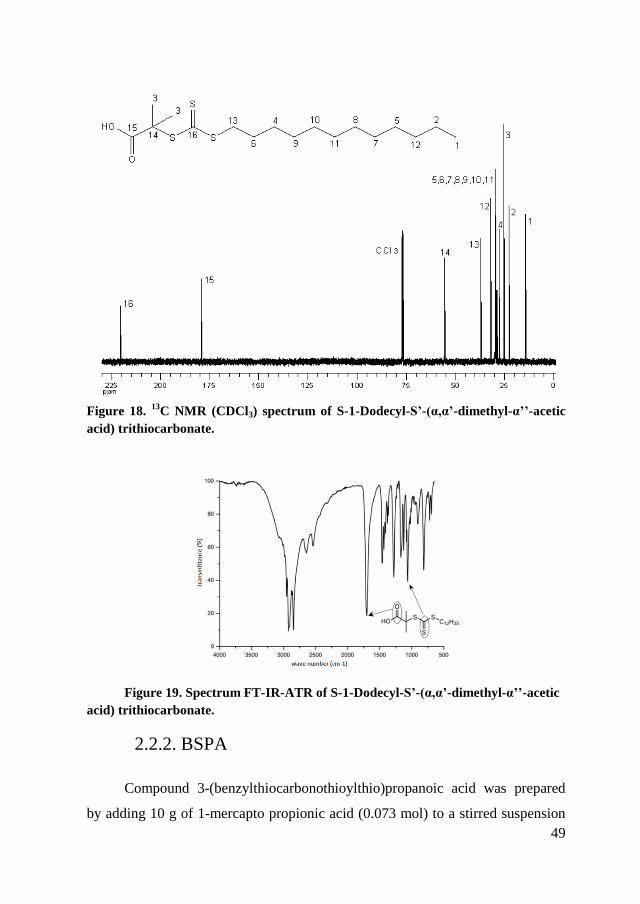
1H, -OH). 13
C NMR (CDCl3): 14.14 (-CH3), 22.70-31.93 (-(CH2)8-), 37.07 (-S-
CH2-), 55.61 (-C(CH3)2), 179.18 (C=O), 220.77 (-C=S).
To obtain DDAT was introduced into the reactor sodium hydroxide and 1-
Dodecanethiol, with a surfactant, to create the thiol anion. The reaction proceeds
at 10 ° C under argon atmosphere to avoid the presence of oxygen and the
evaporation of the solvent. CS2 was dropped forming the anion trithiocarbonate
(product 1 in Scheme 4), demonstrated by the red color of the solution. After
twenty minutes chloroform and sodium hydroxide were added dropwise to
acetone and together, already present in solution, producing the epoxide (2) that
reacts with ion tritiocarbonato forming the acyl chloride of the desired compound
(3). The reaction proceeds to for the night at room temperature. A solution of
concentrated acid was added forming S-1-Dodecyl-S’-(α,α’-dimethyl-α’’-acetic
acid) trithiocarbonate (4). The product was dissolved in 2-propanol and filtered
removing the insoluble dimer (S, S'-bis (1-dodecyl) trithiocarbonate).
DDAT RAFT agent was purified by recrystallization from methanol 3
times, the purity of the product was followed by DSC analysis (Figure 16). From
the measurements of nuclear magnetic resonance (Figure 17) it was possible to
check the purity of the product. The assignment of the peaks in the 13
C NMR
were performed by comparing similar studies in the literature (Figure 18).
Figure 19 shows the absorption spectrum of the sample the peaks
representative of the molecule: 1060 cm-1
there is the group C = S and 1703 cm-1
the group C = O.
48
Figure 16. DSC analysis of S-1-Dodecyl-S’-(α,α’-dimethyl-α’’-acetic acid)
trithiocarbonate.
Figure 17. 1H NMR (CDCl3) spectrum of S-1-Dodecyl-S’-(α,α’-dimethyl-α’’-acetic
acid) trithiocarbonate.
49
Figure 18. 13
C NMR (CDCl3) spectrum of S-1-Dodecyl-S’-(α,α’-dimethyl-α’’-acetic
acid) trithiocarbonate.
Figure 19. Spectrum FT-IR-ATR of S-1-Dodecyl-S’-(α,α’-dimethyl-α’’-acetic
acid) trithiocarbonate.
2.2.2. BSPA
Compound 3-(benzylthiocarbonothioylthio)propanoic acid was prepared
by adding 10 g of 1-mercapto propionic acid (0.073 mol) to a stirred suspension
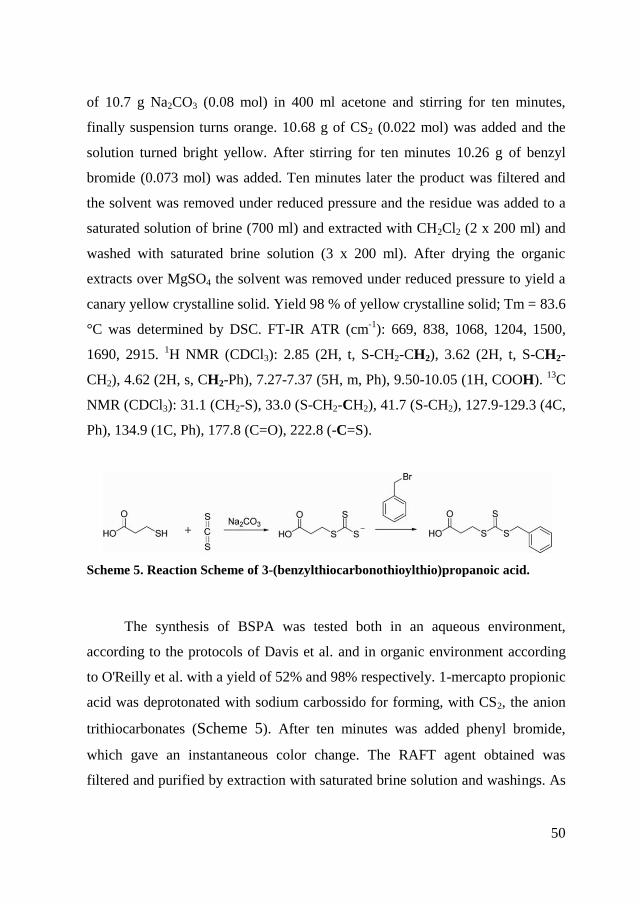
50
of 10.7 g Na2CO3 (0.08 mol) in 400 ml acetone and stirring for ten minutes,
finally suspension turns orange. 10.68 g of CS2 (0.022 mol) was added and the
solution turned bright yellow. After stirring for ten minutes 10.26 g of benzyl
bromide (0.073 mol) was added. Ten minutes later the product was filtered and
the solvent was removed under reduced pressure and the residue was added to a
saturated solution of brine (700 ml) and extracted with CH2Cl2 (2 x 200 ml) and
washed with saturated brine solution (3 x 200 ml). After drying the organic
extracts over MgSO4 the solvent was removed under reduced pressure to yield a
canary yellow crystalline solid. Yield 98 % of yellow crystalline solid; Tm = 83.6
°C was determined by DSC. FT-IR ATR (cm-1
): 669, 838, 1068, 1204, 1500,
1690, 2915. 1H NMR (CDCl3): 2.85 (2H, t, S-CH2-CH2), 3.62 (2H, t, S-CH2-
CH2), 4.62 (2H, s, CH2-Ph), 7.27-7.37 (5H, m, Ph), 9.50-10.05 (1H, COOH). 13
C
NMR (CDCl3): 31.1 (CH2-S), 33.0 (S-CH2-CH2), 41.7 (S-CH2), 127.9-129.3 (4C,
Ph), 134.9 (1C, Ph), 177.8 (C=O), 222.8 (-C=S).
Scheme 5. Reaction Scheme of 3-(benzylthiocarbonothioylthio)propanoic acid.
The synthesis of BSPA was tested both in an aqueous environment,
according to the protocols of Davis et al. and in organic environment according
to O'Reilly et al. with a yield of 52% and 98% respectively. 1-mercapto propionic
acid was deprotonated with sodium carbossido for forming, with CS2, the anion
trithiocarbonates (Scheme 5). After ten minutes was added phenyl bromide,
which gave an instantaneous color change. The RAFT agent obtained was
filtered and purified by extraction with saturated brine solution and washings. As
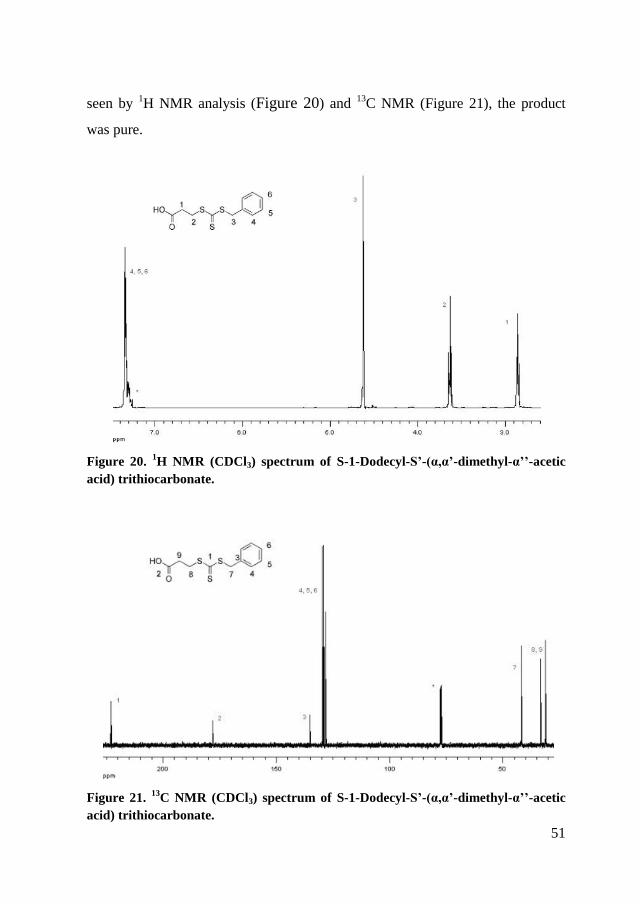
51
seen by 1H NMR analysis (Figure 20) and
13C NMR (Figure 21), the product
was pure.
Figure 20. 1H NMR (CDCl3) spectrum of S-1-Dodecyl-S’-(α,α’-dimethyl-α’’-acetic
acid) trithiocarbonate.
Figure 21. 13
C NMR (CDCl3) spectrum of S-1-Dodecyl-S’-(α,α’-dimethyl-α’’-acetic
acid) trithiocarbonate.

52
The ATR-IR analysis shown the typical signs of RAFT agent synthesized
(Figure 22), 669 cm-1
bending of C-H (Ph), 838 cm-1
bending of C=S, 1068 cm-1
stretching of, 1204 cm-1
bending of C-O, cm-1
stretching of CH2, 1500 cm-1
stretching of C=C, 1690 cm-1
stretching of C=O, 2915 cm-1
stretching of C-H and
2500-3100 stretching of OH group.
Figure 22. Specto IR-ATR of 3-(benzylthiocarbonothioylthio)propanoic acid.
2.2.3. BTmePT
To a stirred solution of 6.20 g of 3-(mercaptopropyl) trimethoxysilane
(95%, 30 mmol) in 50 mL of anhydrous methanol was added dropwise in 6.12 ml
of sodium methoxide in methanol (25 wt %, 30 mmol) under argon. After stirring
for 30 min, 3.05 g of CS2 (40 mmol) was added dropwise to the solution, and the
mixture was then stirred at ambient temperature for 5 h. To the yellow solution
was added 5.24 g of benzyl bromide (98%, 30 mmol), and the mixture was
stirred overnight under argon. The mixture was concentrated, diluted with
dichloromethane, filtered off, and concentrated under reduced pressure until
constant weight. BTmePT (10.8 g, 30 mmol) was obtained as orange oil and
stored at 4 °C. Yield 47.12 %. 1H NMR (CDCl3): 0.78 (t, 2H, CH2Si), 1.84 (m,
2H, CH2), 3.41 (t, 2H, CH2S), 3.57 (s, 9H, CH3O), 4.61 (s, 2H, CH2), 7.33 (m,
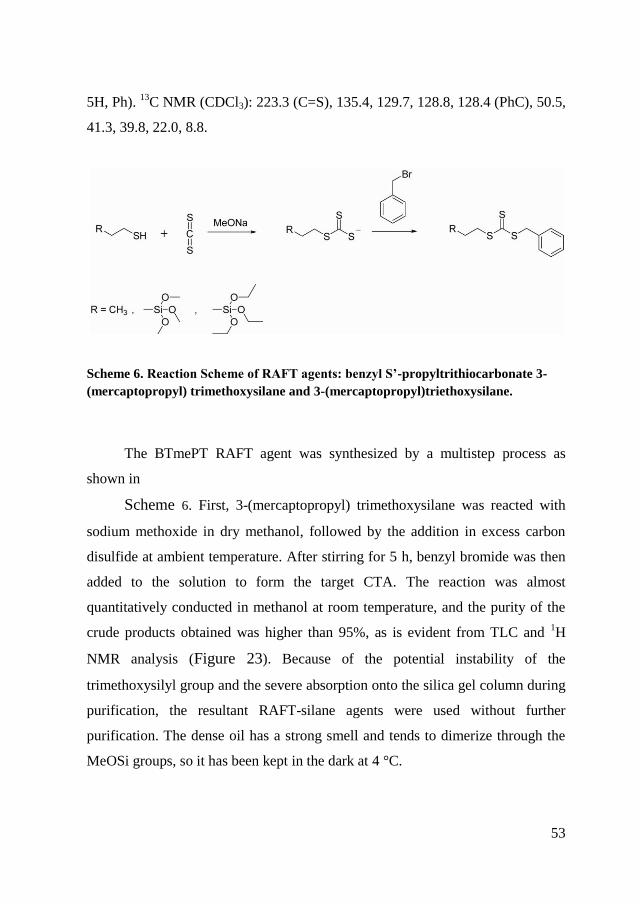
53
5H, Ph). 13
C NMR (CDCl3): 223.3 (C=S), 135.4, 129.7, 128.8, 128.4 (PhC), 50.5,
41.3, 39.8, 22.0, 8.8.
Scheme 6. Reaction Scheme of RAFT agents: benzyl S’-propyltrithiocarbonate 3-
(mercaptopropyl) trimethoxysilane and 3-(mercaptopropyl)triethoxysilane.
The BTmePT RAFT agent was synthesized by a multistep process as
shown in
Scheme 6. First, 3-(mercaptopropyl) trimethoxysilane was reacted with
sodium methoxide in dry methanol, followed by the addition in excess carbon
disulfide at ambient temperature. After stirring for 5 h, benzyl bromide was then
added to the solution to form the target CTA. The reaction was almost
quantitatively conducted in methanol at room temperature, and the purity of the
crude products obtained was higher than 95%, as is evident from TLC and 1H
NMR analysis (Figure 23). Because of the potential instability of the
trimethoxysilyl group and the severe absorption onto the silica gel column during
purification, the resultant RAFT-silane agents were used without further
purification. The dense oil has a strong smell and tends to dimerize through the
MeOSi groups, so it has been kept in the dark at 4 °C.
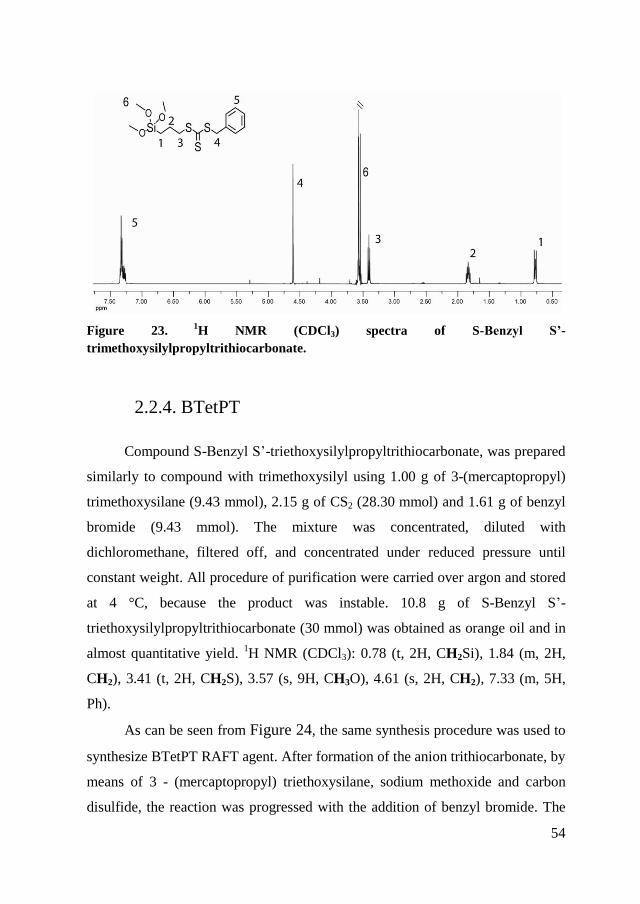
54
Figure 23. 1
H NMR (CDCl3) spectra of S-Benzyl S’-
trimethoxysilylpropyltrithiocarbonate.
2.2.4. BTetPT
Compound S-Benzyl S’-triethoxysilylpropyltrithiocarbonate, was prepared
similarly to compound with trimethoxysilyl using 1.00 g of 3-(mercaptopropyl)
trimethoxysilane (9.43 mmol), 2.15 g of CS2 (28.30 mmol) and 1.61 g of benzyl
bromide (9.43 mmol). The mixture was concentrated, diluted with
dichloromethane, filtered off, and concentrated under reduced pressure until
constant weight. All procedure of purification were carried over argon and stored
at 4 °C, because the product was instable. 10.8 g of S-Benzyl S’-
triethoxysilylpropyltrithiocarbonate (30 mmol) was obtained as orange oil and in
almost quantitative yield. 1H NMR (CDCl3): 0.78 (t, 2H, CH2Si), 1.84 (m, 2H,
CH2), 3.41 (t, 2H, CH2S), 3.57 (s, 9H, CH3O), 4.61 (s, 2H, CH2), 7.33 (m, 5H,
Ph).
As can be seen from Figure 24, the same synthesis procedure was used to
synthesize BTetPT RAFT agent. After formation of the anion trithiocarbonate, by
means of 3 - (mercaptopropyl) triethoxysilane, sodium methoxide and carbon
disulfide, the reaction was progressed with the addition of benzyl bromide. The
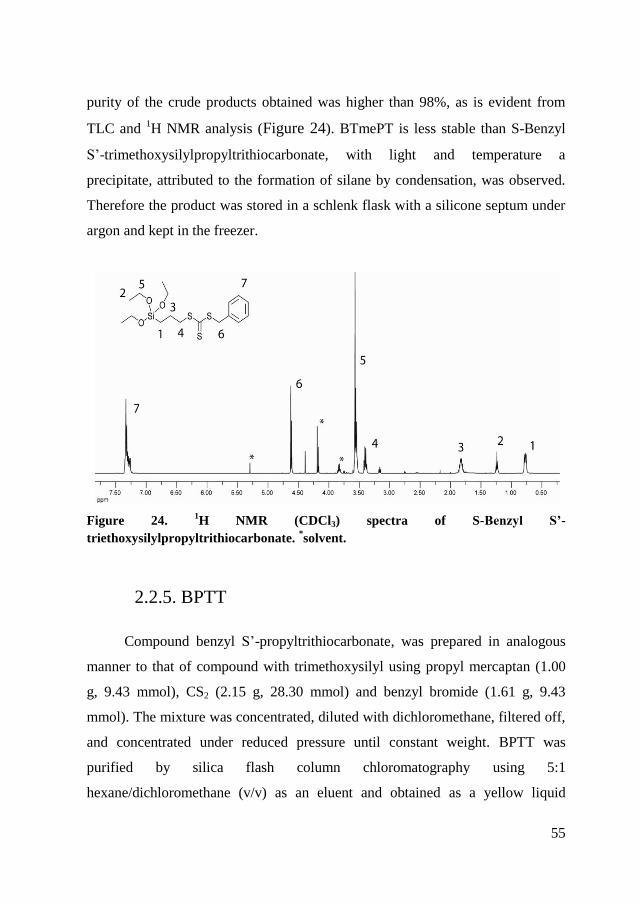
55
purity of the crude products obtained was higher than 98%, as is evident from
TLC and 1H NMR analysis (Figure 24). BTmePT is less stable than S-Benzyl
S’-trimethoxysilylpropyltrithiocarbonate, with light and temperature a
precipitate, attributed to the formation of silane by condensation, was observed.
Therefore the product was stored in a schlenk flask with a silicone septum under
argon and kept in the freezer.
Figure 24. 1H NMR (CDCl3) spectra of S-Benzyl S’-
triethoxysilylpropyltrithiocarbonate. *solvent.
2.2.5. BPTT
Compound benzyl S’-propyltrithiocarbonate, was prepared in analogous
manner to that of compound with trimethoxysilyl using propyl mercaptan (1.00
g, 9.43 mmol), CS2 (2.15 g, 28.30 mmol) and benzyl bromide (1.61 g, 9.43
mmol). The mixture was concentrated, diluted with dichloromethane, filtered off,
and concentrated under reduced pressure until constant weight. BPTT was
purified by silica flash column chloromatography using 5:1
hexane/dichloromethane (v/v) as an eluent and obtained as a yellow liquid
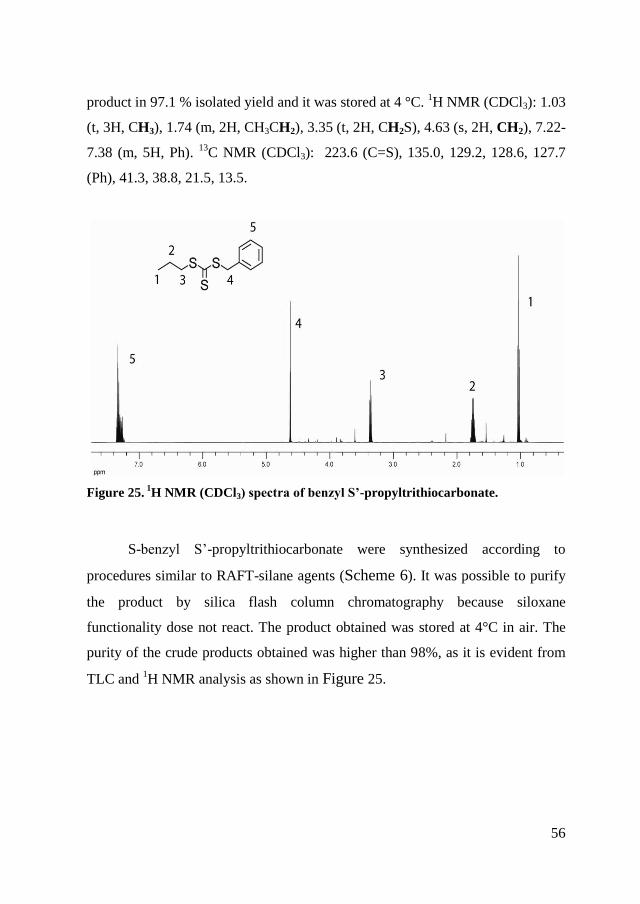
56
product in 97.1 % isolated yield and it was stored at 4 °C. 1H NMR (CDCl3): 1.03
(t, 3H, CH3), 1.74 (m, 2H, CH3CH2), 3.35 (t, 2H, CH2S), 4.63 (s, 2H, CH2), 7.22-
7.38 (m, 5H, Ph). 13
C NMR (CDCl3): 223.6 (C=S), 135.0, 129.2, 128.6, 127.7
(Ph), 41.3, 38.8, 21.5, 13.5.
Figure 25. 1H NMR (CDCl3) spectra of benzyl S’-propyltrithiocarbonate.
S-benzyl S’-propyltrithiocarbonate were synthesized according to
procedures similar to RAFT-silane agents (Scheme 6). It was possible to purify
the product by silica flash column chromatography because siloxane
functionality dose not react. The product obtained was stored at 4°C in air. The
purity of the crude products obtained was higher than 98%, as it is evident from
TLC and 1H NMR analysis as shown in Figure 25.
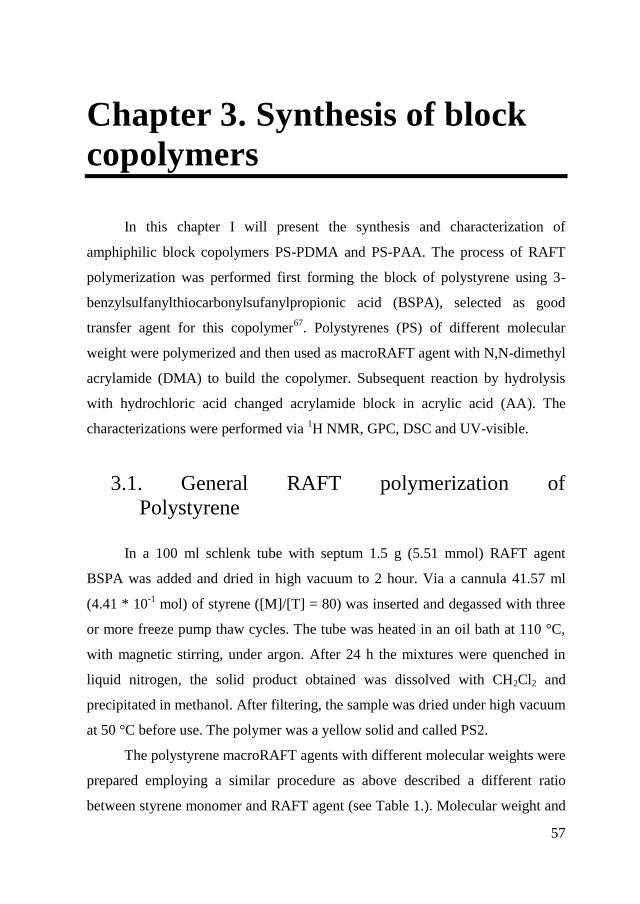
57
Chapter 3. Synthesis of block
copolymers
In this chapter I will present the synthesis and characterization of
amphiphilic block copolymers PS-PDMA and PS-PAA. The process of RAFT
polymerization was performed first forming the block of polystyrene using 3-
benzylsulfanylthiocarbonylsufanylpropionic acid (BSPA), selected as good
transfer agent for this copolymer67
. Polystyrenes (PS) of different molecular
weight were polymerized and then used as macroRAFT agent with N,N-dimethyl
acrylamide (DMA) to build the copolymer. Subsequent reaction by hydrolysis
with hydrochloric acid changed acrylamide block in acrylic acid (AA). The
characterizations were performed via 1H NMR, GPC, DSC and UV-visible.
3.1. General RAFT polymerization of
Polystyrene
In a 100 ml schlenk tube with septum 1.5 g (5.51 mmol) RAFT agent
BSPA was added and dried in high vacuum to 2 hour. Via a cannula 41.57 ml
(4.41 * 10-1
mol) of styrene ([M]/[T] = 80) was inserted and degassed with three
or more freeze pump thaw cycles. The tube was heated in an oil bath at 110 °C,
with magnetic stirring, under argon. After 24 h the mixtures were quenched in
liquid nitrogen, the solid product obtained was dissolved with CH2Cl2 and
precipitated in methanol. After filtering, the sample was dried under high vacuum
at 50 °C before use. The polymer was a yellow solid and called PS2.
The polystyrene macroRAFT agents with different molecular weights were
prepared employing a similar procedure as above described a different ratio
between styrene monomer and RAFT agent (see Table 1.). Molecular weight and
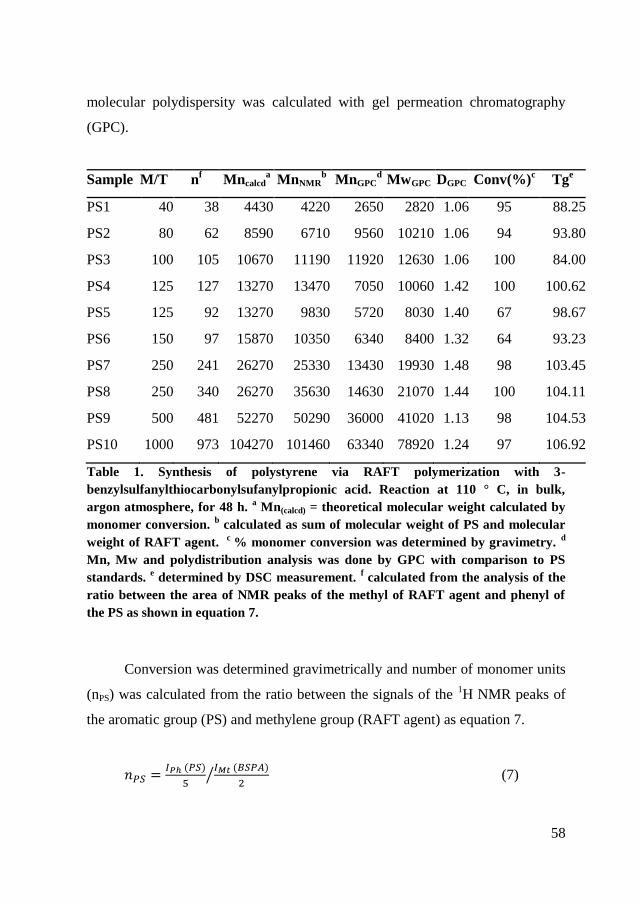
58
molecular polydispersity was calculated with gel permeation chromatography
(GPC).
Sample M/T nf Mncalcd
a MnNMR
b MnGPC
d MwGPC DGPC Conv(%)
c Tg
e
PS1 40 38 4430 4220 2650 2820 1.06 95 88.25
PS2 80 62 8590 6710 9560 10210 1.06 94 93.80
PS3 100 105 10670 11190 11920 12630 1.06 100 84.00
PS4 125 127 13270 13470 7050 10060 1.42 100 100.62
PS5 125 92 13270 9830 5720 8030 1.40 67 98.67
PS6 150 97 15870 10350 6340 8400 1.32 64 93.23
PS7 250 241 26270 25330 13430 19930 1.48 98 103.45
PS8 250 340 26270 35630 14630 21070 1.44 100 104.11
PS9 500 481 52270 50290 36000 41020 1.13 98 104.53
PS10 1000 973 104270 101460 63340 78920 1.24 97 106.92
Table 1. Synthesis of polystyrene via RAFT polymerization with 3-
benzylsulfanylthiocarbonylsufanylpropionic acid. Reaction at 110 ° C, in bulk,
argon atmosphere, for 48 h. a Mn(calcd) = theoretical molecular weight calculated by
monomer conversion. b calculated as sum of molecular weight of PS and molecular
weight of RAFT agent. c
% monomer conversion was determined by gravimetry. d
Mn, Mw and polydistribution analysis was done by GPC with comparison to PS
standards. e determined by DSC measurement.
f calculated from the analysis of the
ratio between the area of NMR peaks of the methyl of RAFT agent and phenyl of
the PS as shown in equation 7.
Conversion was determined gravimetrically and number of monomer units
(nPS) was calculated from the ratio between the signals of the 1H NMR peaks of
the aromatic group (PS) and methylene group (RAFT agent) as equation 7.
(7)
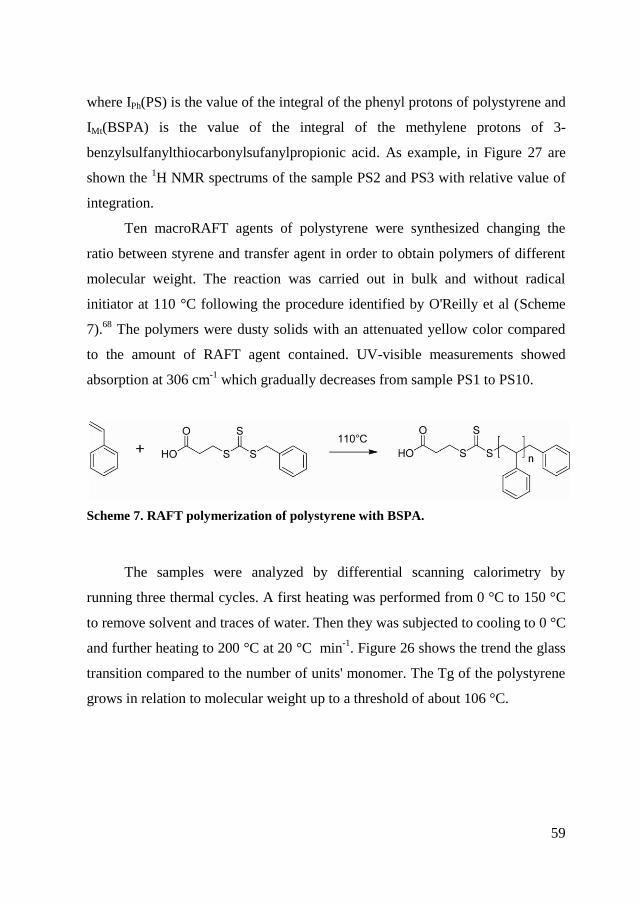
59
where IPh(PS) is the value of the integral of the phenyl protons of polystyrene and
IMt(BSPA) is the value of the integral of the methylene protons of 3-
benzylsulfanylthiocarbonylsufanylpropionic acid. As example, in Figure 27 are
shown the 1H NMR spectrums of the sample PS2 and PS3 with relative value of
integration.
Ten macroRAFT agents of polystyrene were synthesized changing the
ratio between styrene and transfer agent in order to obtain polymers of different
molecular weight. The reaction was carried out in bulk and without radical
initiator at 110 °C following the procedure identified by O'Reilly et al (Scheme
7).68
The polymers were dusty solids with an attenuated yellow color compared
to the amount of RAFT agent contained. UV-visible measurements showed
absorption at 306 cm-1
which gradually decreases from sample PS1 to PS10.
Scheme 7. RAFT polymerization of polystyrene with BSPA.
The samples were analyzed by differential scanning calorimetry by
running three thermal cycles. A first heating was performed from 0 °C to 150 °C
to remove solvent and traces of water. Then they was subjected to cooling to 0 °C
and further heating to 200 °C at 20 °C min-1
. Figure 26 shows the trend the glass
transition compared to the number of units' monomer. The Tg of the polystyrene
grows in relation to molecular weight up to a threshold of about 106 °C.
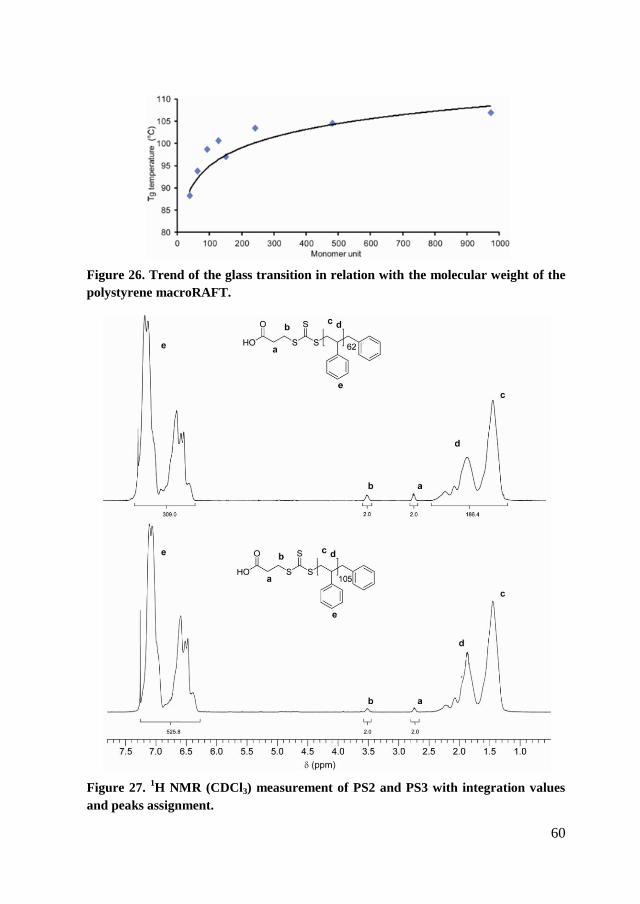
60
Figure 26. Trend of the glass transition in relation with the molecular weight of the
polystyrene macroRAFT.
Figure 27. 1H NMR (CDCl3) measurement of PS2 and PS3 with integration values
and peaks assignment.
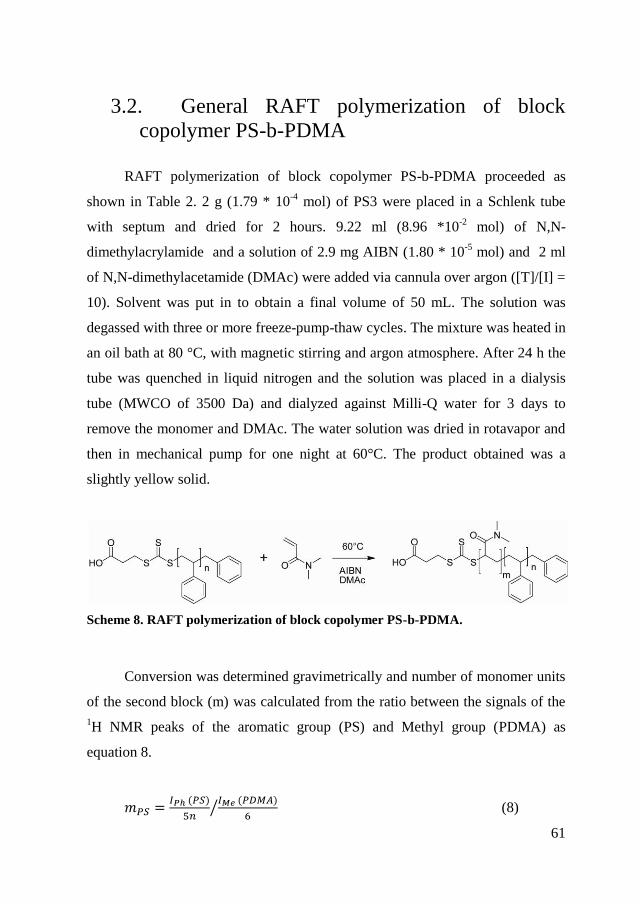
61
3.2. General RAFT polymerization of block
copolymer PS-b-PDMA
RAFT polymerization of block copolymer PS-b-PDMA proceeded as
shown in Table 2. 2 g (1.79 * 10-4
mol) of PS3 were placed in a Schlenk tube
with septum and dried for 2 hours. 9.22 ml (8.96 *10-2
mol) of N,N-
dimethylacrylamide and a solution of 2.9 mg AIBN (1.80 * 10-5
mol) and 2 ml
of N,N-dimethylacetamide (DMAc) were added via cannula over argon ([T]/[I] =
10). Solvent was put in to obtain a final volume of 50 mL. The solution was
degassed with three or more freeze-pump-thaw cycles. The mixture was heated in
an oil bath at 80 °C, with magnetic stirring and argon atmosphere. After 24 h the
tube was quenched in liquid nitrogen and the solution was placed in a dialysis
tube (MWCO of 3500 Da) and dialyzed against Milli-Q water for 3 days to
remove the monomer and DMAc. The water solution was dried in rotavapor and
then in mechanical pump for one night at 60°C. The product obtained was a
slightly yellow solid.
Scheme 8. RAFT polymerization of block copolymer PS-b-PDMA.
Conversion was determined gravimetrically and number of monomer units
of the second block (m) was calculated from the ratio between the signals of the
1H NMR peaks of the aromatic group (PS) and Methyl group (PDMA) as
equation 8.
(8)
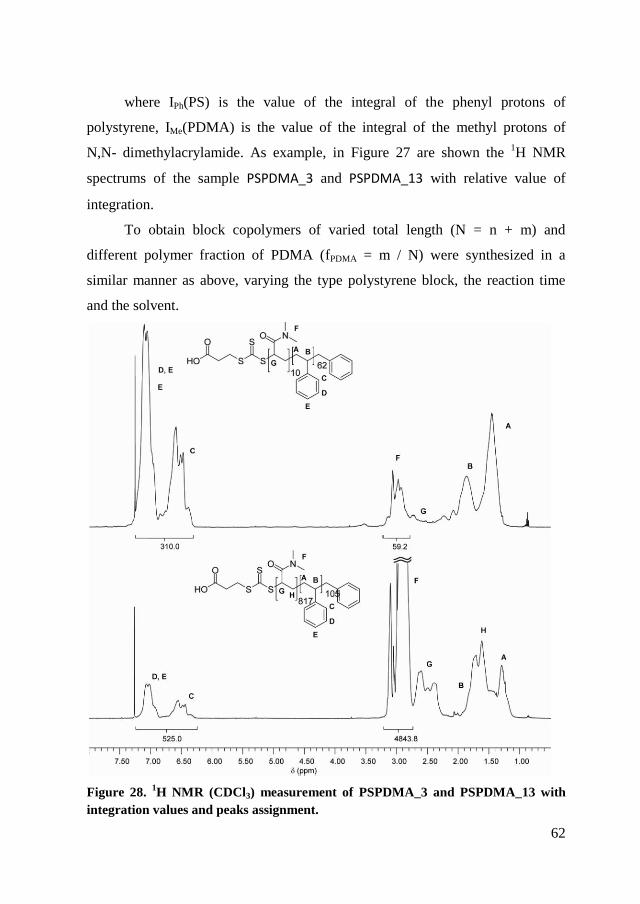
62
where IPh(PS) is the value of the integral of the phenyl protons of
polystyrene, IMe(PDMA) is the value of the integral of the methyl protons of
N,N- dimethylacrylamide. As example, in Figure 27 are shown the 1H NMR
spectrums of the sample PSPDMA_3 and PSPDMA_13 with relative value of
integration.
To obtain block copolymers of varied total length (N = n + m) and
different polymer fraction of PDMA (fPDMA = m / N) were synthesized in a
similar manner as above, varying the type polystyrene block, the reaction time
and the solvent.
Figure 28. 1H NMR (CDCl3) measurement of PSPDMA_3 and PSPDMA_13 with
integration values and peaks assignment.
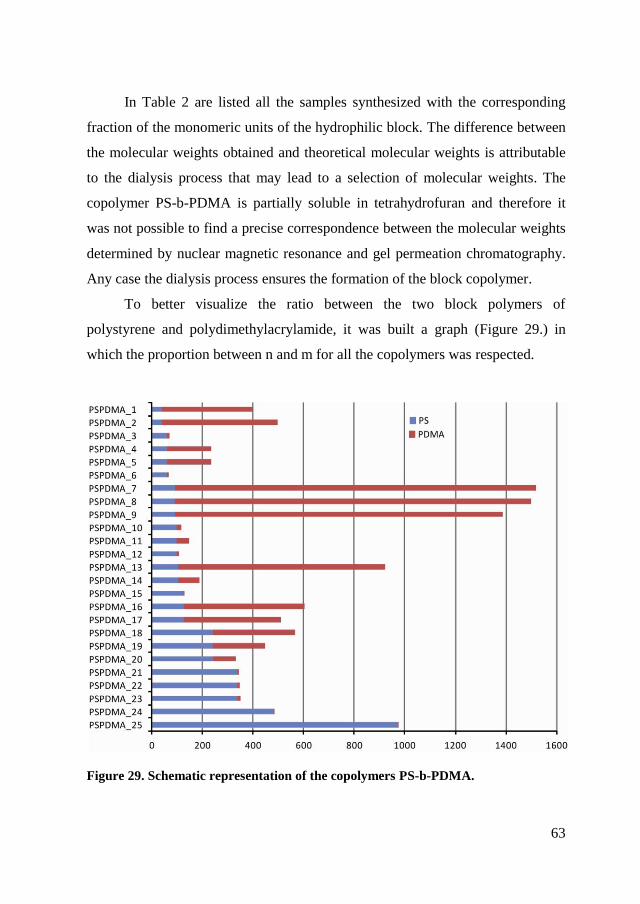
63
In Table 2 are listed all the samples synthesized with the corresponding
fraction of the monomeric units of the hydrophilic block. The difference between
the molecular weights obtained and theoretical molecular weights is attributable
to the dialysis process that may lead to a selection of molecular weights. The
copolymer PS-b-PDMA is partially soluble in tetrahydrofuran and therefore it
was not possible to find a precise correspondence between the molecular weights
determined by nuclear magnetic resonance and gel permeation chromatography.
Any case the dialysis process ensures the formation of the block copolymer.
To better visualize the ratio between the two block polymers of
polystyrene and polydimethylacrylamide, it was built a graph (Figure 29.) in
which the proportion between n and m for all the copolymers was respected.
Figure 29. Schematic representation of the copolymers PS-b-PDMA.
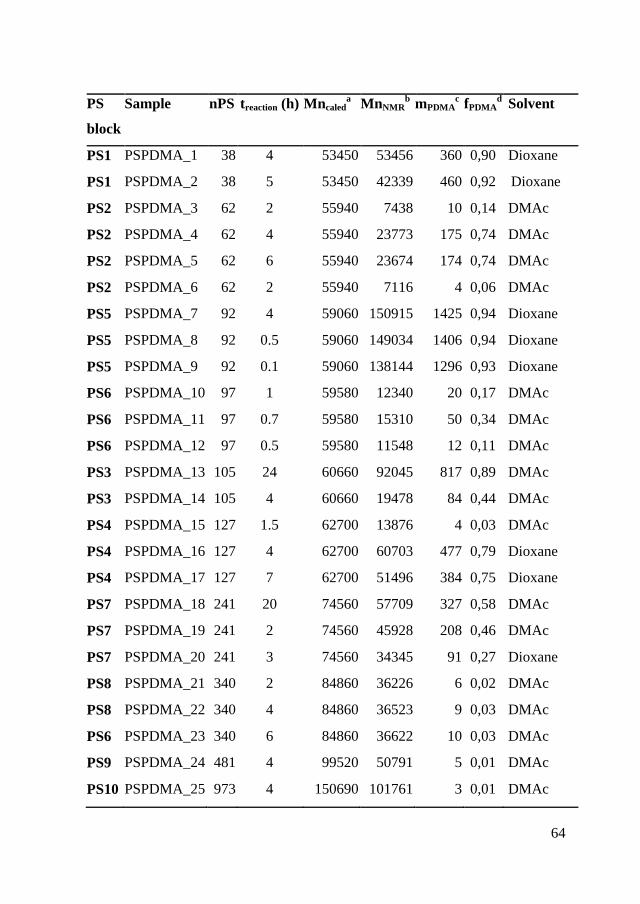
64
PS
block
Sample nPS treaction (h) Mncaleda MnNMR
b mPDMA
c fPDMA
d Solvent
PS1 PSPDMA_1 38 4 53450 53456 360 0,90 Dioxane
PS1 PSPDMA_2 38 5 53450 42339 460 0,92 Dioxane
PS2 PSPDMA_3 62 2 55940 7438 10 0,14 DMAc
PS2 PSPDMA_4 62 4 55940 23773 175 0,74 DMAc
PS2 PSPDMA_5 62 6 55940 23674 174 0,74 DMAc
PS2 PSPDMA_6 62 2 55940 7116 4 0,06 DMAc
PS5 PSPDMA_7 92 4 59060 150915 1425 0,94 Dioxane
PS5 PSPDMA_8 92 0.5 59060 149034 1406 0,94 Dioxane
PS5 PSPDMA_9 92 0.1 59060 138144 1296 0,93 Dioxane
PS6 PSPDMA_10 97 1 59580 12340 20 0,17 DMAc
PS6 PSPDMA_11 97 0.7 59580 15310 50 0,34 DMAc
PS6 PSPDMA_12 97 0.5 59580 11548 12 0,11 DMAc
PS3 PSPDMA_13 105 24 60660 92045 817 0,89 DMAc
PS3 PSPDMA_14 105 4 60660 19478 84 0,44 DMAc
PS4 PSPDMA_15 127 1.5 62700 13876 4 0,03 DMAc
PS4 PSPDMA_16 127 4 62700 60703 477 0,79 Dioxane
PS4 PSPDMA_17 127 7 62700 51496 384 0,75 Dioxane
PS7 PSPDMA_18 241 20 74560 57709 327 0,58 DMAc
PS7 PSPDMA_19 241 2 74560 45928 208 0,46 DMAc
PS7 PSPDMA_20 241 3 74560 34345 91 0,27 Dioxane
PS8 PSPDMA_21 340 2 84860 36226 6 0,02 DMAc
PS8 PSPDMA_22 340 4 84860 36523 9 0,03 DMAc
PS6 PSPDMA_23 340 6 84860 36622 10 0,03 DMAc
PS9 PSPDMA_24 481 4 99520 50791 5 0,01 DMAc
PS10 PSPDMA_25 973 4 150690 101761 3 0,01 DMAc
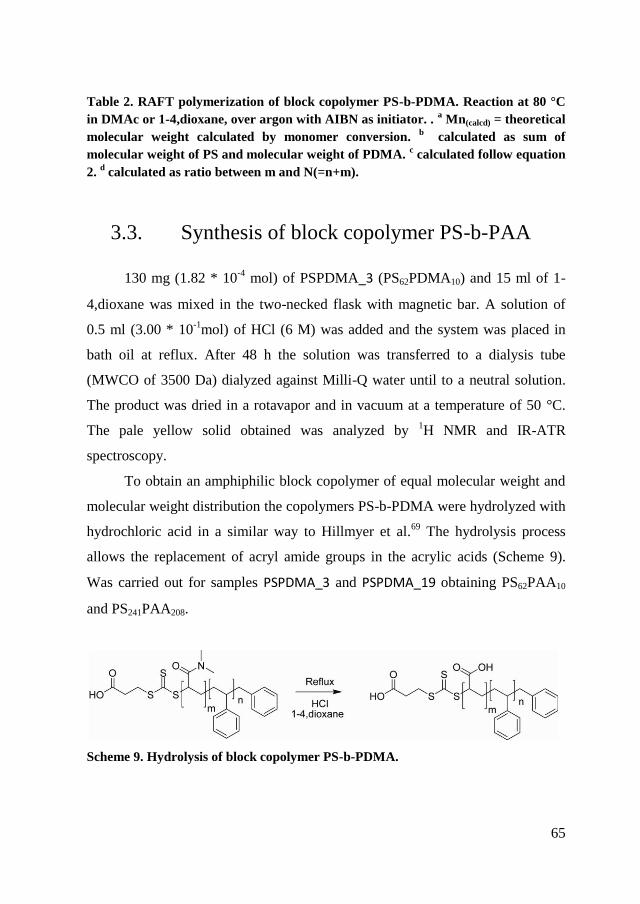
65
Table 2. RAFT polymerization of block copolymer PS-b-PDMA. Reaction at 80 °C
in DMAc or 1-4,dioxane, over argon with AIBN as initiator. . a Mn(calcd) = theoretical
molecular weight calculated by monomer conversion. b
calculated as sum of
molecular weight of PS and molecular weight of PDMA. c calculated follow equation
2. d calculated as ratio between m and N(=n+m).
3.3. Synthesis of block copolymer PS-b-PAA
130 mg (1.82 * 10
-4 mol) of PSPDMA_3 (PS62PDMA10) and 15 ml of 1-
4,dioxane was mixed in the two-necked flask with magnetic bar. A solution of
0.5 ml (3.00 * 10-1
mol) of HCl (6 M) was added and the system was placed in
bath oil at reflux. After 48 h the solution was transferred to a dialysis tube
(MWCO of 3500 Da) dialyzed against Milli-Q water until to a neutral solution.
The product was dried in a rotavapor and in vacuum at a temperature of 50 °C.
The pale yellow solid obtained was analyzed by 1H NMR and IR-ATR
spectroscopy.
To obtain an amphiphilic block copolymer of equal molecular weight and
molecular weight distribution the copolymers PS-b-PDMA were hydrolyzed with
hydrochloric acid in a similar way to Hillmyer et al.69
The hydrolysis process
allows the replacement of acryl amide groups in the acrylic acids (Scheme 9).
Was carried out for samples PSPDMA_3 and PSPDMA_19 obtaining PS62PAA10
and PS241PAA208.
Scheme 9. Hydrolysis of block copolymer PS-b-PDMA.
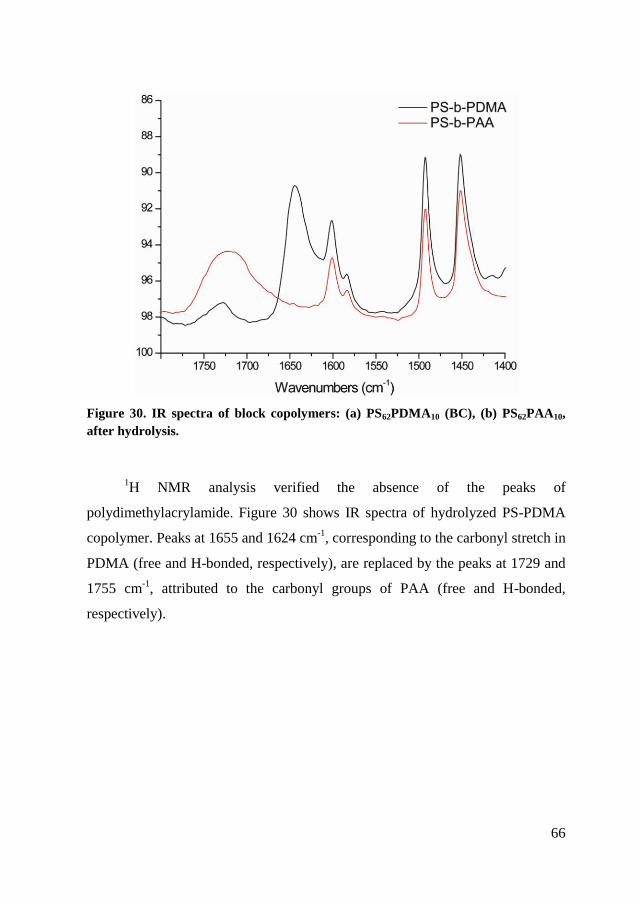
66
Figure 30. IR spectra of block copolymers: (a) PS62PDMA10 (BC), (b) PS62PAA10,
after hydrolysis.
1H NMR analysis verified the absence of the peaks of
polydimethylacrylamide. Figure 30 shows IR spectra of hydrolyzed PS-PDMA
copolymer. Peaks at 1655 and 1624 cm-1
, corresponding to the carbonyl stretch in
PDMA (free and H-bonded, respectively), are replaced by the peaks at 1729 and
1755 cm-1
, attributed to the carbonyl groups of PAA (free and H-bonded,
respectively).
67
Chapter 4. Self-assembly of the
block copolymers
In this chapter I will present the study of the self assembly in selective
solvent of amphiphilic PS-PDMA block copolymers synthesised as described in
Chapter 3. Full characterization of nanomaterials can be achieved only with the
comparison of several different techniques, especially in the case of
nanoparticles. Thus, I compared nuclear magnetic resonance spectroscopy,
dynamic light scattering and electron microscopy on the same systems.
Furthermore, fluorescence spectroscopy was used as new method to characterize
the self assembly. For this technique the mechanism and the class of molecular
rotors used will be explained in detail.
In particular, I have studied the samples PS105PDMA816 (PSPDMA_13)
and PS62PDMA10 (PSPDMA_3).
4.1. Introduction
Block copolymers dispersed in a selective solvent can self assemble in a
large variety of aggregated structures. Depending on the balance between
solvophilic and solvophobic components, polymer chains arrange as spherical
micelles, wormlike micelles, polymersomes (see Figure 31). In water, the
hydrophobic block forms either the core in micelles or the walls in bilayer
structures, while the hydrophilic block forms the corona.
The morphological complexity of copolymer aggregates is due to the non-
ergodicity of the self assembly: the organization of block copolymer chains is
highly dependent on the kinetic pathway.70
Once the aggregate is formed a large
energy gap prevents the transfer of a single molecule form the micelle to the
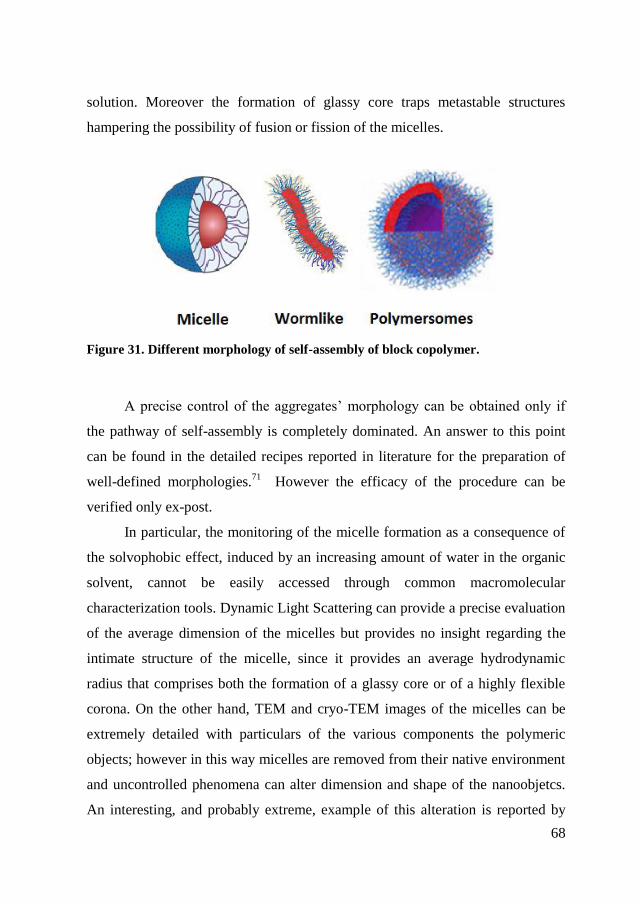
68
solution. Moreover the formation of glassy core traps metastable structures
hampering the possibility of fusion or fission of the micelles.
Figure 31. Different morphology of self-assembly of block copolymer.
A precise control of the aggregates’ morphology can be obtained only if
the pathway of self-assembly is completely dominated. An answer to this point
can be found in the detailed recipes reported in literature for the preparation of
well-defined morphologies.71
However the efficacy of the procedure can be
verified only ex-post.
In particular, the monitoring of the micelle formation as a consequence of
the solvophobic effect, induced by an increasing amount of water in the organic
solvent, cannot be easily accessed through common macromolecular
characterization tools. Dynamic Light Scattering can provide a precise evaluation
of the average dimension of the micelles but provides no insight regarding the
intimate structure of the micelle, since it provides an average hydrodynamic
radius that comprises both the formation of a glassy core or of a highly flexible
corona. On the other hand, TEM and cryo-TEM images of the micelles can be
extremely detailed with particulars of the various components the polymeric
objects; however in this way micelles are removed from their native environment
and uncontrolled phenomena can alter dimension and shape of the nanoobjetcs.
An interesting, and probably extreme, example of this alteration is reported by
69
Eisenberg et al. describing the formation of “kippah” vesicles.72
Even in absence
of alteration, the immobilization of the micelles onto a flat surfaces drastically
hampers their dynamics. On the other hand, considering one of the main
envisaged applications of block copolymer micelles, drug delivery, dynamical
properties of the polymer chain directly determine the uptake/release and
diffusion of active molecules in the micelle.73
In the case of core-shell micelles, if
the core-forming block has glass transition temperature (Tg) far above room
temperature, the drug is trapped by frozen polymer chains and cannot be released
to the target. However confinement effects can alter significantly the Tg at the
nanoscale and no simple comparison can be made with the bulk Tg. For this
reason several attempts have made for determining the glass transition
temperature of polymeric micelles but no technique of choice has been
univocally defined.
In fact, calorimetric techniques have been successfully applied mainly in
case of micelles prepared in low volatile solvents74
or ionic liquids.75
When the
selective solvent is water, unless Tg is close to ambient temperature, DSC
measurements become problematic due to evaporation, which would lead to
extensive denaturation of the core shell structures.
1H Nuclear Magnetic Resonance spectroscopy is quite sensitive to
molecular motions especially in terms of resonances line-widths, and it allows to
determine the glass transition temperature when the peaks corresponding to the
core-forming polymer, as function of decreasing temperature, become so large to
disappear into the baseline. 76
As a consequence if in a 1H NMR spectrum all the
signals of a block are missing we can reasonably assume that at the measuring
temperature that block is below Tg.77,78,79
Finally, Fluorescence Spectroscopy is particularly suited to study polymer
aggregation in micelles, since it can exploit several fluorescent probes whose
fluorescence emission is sensitive to changes of properties, such as polarity,
fluidity, order, molecular mobility. For this purpose, the most used probe is
70
pyrene. Pyrene modifies its spectroscopic properties going from water to the
micelles interior as a consequence of the different monomer/excimer ratio.80,81,82
Dynamics inside the nanostructures can be studied by analyzing the time
resolved fluorescence decay of pyrene. The fluorescence decay is function of the
kinetics of pyrene excimer formation, hence when the mobility of pyrene
decreases due to an increase of medium viscosity, less excimers are formed and
the fluorenscence lifetime increases. The same mechanism holds for naphthalene
or phenantrene labeled micelles.83,84,85,86
More recently Mok and Lodge described
a method to determine the Tg in block copolymer micelles based on pyrene
fluorescence: the technique consists in monitoring the intensity ratio between the
first and third spectral peaks (I3/I1) of pyrene emission spectrum as function of
temperature.
4.1.1. Molecular rotors
Molecular rotors are fluorescent probes widely used in biology and in
polymer science to study dynamical processes (polymerization kinetics, thermal
transitions, photodegradation, swelling) in bulk87
and thin films,88
nevertheless
very few studies of molecular rotor fluorescence in block copolymer micelles are
reported in literature89
.
Molecular rotors have the characteristic of changing their emissive
properties as a function of the medium viscosity in which they are dispersed. In
particular, the luminescence lifetime and quantum yield (QY) of a molecular
rotor increase on increasing of system viscosity. This feature is a consequence of
the fact that, generally, the molecular rotors possess at least two distinct rigid
conjugated sections, connected by a single bond, able to rotate relative to one
another. Hence, an increase of local viscosity around the molecular rotor induces
a decrease of the intramolecular rotations (decrease of the nonradiative process)
thus resulting an increase of the luminescence lifetime and QY. Probably the
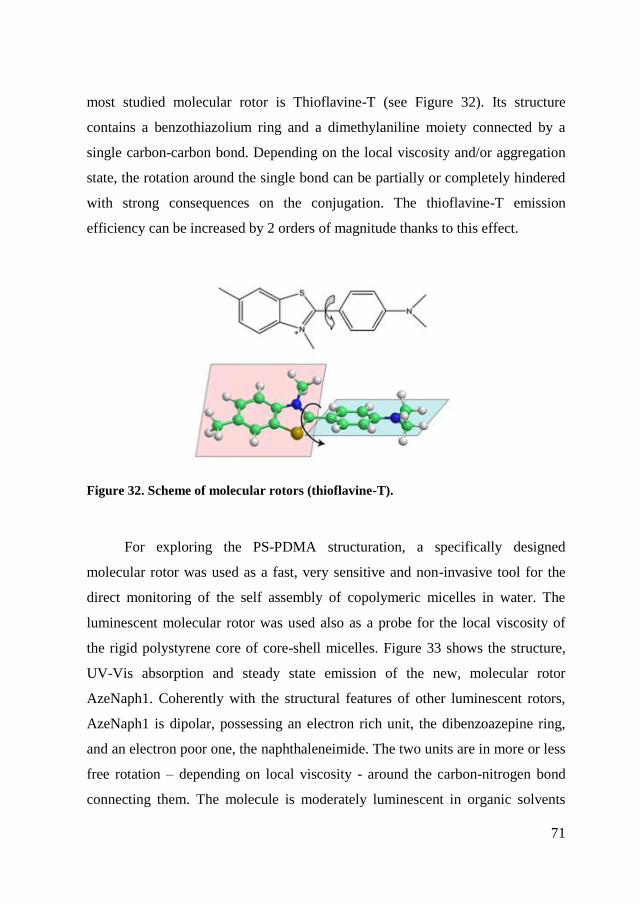
71
most studied molecular rotor is Thioflavine-T (see Figure 32). Its structure
contains a benzothiazolium ring and a dimethylaniline moiety connected by a
single carbon-carbon bond. Depending on the local viscosity and/or aggregation
state, the rotation around the single bond can be partially or completely hindered
with strong consequences on the conjugation. The thioflavine-T emission
efficiency can be increased by 2 orders of magnitude thanks to this effect.
Figure 32. Scheme of molecular rotors (thioflavine-T).
For exploring the PS-PDMA structuration, a specifically designed
molecular rotor was used as a fast, very sensitive and non-invasive tool for the
direct monitoring of the self assembly of copolymeric micelles in water. The
luminescent molecular rotor was used also as a probe for the local viscosity of
the rigid polystyrene core of core-shell micelles. Figure 33 shows the structure,
UV-Vis absorption and steady state emission of the new, molecular rotor
AzeNaph1. Coherently with the structural features of other luminescent rotors,
AzeNaph1 is dipolar, possessing an electron rich unit, the dibenzoazepine ring,
and an electron poor one, the naphthaleneimide. The two units are in more or less
free rotation – depending on local viscosity - around the carbon-nitrogen bond
connecting them. The molecule is moderately luminescent in organic solvents
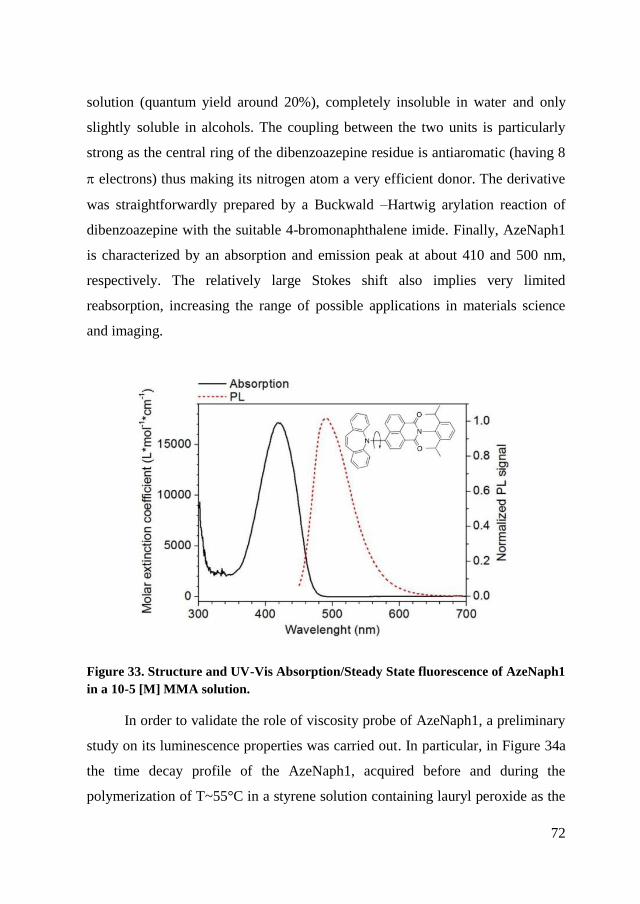
72
solution (quantum yield around 20%), completely insoluble in water and only
slightly soluble in alcohols. The coupling between the two units is particularly
strong as the central ring of the dibenzoazepine residue is antiaromatic (having 8
electrons) thus making its nitrogen atom a very efficient donor. The derivative
was straightforwardly prepared by a Buckwald –Hartwig arylation reaction of
dibenzoazepine with the suitable 4-bromonaphthalene imide. Finally, AzeNaph1
is characterized by an absorption and emission peak at about 410 and 500 nm,
respectively. The relatively large Stokes shift also implies very limited
reabsorption, increasing the range of possible applications in materials science
and imaging.
Figure 33. Structure and UV-Vis Absorption/Steady State fluorescence of AzeNaph1
in a 10-5 [M] MMA solution.
In order to validate the role of viscosity probe of AzeNaph1, a preliminary
study on its luminescence properties was carried out. In particular, in Figure 34a
the time decay profile of the AzeNaph1, acquired before and during the
polymerization of T~55°C in a styrene solution containing lauryl peroxide as the
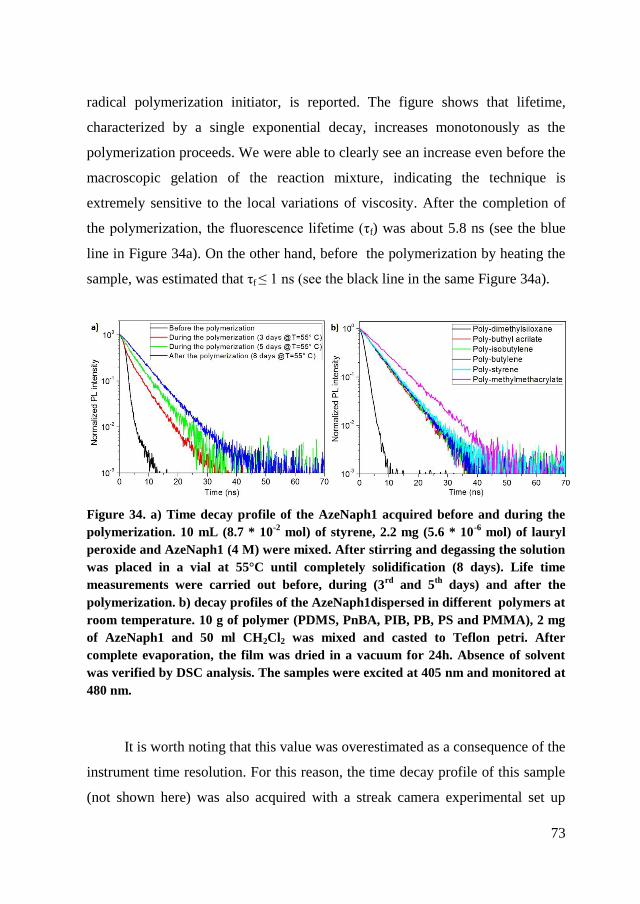
73
radical polymerization initiator, is reported. The figure shows that lifetime,
characterized by a single exponential decay, increases monotonously as the
polymerization proceeds. We were able to clearly see an increase even before the
macroscopic gelation of the reaction mixture, indicating the technique is
extremely sensitive to the local variations of viscosity. After the completion of
the polymerization, the fluorescence lifetime (τf) was about 5.8 ns (see the blue
line in Figure 34a). On the other hand, before the polymerization by heating the
sample, was estimated that τf ≤ 1 ns (see the black line in the same Figure 34a).
Figure 34. a) Time decay profile of the AzeNaph1 acquired before and during the
polymerization. 10 mL (8.7 * 10-2
mol) of styrene, 2.2 mg (5.6 * 10-6
mol) of lauryl
peroxide and AzeNaph1 (4 M) were mixed. After stirring and degassing the solution
was placed in a vial at 55°C until completely solidification (8 days). Life time
measurements were carried out before, during (3rd
and 5th
days) and after the
polymerization. b) decay profiles of the AzeNaph1dispersed in different polymers at
room temperature. 10 g of polymer (PDMS, PnBA, PIB, PB, PS and PMMA), 2 mg
of AzeNaph1 and 50 ml CH2Cl2 was mixed and casted to Teflon petri. After
complete evaporation, the film was dried in a vacuum for 24h. Absence of solvent
was verified by DSC analysis. The samples were excited at 405 nm and monitored at
480 nm.
It is worth noting that this value was overestimated as a consequence of the
instrument time resolution. For this reason, the time decay profile of this sample
(not shown here) was also acquired with a streak camera experimental set up
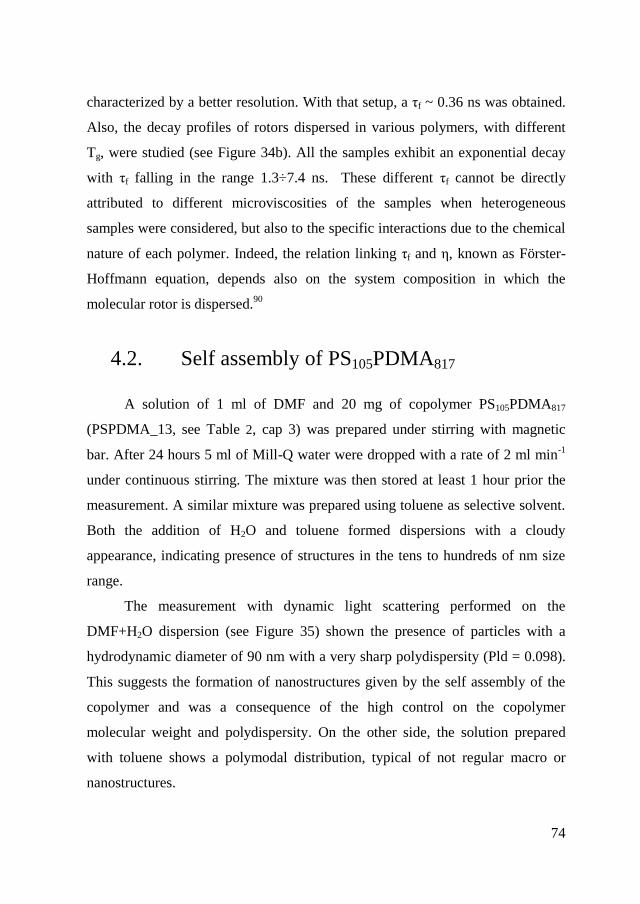
74
characterized by a better resolution. With that setup, a τf ~ 0.36 ns was obtained.
Also, the decay profiles of rotors dispersed in various polymers, with different
Tg, were studied (see Figure 34b). All the samples exhibit an exponential decay
with τf falling in the range 1.3÷7.4 ns. These different τf cannot be directly
attributed to different microviscosities of the samples when heterogeneous
samples were considered, but also to the specific interactions due to the chemical
nature of each polymer. Indeed, the relation linking τf and η, known as Förster-
Hoffmann equation, depends also on the system composition in which the
molecular rotor is dispersed.90
4.2. Self assembly of PS105PDMA817
A solution of 1 ml of DMF and 20 mg of copolymer PS105PDMA817
(PSPDMA_13, see Table 2, cap 3) was prepared under stirring with magnetic
bar. After 24 hours 5 ml of Mill-Q water were dropped with a rate of 2 ml min-1
under continuous stirring. The mixture was then stored at least 1 hour prior the
measurement. A similar mixture was prepared using toluene as selective solvent.
Both the addition of H2O and toluene formed dispersions with a cloudy
appearance, indicating presence of structures in the tens to hundreds of nm size
range.
The measurement with dynamic light scattering performed on the
DMF+H2O dispersion (see Figure 35) shown the presence of particles with a
hydrodynamic diameter of 90 nm with a very sharp polydispersity (Pld = 0.098).
This suggests the formation of nanostructures given by the self assembly of the
copolymer and was a consequence of the high control on the copolymer
molecular weight and polydispersity. On the other side, the solution prepared
with toluene shows a polymodal distribution, typical of not regular macro or
nanostructures.
75
Figure 35. DLS measurement of water (lift) and toluene (right) solution of
PS105PDMA817.
4.2.1. NMR and TEM measurements in different
selective solvent.
To investigate thoroughly the self assembly of this amphiphilic copolymer,
measurements of transmission electron microscopy and nuclear magnetic
resonance were carried out on the two solutions of water and toluene and on a
solution of chloroform. This last sample appears as a clear solution indicating full
solvatation of both blocks. For TEM measurement a drop of the polymer solution
was placed on a perforated carbon grid and solvent was evaporated under a hood
at room temperature. For NMR measurements, the appropriate samples were
prepared using deuterated solvent.
1H NMR spectra is shown in Figure 36. Each block has specific signals,
namely from 6.5 to 7 ppm for PS while PDMA is around 2.8 ppm. In fact
solution NMR is optimized for fast moving molecules, and reduced mobility
produces a dipolar line broadening due to H-H interactions. At the limit of slow
mobility, solid-like fractions are not detected because of extremely low T2
relaxation time91
. The presence or absence of peaks in the spectra can thus be
interpreted as a function of mobility.
The electron microscope was able to identify some structures compatible
with the typical phases of a block copolymer.
In the solution prepared from organic solvent (d-toluene) the styrenic
block is solvated and provides full signal intensity while the PDMA presents a
76
line broadening of the methyls of dimethylacrilamide corresponding to reduced
but not solid like mobility. TEM measurements detected elongated
macromolecular structures. The copolymer is organized in wormlike constructing
assembled "tripod", which extends for several microns. The PDMA phase is
partially wetted by the solvent, which acts as a plastifier.
The peaks of the styrenic block disappear in water, meaning the
hydrophobic block is behaving as a rigid solid. This indicates the styrenic blocks
are clustering together, excluding solvent and resulting in a very low mobility, as
expected for bulk styrene under the Tg. On the other side, a quite regular
distribution can be visualized in the TEM image shown in Figure 36, that
displays black spots, somewhat regularly arranged in a pseudohexagonal fashion
with a center to center distance of 60-70 nm. This is attributed to polystyrene
cores whilst the PDMA shells are no longer well organized as a consequence of
the water evaporation. It should be noted that no contrast reagents were
employed for the acquisition of the image, as such the contrast is connected with
the higher density of the closely packed polystyrene cores with respect to the
swelled and disorganized PDMA shells.
A core diameter of 15-20 nm and a diameter of whole micelle of about 60-
70 nm were estimated by TEM image reported in Figure 36. The different
diameter obtained by TEM and DLS techniques is not surprising. Indeed,
considering the swelled form of the external PDMA shell of micelles, it is simple
to image that the size measured by TEM image is underestimated as a
consequence of the water evaporation: the deposited micelles can partially
superimpose the external shells. On the other hand, DLS technique probes a
hydrodynamic diameter which can be quantitatively different from the actual
size.
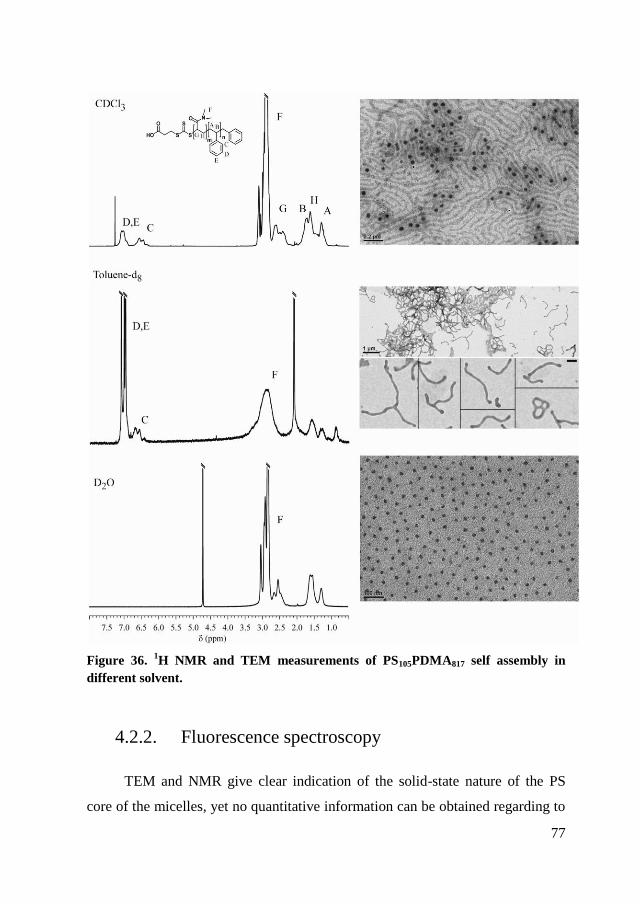
77
Figure 36. 1H NMR and TEM measurements of PS105PDMA817 self assembly in
different solvent.
4.2.2. Fluorescence spectroscopy
TEM and NMR give clear indication of the solid-state nature of the PS
core of the micelles, yet no quantitative information can be obtained regarding to
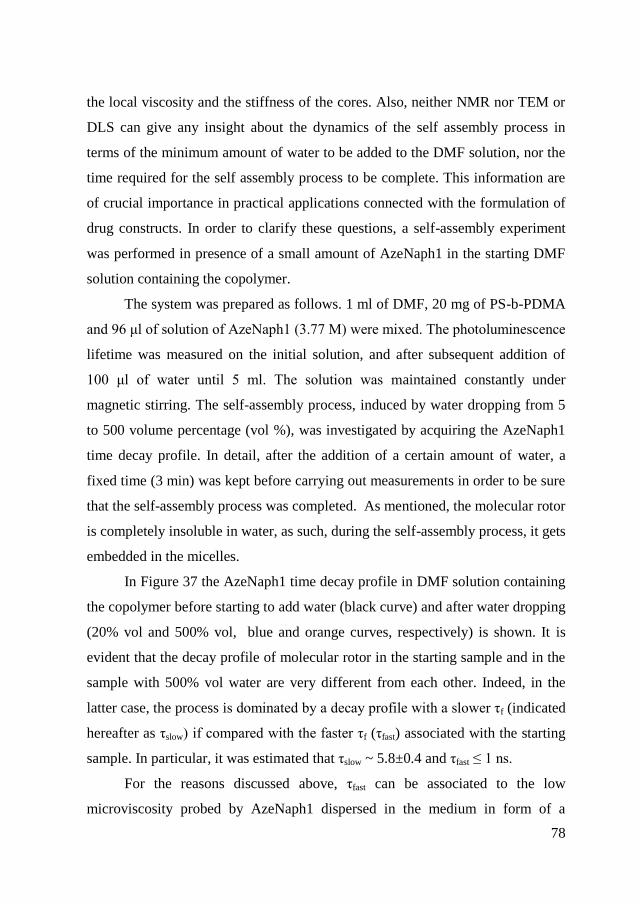
78
the local viscosity and the stiffness of the cores. Also, neither NMR nor TEM or
DLS can give any insight about the dynamics of the self assembly process in
terms of the minimum amount of water to be added to the DMF solution, nor the
time required for the self assembly process to be complete. This information are
of crucial importance in practical applications connected with the formulation of
drug constructs. In order to clarify these questions, a self-assembly experiment
was performed in presence of a small amount of AzeNaph1 in the starting DMF
solution containing the copolymer.
The system was prepared as follows. 1 ml of DMF, 20 mg of PS-b-PDMA
and 96 μl of solution of AzeNaph1 (3.77 M) were mixed. The photoluminescence
lifetime was measured on the initial solution, and after subsequent addition of
100 μl of water until 5 ml. The solution was maintained constantly under
magnetic stirring. The self-assembly process, induced by water dropping from 5
to 500 volume percentage (vol %), was investigated by acquiring the AzeNaph1
time decay profile. In detail, after the addition of a certain amount of water, a
fixed time (3 min) was kept before carrying out measurements in order to be sure
that the self-assembly process was completed. As mentioned, the molecular rotor
is completely insoluble in water, as such, during the self-assembly process, it gets
embedded in the micelles.
In Figure 37 the AzeNaph1 time decay profile in DMF solution containing
the copolymer before starting to add water (black curve) and after water dropping
(20% vol and 500% vol, blue and orange curves, respectively) is shown. It is
evident that the decay profile of molecular rotor in the starting sample and in the
sample with 500% vol water are very different from each other. Indeed, in the
latter case, the process is dominated by a decay profile with a slower τf (indicated
hereafter as τslow) if compared with the faster τf (τfast) associated with the starting
sample. In particular, it was estimated that τslow ~ 5.8±0.4 and τfast ≤ 1 ns.
For the reasons discussed above, τfast can be associated to the low
microviscosity probed by AzeNaph1 dispersed in the medium in form of a
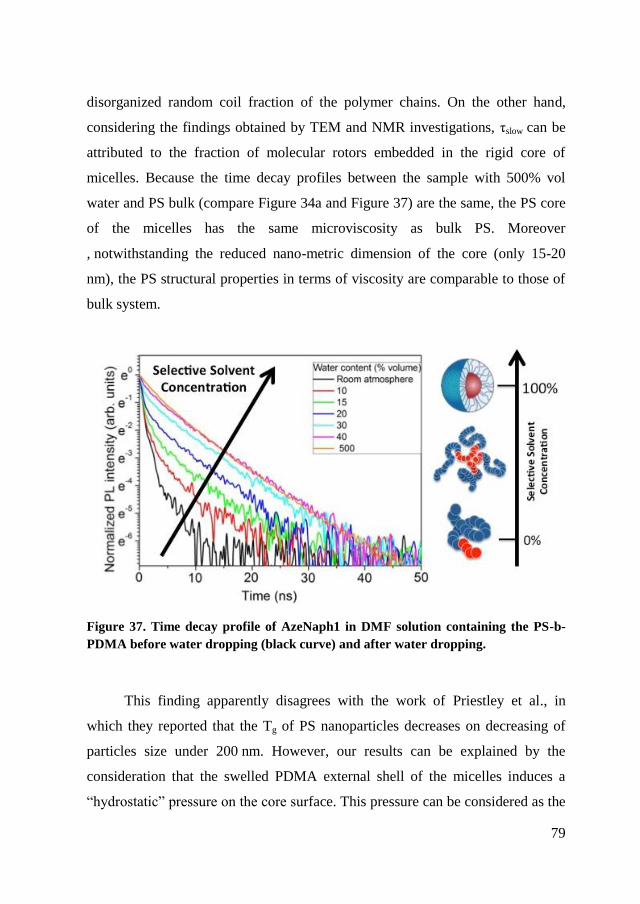
79
disorganized random coil fraction of the polymer chains. On the other hand,
considering the findings obtained by TEM and NMR investigations, τslow can be
attributed to the fraction of molecular rotors embedded in the rigid core of
micelles. Because the time decay profiles between the sample with 500% vol
water and PS bulk (compare Figure 34a and Figure 37) are the same, the PS core
of the micelles has the same microviscosity as bulk PS. Moreover
, notwithstanding the reduced nano-metric dimension of the core (only 15-20
nm), the PS structural properties in terms of viscosity are comparable to those of
bulk system.
Figure 37. Time decay profile of AzeNaph1 in DMF solution containing the PS-b-
PDMA before water dropping (black curve) and after water dropping.
This finding apparently disagrees with the work of Priestley et al., in
which they reported that the Tg of PS nanoparticles decreases on decreasing of
particles size under 200 nm. However, our results can be explained by the
consideration that the swelled PDMA external shell of the micelles induces a
“hydrostatic” pressure on the core surface. This pressure can be considered as the
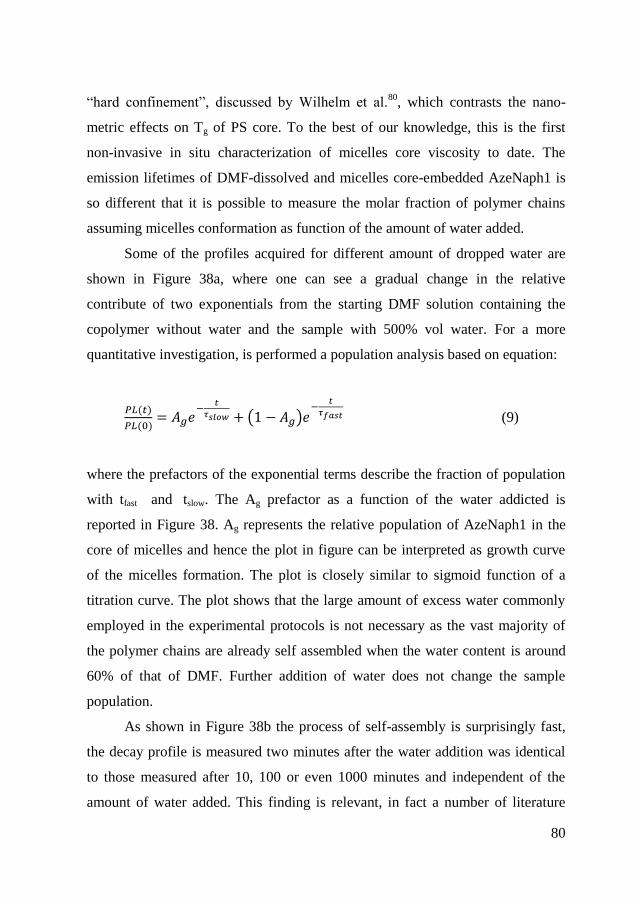
80
“hard confinement”, discussed by Wilhelm et al.80
, which contrasts the nano-
metric effects on Tg of PS core. To the best of our knowledge, this is the first
non-invasive in situ characterization of micelles core viscosity to date. The
emission lifetimes of DMF-dissolved and micelles core-embedded AzeNaph1 is
so different that it is possible to measure the molar fraction of polymer chains
assuming micelles conformation as function of the amount of water added.
Some of the profiles acquired for different amount of dropped water are
shown in Figure 38a, where one can see a gradual change in the relative
contribute of two exponentials from the starting DMF solution containing the
copolymer without water and the sample with 500% vol water. For a more
quantitative investigation, is performed a population analysis based on equation:
(9)
where the prefactors of the exponential terms describe the fraction of population
with tfast and tslow. The Ag prefactor as a function of the water addicted is
reported in Figure 38. Ag represents the relative population of AzeNaph1 in the
core of micelles and hence the plot in figure can be interpreted as growth curve
of the micelles formation. The plot is closely similar to sigmoid function of a
titration curve. The plot shows that the large amount of excess water commonly
employed in the experimental protocols is not necessary as the vast majority of
the polymer chains are already self assembled when the water content is around
60% of that of DMF. Further addition of water does not change the sample
population.
As shown in Figure 38b the process of self-assembly is surprisingly fast,
the decay profile is measured two minutes after the water addition was identical
to those measured after 10, 100 or even 1000 minutes and independent of the
amount of water added. This finding is relevant, in fact a number of literature
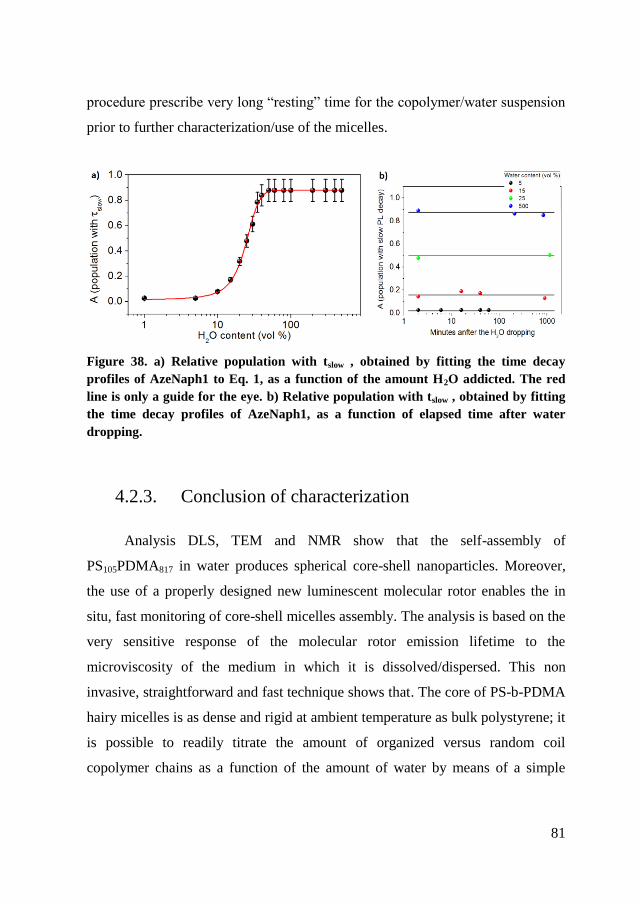
81
procedure prescribe very long “resting” time for the copolymer/water suspension
prior to further characterization/use of the micelles.
Figure 38. a) Relative population with tslow , obtained by fitting the time decay
profiles of AzeNaph1 to Eq. 1, as a function of the amount H2O addicted. The red
line is only a guide for the eye. b) Relative population with tslow , obtained by fitting
the time decay profiles of AzeNaph1, as a function of elapsed time after water
dropping.
4.2.3. Conclusion of characterization
Analysis DLS, TEM and NMR show that the self-assembly of
PS105PDMA817 in water produces spherical core-shell nanoparticles. Moreover,
the use of a properly designed new luminescent molecular rotor enables the in
situ, fast monitoring of core-shell micelles assembly. The analysis is based on the
very sensitive response of the molecular rotor emission lifetime to the
microviscosity of the medium in which it is dissolved/dispersed. This non
invasive, straightforward and fast technique shows that. The core of PS-b-PDMA
hairy micelles is as dense and rigid at ambient temperature as bulk polystyrene; it
is possible to readily titrate the amount of organized versus random coil
copolymer chains as a function of the amount of water by means of a simple
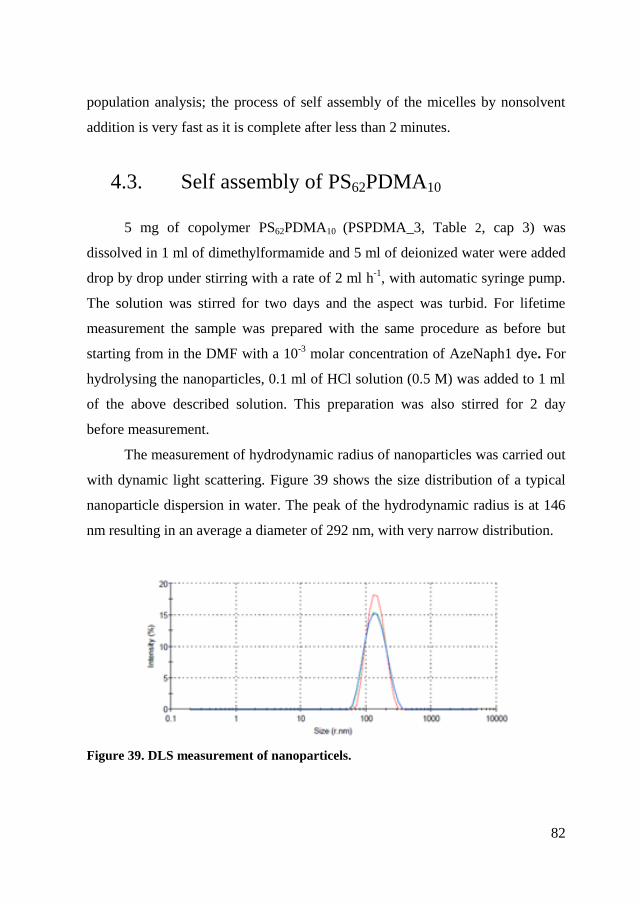
82
population analysis; the process of self assembly of the micelles by nonsolvent
addition is very fast as it is complete after less than 2 minutes.
4.3. Self assembly of PS62PDMA10
5 mg of copolymer PS62PDMA10 (PSPDMA_3, Table 2, cap 3) was
dissolved in 1 ml of dimethylformamide and 5 ml of deionized water were added
drop by drop under stirring with a rate of 2 ml h-1
, with automatic syringe pump.
The solution was stirred for two days and the aspect was turbid. For lifetime
measurement the sample was prepared with the same procedure as before but
starting from in the DMF with a 10-3
molar concentration of AzeNaph1 dye. For
hydrolysing the nanoparticles, 0.1 ml of HCl solution (0.5 M) was added to 1 ml
of the above described solution. This preparation was also stirred for 2 day
before measurement.
The measurement of hydrodynamic radius of nanoparticles was carried out
with dynamic light scattering. Figure 39 shows the size distribution of a typical
nanoparticle dispersion in water. The peak of the hydrodynamic radius is at 146
nm resulting in an average a diameter of 292 nm, with very narrow distribution.
Figure 39. DLS measurement of nanoparticels.
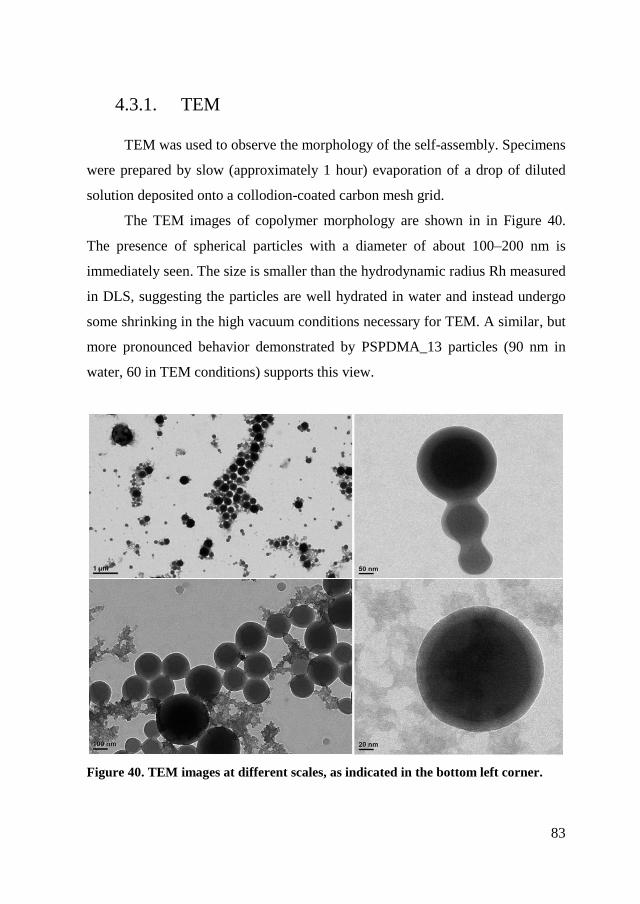
83
4.3.1. TEM
TEM was used to observe the morphology of the self-assembly. Specimens
were prepared by slow (approximately 1 hour) evaporation of a drop of diluted
solution deposited onto a collodion-coated carbon mesh grid.
The TEM images of copolymer morphology are shown in in Figure 40.
The presence of spherical particles with a diameter of about 100–200 nm is
immediately seen. The size is smaller than the hydrodynamic radius Rh measured
in DLS, suggesting the particles are well hydrated in water and instead undergo
some shrinking in the high vacuum conditions necessary for TEM. A similar, but
more pronounced behavior demonstrated by PSPDMA_13 particles (90 nm in
water, 60 in TEM conditions) supports this view.
Figure 40. TEM images at different scales, as indicated in the bottom left corner.
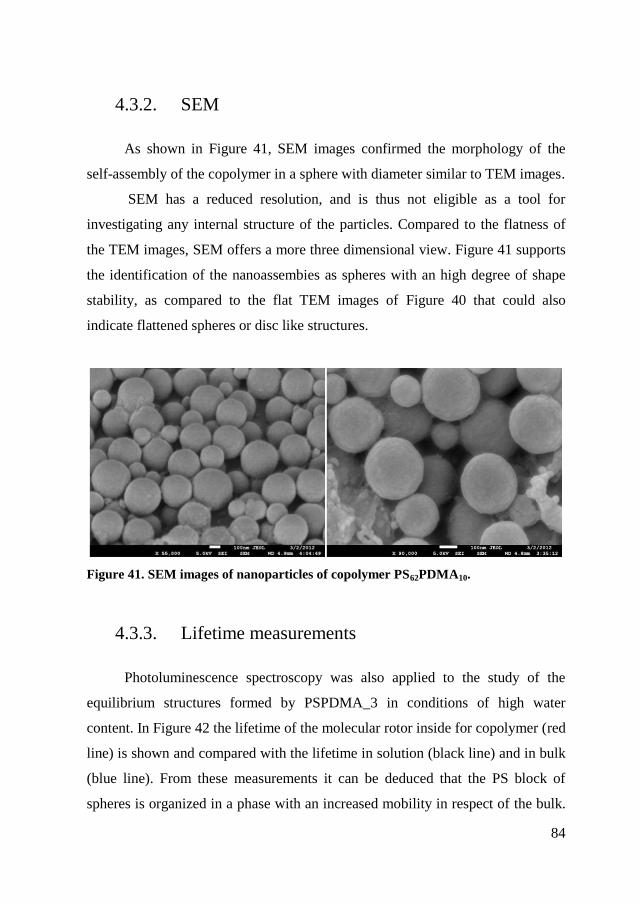
84
4.3.2. SEM
As shown in Figure 41, SEM images confirmed the morphology of the
self-assembly of the copolymer in a sphere with diameter similar to TEM images.
SEM has a reduced resolution, and is thus not eligible as a tool for
investigating any internal structure of the particles. Compared to the flatness of
the TEM images, SEM offers a more three dimensional view. Figure 41 supports
the identification of the nanoassembies as spheres with an high degree of shape
stability, as compared to the flat TEM images of Figure 40 that could also
indicate flattened spheres or disc like structures.
Figure 41. SEM images of nanoparticles of copolymer PS62PDMA10.
4.3.3. Lifetime measurements
Photoluminescence spectroscopy was also applied to the study of the
equilibrium structures formed by PSPDMA_3 in conditions of high water
content. In Figure 42 the lifetime of the molecular rotor inside for copolymer (red
line) is shown and compared with the lifetime in solution (black line) and in bulk
(blue line). From these measurements it can be deduced that the PS block of
spheres is organized in a phase with an increased mobility in respect of the bulk.
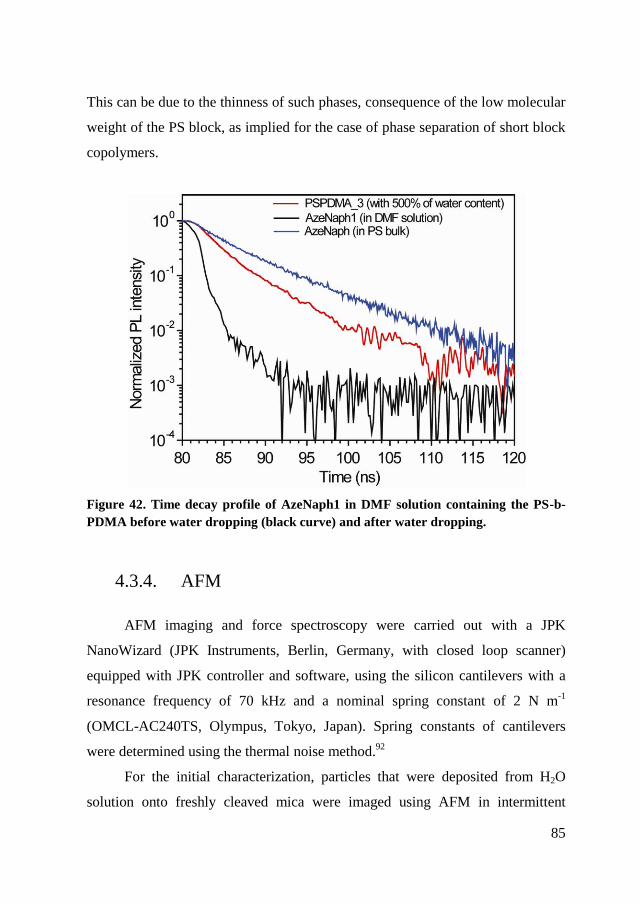
85
This can be due to the thinness of such phases, consequence of the low molecular
weight of the PS block, as implied for the case of phase separation of short block
copolymers.
Figure 42. Time decay profile of AzeNaph1 in DMF solution containing the PS-b-
PDMA before water dropping (black curve) and after water dropping.
4.3.4. AFM
AFM imaging and force spectroscopy were carried out with a JPK
NanoWizard (JPK Instruments, Berlin, Germany, with closed loop scanner)
equipped with JPK controller and software, using the silicon cantilevers with a
resonance frequency of 70 kHz and a nominal spring constant of 2 N m-1
(OMCL-AC240TS, Olympus, Tokyo, Japan). Spring constants of cantilevers
were determined using the thermal noise method.92
For the initial characterization, particles that were deposited from H2O
solution onto freshly cleaved mica were imaged using AFM in intermittent
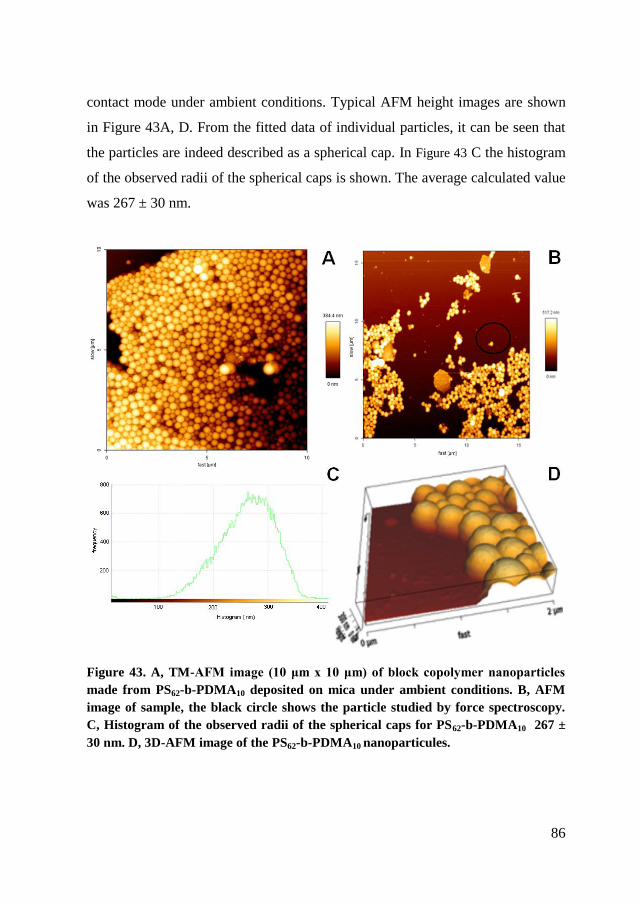
86
contact mode under ambient conditions. Typical AFM height images are shown
in Figure 43A, D. From the fitted data of individual particles, it can be seen that
the particles are indeed described as a spherical cap. In Figure 43 C the histogram
of the observed radii of the spherical caps is shown. The average calculated value
was 267 ± 30 nm.
Figure 43. A, TM-AFM image (10 μm x 10 μm) of block copolymer nanoparticles
made from PS62-b-PDMA10 deposited on mica under ambient conditions. B, AFM
image of sample, the black circle shows the particle studied by force spectroscopy.
C, Histogram of the observed radii of the spherical caps for PS62-b-PDMA10 267 ±
30 nm. D, 3D-AFM image of the PS62-b-PDMA10 nanoparticules.
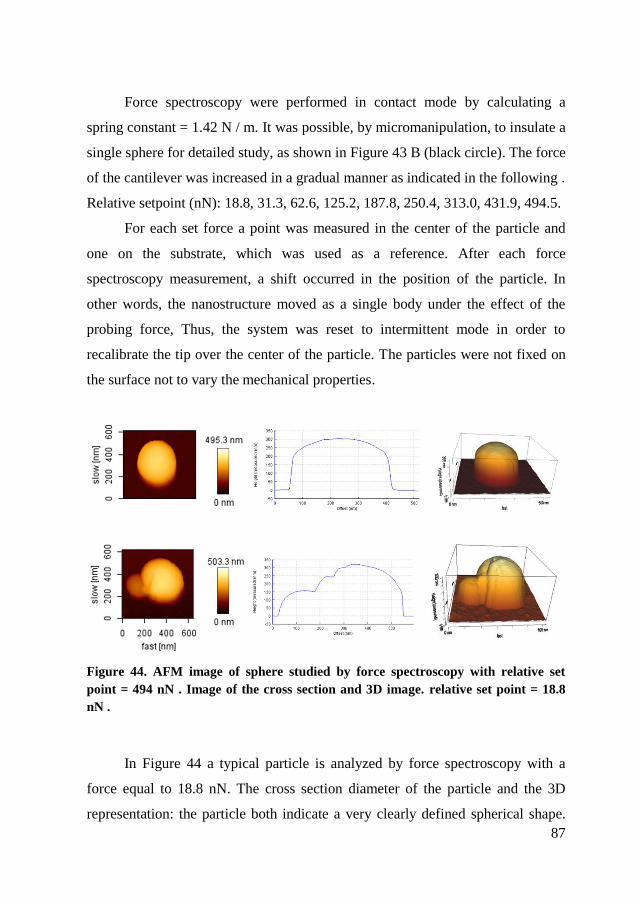
87
Force spectroscopy were performed in contact mode by calculating a
spring constant = 1.42 N / m. It was possible, by micromanipulation, to insulate a
single sphere for detailed study, as shown in Figure 43 B (black circle). The force
of the cantilever was increased in a gradual manner as indicated in the following .
Relative setpoint (nN): 18.8, 31.3, 62.6, 125.2, 187.8, 250.4, 313.0, 431.9, 494.5.
For each set force a point was measured in the center of the particle and
one on the substrate, which was used as a reference. After each force
spectroscopy measurement, a shift occurred in the position of the particle. In
other words, the nanostructure moved as a single body under the effect of the
probing force, Thus, the system was reset to intermittent mode in order to
recalibrate the tip over the center of the particle. The particles were not fixed on
the surface not to vary the mechanical properties.
Figure 44. AFM image of sphere studied by force spectroscopy with relative set
point = 494 nN . Image of the cross section and 3D image. relative set point = 18.8
nN .
In Figure 44 a typical particle is analyzed by force spectroscopy with a
force equal to 18.8 nN. The cross section diameter of the particle and the 3D
representation: the particle both indicate a very clearly defined spherical shape.
88
Similar images were obtained with most of the forces Upon increasing the
strength of to 494 nN indentation, we instead produced a breakdown of the
particle, as can be seen from the cross-sectional diameter (Figure 44). This image
also confirms the view of a solid, structure, and excludes the nanovescivle form.
4.3.5. FIB enhanced SEM experiments
Further investigation of the internal structure was performed by cutting
particles with a focused ion beam (FIB). For sample preparation, a drop of this
particle suspension was cast on a Si wafer and dried over night. The Si wafer was
glued to an aluminium stub using a double-sided adhesive carbon tape.
The sample was mounted on the stage of the FIB and the sample chamber
was evacuated to a working pressure of about 7*10-5
mbar at room temperature.
First the SEM of the dual beam instrument was used to obtain overview images
of the sample and to locate single spheres for further analysis (Figure 45, A).
Along the rim of the dried droplet we observed a ring-like structure which might
have resulted from an organic part formed by a coalescence of the nanoparticles
(Figure 45, B) and was deposited due to the so called “coffee stain effect”.
The sample stage was then tilted by 52 degrees to cut single particles with
the focused ion beam from the top while observing the cross-section from the
exposedside Figure 45 C shows the top view of the cut area imaged using the ion
beam, while Figure 45 D is an SEM image of the finished cut. There is no
indication of visible phase separation. For further cuts with the FIB, a thin layer
(~100 nm thickness) of platinum was deposited over the particle using beam-
assisted Pt deposition (Figure 46 A). This allows cutting of the sphere without
removing the top layers and leads to smoother cross-sections. Again we could not
see any difference between the interior and the exterior of the sphere (Figure 46
B).
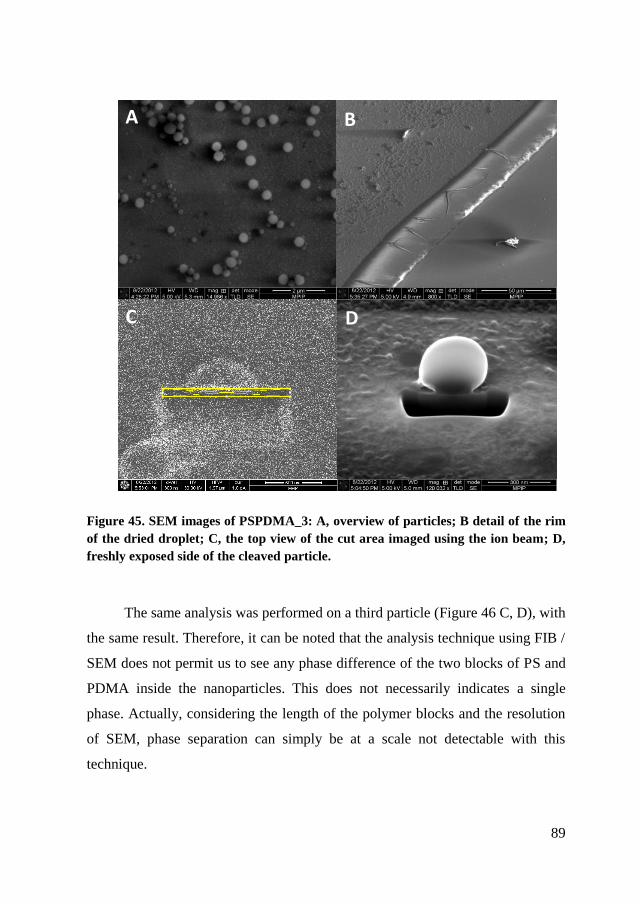
89
Figure 45. SEM images of PSPDMA_3: A, overview of particles; B detail of the rim
of the dried droplet; C, the top view of the cut area imaged using the ion beam; D,
freshly exposed side of the cleaved particle.
The same analysis was performed on a third particle (Figure 46 C, D), with
the same result. Therefore, it can be noted that the analysis technique using FIB /
SEM does not permit us to see any phase difference of the two blocks of PS and
PDMA inside the nanoparticles. This does not necessarily indicates a single
phase. Actually, considering the length of the polymer blocks and the resolution
of SEM, phase separation can simply be at a scale not detectable with this
technique.
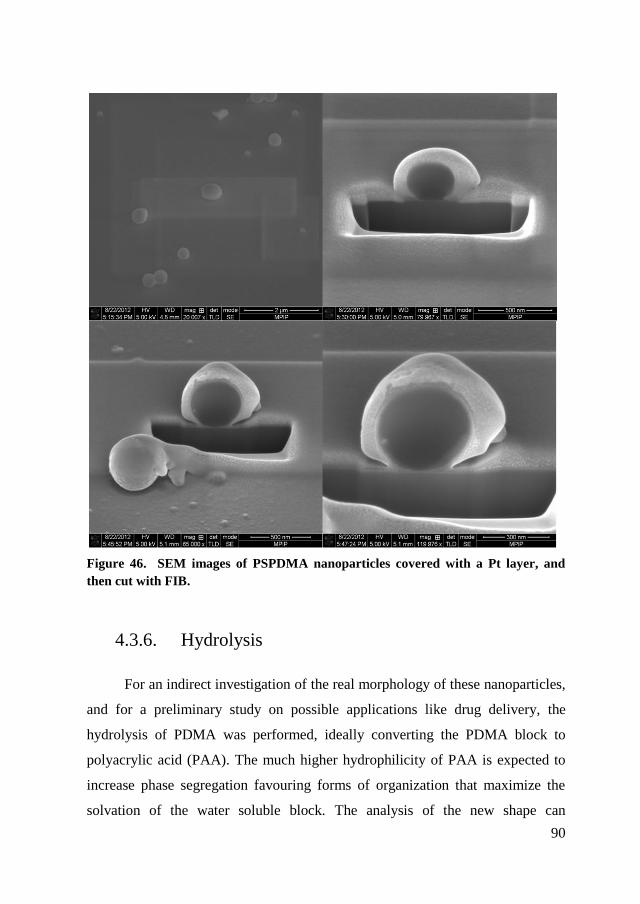
90
Figure 46. SEM images of PSPDMA nanoparticles covered with a Pt layer, and
then cut with FIB.
4.3.6. Hydrolysis
For an indirect investigation of the real morphology of these nanoparticles,
and for a preliminary study on possible applications like drug delivery, the
hydrolysis of PDMA was performed, ideally converting the PDMA block to
polyacrylic acid (PAA). The much higher hydrophilicity of PAA is expected to
increase phase segregation favouring forms of organization that maximize the
solvation of the water soluble block. The analysis of the new shape can
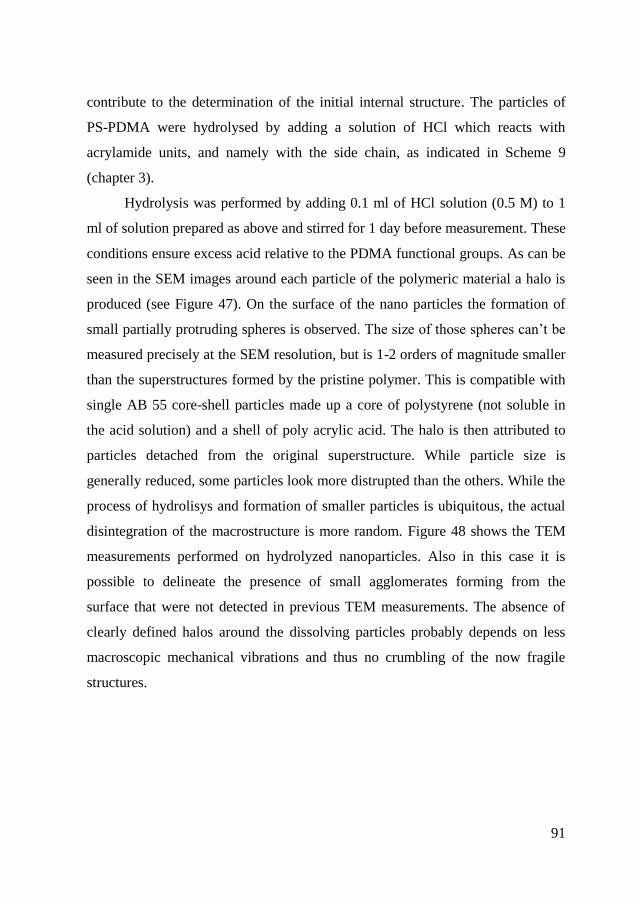
91
contribute to the determination of the initial internal structure. The particles of
PS-PDMA were hydrolysed by adding a solution of HCl which reacts with
acrylamide units, and namely with the side chain, as indicated in Scheme 9
(chapter 3).
Hydrolysis was performed by adding 0.1 ml of HCl solution (0.5 M) to 1
ml of solution prepared as above and stirred for 1 day before measurement. These
conditions ensure excess acid relative to the PDMA functional groups. As can be
seen in the SEM images around each particle of the polymeric material a halo is
produced (see Figure 47). On the surface of the nano particles the formation of
small partially protruding spheres is observed. The size of those spheres can’t be
measured precisely at the SEM resolution, but is 1-2 orders of magnitude smaller
than the superstructures formed by the pristine polymer. This is compatible with
single AB 55 core-shell particles made up a core of polystyrene (not soluble in
the acid solution) and a shell of poly acrylic acid. The halo is then attributed to
particles detached from the original superstructure. While particle size is
generally reduced, some particles look more distrupted than the others. While the
process of hydrolisys and formation of smaller particles is ubiquitous, the actual
disintegration of the macrostructure is more random. Figure 48 shows the TEM
measurements performed on hydrolyzed nanoparticles. Also in this case it is
possible to delineate the presence of small agglomerates forming from the
surface that were not detected in previous TEM measurements. The absence of
clearly defined halos around the dissolving particles probably depends on less
macroscopic mechanical vibrations and thus no crumbling of the now fragile
structures.
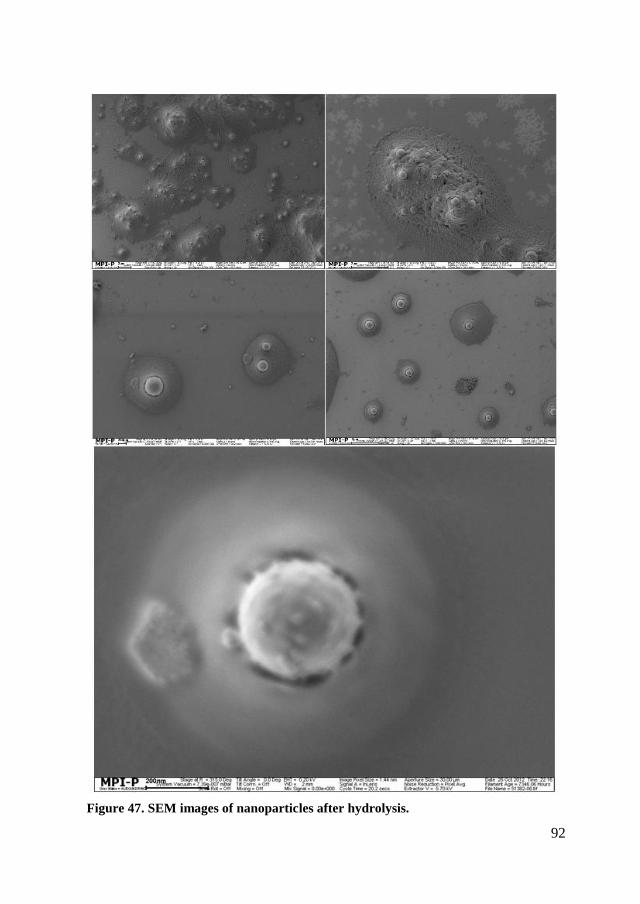
92
Figure 47. SEM images of nanoparticles after hydrolysis.
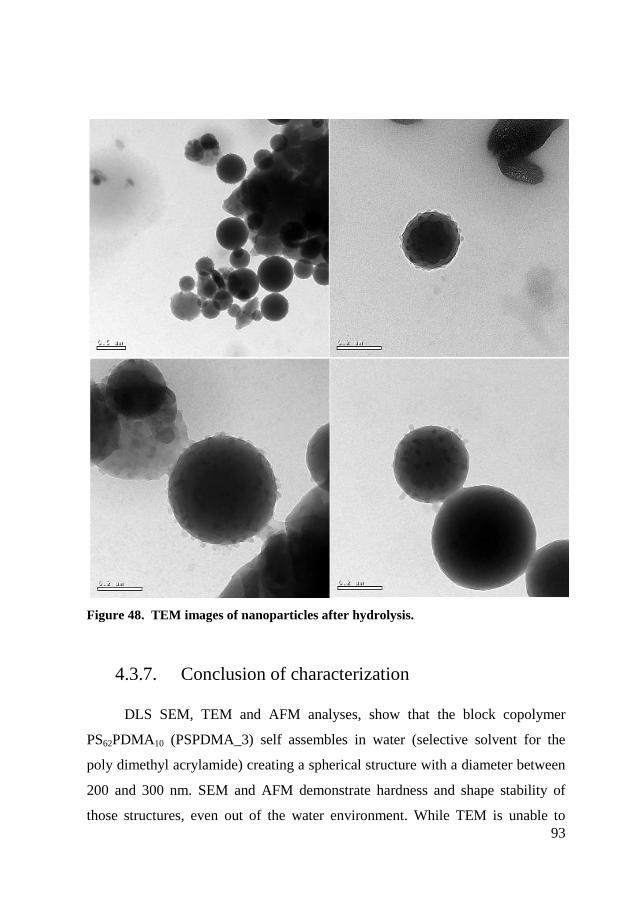
93
Figure 48. TEM images of nanoparticles after hydrolysis.
4.3.7. Conclusion of characterization
DLS SEM, TEM and AFM analyses, show that the block copolymer
PS62PDMA10 (PSPDMA_3) self assembles in water (selective solvent for the
poly dimethyl acrylamide) creating a spherical structure with a diameter between
200 and 300 nm. SEM and AFM demonstrate hardness and shape stability of
those structures, even out of the water environment. While TEM is unable to
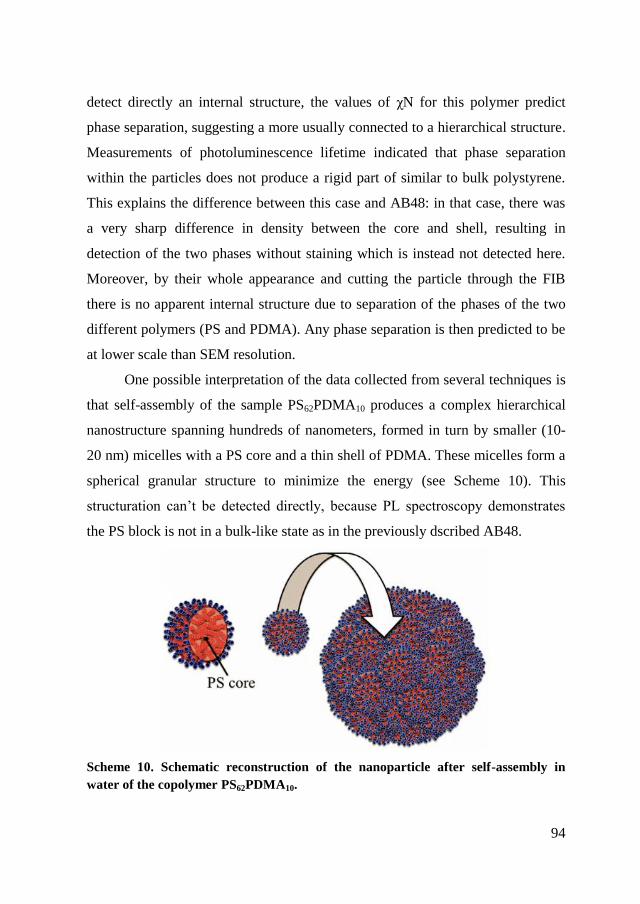
94
detect directly an internal structure, the values of χN for this polymer predict
phase separation, suggesting a more usually connected to a hierarchical structure.
Measurements of photoluminescence lifetime indicated that phase separation
within the particles does not produce a rigid part of similar to bulk polystyrene.
This explains the difference between this case and AB48: in that case, there was
a very sharp difference in density between the core and shell, resulting in
detection of the two phases without staining which is instead not detected here.
Moreover, by their whole appearance and cutting the particle through the FIB
there is no apparent internal structure due to separation of the phases of the two
different polymers (PS and PDMA). Any phase separation is then predicted to be
at lower scale than SEM resolution.
One possible interpretation of the data collected from several techniques is
that self-assembly of the sample PS62PDMA10 produces a complex hierarchical
nanostructure spanning hundreds of nanometers, formed in turn by smaller (10-
20 nm) micelles with a PS core and a thin shell of PDMA. These micelles form a
spherical granular structure to minimize the energy (see Scheme 10). This
structuration can’t be detected directly, because PL spectroscopy demonstrates
the PS block is not in a bulk-like state as in the previously dscribed AB48.
Scheme 10. Schematic reconstruction of the nanoparticle after self-assembly in
water of the copolymer PS62PDMA10.
95
Thus, the difference of density between the PDMA and PS phase is not
sufficient to provide TEM contrast. But this complex structure is demonstrated
by the detailed study of the breakdown of the structure after hydrolysing PDMA
in PAA and increasing the hydrophilicity of the shell of the micelles. Since
acrylic acid has a higher hydrophilicity than dimethyl acrylamide, the particles
have no more an energy advantage to form a sphere granulate. Also by means of
force spectroscopy is shown that the particles are an agglomerated structures of
smaller objects because, with the increase of the force of indentation, a collapse
of a part of the sphere occurred rather than a real breakdown.
96
Chapter 5. Synthesis of the
block copolymers for Quasi
Solid-State Dye-Sensitized
Solar Cells
In this chapter I will present amphiphilic block copolymer as polymer gel
for the electrolyte in the dye-sensitized solar cells (DSSC). The synthesis of the
polymer is performed through RAFT polymerization starting from commercial
polyethyleneoxide. Then I will report the first applcation of a PS-b-PEO block-
copolymer in I-/I
3- electrolyte in combination with N719 as a sensitizer in a DSC
device, affording efficiencies up to 6.9%, to be compared with an efficiency of
7.3% obtained in similar conditions with a liquid electrolyte93
.
The final goal of this project is overcome one important drawback of the
conventional Dye-Sensitized Solar Cells (DSSC) configuration, consisting in the
evaporation or leakage of toxic solvents used as liquid electrolyte, leakages are
particularly detrimental since they cause corrosion of the sealing materials and
metals constituting the cell.
5.1. Introduction
Dye-sensitized solar cells (DSSCs) represent one of the emerging
photovoltaic (PV) technologies showing an optimal trade-off between high-
conversion efficiency and low-cost manufacturing.94,95
Currently inorganic solar
cells are more efficient, but the advantages of organic cells are many: low cost
and ease of production, performance increases with temperature, bifacial
configuration advantage for diffuse light, transparency for power windows and
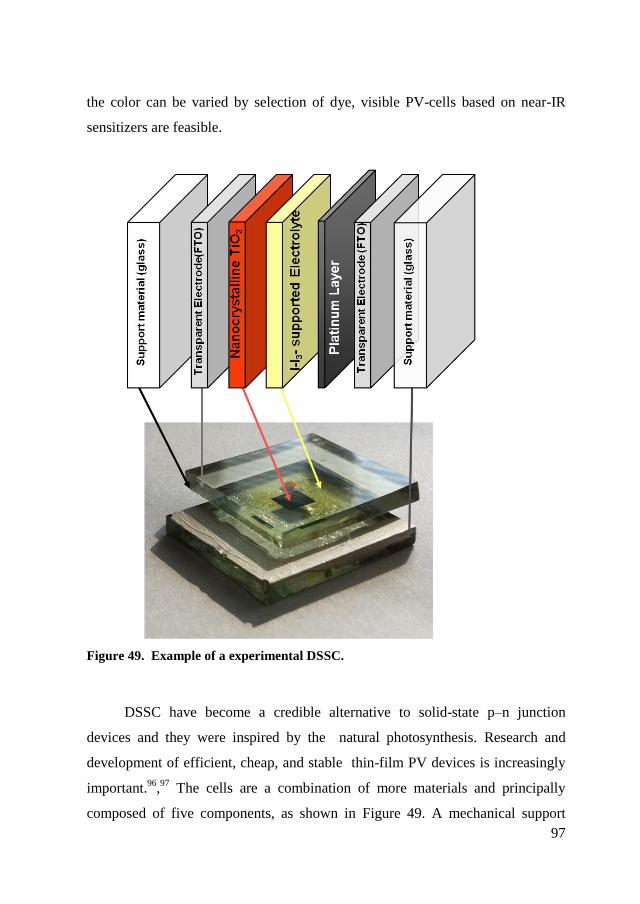
97
the color can be varied by selection of dye, visible PV-cells based on near-IR
sensitizers are feasible.
Figure 49. Example of a experimental DSSC.
DSSC have become a credible alternative to solid-state p–n junction
devices and they were inspired by the natural photosynthesis. Research and
development of efficient, cheap, and stable thin-film PV devices is increasingly
important.96
,97
The cells are a combination of more materials and principally
composed of five components, as shown in Figure 49. A mechanical support
98
coated with transparent conductive oxides (ITO or FTO); a semiconductor film,
usually TiO2; a dye sensitizer adsorbed onto the semiconductor surface; an
electrolyte containing a redox mediator (usually I-/I
3- redox couple); a counter
electrode capable of regenerating the redox mediator.
The operational principle of the cell requires that upon illumination the dye
molecule absorbs light photoexciting an electron from the HOMO to the LUMO
level, which is then injected into the conduction band of the oxide. The dye is
subsequently reduced to its initial state by the donation of an electron from the
electrolyte, usually an organic solvent containing redox system, such as the
already mentioned iodide/triiodide couple. The regeneration of the sensitizer by
the electrolyte is crucial in order to avoid undesired processes such as the back-
transfer of the electron from the titanium dioxide to the dye or undesired side
reactions. On the other side the electrolyte is regenerated by the reduction at the
counter electrode. The circuit being completed via electron migration through
the external load. The voltage generated under illumination corresponds to the
difference between the Fermi level of the electron in the solid and the redox
potential of the electrolyte. Overall the device generates electric power from light
without undergoing permanent chemical transformations.
A crucial role is the morphology of the semiconductor which has to be
porous and endowed with a high surface area. In fact a dye sensitized
nanocrystaline film generates over 1000 times more photocurrent then a single
crystal electrode.
The dye is the real motor of the cell, different types of systems can be
used, ranging from all organic molecules to metal complexes. In order to
optimize the efficiencies of the cell, the sensitizer should satisfy a number of
essential requirements. First of all it should strongly absorb solar radiation with
absorption bands in the visible or near-IR region, preferably covering a broad
range of wavelengths. Furthermore the sensitizers should bind strongly to the
TiO2 by means of an anchoring group, typically a carboxylic or phosphonic acid,
99
possibly located in the high charge density of the excited state of the dye. This
ensures efficient electron injection into the TiO2 conducting band and prevents
gradual leaching by the electrolyte. The electron transfer from the excited state of
the dye to the TiO2 must also be rapid in comparison to the decay to the ground
state. Additionally the LUMO of the dye must be sufficiently high in energy for
efficient charge injection into the TiO2, while the HOMO must be sufficiently
low in energy for efficient regeneration of the oxidized dye by the hole-transport
material.
All these requirements can be successfully satisfied by careful design of
the molecules and tailored according to needs via organic synthesis. The most
famous example of dyes for DSSCs are metal complexes. The optimization of the
dye metal complex component of the cell has been made through systematic
variation of the ligand nature, metal, and introducing different types of
substituent on the metal ligand. This systematic study has resulted in the
development of mononuclear and polynuclear dyes based on metals such as
Ru(II), Os(II), Pt(II), Re(I), Cu(I), and Fe(II). By tuning the ligand orbitals, via
substitution of the electron acceptor groups on the dye molecule, it is possible to
adjust the LUMO level of the system. The prototypical sensitizer is the Ru(II)
complex bis(2,2’-bipyridyl-4,4’-dicarboxylate)ruthenium(II) (N719). N719 based
DSC have reached power conversion efficiencies exceeding 11%.98
The best
photovoltaic performances up to date in terms of efficiencies and long term
stability has so far been achieved with polypyridyl complexes of ruthenium in
which have been used two ligands L = 4,40-dicarboxy-2,20-bipyridine and
thiocyanate ligands.
One important drawback of the conventional DSSC configuration consists
in the use of a liquid electrolyte based on the I-/I
3- redox couple, which causes
evaporation or leakage of toxic solvents and corrosiveness of the iodide/triiodide
couple toward sealing materials and metals, such as Ag and counterelectrode Pt.99
This results in a less robust sealing and reduced long-term stability. As a matter

100
of fact, the use of liquid electrolyte is considered to be the most important
restriction for the scale up of DSSC technology. On the other hand the use of the
iodide/triiodide couple allows for higher efficiencies thanks to a favorable
penetration into the mesoporous TiO2 film and fast dye regeneration. Therefore,
it would be of crucial importance for the market to replace the conventional
liquid electrolyte bypassing the issues linked to the presence of solvents but
keeping the advantages of the iodide/triiodide redox system. Over the past years
a number of approaches have been investigated to replace liquid components by
solid-state and quasi solid-state electrolytes,100,101
such as hole transport
materials, ionic liquids,102
or solid-state composite electrolytes. Although a
certified 6.08% record value has been recently reported for a solid-state DSSC
(ssDSSC) using the molecular 2,2’,7,7’-tetrakis(N,N-dimethoxyphenylamine)-
9,9’-spirobifluorene (spiro-MeOTAD) hole-transporting material,103
the
performances of ssDSSC are much lower than those based on the liquid
electrolyte, with the best power conversion efficiencies approaching 5%. This is
mainly due to poor ion diffusion and conductivity properties.
One simple approach to avoid leakage and evaporation of solvents from
the electrolyte consists in using a dispersion in a polymeric matrix.104 ,105
In these
cases the conventional electrolyte is still present in its original form but is
converted in a quasi solid-state material. The advantage of using polymer
electrolyte is the higher conductivity and pore filling properties compared to
other ssDSC components such as spiro-MeOTAD. In a polymer electrolyte,
generally prepared by dissolving the inorganic and organic salts in a proper
polymer matrix, the liquid electrolyte is trapped in a polymer cage forming a
three-dimensional network, where the ions are free to move as in the liquid
phase. A large number of polymer composites have been tested. Among the
others, poly(ethylene oxide) (PEO) polymers have been commonly used as host
materials for ssDSC, thanks to the coordinating properties of the polyether chain
to the lithium or sodium cations present in the electrolyte mixture.
101
Shu Yin et al.106
have obtained good results (6.1%) using the blend
polymer PEO/PAA, with good structural stability compared to ssDSSC.
An electrolyte based on a blend of polyacrylic acid and
polyethyleneglycol, obtained by radical polymerization of acrylic acid in
presence of PEG chains, with NaI/I2 was able to afford a remarkable 6.1%
efficiency.107
By using the same methodology and a metal-free organic sensitizer
an efficiency of 6.8% has been obtained.108
On the other hand the problem of these systems is the coexistence of two
different phases that are thermodynamically unstable, with strong tendency to
phase segregate with time and especially at the high operating temperatures of
the cell. However, block copolymers are organized by self assembly in stable
nanometric ordered structures (for example: cubic, lamellar, hexagonal…).
Furthermore the nanometric confinement can prevent crystallization of PEO. De
Paoli and co-workers have pioneered the use of PEO-based copolymers with a
poly(epichlorohydrin-co-ethylene)oxide polymer filled with NaI/I2 as an
electrolyte, the authors report conversion efficiencies of 10-4%, which were later
improved to 1.6% by using N719 as the sensitizer.109
Therefore, the advantage of using block-copolymers, obtained by RAFT
polymerization, over conventional polymers such as PEO (polyethyleneoxide),
random copolymers, or polymer blends, is the possibility to control the
morphology of the polymer gel by varying the ratio between PEO and the
hydrophobic blocks. Furthermore a large variety of monomers can be used,
providing gels characterized by different physico-chemical and mechanical
properties, as an example Tg can be finely tuned. On the basis of this complex
and rich morphological variety, block-copolymers represent a versatile class of
templates for nanoarchitecture construction.
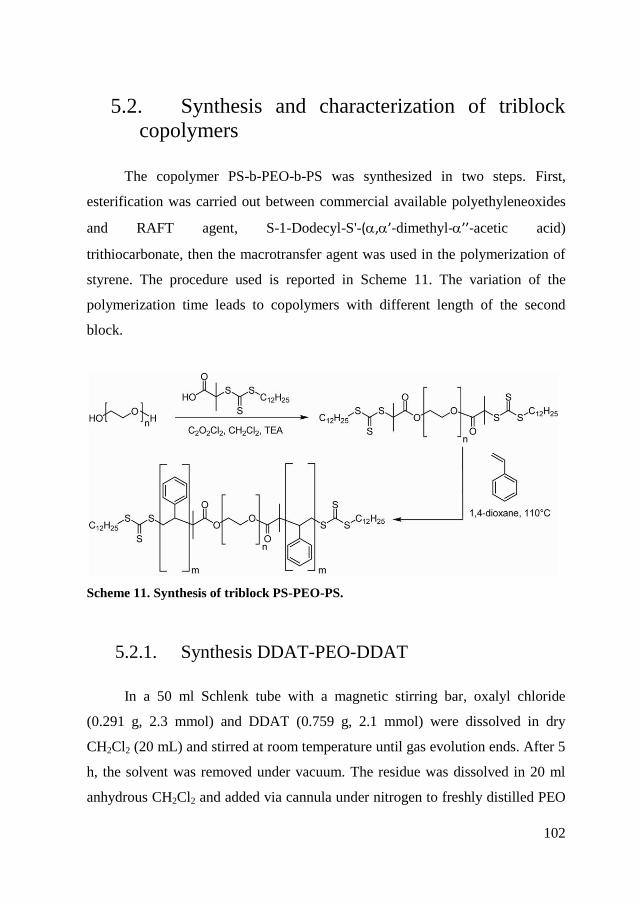
102
5.2. Synthesis and characterization of triblock
copolymers
The copolymer PS-b-PEO-b-PS was synthesized in two steps. First,
esterification was carried out between commercial available polyethyleneoxides
and RAFT agent, S-1-Dodecyl-S'-(,’-dimethyl-’’-acetic acid)
trithiocarbonate, then the macrotransfer agent was used in the polymerization of
styrene. The procedure used is reported in Scheme 11. The variation of the
polymerization time leads to copolymers with different length of the second
block.
Scheme 11. Synthesis of triblock PS-PEO-PS.
5.2.1. Synthesis DDAT-PEO-DDAT
In a 50 ml Schlenk tube with a magnetic stirring bar, oxalyl chloride
(0.291 g, 2.3 mmol) and DDAT (0.759 g, 2.1 mmol) were dissolved in dry
CH2Cl2 (20 mL) and stirred at room temperature until gas evolution ends. After 5
h, the solvent was removed under vacuum. The residue was dissolved in 20 ml
anhydrous CH2Cl2 and added via cannula under nitrogen to freshly distilled PEO
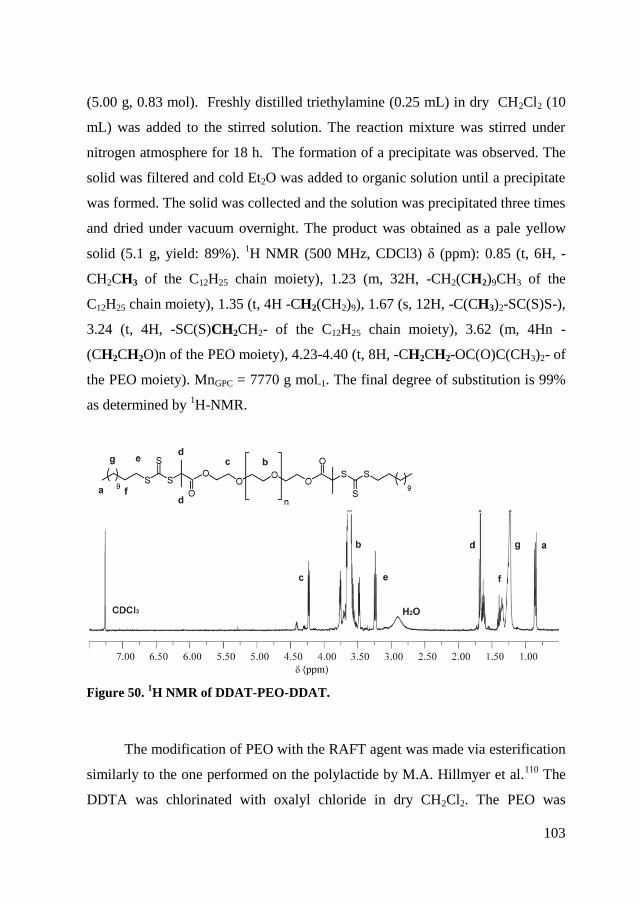
103
(5.00 g, 0.83 mol). Freshly distilled triethylamine (0.25 mL) in dry CH2Cl2 (10
mL) was added to the stirred solution. The reaction mixture was stirred under
nitrogen atmosphere for 18 h. The formation of a precipitate was observed. The
solid was filtered and cold Et2O was added to organic solution until a precipitate
was formed. The solid was collected and the solution was precipitated three times
and dried under vacuum overnight. The product was obtained as a pale yellow
solid (5.1 g, yield: 89%). 1H NMR (500 MHz, CDCl3) δ (ppm): 0.85 (t, 6H, -
CH2CH3 of the C12H25 chain moiety), 1.23 (m, 32H, -CH2(CH2)9CH3 of the
C12H25 chain moiety), 1.35 (t, 4H -CH2(CH2)9), 1.67 (s, 12H, -C(CH3)2-SC(S)S-),
3.24 (t, 4H, -SC(S)CH2CH2- of the C12H25 chain moiety), 3.62 (m, 4Hn -
(CH2CH2O)n of the PEO moiety), 4.23-4.40 (t, 8H, -CH2CH2-OC(O)C(CH3)2- of
the PEO moiety). MnGPC = 7770 g mol-1. The final degree of substitution is 99%
as determined by 1H-NMR.
Figure 50. 1H NMR of DDAT-PEO-DDAT.
The modification of PEO with the RAFT agent was made via esterification
similarly to the one performed on the polylactide by M.A. Hillmyer et al.110
The
DDTA was chlorinated with oxalyl chloride in dry CH2Cl2. The PEO was
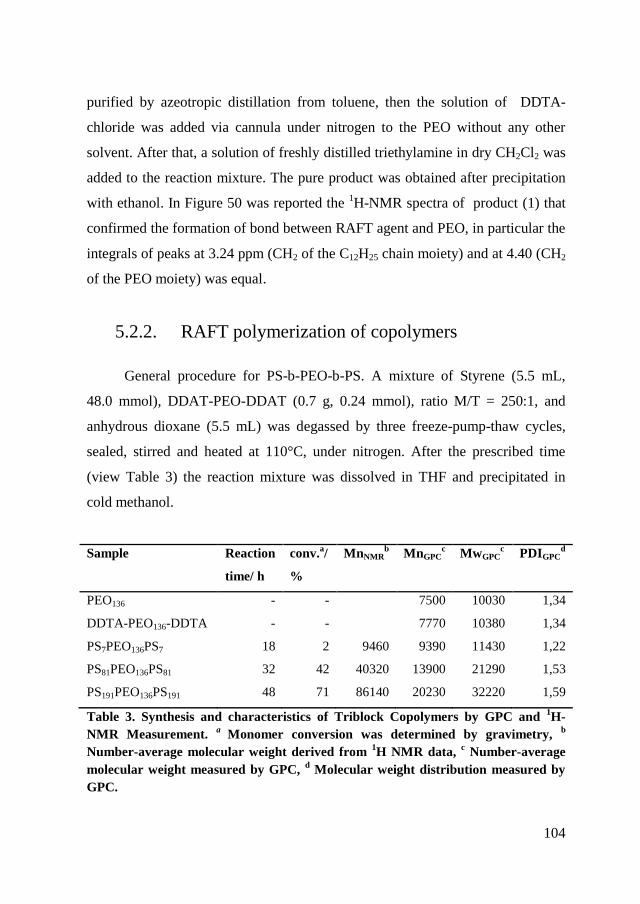
104
purified by azeotropic distillation from toluene, then the solution of DDTA-
chloride was added via cannula under nitrogen to the PEO without any other
solvent. After that, a solution of freshly distilled triethylamine in dry CH2Cl2 was
added to the reaction mixture. The pure product was obtained after precipitation
with ethanol. In Figure 50 was reported the 1H-NMR spectra of product (1) that
confirmed the formation of bond between RAFT agent and PEO, in particular the
integrals of peaks at 3.24 ppm (CH2 of the C12H25 chain moiety) and at 4.40 (CH2
of the PEO moiety) was equal.
5.2.2. RAFT polymerization of copolymers
General procedure for PS-b-PEO-b-PS. A mixture of Styrene (5.5 mL,
48.0 mmol), DDAT-PEO-DDAT (0.7 g, 0.24 mmol), ratio M/T = 250:1, and
anhydrous dioxane (5.5 mL) was degassed by three freeze-pump-thaw cycles,
sealed, stirred and heated at 110°C, under nitrogen. After the prescribed time
(view Table 3) the reaction mixture was dissolved in THF and precipitated in
cold methanol.
Sample Reaction
time/ h
conv.a/
%
MnNMRb MnGPC
c MwGPC
c PDIGPC
d
PEO136 - - 7500 10030 1,34
DDTA-PEO136-DDTA - - 7770 10380 1,34
PS7PEO136PS7 18 2 9460 9390 11430 1,22
PS81PEO136PS81 32 42 40320 13900 21290 1,53
PS191PEO136PS191 48 71 86140 20230 32220 1,59
Table 3. Synthesis and characteristics of Triblock Copolymers by GPC and 1H-
NMR Measurement. a
Monomer conversion was determined by gravimetry, b
Number-average molecular weight derived from 1H NMR data,
c Number-average
molecular weight measured by GPC, d Molecular weight distribution measured by
GPC.
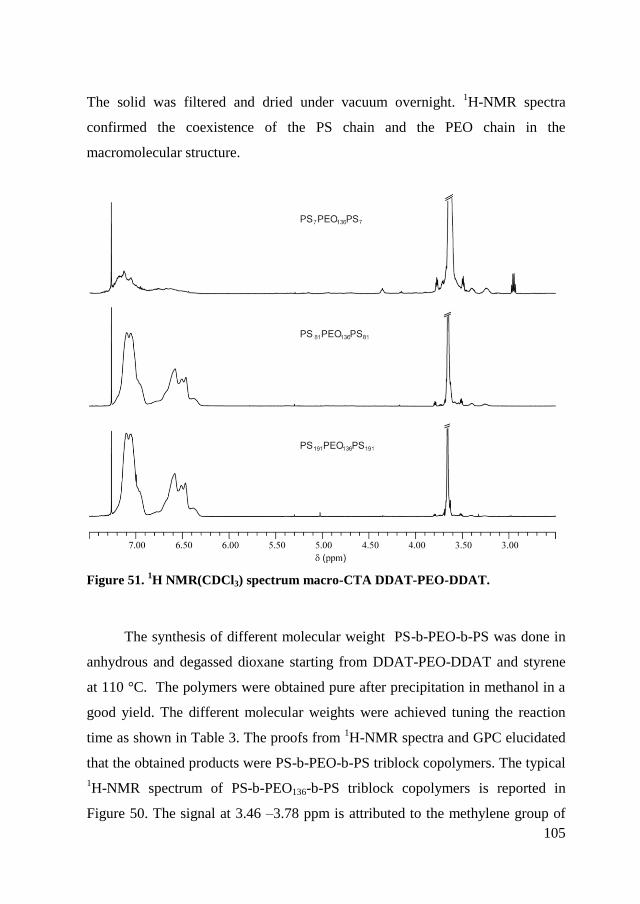
105
The solid was filtered and dried under vacuum overnight. 1H-NMR spectra
confirmed the coexistence of the PS chain and the PEO chain in the
macromolecular structure.
Figure 51. 1H NMR(CDCl3) spectrum macro-CTA DDAT-PEO-DDAT.
The synthesis of different molecular weight PS-b-PEO-b-PS was done in
anhydrous and degassed dioxane starting from DDAT-PEO-DDAT and styrene
at 110 °C. The polymers were obtained pure after precipitation in methanol in a
good yield. The different molecular weights were achieved tuning the reaction
time as shown in Table 3. The proofs from 1H-NMR spectra and GPC elucidated
that the obtained products were PS-b-PEO-b-PS triblock copolymers. The typical
1H-NMR spectrum of PS-b-PEO136-b-PS triblock copolymers is reported in
Figure 50. The signal at 3.46 –3.78 ppm is attributed to the methylene group of
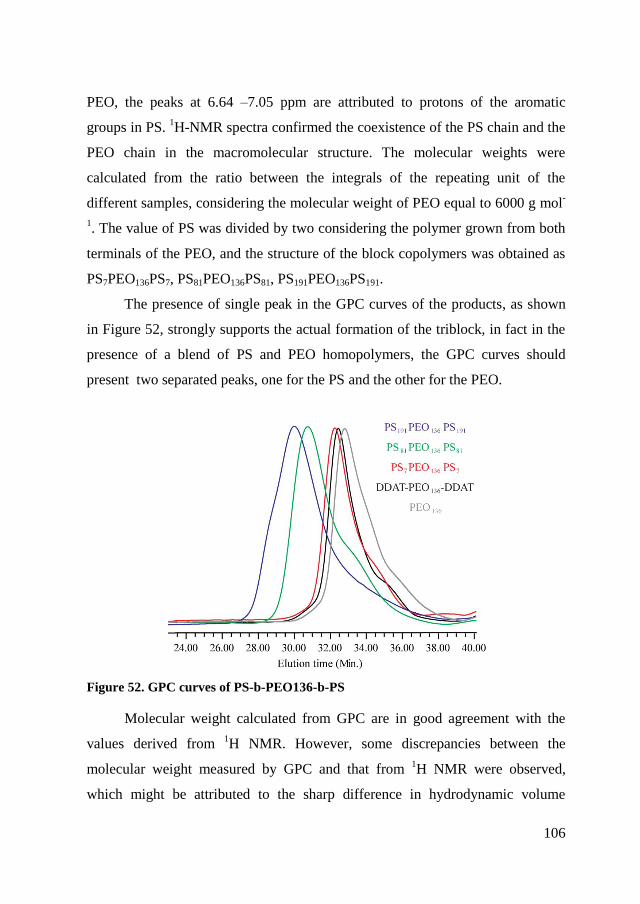
106
PEO, the peaks at 6.64 –7.05 ppm are attributed to protons of the aromatic
groups in PS. 1H-NMR spectra confirmed the coexistence of the PS chain and the
PEO chain in the macromolecular structure. The molecular weights were
calculated from the ratio between the integrals of the repeating unit of the
different samples, considering the molecular weight of PEO equal to 6000 g mol-
1. The value of PS was divided by two considering the polymer grown from both
terminals of the PEO, and the structure of the block copolymers was obtained as
PS7PEO136PS7, PS81PEO136PS81, PS191PEO136PS191.
The presence of single peak in the GPC curves of the products, as shown
in Figure 52, strongly supports the actual formation of the triblock, in fact in the
presence of a blend of PS and PEO homopolymers, the GPC curves should
present two separated peaks, one for the PS and the other for the PEO.
Figure 52. GPC curves of PS-b-PEO136-b-PS
Molecular weight calculated from GPC are in good agreement with the
values derived from 1H NMR. However, some discrepancies between the
molecular weight measured by GPC and that from 1H NMR were observed,
which might be attributed to the sharp difference in hydrodynamic volume
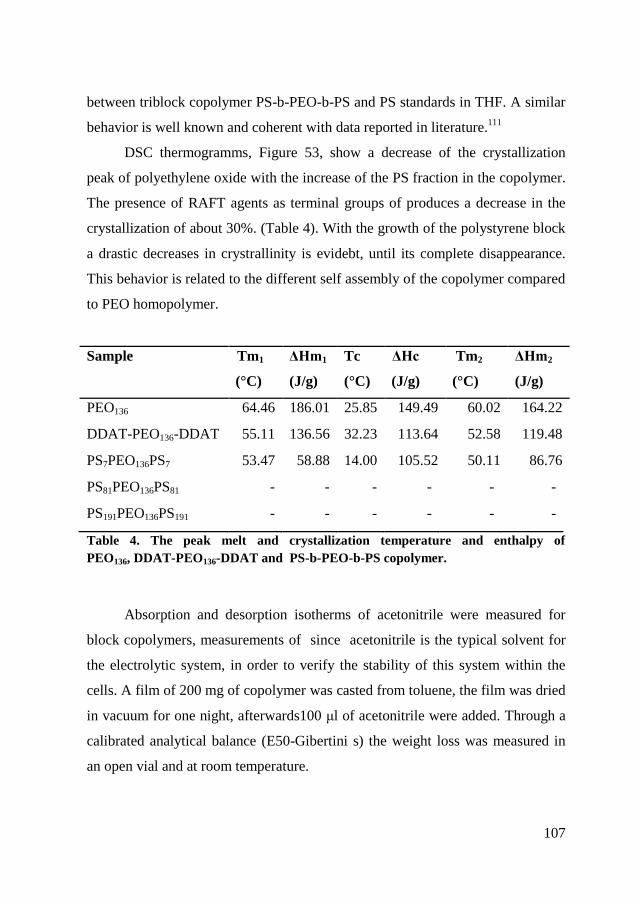
107
between triblock copolymer PS-b-PEO-b-PS and PS standards in THF. A similar
behavior is well known and coherent with data reported in literature.111
DSC thermogramms, Figure 53, show a decrease of the crystallization
peak of polyethylene oxide with the increase of the PS fraction in the copolymer.
The presence of RAFT agents as terminal groups of produces a decrease in the
crystallization of about 30%. (Table 4). With the growth of the polystyrene block
a drastic decreases in crystrallinity is evidebt, until its complete disappearance.
This behavior is related to the different self assembly of the copolymer compared
to PEO homopolymer.
Sample Tm1
(°C)
ΔHm1
(J/g)
Tc
(°C)
ΔHc
(J/g)
Tm2
(°C)
ΔHm2
(J/g)
PEO136 64.46 186.01 25.85 149.49 60.02 164.22
DDAT-PEO136-DDAT 55.11 136.56 32.23 113.64 52.58 119.48
PS7PEO136PS7 53.47 58.88 14.00 105.52 50.11 86.76
PS81PEO136PS81 - - - - - -
PS191PEO136PS191 - - - - - -
Table 4. The peak melt and crystallization temperature and enthalpy of
PEO136, DDAT-PEO136-DDAT and PS-b-PEO-b-PS copolymer.
Absorption and desorption isotherms of acetonitrile were measured for
block copolymers, measurements of since acetonitrile is the typical solvent for
the electrolytic system, in order to verify the stability of this system within the
cells. A film of 200 mg of copolymer was casted from toluene, the film was dried
in vacuum for one night, afterwards100 μl of acetonitrile were added. Through a
calibrated analytical balance (E50-Gibertini s) the weight loss was measured in
an open vial and at room temperature.
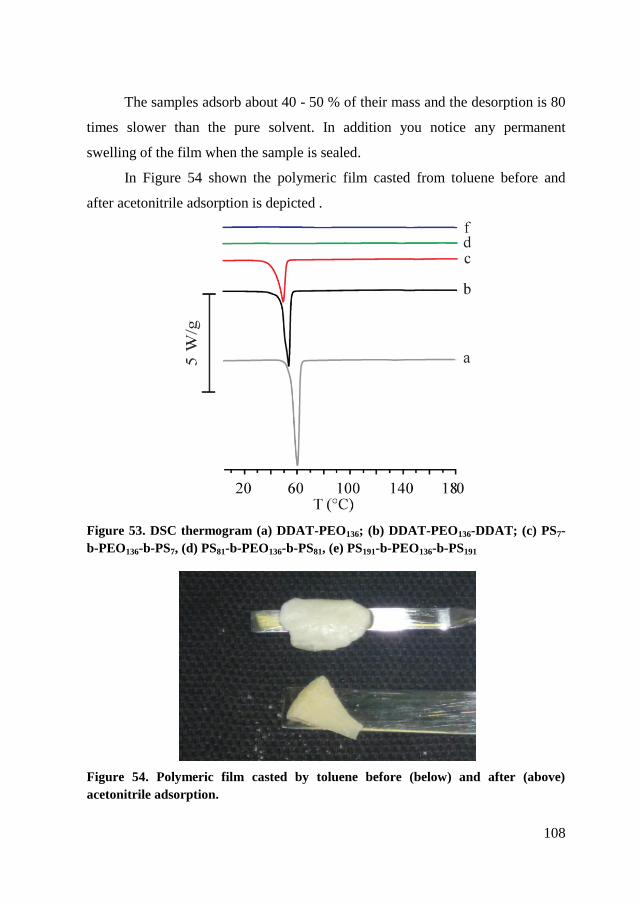
108
The samples adsorb about 40 - 50 % of their mass and the desorption is 80
times slower than the pure solvent. In addition you notice any permanent
swelling of the film when the sample is sealed.
In Figure 54 shown the polymeric film casted from toluene before and
after acetonitrile adsorption is depicted .
Figure 53. DSC thermogram (a) DDAT-PEO136; (b) DDAT-PEO136-DDAT; (c) PS7-
b-PEO136-b-PS7, (d) PS81-b-PEO136-b-PS81, (e) PS191-b-PEO136-b-PS191
Figure 54. Polymeric film casted by toluene before (below) and after (above)
acetonitrile adsorption.
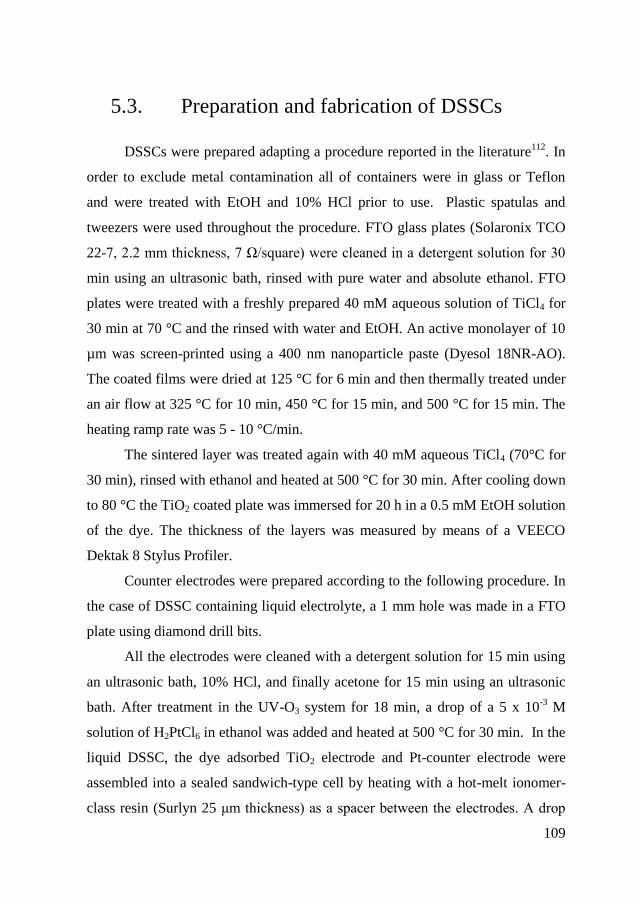
109
5.3. Preparation and fabrication of DSSCs
DSSCs were prepared adapting a procedure reported in the literature112
. In
order to exclude metal contamination all of containers were in glass or Teflon
and were treated with EtOH and 10% HCl prior to use. Plastic spatulas and
tweezers were used throughout the procedure. FTO glass plates (Solaronix TCO
22-7, 2.2 mm thickness, 7 Ω/square) were cleaned in a detergent solution for 30
min using an ultrasonic bath, rinsed with pure water and absolute ethanol. FTO
plates were treated with a freshly prepared 40 mM aqueous solution of TiCl4 for
30 min at 70 °C and the rinsed with water and EtOH. An active monolayer of 10
µm was screen-printed using a 400 nm nanoparticle paste (Dyesol 18NR-AO).
The coated films were dried at 125 °C for 6 min and then thermally treated under
an air flow at 325 °C for 10 min, 450 °C for 15 min, and 500 °C for 15 min. The
heating ramp rate was 5 - 10 °C/min.
The sintered layer was treated again with 40 mM aqueous TiCl4 (70°C for
30 min), rinsed with ethanol and heated at 500 °C for 30 min. After cooling down
to 80 °C the TiO2 coated plate was immersed for 20 h in a 0.5 mM EtOH solution
of the dye. The thickness of the layers was measured by means of a VEECO
Dektak 8 Stylus Profiler.
Counter electrodes were prepared according to the following procedure. In
the case of DSSC containing liquid electrolyte, a 1 mm hole was made in a FTO
plate using diamond drill bits.
All the electrodes were cleaned with a detergent solution for 15 min using
an ultrasonic bath, 10% HCl, and finally acetone for 15 min using an ultrasonic
bath. After treatment in the UV-O3 system for 18 min, a drop of a 5 x 10⁻³
M
solution of H2PtCl6 in ethanol was added and heated at 500 °C for 30 min. In the
liquid DSSC, the dye adsorbed TiO2 electrode and Pt-counter electrode were
assembled into a sealed sandwich-type cell by heating with a hot-melt ionomer-
class resin (Surlyn 25 μm thickness) as a spacer between the electrodes. A drop
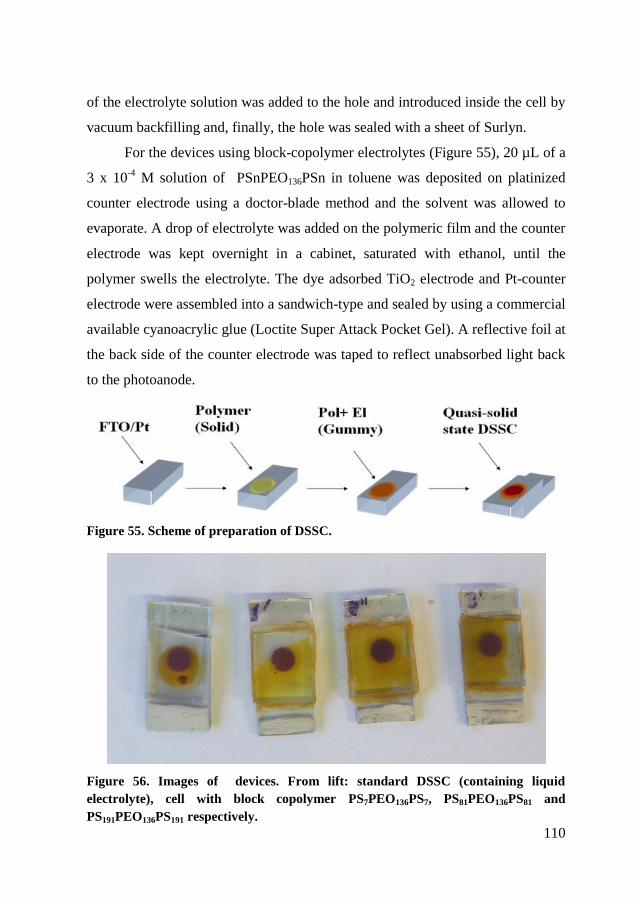
110
of the electrolyte solution was added to the hole and introduced inside the cell by
vacuum backfilling and, finally, the hole was sealed with a sheet of Surlyn.
For the devices using block-copolymer electrolytes (Figure 55), 20 µL of a
3 x 10⁻⁴
M solution of PSnPEO136PSn in toluene was deposited on platinized
counter electrode using a doctor-blade method and the solvent was allowed to
evaporate. A drop of electrolyte was added on the polymeric film and the counter
electrode was kept overnight in a cabinet, saturated with ethanol, until the
polymer swells the electrolyte. The dye adsorbed TiO2 electrode and Pt-counter
electrode were assembled into a sandwich-type and sealed by using a commercial
available cyanoacrylic glue (Loctite Super Attack Pocket Gel). A reflective foil at
the back side of the counter electrode was taped to reflect unabsorbed light back
to the photoanode.
Figure 55. Scheme of preparation of DSSC.
Figure 56. Images of devices. From lift: standard DSSC (containing liquid
electrolyte), cell with block copolymer PS7PEO136PS7, PS81PEO136PS81 and
PS191PEO136PS191 respectively.
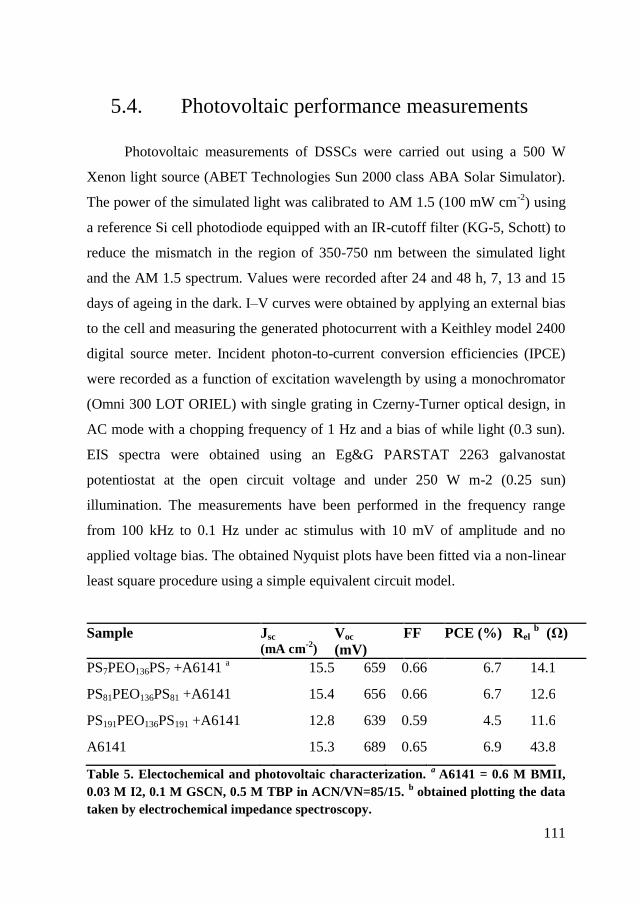
111
5.4. Photovoltaic performance measurements
Photovoltaic measurements of DSSCs were carried out using a 500 W
Xenon light source (ABET Technologies Sun 2000 class ABA Solar Simulator).
The power of the simulated light was calibrated to AM 1.5 (100 mW cm-2
) using
a reference Si cell photodiode equipped with an IR-cutoff filter (KG-5, Schott) to
reduce the mismatch in the region of 350-750 nm between the simulated light
and the AM 1.5 spectrum. Values were recorded after 24 and 48 h, 7, 13 and 15
days of ageing in the dark. I–V curves were obtained by applying an external bias
to the cell and measuring the generated photocurrent with a Keithley model 2400
digital source meter. Incident photon-to-current conversion efficiencies (IPCE)
were recorded as a function of excitation wavelength by using a monochromator
(Omni 300 LOT ORIEL) with single grating in Czerny-Turner optical design, in
AC mode with a chopping frequency of 1 Hz and a bias of while light (0.3 sun).
EIS spectra were obtained using an Eg&G PARSTAT 2263 galvanostat
potentiostat at the open circuit voltage and under 250 W m-2 (0.25 sun)
illumination. The measurements have been performed in the frequency range
from 100 kHz to 0.1 Hz under ac stimulus with 10 mV of amplitude and no
applied voltage bias. The obtained Nyquist plots have been fitted via a non-linear
least square procedure using a simple equivalent circuit model.
Sample Jsc (mA cm
-2)
Voc
(mV)
FF PCE (%) Rel b (Ω)
PS7PEO136PS7 +A6141 a 15.5 659 0.66 6.7 14.1
PS81PEO136PS81 +A6141 15.4 656 0.66 6.7 12.6
PS191PEO136PS191 +A6141 12.8 639 0.59 4.5 11.6
A6141 15.3 689 0.65 6.9 43.8
Table 5. Electochemical and photovoltaic characterization. a
A6141 = 0.6 M BMII,
0.03 M I2, 0.1 M GSCN, 0.5 M TBP in ACN/VN=85/15. b obtained plotting the data
taken by electrochemical impedance spectroscopy.
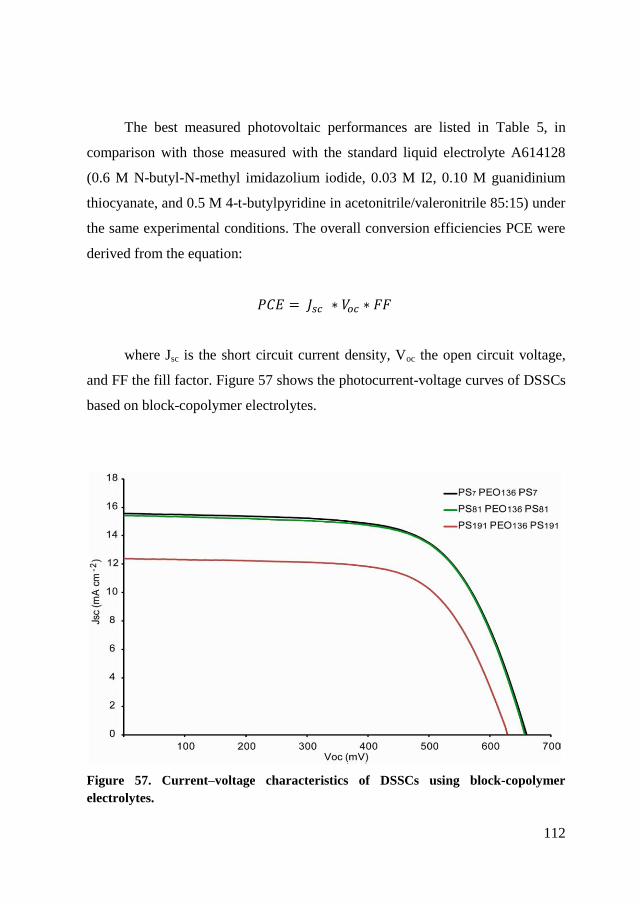
112
The best measured photovoltaic performances are listed in Table 5, in
comparison with those measured with the standard liquid electrolyte A614128
(0.6 M N-butyl-N-methyl imidazolium iodide, 0.03 M I2, 0.10 M guanidinium
thiocyanate, and 0.5 M 4-t-butylpyridine in acetonitrile/valeronitrile 85:15) under
the same experimental conditions. The overall conversion efficiencies PCE were
derived from the equation:
where Jsc is the short circuit current density, Voc the open circuit voltage,
and FF the fill factor. Figure 57 shows the photocurrent-voltage curves of DSSCs
based on block-copolymer electrolytes.
Figure 57. Current–voltage characteristics of DSSCs using block-copolymer
electrolytes.
0
2
4
6
8
10
12
14
16
18
0 100 200 300 400 500 600 700
J sc
(mA
cm
-2)
Voc (mV)
PS7 PEO136 PS7
PS81 PEO136 PS81
113
The properties of electrolyte conductivity were investigated by means of
electrochemical impedance spectroscopy (EIS) and the resistivities of the
polymeric layers are listened in Table 5, in comparison with the conventional
liquid electrolyte. In this experiment, a small sinusoidal voltage stimulus of fixed
frequency is applied to an electrochemical cell and its current response is
measured. The ac behavior of an electrochemical system can be investigated by
sweeping the frequency over several orders of magnitude (generally from a few
mHz to several MHz). The analysis of impedance spectra is usually performed in
terms of Nyquist plots where the imaginary part of the impedance is plotted as a
function of the real part over the range of frequencies. Equivalent circuits built in
series or parallel combinations of simple elements like resistance, capacitance,
and inductance are often used to qualitatively describe the electrode material,
while the determination of their numeric values by fitting procedures yields
quantitative data. In a DSSC the nano-porous photo-electrode, the electrolyte and
the platinized counter-electrode show different time constants, i.e. characteristic
frequencies, and thus can be seen as separated impedance arcs in the Nyquist
plot.113
As a consequence, the impedance of a DSSC can be described by an
equivalent circuit model,114,115,116
in which the different cell components and their
interfaces are treated as discrete electrical elements. The remarkable result
revealed by EIS is that the copolymers seem to help the ionic conductivity,
decreasing the resistance of the electrolyte, which is even higher in the liquid
one.
Furthermore, the devices built with copolymers, both those stored in the
dark and ones left under weathering, have shown a good stability as can be seen
in the Figure 58 and in Table 6 and Table 7.
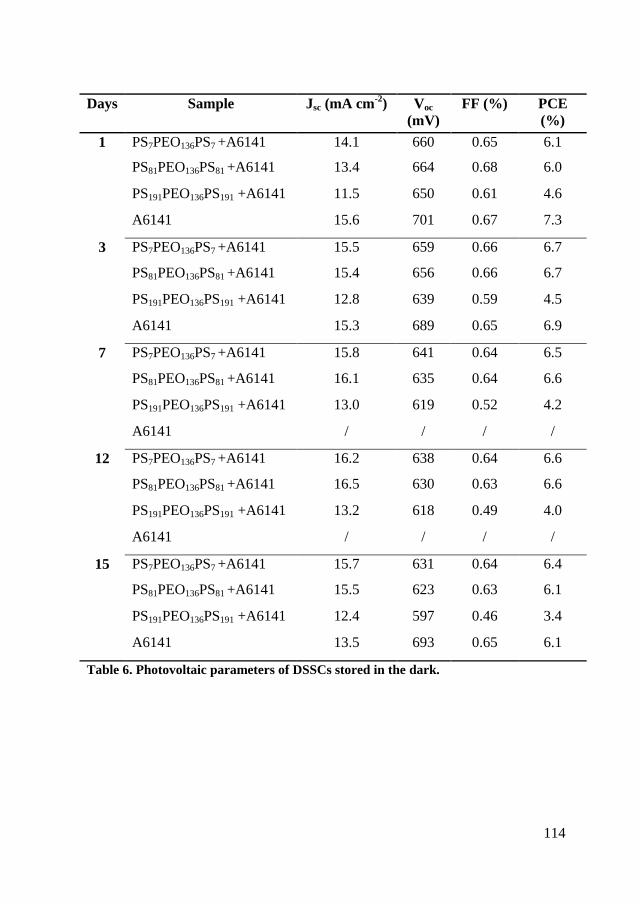
114
Days Sample Jsc (mA cm-2
) Voc
(mV)
FF (%) PCE
(%)
1 PS7PEO136PS7 +A6141 14.1 660 0.65 6.1
PS81PEO136PS81 +A6141 13.4 664 0.68 6.0
PS191PEO136PS191 +A6141 11.5 650 0.61 4.6
A6141 15.6 701 0.67 7.3
3 PS7PEO136PS7 +A6141 15.5 659 0.66 6.7
PS81PEO136PS81 +A6141 15.4 656 0.66 6.7
PS191PEO136PS191 +A6141 12.8 639 0.59 4.5
A6141 15.3 689 0.65 6.9
7 PS7PEO136PS7 +A6141 15.8 641 0.64 6.5
PS81PEO136PS81 +A6141 16.1 635 0.64 6.6
PS191PEO136PS191 +A6141 13.0 619 0.52 4.2
A6141 / / / /
12 PS7PEO136PS7 +A6141 16.2 638 0.64 6.6
PS81PEO136PS81 +A6141 16.5 630 0.63 6.6
PS191PEO136PS191 +A6141 13.2 618 0.49 4.0
A6141 / / / /
15 PS7PEO136PS7 +A6141 15.7 631 0.64 6.4
PS81PEO136PS81 +A6141 15.5 623 0.63 6.1
PS191PEO136PS191 +A6141 12.4 597 0.46 3.4
A6141 13.5 693 0.65 6.1
Table 6. Photovoltaic parameters of DSSCs stored in the dark.
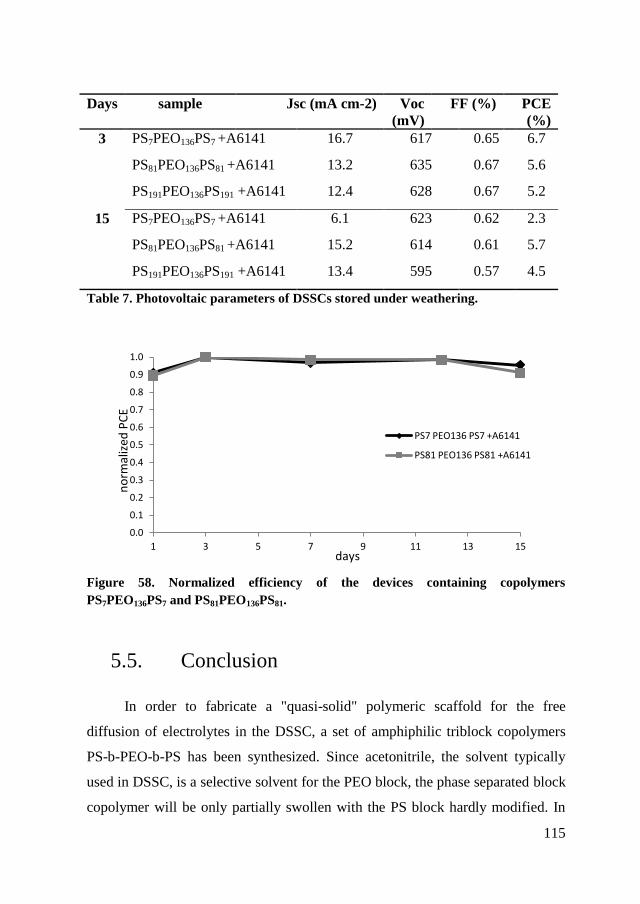
115
Days sample Jsc (mA cm-2) Voc
(mV)
FF (%) PCE
(%)
3 PS7PEO136PS7 +A6141 16.7 617 0.65 6.7
PS81PEO136PS81 +A6141 13.2 635 0.67 5.6
PS191PEO136PS191 +A6141 12.4 628 0.67 5.2
15 PS7PEO136PS7 +A6141 6.1 623 0.62 2.3
PS81PEO136PS81 +A6141 15.2 614 0.61 5.7
PS191PEO136PS191 +A6141 13.4 595 0.57 4.5
Table 7. Photovoltaic parameters of DSSCs stored under weathering.
Figure 58. Normalized efficiency of the devices containing copolymers
PS7PEO136PS7 and PS81PEO136PS81.
5.5. Conclusion
In order to fabricate a "quasi-solid" polymeric scaffold for the free
diffusion of electrolytes in the DSSC, a set of amphiphilic triblock copolymers
PS-b-PEO-b-PS has been synthesized. Since acetonitrile, the solvent typically
used in DSSC, is a selective solvent for the PEO block, the phase separated block
copolymer will be only partially swollen with the PS block hardly modified. In
0.0
0.1
0.2
0.3
0.4
0.5
0.6
0.7
0.8
0.9
1.0
1 3 5 7 9 11 13 15
no
rmal
ized
PC
E
days
PS7 PEO136 PS7 +A6141
PS81 PEO136 PS81 +A6141
116
such a way the PS areas provide dimensional stability and mechanical strength to
the film, meanwhile PEO areas are solubilized by acetonitrile generating liquid-
like pathways for the o the electrolytic system. Three samples, with different
length of the polystyrene block were synthesized with RAFT technique, a
technique able to control the polydispersity of the molecular weights without the
need of metal catalysts. The copolymers showed a decrease of crystallinity of the
polyethylene oxide with the increase of the styrenic block.
DSSC cells have been prepared with the copolymer as polymer matrix for
the electrolytic solution. Measurements of electrical conductivity show
efficiencies of about 6.7 % comparable to that of standard electrolyte DSSC (6.9
%). Moreover the cells are stable with time: a device kept for 15 days under
outdoor conditions with sunlight and climate stress has shown unvaried power
conversion efficiency.
Therefore this new polymeric host electrolytes could be of interest for a
new generation of quasi solid-state DSSC, especially for their high tunability of
physic-chemical and mechanical properties.
117
Chapter 6. Rutile–PS
composite with high dielectric
constant
In this chapter I will present the synthesis of polystyrene grafted on the
surface of TiO2 nanocrystals (rutile polymorph). The obtained core-shell
particles are used for the fabrication of a polymeric nanocomposite endowed with
high dielectric constant.
A brief literature review on the fabrication and characterization of
nanocomposites with potential application as dielectric materials is reported.
Methods based on RAFT polymerization will be discussed with special attention
to the CTAs and reaction conditions used. The morphology of the PS@ TiO2
core shell particles, as dispersed in the polymeric matrix at various
concentrations, will be investigated. Finally the electrical properties of the
devices will be discussed.
In particular, we have verified that the polymer molecules attached to the
surfaces of TiO2 nanoparticles exist in a “brush” regime. By increasing the filler
concentration, the composites show a high dielectric constant, which is ascribed
to the self-assembly of rutile nanoparticles in chestnut-burr aggregates, where a
number of rutile crystals share the lateral faces and form capacitive
microstructures. Moreover, the crystals are separated by a polymer thin layer and
allow a high percolative threshold of 41% v/v filler content, before the formation
of a continuous network responsible for the sudden change of the dielectric
characteristics.
118
6.1. Introduction
High dielectric constant (εr) materials received large interest from a variety
of technological applications such as gate dielectrics,117
electroactive devices118
and charge-storage capacitors.119
Moreover the same materials were investigated
as a base for storage energy devices in electric powered vehicles and pulse power
applications.120
In these contexts, polymeric materials offer a new approach
towards low cost and flexible large area electronic devices,121
although they
require the dielectric properties to be enhanced preserving flexibility.122
In fact
high dielectric constant materials, like titanium dioxide (εr = 31, anatase; εr = 114,
rutile),123
strontium titanate (εr = 150)124
or Ba0.6Sr0.4TiO3 (εr = 4000),125
display
suitable electrical properties but they are not easily processable,126
instead easily
processable systems such as polymers, poly(methyl methacrylate) (εr = 3.12)127
or polystyrene (εr = 2.6)128
typically exhibit low dielectric constants.
In principle, polymer–inorganic composites offer the possibility of
combining the desired electrical properties with flexibility and printability.
Recent studies showed a moderate increase in the dielectric permittivity by
incorporating high εr nanofillers such as titania,129
zirconia,130
alumina,131
and
barium titanate132
into a polymeric matrix. Badheka et al. reported that the
incorporation of nanometric particles of barium titanate (40 vol%) into PS
increases the dielectric constant significantly from 2.6 to 20, but it is still much
lower than the value εr = 1700 of the ceramic phases.133
The dielectric properties of a composite material depend on the
composition (matrix and filler), and particularly on the loading, size, shape and
orientation of the particles.134
Many models described the effective dielectric
properties of materials incorporating particles into a continuous matrix. When the
filler volume within the matrix increases, the formation of a microcapacitor
network occurs.135
These microcapacitors are formed by close conductive filler
particles and thin layers of dielectric in between, contributing to a very large
119
capacitance. Some of the conductive filler particles within the capacitive
microstructures are connected in parallel and some others in series. The
connection in parallel is able to increase the material capacitance.136
The large
capacitance contributed by these microcapacitors induces a significant increase in
the intensity of the local electric field and promotes the accumulation of charge
carriers at the filler–matrix interface. This polarization, known as the Maxwell–
Wagner effect, is responsible for the enhancement of the dielectric constant.
When the density of the microcapacitors becomes very relevant, a
conductive network takes place and a percolation phenomenon appears as a
discharge between the electrodes.137
Based on this model the trend of electrical
properties with the filler concentration shows three regions. The first region is
defined for the low filler amount and is characterized by the gradual rise of the
dielectric constant with concentration. The particles are randomly dispersed and
their contribution to the εr is well predictable by the classical mixing formulae. In
the second region further increase of the filler concentration causes the formation
of microaggregates acting as microcapacitive structures. The consequent
enhancement of the dielectric constant can be described according to eq.
10:138,139,140
(10)
where εr is the relative dielectric constant, c is a constant prefactor, A = (vc -
v)/vc is the reduced volume fraction, v is the volume fraction of the particles, vc is
the percolation threshold and q has the critical value about 1. In order to fit the
experimental data, some authors use the dielectric constant of the matrix as c
prefactor; we will use q, vc and c as adjustable parameters. In the third region, at
high filler concentrations, the microaggregates connect, causing the formation of
the conductive network and the consequent decrease of εr. Between the second
and the third region lies the percolation threshold namely the critical filler
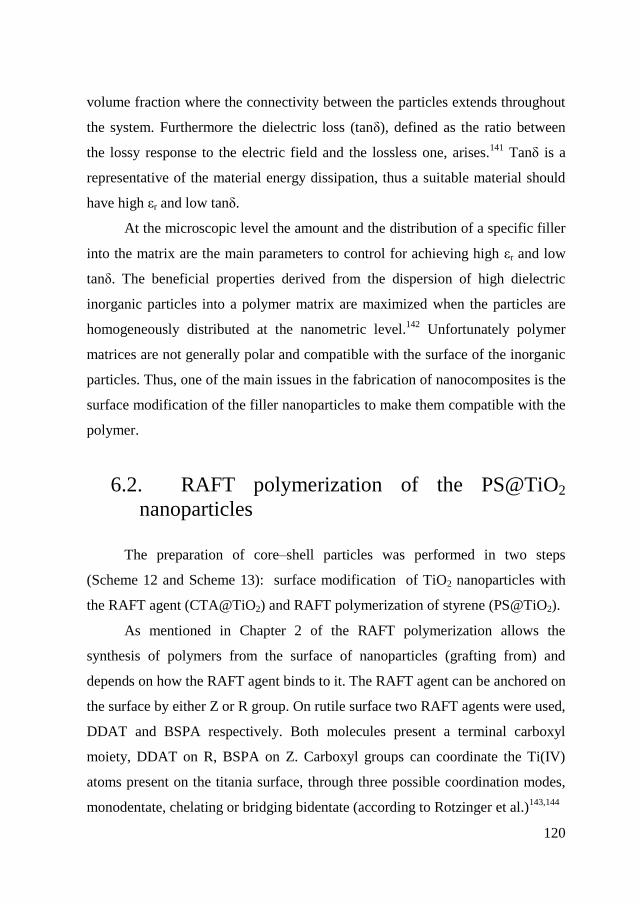
120
volume fraction where the connectivity between the particles extends throughout
the system. Furthermore the dielectric loss (tanδ), defined as the ratio between
the lossy response to the electric field and the lossless one, arises.141
Tanδ is a
representative of the material energy dissipation, thus a suitable material should
have high εr and low tanδ.
At the microscopic level the amount and the distribution of a specific filler
into the matrix are the main parameters to control for achieving high εr and low
tanδ. The beneficial properties derived from the dispersion of high dielectric
inorganic particles into a polymer matrix are maximized when the particles are
homogeneously distributed at the nanometric level.142
Unfortunately polymer
matrices are not generally polar and compatible with the surface of the inorganic
particles. Thus, one of the main issues in the fabrication of nanocomposites is the
surface modification of the filler nanoparticles to make them compatible with the
polymer.
6.2. RAFT polymerization of the PS@TiO2
nanoparticles
The preparation of core–shell particles was performed in two steps
(Scheme 12 and Scheme 13): surface modification of TiO2 nanoparticles with
the RAFT agent (CTA@TiO2) and RAFT polymerization of styrene (PS@TiO2).
As mentioned in Chapter 2 of the RAFT polymerization allows the
synthesis of polymers from the surface of nanoparticles (grafting from) and
depends on how the RAFT agent binds to it. The RAFT agent can be anchored on
the surface by either Z or R group. On rutile surface two RAFT agents were used,
DDAT and BSPA respectively. Both molecules present a terminal carboxyl
moiety, DDAT on R, BSPA on Z. Carboxyl groups can coordinate the Ti(IV)
atoms present on the titania surface, through three possible coordination modes,
monodentate, chelating or bridging bidentate (according to Rotzinger et al.)143,144
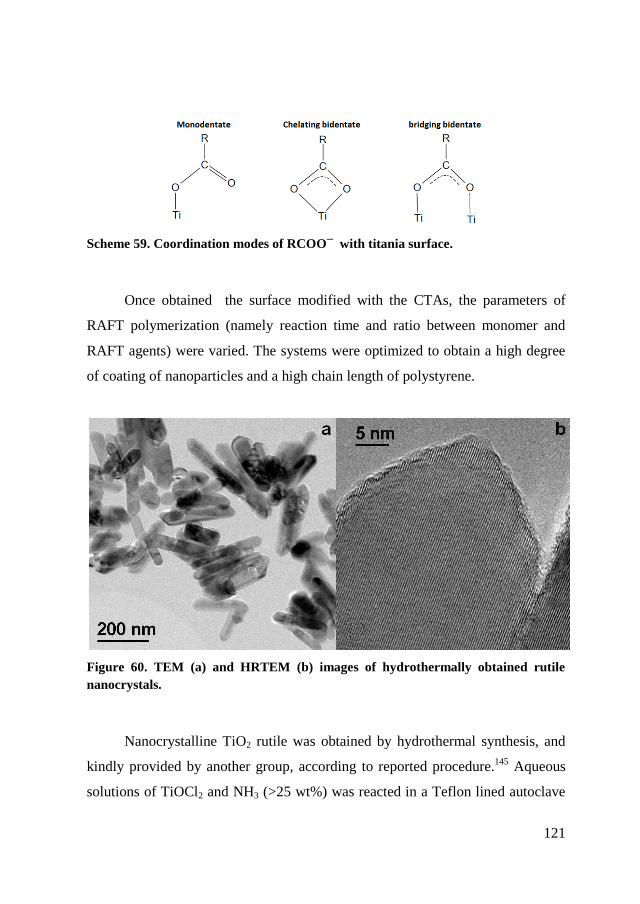
121
Scheme 59. Coordination modes of RCOO─ with titania surface.
Once obtained the surface modified with the CTAs, the parameters of
RAFT polymerization (namely reaction time and ratio between monomer and
RAFT agents) were varied. The systems were optimized to obtain a high degree
of coating of nanoparticles and a high chain length of polystyrene.
Figure 60. TEM (a) and HRTEM (b) images of hydrothermally obtained rutile
nanocrystals.
Nanocrystalline TiO2 rutile was obtained by hydrothermal synthesis, and
kindly provided by another group, according to reported procedure.145
Aqueous
solutions of TiOCl2 and NH3 (>25 wt%) was reacted in a Teflon lined autoclave
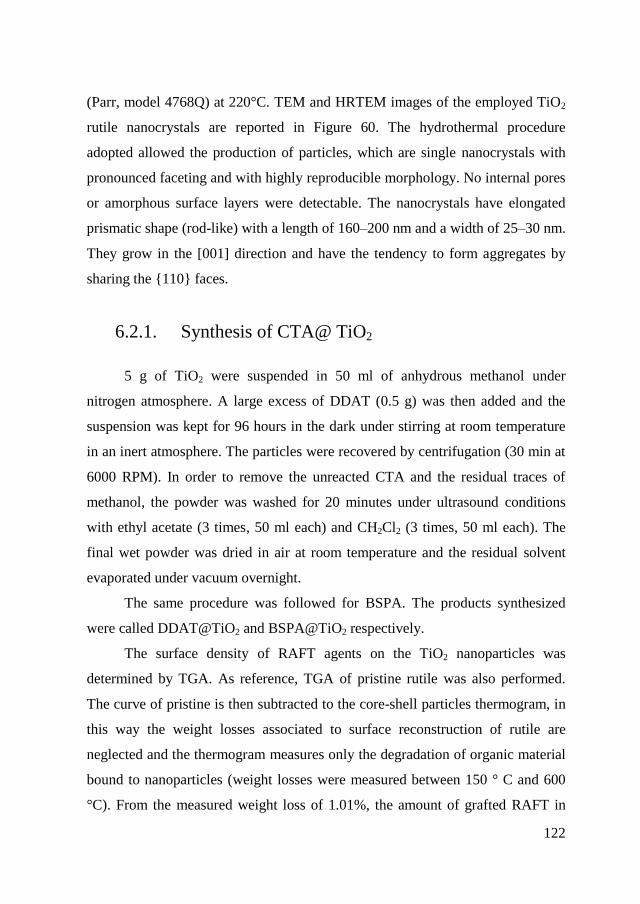
122
(Parr, model 4768Q) at 220°C. TEM and HRTEM images of the employed TiO2
rutile nanocrystals are reported in Figure 60. The hydrothermal procedure
adopted allowed the production of particles, which are single nanocrystals with
pronounced faceting and with highly reproducible morphology. No internal pores
or amorphous surface layers were detectable. The nanocrystals have elongated
prismatic shape (rod-like) with a length of 160–200 nm and a width of 25–30 nm.
They grow in the [001] direction and have the tendency to form aggregates by
sharing the {110} faces.
6.2.1. Synthesis of CTA@ TiO2
5 g of TiO2 were suspended in 50 ml of anhydrous methanol under
nitrogen atmosphere. A large excess of DDAT (0.5 g) was then added and the
suspension was kept for 96 hours in the dark under stirring at room temperature
in an inert atmosphere. The particles were recovered by centrifugation (30 min at
6000 RPM). In order to remove the unreacted CTA and the residual traces of
methanol, the powder was washed for 20 minutes under ultrasound conditions
with ethyl acetate (3 times, 50 ml each) and CH2Cl2 (3 times, 50 ml each). The
final wet powder was dried in air at room temperature and the residual solvent
evaporated under vacuum overnight.
The same procedure was followed for BSPA. The products synthesized
were called DDAT@TiO2 and BSPA@TiO2 respectively.
The surface density of RAFT agents on the TiO2 nanoparticles was
determined by TGA. As reference, TGA of pristine rutile was also performed.
The curve of pristine is then subtracted to the core-shell particles thermogram, in
this way the weight losses associated to surface reconstruction of rutile are
neglected and the thermogram measures only the degradation of organic material
bound to nanoparticles (weight losses were measured between 150 ° C and 600
°C). From the measured weight loss of 1.01%, the amount of grafted RAFT in
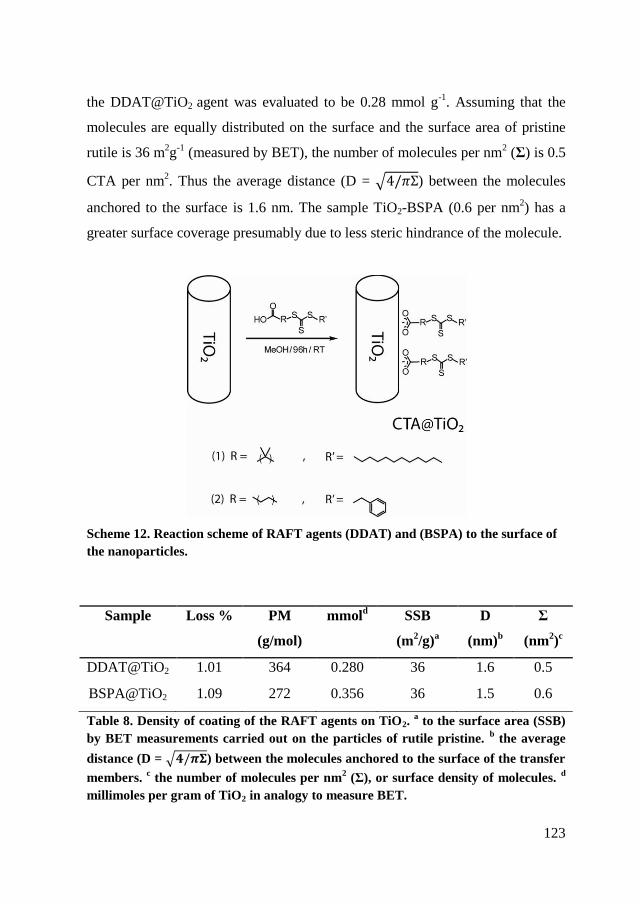
123
the DDAT@TiO2 agent was evaluated to be 0.28 mmol g-1
. Assuming that the
molecules are equally distributed on the surface and the surface area of pristine
rutile is 36 m2g
-1 (measured by BET), the number of molecules per nm
2 (Σ) is 0.5
CTA per nm2. Thus the average distance (D = ) between the molecules
anchored to the surface is 1.6 nm. The sample TiO2-BSPA (0.6 per nm2) has a
greater surface coverage presumably due to less steric hindrance of the molecule.
Scheme 12. Reaction scheme of RAFT agents (DDAT) and (BSPA) to the surface of
the nanoparticles.
Table 8. Density of coating of the RAFT agents on TiO2. a to the surface area (SSB)
by BET measurements carried out on the particles of rutile pristine. b the average
distance (D = ) between the molecules anchored to the surface of the transfer
members. c the number of molecules per nm
2 (Σ), or surface density of molecules.
d
millimoles per gram of TiO2 in analogy to measure BET.
Sample Loss % PM
(g/mol)
mmold SSB
(m2/g)
a
D
(nm)b
Σ
(nm2)
c
DDAT@TiO2 1.01 364 0.280 36 1.6 0.5
BSPA@TiO2 1.09 272 0.356 36 1.5 0.6
124
By ATR-IR measurements, it was determined the coordination of the
carboxylic group of the CTA on the surface of TiO2. In the spectrum of the
samples DDAT@TiO2 and BSPA@TiO2 there are no bands of the carboxyl
group, namely the stretching of the bond C = O at 1705 cm-1
, the deformation of
the bond C-O-H to 1415 cm-1
and the stretching of C-O in 1240 cm-1
. This is
confirmed by the presence of modes of stretching of the carboxylate in the range
1300-1600 cm-1 compared to the spectrum of the pristine rutile. Furthermore, the
presence of modes of stretching of the CH bonds of the chain C12H25 between
2750 cm-1
and 3000 cm-1
and the band at 1450 cm-1
, ensure the formation of the
bond between RAFT agent and nanoparticle, despite the particles have been
applied to repeated washing cycles.
6.2.2. RAFT polymerization of styrene on TiO2
nanoparticles.
The polymerization was performed in pure styrene under argon (Scheme
13). To study the degree of polymerization of polystyrene chains grown on the
surface of the nanoparticles, the reaction time and ratio of concentrations of
styrene [M] and RAFT agent [T] were varied. The syntheses were performed
changing parameters polymerization time and [M]/[T] as shown in table 2.
0.2 g of functionalized particles (DDAT@TiO2), with a resulting transfer
agent net content of 1.18 10-5
mol, were kept at reduced pressure (102 Torr) for
2 hours before the addition of suitable quantity of styrene. The mixture was
homogeneously dispersed by ultrasound treatment, four freeze–pump–thaw
cycles were performed to remove the oxygen. The polymerization reaction was
conducted at 110 °C for 96 h under a nitrogen atmosphere and was interrupted by
quenching the mixture in liquid N2.
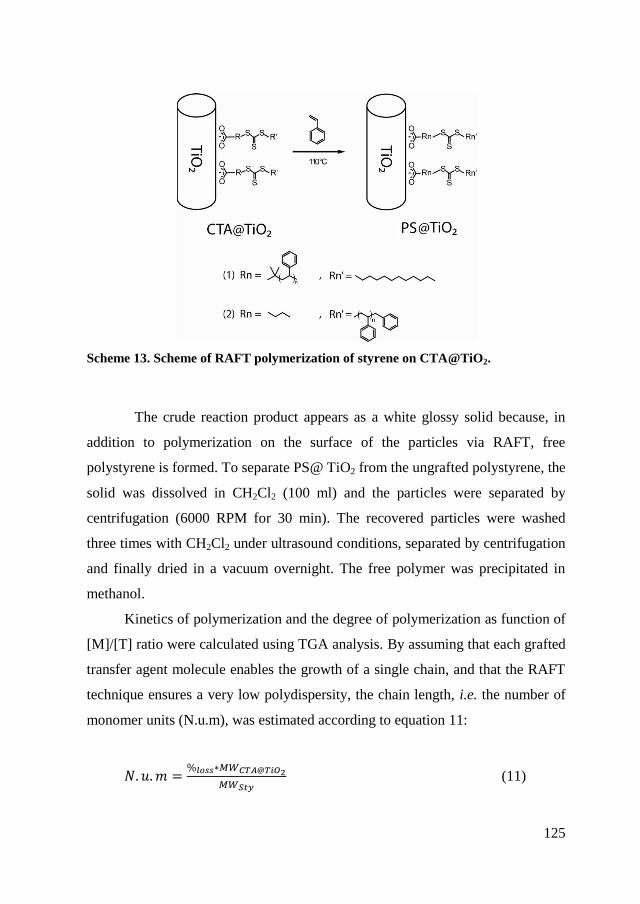
125
Scheme 13. Scheme of RAFT polymerization of styrene on CTA@TiO2.
The crude reaction product appears as a white glossy solid because, in
addition to polymerization on the surface of the particles via RAFT, free
polystyrene is formed. To separate PS@ TiO2 from the ungrafted polystyrene, the
solid was dissolved in CH2Cl2 (100 ml) and the particles were separated by
centrifugation (6000 RPM for 30 min). The recovered particles were washed
three times with CH2Cl2 under ultrasound conditions, separated by centrifugation
and finally dried in a vacuum overnight. The free polymer was precipitated in
methanol.
Kinetics of polymerization and the degree of polymerization as function of
[M]/[T] ratio were calculated using TGA analysis. By assuming that each grafted
transfer agent molecule enables the growth of a single chain, and that the RAFT
technique ensures a very low polydispersity, the chain length, i.e. the number of
monomer units (N.u.m), was estimated according to equation 11:
(11)
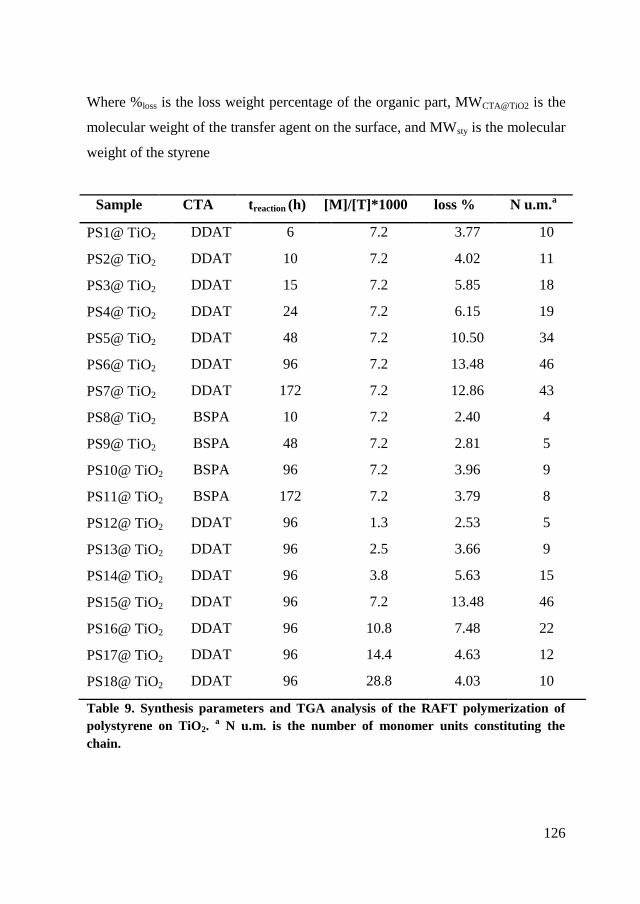
126
Where %loss is the loss weight percentage of the organic part, MWCTA@TiO2 is the
molecular weight of the transfer agent on the surface, and MWsty is the molecular
weight of the styrene
Sample CTA treaction (h) [M]/[T]*1000 loss % N u.m.a
PS1@ TiO2 DDAT 6 7.2 3.77 10
PS2@ TiO2 DDAT 10 7.2 4.02 11
PS3@ TiO2 DDAT 15 7.2 5.85 18
PS4@ TiO2 DDAT 24 7.2 6.15 19
PS5@ TiO2 DDAT 48 7.2 10.50 34
PS6@ TiO2 DDAT 96 7.2 13.48 46
PS7@ TiO2 DDAT 172 7.2 12.86 43
PS8@ TiO2 BSPA 10 7.2 2.40 4
PS9@ TiO2 BSPA 48 7.2 2.81 5
PS10@ TiO2 BSPA 96 7.2 3.96 9
PS11@ TiO2 BSPA 172 7.2 3.79 8
PS12@ TiO2 DDAT 96 1.3 2.53 5
PS13@ TiO2 DDAT 96 2.5 3.66 9
PS14@ TiO2 DDAT 96 3.8 5.63 15
PS15@ TiO2 DDAT 96 7.2 13.48 46
PS16@ TiO2 DDAT 96 10.8 7.48 22
PS17@ TiO2 DDAT 96 14.4 4.63 12
PS18@ TiO2 DDAT 96 28.8 4.03 10
Table 9. Synthesis parameters and TGA analysis of the RAFT polymerization of
polystyrene on TiO2. a N u.m. is the number of monomer units constituting the
chain.
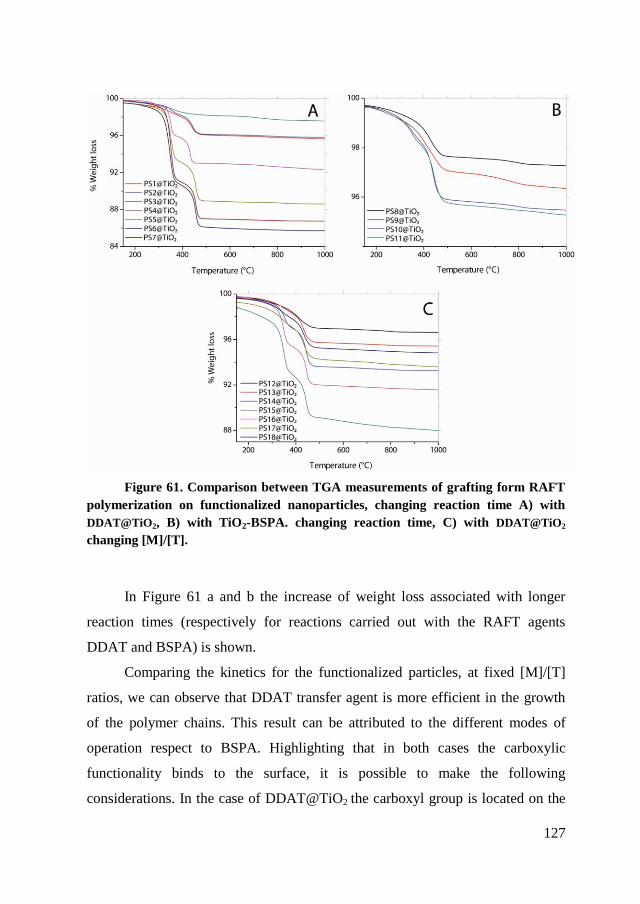
127
Figure 61. Comparison between TGA measurements of grafting form RAFT
polymerization on functionalized nanoparticles, changing reaction time A) with
DDAT@TiO2, B) with TiO2-BSPA. changing reaction time, C) with DDAT@TiO2
changing [M]/[T].
In Figure 61 a and b the increase of weight loss associated with longer
reaction times (respectively for reactions carried out with the RAFT agents
DDAT and BSPA) is shown.
Comparing the kinetics for the functionalized particles, at fixed [M]/[T]
ratios, we can observe that DDAT transfer agent is more efficient in the growth
of the polymer chains. This result can be attributed to the different modes of
operation respect to BSPA. Highlighting that in both cases the carboxylic
functionality binds to the surface, it is possible to make the following
considerations. In the case of DDAT@TiO2 the carboxyl group is located on the
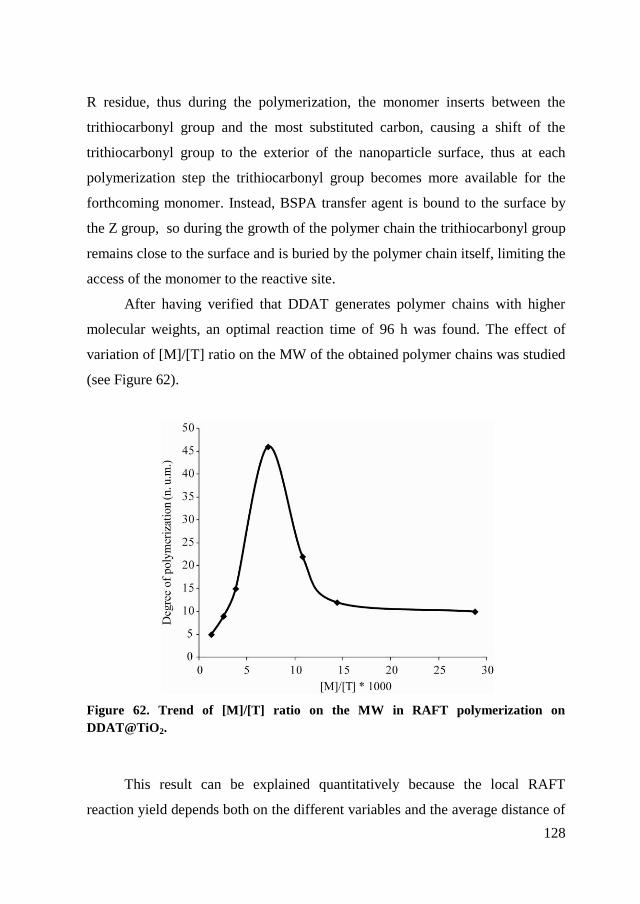
128
R residue, thus during the polymerization, the monomer inserts between the
trithiocarbonyl group and the most substituted carbon, causing a shift of the
trithiocarbonyl group to the exterior of the nanoparticle surface, thus at each
polymerization step the trithiocarbonyl group becomes more available for the
forthcoming monomer. Instead, BSPA transfer agent is bound to the surface by
the Z group, so during the growth of the polymer chain the trithiocarbonyl group
remains close to the surface and is buried by the polymer chain itself, limiting the
access of the monomer to the reactive site.
After having verified that DDAT generates polymer chains with higher
molecular weights, an optimal reaction time of 96 h was found. The effect of
variation of [M]/[T] ratio on the MW of the obtained polymer chains was studied
(see Figure 62).
Figure 62. Trend of [M]/[T] ratio on the MW in RAFT polymerization on
DDAT@TiO2.
This result can be explained quantitatively because the local RAFT
reaction yield depends both on the different variables and the average distance of
129
the particles. The use of ultrasound before the reaction and magnetic agitation
during the same provides, in principle, an optimum dispersion of the
nanoparticles in styrene. The effectiveness of the polymerization is affected by
the distance of the sites of polymerization and by the mobility of radicals. At
high monomer concentration, since the polymerization is thermally activated, the
number of growing polymer chains of free polystyrene increases, causing a raise
of the viscosity and leading finally to well-known “cage effect,” the nanoparticles
cannot be reached by the monomer anymore: the degree of polymerization,
remains constant after a certain [M]/[T] ratio.
Through GPC (Table 10) analysis we can investigate the nature of the
polymerization process involving free polystyrene. The polymer is dusty and
does not have the typical pale yellow color which characterizes a PS grew up
with RAFT technique (given by the function trithiocarbonyl). High
polydispersity were obtained especially in the samples with shorter chains and
where the process of polymerization was slowed down (use BSPA@TiO2 and
high reaction times).
In order to fabricate the nanocomposite, the conditions that lead to sample
with more extended polystyrene chains, TiO2-PS15, are used to produce a large
amount of surface modified titania. 4.5 g of DDAT@TiO2 were synthesized and
used for the RAFT polymerization of 104 ml styrene ([M] / [T] = 7200) at 110
°C during 96 hours. After purification, the sample was characterized (PS@
TiO2).
In Figure 63, the comparison of the TGA thermograms of synthesized
samples is shown. In PS@ TiO2 nanoparticles, the weight loss attributed to the
polymer grafted on the TiO2 resulted to be 12.2 ± 0.2%. Holding to the same
assumptions as above, the chain length was estimated in 42 styrene repeat units.
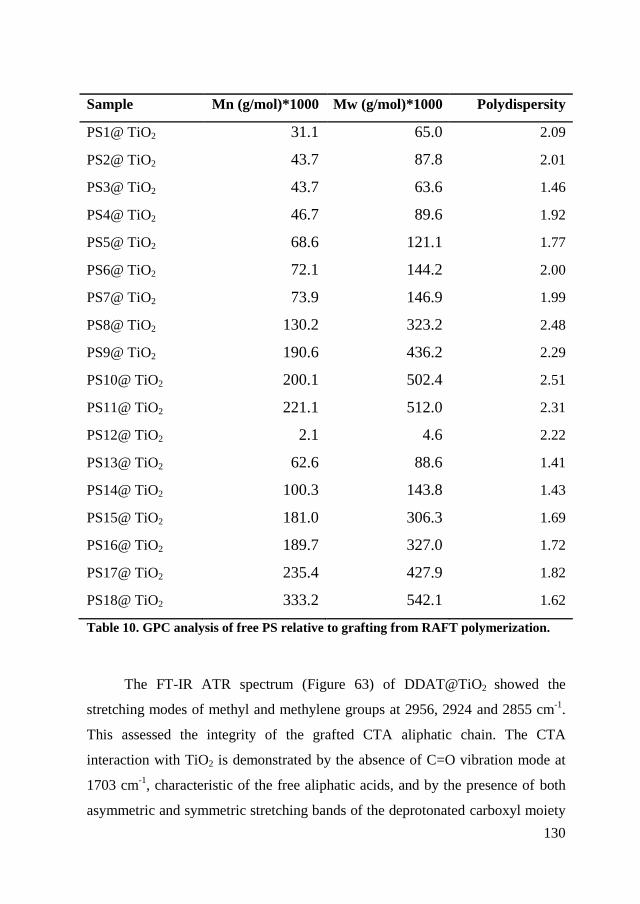
130
Sample Mn (g/mol)*1000 Mw (g/mol)*1000 Polydispersity
PS1@ TiO2 31.1 65.0 2.09
PS2@ TiO2 43.7 87.8 2.01
PS3@ TiO2 43.7 63.6 1.46
PS4@ TiO2 46.7 89.6 1.92
PS5@ TiO2 68.6 121.1 1.77
PS6@ TiO2 72.1 144.2 2.00
PS7@ TiO2 73.9 146.9 1.99
PS8@ TiO2 130.2 323.2 2.48
PS9@ TiO2 190.6 436.2 2.29
PS10@ TiO2 200.1 502.4 2.51
PS11@ TiO2 221.1 512.0 2.31
PS12@ TiO2 2.1 4.6 2.22
PS13@ TiO2 62.6 88.6 1.41
PS14@ TiO2 100.3 143.8 1.43
PS15@ TiO2 181.0 306.3 1.69
PS16@ TiO2 189.7 327.0 1.72
PS17@ TiO2 235.4 427.9 1.82
PS18@ TiO2 333.2 542.1 1.62
Table 10. GPC analysis of free PS relative to grafting from RAFT polymerization.
The FT-IR ATR spectrum (Figure 63) of DDAT@TiO2 showed the
stretching modes of methyl and methylene groups at 2956, 2924 and 2855 cm-1
.
This assessed the integrity of the grafted CTA aliphatic chain. The CTA
interaction with TiO2 is demonstrated by the absence of C=O vibration mode at
1703 cm-1
, characteristic of the free aliphatic acids, and by the presence of both
asymmetric and symmetric stretching bands of the deprotonated carboxyl moiety
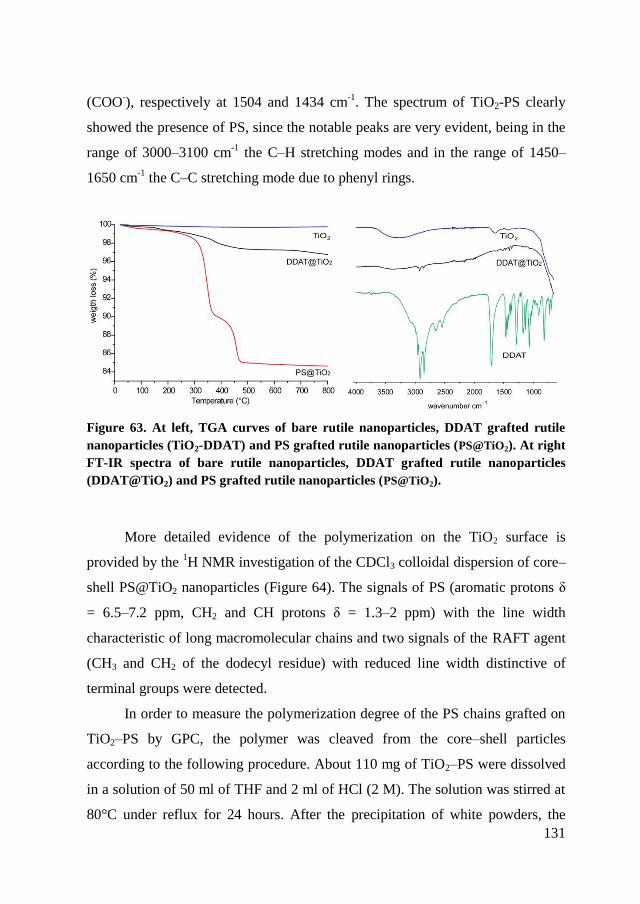
131
(COO-), respectively at 1504 and 1434 cm
-1. The spectrum of TiO2-PS clearly
showed the presence of PS, since the notable peaks are very evident, being in the
range of 3000–3100 cm-1
the C–H stretching modes and in the range of 1450–
1650 cm-1
the C–C stretching mode due to phenyl rings.
Figure 63. At left, TGA curves of bare rutile nanoparticles, DDAT grafted rutile
nanoparticles (TiO2-DDAT) and PS grafted rutile nanoparticles (PS@TiO2). At right
FT-IR spectra of bare rutile nanoparticles, DDAT grafted rutile nanoparticles
(DDAT@TiO2) and PS grafted rutile nanoparticles (PS@TiO2).
More detailed evidence of the polymerization on the TiO2 surface is
provided by the 1H NMR investigation of the CDCl3 colloidal dispersion of core–
shell PS@TiO2 nanoparticles (Figure 64). The signals of PS (aromatic protons δ
= 6.5–7.2 ppm, CH2 and CH protons δ = 1.3–2 ppm) with the line width
characteristic of long macromolecular chains and two signals of the RAFT agent
(CH3 and CH2 of the dodecyl residue) with reduced line width distinctive of
terminal groups were detected.
In order to measure the polymerization degree of the PS chains grafted on
TiO2–PS by GPC, the polymer was cleaved from the core–shell particles
according to the following procedure. About 110 mg of TiO2–PS were dissolved
in a solution of 50 ml of THF and 2 ml of HCl (2 M). The solution was stirred at
80°C under reflux for 24 hours. After the precipitation of white powders, the
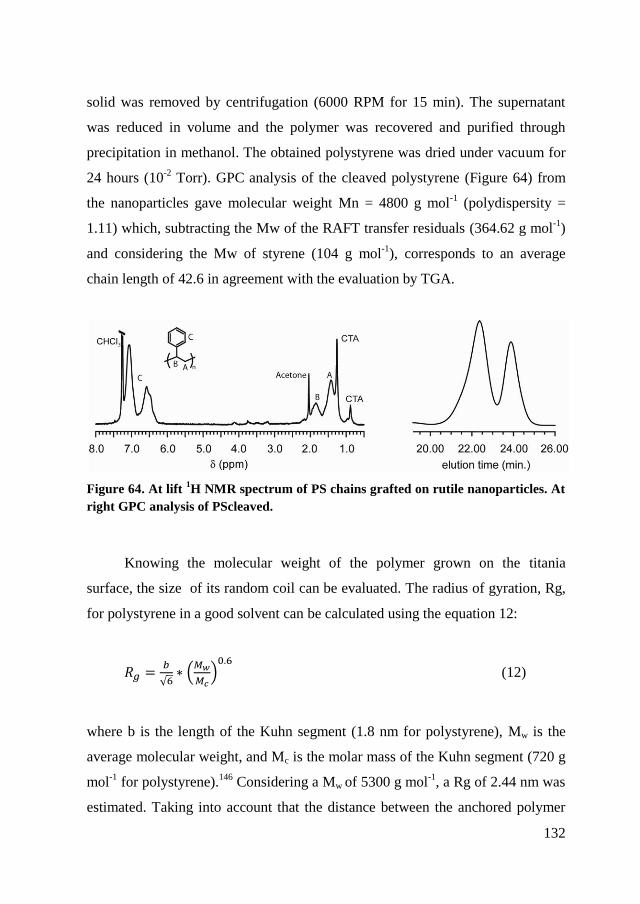
132
solid was removed by centrifugation (6000 RPM for 15 min). The supernatant
was reduced in volume and the polymer was recovered and purified through
precipitation in methanol. The obtained polystyrene was dried under vacuum for
24 hours (10-2
Torr). GPC analysis of the cleaved polystyrene (Figure 64) from
the nanoparticles gave molecular weight Mn = 4800 g mol-1
(polydispersity =
1.11) which, subtracting the Mw of the RAFT transfer residuals (364.62 g mol-1
)
and considering the Mw of styrene (104 g mol-1
), corresponds to an average
chain length of 42.6 in agreement with the evaluation by TGA.
Figure 64. At lift 1H NMR spectrum of PS chains grafted on rutile nanoparticles. At
right GPC analysis of PScleaved.
Knowing the molecular weight of the polymer grown on the titania
surface, the size of its random coil can be evaluated. The radius of gyration, Rg,
for polystyrene in a good solvent can be calculated using the equation 12:
(12)
where b is the length of the Kuhn segment (1.8 nm for polystyrene), Mw is the
average molecular weight, and Mc is the molar mass of the Kuhn segment (720 g
mol-1
for polystyrene).146
Considering a Mw of 5300 g mol-1
, a Rg of 2.44 nm was
estimated. Taking into account that the distance between the anchored polymer
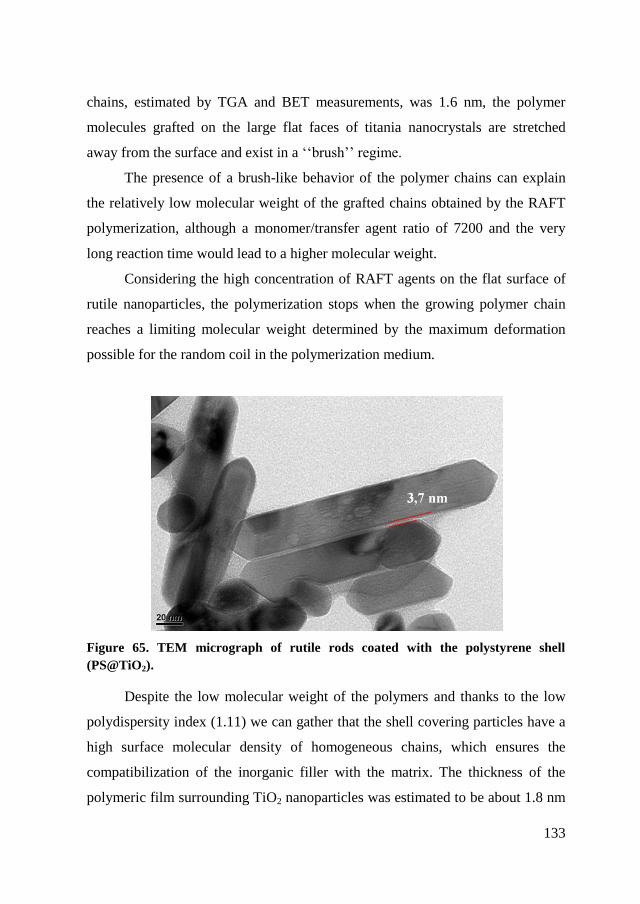
133
chains, estimated by TGA and BET measurements, was 1.6 nm, the polymer
molecules grafted on the large flat faces of titania nanocrystals are stretched
away from the surface and exist in a ‘‘brush’’ regime.
The presence of a brush-like behavior of the polymer chains can explain
the relatively low molecular weight of the grafted chains obtained by the RAFT
polymerization, although a monomer/transfer agent ratio of 7200 and the very
long reaction time would lead to a higher molecular weight.
Considering the high concentration of RAFT agents on the flat surface of
rutile nanoparticles, the polymerization stops when the growing polymer chain
reaches a limiting molecular weight determined by the maximum deformation
possible for the random coil in the polymerization medium.
Figure 65. TEM micrograph of rutile rods coated with the polystyrene shell
(PS@TiO2).
Despite the low molecular weight of the polymers and thanks to the low
polydispersity index (1.11) we can gather that the shell covering particles have a
high surface molecular density of homogeneous chains, which ensures the
compatibilization of the inorganic filler with the matrix. The thickness of the
polymeric film surrounding TiO2 nanoparticles was estimated to be about 1.8 nm
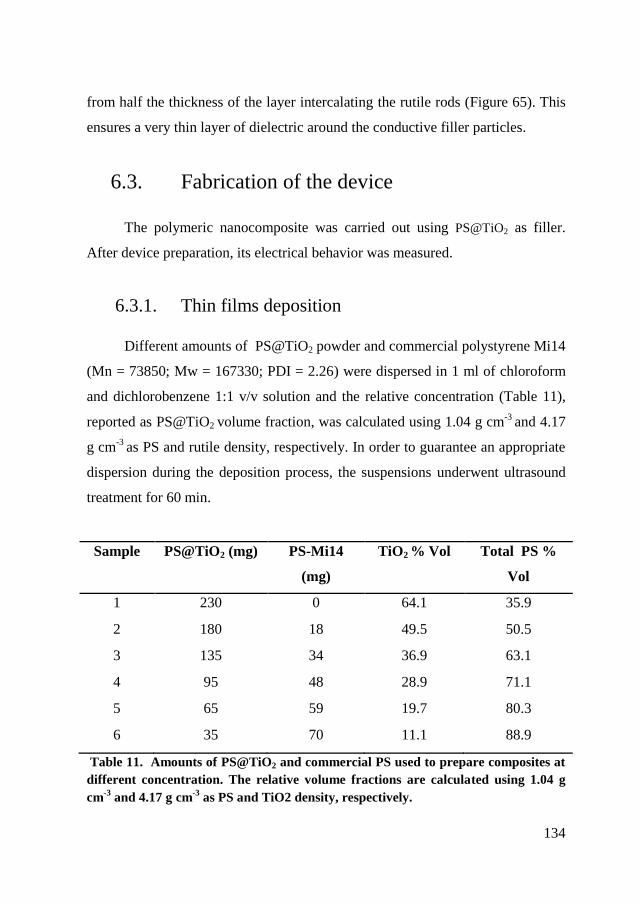
134
from half the thickness of the layer intercalating the rutile rods (Figure 65). This
ensures a very thin layer of dielectric around the conductive filler particles.
6.3. Fabrication of the device
The polymeric nanocomposite was carried out using PS@TiO2 as filler.
After device preparation, its electrical behavior was measured.
6.3.1. Thin films deposition
Different amounts of PS@TiO2 powder and commercial polystyrene Mi14
(Mn = 73850; Mw = 167330; PDI = 2.26) were dispersed in 1 ml of chloroform
and dichlorobenzene 1:1 v/v solution and the relative concentration (Table 11),
reported as PS@TiO2 volume fraction, was calculated using 1.04 g cm-3
and 4.17
g cm-3
as PS and rutile density, respectively. In order to guarantee an appropriate
dispersion during the deposition process, the suspensions underwent ultrasound
treatment for 60 min.
Table 11. Amounts of PS@TiO2 and commercial PS used to prepare composites at
different concentration. The relative volume fractions are calculated using 1.04 g
cm-3
and 4.17 g cm-3
as PS and TiO2 density, respectively.
Sample PS@TiO2 (mg) PS-Mi14
(mg)
TiO2 % Vol
Total PS %
Vol
1 230 0 64.1 35.9
2 180 18 49.5 50.5
3 135 34 36.9 63.1
4 95 48 28.9 71.1
5 65 59 19.7 80.3
6 35 70 11.1 88.9
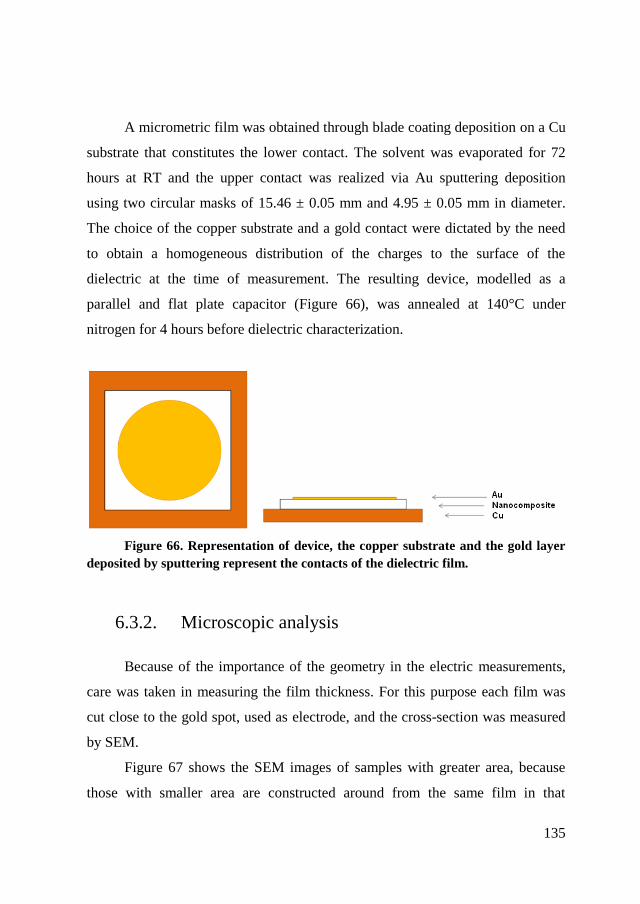
135
A micrometric film was obtained through blade coating deposition on a Cu
substrate that constitutes the lower contact. The solvent was evaporated for 72
hours at RT and the upper contact was realized via Au sputtering deposition
using two circular masks of 15.46 ± 0.05 mm and 4.95 ± 0.05 mm in diameter.
The choice of the copper substrate and a gold contact were dictated by the need
to obtain a homogeneous distribution of the charges to the surface of the
dielectric at the time of measurement. The resulting device, modelled as a
parallel and flat plate capacitor (Figure 66), was annealed at 140°C under
nitrogen for 4 hours before dielectric characterization.
Figure 66. Representation of device, the copper substrate and the gold layer
deposited by sputtering represent the contacts of the dielectric film.
6.3.2. Microscopic analysis
Because of the importance of the geometry in the electric measurements,
care was taken in measuring the film thickness. For this purpose each film was
cut close to the gold spot, used as electrode, and the cross-section was measured
by SEM.
Figure 67 shows the SEM images of samples with greater area, because
those with smaller area are constructed around from the same film in that
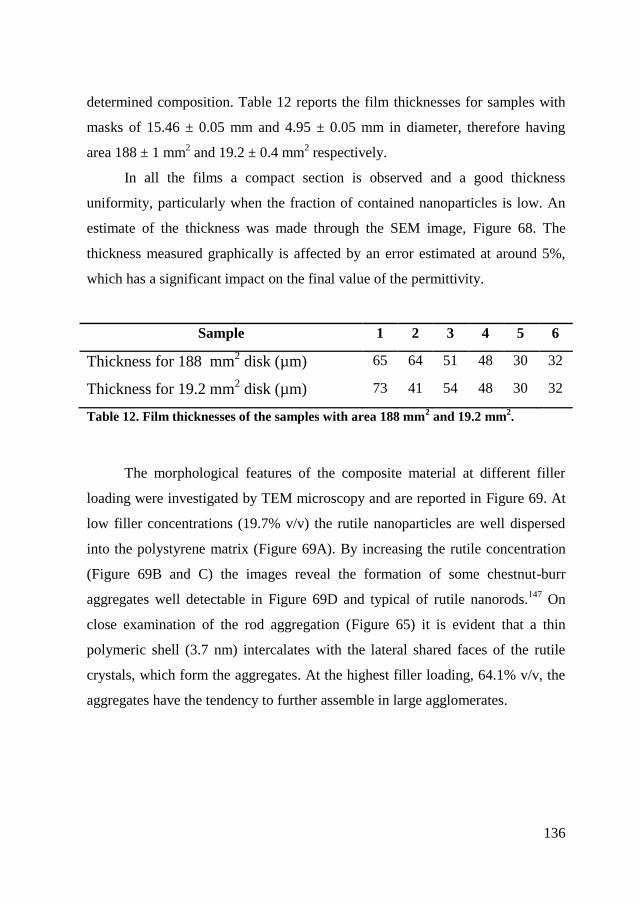
136
determined composition. Table 12 reports the film thicknesses for samples with
masks of 15.46 ± 0.05 mm and 4.95 ± 0.05 mm in diameter, therefore having
area 188 ± 1 mm2 and 19.2 ± 0.4 mm
2 respectively.
In all the films a compact section is observed and a good thickness
uniformity, particularly when the fraction of contained nanoparticles is low. An
estimate of the thickness was made through the SEM image, Figure 68. The
thickness measured graphically is affected by an error estimated at around 5%,
which has a significant impact on the final value of the permittivity.
Sample 1 2 3 4 5 6
Thickness for 188 mm2 disk (µm) 65 64 51 48 30 32
Thickness for 19.2 mm2 disk (µm) 73 41 54 48 30 32
Table 12. Film thicknesses of the samples with area 188 mm2 and 19.2 mm
2.
The morphological features of the composite material at different filler
loading were investigated by TEM microscopy and are reported in Figure 69. At
low filler concentrations (19.7% v/v) the rutile nanoparticles are well dispersed
into the polystyrene matrix (Figure 69A). By increasing the rutile concentration
(Figure 69B and C) the images reveal the formation of some chestnut-burr
aggregates well detectable in Figure 69D and typical of rutile nanorods.147
On
close examination of the rod aggregation (Figure 65) it is evident that a thin
polymeric shell (3.7 nm) intercalates with the lateral shared faces of the rutile
crystals, which form the aggregates. At the highest filler loading, 64.1% v/v, the
aggregates have the tendency to further assemble in large agglomerates.
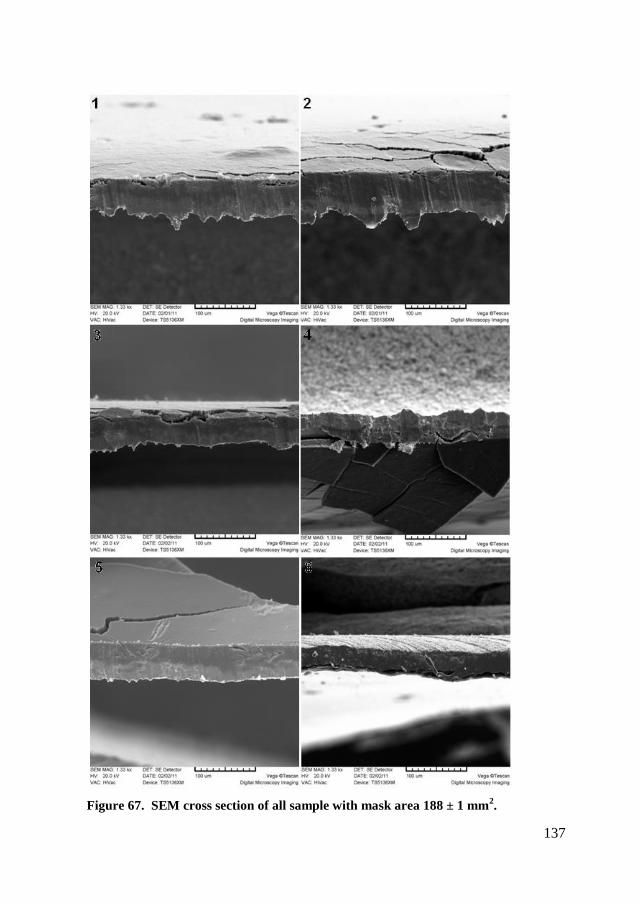
137
Figure 67. SEM cross section of all sample with mask area 188 ± 1 mm2.
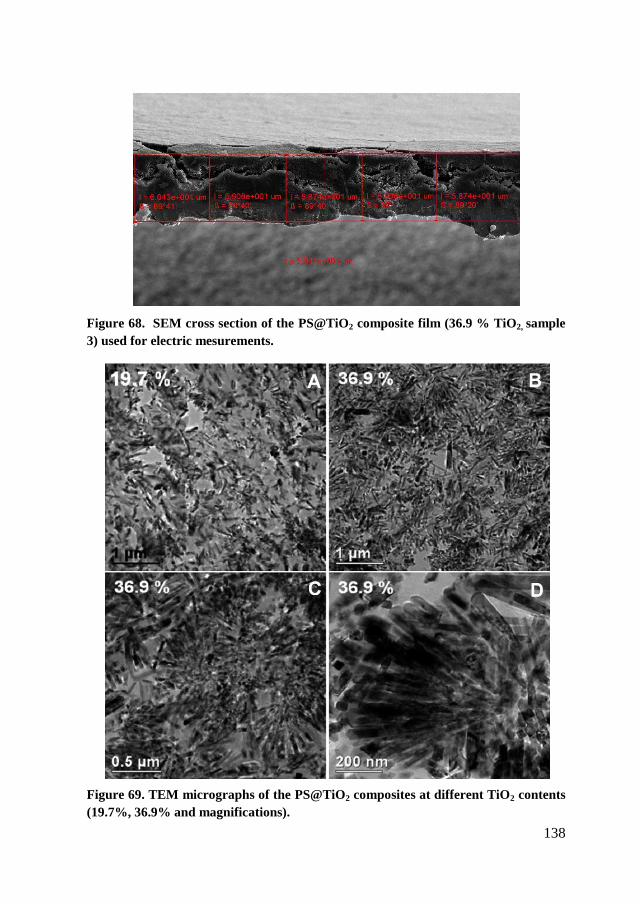
138
Figure 68. SEM cross section of the PS@TiO2 composite film (36.9 % TiO2, sample
3) used for electric mesurements.
Figure 69. TEM micrographs of the PS@TiO2 composites at different TiO2 contents
(19.7%, 36.9% and magnifications).
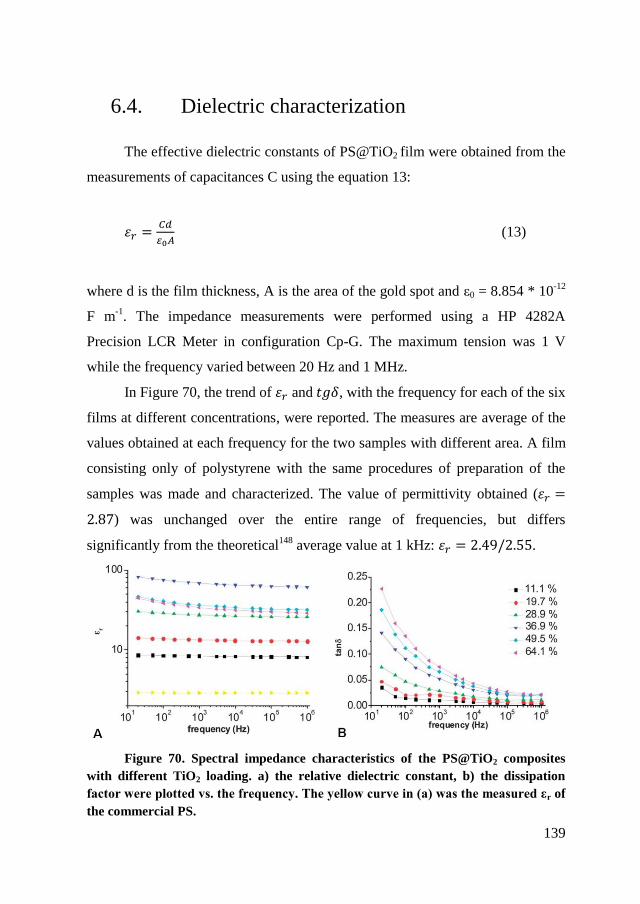
139
6.4. Dielectric characterization
The effective dielectric constants of PS@TiO2 film were obtained from the
measurements of capacitances C using the equation 13:
(13)
where d is the film thickness, A is the area of the gold spot and ε0 = 8.854 * 10-12
F m-1
. The impedance measurements were performed using a HP 4282A
Precision LCR Meter in configuration Cp-G. The maximum tension was 1 V
while the frequency varied between 20 Hz and 1 MHz.
In Figure 70, the trend of and , with the frequency for each of the six
films at different concentrations, were reported. The measures are average of the
values obtained at each frequency for the two samples with different area. A film
consisting only of polystyrene with the same procedures of preparation of the
samples was made and characterized. The value of permittivity obtained (
) was unchanged over the entire range of frequencies, but differs
significantly from the theoretical148
average value at 1 kHz: .
Figure 70. Spectral impedance characteristics of the PS@TiO2 composites
with different TiO2 loading. a) the relative dielectric constant, b) the dissipation
factor were plotted vs. the frequency. The yellow curve in (a) was the measured εr of
the commercial PS.
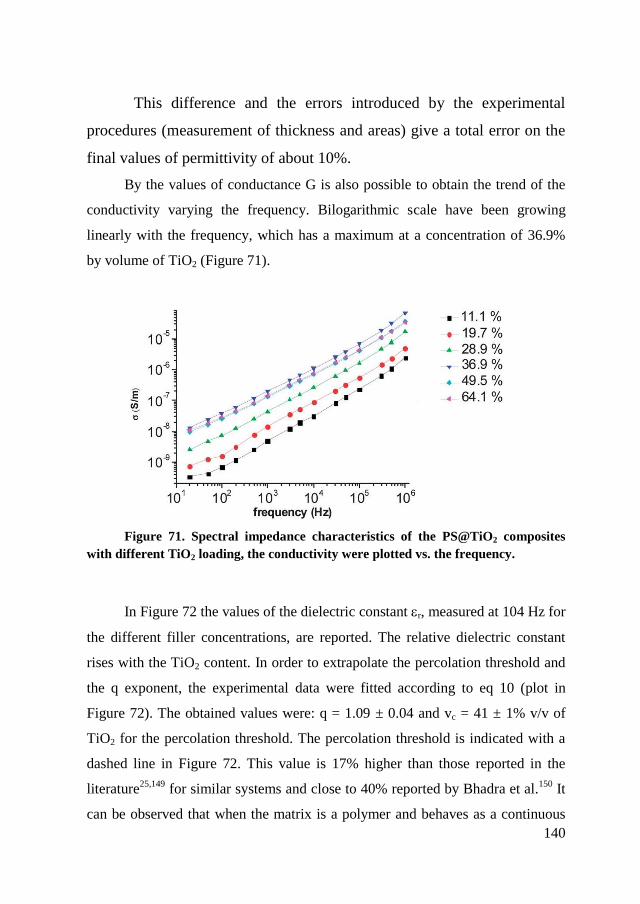
140
This difference and the errors introduced by the experimental
procedures (measurement of thickness and areas) give a total error on the
final values of permittivity of about 10%.
By the values of conductance G is also possible to obtain the trend of the
conductivity varying the frequency. Bilogarithmic scale have been growing
linearly with the frequency, which has a maximum at a concentration of 36.9%
by volume of TiO2 (Figure 71).
Figure 71. Spectral impedance characteristics of the PS@TiO2 composites
with different TiO2 loading, the conductivity were plotted vs. the frequency.
In Figure 72 the values of the dielectric constant r, measured at 104 Hz for
the different filler concentrations, are reported. The relative dielectric constant
rises with the TiO2 content. In order to extrapolate the percolation threshold and
the q exponent, the experimental data were fitted according to eq 10 (plot in
Figure 72). The obtained values were: q = 1.09 ± 0.04 and vc = 41 ± 1% v/v of
TiO2 for the percolation threshold. The percolation threshold is indicated with a
dashed line in Figure 72. This value is 17% higher than those reported in the
literature25,149
for similar systems and close to 40% reported by Bhadra et al.150
It
can be observed that when the matrix is a polymer and behaves as a continuous
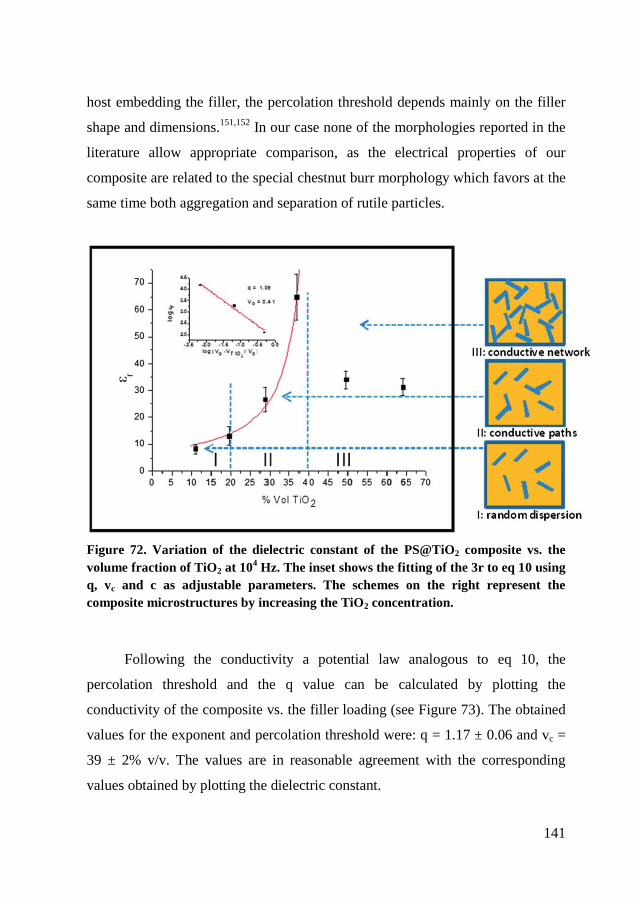
141
host embedding the filler, the percolation threshold depends mainly on the filler
shape and dimensions.151,152
In our case none of the morphologies reported in the
literature allow appropriate comparison, as the electrical properties of our
composite are related to the special chestnut burr morphology which favors at the
same time both aggregation and separation of rutile particles.
Figure 72. Variation of the dielectric constant of the PS@TiO2 composite vs. the
volume fraction of TiO2 at 104 Hz. The inset shows the fitting of the 3r to eq 10 using
q, vc and c as adjustable parameters. The schemes on the right represent the
composite microstructures by increasing the TiO2 concentration.
Following the conductivity a potential law analogous to eq 10, the
percolation threshold and the q value can be calculated by plotting the
conductivity of the composite vs. the filler loading (see Figure 73). The obtained
values for the exponent and percolation threshold were: q = 1.17 ± 0.06 and vc =
39 ± 2% v/v. The values are in reasonable agreement with the corresponding
values obtained by plotting the dielectric constant.
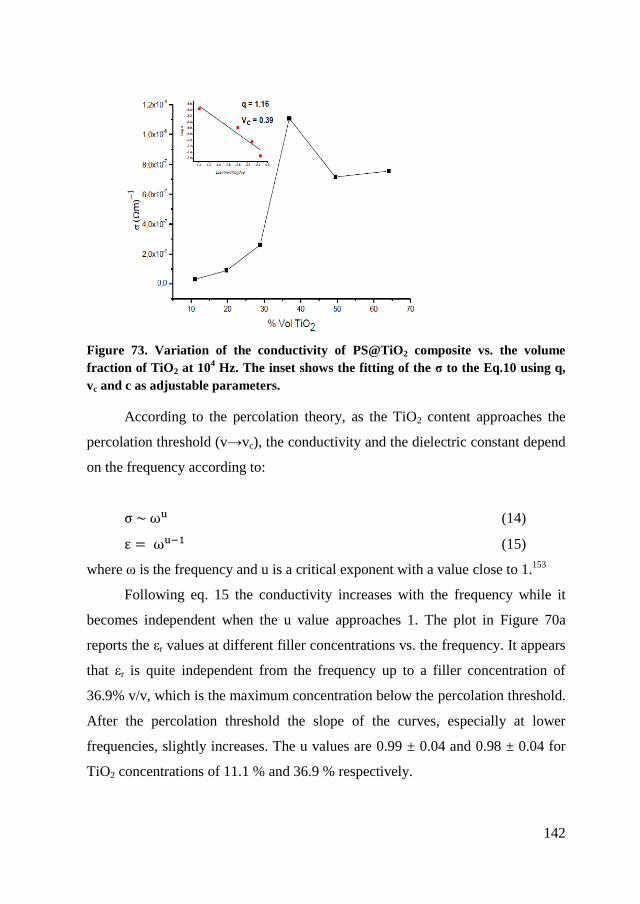
142
Figure 73. Variation of the conductivity of PS@TiO2 composite vs. the volume
fraction of TiO2 at 104 Hz. The inset shows the fitting of the σ to the Eq.10 using q,
vc and c as adjustable parameters.
According to the percolation theory, as the TiO2 content approaches the
percolation threshold (v→vc), the conductivity and the dielectric constant depend
on the frequency according to:
(14)
(15)
where ω is the frequency and u is a critical exponent with a value close to 1.153
Following eq. 15 the conductivity increases with the frequency while it
becomes independent when the u value approaches 1. The plot in Figure 70a
reports the εr values at different filler concentrations vs. the frequency. It appears
that εr is quite independent from the frequency up to a filler concentration of
36.9% v/v, which is the maximum concentration below the percolation threshold.
After the percolation threshold the slope of the curves, especially at lower
frequencies, slightly increases. The u values are 0.99 ± 0.04 and 0.98 ± 0.04 for
TiO2 concentrations of 11.1 % and 36.9 % respectively.
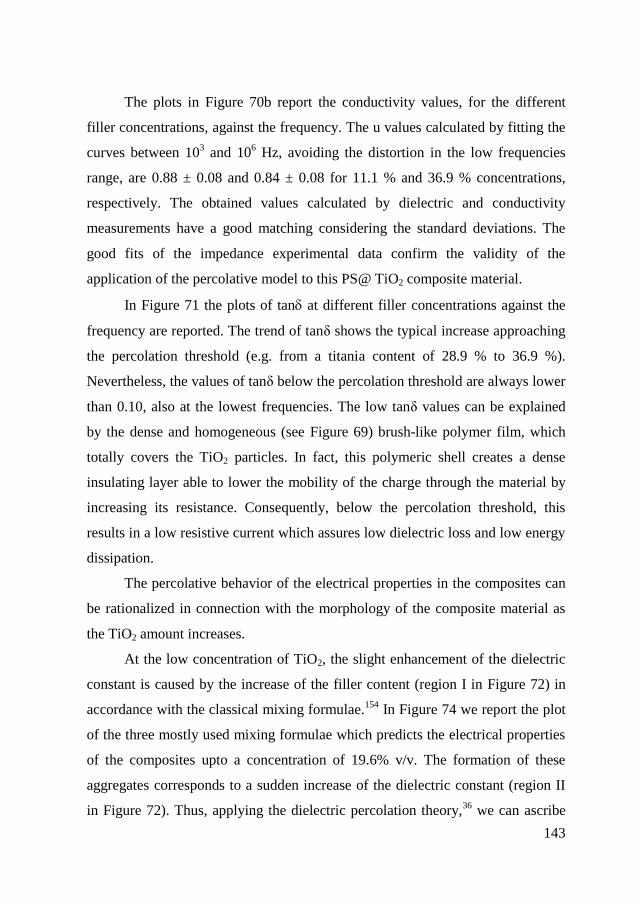
143
The plots in Figure 70b report the conductivity values, for the different
filler concentrations, against the frequency. The u values calculated by fitting the
curves between 103 and 10
6 Hz, avoiding the distortion in the low frequencies
range, are 0.88 ± 0.08 and 0.84 ± 0.08 for 11.1 % and 36.9 % concentrations,
respectively. The obtained values calculated by dielectric and conductivity
measurements have a good matching considering the standard deviations. The
good fits of the impedance experimental data confirm the validity of the
application of the percolative model to this PS@ TiO2 composite material.
In Figure 71 the plots of tan at different filler concentrations against the
frequency are reported. The trend of tanδ shows the typical increase approaching
the percolation threshold (e.g. from a titania content of 28.9 % to 36.9 %).
Nevertheless, the values of tanδ below the percolation threshold are always lower
than 0.10, also at the lowest frequencies. The low tanδ values can be explained
by the dense and homogeneous (see Figure 69) brush-like polymer film, which
totally covers the TiO2 particles. In fact, this polymeric shell creates a dense
insulating layer able to lower the mobility of the charge through the material by
increasing its resistance. Consequently, below the percolation threshold, this
results in a low resistive current which assures low dielectric loss and low energy
dissipation.
The percolative behavior of the electrical properties in the composites can
be rationalized in connection with the morphology of the composite material as
the TiO2 amount increases.
At the low concentration of TiO2, the slight enhancement of the dielectric
constant is caused by the increase of the filler content (region I in Figure 72) in
accordance with the classical mixing formulae.154
In Figure 74 we report the plot
of the three mostly used mixing formulae which predicts the electrical properties
of the composites upto a concentration of 19.6% v/v. The formation of these
aggregates corresponds to a sudden increase of the dielectric constant (region II
in Figure 72). Thus, applying the dielectric percolation theory,36
we can ascribe
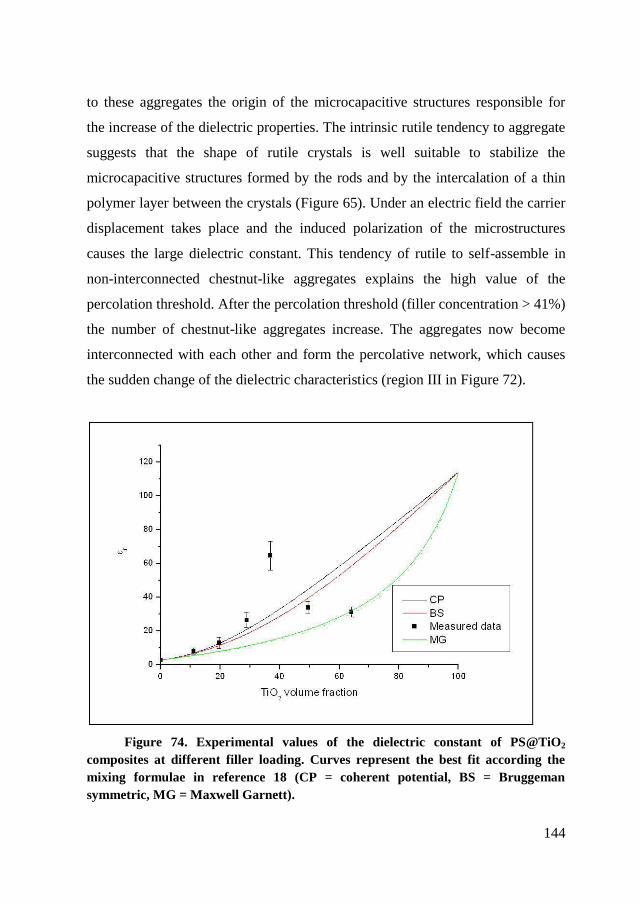
144
to these aggregates the origin of the microcapacitive structures responsible for
the increase of the dielectric properties. The intrinsic rutile tendency to aggregate
suggests that the shape of rutile crystals is well suitable to stabilize the
microcapacitive structures formed by the rods and by the intercalation of a thin
polymer layer between the crystals (Figure 65). Under an electric field the carrier
displacement takes place and the induced polarization of the microstructures
causes the large dielectric constant. This tendency of rutile to self-assemble in
non-interconnected chestnut-like aggregates explains the high value of the
percolation threshold. After the percolation threshold (filler concentration > 41%)
the number of chestnut-like aggregates increase. The aggregates now become
interconnected with each other and form the percolative network, which causes
the sudden change of the dielectric characteristics (region III in Figure 72).
Figure 74. Experimental values of the dielectric constant of PS@TiO2
composites at different filler loading. Curves represent the best fit according the
mixing formulae in reference 18 (CP = coherent potential, BS = Bruggeman
symmetric, MG = Maxwell Garnett).
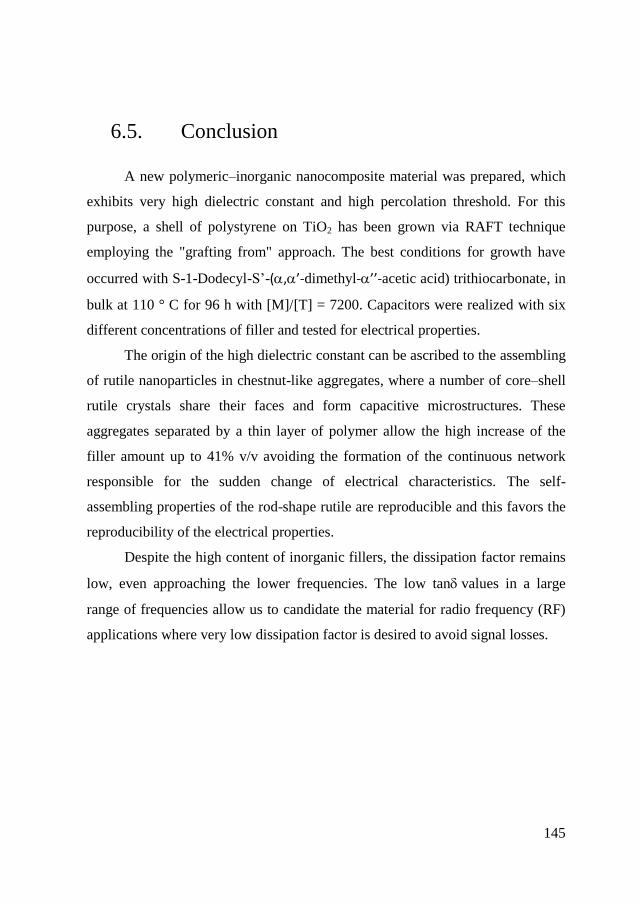
145
6.5. Conclusion
A new polymeric–inorganic nanocomposite material was prepared, which
exhibits very high dielectric constant and high percolation threshold. For this
purpose, a shell of polystyrene on TiO2 has been grown via RAFT technique
employing the "grafting from" approach. The best conditions for growth have
occurred with S-1-Dodecyl-S’-(,’-dimethyl-’’-acetic acid) trithiocarbonate, in
bulk at 110 ° C for 96 h with [M]/[T] = 7200. Capacitors were realized with six
different concentrations of filler and tested for electrical properties.
The origin of the high dielectric constant can be ascribed to the assembling
of rutile nanoparticles in chestnut-like aggregates, where a number of core–shell
rutile crystals share their faces and form capacitive microstructures. These
aggregates separated by a thin layer of polymer allow the high increase of the
filler amount up to 41% v/v avoiding the formation of the continuous network
responsible for the sudden change of electrical characteristics. The self-
assembling properties of the rod-shape rutile are reproducible and this favors the
reproducibility of the electrical properties.
Despite the high content of inorganic fillers, the dissipation factor remains
low, even approaching the lower frequencies. The low tanvalues in a large
range of frequencies allow us to candidate the material for radio frequency (RF)
applications where very low dissipation factor is desired to avoid signal losses.
146
Chapter 7. Functionalization of
SiO2 with PI for application in
tyres
In this chapter I will present the functionalization of commercial SiO2
nanoparticles with diene polymers with the aim to increase their compatibility
with the polymer phase of tyres. The synthesis procedure is the same as the one
carried out on TiO2 (grafting from polymerization RAFT), but I changed the
transfer agents and the polymers anchored to the surface. After studying the
functionalization with three different RAFT agents (DDAT, BTmePT, BTetPT),
the polymerizations of styrene and isoprene were performed. Since a good
polyisoprene coating was obtained, scaling-up of the process was developed and
the product was tested in polymeric compounds. All the work was carried out
with particular care to the possible application in tyres.
7.1. Introduction
Tyres must satisfy a wide range of performance requirements. They must
carry the load of the vehicle, have sufficient grip on the road, transmit steering
forces to guide the vehicle, provide dampening between the road and the vehicle,
have durability that enables their use at high speeds and over long time periods,
and be fuel-efficient (related to rolling resistance). Tyres are complex composites
made of mixtures of rubber with metal and textile reinforcements.155
The rubber
mixtures or compounds are mainly composed of polymers, reinforcing fillers,
oils, and numerous chemicals used to crosslink or “vulcanize” the compounds.
Different rubber compounds exist for the various parts of a tyre, each with a
specific combination of materials to provide the performance attributes for that
147
part. The first polymer used was natural rubber, 1,4-cis-polyisoprene, but due to
the need to adjust the performance of the tyres, synthetic rubbers such as BR
(Butadiene Rubber), SBR (Styrene Butadiene Rubber), and different copolymers
were introduced. To control the stiffness of the blend and add greater
workability, softeners such as resins and hydrocarbon oils are introduced in small
quantities. In addition, chemicals such as para-phenylenediamine (PPD) are used
to protect the tyres against heat, oxygen and ozone. A very important component
is represented by materials that allow the process of vulcanization or cross-link,
enabling the polymer chains to bind via chemical bridges that increase the elastic
properties of the system: the most common are sulfur and sulfenamides.
Activators and accelerators of vulcanization are introduced to adjust the process,
as stearic acid and Zinc oxide. Finally, there are reinforcing fillers such as carbon
black, silica, clay and titanium dioxide.
The reinforcing fillers used in tyre compounding are critical to achieving
the performances required. This is especially true for the tread compound with its
large number of requirements and emphasis on wear resistance. The fillers
provide a large degree of strengthening of the rubber network, resulting in a
substantial increase in stiffness, tensile strength, and resistance to abrasion156
.
The reinforcing fillers achieve this via a high level of chemical links with the
polymer network. The primary result of this strength improvement is the
longevity of the tyres, in terms of overall load bearing, durability, and tread wear
performance157
. A tyre manufactured without the use of reinforcing fillers would
not be strong enough to carry the load or handle the forces required by the
vehicles of today. Without reinforcing fillers, tyres would need to be replaced
considerably more often, resulting in an increased burden on end‐of‐life‐tyre
(ELT) management and an increase in tyre manufacturing energy requirements
and greenhouse gas emissions per vehicle kilometer driven.
The primary reinforcing fillers used for the production of rubber articles
are precipitated amorphous silica and carbon black. This work is focused on
148
silica. Amorphous precipitated silica, defined by a specific CAS number, is used
in many applications in addition to its use in the rubber and tyre industry,
including cosmetics, paper and many other applications related to nutrition and
health158
. The world production of amorphous precipitated silica is 1.3 million
tons of which one‐third is used in tyre production. Silica has been used in the
treads of tyres for more than twenty years in order to reduce the fuel consumption
of vehicles, thus contributing to a reduction in vehicle emissions of greenhouse
gases159
.
Amorphous precipitated silica is produced from vitreous silicate. The
vitreous silicate is dissolved in water and transferred to a reactor in which,
through acidification and under agitation, amorphous silica is precipitated out.
During this precipitation there is an instantaneous formation of primary
nanoscale particles (from approximately 2 to 40 nm) of a very short lifespan.
However, these particles immediately cluster to form non‐dissociable aggregates
(from approximately 100 to 500 nm in size) based on covalent bonds. Because of
the nature of these bonds, these aggregates cannot disaggregate under standard
conditions. The aggregates subsequently electrostatically bind together to form
agglomerates from 1 to 40 μm. Electrostatic bonds, while weaker than covalent
bonds, cannot be broken from normal use: breaking these bonds requires the use
of a dispersant. Because of these aggregates and agglomerates, precipitated
amorphous silica is a nanostructured material, even if each agglomerate does not
meet the definition of nanoparticle. At the end of the precipitation process, after
drying and washing, the precipitated amorphous silica is mechanically processed
into micro pearls or granules (dimension of 1/10 mm to a few mm) to ease
shipping, handling and use. It is this form that is used by the tyre industry. The
formation of these micro pearls and granules reduces the dustiness of the
precipitated silica, and therefore reduces the potential for worker exposure to
particles of amorphous silica during handling. During rubber compounding, due
to the high energy involved, the granules or micropearls of the precipitated silica
149
are broken down, transforming back to the aforementioned agglomerates with
dimensions between 1 and 40 microns. Because of the strong mechanical energy
applied to the rubber, agglomerates may be broken down and transformed into
aggregates, some of which are of nanometric size (their dimension ranges
between 100 to 500 nanometers ).
However, it is crucial to understand that these aggregates are chemically
bound to the rubber matrix by strong chemical links that result from the
manufacturing process. Furthermore, the physical mixing process itself does not
create enough energy to break down the strong covalent forces that exist between
the individual particles that form these aggregates160
. Agglomeration is also
driven by incompatibility between inorganic silica surface and the organic
matrix. Consequently, to obtain well dispersed silica inside the tyres using the
precipitated silica already existing on the market, you have to modify the surface
to prevent agglomeration. A possible way to do this is to functionalize the
surface. As mentioned in the introduction, the ways for this task are of different
chemical and physical nature, the method taken into consideration in this work is
to create a shell of polyisoprene (same polymer matrix) to make sure that the
surface of the nano particles are energetically discouraged to agglomerate.
7.2. Synthesis of SiO2 with different RAFT
agents
Commercial SiO2 (Ultrasil 7000 GR, Evonik) with a particle size of about
25 nm and a specific surface area of 170 m2 g
-1 (measured by BET) was chosen
as solid support.
Following the results obtained with nanoparticles of TiO2 (Chapter 6)
silica was functionalized with DDAT, which is seen to have a good
polymerization efficiency. SiO2 with two RAFT agents with silanic functionality
that form covalent bonds with the surface of the nano particles, BTmePT and
150
BTetPT, were then tested. The former, which is stable and simple to produce,
was mainly used to study the coating surface density at varying transfer
agent/silica ratio. Since the reaction with the methoxy silane produces methanol,
considered undesired at an industrial level, RAFT agent with ethoxy silane was
tested.
7.2.1. Synthesis of DDAT@SiO2
To a 250 mL two-necked flask 5 g of SiO2 and 40 ml of toluene were
added and the water was removed by azeotropic distillation. The nanoparticles
were dried with mechanical vacuum. Via cannule, a solution of 50 ml of
methanol and 2.5 g (6.87 mmol) of DDAT trithiocarbonate was added. The
suspension was kept for 96 hours in the dark under stirring at room temperature
under argon. The particles were recovered by centrifugation (30 min at 6000
RPM). In order to remove the unreacted CTA and the residual traces of
methanol, the powder was washed for 20 minutes under ultrasound conditions
with ethyl acetate (3 times with 50 ml) and CH2Cl2 (3 times with 50 ml). The
final wet powder was dried in air at room temperature and the residual solvent
evaporated under vacuum overnight.
The surface density of coating of the RAFT agent on the SiO2 was
determined by TGA (Figure 76) and sulfur elementary analysis. As in the case of
the TiO2 the bond formed between the carboxylic acid moiety and the surface can
be considered as intermediate between a dative covalent bond and an ionic bond.
Following a procedure similar to Chapter 6, a blank measurement was
carried out on a sample of silica, to be able to subtract the curve obtained from
the subsequent measurements on functionalized nanoparticles. Therefore the
weight losses were measured between 150 ° C and 600 ° C. From the measured
weight loss of 1.18%, the amount of grafted RAFT in the -DDAT@SiO2 agent
was evaluated to be 0.035 mmol g-1
. Assuming that the molecules were evenly
151
distributed on the surface and referring to the surface area of SiO2 170 m2
g-1
(measured by BET), the number of molecules per nm2 resulted to be 0.5 DDAT
per nm2. The average distance between the molecules anchored to the surface is
3.2 nm. The sulfur elementary analysis revealed that the RAFT agent loading was
0.95 %, which is comparable to the results estimated by TGA.
Therefore the overall coating level of silica surface, maintaining the same
reaction conditions, results to be lower than in the case of the nano particles of
TiO2. One possible explanation for this phenomenon is due to the different
chemical and morphological nature of the surface of SiO2.
7.2.2. Synthesis of BTmePT@SiO2 and BTetPT@SiO2
The functionalization of the silica with the two RAFT agents with siloxane
functionality was performed with similar procedure of Perrier et al.161
(see Figure
75). In a 500 mL three-necked flask with septum, 8.0 g of silica and 200 mL of
toluene were mixed with magnetic stirring and ultrasound at room temperature
for 30 min. Water was removed by azeotropic distillation. A solution of RAFT
agent (see Table 13) and 50 mL of dry toluene was added into the flask under
argon. The reaction mixtures were heated to reflux overnight (about 16 hours) in
argon atmosphere. After cooling, the suspension was recovered by centrifugation
(60 min at 6000 RPM) and was washed for 20 minutes under ultrasound
conditions with CH2Cl2 (5 times with 100 ml). After drying at 60 °C under
vacuum overnight, grafted silica particles (BTmePT@SiO2 or BTetPT@SiO2)
were obtained as deep yellow solid products. The residual was recycled and used
further for the synthesis.
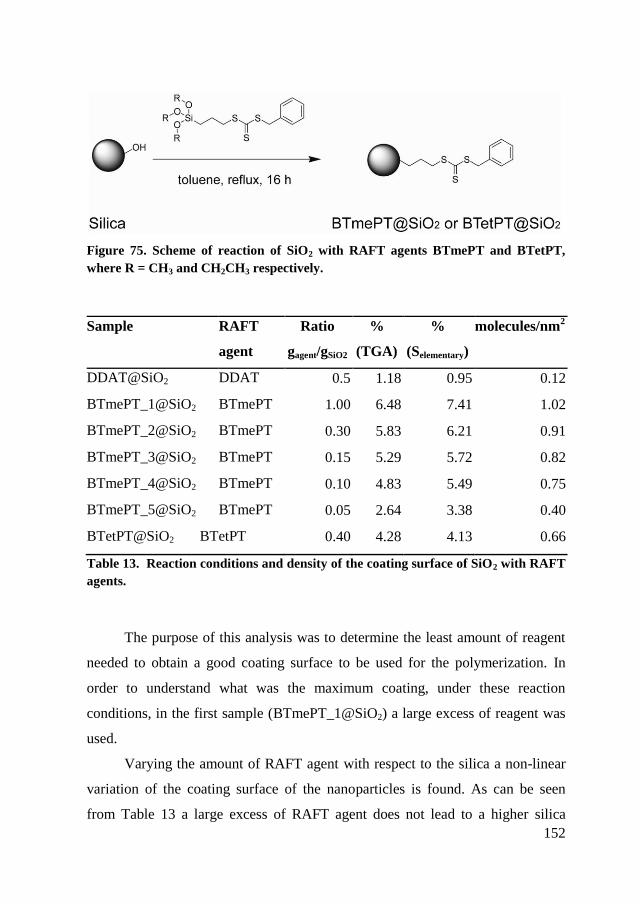
152
Figure 75. Scheme of reaction of SiO2 with RAFT agents BTmePT and BTetPT,
where R = CH3 and CH2CH3 respectively.
Sample RAFT
agent
Ratio
gagent/gSiO2
%
(TGA)
%
(Selementary)
molecules/nm2
DDAT@SiO2 DDAT 0.5 1.18 0.95 0.12
BTmePT_1@SiO2 BTmePT 1.00 6.48 7.41 1.02
BTmePT_2@SiO2 BTmePT 0.30 5.83 6.21 0.91
BTmePT_3@SiO2 BTmePT 0.15 5.29 5.72 0.82
BTmePT_4@SiO2 BTmePT 0.10 4.83 5.49 0.75
BTmePT_5@SiO2 BTmePT 0.05 2.64 3.38 0.40
BTetPT@SiO2 BTetPT 0.40 4.28 4.13 0.66
Table 13. Reaction conditions and density of the coating surface of SiO2 with RAFT
agents.
The purpose of this analysis was to determine the least amount of reagent
needed to obtain a good coating surface to be used for the polymerization. In
order to understand what was the maximum coating, under these reaction
conditions, in the first sample (BTmePT_1@SiO2) a large excess of reagent was
used.
Varying the amount of RAFT agent with respect to the silica a non-linear
variation of the coating surface of the nanoparticles is found. As can be seen
from Table 13 a large excess of RAFT agent does not lead to a higher silica
153
loading. Therefore it can be established that the sample where the ratio of RAFT
agent/SiO2 (BTmePT_2@SiO2) was 0.30, was the best compromise to obtain a
good surface covering and a moderate consumption of reagents.
The functionalization with BTetPT shows a different result compared to
BTmePT, this phenomenon can be explained by two reasons. The molecule has a
greater steric hindrance, that blocks anchoring sites.
7.3. Raft polymerization mediated by
CTAs@SiO2
Before studying the functionalization of the silica with isoprene, the
behavior of the polymerization of styrene in conditions similar to those used with
TiO2 (Chapter 6) was evaluated.
7.3.1. Styrene polymerization
In a 100 ml schlenk tube with septum 200 mg of SiO2-DDAT were kept at
reduced pressure for 4 hours before the addition 2.77 ml of styrene (23.9 mmol,
[M]/[T] = 3500) over argon. The suspension was homogeneously dispersed by
ultrasound treatment and four freeze–pump–thaw cycles were performed to
remove the oxygen dissolved in styrene. The RAFT polymerization was carried
out at 110 °C for 96 h under an argon atmosphere with magnetic stirring. The
polymerization was interrupted by quenching in liquid nitrogen. To separate
SiO2–PS from the ungrafted polystyrene, the solid was dissolved in CH2Cl2 (80
ml) and the particles were separated by centrifugation (6000 RPM for 30 min).
The recovered particles were washed three times with CH2Cl2 under ultrasound
conditions, separated by centrifugation and finally dried in a vacuum overnight at
40 °C (PS1@SiO2). With the same procedure, PS2@SiO2 and PS3@SiO2
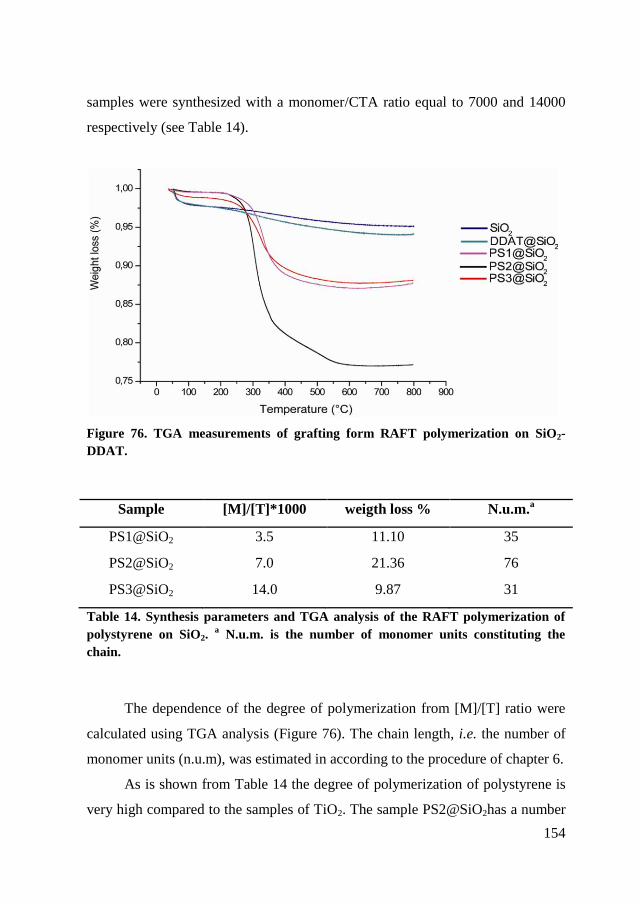
154
samples were synthesized with a monomer/CTA ratio equal to 7000 and 14000
respectively (see Table 14).
Figure 76. TGA measurements of grafting form RAFT polymerization on SiO2-
DDAT.
Sample [M]/[T]*1000 weigth loss % N.u.m.a
PS1@SiO2 3.5 11.10 35
PS2@SiO2 7.0 21.36 76
PS3@SiO2 14.0 9.87 31
Table 14. Synthesis parameters and TGA analysis of the RAFT polymerization of
polystyrene on SiO2. a N.u.m. is the number of monomer units constituting the
chain.
The dependence of the degree of polymerization from [M]/[T] ratio were
calculated using TGA analysis (Figure 76). The chain length, i.e. the number of
monomer units (n.u.m), was estimated in according to the procedure of chapter 6.
As is shown from Table 14 the degree of polymerization of polystyrene is
very high compared to the samples of TiO2. The sample PS2@SiO2has a number
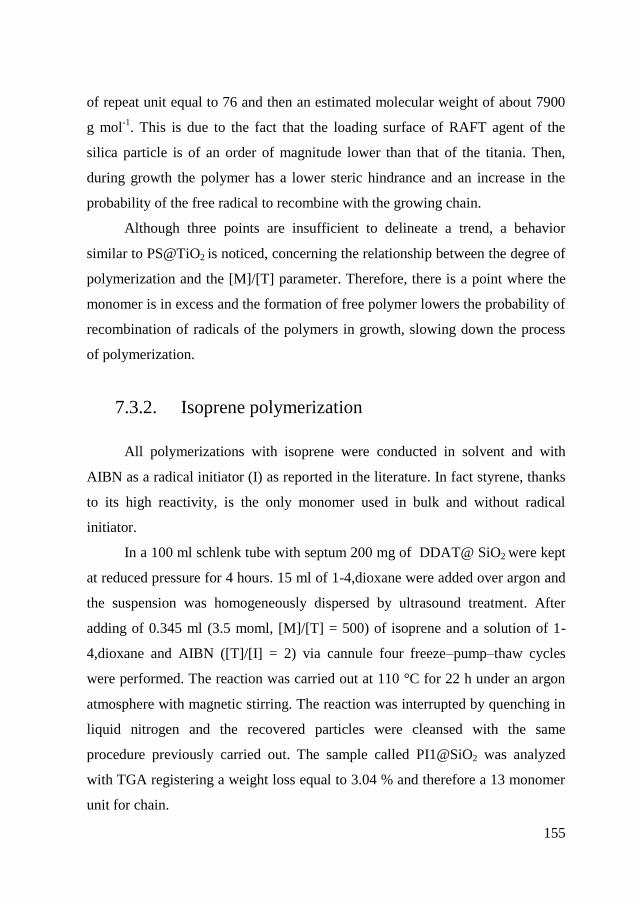
155
of repeat unit equal to 76 and then an estimated molecular weight of about 7900
g mol-1
. This is due to the fact that the loading surface of RAFT agent of the
silica particle is of an order of magnitude lower than that of the titania. Then,
during growth the polymer has a lower steric hindrance and an increase in the
probability of the free radical to recombine with the growing chain.
Although three points are insufficient to delineate a trend, a behavior
similar to PS@TiO2 is noticed, concerning the relationship between the degree of
polymerization and the [M]/[T] parameter. Therefore, there is a point where the
monomer is in excess and the formation of free polymer lowers the probability of
recombination of radicals of the polymers in growth, slowing down the process
of polymerization.
7.3.2. Isoprene polymerization
All polymerizations with isoprene were conducted in solvent and with
AIBN as a radical initiator (I) as reported in the literature. In fact styrene, thanks
to its high reactivity, is the only monomer used in bulk and without radical
initiator.
In a 100 ml schlenk tube with septum 200 mg of DDAT@ SiO2 were kept
at reduced pressure for 4 hours. 15 ml of 1-4,dioxane were added over argon and
the suspension was homogeneously dispersed by ultrasound treatment. After
adding of 0.345 ml (3.5 moml, [M]/[T] = 500) of isoprene and a solution of 1-
4,dioxane and AIBN ([T]/[I] = 2) via cannule four freeze–pump–thaw cycles
were performed. The reaction was carried out at 110 °C for 22 h under an argon
atmosphere with magnetic stirring. The reaction was interrupted by quenching in
liquid nitrogen and the recovered particles were cleansed with the same
procedure previously carried out. The sample called PI1@SiO2 was analyzed
with TGA registering a weight loss equal to 3.04 % and therefore a 13 monomer
unit for chain.
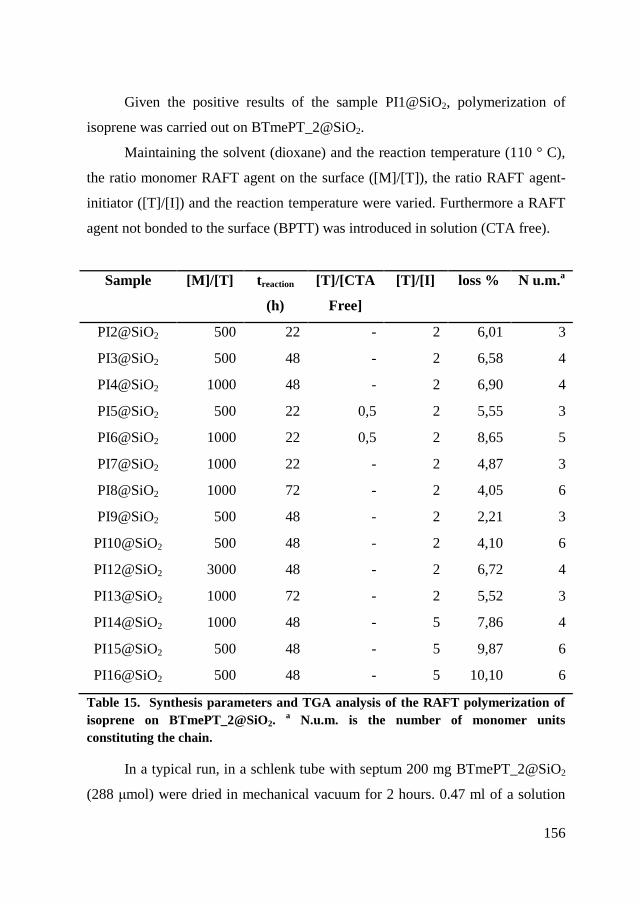
156
Given the positive results of the sample PI1@SiO2, polymerization of
isoprene was carried out on BTmePT_2@SiO2.
Maintaining the solvent (dioxane) and the reaction temperature (110 ° C),
the ratio monomer RAFT agent on the surface ([M]/[T]), the ratio RAFT agent-
initiator ([T]/[I]) and the reaction temperature were varied. Furthermore a RAFT
agent not bonded to the surface (BPTT) was introduced in solution (CTA free).
Sample [M]/[T] treaction
(h)
[T]/[CTA
Free]
[T]/[I] loss % N u.m.a
PI2@SiO2 500 22 - 2 6,01 3
PI3@SiO2 500 48 - 2 6,58 4
PI4@SiO2 1000 48 - 2 6,90 4
PI5@SiO2 500 22 0,5 2 5,55 3
PI6@SiO2 1000 22 0,5 2 8,65 5
PI7@SiO2 1000 22 - 2 4,87 3
PI8@SiO2 1000 72 - 2 4,05 6
PI9@SiO2 500 48 - 2 2,21 3
PI10@SiO2 500 48 - 2 4,10 6
PI12@SiO2 3000 48 - 2 6,72 4
PI13@SiO2 1000 72 - 2 5,52 3
PI14@SiO2 1000 48 - 5 7,86 4
PI15@SiO2 500 48 - 5 9,87 6
PI16@SiO2 500 48 - 5 10,10 6
Table 15. Synthesis parameters and TGA analysis of the RAFT polymerization of
isoprene on BTmePT_2@SiO2. a N.u.m. is the number of monomer units
constituting the chain.
In a typical run, in a schlenk tube with septum 200 mg BTmePT_2@SiO2
(288 μmol) were dried in mechanical vacuum for 2 hours. 0.47 ml of a solution
157
0.6 M of AIBN and 0.2 ml of a solution 1.3 M of BPTT both in 1-4,dioxane were
added under argon. After stirring 2.88 ml (28.7 mmol, [M]/[T] = 500) of isoprene
and 1-4,dioxane were introduced. After adding a magnetic stirring bar and
ultrasonic treatment, the tube was subjected to three freeze-pump-thaw cycles to
remove oxygen. The tube was placed into an oil bath preheated to 60 °C for 18 h
and then the polymerization was quenched by putting the tube into a liquid
nitrogen bath. The recovered particles were cleansed with the same procedure
previously carried out and were analyzed by TGA. All other samples were
synthesized by the same procedure by varying the parameters as indicated in
Table 15.
The RAFT polymerization via grafting of isoprene on BTmePT_2@SiO2
did not produce a high degree of polymerization with variation of these
parameters. The number average of unit monomer varies from 3 to 6, therefore
the polymeric chains can be considered oligomers. However, the coating of the
nanoparticles is high because the silica used has a high density of
functionalization. The sample PI15@SiO2 has a quantity of polyisoprene bonded
to the surface equal to 10.1%.
The parameters of polymerization to obtain a polymer with higher
molecular weight were found to be the ratio [M] and [T] equal to 500, with five
times the amount of CTA compared to radical initiator for 48 h. The free CTA,
unexpectedly, does not seem to influence the process as supported by Perrier et
al. Probably, the dense surface coating of BTmePT causes a too high steric
hindrance during polymerization. Another explanation could be both the type and
the quantity of solvent used.
7.4. Nanocomposite
To obtain a compound comparable to those of standard tyres, 75 g of
RAFT agent-functionalized SiO2 were synthesized and functionalized with
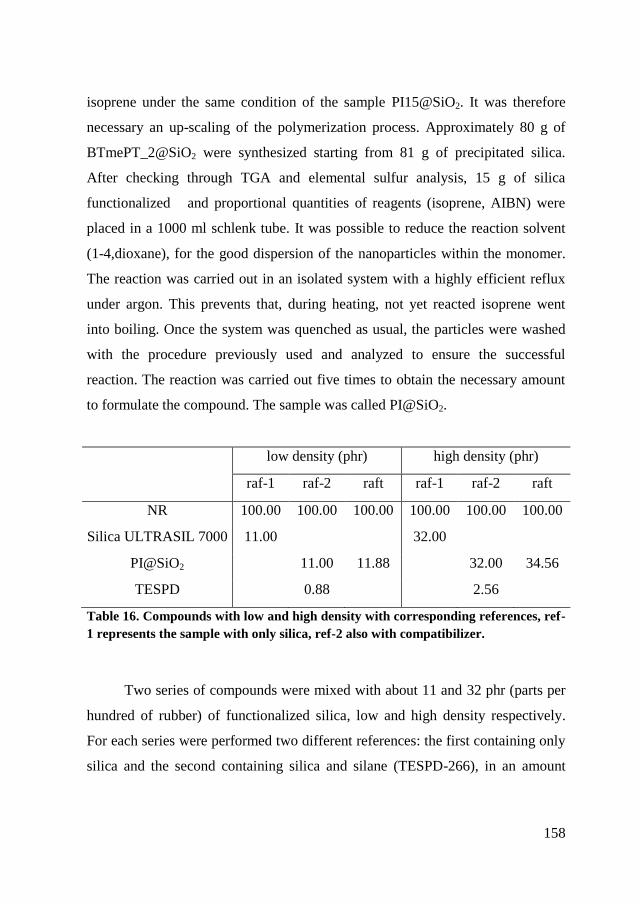
158
isoprene under the same condition of the sample PI15@SiO2. It was therefore
necessary an up-scaling of the polymerization process. Approximately 80 g of
BTmePT_2@SiO2 were synthesized starting from 81 g of precipitated silica.
After checking through TGA and elemental sulfur analysis, 15 g of silica
functionalized and proportional quantities of reagents (isoprene, AIBN) were
placed in a 1000 ml schlenk tube. It was possible to reduce the reaction solvent
(1-4,dioxane), for the good dispersion of the nanoparticles within the monomer.
The reaction was carried out in an isolated system with a highly efficient reflux
under argon. This prevents that, during heating, not yet reacted isoprene went
into boiling. Once the system was quenched as usual, the particles were washed
with the procedure previously used and analyzed to ensure the successful
reaction. The reaction was carried out five times to obtain the necessary amount
to formulate the compound. The sample was called PI@SiO2.
low density (phr) high density (phr)
raf-1 raf-2 raft raf-1 raf-2 raft
NR 100.00 100.00 100.00 100.00 100.00 100.00
Silica ULTRASIL 7000 11.00 32.00
PI@SiO2 11.00 11.88 32.00 34.56
TESPD 0.88 2.56
Table 16. Compounds with low and high density with corresponding references, ref-
1 represents the sample with only silica, ref-2 also with compatibilizer.
Two series of compounds were mixed with about 11 and 32 phr (parts per
hundred of rubber) of functionalized silica, low and high density respectively.
For each series were performed two different references: the first containing only
silica and the second containing silica and silane (TESPD-266), in an amount
159
proportional to the silica, and close to the organic matter of the sample PI@SiO2
(10.1 %). As reference was used Silica ULTRASIL 7000.
In a typical run, 162 g of natural rubber (NR-STR 20 P 93) and 19.12 g of
PI@SiO2 were added in a closed mixing chamber (thermo Haake rheomix lab
station). After 7 minutes of mixing and reaching 140 °C, the resulting “first
phase compound” was discharged and cooled. After 24 h, the “first phase
compound” was mixed in the same equipment with 3.12 g of stearic acid, 3.9 g of
N-(1,3-Dimethylbutyl)-N´-phenyl-1,4-phenylenediamine (6PPD) and 5.46 g of
zinc oxide (RHENOGRAN ZnO 80% active) for 4 minutes. The product was
cooled and mixed with 4.56 g of N-Cyclohexyl-2-benzothiazole
sulfenamide (CBS) and 1.52 g of sulfur for 2 minutes in an open two-roll mill.
The other compounds were obtained with similar procedure varying only the type
of silica and the presence of silane (see Table 16) in the first step. The sample
with 32 phr were mixed in first stage for 6 minutes because the compound
produces more heat, In addition was visible a better homogeneity of the product.
160
Conclusions
In this thesis I exploited RAFT polymerization technique to develop
different macromolecular architectures. The topics addressed have been the
synthesis of block copolymers and the surface modification of nanoparticles of
metal oxides.
Several PS-b-PDMA copolymers were synthesized for controlled self-
assembly in aqueous solution, introducing a new non-invasive method for
determining the viscosity of micro-nano structures. In particular, I have analyzed
two polymers with different block lengths. PS105-b-PDMA817 presents a micellar
morphology with a hard core of polystyrene and a solvated shell of PDMA.
Instead, PS62-b-PDMA10 exhibits a complex morphology whose determination
required more effort. From the data obtained, a granular morphology with
nanoparticles agglomerated in a superstructure of 200-300 nm is hypothesized.
PS-b-PEO-b-PS copolymers were synthesized and used as polymer gel for
the manufacture of Quasi Solid-State Dye-Sensitized Solar Cells. The polymers
were placed in standard cells as a support for the liquid electrolyte, producing a
gel matrix. Measurements of electrical conductivity show a efficiencies of 6.7%
which are comparable to that of the standard electrolyte DSSC (6.9 %).
Moreover, improved stability was observed: a device kept for 15 days under
outdoor conditions with sunlight and climate stress has shown unvaried power
conversion efficiency. Therefore this new polymeric host electrolytes could be of
interest for a new generation of quasi solid-state DSSC, especially for the good
mechanical properties and high tunability of physico-chemical characteristics.
Nanoparticles of TiO2 have been functionalized with polystyrene to
produce core-shell particles. New polymeric nanocomposite with potential
application as high dielectric material can be prepared staring from the core-shell
161
particles. As an example, nanocomposites were fabricated varying the amount of
PS@TiO2 core shell particles in a matrix of commercially available polystyrene.
They exhibit very high dielectric constant and high percolation threshold. The
origin of the high dielectric constant can be ascribed to the assembling of rutile
nanoparticles in chestnut-like aggregates, where a number of core–shell rutile
crystals share their faces and form capacitive microstructures. These aggregates,
separated by a thin layer of polymer, allow the high increase of the filler amount
up to 41% v/v avoiding the formation of the continuous network responsible for
the sudden change of electrical characteristics. Despite the high content of
inorganic fillers, the dissipation factor remains low, even approaching the lower
frequencies. The low tanvalues in a large range of frequencies allow us to
candidate the material for radio frequency (RF) applications where very low
dissipation factor is desired to avoid signal losses.
RAFT was also used to prepare core-shell particles based on precipitated
silica. Silica is currently used in the so-called green tires, since it reduces the
rolling resistance and increases the wet traction. In order to make silica
compatible with rubbers, typically polybutadiene and polyisoprene (PI), the
surface of the particles is treated with silanes bearing sulphur groups, these
groups participate at the vulcanization process. RAFT, instead, allows to grow
directly on the silica surface polymer chains, so PI@SiO2 core-shell particles
were prepared and used to prepare rubber compounds.
162
Supporting information
Materials
1-Dodecanethiol (99.8 %), aliquot 336 (tricaprylylmethylammonium
chloride), 1-mercaptopropionic acid (99 %), sodiun carbonate (Na2CO3, 99.9 %),
magnesium sulfate (MgSO4, 99.5 %), 3-(mercaptopropyl) trimethoxysilane (95
%), 3-(mercaptopropyl) triethoxysilane (95%), propyl mercaptan (99 %), carbon
disulfide (CS2, 99 %), and benzyl bromide (98%), lauryl peroxide (99 %), silica
gel (60 Å) were purchased from Aldrich and used without further purification.
Distilled and Milli-Q water (18.2 MΩ·cm at 25 °C) on site with the appropriate
equipment were produced. Sodium methoxide (25 % wt. in methanol) freshly
prepared. Triethylamine was dried over calcium hydride and distilled under
nitrogen. PEO (Fluka Mn = 6000) was precipitated from diethyl ether two times.
Isoprene (Ip, 99 %), styrene (Sty, 99 %), N,N-Dimethylacetamide (DMA,
99 %), methymeta acrylate (MMA, 99 %), n-butyl acrylate (nB, 99 %), were
obtained from Sigma-Aldrich and was stirred over calcium hydride for 2 days,
distilled under reduced pressure and stored under nitrogen.
Dimethylacetamide (DMAc, 99.8 %), dimethylacrylate (DMA, 99%),
methylene chloride (CH2Cl2, 99 %), acetone (99.9 %), chloroform (99 %), 2-
propanol (99 %), hexane (99 %), diethyl ether (99 %), 1,4-dioxane anhydrous
(99%), Tetrahydrofuran THF (inhibitor free, HPLC grade), methanol (HPLC
grade,), chloroform-d (CD3Cl, 99.8 %), deuterium oxide (D2O, 99.8 %) were
used as received. Azoisobutyronitrile (AIBN, Sigma-Aldrich) was recrystallized
from methanol and stored in a freezer prior to use. Nitrogen (5.5) and argon (Ar,
5.5) were ultra-high purity grade gasses with zeolites 3 Å. All other materials
were used as received from Sigma-Aldrich Company.
163
Dialysis tube, with MWCO of 3.5k and 15k Da, of series Spectra/Por 7
were used without purification.
Characterization
ATR-FTIR analysis was performed using a Perkin Elmer Spectrum 100
instrument scanning from 650 to 4000 cm-1
with a resolution of 4 cm-1
for 64
scans.
Transition temperatures were determined by differential scanning
calorimetry (DSC) using a Mettler Toledo DSC 821 instrument with a heating
and cooling rate of 20°C/min under nitrogen. Quantitative determination of the
amount of organic molecules which functionalize the oxide (TiO2 and SiO2) was
performed by Thermo Gravimetric Analysis (TGA) and DSC measurements on a
Mettler Toledo TGA/DSC1 STARe System, at a constant gas flow (50 cm3 min
-
1). The thermal profile was the following: 40°C 5 min (N2); 40–150°C 10°C min
-1
(N2); 150°C 5 min (N2); 150–1000°C 10°C min-1
(air).
Molecular weights and molecular weight distributions were determined by
Gel Permeation Chromatography (GPC) using a WATERS 1515 isocratic
equipped with a HPLC Pump, WATERS 2414 refractive index detector, four
Styragel columns (HR2, HR3, HR4 and HR5 in the effective molecular weight
range of 500-20000, 500-30000, 50000-600000 and 50000-4000000
respectively) with THF as the eluent at a flow rate of 1.0 ml min-1
. The GPC
system was calibrated with standard polystyrene from Sigma-Aldrich.
Elemental Analyses. C, H, were determined by combustion followed by
chromatographic separation and thermal conductivity detection using a Carlo
Erba 1108 elemental analyzer. Sulfur analyses were conducted using the
Schoniger oxygen flask combustion method followed by the relevant titration.
164
NMR spectra were recorded on a Bruker AMX-500 instrument operating
at 500.13 (1H) and 125.77 (
13C) MHz. J-MOD. Coupling constants are given in
Hz, using toluene-d, CDCl3 and D2O as the solvents.
The specific surface area (SSA), by the BET method, was measured by
nitrogen physisorption with a Quantachrome Autosorb-1 apparatus. Powder
samples were evacuated at 200°C for 16 h before the analysis.
Scanning electron microscopy (SEM) measurements were performed by a
LEO 1450VP instrument. Transmission Electron Microscopy (TEM) analysis
was carried out using a Jeol JEM-3010 instrument equipped with an Energy
Dispersive Spectroscopy (EDS) system ISIS Series 300, manufactured by Oxford
Instruments.
The impedance measurements were performed using a HP 4282A
Precision LCR Meter in configuration Cp-G. The maximum tension was 1 V
while the frequency varied between 20 Hz and 1 MHz. The final electrical
characteristics of the material for each concentration of the filler were obtained
averaging the data collected for the two different dimensions of the top contact.
Dynamic Light Scattering (DSC) experiments were performed at 25°C on
a 90Plus Particle Size Analizer (Brookhaven Instruments Corporation) with
scattering angles of 15° and 90°, equipped with a 35 mW solid state laser and a
Brookhaven’s TuboCorr correlator with 510 channels.
AFM imaging and force spectroscopy were carried out with a JPK
NanoWizard (JPK Instruments, Berlin, Germany, with closed loop scanner)
equipped with JPK controller and software, using the silicon cantilevers with a
resonance frequency of 70 kHz and a nominal spring constant of 2 N m-1
(OMCL-AC240TS, Olympus, Tokyo, Japan).
The inner structure of particles was observed using a gallium Focused Ion
Beam (FIB Dual Beam, FEI Helios). The particles as a liquid-drop state were
located and dried on a Si wafer. The mounted particles on the Si wafer were
deposited by Pt–Pd materials with the thickness of about 100 nm to prevent the
165
sample damage by Ga ion and then went to the FIB chamber, in which a big
stair-step FIB trench was cut on one side of the particle until the inner structure
was observed by scanning electron microscopy (SEM) which is mounted in FIB
chamber with the tilting angle of 52° from a ion beam.
For the production of compounds was used a mixing chamber closed
Thermo Haake Rheomix lab station with mixing chamber 250 ml and fill factor
0.7.
166
Acknowledgments
This work was supported by Pirelli Tyre and by Fondazione Cariplo at the
University of Milano Bicocca.
I would like to thank Dr. Roberto Simonutti for his guidance, support and
discussion during these last three years. I have to thank Dr. Raffaella Donetti, Dr.
Luca Giannini and Dr. Marco Nahmias for willingness in Pirelli.
A dear thank goes to Michele Mauri, Gaetano Distefano, Tommaso Crisenza,
Annalisa Colombo, Lucio Mauri, Luca De Trizio and all graduating students who
have worked with me and for me in the group Posylife.
I am also very thankful to Prof. Dr. Hans-Jürgen Butt, Dr. Kaloian Koynov and
Dr. Michael Kappl for hosting me at the Max Plank Institute for Polymer
Research as part of the European Doctorate program. I definitely have to thank as
well all the people in MPI-P in Mainz for the enjoyable period that I spent there.
A sincere thank you goes to all the people who have worked in my thesis: Dr.
Luca Beverina, Dr. Gianfranco Vaccaro, Dr. Angelo Monguzzi and the group of
Prof. Morazzoni, in particular Maurizio Crippa and Massimiliano D'Arienzo.
I would like also to acknowledge all the people I collaborated with, and who
helped me in the realization of the work presented in this dissertation.
To last but not least, I thank my mom, my brother and my girlfriend Margherita
for supporting me and drove to the outside of my work.
167
References
1 R. T. A. Mayadunne, E. Rizzardo, J. Chiefari, Y. K. Chong, G. Moad, S. H. Thang, Macromolecules, 1999, 32, 6977.
2 J. S. Wang, K. Matyjaszewski, J. Am. Chem. Soc., 1995, 117, 5614.
3 K. Matyjaszewski, J. Xia, Chem. Rev., 2001, 101, 2921.
4 C. J. Hawker, Angew. Chem. Int. Ed., 1995, 34, 1456.
5 C. J. Hawker, A. W. Bosman, E. Harth, Chem. Rev., 2001, 101, 3661.
6 L. Barner, T. P. Davis, M. H. Stenzel, C. Barner-Kowollik, Macromol. Rapid Commun., 2007, 28, 539–559.
7 F. S. Bates, G. H. Fredrickson, Physics Today, February 1999.
8 O. Prucker, J. Ruhe, Macromolecules, 1998, 31, 592-601.
9 N. Tsubokawa, S. Machida, S. Yoshikawa, J. Polym. Sci., Polym. Chem., 2002, 36, 3165-3172.
10 C. Barner-Kowollik, T. P. Davis, M. Whittaker, Journal of polymer Science, 2003, 41, 365-375.
11 G. Moad, E. Rizzardo, S. H. Thang, Polymer 2008, 49 (5), 1079-1131.
12 S. N. Lewis, J.J. Miller, S. Winstein, J Org Chem, 1972, 37 ,1478-1485.
13 D. Barton, S. W. McCombie, J. Chem. Soc., 1975, 1, 1574-1585.
14 G.F. Meijs, E. Rizzardo, D. Makromol, Chem Rapid Commun, 1988, 9, 547-551.
15 G.F. Meijs, E. Rizzardo, S.H. Thang, Macromolecules, 1988, 21, 3122-3124.
16 J. Chiefari, Y. K. Chong, F. Ercole, J. Krstina, J. Jeffery, P.T. Le Tam, A. Mayadunne, G. F. Meijs, C. L.
Moad, G. Moad, E. Rizzardo, S. H. Thang, Macromolecules, 1998, 31, 5559–5562.
17 G. Moad, D.H. Solomon, The chemistry of radical polymerization, 2nd ed. Oxford, Elsevier, 2006, 451-585.
18 A. Ishii, J. Nakayama, Top. Curr. Chem., 2005, 251, 181-225.
19 S. Z. Zard, Angew. Chem., 1997, 36, 672-685.
20 G. Moad, Aust J Chem, 2006, 59, 661-662.
21 T. P. Le, G. Moad, E. Rizzardo, S. H. Thang, Int. Patent Appl., 1998, WO 9801478, USA.
22 Web of science, Decembers, 2012.
23 E. Rizzardo, D. Harrison, R.L. Laslett, G.F. Meijs, T.C. Morton, S.H. Thang, Prog. Pacific. Polym. Sci.,
1991, 2, 77-88.
24 G. David, C. Boyer, J. Tonnar, B. Ameduri, P. Lacroix-Desmazes, B. Boutevin, Chem. Rev., 2006, 106, 3936-3962.
25 S. Yamago, J. Polym. Sci. Part. A Polym. Chem., 2006, 44, 1-12.
26 J. Krstina, C.L. Moad, G. Moad, E. Rizzardo, C.T. Berge, M. Fryd, Macro. mol. Symp., 1996, 111, 13-23.
27 T. Otsu, M. Yoshida, Macromol. Chem. Rapid. Commun., 1982, 3, 127-132.
168
28 E. Rizzardo, G. Moad, S.H. Thang, Handbook of RAFT polymerization, 2007, Weinheim, Germanym Wiley-
VCH.
29 S. Perrier, P. Takolpuckdee, J. Polym. Sci. Part. A Polym. Chem., 2005, 43, 5347-5393.
30 A. Favier, M.T. Charreyre, Macromol. Rapid. Commun., 2006, 27, 653-692.
31 C. Barner-Kowollik, T. P. Davis, J. P. A. Heuts, M. H. Stenzel, P. Vana, M. Whittaker, J. Polym. Sci. Part. A Polym. Chem., 2003, 41, 3653-75.
32 M. J. Monteiro, J. Polym. Sci. Part. A Polym. Chem., 2005, 43, 3189-3204.
33 A.B. Lowe, C.L. McCormick, Prog. Polym. Sci., 2007, 32, 283-351.
34 G. Moad, Y.K. Chong, E. Rizzardo, A. Postma, S.H. Thang, Polymer, 2005, 46, 8458-8468.
35 L. Barner, T.P. Davis, M.H. Stenzel, C. Barner-Kowollik, Macromol. Rapid. Commun., 2007, 28, 539-559.
36 M.H. Stenzel, C. Barner-Kowollik, T.P. Davis, J. Polym. Sci. Part. A Polym. Chem., 2006, 44, 2363-2375.
37 B.Y.K. Chong, T.P.T. Le, G. Moad, E. Rizzardo, S.H. Thang, Macromolecules, 1999, 32, 2071-2074.
38 G. Moad, J. Chiefari, C.L. Moad, A. Postma, R.T.A. Mayadunne, E. Rizzardo, Macromol. Symp., 2002, 182,
65-80.
39 Y.K. Chong, J. Krstina, T.P.T. Le, G. Moad, A. Postma, E. Rizzardo, Macromolecules, 2003, 36, 2256-2272.
40 M.L. Coote, E.I. Izgorodina, E.H. Krenske, M. Busch, C. Barner-Kowollik, Macromol. Rapid. Commun.,
2006, 27, 1015-1122.
41 K. Kubo, A. Goto, K. Sato, Y. Kwak, T. Fukuda, Polymer, 2005, 46, 9762-9768.
42 A. Alberti, M. Guerra, P. Hapiot, T. Lequeux, D. Macciantelli, S. Masson, Phys. Chem. Chem. Phys., 2005, 7,
250-257.
43M. L. Coote, D.J. Henry, Macromolecules, 2005, 38, 5774-5779.
44 A. Feldermann, M. L. Coote, M. H. Stenzel, T. P. Davis, C. Barner-Kowollik, J. Am. Chem. Soc., 2004, 126,
15915-15923.
45 J. Chiefari, R. T. A. Mayadunne, C.L. Moad, G. Moad, E. Rizzardo, A. Postma, Macromolecules, 2003, 36,
2273-2283.
46 D. Charmot, P. Corpart, H. Adam, S.Z. Zard, T. Biadatti, G. Bouhadir, Macromol. Symp., 2000, 150, 23-32.
47 M. H. Stenzel, Macromol. Rapid. Commun., 2009, 30, 1603–1624.
48 M. A. White, A. Maliakal, N. J. Turro, J. Koberstein, Macromol. Rapid. Commun., 2008, 29, 1544–1548.
49 Y. Tsujii, M. Ejaz, K. Sato, A. Goto, T. Fukuda, Macromolecules, 2001, 34, 8872.
50 C. Li, B. C. Benicewicz, Macromolecules, 2005, 38, 5929.
51 C. Li, J. Han, C. Y. Ryu, B. C. Benicewicz, Macromolecules, 2006, 39, 3175.
52 Y. Yang, Z. Yang, Q. Zhao, X. Cheng, S. C. Tjong, R. K. Y. Li, X. Wang, X. Xie, J. Polym. Sci. Part A: Polym. Chem., 2009, 47, 467.
53 J. Raula, J. Shan, M. Nuopponen, A. Niskanen, H. Jiang,E. I. Kauppinen, H. Tenhu, Langmuir, 2003, 19,
3499.
54 H. Skaff, T. Emrick, Angew. Chem., 2004, 43, 5383.
55 Y. Zhao, S. Perrier, Macromolecules, 2006, 39, 8603.
169
56 D. H. Nguyen, P. Vana, Polym. Adv. Technol., 2006, 17, 625.
57 S. Perrier, P. Takolpuckdee, C. A. Mars, Macromolecules, 2005, 38, 6770.
58 J. Lai, T., D. Filla, R. Shea, Macromolecules, 2002, 35, 6754.
59 J. Skey, R. K. O’Reilly, Chem. Commun., 2008, 4183–4185.
60 M. H. Stenzel, T. P. Davis., J. Polym. Sci. Part. A Polym. Chem., 2002, 40, 4498–4512.
61 M. Hernandez-Guerrero, C. Barner-Kowollik, T.P. Davis, M.H. Stenzel, Eur. Polym J. 2005, 41, 2264-2277.
62 V. Mellon, D. Rinaldi, E. Bourgeat-Lami, F. D’Agosto, Macromolecules, 2005, 38, 1591-1598.
63 R. Rotzoll, D. H. Nguyen, P. Vana, Macromol. Symp., 2009, 275–276.
64 Y. Zhao, S. Perrier, Macromolecules, 2007, 40, 9116-9124.
65 Y. Zhao, S. Perrier, Macromolecules, 2006, 39, 8603-8608.
66 M. R. Wood, D. J. Duncalf, S. P. Rannard, S. Perrier, Org. Lett., 2006, 8(4), 553-556
67 K. Wong, T. P. Davis, C. Barner-Kowollik, M. H. Stenzel, Polymer, 2007, 48, 4950-4965.
68 J. Skey, R. K. O’Reilly, Chem. Commun., 2008, 4183–4185.
69 J. Rzayev, M. A. Hillmyer, J. Am. Chem. Soc., 2005, 127, 13373-13379.
70E. B. Zhulina, O. V. Borisov, Macromolecules, 2012, 45, 4429-4440.
71 H. Huang, B. Chung, J. Jung, H. W. Park, T. Chang, Angew. Chem. Int. Ed., 2009, 48, 4594-4597.
72 T. Azzam, A. Eisenberg, Langmuir, 2010, 26, 10513-10523.
73 K. T. Kim, J. Cornelissen, R. J. M. Nolte, J. C. M. van Hest, Adv. Mater., 2009, 21, 2787.
74 C. J. Lai, W. B. Russel, R. A. Register, Macromolecules, 2002, 35, 841-849.
75 J. M. Virgili, A. Hexemer, J. A. Pople, N. P. Balsara, R. A. Segalman, Macromolecules, 2009, 42, 4604-4613.
76 Y. Yamamoto, K. Yasugi, A. Harada, Y. Nagasaki, K. Kataoka, J. Controlled Release, 2002, 82, 359-371.
77 J. S. Hrkach, M. T. Peracchia, A. Domb, N. Lotan, R. Langer, Biomaterials, 1997, 18, 27-30.
78 C. R. Heald, S. Stolnik, K.S. Kujawinski, C. De Matteis, M.C. Garnett, L. Illum, S. S. Davis, S. C. Purkiss, R.
J. Barlow, P. R. Gellert, Langmuir, 2002, 18, 3669-3675.
79 G. M. Wilmes, D. J. Arnold, K. S. Kawchak, J. Polym. Res. 2011, 18, 1787-1797; d) K. Vijayakrishna, D. Mecerreyes, Y. Gnanou, D. Taton, Macromolecules, 2009, 42, 5167-5174.
80 M. Wilhelm, C. L. Zhao, Y. C. Wang, R. L. Xu, M. A. Winnik, J. L. Mura, G. Riess, M. D. Croucher,
Macromolecules, 1991, 24, 1033-1040.
81 R. Rutkaite, L. Swanson, Y. Li, S. P. Armes, Polymer, 2008, 49, 1800-1811.
82 S. C. Lee, Y. K. Chang, J. S. Yoon, C. H. Kim, I. C. Kwon, Y. H. Kim, S. Y. Jeong, Macromolecules, 1999,
32, 1847-1852.
83 K. Prochazka, D. Kiserow, C. Ramireddy, Z. Tuzar, P. Munk, S. E. Webber, Macromolecules, 1992, 25, 454-
460.
84 D. Kiserow, K. Prochazka, C. Ramireddy, Z. Tuzar, P. Munk, S. E. Webber, Macromolecules, 1992, 25, 461-469.
170
85 D. Kiserow, J. Chan, C. Ramireddy, P. Munk, S. E. Webber, Macromolecules, 1992, 25, 5338-5344.
86 Y. Teng, M. E. Morrison, P. Munk, S. E. Webber, K. Prochazka, Macromolecules, 1998, 31, 3578-3587.
87 P. Bosch, F. Catalina, T. Corrales, C. Peinado, Chem. Eur. J., 2005, 11, 4314-4325.
88 R. D. Priestley, C. J. Ellison, L. J. Broadbelt, J. M. Torkelson, Science, 2005, 309, 456-459.
89 Y. Shiraishi, T. Inoue, T. Hirai, Langmuir, 2010, 26, 17505-17512.
90 K. Y. Law, Chem. Phys. Lett., 1980, 75, 545-549.
91 K. Viajayakrsishna, D. Mecerreyes, Y. Gnanou, D. Taton, Macromolecules, 2009, 42, 5167-5174.
92 J. L. Hutter, J. Bechhoefer, Rev. Sci. Instrum., 1993, 64, 1868.
93 A. Abbotto, R. Simonutti, N. Manfredi, A. Bianchi, PCT Int. Appl., 2012, WO2012153300 (A1), 15
November 2012.
94 B. O'Regan, M. Gratzel, Nature, 1991, 353, 737-740.
95 M. Grätzel, Acc. Chem. Res., 2009, 42, 1788-1798
96 A. J. Nozik, J. Miller, Chem. Rev., 2010, 110, 6443-6445.
97 N. Armaroli, V. Balzani, Angew. Chem. Int. Ed., 2007, 46, 52-66.
98 M. K. Nazeeruddin, F. De Angelis, S. Fantacci, A. Selloni, G. Viscardi, P. Liska, S. Ito, B. Takeru, M.
Grätzel, Journal of the American Chemical Society, 2005, 127, 16835-16847.
99 S. Yanagida, Y. Yu and K. Manseki, Acc. Chem. Res., 2009, 42, 1827-1838.
100 B. Li, L. Wang, B. Kang, P. Wang, Y. Qiu, Sol. Energy Mater. Sol. Cells, 2006, 90, 549-573.
101 H. J. Snaith, L. Schmidt-Mende, Adv. Mater., 2007, 19, 3187-3200.
102 S. M. Zakeeruddin, M. Grätzel, Adv. Funct. Mater., 2009, 19, 2187-2202.
103 N. Cai, S.-J. Moon, L. Cevey-Ha, T. Moehl, R. Humphry-Baker, P. Wang, S. M. Zakeeruddin, M. Grätzel,
Nano Lett., 2011, 11, 1452-1456.
104 J.E. Benedettia, A.D. Gonc¸ A.L.B. Formiga, M.-A. De Paolia, X. Li, J.R. Durrant, A.F. Nogueira, Journal
of Power Sources, 2003,119–121, 448–453.
105 J. Nei de Freitas, A. F. Nogueira, M.-A. De Paoli, Journal of Materials Chemistry, 2009, 19, 5279-5294.
106 Y. Gao, H. Liu, Journal of Applied Polymer Science, 2007, 106, 2718–2723.
107 J. H. Wu, Z. Lan, J. M. Lin, M. L. Huang, S. C. Hao, T. Sato, S. Yin, Adv. Mater., 2007, 19, 4006-4011.
108 J. Shi, S. Peng, J. Pei, Y. Liang, F. Cheng, J. Chen, ACS Applied Materials & Interfaces, 2009, 1, 944-950.
109 A. F. Nogueira, J. R. Durrant, M. A. De Paoli, Adv. Mater., 2001, 13, 826-830.
110 A. Hillmyer, J. Am. Chem. Soc., 2005, 127, 13373-13379
111 M. Sahnoun, M.-T. Charreyre, L. Veron, T. Delair, F. D'Agosto, Journal of Polymer Science Part A: Polymer Chemistry, 2005, 43, 3551-3565.
112 S. Ito, T. N. Murakami, P. Comte, P. Liska, C. Grätzel, M.K. Nazeeruddin, M. Grätzel, Thin Solid Films,
2008, 516, 4613–4619.
171
113 . Halme, P. Vahermaa, K. Miettunen, P. Lund, Adv. Mater., 2010, 22, E210-E234.
114 Q. Wang, J.-E. Moser, M. Grätzel, The Journal of Physical Chemistry B, 2005, 109, 14945-14953.
115 F. Fabregat-Santiago, J. Bisquert, E. Palomares, L. Otero, D. Kuang, S. M. Zakeeruddin, M. Grätzel, The
Journal of Physical Chemistry C, 2007, 111, 6550-6560.
116 F. Fabregat-Santiago, J. Bisquert, G. Garcia-Belmonte, G. Boschloo, A. Hagfeldt, Sol. Energy Mater. Sol.
Cells, 2005, 87, 117-131.
117 A. Facchetti, M. H. Yoon and T. J. Marks, Adv. Mater., 2005, 17, 1705.
118 Q. M. Zhang, H. F. Li, M. Poh, F. Xia, Z. Y. Cheng, H. S. Xu, Nature, 2002, 419, 284.
119 . Bai, Z. Y. Cheng, V. Bharti, H. S. Xu and Q. M. Zhang, Appl. Phys. Lett., 2000, 76, 3804.
120 A. Burke. Electrochim, Acta, 2007, 53, 1083.
121 S. R. Forrest, Nature, 2004, 428, 911.
122 C. Dimitrakopoulos, P. Malenfant, Adv. Mater., 2002, 14, 99.
123 S. Roberts, Phys. Rev., 1949, 76, 1215.
124 S. Campbell, H. Kim, D. Gilmer, B. He, T. Ma, W. Gladfelter, IBM J. Res. Dev., 1999, 43, 383.
125 A. K. Tagantsev, V. O. Sherman, K. F. Astafiev, J. Venkatesh, N. Setter, J. Electroceram., 2003, 11, 5.
126 G. Goh, S. Donthu, P. Pallathadka, Chem. Mater., 2004, 16, 2857.
127 W. Wunderlich, Polymer Handbook, ed. J. Brandrupp and E. Immergut, John Wiley & Sons, New York, 3rd
edn, 1989, p. V77.
128 J. Rudd, Polymer Handbook, ed. J. Brandrupp and E. Immergut, John Wiley & Sons, New York, 3rd edn, 1989, p. V81.
129 B. Balasubramanian, K. L. Kraemer, N. A. Reding, R. Skomski, S. Ducharme and D. J. Sellmyer, ACS Nano,
2010, 4(4), 1893.
130 B. Chu, M. Lin, B. Neese and Q. Zhang, J. Appl. Phys., 2009, 105, 14103.
131 J. Xu and C. P. Wong, Composites Part A, 2006, 38, 13.
132 P. Badheka, V. Magadala, N. G. Devaradju, B. I. Lee, E. S. Kee, J. Appl. Polym. Sci., 2005, 99, 2815.
133 P. Barber, S. Balasubramanian, Y. Anguchamy, S. Gong, A. Wibowo, H. Gao, H. J. Ploehn and H. C. zur
Loye, Materials, 2009, 2, 1697.
134 L. Jylha, A. Sihvola, J. Phys. D: Appl. Phys., 2007, 40, 4966.
135 C. Pecharroman, J. S. Moya, Adv. Mater., 2000, 12, 294.
136 Z. M. Dang, L.-Z. Fan, Y. Shen, C.-W. Nan, Chem. Phys. Lett., 2003, 369, 95
137 L. Qi, B. I. Lee, S. Chen, W. D. Samuels, G. J. Exarhos, Adv. Mater., 2005, 17, 1777.
138 Z. M. Dang, J. P. Wu, H. P. Xu, S. H. Yao, M. J. Jiang, Appl. Phys. Lett., 2007, 91, 072912.
139 D. M. Grannan, J. C. Garland, D. T. Tanner, Phys. Rev. Lett., 1981, 46, 375.
140 Z. M. Dang, Y. H. Lin, C. W. Nan, Adv. Mater., 2003, 15, 1625.
141 G. Wang, Appl. Mater. Interfaces, 2010, 2, 1290.
172
142 H. Althues, J. Henle, S. Kaskel, Chem. Soc. Rev., 2007, 36, 1454.
143 B. Hojjati, R. Sui, P. A. Charpentier, Polymer, 2007, 48, 5850-5858.
144 F. P. Rotzinger, J. M. Kesselman-Truttmann, S. J. Hug, V. Shklover, M. Gratzel, J. Phys. Chem., 2004, 108,
5004-5017.
145 A. Testino, I. R. Bellobono, V. Buscaglia, C. Canevali, M. D’Arienzo, S. Polizzi, R. Scotti, F. Morazzoni, J. Am. Chem. Soc. 2007, 129, 3564.
146 A. Maliakal, H. Katz, P. M. Cotts, S. Subramoney, P. Mirau, J. Am. Chem. Soc., 2005, 127, 14655.
147 R. Scotti, M. D’Arienzo, F. Morazzoni, I. R. Bellobono, Appl. Catal. B, 2009, 88, 323.
148 J. Brandrup, E. H. Immergut, E. A. Grulke, “Polymer Handbook”, 4th edition John Wiley, New York, NY,
USA, 1999.
149 H. Althues, J. Henle, S. Kaskel, Chem. Soc. Rev. 2007, 36, 1454.
150 D. Bhadra, A. Biswas, S. Sarkar, B. K. Chaudhuri, K. F. Tseng, H. D. Yang. J. Appl. Phys., 2010, 107,
124115.
151 C. Chiteme, D. S. Mclachlan, Physica B., 2000, 279, 69.
152 C. W. Nan, Y. Shen, J. Ma, Annu. Rev. Mater. Res., 2010, 40, 131.
153 Z. M. Dang, J. P. Wu, H. P. Xu, S. H. Yao and M. J. Jiang, Appl. Phys. Lett., 2007, 91, 072912.
154 L. Jylha, A. Sihvola, J. Phys. D: Appl. Phys. 2007, 40, 4966.
155 J. Mark, T. Erman, B. Eirich, Science and Technology of Rubber, Editors. 1994, Academic Press: San Diego.
156A. Brinke, Silica Reinforced Tyre Rubbers: Mechanistic Aspects of the Role of Coupling Agents. 2002,
University of Twente: Enschede.
157 M. Wischhusen, , Balancing Rolling Resistance with Other Performance Characteristics. Tyre Review, 2010.
158 D.W Schaefer, J. Appl. Crys., 2000, 33, 587-591.
159 National Research Council of the National Academies of Science, Tires and Passenger Vehicle FuelEconomy, Editor, 2006, Washington, D.C.
160 W. Hofmann, "Rubber Technology Handbook", 1996, Hanser/Gardner, Munich.
161 Y. Zhao, S. Perrier, Macromolecules, 2007, 40, 9116-9124.