Embed Size (px)
Citation preview

1
Living with the Carbon Tax
Presentation to the Sydney Institute, July 3rd Miriam Lyons, Executive Director, Centre for Policy Development This paper is an expanded version of a presentation to the Sydney Institute on July 3rd. With thanks to CPD intern Lauren Dawson for her research assistance, and to Ian Dunlop, Ian McAuley and John Quiggin for their feedback on earlier drafts. All conclusions and any mistakes that remain are the author’s own. For more policy analysis or to find out more about the Centre for Policy Development, please see http://cpd.org.au
Brief update: Prime Minister Gillard’s speech on the need to tackle gold-plating of the grid suggests that one of the possible consequences of the carbon tax discussed in my address – the beginnings of an overdue transformation of Australia’s electricity market in the interests of consumers – may well come to pass. Note that only last year Energy Minister Martin Ferguson was dismissive of Ross Garnaut’s argument that increased power bills were mainly due to overinvestment in poles and wires.1
Contents The carbon tax: rhetoric and reality........................................................................................... 1 The carbon tax: negative impacts in context.......................................................................... 2 Impact on households in context............................................................................................ 2 Impact on household electricity prices in context ..................................................... 4
Impact on the economy in context......................................................................................... 7 Impact on trade-‐exposed industries in context........................................................... 7
The carbon tax: benefits in context ............................................................................................ 8 Sparking a transformation of Australia’s electricity grid........................................ 9
Other potential benefits............................................................................................................11 What the carbon tax won’t do.....................................................................................................11 Put Australia ahead of the rest of the world ....................................................................11 Clean up our share of the mess..............................................................................................11
Endnotes...............................................................................................................................................13
The carbon tax: rhetoric and reality Both the advocates and the opponents of the Clean Energy Future package are exaggerating its likely impact. This wouldn’t be the first time that public debate over an economic reform in Australia has suffered from runaway rhetorical inflation, as each side bids up the going rate for hyperbole. Labor’s more excitable predictions on the impact of the GST make for amusing reading in retrospect. Kevin Rudd’s denouncement of the tax in parliament is a great example: “When the history of this Parliament, this nation and this century is written, 30 June 1999 will be recorded as a day of fundamental injustice…It will be recorded as the day when the social compact that has governed this nation for the last 100 years was torn up.”2
Free trade bulls and bears both exaggerated the impact of the US-Australia Free Trade Agreement. The massive gains anticipated by the bulls did not materialise; neither did the gutting of the Pharmaceutical Benefits Scheme predicted by the bears.3
The same is true of the Labor government’s decision to introduce an emissions trading scheme, starting with a three year fixed price. In this paper I’ll refer to that 3-year fixed price as the carbon tax.

2
The carbon tax is probably the most structurally significant economic reform since the GST, and certainly the most unpopular policy implemented by an Australian government in a long time. There are some widespread misunderstandings about the likely costs:
• Over 50% of voters think it will increase fuel prices by a lot, when fuel is of course excluded from the scheme.
• Around 40% of voters think it will increase grocery prices a lot (Treasury modelling indicates less than a dollar a week)
• Around 20% think it will increase interest rates by a lot4
It’s not surprising that many people are under this impression, given the enthusiastically dire predictions of the politicians and commentators who oppose the policy.
So I’d like to start by giving a sense of context and proportion to what business columnist Terry McCrann has called “the most egregious act of national self-harm we have ever seen in this country”.5
Everyone’s entitled to their own opinion, but no one is entitled to their own facts. I can understand people arguing against the carbon tax because they believe it is unnecessary, or poorly designed, or that it represents a broken promise. But when you look at the likely impact of the carbon tax in practice, it’s clear that you can’t mount a credible, fact-based argument that it’s going to, in opposition leader Tony Abbott’s words, “act as a wrecking ball across the economy.”6
The carbon tax: negative impacts in context
Impact on households in context How can we understand what living with the carbon tax will be like for most Australian households? We could start with a little trip down memory lane.
Looking at the movement of Consumer Price Index (CPI) over the long term gives us a reasonable picture of the carbon tax’s likely impact on the cost of living. Treasury projects an initial increase in the CPI of 0.7% from the carbon tax, plus another 0.2% later when it switches to the cap and trade scheme7. Treasury notes that these estimates are conservative and overstate the likely effect on the CPI, as they do not account for one of the policy’s desired effects: product substitution of less carbon intensive goods and services.
By contrast, the introduction of the GST resulted in a 2.5% rise in the CPI in 2000-20018 - a much more noticeable increase in the cost of living. In fact, the closest historical equivalent to the likely experience of living with the carbon tax is the CPI spike of 0.8% that followed Cyclone Larry in 2007. Much as we loved complaining about the price of bananas at the time, the impact on the bottom line of the average household budget was minimal.
3
Figure 1: Impact on cost of living in context
Source: ‘The Carbon Price and the Cost of Living’, p. iv9
NB: This report, prepared by AECOM and CSIRO for The Climate Institute, estimates slightly lower CPI increases than Treasury, but the past CPI impacts depicted above are all based on historical data.
Another way to look at the impact on households in context is to see where carbon tax costs fit into the average household budget.
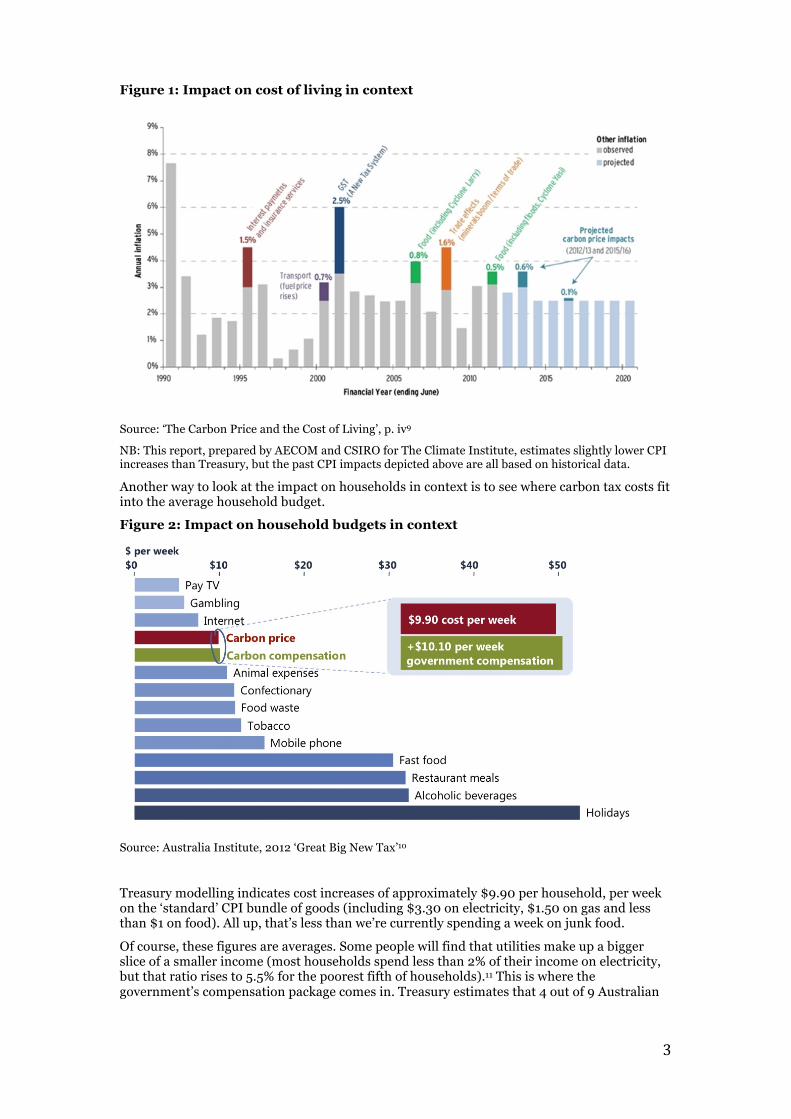
Figure 2: Impact on household budgets in context
Source: Australia Institute, 2012 ‘Great Big New Tax’10
Treasury modelling indicates cost increases of approximately $9.90 per household, per week on the ‘standard’ CPI bundle of goods (including $3.30 on electricity, $1.50 on gas and less than $1 on food). All up, that’s less than we’re currently spending a week on junk food.
Of course, these figures are averages. Some people will find that utilities make up a bigger slice of a smaller income (most households spend less than 2% of their income on electricity, but that ratio rises to 5.5% for the poorest fifth of households).11 This is where the government’s compensation package comes in. Treasury estimates that 4 out of 9 Australian

4
households - mostly those on low incomes - will be overcompensated by around 20 per cent. Overall it’s predicted that 6 out of 9 households will come out ahead or even.12
Again, it’s worth bearing in mind that these costings assume no behaviour change - to reduce consumption of electricity and gas for example. Responses to rising costs are not always straightforward. There are a number of situations in which energy consumption might not fall in response to higher prices – economists would describe this as price ‘inelasticity’:
• when a product makes up such a small percentage of a household’s expenses that changes aren’t noticed.13
• when people don’t have access to easy options for reducing their energy consumption (for example if they can’t afford to make some of the upfront investments required, or restrictions imposed by a landlord make it difficult for them to do so).14
• when people don’t know about easy options for reducing their energy consumption.
• when people are averse to making upfront investments in reducing their energy consumption, even when the medium and long-term savings will clearly make that investment worthwhile (economists describe this as applying an irrationally high ‘discount rate’ – the rest of us know it as short-term thinking).
These factors combined create a strong case for some well-designed complementary measures to accompany carbon pricing, to ensure that all households are able to improve their energy efficiency. Nevertheless, we have good reason to think that behaviour change is likely because, as discussed below, rising electricity prices from the ‘gold-plating’ of Australia’s electricity grid are already leading consumers to reduce demand.
Impact on household electricity prices in context From July 2012 NSW and Queensland residents will receive an estimate of the carbon tax component of average household energy costs on the front page of our bills.15 What we won’t receive is information on the ‘poles and wires’ spending that has been driving massive increases in electricity prices over recent years.16 These increases dwarf the predicted 10% rise17,18 from the carbon tax, and they will continue unless major reforms are made to Australia’s energy market.

5
Figure 3: components of household electricity prices
Source: Australian Energy Market Commission (AEMC), 201119
Figure 3 breaks residential energy costs down into its main components:
• Network costs – made up of distribution (poles and wires) and transmission (the connections between generators and distributors and between state grids). Network costs currently make up around 46% of the average household power bill.
• Wholesale costs – the prices that coal, gas and other generators are able to attract for the electricity they supply through the National Energy Market. Generation currently makes up around 32% of the average bill.
• Retail costs – made up of the costs retailers incur acquiring customers and managing the volatile prices of energy that they on-sell to those customers (plus profits of course). Retail costs currently make up a little under 15% of the average bill.20
Figure 3 shows that the various green schemes (feed in tariffs, the renewable energy target, etc) make up a small proportion of total costs (about 3% combined).21,22 The two columns in the middle estimate electricity prices over 2012/13 and 2013/14 without a carbon tax, and the two columns to the right estimate prices with a carbon tax. The Australian Energy Market Commission estimates that the overall increase in residential energy prices between 10/11 and 13/14 would have been 29.4% without the carbon tax, and will be 37.2% with it.
This picture helps explain why energy prices have been rising so rapidly recently – around 40% in real terms between 2007 and 2010.23 The back-story is the more than $47 billion24 of infrastructure spending on the electricity network in the pipeline between 2010 and 2015. Compared to the National Broadband Network, the cost-effectiveness of this investment has received remarkably little scrutiny, and discussion of alternative options has until now failed to make front-page news.
The rapid rise in network spending is due to these main factors:
6
• A rapid increase in peak demand (big spikes in electricity usage, usually on very hot and cold days). Billions have already been spent to cope with a surge in demand that is confined to four or five extremely hot days a year.25 The growth of air conditioner usage is a big part of this story – it’s estimated that each additional air conditioner adds $7,000 of network costs for every $1,500 unit sold – costs which are currently subsidised by other users.26
• Electricity market rules that encourage 'over-investment'. The network companies, both state-owned and private, are given a generous profit margin on whatever new capital spending they plan to make. Most businesses could only dream of being assured a guaranteed profit on whatever they spend. The government’s former climate change adviser Ross Garnaut found that the rules currently governing the National Electricity Market are leading to what he called 'gold plating' of the grid.27
A discussion of what could be done to deal with this problem can be found below under the heading ‘Sparking a transformation of Australia’s electricity grid’.
Other factors also contribute to some extent, such as state governments imposing higher reliability standards on electricity networks. Victoria has refrained from doing this, which has led to lower cost increases so far. Some spending is genuinely needed to replace infrastructure that has reached the end of its working life, but nothing like the amount that is currently in the pipeline.28
Finally, it’s worth noting that retail costs are likely to account for 26% of the price rises between 11/12 and 13/14, and have received even less scrutiny.29 Retailers calculate their margins as a percentage of total costs, which are of course going up for the reasons already stated, and regulators in some states are allowing retailers to charge more due to increased costs as more customers switch between retailers30 (which in turn may have been sparked by rising prices – potentially a recipe for an inflation spiral in the retail cost component).
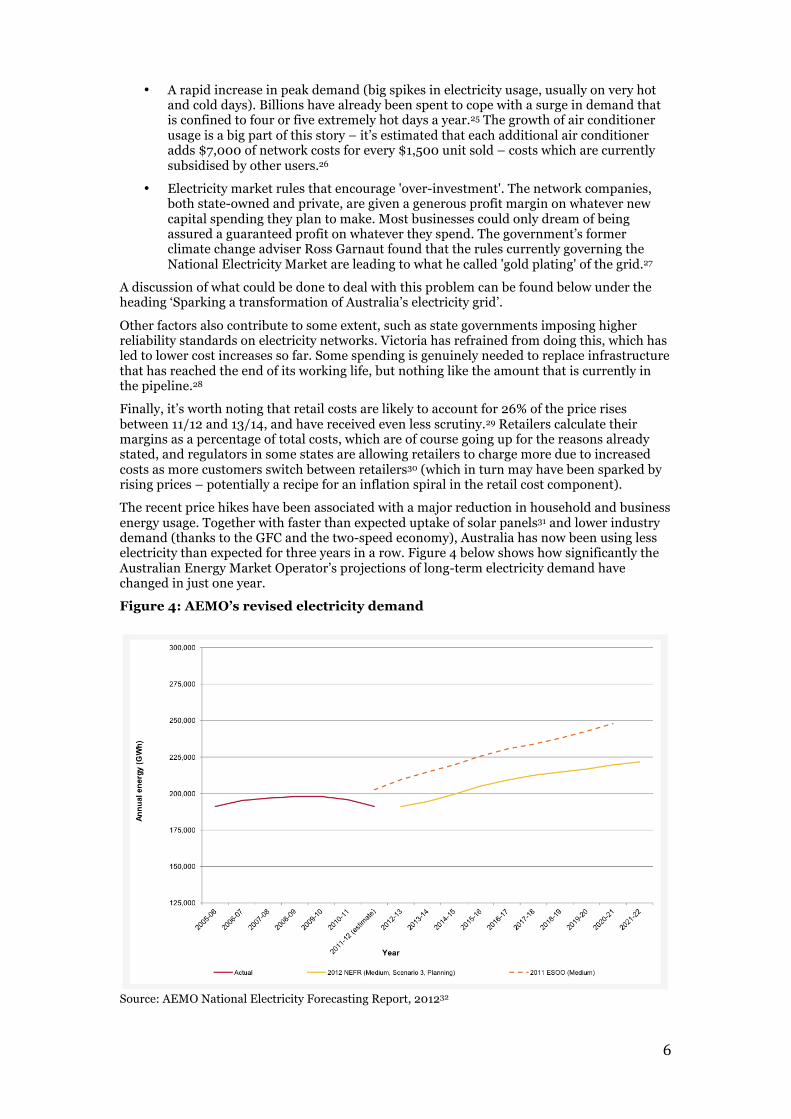
The recent price hikes have been associated with a major reduction in household and business energy usage. Together with faster than expected uptake of solar panels31 and lower industry demand (thanks to the GFC and the two-speed economy), Australia has now been using less electricity than expected for three years in a row. Figure 4 below shows how significantly the Australian Energy Market Operator’s projections of long-term electricity demand have changed in just one year.
Figure 4: AEMO’s revised electricity demand
Source: AEMO National Electricity Forecasting Report, 201232
7
The collapse in demand has resulted in the lowest wholesale electricity prices seen since the establishment of the National Energy market – they have fallen by 20% in each of the last two years.33 Consumers are yet to see the benefit of these lower prices on their bills, although they may help to offset the impact of the carbon tax and rising global coal and gas prices34 on generation costs.
There is reason to believe that the turnaround in demand depicted in Figure 4 is not just a blip, but represents the beginning of a step change in Australia’s electricity market. The implications of this are discussed below under the heading ‘Sparking a transformation of Australia’s electricity grid’.
Impact on the economy in context So much for the impact of the carbon tax on households. What of the broader economy? We’ve already seen that it’s likely to have a small inflationary effect. As with households, the effect on electricity prices for business is likely to be small compared to other drivers for most businesses.35 As a ‘great big new tax’ its claim to greatness is questionable. It will raise around $15 billion in revenue once the free permits are taken into account36 - more than motor vehicle taxes and less than payroll taxes.37 The vast majority of this increased revenue will go towards income tax cuts and higher benefit payments.
Again the GST (which currently raises around $51 billion a year) provides a useful historical reference point for understanding what ‘living with the carbon tax’ will be like for the business sector. Relatively few businesses will have to deal with the compliance requirements of the carbon tax, compared to every Australian business becoming a tax collector under the GST. The underlying health of Australia’s economy is stronger than it was when the GST was introduced, with lower employment, lower interest rates and less underlying inflationary pressure.
Economic indicator38 GST Carbon tax
Unemployment at the time of introduction
6.6% in 1999-2000 5.2% in 2011-2012 (with a higher participation rate than in ’99/00)39
Interest rates at time of introduction
RBA cash rate 6% in 2000
RBA cash rate 3.75% in 2012
Underlying inflationary pressure
CPI pre-GST 3.2% CPI pre carbon tax 1.6%
Impact on trade-‐exposed industries in context
What of the commonly cited argument that the carbon tax will make emissions-intensive exporters uncompetitive?
Firstly, we should remember that over 90% of economic activity and over 95% of employment in Australia either doesn’t create a lot of direct carbon emissions (so the carbon tax would represent less than 5% of costs) or could not be moved overseas.40
Secondly, just as the impact on retail electricity prices is small compared to the ongoing impact of network spending, the impact on export-exposed industries is small compared to the ongoing impact of the high Australian dollar.
Paul O’Malley, CEO of Bluescope Steel, pointed this out when commenting on the company’s recent financial losses: "The key things we are facing are the macro-economic challenges

8
around the high Aussie dollar, high raw material prices, and low steel prices - it's definitely not about carbon."41
Naturally this did not stop affected business leaders (including Bluescope) from playing up the likely impact of the carbon tax ahead of its implementation42 – exaggerated claims of job losses have long been a key tactic used by lobbyists in the face of oncoming economic reform. In this case they were successful – after receiving between 66 and 94.5 per cent of their permits for free, plus industry assistance, Australia’s high-polluting exporters will effectively be paying a carbon tax of around $1 to $8 a tonne.43
Aluminium producers are among those that will pay the carbon tax on only 5.5 per cent of their emissions. Greg Combet pointed out that “the average carbon price impact on local smelters, per tonne of aluminium produced, is equivalent to the impact of a one cent rise in the value of the Australian dollar”.44
Grattan Institute research found that in many cases substantially more compensation and free permits have been issued than can be justified by the concern that polluting businesses would shift to other countries without carbon taxes. It also found that the steel sector will in fact be overcompensated for the impact of the carbon tax.45
The carbon tax: benefits in context Just as there’s no justification for calling the carbon tax a ‘wrecking ball’, it would also be an exaggeration to describe the carbon tax and its associated policies as “implementing a comprehensive plan for a clean energy future for our nation.”46 With a modest emissions reduction target, major emitting sectors like transport excluded and billions of dollars worth of free permits for coal-fired power plants, it would be more accurate to describe the overall package as a valuable but incomplete plan for a cleaner energy future than we would have had otherwise.47 The benefits of the policy are nevertheless important, especially when compared to the consequences of ongoing inaction.
The carbon tax and subsequent emissions trading scheme is designed to deliver emissions 5% lower than 2000 levels in 2020 (a target which the Coalition shares), and 80% lower by 2050. This is to be achieved by:
• Providing a financial incentive for energy efficiency.
• Making gas-fired energy generation or renewables more attractive than coal for some investments.
• Providing a financial incentive for other changes – such as flaring or using waste gas from coal and gas mining, or reducing nitrous oxide emissions from chemical manufacturing plants.
• Paying other countries with lower emissions abatement costs to cut their carbon emissions on our behalf (this applies to the trading scheme phase not the carbon tax, and is to be capped at half of the carbon credits of each business covered by the scheme).48
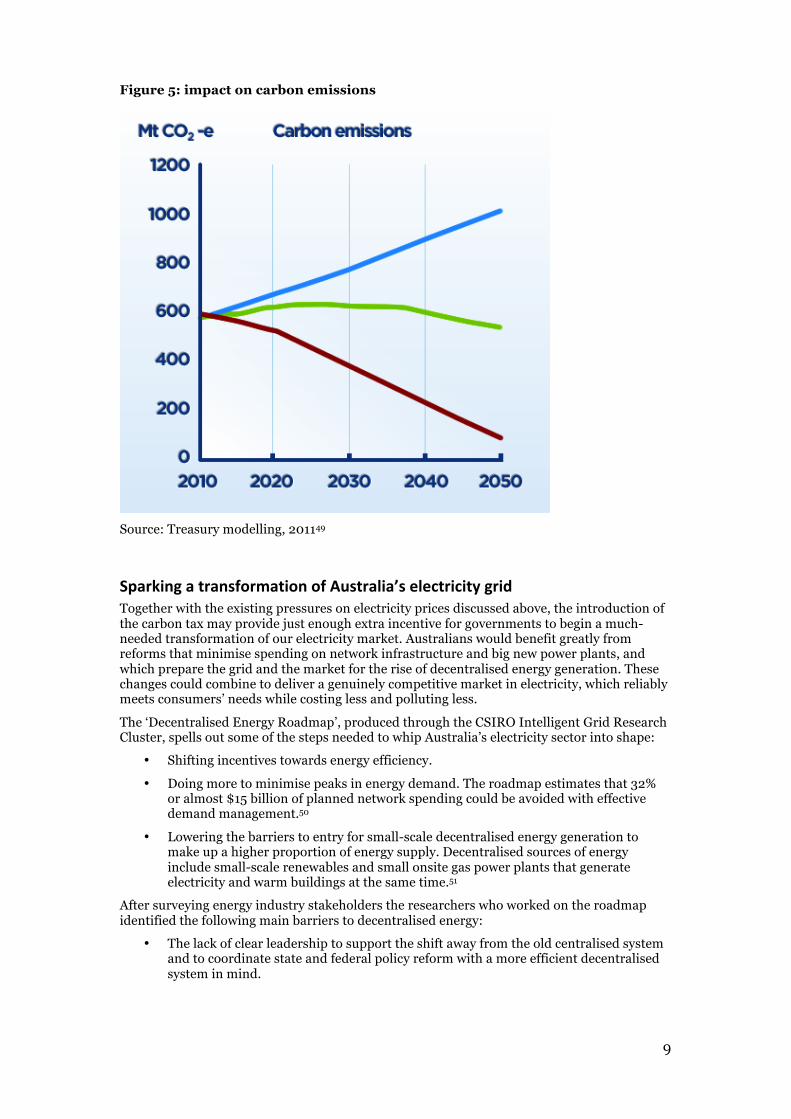
Figure 5 below depicts the impact of the carbon tax and trading scheme on Australia’s emissions. The blue line is business as usual, the green line represents emissions without counting carbon credits purchased overseas, and the red line depicts emissions reductions when those credits are counted.
9
Figure 5: impact on carbon emissions
Source: Treasury modelling, 201149
Sparking a transformation of Australia’s electricity grid Together with the existing pressures on electricity prices discussed above, the introduction of the carbon tax may provide just enough extra incentive for governments to begin a much-needed transformation of our electricity market. Australians would benefit greatly from reforms that minimise spending on network infrastructure and big new power plants, and which prepare the grid and the market for the rise of decentralised energy generation. These changes could combine to deliver a genuinely competitive market in electricity, which reliably meets consumers’ needs while costing less and polluting less.
The ‘Decentralised Energy Roadmap’, produced through the CSIRO Intelligent Grid Research Cluster, spells out some of the steps needed to whip Australia’s electricity sector into shape:
• Shifting incentives towards energy efficiency.
• Doing more to minimise peaks in energy demand. The roadmap estimates that 32% or almost $15 billion of planned network spending could be avoided with effective demand management.50
• Lowering the barriers to entry for small-scale decentralised energy generation to make up a higher proportion of energy supply. Decentralised sources of energy include small-scale renewables and small onsite gas power plants that generate electricity and warm buildings at the same time.51
After surveying energy industry stakeholders the researchers who worked on the roadmap identified the following main barriers to decentralised energy:
• The lack of clear leadership to support the shift away from the old centralised system and to coordinate state and federal policy reform with a more efficient decentralised system in mind.

10
• The fact that electricity market regulators are not allowed to consider environmental objectives in their decision-making, leading to unnecessary inconsistency and duplication between environmental and electricity policies.
• The fact that electricity prices do not reflect true costs, so neither electricity companies nor consumers have an incentive to manage demand to minimise those costs.52
The researchers modelled a scenario in which growth in peak demand through to 2020 is met with decentralised energy and demand management rather than additional coal-fired power, and found it would save around $2 billion a year in network costs. They also found that Australia could spend 5% a year less on our energy by retiring around 7,000 megawatts of coal-fired power capacity and replacing it with decentralized energy, renewables and some peaking gas plants.53
Several specific ideas for reducing network infrastructure spending are being proposed now that the issue is emerging from the shadows. George Maltaborow of Ausgrid has suggested that network companies be allowed to split savings from demand management measures with consumers.54 An energy market rule change has been proposed to the AEMC to remove some of the barriers to on-site generation of combined heat and power (co-generation) and heat, power & cooling (trigeneration).55
A number of reviews currently underway may provide the federal and state governments with further impetus to make some major changes. The AEMC’s ‘Power of Choice’ review, due out in September, is looking at options for encouraging demand management. The AEMC has also been reviewing reliability standards to see if it’s worth paying such a high price to avoid the risk of blackouts.56 Changes to the way that spending is approved for network companies have been proposed,57 and the Productivity Commission is currently assessing the efficiency of electricity distribution companies.58
There’s a danger that governments will respond to all these reviews with an ad-hoc mix of reforms that tinker at the edges of our electricity market, adding complexity without realising the full benefits of demand management and decentralised generation. Policy makers should be guided by the future direction of our energy system, rather than what they see in the rear-view mirror:
• Profit-making will shift from increasing the volume of electricity sales to improving the quality of electricity services.
• The benefits of avoiding capital spending on networks and big centralised generators will need to be shared efficiently and fairly.
• The electricity market will need to accommodate the rapid uptake of renewables that are falling in cost, fast.
A new report from the Bureau of Resources and Energy Economics found that renewable energy sources like wind and rooftop solar could be among the cheapest sources of electricity in Australia by 2030.59 The idea that Australia’s coal-fired power could be replaced with renewable energy is an increasingly mainstream concept – the old assumptions that ‘renewables can’t do baseload’ or ‘renewables will always be too expensive’ have been comprehensively debunked.
The combination of rising retail electricity prices and falling solar photovoltaic prices is giving residents and businesses an incentive to install solar PV that will outlast the various schemes currently in place to promote its uptake. A new report from the Australian Energy Market Operator found that installed solar PV capacity had grown from 23 megawatts in 2008 to an estimated 1,450 megawatts by February this year. While the breakneck growth may slow for a few years if feed-in-tariffs are reduced or phased out, costs are coming down to the point that it still expects increased uptake to ‘offset a large amount of energy that would have otherwise been provided by the NEM.’60
Around the world, policies like feed-in-tariffs and mandatory renewable targets have contributed to the rapid drop in solar PV costs – bridging the gap with fossil fuel prices long enough for solar businesses to ‘learn by doing’ and compete to cut costs in a market that grew 44% a year between 1990 and 2009. The cost of solar PV has gone down by 19 percent for every doubling in installed capacity.61 While various studies have found that such policies (like

11
the Coalition’s preferred ‘direct action’ measures) are more expensive per tonne of emissions reduction than carbon taxes or trading schemes,62, 63 they seem to have been very successful at allowing an emerging industry to develop to the point where it has a shot at causing some old-fashioned Schumpeterian destruction in the energy market.
Established and profitable oligopolies tend not to welcome fundamental challenges to their business models, so it will be important that policy-makers protect the rights of consumers in this new era and ensure that they share in the benefits of reducing the costs of the network, either by reducing their demand or generating their own electricity with solar PV.
Other potential benefits There are a few other potential benefits to consider:
• Even if the carbon tax is abolished by an Abbott government, it will have led many businesses to set up energy accounting and management systems which they will probably keep using to manage rising electricity costs.
• Experience in managing carbon emissions could prove increasingly useful for exporters and multinational businesses if the number of countries and states with carbon reduction policies continues to grow. The strong media focus on poor outcomes from Copenhagen and Cancun has distracted attention from the rapid expansion in the number of countries, states and local councils implementing renewable energy targets, carbon trading schemes and carbon taxes.64
• Australia has a lot to lose from climate change. The number of record hot days has more than doubled over the past 50 years.65 There are estimates that we could see 20% more months of drought and a 25% rise in high and very high fire danger days by 2030.66 Our agricultural exports are vulnerable to declining rainfall and rising temperatures67 and our tourism sector faces rising threats to key natural assets like the Great Barrier Reef.68 Over 425,000 homes are within 3 kilometres of the coast and are likely to see rising insurance premiums as more frequent flooding and severe storms combine with rising sea levels.69 We therefore have a lot to gain from emissions reductions by other countries. As a middle-power, demonstration is one of the more potent diplomatic tools at our disposal when encouraging other countries to take action. By showing that impacts of the tax are manageable we can help to maintain the global momentum towards stronger emissions reduction policies.
What the carbon tax won’t do
Put Australia ahead of the rest of the world While the carbon tax and subsequent trading scheme will hopefully remove our status as one of the worst per-capita emitters in the world,70 it will not transform us into a global leader. Because of the different forms of action that are currently being taken in different countries it is difficult to compare carbon prices across jurisdictions, but analysis by the Climate Institute finds a number of states that have higher effective prices than Australia’s carbon tax.71
Clean up our share of the mess The carbon tax also won’t come close bringing Australia’s emissions back within our share of the world’s carbon budget. To have a 50% chance of keeping global warming to 2 degrees or less, the world can only emit a further 1,200 gigatonnes of carbon dioxide, a budget which will be used up in less than 33 years on our current trajectory. Australia, as one of the world’s highest per capita carbon emitters, runs out of our share of that budget in 5 to 8 years.72 Given the growing evidence that positive feedback loops are kicking in at less than 2 degrees of warming, sensible climate management would assume even smaller carbon budgets.73
Even when we take the growing number of emissions reduction policies adopted by governments across the world into account we are still on a path to over 4 degrees of

12
warming. The last time things got that hot the planet had no large ice sheets on the planet, and sea levels were 65–70 metres higher than today.74
Figure 6: when science meets politics
Source: Climate Interactive Scoreboard, 201275
Contrasting the scale of the challenge with an awareness of the current state of politics can lead to what psychologists have called the ‘what the hell effect’. Dieters who realise that they have broken their diet for the day tend to go on to consume even more calories than the indulgence that pushed them over the edge, with the justification that they’ve already failed, so why keep trying?
Likewise, opponents of action to reduce carbon emissions sometimes argue that we should give up on mitigation and focus instead on adaptation. This is the equivalent of saying that the world will never stick to an ambitious diet, so we should instead rely on the riskier and more expensive options of heart surgery and stomach stapling further down the track.
It’s true that enough climate change has already been ‘locked in’ that some very expensive adaptation measures will probably become necessary. However, research indicates that reducing emissions earlier and adapting less is still likely to cost a lot less than waiting longer to reduce them and adapting more.76
Just as waiting until you’re obese and then going on a crash diet is more painful than adopting a healthier lifestyle earlier, economists find that every year of delayed action on climate change leads to higher long-term costs.77
Climate change is ultimately a consequence of human cleverness. The appropriate response to the dangers we’ve created for ourselves on the path to progress is not to abandon the idea of progress or indulge in panic or guilt. The appropriate response is to take responsibility for the consequences of our actions. We can use the cleverness that got us here and the resources that civilisation has delivered to ensure that we have the best possible chance of continuing to make progress as a species.
That’s the context in which the consequences of ‘living with the carbon tax’ should be judged.

13
Endnotes 1 Drape, J. (2011) ‘Ferguson critical of Garnaut’s power play’, AAP, Sydney Morning Herald, April 1 2011
http://news.smh.com.au/breaking-‐news-‐national/ferguson-‐critical-‐of-‐garnauts-‐power-‐play-‐20110401-‐1crcc.html
accessed June 2012
2 Schubert, M. (2012), ‘If the political hyperbole doesn’t get them, the reality check will’, The Age, June 24 2012
http://m.theage.com.au/opinion/politics/if-‐the-‐political-‐hyperbole-‐doesnt-‐get-‐them-‐the-‐reality-‐check-‐will-‐20120623-‐
20vb5.html accessed June 2012
3 Quiggin, J. (2010), ‘Lessons from the Australia-‐US Free Trade Agreement’, Inside Story, 22 November 2010
http://inside.org.au/lessons-‐from-‐the-‐australia%E2%80%93us-‐free-‐trade-‐agreement/ accessed June 2012
4 Essential Media Communications (2012), Impact of Carbon Tax, Essential Report, June 25 2012,
http://essentialvision.com.au/impact-‐of-‐carbon-‐tax accessed June 2012
5 McCrann, T. (2011) ‘Time for a change of climate’, The Australian, October 22 2011,
http://www.theaustralian.com.au/business/opinion/time-‐for-‐a-‐change-‐of-‐climate/story-‐e6frg9k6-‐1226173504996
accessed June 2012
6 Abbott, T. (2102) ‘The Carbon Tax: 100 days to go’, Press Release, 23 March 2012,
http://www.tonyabbott.com.au/LatestNews/PressReleases/tabid/86/articleType/ArticleView/articleId/8642/The-‐
Carbon-‐Tax-‐100-‐Days-‐to-‐Go.aspx accessed June 2012
7 The Treasury, (2011) ‘Australia with Carbon Pricing’, Chapter 5 in ‘Strong Growth Low Pollution-‐ Modelling a Carbon
Price’, Commonwealth of Australia,
http://archive.treasury.gov.au/carbonpricemodelling/content/report/09chapter5.asp accessed June 2012
8 Hatfield-‐Dodds, S., Feeney, K., Shepherd, L., Stephens, J., Garcia, C., and Proctor, W., (2011), ‘The Carbon Price and the
Cost of Living: Assessing the impacts on consumer prices and households’, A report to The Climate Institute prepared by
CSIRO and AECOM, Sydney, p. iv http://www.climateinstitute.org.au/our-‐work/flagship-‐projects/cost-‐of-‐living-‐
report.html accessed June 2012
9 ibid
10 TAI (2012), ‘How Big is the Great Big New Tax?’, The Australia Institute, 2012, https://www.tai.org.au/node/540
accessed July 2012
11 Hatfiled-‐Dodds, S. et al (2011), op cit p. 25
12 See http://www.cleanenergyfuture.gov.au/clean-‐energy-‐future/our-‐plan/supporting-‐australian-‐
households/#content03 accessed June 2012
Additional Treasury analysis showing that 75% of households earning up to $150,000 a year would be fully or
overcompensated is available at
http://www.treasurer.gov.au/wmsDisplayDocs.aspx?doc=economicnotes/2012/022.htm&pageID=012&min=wms&Year
=&DocType=4 accessed June 2012
13 This might be true for most households if it were not for the fact that quarterly billing makes price changes much more
noticeable. See page 18 of ‘What are we complaining about? An analysis of cost of living pressures’ for a discussion of
perception and evidence on energy prices. McAuley, I. (2011) ‘What are we complaining about? An analysis of cost of

14
living pressures’, Centre for Policy Development, December 2011, http://cpd.org.au/2012/02/cost-‐of-‐living/ accessed
June 2012
14 It’s worth noting that many effective options for reducing energy usage are both very cheap and don’t require a
landlord’s permission. Some examples can be found at http://theconversation.edu.au/the-‐carbon-‐tax-‐neednt-‐cost-‐you-‐
easy-‐ways-‐to-‐cut-‐energy-‐costs-‐7879 and http://www.switchthefuture.com.au/Energy-‐Efficiency/ accessed June 2012
15 Angel, J. (2012), ‘ Why doesn’t Gillard defend her carbon tax?’, ABC Online
http://www.abc.net.au/environment/articles/2012/06/28/3534685.htm accessed June 2012
16 While electricity prices have been rising much faster in Australia than other developed countries, we still have
relatively low prices by global standards. Garnaut, R. (2011) Climate Change Review, ‘Update Paper 8: Transforming the
electricity sector’, March 2011, http://www.garnautreview.org.au/update-‐2011/update-‐papers/up8-‐transforming-‐the-‐
electricity-‐sector.html accessed June 2012
17 This will rise to 11% ($4.20 per household per week) on the shift from a carbon tax to floating carbon prices. The
Treasury (2011) ‘Australia with Carbon Pricing’, op cit
18 We saw an early test of that estimate when a recent ruling allowed electricity prices to rise by 18 per cent in NSW; 8.4
per cent due to a rise in network costs and 8.9 per cent due to the carbon tax, according to the Independent Pricing and
Regulatory Tribunal. IPART (2012), ‘Changes in regulated electricity retail prices from 1 July 2012’, Electricity – Final
Report, June 2012, p.3
http://www.ipart.nsw.gov.au/Home/Industries/Electricity/Reviews/Retail_Pricing/Changes_in_regulated_electricity_ret
ail_prices_from_1_July_2012 accessed June 2012
19 AEMC (2011), ‘Possible Future Retail Electricity Price Movements: 1 July 2011 to 30 June 2014’, Final Report, 25
November 2011, Sydney, p.28
20 AEMC (2011) ibid, p. 6
21 AEMC (2011) ibid, p. iv
22 There is however a great deal of room to make the current mix of ‘complementary’ schemes much more cost-‐effective,
better targeted, and better coordinated
23 Department of Resources Energy and Tourism (2011), ‘Electricity Prices’, Clean Energy Package Factsheet, July 2011
24 Langham, E., Dunstan, C., Cooper, C., Moore, D., Mohr, S. and Ison, N. 2011, ‘Decentralised Energy Costs and
Opportunities for Victoria’, prepared by the Institute for Sustainable Futures, University of Technology Sydney for
Sustainability Victoria, November 2011 p. 27, http://www.isf.uts.edu.au/publications/Langhametal2011devictoria.pdf
accessed June 2012. The figure of $42 billion over five years from 2009 often quoted in media reports on this issue is
from earlier data from the Australian Energy Regulator – ISF draws on the same AER data over a different timeframe.
25 Fanning, E. (2012) ‘The Hidden Costs of Infinite Energy’, The Global Mail, February 6 2012,
http://www.theglobalmail.org/feature/the-‐hidden-‐cost-‐of-‐infinite-‐energy-‐part-‐1/19/ accessed June 2012
26 Department of Resources, Energy and Tourism ‘Draft Energy White Paper 2011: Strengthening the foundations of
Australia’s energy future’ Commonwealth of Australia, p22, http://www.ret.gov.au/energy/documents/ewp/draft-‐ewp-‐
2011/draft-‐ewp.pdf, accessed June 2012
27 Garnaut, R. (2011), ‘Update Paper 8: Transforming the electricity sector’, Garnaut Climate Change Review Update,
March 29 2011, http://www.garnautreview.org.au/update-‐2011/update-‐papers/up8-‐transforming-‐the-‐electricity-‐
sector.html

15
28 Manning, P. and Robins, B. (2012) ‘High power rates: it's a poles and wires story’, Sydney Morning Herald, June 12
2012,
http://www.smh.com.au/business/high-‐power-‐rates-‐its-‐a-‐poles-‐and-‐wires-‐story-‐20120611-‐
20603.html#ixzz23ELey76Z accessed June 2012
29 AEMC (2011), op cit, p. iii
30 AEMC (2011), ibid, p. 14-‐15
31 AEMO (2012), ‘South Australian Electricity Report’, p. 4, http://www.aemo.com.au/en/Electricity/Planning/South-‐
Australian-‐Advisory-‐Functions/~/media/Files/Other/planning/2012_South_Australian_Electricity_Report.pdf.ashx
32 AEMO (2012), ‘National Electricity Forecasting Report. For the National Electricity Market (NEM)’, p. 35,
http://www.aemo.com.au/en/Electricity/Forecasting/2012-‐National-‐Electricity-‐Forecasting-‐Report accessed June 2012
33 Sandiford, M. (2012), ‘A spotlight on Australia’s great electricity story’, Climate Spectator, June 27 2012,
http://www.climatespectator.com.au/commentary/spotlight-‐australias-‐great-‐electricity-‐story accessed June 2012
34 Garnaut, R. (2011) op cit
35 Business and household electricity prices don’t always move together, but recent price rises have affected both
sectors. Garnaut, R. (2011) ibid
36 Edis, T. (2012), ‘The amazing disappearing carbon tax grab’, Climate Spectator, May 17 2012,
http://www.climatespectator.com.au/commentary/amazing-‐disappearing-‐carbon-‐tax-‐grab accessed June 2012
37 TAI (2012) op cit
38 Keane, B. (2012) ‘When’s a Good Time to Introduce a Great Big New Tax?’ Crikey, June 5 2012,
http://www.crikey.com.au/2012/06/05/whens-‐a-‐good-‐time-‐to-‐introduce-‐a-‐great-‐big-‐new-‐tax/ accessed June 2012
39 ABS (2012) '6202.0 -‐ Labour Force, Australia, Apr 2012’ Australian Bureau of Statistics, Canberra, May 2012,
http://www.abs.gov.au/AUSSTATS/[email protected]/Previousproducts/6202.0Main%20Features1Apr%202012?opendocumen
t&tabname=Summary&prodno=6202.0&issue=Apr%202012&num=&view= accessed June 2012
40 Wood, T. and Edis, T., (2011), ‘New Protectionism under Carbon Pricing; case studies of LNG, Coal Mining and Steal
Sectors, Grattan Institute, Melbourne, p. 33,
http://grattan.edu.au/static/files/assets/8aeed5f0/101_report_new_protectionism.pdf accessed June 2012
41 Chambers, M (2011) ‘BlueScope slumps to new low as dollar devastates steel industry’, The Australian, August 22
2011, http://www.theaustralian.com.au/business/companies/bluescope-‐slumps-‐to-‐new-‐low-‐as-‐dollar-‐devastates-‐steel-‐
industry/story-‐fn91v9q3-‐1226114053655 accessed June 2012
42 Dennis, R. (2011) ‘The industries that cried wolf: An analysis of the claims made by Australia’s big polluters of the
impact of a carbon price’, The Australia Institute, April 2011,
http://www.tai.org.au/file.php?file=/media_releases/PB%2025%20The%20industries%20that%20cried%20wolf%20fi
nal.pdf accessed June 2012
43 Jackson, E. (2012), ‘Spotlight Report’, Global Climate Leadership Review 2012, The Climate Institute, Sydney, p. 20
http://www.climateinstitute.org.au/lcci accessed June 2012

16
44 Combet, G. (2012), ‘Australia's economic transformation: Policies for future prosperity’, National Press Club address,
Canberra, February 22 2012,
http://minister.innovation.gov.au/gregcombet/Speeches/Pages/NationalPressClubaddress.aspx accessed June 2012
45 Wood, T. and Edis, T. (2011), op cit, p. 27
46 Prime Minister Gillard (2011) ‘Securing a clean energy future for Australia’, July 10 2011,
http://www.pm.gov.au/press-‐office/securing-‐clean-‐engergy-‐future-‐australia accessed July 2012
47 For a useful discussion of some of the key contradictions and omissions in the plan, see Denniss, R. and Macintosh, A.
(2012) ‘What nobody wants to say about the carbon tax package’, Crikey, July 10 2012,
http://www.crikey.com.au/2012/07/10/what-‐nobody-‐wants-‐to-‐say-‐about-‐the-‐carbon-‐tax-‐package/ accessed July 2012
48 Commonwealth government (2011), ‘Securing a clean energy future’, p. xiii
http://www.cleanenergyfuture.gov.au/clean-‐energy-‐future/securing-‐a-‐clean-‐energy-‐future/ accessed June 2012
49 Thanks to ABC Online for the image: http://www.abc.net.au/news/specials/climate-‐change/income-‐and-‐emissions/
accessed June 2012
50 Dunstan, C., Boronyak., L, Langham., E., Ison, N., Usher J., Cooper C. and White, S. (2011), ‘Think Small: The Australian
Decentralised Energy Roadmap: Issue 1, December 2011’, CSIRO Intelligent Grid Research Program, Institute for
Sustainable Futures, University of Technology Sydney, p. 8-‐9,
http://igrid.net.au/resources/downloads/project4/Australian_Decentralised%20Energy_Roadmap_December_2011.pdf
accessed June 2012
51 The energy research centre Beyond Zero Emissions questions the value of cogeneration and trigeneration, pointing
out that the emissions associated with coal seam gas mining are very high:
Wright, M. (2011), ‘Warming to a better way’, Climate Spectator, February 8 2011,
http://www.climatespectator.com.au/commentary/warming-‐better-‐way accessed June 2012
Cubby, B. (2011), ‘Coal seam gas 'clean' claims under attack’, Sydney Morning Herald, November 4 2011,
http://www.smh.com.au/environment/climate-‐change/coal-‐seam-‐gas-‐clean-‐claims-‐under-‐attack-‐20111103-‐
1mxy4.html accessed June 2012
52 Dunstan, C. et al (2011), op cit, p. 76
53 Dunstan, C. et al (2011), ibid, p. 72
54 Fanning, E. (2012), op cit, part 2, http://www.theglobalmail.org/feature/the-‐hidden-‐cost-‐of-‐infinite-‐energy-‐part-‐
2/36/ accessed June 2012
55 Thwaites, J. (2012) ‘An AEMC boost to green energy’, June 22 2012,
http://www.climatespectator.com.au/commentary/aemc-‐boost-‐green-‐energy accessed June 2012
56 The O’Farrell government has said it would consider the AEMC’s recommendation that NSW save money by reducing
reliability standards.
Wade, M. (2012) ‘Reliability trade-‐off could deliver lower power prices’, http://www.smh.com.au/nsw/reliability-‐
tradeoff-‐could-‐deliver-‐lower-‐power-‐prices-‐20120801-‐23foo.html accessed August 2012
57 AAP, http://www.climatespectator.com.au/news/gold-‐plating-‐electric-‐assets-‐end-‐aemc
58 Manning, P. and Robins, B. (2012), op cit

17
59 BREE (2012), ‘Australian Energy Technology Assessment’, prepared for the Department of Resources, Energy and
Tourism, Canberra, http://www.bree.gov.au/documents/publications/Australian_Energy_Technology_Assessment.pdf
accessed August 2012
60 AEMO (2012), ‘Rooftop PV information paper’, National Electricity Forecasting, p. iii
61 Dunstan, C. et al (2011), op cit, p. 75
62 Some states designed their feed-‐in-‐tariffs fairly well, phasing subsidies out automatically as costs dropped. Others
made the mistake of implementing overly generous schemes and then dropping them as soon as they proved popular,
resulting in high costs to taxpayers and immature solar industries. Australia’s feed-‐in-‐tariff schemes have often fallen into
the second category.
63 Other studies indicate that the true cost of such schemes is lower due to the ‘merit order effect’, a term for the impact
of renewables with low marginal costs on wholesale electricity prices. For example a forthcoming paper finds that a 30
cent feed in tariff would be cost neutral in Australia once the merit order effect is taken into account.
Melbourne Energy Institute (2012), The Merit Order Effect, (forthcoming)
http://energy.unimelb.edu.au/index.php?mact=News,cntnt01,detail,0&cntnt01articleid=112&cntnt01ori
gid=158&cntnt01returnid=22, accessed June 2012
64 See http://www.cleanenergyfuture.gov.au/why-‐we-‐need-‐to-‐act/what-‐others-‐are-‐doing/ for some examples.
65 CSIRO & BOM, (2010) ‘State of the Climate 2010’, Commonwealth Scientific and Industrial Research Organisation and
Bureau of Meteorology,
http://www.csiro.au/~/Media/CSIROau/Divisions/CSIRO%20Marine%20%20Atmospheric%20Research/StateOfTheCli
mate_CMAR_PDF%20Standard.pdf accessed June 2012
66 Department of Climate Change and Energy Efficiency, ‘Impacts of Climate Change’,
http://www.climatechange.gov.au/climate-‐change/impacts.aspx accessed June 2012
67 Howden I, Crimp S and Nelson S (2009) ‘Australian Agriculture in a Climate of Change’, in ‘Managing Climate Change:
Papers from the Greenhouse 2009 Conference’. (Eds I Jubb, P Holper and W Cai). Casiro Publishing, Oxford UK.
68 Burke, L. et al (2011), ‘Reefs at Risk Revisited’, World Resources Institute, February 2011
http://www.wri.org/publication/reefs-‐at-‐risk-‐revisited/ accessed June 2012
69 Kirkpatrick D (2008) Coastal Retreat About the House,
http://www.aph.gov.au/house/news/magazine/34/ath_34Coastal%20retreat.pdf accessed June 2012
70 World Resources Institute (2010), Climate Analysis Indicators Tool (CAIT) Version 8.0, World Resources Institute,
http://www.wri.org/project/cait/ accessed June 2012
71 Jackson, E. (2012), op cit, p. 26
72 Dunlop, I. (2012), ‘The Future of Energy The Most Likely Scenario – Emergency Action’, Submission on December 2011
DRET Draft Energy White Paper, p. 12, http://cpd.org.au/2012/04/ian-‐dunlop-‐the-‐future-‐of-‐energy-‐the-‐most-‐likely-‐
scenario-‐emergency-‐action/ accessed June 2012
73 Dunlop, I. (2012), ibid, p. 6
74 Hansen, J. (2007), ‘Scientific reticence and sea level rise’, Environmental Research Letters 2,
http://pubs.giss.nasa.gov/docs/2007/2007_Hansen.pdf accessed June 2012

18
75 Climate Interactive Scoreboard, http://climateinteractive.org/scoreboard/scoreboard-‐science-‐and-‐data/climate-‐
interactive-‐scoreboard accessed June 2012
76 For a good summary of the evidence on this, see http://thinkprogress.org/climate/2010/08/27/206596/adaptation-‐
mitigation-‐climate-‐chang/
77 The Treasury, (2011), ‘Strong Growth, Low Pollution: Modelling a Carbon Price -‐ Overview’, Commonwealth of
Australia, July 2011, p. 4
http://cache.treasury.gov.au/treasury/carbonpricemodelling/content/overview/downloads/Modelling_a_Carbon_Price_
Overview.pdf accessed June 2012