Embed Size (px)
Citation preview

Living with the TrinityLesson Plan 3: TheWater Quality Testing Lesson
Session 1 of 3
Learning Objective:Students will be introduced to various indicators that determine the quality of water, such asodor, temperature and appearance. This session is intended to set the stage for discussing otherwater testing methods and field explorations, such as pH and turbidity.
Lesson Activities:Students will develop a hypothesis regarding the “healthiness” of several teacher-made watersamples. Then, they will test their hypothesis using sensory cues.
Student Performance Objectives:• The student will participate in physical and chemical testing of water.• The student will use their senses to make observations.• The student will formulate a hypothesis, gather and analyze evidence and draw conclusions.
Session One Vocabulary:dissolve, wafting, hypothesis, data, conclusion
Materials:• 5 Clear plastic drinking cups (one for each sample)• 5 Thermometers (one per sample)• Substances to be added to water for Samples 1-4
• Sample 1: Clear rubbing alcohol• Sample 2: Clear vinegar• Sample 3: Baby oil• Sample 4: Ground cinnamon and mint leaves
• Clear plastic wrap• Dark-colored permanent marker• Copy of the Water Quality Testing Data Collection Sheet for each student (included)• Room temperature water (enough to fill each of the five clear plastic cups about ¾ full of water)
Before You Start:• This activity requires students to interact with liquids that look like water, but may be harmful to
them if ingested. Review laboratory rules, reminding them that scientists do not eat or drinktheir experiments. This activity should be done as a teacher demonstration if there are anysafety concerns.
• This activity requires that students be able to measure the temperature of a liquid using athermometer. If students have not acquired this skill before they do this lesson, the teacher cantake the temperature of all of the samples while the students observe.
• Prepare to watch a video from the Internet with your students. If you are unsure how to display aWeb site using a projector or other equipment, ask your school computer/technology teacher orlibrarian for help. Otherwise, you may want to plan to do those portions requiring the group towatch video from the Internet in a computer lab. Be sure to bookmark the sites ahead of time.

• To create the five samples:• For the first four test substances, create a mix of one part test substance to four parts water.
Make sure you can still easily smell the test substance by wafting.• The fifth test substance should be room temperature water.• Use a permanent marker to label the cups “Samples 1-5.” Keep a key detailing which
substance is in which numbered cup. Wrap the cups in clear plastic wrap so that the studentswill only be able to use their sense of sight to observe the samples at first.
• To add a bit of variety in the temperatures, use refrigerated water for one of the samples oradd a small amount of ice.
Background Information:Many times people believe they can look at or smell a body of water and make an assumptionabout whether or not the water is clean or healthy enough for humans and other animals todrink. In reality, this is not the case. Sometimes people see things in water, or the water doesn’tlook very clear and they take this to mean that it is “dirty” or unhealthy when, in reality, the watermay not have any known risk factors associated with it. In contrast, and much more importantly,sometimes people will look at a body of water and NOT see anything in it or not smell anythingfrom it and so they will assume that it IS “clean” and thus healthy for them to drink. Again, inreality, this may not be the case. It is possible for water to have neither visible particles nor asmell and still NOT be “clean” or healthy enough for humans and other animals to consume.
Lesson Format:This is a challenging concept and thus this lesson is divided into three distinct parts. The firstsession deals with the idea that we must use more than just our observational skills of sight andsmell to determine if water is “clean” or “healthy.” The second session is a demonstration thatintroduces other methods that scientists use to figure out the overall health of a body of water;and the third session provides an opportunity for students to be able to apply and demonstratetheir understanding of this concept.
Texas Essential Knowledge and Skills (TEKS) for All Sessions:3rd Grade:
Science: 3.1A; 3.2B, C, D, E; 3.3A, C; 3.4A; 3.5A; 3.8A, CLanguage Arts: 3.29A, B; 3.31Social Studies: 3.4C; 3.11B; 3.16E; 3.18A, B
4th Grade:Science: 4.1A; 4.2 B, C, D, E; 4.3C; 4.4A; 4.5B
Language Arts: 4.13A, B; 4.27A, B; 4.28; 4.29Social Studies: 4.7C; 4.9A, B; 4.24A, B
5th Grade:Science: 5.1A; 5.2B, C, D, E; 5.3C; 5.4A; 5.5B; 5.7CLanguage Arts: 5.13A, B; 5.22B; 5.27A, B; 5.28; 5.29Social Studies: 5.27A, B
2010-2011 School Year Science TEKS3rd Grade: 3.1A; 3.2B, C, D, F; 3.3C; 3.4A; 3.9A4th Grade: 4.1A; 4.2B, C, D, F; 4.3C; 4.4A5th Grade: 5.1A; 5.2B, C, D, F, G; 5.4A; 5.9A, C
Lesson Plan 3: TheWater Quality Testing Lesson Page 2
Time Needed for Session One: One Hour
How to Start:1. Pass out a copy of the Water Quality Testing Data Collection Sheet to each student. Set up a
display of the five samples where they are visible to the entire class.2. Say: Take a look at these containers. Do they all look the same? Do they all look like water? Wait
for student responses. What if I told you that only one of these samples is truly “ONLY water?”Would that surprise you? If you were to make an educated guess, which sample would youhypothesize is the “water only” sample? Accept all student answers and reasons.
3. Ask a student to volunteer to make a list of the student reasons on the board. Allow thestudents to discuss and explain their reasoning for choosing the sample they think is only water.Say: Hmm . . . we have a lot of different opinions here. So how can we figure this out? Let’sreview what we know. We know that only one of these five samples is “water only.” But we havemany different opinions, so it looks like we need to gather more evidence before we can figureout which one of these samples is the “water only” sample. One of the methods that scientistsuse to figure things like this out is to eliminate possibilities based on observational evidence. So,using only your sense of sight, do you see anything in the five samples that would allow you tosay that that sample is NOT a “water only” sample? Again, allow students to discuss, explain,brainstorm and reason with one another. Ultimately, the students will select the groundcinnamon and mint leaves sample.
4. Say: OK, so with using one type of observation we have ruled out one of the samples. But wehave four samples left. What is another observational tool that we might be able to use in orderto figure out which one of these samples is the “water only” sample? Allow the students tobrainstorm. Some students will say “taste it.” This is an opportune time to discuss the fact thattasting a sample is NOT an acceptable scientific (or healthy) practice. Scientists do NOT tastetheir experiments, and neither should student scientists.
5. Say: OK, though it is true that tasting is a way of observing, we’ve ruled out tasting the samplesas a method of determining which of the remaining four samples is “only water” since scientistsnever taste their experiments! What are some of the other methods available to us? Eventuallythe students will say “smell it.” Say: Excellent. You are so right! Smelling is an observational tooland it is also a tool used by scientists. But scientists are very safety conscious and they knowthat smelling something directly, putting your nose to it and taking a sniff, could be VERYHARMFUL! So they have invented a way to SAFELY use this observational skill. The technique iscalled “wafting.” When wafting, scientists hold the substance about six inches from their noseand fan the scent towards their face instead of sniffing it directly. Do: demonstrate thistechnique for the students so they can both hear your words and see your technique at the sametime.
6. Say: We are going to try this technique. Now, I know that we have already ruled out one of thesamples through our visual observations, but I’ve included it at one of the centers so that youcan also use this observational tool (wafting of smell) to figure out if the smell will support yourvisual evidence.
Lesson Plan 3: TheWater Quality Testing Lesson Page 3

Steps1. Divide students into five groups.2. Create five “centers” or areas of investigation within your classroom. At each center, place one of
the five samples and a thermometer.3. Before beginning any testing, ask the students to fill in the “Hypothesis” part of the Data
Collection Sheet, offering their guesses for what they think they are going to discover whentesting the water. (Students can make use of the discussion items written on the board.)
4. Assign the first group to begin with sample one, the second group with sample two, etc. Be sureto inform the students that each group will observe each of the five samples.
5. Instruct the groups to take the temperature for each sample first. Then, each student in thegroup will use the observational tools of looking and smelling through “wafting” the sample attheir center. As a group, the students must come to a consensus as to the appearance,temperature and smell of their sample. Tell them that the final column on the chart will be filledin at the very end of the experiment. Have the student groups rotate in such a way that all fivegroups are able to observe all five samples.
6. After all of the data has been collected, ask the students to discuss in their groups thesimilarities and differences between each of the five samples.
7. Direct the students to complete the conclusion section of their sheet. Discuss any surprises theydiscovered.
Lesson Plan 3: TheWater Quality Testing Lesson Page 4

Water Quality Testing Data Collection Sheet
Hypothesis:Which one of the samples looks like it is only water, with nothing else in it. Why?
Data:
Sample
1
2
3
4
5
Conclusion:After testing the sample, do you accept your hypothesis? Does the evidence you gatheredsupport what you originally thought? If so, why? If not, why?
Lesson Plan 3: TheWater Quality Testing Lesson Page 5
Use 3 words todescribe what itlooks like.(Appearance)
Use 3 words todescribe what itsmells like.
Temperature?(Celsius)
Is this sample“water only”?(Yes or no)

Wrap Up:1. Discuss and define the word “dissolve” with the students. Ask: Can you give some examples of
things that dissolve in water in such a way that you can’t see them? Or smell them? Allowstudents to respond. Do you think the samples you investigated today may have substances inthem that you can’t see or smell? Or sometimes see but not smell? Or sometimes smell but notsee? Allow students to respond. Can we know for sure something is in the water when we can’tsee it or smell it? Are there other ways of testing or other types of tests that could be conducted?
2. Say: Do you feel confident in your results? Do you feel that we have gathered enough evidence tobe really certain that the water we have selected is really the “water only” sample? Allow thestudents to discuss their doubts and reasoning. Eventually, the students will say, “No.”
3. Say: You know, scientists are the exact same way. They too don’t feel confident enough to makea conclusion based only on what they see and smell. So scientists have taken the next step andhave invented more ways to gather evidence to help them figure out if the water samples theyare dealing with truly are “clean” and “healthy” enough for humans and other animals to consumeor eat. In our next session, we will learn more about these other methods and learn a little bitabout the types of scientists that do this kind of work.
4. Collect the students’ Water Testing Data Collection Sheets for use during Session 2.
Lesson Plan 3: TheWater Quality Testing Lesson Page 6

Session 2 of 3
Learning Objective:Students will be introduced to water quality testing methods that scientists use to assess anddetermine the health of water within water bodies such as the Trinity River.
Lesson Activities:Students will create a class model of the Trinity River using a clear container and householdmaterials. As they assemble the model, they will learn information about the tests scientists useto assess water quality.
Student Performance Objectives:• The student will observe a demonstration and record important information.• The student will learn there are seven different indicators of water quality that scientists test for
to assess water quality.
Session 2 and 3 Vocabulary:dissolve, dissolved solids, oxygen, dissolved oxygen, habitat, pollution, organism, nutrients, pH,acid, fecal coliform
Materials:• A small container of chocolate sprinkles• About 3 chopped lemons or a small container of lemon juice• Red food coloring• About 10 green leaves (can be real or artificial)• About 2 cups of fish-shaped crackers• About 1 cup of gummy worms (optional)• An old magazine or newspaper circular• Cut up labels from drinking water bottles or bottle caps• A clear glass or plastic container (e.g., a Pyrex beaker or baking dish, a clear plastic storage dish)• Enough water to fill the clear container about half way• Completed Water Quality Testing Data Sheet from Session 1
Before You Start:• Have the clear container filled half way with water and all of the materials lined up in the
demonstration area before students arrive to pique their interest.• This lesson can be modified to fit the background knowledge level of your students. The words
in brackets are the more difficult scientific terms used by biologists to explain water qualitytesting. Those words are defined in the Glossary for the lessons. There are also specificexamples for these terms that you can use in lieu of the actual terms.
Time Needed for the Demonstration: 30 Minutes to One Hour
Lesson Plan 3: TheWater Quality Testing Lesson Page 7

How to Start:1. Pass back the Water Quality Testing Data Sheet from the previous session. Again, have the 5
samples from the previous session in front of you. Have cards in front of each sample that havethe “answers” to what is mixed with the water faced down (so the students cannot see theanswers). Ask: What does “clean” mean? Ask a volunteer to come to the board and list theanswers that students provide.
2. Say: “Clean” seems to mean different things to different people, doesn’t it? Well let’s narrow thequestion. In the last lesson we were testing water to determine if we could see or smell if thingswere added to the water. You guys showed me that sometimes we can see things in water;sometimes we can smell things in water; sometimes we can do both; and sometimes we can’t doeither one! But just because we couldn’t see or smell something in the water, does that meanthat it was “clean?”
3. Say: Let’s look at our samples again.a. Based on your data and conclusions from our first experiments, what did you find about
sample 1? Answers will vary but may be similar to “it had a bad smell,” “it looked kind of clearbut kind of murky,” etc. Ask: So what did you conclude?
b. Based on your data and conclusions, what did you find about sample 2? (Similar answers assample 1).
c. Sample 3? (Students may not have been able to detect any smell, and it may be cleardepending on your mixture).
d. Sample 4? Student answers will vary but may be similar to “it had a good smell,” “we could seestuff floating in it,” etc.
e. Sample 5? (Students will not have been able to detect any smell and it will be clear).4. Say: So now, after discussing all of our options, shall we see if we got it right? Turn over the
cards one at a time and allow the students to discuss. Say: sample 1 had rubbing alcohol. It hada smell that you didn’t like but it wasn’t easy to see. Sample 2 had vinegar and it too had asmell you didn’t like but couldn’t really see. Sample 3 had baby oil and you couldn’t smell or seethat!! And Sample 4 had cinnamon and mint. It had a smell that most of you did like and it waseasy to see. Sample 5 is the “water only” sample. But knowing this . . . which of the sampleswould you say are “clean?” Allow the students to discuss. All will agree that sample 5 is “clean”and most will say that the other 4 are not because they have something in them.
5. Say: but you didn’t see or smell anything in sample 3 (baby oil) so why isn’t it clean? And don’twe eat cinnamon and mint? Just because they created a smell and we could see them in thewater, does that really make the water “unclean?” (Answers will vary but the students may still beconcerned that something is in the water, even if it isn’t harmful)
6. Say: The word “clean” doesn’t really seem to work in this situation, does it? Maybe we should usea different word. What are some words that might fit this situation? (Allow the students theopportunity to brainstorm. Answers will vary but ultimately they will say things like “safe todrink” or “healthy” or possibly “unsafe to drink” or “unhealthy.”) Say: Exactly!! You are socorrect. It really isn’t about what is or is not “clean,” but rather about what is or is not “safe”and/or “healthy.”
7. Continue with the discussion, helping the students to understand that sight and smell alonecannot help us determine whether a body of water is actually safe to drink or healthy fororganisms to live in.
Lesson Plan 3: TheWater Quality Testing Lesson Page 8

8. Say: What about in the real world? Can the water in a stream or river ever be totally clean?Why or why not? (Possible answer: “No, because it’s outside so anything can get into it”). Letstudents respond and explain their answers. But like we learned in our first experiments, “clear”doesn’t always mean “clean” and it doesn’t always mean “healthy.” Say: Scientists have studiedthe water in rivers and streams and they have figured out what it takes for a stream or river tobe a healthy home or habitat for living things [organisms]. Today, we are going to learn aboutways to observe a body of water that will help us recognize if a stream or river is a healthyecosystem or not.
Steps1. Tell the students that scientists who study water [hydrologists] observe several different things in
order to determine if a river is a healthy habitat or home for plants and animals. They arechecking the water to make sure that it is -- “Clean with enough Oxygen and Nutrients for Everyliving thing.” The abbreviation is C.O.N.E. Where the “C” stands for “Clean.” The “O” stands for“Oxygen.” The” N” stands for “Nutrients.” And the “E” stands for “Every” living thing.
2. Point the students’ attention to the clear container of water. Ask them to pretend that it is theTrinity River.
3. Say: Would you guys say that this model river is C.O.N.E? Why or why not? Allow students torespond. Say: Right, it does look “clear” but we learned that clear doesn’t always mean “clean.”We can’t tell if it has enough oxygen just by looking at it, since oxygen is dissolved, and it doesn’tappear to have any nutrients for plants or animals to eat so . . . .no. This river isn’t C.O.N.E
4. Turbidity: It is true that our river water is perfectly clear right now. Turbidity is the measure ofhow clear or cloudy the water is. Our water is very clear now so it is not very “turbid” or cloudy,but is this what a river looks like? What is missing from our river? (Possible answers: fish,plants, insects, frogs, dirt, trash, etc.) Let’s add some dirt [sediment] for plants to grow on thebottom, some fish to swim in it and some animals to live in and by it.
5. Tear the leaves into small pieces and sprinkle them into the water. Sprinkle a few fish-shapedcrackers and gummy worms in as well. Say: NOW, how [turbid] or cloudy is our river? Allowstudents to respond. Say: So like with the sample that had cinnamon and mint in it, we can seethat some turbidity is going to come in the form of food or nutrients for plants and animals toeat. This is essential for life. Totally clear water may NOT mean that the water is healthy orsafe for plants and animals because it may not have the right nutrients for them to survive.
6. Pollution:Say: Another thing that scientists look for to show us if our water is a healthy place for plantsand animals is trash in and around the water. Pretend our river has lots of trash floatingaround in it. How would that affect the plants and animals living in it? Allow students torespond.
7. Do: Rip up small pieces of an old magazine or newspaper circular and toss them into the water.Also, add in some small cut pieces of a drinking water bottle label or a plastic bottle top torepresent the large amounts of plastic waste.
8. pH:Say: Water treatment plants can remove some of the dirty stuff from our water [reference theTrinity River Introductory lesson here if you have already used it with your students], but not allof it. Sometimes water is dirty from what’s floating in it and around it. But sometimes it’s dirtyfrom what’s already in it that we can’t even see.
Lesson Plan 3: TheWater Quality Testing Lesson Page 9

9. Pour in a lot of the lemon juice or squeeze in all three lemons. Say: Can you see the lemon juicethat I just poured into the water? (No) just like we couldn’t see the baby oil in our experiments!How do you think the plants and animals will respond? Is there any way we can get the lemonjuice out of the water? (No) How would you respond if someone poured lemon juice all over yourfood and home all of the time? Wait for responses. Like the cinnamon and mint from before,lemon isn’t “bad” but is it always good? Is it possible for there to be too much? Allow students torespond. Scientists call chemicals like lemon juice “acids”. They can measure if water has toomuch acid or not enough acid with what is called the pH scale. Water has to be balanced withjust enough acid to be a healthy home for the fish, plants and other animals.
10. Dissolved Solids/Fecal ColiformSay: Or, what if lots of large animals like cows lived near the river and drank out of it. They alsoleave their waste in and near the water. A little bit of manure or waste from the cows canprovide the nutrients that will really help the plants in our water grow tall and healthy! But likewith the lemon juice, too much can end up hurting our river. And there are other ways thatwaste can get into our rivers!! Can you think of some of the ways? (examples: pet waste, birdwaste, etc.)
11. Add lots of brown sprinkles to the water. Say: If I leave these sprinkles here long enough, theywill dissolve or join into the water just like we saw in our first experiments. Once the wastedissolves and becomes a part of the water, will it be easy to get it back out? (Answer: It is verydifficult and sometimes impossible to remove dissolved solid waste and other liquids fromwater.) How do you think the fish and plants will respond? Would the water be C.O.N.E? So wecan see, once again, that water can look clean even when it may be harmful for the plants andanimals.
12. Dissolved Oxygen:Say: How do you think fish breathe while they’re in the water? (Possible answers: They getoxygen from the water.) Actually, fish breathe from the oxygen that plants make. Let’s addsome oxygen to the water from the plants that live in or near the water, such as lily pads, reeds,duckweed and cattails. For more information on Texas aquatic plants, visit the Texas AgrilifeExtension Service’s Aquaplant site: http://aquaplant.tamu.edu/database/.
13. Biological Oxygen Demand:Dump in several more fish-shaped crackers and gummy worms. Say: What do you think is goingto happen to all of these new fish and animals I just added to our river? Wait for students torespond and explain their answer. Do they have enough space to swim around? Do you thinkthere’s enough oxygen in the water for them to live? What about nutrients for the plants? HowC.O.N.E is the river now? Allow students to respond.
Wrap Up:• Say: Let’s look at our river now. Pretend you are a scientist who studies water [hydrologist]
trying to figure out if our Trinity River is a healthy habitat for plants and animals. Is it clean?Why or why not? Is there enough oxygen for all of the fish and animals to breathe? Why or whynot? Are there enough nutrients? Is there enough room for all of our fish, frogs and plants togrow? Allow students to respond. During our next session, we are going create our own streammodels and use our C.O.N.E. scale to figure out if they are healthy habitats for plants andanimals.
• Review the steps of the natural water cycle from Lesson Plan 1. Ask the students what they thinkhappens to all of the pollutants in the water that cannot be removed by the water treatmentplant? (Possible answer: The pollutants stay in our water for a long time.)
• Keep your Trinity River Model as an example for the next lesson.
Lesson Plan 3: TheWater Quality Testing Lesson Page 10
Session 3 of 3
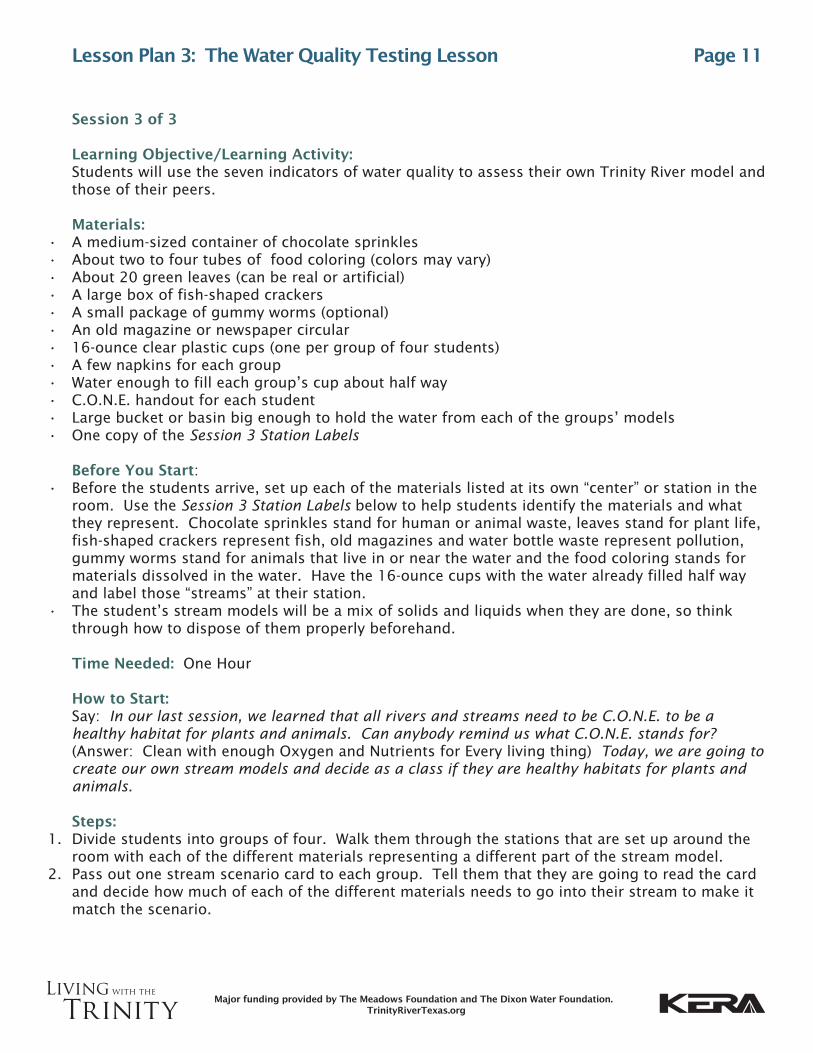
Learning Objective/Learning Activity:Students will use the seven indicators of water quality to assess their own Trinity River model andthose of their peers.
Materials:• A medium-sized container of chocolate sprinkles• About two to four tubes of food coloring (colors may vary)• About 20 green leaves (can be real or artificial)• A large box of fish-shaped crackers• A small package of gummy worms (optional)• An old magazine or newspaper circular• 16-ounce clear plastic cups (one per group of four students)• A few napkins for each group• Water enough to fill each group’s cup about half way• C.O.N.E. handout for each student• Large bucket or basin big enough to hold the water from each of the groups’ models• One copy of the Session 3 Station Labels
Before You Start:• Before the students arrive, set up each of the materials listed at its own “center” or station in the
room. Use the Session 3 Station Labels below to help students identify the materials and whatthey represent. Chocolate sprinkles stand for human or animal waste, leaves stand for plant life,fish-shaped crackers represent fish, old magazines and water bottle waste represent pollution,gummy worms stand for animals that live in or near the water and the food coloring stands formaterials dissolved in the water. Have the 16-ounce cups with the water already filled half wayand label those “streams” at their station.
• The student’s stream models will be a mix of solids and liquids when they are done, so thinkthrough how to dispose of them properly beforehand.
Time Needed: One Hour
How to Start:Say: In our last session, we learned that all rivers and streams need to be C.O.N.E. to be ahealthy habitat for plants and animals. Can anybody remind us what C.O.N.E. stands for?(Answer: Clean with enough Oxygen and Nutrients for Every living thing) Today, we are going tocreate our own stream models and decide as a class if they are healthy habitats for plants andanimals.
Steps:1. Divide students into groups of four. Walk them through the stations that are set up around the
room with each of the different materials representing a different part of the stream model.2. Pass out one stream scenario card to each group. Tell them that they are going to read the card
and decide how much of each of the different materials needs to go into their stream to make itmatch the scenario.
Lesson Plan 3: TheWater Quality Testing Lesson Page 11

3. Let the groups decide how they are going to gather their materials. Let them use napkins tocollect the materials they need. Have them create their model according to the scenario. Then,discuss as a group to fill in their C.O.N.E. handout for their group’s scenario.
4. Ask students to come up front and present their water model and their scenario. As a class, usethe C.O.N.E. handout to decide whether each of the streams is a healthy habitat for plants andanimals. Let the group who is presenting add any additional ideas they had about the streamduring the discussion.
5. When all of the groups have presented their scenarios, ask the students to dump all of theirstreams into one large bucket to show how all of the streams in our area flow into the TrinityRiver. Ask them to share any ideas they have for what they can do to help keep it clean.
Wrap Up:Take a class trip to the Trinity River Audubon Center (www.trinityriveraudubon.org) so studentscan conduct water quality tests firsthand and talk to scientists who conduct these tests in thefield.
Assessment:Ask students to fill in the blanks on the C.O.N.E. Assessment and the Water Quality TestingAssessment using their notes or without any help at all. The C.O.N.E handout provides theanswers for the C.O.N.E. Assessment. Use the Water Quality Testing Assessment questions as aquiz, classwork or homework to reinforce the information. A key with possible student answersis given. Since this lesson is adaptable, be sure to only include questions on your assessmentthat address the particular concepts you emphasized during their lessons.
Curriculum Extensions
Math• Compare the Fahrenheit temperature with the Celsius temperature.• Use the C.O.N.E. handout to evaluate two nearby bodies of water. Ask students to compare and
contrast the two locations using graphs, Venn diagrams and models.Science
• Use a LaMOTTE Water Quality Test kit to test the chemical quality of the water samples.• Use the C.O.N.E. handout to evaluate two nearby bodies of water. Ask students to compare and
contrast the two locations using a Venn diagram.Art
• Create a diorama of the Trinity River Watershed• Ask students to use their creativity and create an ice cream cone that helps them remember the
information from the C.O.N.E. handout. Allow students to share their creations with the class.Language Arts
• Write thank you notes to employees of the local Drinking Water Treatment Plant.• Have students write a funny story about what a day with no water would be like.
Social Studies• Use the internet to research the Safe Drinking Water Act.• Invite a guest from the EPA or Waste Water (or Drinking Water) Treatment plant to speak to your
class.• Find a local hydrologist and ask them to visit your classroom to answer questions students still
have about water testing.
Lesson Plan 3: TheWater Quality Testing Lesson Page 12

Student Web Activities for Centers or Small Groups:
Trinity River Educational Interactives from the Center for Global Environmental Educationhttp://www.trinityrivertexas.org/education/interactives
Environmental Education for Kids from the Wisconsin Department of Natural Resourceshttp://dnr.wi.gov/eek/
Floods from FEMA for Kidshttp://www.fema.gov/kids/floods.htm
Teacher Web Resources:
PBS Kids Go: Zoom Activity- Create your own water filter.http://pbskids.org/zoom/activities/sci/waterfilter.html
Classroom water experiments from Rural Water Providers of Oklahomahttp://www.gettoknowyourh20.com/fun-stuff
Brief history of clean water from National Environmental Services CenterWest Virginia Universityhttp://www.nesc.wvu.edu/old_website/ndwc/ndwc_DWH_1.html
Fecal Coliform Bacteria Discovered in Half of All Fast-Food Sodahttp://www.walletpop.com/blog/2010/01/08/fecal-coliform-bacteria-discovered-in-half-of-all-fast-food-soda/
Water Quality Testing Explained Lesson Plan from Friends of the Chicago River Chicago RiverSchools Network for 7th-12th Grade Students:http://www.chicagoriver.org/upload/Water%20Quality%20Tests%20Explained.pdf
Water Quality Scientist Job Descriptionhttp://www.prospects.ac.uk/p/types_of_job/print/water_quality_scientist.jsp
Hydrologist Job Descriptionhttp://careers.stateuniversity.com/pages/66/Hydrologist.html
For more information on Texas aquatic plants, visit the Texas Agrilife Extension Service’sAquaplantsite: http://aquaplant.tamu.edu/database/
Water teaching resources from the Environmental Protection Agencyhttp://epa.gov/teachers/water.htm
Trinity River Audubon Centerhttp://www.trinityriveraudubon.org/site/PageServer?pagename=Home
Lesson Plan 3: TheWater Quality Testing Lesson Page 13

Water Quality Testing Stream Scenarios
Cut these apart and distribute one to each group in Session 3.
1. Your stream is near a farm where lots of cattle live. Those cows leave their waste really close tothe stream all of the time. Also, the farmers give the cows a lot of different extra medicinestrying to make them grow bigger before he sells them. Those medicines come out in their waste,too. Use the materials to create a stream to represent this situation.
2. The summer was extra hot, so a lot of the animals in your stream died. But the plants continuedto grow and grow. There is also a restaurant by your stream that constantly throws trash and oldfruits into the water. Use the materials to create a stream to represent this situation.
3. It’s springtime at your stream and there are lots of plants, animals and fish. Actually, there areway too many plants, animals and fish. Use the materials to create a stream to represent thissituation.
4. It floods in your area and waste from the nearby sewage plant gets into your otherwise healthyriver. Just think about all of the bad things that we flush down the toilet, like medicines andchemicals! Use the materials to create a stream to represent this situation.
5. Your stream is near the highway, so when people throw trash out of their window, it lands inyour stream. Also, the oil and dirt from the cars washes into your stream when it rains. Use thematerials to create a stream to represent this situation.
6. Your stream has water that is just right on the pH scale. It also has water that is crystal clear, butwith very few plants, animals or fish. Use the materials to create a stream to represent thissituation
Lesson Plan 3: TheWater Quality Testing Lesson Page 14
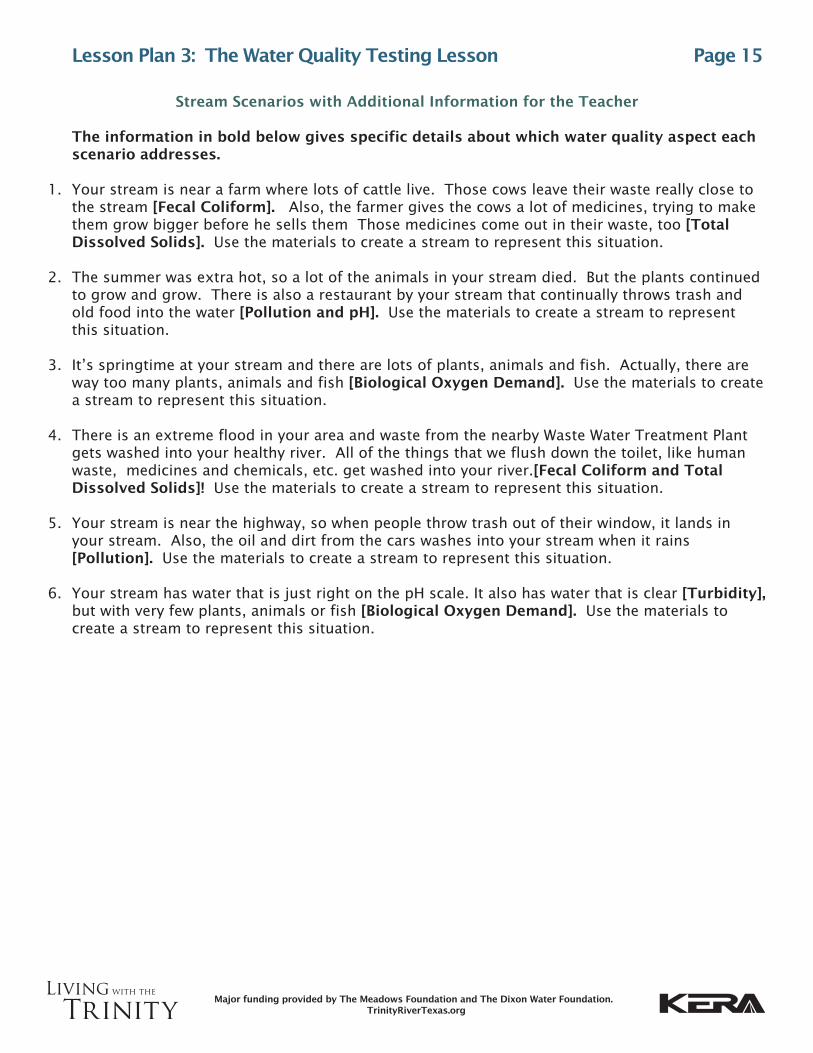
Stream Scenarios with Additional Information for the Teacher
The information in bold below gives specific details about which water quality aspect eachscenario addresses.
1. Your stream is near a farm where lots of cattle live. Those cows leave their waste really close tothe stream [Fecal Coliform]. Also, the farmer gives the cows a lot of medicines, trying to makethem grow bigger before he sells them Those medicines come out in their waste, too [TotalDissolved Solids]. Use the materials to create a stream to represent this situation.
2. The summer was extra hot, so a lot of the animals in your stream died. But the plants continuedto grow and grow. There is also a restaurant by your stream that continually throws trash andold food into the water [Pollution and pH]. Use the materials to create a stream to representthis situation.
3. It’s springtime at your stream and there are lots of plants, animals and fish. Actually, there areway too many plants, animals and fish [Biological Oxygen Demand]. Use the materials to createa stream to represent this situation.
4. There is an extreme flood in your area and waste from the nearby Waste Water Treatment Plantgets washed into your healthy river. All of the things that we flush down the toilet, like humanwaste, medicines and chemicals, etc. get washed into your river.[Fecal Coliform and TotalDissolved Solids]! Use the materials to create a stream to represent this situation.
5. Your stream is near the highway, so when people throw trash out of their window, it lands inyour stream. Also, the oil and dirt from the cars washes into your stream when it rains[Pollution]. Use the materials to create a stream to represent this situation.
6. Your stream has water that is just right on the pH scale. It also has water that is clear [Turbidity],but with very few plants, animals or fish [Biological Oxygen Demand]. Use the materials tocreate a stream to represent this situation.
Lesson Plan 3: TheWater Quality Testing Lesson Page 15
Name _____________________________________________________________________ Date _________________
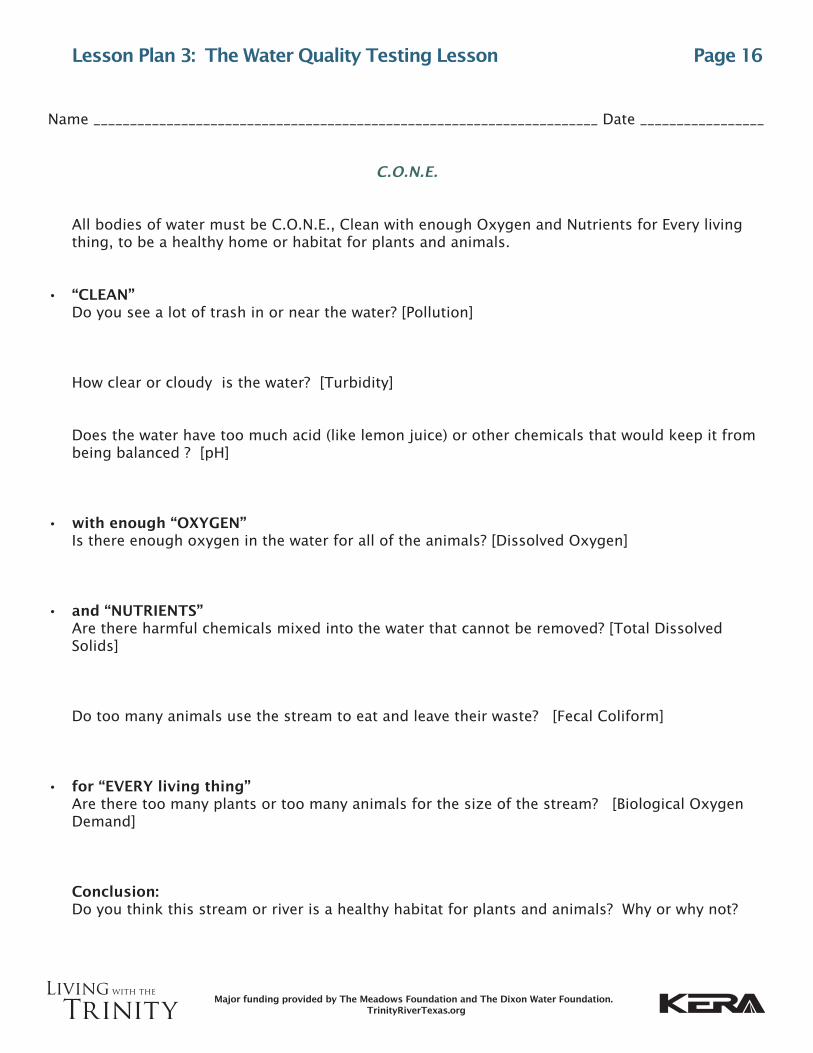
C.O.N.E.
All bodies of water must be C.O.N.E., Clean with enough Oxygen and Nutrients for Every livingthing, to be a healthy home or habitat for plants and animals.
• “CLEAN”Do you see a lot of trash in or near the water? [Pollution]
How clear or cloudy is the water? [Turbidity]
Does the water have too much acid (like lemon juice) or other chemicals that would keep it frombeing balanced ? [pH]
• with enough “OXYGEN”Is there enough oxygen in the water for all of the animals? [Dissolved Oxygen]
• and “NUTRIENTS”Are there harmful chemicals mixed into the water that cannot be removed? [Total DissolvedSolids]
Do too many animals use the stream to eat and leave their waste? [Fecal Coliform]
• for “EVERY living thing”Are there too many plants or too many animals for the size of the stream? [Biological OxygenDemand]
Conclusion:Do you think this stream or river is a healthy habitat for plants and animals? Why or why not?
Lesson Plan 3: TheWater Quality Testing Lesson Page 16

Session 3 Station Labels
Chocolate sprinkles(Represent human or animal waste)
Leaves(Represent plant life)
Fish-shaped crackers(represent fish)
Old magazines and water bottle waste(represent pollution)
Gummy worms(Represent animals that live in or near the water)
Food coloring(Represents materials dissolved in the water)
Cups with water(Represents a local stream)
Lesson Plan 3: TheWater Quality Testing Lesson Page 17

Name _____________________________________________________________________ Date _________________
Water Quality Testing Assessment
1. Can you tell that water is “clean” just by looking at it? Why or why not?
2. Describe what a healthy stream might look like. Draw a picture to illustrate on a separate pieceof paper.
3. Describe what an unhealthy stream might look like. Draw a picture to illustrate on a separatepiece of paper.
4. List four ways that streams can become polluted.
5. List four things people can do to help keep streams healthy.
6. What does C.O.N.E. stand for?
7. Why is oxygen important to a stream? How does a stream get enough oxygen?
8. How might a flood in your area affect your local streams?
9. What is an “ecosystem”?
10. What would happen to a stream if you removed all of the plants?
11. What would happen to a stream if you removed all of the fish and animals?
12. How was our cup different from a real stream? How was it the same as a real stream?
13. What are some questions that you still have about water quality testing and healthy water?
Lesson Plan 3: TheWater Quality Testing Lesson Page 18
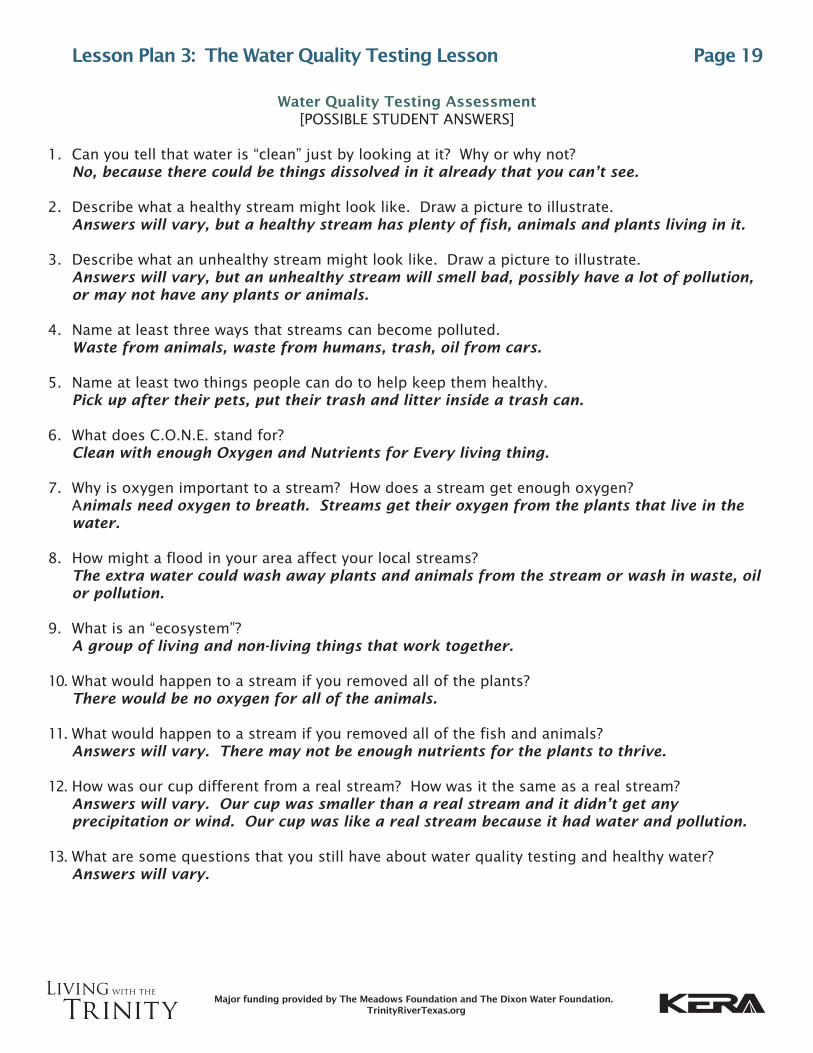
Water Quality Testing Assessment[POSSIBLE STUDENT ANSWERS]
1. Can you tell that water is “clean” just by looking at it? Why or why not?No, because there could be things dissolved in it already that you can’t see.
2. Describe what a healthy stream might look like. Draw a picture to illustrate.Answers will vary, but a healthy stream has plenty of fish, animals and plants living in it.
3. Describe what an unhealthy stream might look like. Draw a picture to illustrate.Answers will vary, but an unhealthy stream will smell bad, possibly have a lot of pollution,or may not have any plants or animals.
4. Name at least three ways that streams can become polluted.Waste from animals, waste from humans, trash, oil from cars.
5. Name at least two things people can do to help keep them healthy.Pick up after their pets, put their trash and litter inside a trash can.
6. What does C.O.N.E. stand for?Clean with enough Oxygen and Nutrients for Every living thing.
7. Why is oxygen important to a stream? How does a stream get enough oxygen?Animals need oxygen to breath. Streams get their oxygen from the plants that live in thewater.
8. How might a flood in your area affect your local streams?The extra water could wash away plants and animals from the stream or wash in waste, oilor pollution.
9. What is an “ecosystem”?A group of living and non-living things that work together.
10. What would happen to a stream if you removed all of the plants?There would be no oxygen for all of the animals.
11. What would happen to a stream if you removed all of the fish and animals?Answers will vary. There may not be enough nutrients for the plants to thrive.
12. How was our cup different from a real stream? How was it the same as a real stream?Answers will vary. Our cup was smaller than a real stream and it didn’t get anyprecipitation or wind. Our cup was like a real stream because it had water and pollution.
13. What are some questions that you still have about water quality testing and healthy water?Answers will vary.
Lesson Plan 3: TheWater Quality Testing Lesson Page 19
Name _____________________________________________________________________ Date _________________
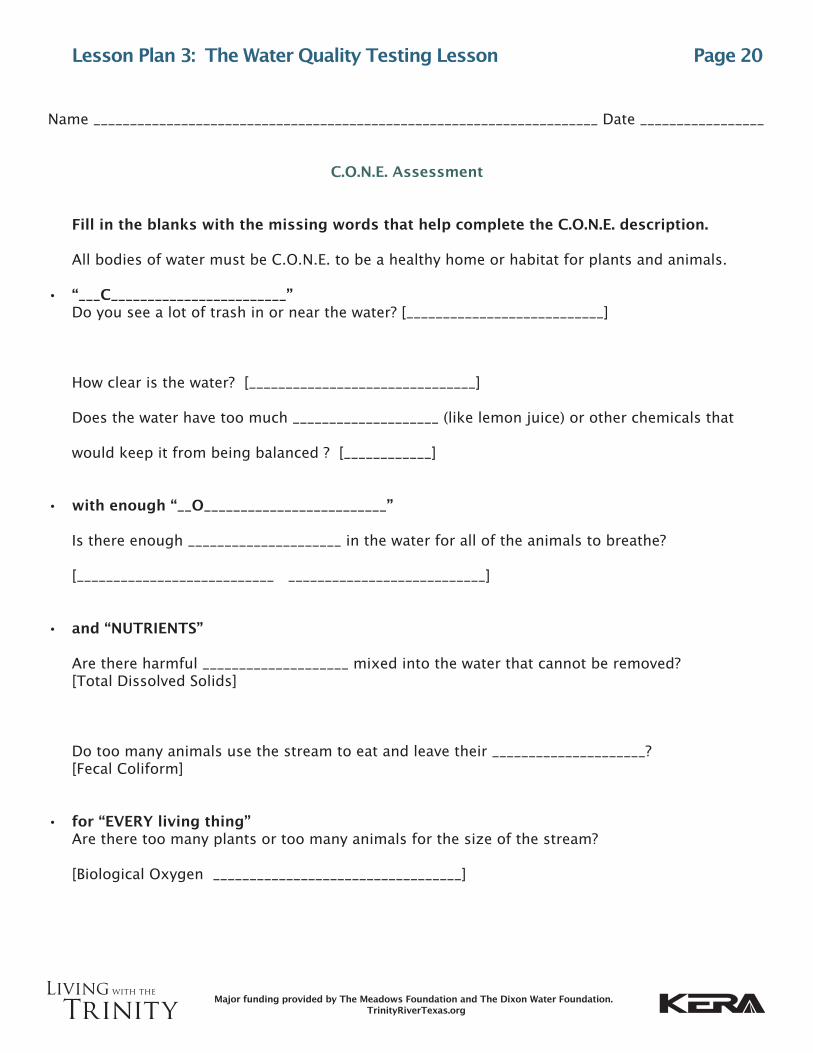
C.O.N.E. Assessment
Fill in the blanks with the missing words that help complete the C.O.N.E. description.
All bodies of water must be C.O.N.E. to be a healthy home or habitat for plants and animals.
• “___C________________________”Do you see a lot of trash in or near the water? [___________________________]
How clear is the water? [_______________________________]
Does the water have too much ____________________ (like lemon juice) or other chemicals that
would keep it from being balanced ? [____________]
• with enough “__O_________________________”
Is there enough _____________________ in the water for all of the animals to breathe?
[___________________________ ___________________________]
• and “NUTRIENTS”
Are there harmful ____________________ mixed into the water that cannot be removed?[Total Dissolved Solids]
Do too many animals use the stream to eat and leave their _____________________?[Fecal Coliform]
• for “EVERY living thing”Are there too many plants or too many animals for the size of the stream?
[Biological Oxygen __________________________________]
Lesson Plan 3: TheWater Quality Testing Lesson Page 20