Embed Size (px)
Citation preview

AD-754 357
PHYSICAL FITNESS AND HUMAN PERFORMANCE 4
.'ohn Frederick Lambert, et al
Naval Postgraduate SchoolMonterey, California
September 1972
I
i
DISTRIBUTED BY:
Natolen Technical Inforinaton ServiceU. S. DEPARTMENT OF COMMERCE5285 Port Royal Road, Springfield Va. 22151
/I I
Ll
NAVAL POSTGRADUATE SCHOOLMonterey, California
B
THESISPHYSICAL FITNESS AND HUMAN PERFORMANCE M
by
John Frederick Lambert
and
Donald James Parrish
Thesis Advisor: R. N. Forrest
September 1972
Reproduced by
NATIONAL TECHNICALINFORMATION SERVICE
U q rfl'ortmmnt of Commerce
Sp.,ingfi,,Id VA 22151
App~oved 6o pubtie 'taemee; dLhibwon witimUed.
* -A
Security CIeassifiraton.LINK A LINK a LINK C
KEY WOROS
ROLE WY ROLE WT ROLE WY
psychomotor performance
psychological state
physical fitness
aerobic exercise
parametric statistics
nonparametric statistics
Maximal Oxygen Uptake (MOU)
treadmill
exer-genie
life cycle
DDFORM (AKDDS NV,1473.1..473(BACK)S/N 0101 O?7*4621 "* Security Classification A-31409
LA
Physical Fitness and Human Performance
by
John Frederick LambertLCDR, U.S. Navy
B.S., U.S. Naval Academy, 1964
and
Donald James ParrishCptr U.S. Army
B.S., U.S. Military Academy, 1965
Submitted in partial fulfillment of therequirements for the degree of
MASTER OF SCIENCE IN OPERATIONS RESEARCH
from the
NAVAL POSTGRADUATE SCHOOLSeptember 1972
Authors
Approved by:
SThesis Advisor
'-Z Second ReaderChairm 91epartmento 6 peijgti.ons Research and//.• istrative Science
1 ,4
Aca emic Dean
-1V

"DOCUMENT CONTROL DATA . R & DiSecurity classiflation of title, body of abstraet and indeving annotatlion must be entered *hen the overall report Is Cla•seifled)
I. ORIGINATING ACTIVITY (CoiPorat* au1hor) 28. REPORT SECURITY CLASSIFICATION
V~l IUnclassifiedNaval Postgraduate School . Un sMonterey, California 93940
3. REPORT TITLE
Physical Fitness and Hiunan Performance
4. DESCRIPTIVE NOTES (Type of report andinclueive dale.)
Master's Thesis; September 1972S. AU THORISI (Fertat name, middle Initial, last name)
John Frederick Lambert and
Donald James Parrish6. REPORT DATE 'a. TOTAL. NO. OF PAGES 7Tb. NO. or newS
September, 1972 63_ 12U. CONTRACT ON GRANT NO. Sa. ORIGINATOR'S REPORT NUMELAIS)
6. PROJECT NO.
Ob. OTHER REPORT NO(M) (Any eW•at umbers heat my be easledthisrport)
d.
10. OISTRISUTION STATEMrNT
Approved for public release; dist.ibution unlimited.
1I. SUPPLEMENTARY NOTES r2. SPONSORING MILITARY ACTIVITY
Naval Postgraduate SchoolMonterey, California 93940
I1. ASISTRACTThe relationship between physical fitness and performance as
determined by psychomotor reaction times and psychological state wasinvestigated in an experiment using two different exercise programsand thirty subjects. There were ten subjects in each exercise groupand the remaining ten were in a control group.
The statistical tests used in this investigation suggest that thesubjects in the exercise programs significantly lowered their psy-chomotor reaction times as a result of their exercise while thepsychomotor reaction times of the control group were unchanged. Nostatistical evidence of a change in the psychological state of thesubjects as a result of exercise was shown.
"UStU of illuatraions inttiidolcument may be better
NFORI4 (PAGE I)
S/N 0101-S07-6811. ecutity lIsesificUot... .,-ii1M IA

ABSTRACT
The relationship between physical fitness and performance
as determined by psychomotor reaction times and psychological
state was investigated in an experiment using two different
exercise programs and thirty subjects. There were ten subjects
in each exercise group and the remaining ten were in a controi
group.
The statistical tests used in this investigation suggest
that the subjects in the exercise programs significantly
lowered their psychomotor reaction times as a result of their
exercise while the psychomotor reaction times of the control
group were unchanged. No statistical evidence of a change in
the psychological state of the subjects as a result of exercise
was shown.
2

TABLE OF CONTENTS
I. INTRODUCTION------------------------------------------ 6
II. THE EXPERIMENT --------------------------------------- 8
A. EXPERIMENTAL EQUIPMENT -------------------------- 8
1. Physical Fitness Testing Equipment --------- 8
2. Psychomotor Performance Testing Equipment- 9
3. Psychological Testing Equipment ------------ 10
B. EXPERIMENTAL SUBJECTS ---------------------------11
C. DESCRIPTION OF EXERCISE PROGRAMS ----------------12
1. Stationary Bicycle Program ----------------- 12
2. Exer-Genie Exerciser Program ---------------13
D. TESTING PROCEDURES ------------------------------ 16
1. Psychomotor Response Test ------------------ 16
2. Physical Fitness Test ---------------------- 17
3. Psychological Test ------------------------- 18
III. STATISTICAL RESULTS ----------------------------------20
A. PARAMETRIC ANALYSIS -----------------------------20
B. NONPARAMETRIC ANALYSIS -------------------------- 21
IV. DISCUSSION OF RESULTS -------------------------------- 24
A. MAXIMAL OXYGEN UPTAKE --------------------------- 24
B. PSYCHOMOTOR TEST -------------------------------- 25
C. PSYCHOLOGICAL TEST ------------------------------ 26
V. OTHER RESULTS ---------------------------------------- 28
IIVI. COMMENTS '3 29
APPENDIX A -- - - - - - - - - - - - - - - - - - - - - - - -30
APPENDIX B ------ ------ ------ ------ ------ ------ ----- 35
SJ*
i~i .. . ._ . _ . . ... . • . o. . . . . &3

APPENDIX C ................. -----------------------.. ..... 42
APPENDIX D ------------------------------------------------ 46
BIBLIOGRAPHY ---------------------------------------------- 60
INITIAL DISTRIBUTION LIST --------------------------------- 61
DD FORM 1473 ----------------------------------------------- 62
4
S-a
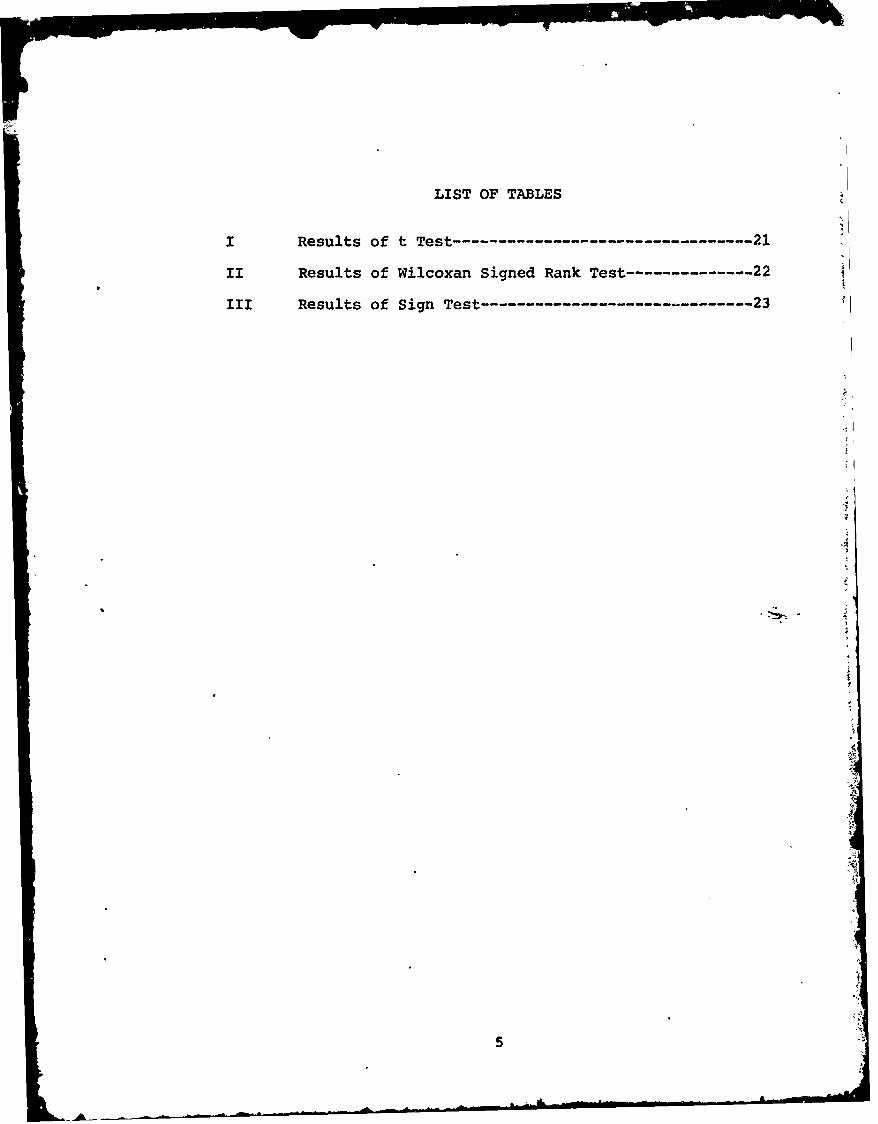
LIST OF TABLES
I Results of t Test --------------------------------- 21
II Results of Wilcoxan Signed Rank Test -------------- 22
III Results of Sign Test ------------------------------ 23
5I
1W -41p - W
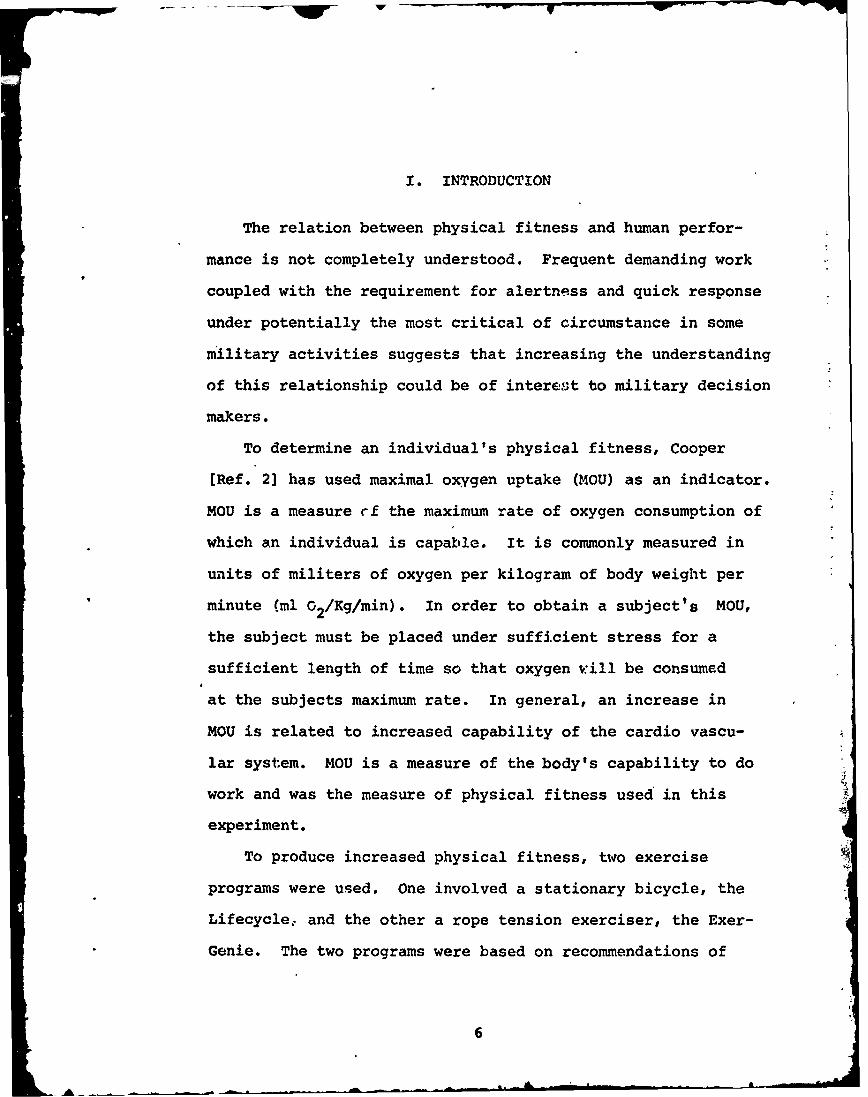
I. INTRODUCTION
The relation between physical fitness and human perfor-
mance is not completely understood. Frequent demanding work
coupled with the requirement for alertness and quick response
under potentially the most critical of circumstance in some
military activities suggests that increasing the understanding
of this relationship could be of interest to military decision
makers.
To determine an individual's physical fitness, Cooper
[Ref. 2] has used maximal oxygen uptake (MOU) as an indicator.
MOU is a measure i-f the maximum rate of oxygen consumption of
which an individual is capable. It is commonly measured in
units of militers of oxygen per kilogram of body weight per
minute (ml 02 /Kg/min). In order to obtain a subject's MOU,
the subject must be placed under sufficient stress for a
sufficient length of time so that oxygen will be consumed
at the subjects maximum rate. In general, an increase in
MOU is related to increased capability of the cardio vascu-
lar system. MOU is a measure of the body's capability to do
work and was the measure of physical fitness used in this
experiment.
To produce increased physical fitness, two exercise
programs were used. One involved a stationary bicycle, the
Lifecycle, and the other a rope tension exerciser, the Exer-
Genie. The two programs were based on recommendations of
6
Phelan and Parodi [Ref. 4] on whose work part of this
experiment is based.
To determine performance, measures of psychomotor reaction
times and psychological state were used. Psychomotor reaction
time is the time required to perform a muscular action which
is cued by some observable signal. Psychological state was
defined, for this experiment, as an individual's degree of
anxiety, depression, and hostility.
An overview of the experiment is as follows: A group of
subjects underwent initial testing to determine their initial
MOU's, psychological states, and psychomotor reaction times.
The subjects exercised for a fixed period of time with regular
frequency. They, then, underwent final testing to determine
their final I )U's, psychological states, and psychomotor
reaction times. This initial and final data were statistically
analyzed to determine changes in the subject population. A
control group was established to isolate temporal effects,
etc. The null hypothesis tested in this experiment was that
increased physical fitness does not decrease psychomotor
reaction time, anxiety, depriession, and hostility.
7LI
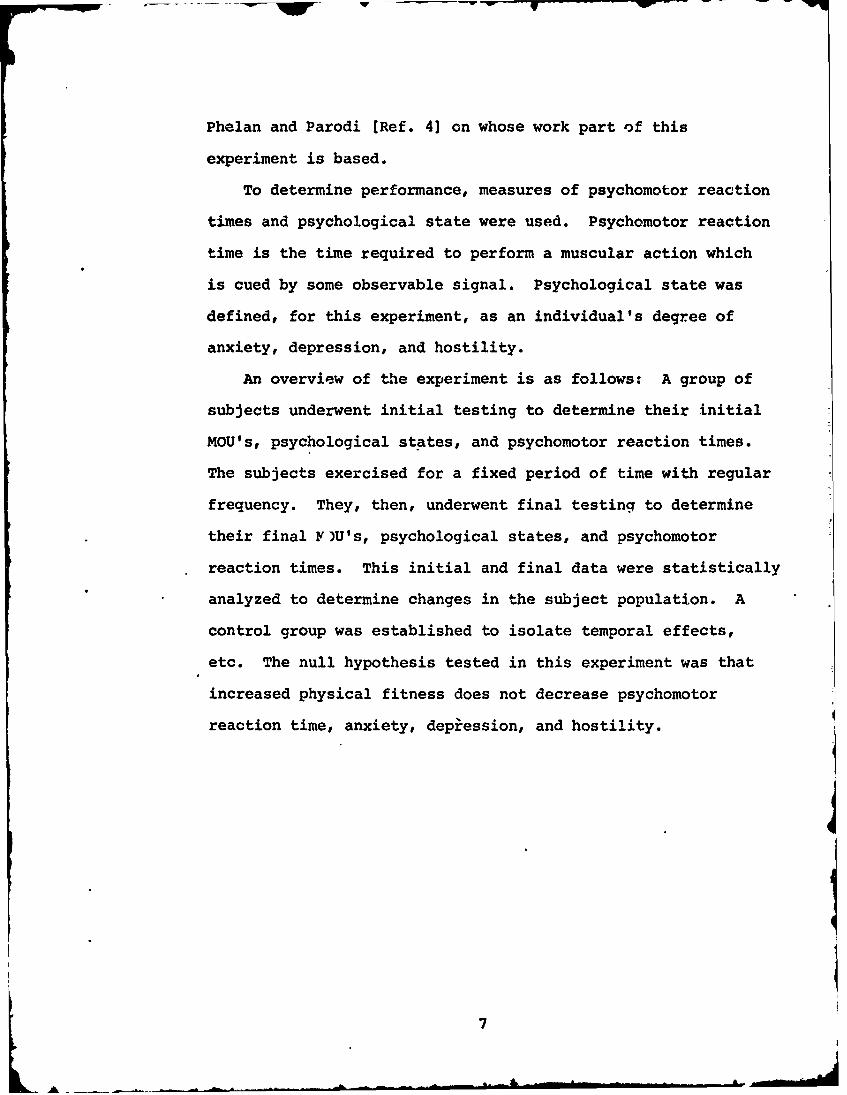
II. THE EXPERIMENT
A. EXPERIMENTAL EQUIPMENT
The following equipment was used to measure physical
fitness and performance parameters:
1. Physical Fitness Testing Equipment
A commercial treadiiil1, Quinton Instruments, Model
14-44A, was used to stress subjects for the MOU measurement.
The treadmill consisted of a mechanically driven belt upon
which the subject ran at a predetermined rate. By a control
knob and speed indicator, the subject's speed could be varied
from 0.0 to 4.5 miles per hour. Additionally the incline
angle of the treadmill could be controlled by the experi-
menters from 0 to 20 degrees.
Oxygen consumption was determined with a respiration
gasmeter in conjunction with a Beckman Oxygen Analyzer. The
respiration gasmeter measured the total quantity of air ex-
haled by a subject in liters and siphoned a sample of air
from each exhalation of the subject. The oxygen analyzer
measured the percentage of oxygen in the exhalation sarple
as well as the percentage of oxygen at ambient room conditions.
Pulse rate was monotored by a pulse rate meter on the
bicycle. It was measured by an ear clip which consisted of
a light source and a small photoelectric cell which sensed the
periodic change in transparency of the ear lobe resulting
from changes in blood flow due to heart action.
B
The treadmill is shown in Figure 1,
Figure 1 telTtoa 9iiP
2. Psychomotor Performance Testing Equipment
The psychomotor performance testing equipment mea-
sured a subject's reaction time to a particular stimulus.
This equipment consisted of a counter-timer, an input console,
a three inch by two inch display screen, and an output con-
sole. The experimenters' input console consisted of four
buttons numbered 1, 2, 3, and 4 which activated corresponding
numbers 1, 2, 3, or 4 on the display screen and simultaneously
started the counter--..mer. The subject's output console was
similar to the input console except that pushing the button 4
whose number corresponding to the number appearing on the
screen extinguished the displayed number and stopped the
counter-timer. Unless reset to zero, the counter-timer
9
P W - W
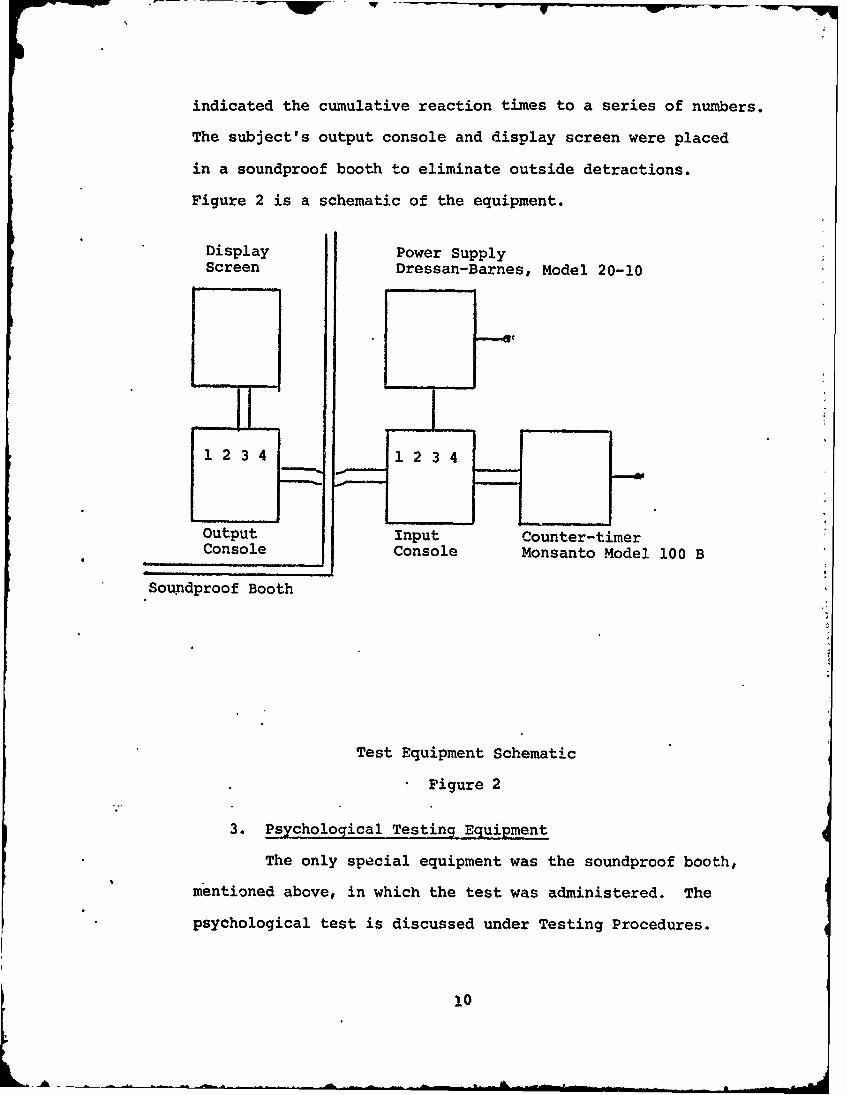
indicated the cumulative reaction times to a series of numbers.
The subject's output console and display screen were placed
in a soundproof booth to eliminate outside detractions.
Figure 2 is a schematic of the equipment.
Display Power SupplyScreen Dressan-Barnes, Model 20-10
1234 34
Output Input Counter-timerConsole Console Monsanto Model 100 B
Soundproof Booth
Test Equipment Schematic
Figure 2
3. Psychological Testing Equipment
The only special equipment was the soundproof booth,
mentioned above, in which the test was administered. The
psychological test is discussed under Testing Procedures.
10

B. EXPERIMENTAL SUBJECTS
The experimental subjects were volunteers from the
student body of the U.S. Naval Postgraduate School, Monterey,
California. Approximately 1000 circulars requesting volun-
teers for the program were distributed to the student body.
Approximately sixty responses were received. Thirty-onm
subjects were selected after an interview. The subjects
selected met the following criteria: no regular exercise
patterns and no recent participation in any physical fitness
program. This criteria suggested that some increase in
physical fitness of a subject participating in one of the
exercise programs should occur.
The Medical Staff of the school medically cleared all
subjects prior to their participation, however, three of
the exercise subjects developed medical problems and had to
terminate their participation in t.- experiment prior to
ics completion.
A control group was selected from the students who had
not responded to the initial request. This was done in
order to reduce the possibility of a control group member
undertaking an exercise program during the experiment. The
control group was established to indicate temporal effects,
etc. All subjects, control and exercise, agreed not to
initiate any regular exercise program for the duration of
the experiment.
r •

C. DESCRIPTION OF EXERCISE PROGRAMS 0
The exercise proqrams used were the stationary bicycle
program and the exerciser program. The entire program spanned
a period of ten weeks. Both exercise programs were completed
within the fourth quarter of academic year 1972 at the U.S.
Naval Postgraduate School. The first week of the quarter
was devoted to subject selection, orientation, and initial
testing. The exercise programs continued from the second
through tenth weeks. Final testing was conducted at the and
of the tenth week. The exercise programs were not extended
beyond the tenth week because it was felt that final exams
and the quarterly break would constitute too large an inter-
ruption for the programs.
1. Stationary Bicycle Program
Participants in the bicycle program were required to
ride the bicycle over a preprogrammed twelve minute course a
minimum of four days per week. Ten load levels are available
with the bicycle. Oradual increases of these load levels
over the duration of the program should produce increased
physical fitness. The amount and frequency of increase was
determined by the subject's pulse rate. The program was
essentially the program outlined by Cooper [Ref. 2]. The
detailed program is contained in Appendix A.
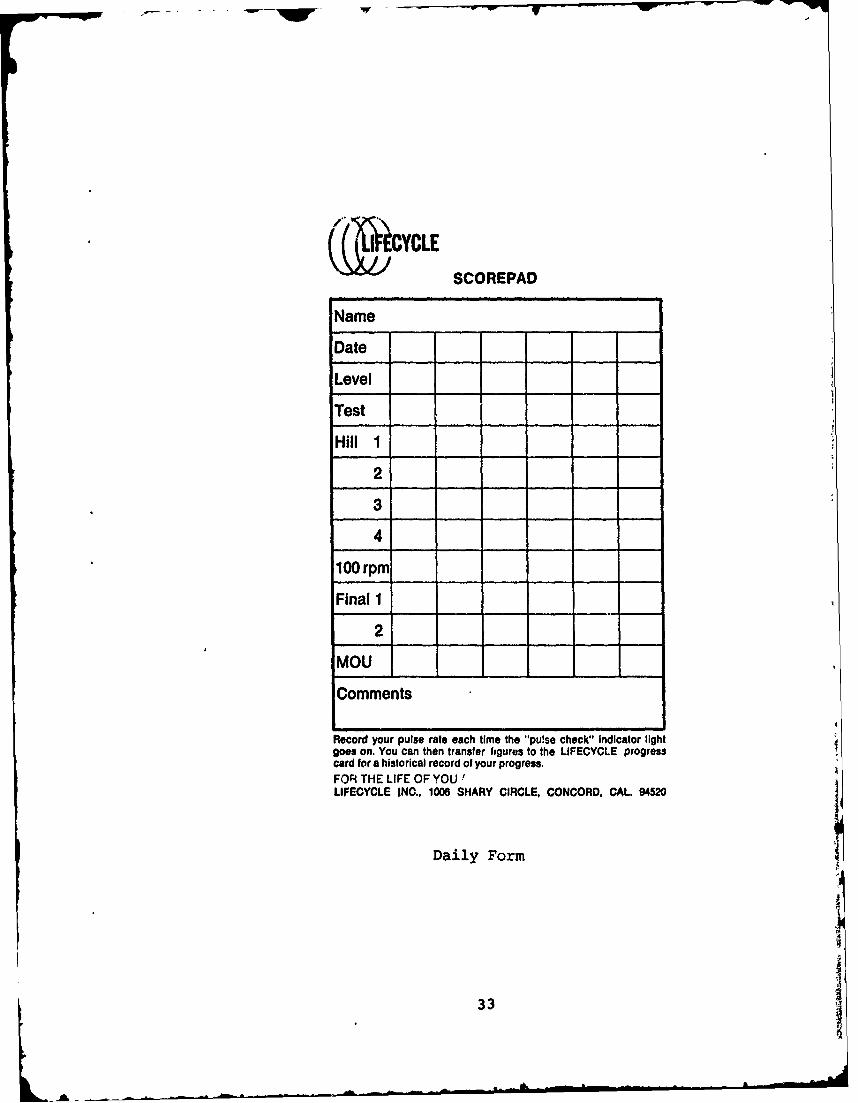
To monitor progress, each subject recorded his pulse
at selected time intervals on a preprinted form. Data from
these daily forms was transcribed to a weekly summary
12
i A
., ....... ...
(Appendix A]. These forms provided the experimenters with
information concerning each subject's progress and participation.
During the programý the stationary bicycle was in-
operative during the fourth week for a loss of four exercise
periods. Because of adjustments to the variable load mech-
anism, each participant had to refind his load level. It
was felt that this readjustment and loss of exercise periods *
were accomplished without significant detriment to the overall
program. Of the fourteen original subjects, 10 successfully
completed the program. One stopped for medical reasons, one
stopped for academic reasons, and two were judged by the
experimenters not to have participated with satisfactory
frequencies.
2. Exerciser Program
The exercising equipment used in this portion of the
program is relatively new and therefore requires a brief
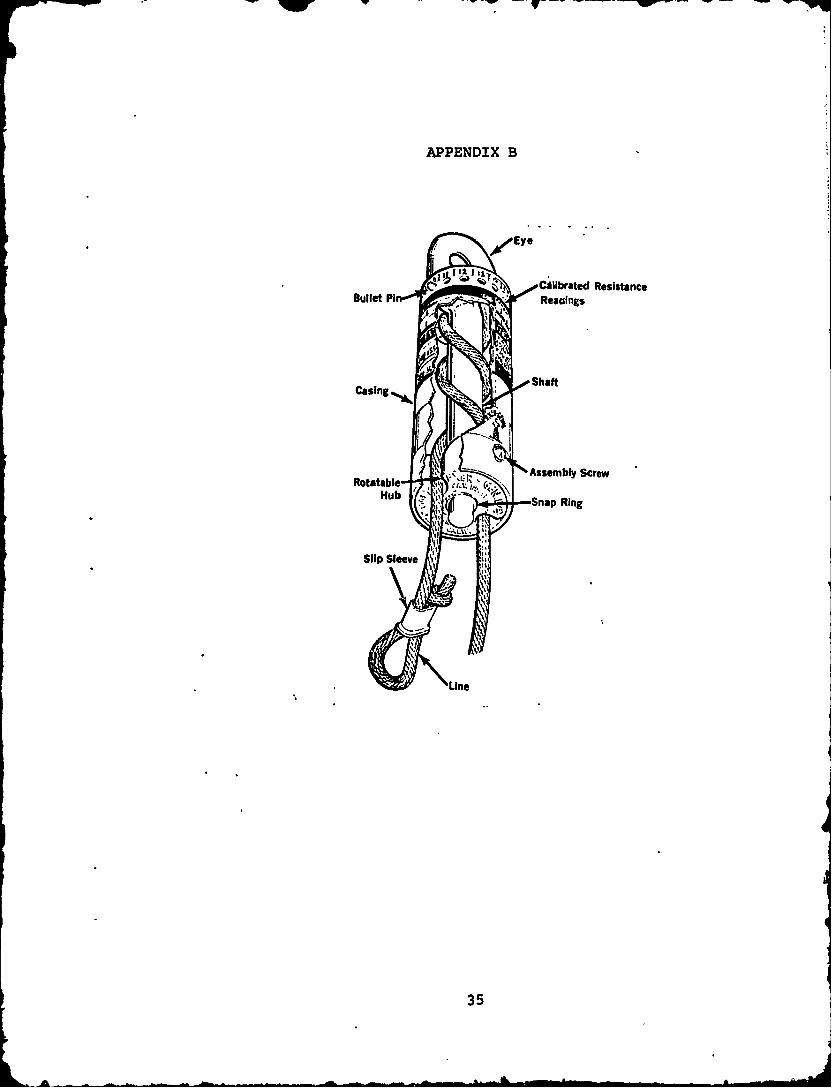
discussion. The Exer-Genie exerciser, created in 1961, is
a rope tension device which consists of a highly polished
aluminum shaft inside an engineered cylinder and a nylon
rope. Friction determines the tension of this device and is
determined by the number of turns the nylon rope is wrapped
around the shaft. The exerciser is shown in Appendix B.
The exerciser program was developed with the as-
sistance of Ronald E. Useldinger, M.A., the Regional Director
of American Physical Fitness of San Jose, California
[Useldinger 1972].
Each subject was instructed to exercise with the
exerciser a minimum of four times per week. Each workout
13
period consisted of the following exercises:
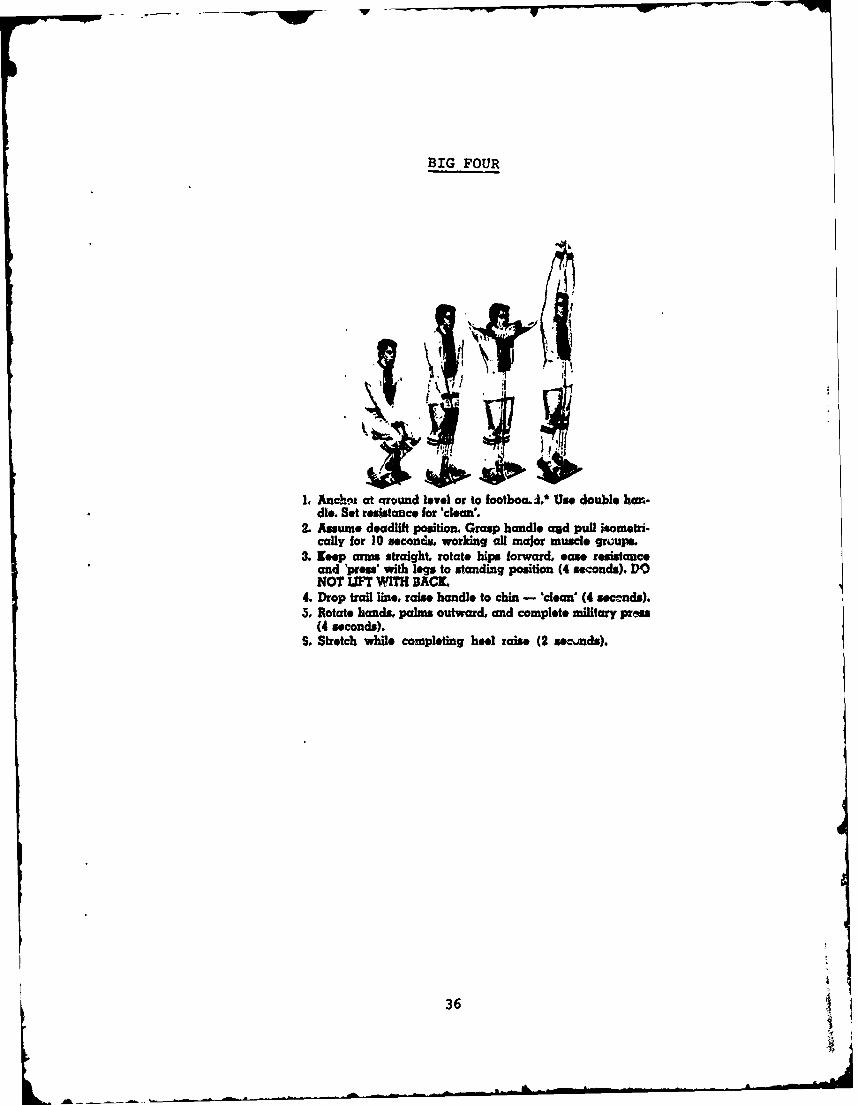
1. 3 - Big Fours
2. 3 - Floor Sit-ups or Standing Sit-ups
3. 3 - Rowing
4. 3 - Side Bends
5. 3 - 35 Second Runs in Running Harness
These exercises are shown in Appendix B.
Starting load levels were ascertained by having
each subject individually make a subjective determination of
his maximum capacity. Each subject was advised not to exceed
this capacity as a measure to prevent injury. These load
levels were maintained until the subject found the load too
easy. At this point each subject would again adjust the load
levels by determining his new capacities. To increase cardio-
vascular exercise, each subject was instructed to maintain a
pulse count between 120 and 170 beats per minute for each
exercise. The pulse was found by placing a finger on the
throat at the end of the third repetition of each exercise.
The pulse rate was then increased or decreased by varying
the amount of exertion expended during the exercises. The
subjects were instructed to move from one exercise directly
to the next with less than one minute of delay. The subjects
were further instructed to complete all exercises in less
than twenty minutes. By the fifth week all subjects were
completing all fire exercises in under fifteen minutes.
The exerciser program results were monitored and
displayed continuously throughout the ten week period. Each
subject was instructed to record on the forms provided his
14
__- I - - -
load levels and pulse rates for each exercise in addition
to his total exercise time. These data wer3 then transferred
to his individual progress chart which was displayed in the
exerciser room. Examples of the form and progress chart are
contained in Appendix B.
The individual progress chart in Appendix B represents
a hypothetical subject's progress throughout the ten week
exerciser program. The left ordnant of the chart represents
load levels used on the exerciser for all of the five
exercises. On a weekly basis a data point for each of the
five exercises was plotted on the chart. This point represented
the highest load level achieved on the exerciser for the
respective exercise during the preceding week. The weekly
data points thus obtained for each exercise were then con-
nected by straight lines containing the proper nomenclature
symbols.
The right ordnant of the chart represents the
average time per week to complete a workout, i.e., a set of
the five required exercises. This average time was obtained
by having the subject record the total time required to
complete each workout during the week in question and then
dividing the total time for all workouts by the number of
workouts completed during the week.
Of the seventeen original subjects, ten successfully
completed the exerciser program. No one dropped from the
program for reasons directly attributed to the use of the
exerciser.
15
~ -- a---

D. TESTING PROCEDURES
1. Psychomotor Response Test
To obtain a measure of each subject's psychomotor
pcrformance the experimenters constructed a consecutive
three-part test. Parts one and three were identical. Parts
one and three consisted of a serial reaction time test.
For these parts each subject was seated in the soundproof
booth at a table furnished with the output console and
display screen mentioned earlier. The subject was instriir-ted
to use either or both hands and any number of fingers tc push
the buttons on the output console. The only restrictions
placed on the subject's individual technique were that he
never use more than one finger simultaneously to extinguish
a number on the screen and that he always use the same
technique. A number was presented on the screen by the
experimenter and was extinguished as rapidly as possible
by the subject. The rate at which the numbers appeared on
the screen was determined by the rate at which the subject
extinguished them. As soon as the experimenter observed that
the subject had correctly responded by noting that the counter-
timer had stopped, he inputted another number. A total of
150 numbers were presented on the screen during a test
segment. The numbers were obtained from a table of random
numbers. Each subject was initially allowed 50 numbers to
acquaint himself with the apparatus and to reduce the
learning effects during the actual testing. This number
16
A -
was considered sufficient due to the simplicity of the task
involved.
After responding to the first set of 150 numbers,
i.e., part one of the test, the subject commenced part two
of the test without delay. Part two consisted of jogging
on a treadmill for a total time of three minutes. The speed
and incline angle of the treadmill were standardized for all
subjects at four miles per hour and fifteen degrees respectively.
Upon completion of the three minutes of jogging, the subject
was immediately returned to the soundproof booth for part
three of the test. The prosecution of the second set of 150
numbers commenced again without delay and unlike part one,
no practice numbers were allowed. The average of the
cumulated times obtained in parts one and three was the
measure used for each subject's psychomotor response time.
The psycho1 motor response test was given to every subject
in our experiment, both at the beginning and end of the ten
week physical conditioning program.
2. Physical Fitness Test
This test %as actually performed during part two
of the psychomotor response test. As described earlier,
each subject joged for a total of three minutes on the
treadmill. Data for the physical fitness test was obtained
by having the subject place the face mask of the previously
described respiration gasmeter over his nose and riouth
during the final minute of the three minute jogging period.
The volume and oxygen percentage of the exhaled air were
then obtained and recorded. These data plus the subject's
17

weight in kilograms were used to compute his physical fitness
index. This index was called the maximal oxygen uptake (MOU).
3. Psychological Test
The psychological test utilized for this experiment
was identical in every detail to the test used by Phelan and
Parodi [Ref. 4] and the following discussion of the test was
excerpted from their work.
"The psychological tert utilized was the Multiple
Affect Adjective Check List (Appendix C). Affect may be
defined as the psychological aspects of emotion, or the
emotional response which is assessed by means of verbal re-
ports. Most psychological measures tend to evaluate affect
as a trait rather than a state [Zuckerman 1965]. The MAACL,
however, attempts to measure the state, as measuring the
state specifies the time reierant (e.g., now, last week).
The MAACL is a self-administered test which provides
measures of three of the clinically relevant negative affects:
anxiety, depression, and hostility. Two types of the test
are axýailable, the "today" form and the "general" form. In
the "today" form, the subject responds positively or negatively
to a series of adjectives describing how he has felt today
only, and in the "general" form the subject responds to how
he has felt in some specified time frame in the past. In
this experiment, the subject was asked how he had felt
during the past week.
Most words appearing on the check list were direct
indicators of the affective state. The remaining words,
18
1w ---W~- --- Rw
however, had no relationship to the affective state. The
process by which words were selected to appear on the check
list is discussed fully by Zuckerman [Ref. 10].
The scoring of the tests was based on the subject's
response to certain words anc lack of response to other
words. These key words are shown in Appendix C, as well as
the specific scoring procedures utilized.
The MAACL has not been investigated sufficiently to
relate the raw scores obtained from the tests to a specific
degree of clinical affect [Zuckerman 1965]".
In this experiment, the MAACL was given to all subjects
both before the physical training program commenced and after
its completion.
19
. .. r "
III. STATISTICAL RESULTS
Parametric and nonparametric statistics have been used to
analyze results of the exercise program. Conclusions drawn
by parametric tests have been rechecked by nonparametric
tests. This redundancy was felt necessary because the under-
lying assumption of the test is normality of the random
variables. A plot of the variables on normal probability
paper did not indicate that they were not normal, however
the plot did not strongly indicate ncrmality. Hence, it was
felt that it would be advisable to use the more conservative
nonparametric tests as a check to prevent rejection of the
null hypothesis when it should be accepted.
A. PARAMETRIC ANALYSIS
In this analysis, it is assumed that the five variables,
maximal oxygen uptake, psychomotor reaction times, and
anxiety, hostility, and depression, were approximately
normally distributed. Zuckerman [Ref. 12] indicated that the
three variables of the psychological test were normally
distributed. Each subject has a before and after exercise
score for each viriable. These bivariate normal pairs were
tested for equal means by the paired sample t test. The
null hypothesis was that the means before and after were
equal and the level of significance a was ten percent. If
the null hypothesis was rejected, the direction of t1,e in-
equality was determined by the sample means. Details of the 4analysis are as given in Appendix D. Table I summarizes
the results.
20the results
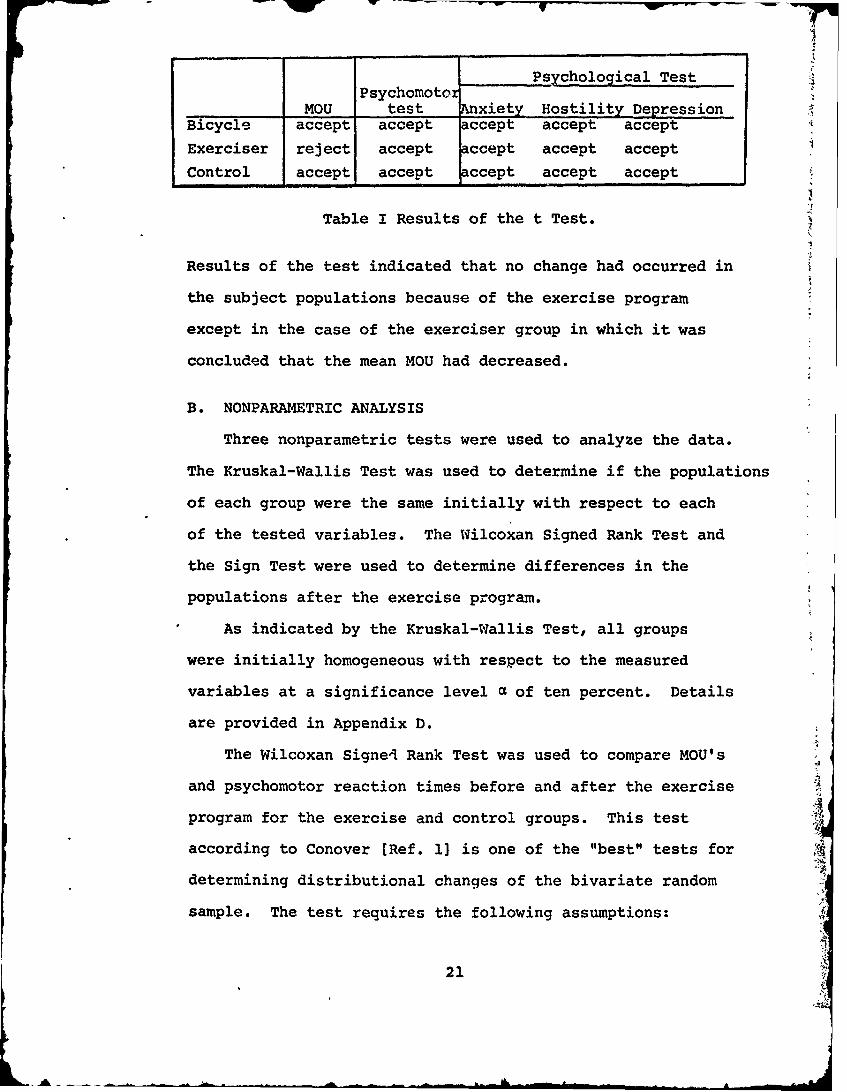
Psychological TestPsychomotor
MOU test Anxiety Hostility DepressionBicycle accept accept accept accept accept
Exerciser reject accept accept accept accept
Control accept accept accept accept accept
Table I Results of the t Test.I
Results of the test indicated that no change had occurred in
the subject populations because of the exercise program
except in the case of the exerciser group in which it was
concluded that the mean MOU had decreased.
B. NONPARAMETRIC ANALYSIS
Three nonparametric tests were used to analyze the data.
The Kruskal-Wallis Test was used to determine if the populations
of each group were the same initially with respect to each
of the tested variables. The Wilcoxan Signed Rank Test and
the Sign Test were used to determine differences in the
populations after the exercise program.
As indicated by the Kruskal-Wallis Test, all groups
were initially homogeneous with respect to the measured
variables at a significance level a of ten percent. Details
are provided in Appendix D.
The Wilcoxan Signe4 Rank Test was used to compare MOU's
and psychomotor reaction times before and after the exercise
program for the exercise and control groups. This test
according to Conover [Ref. 1] is one of the "best" tests for
determining distributional changes of the bivariate random
sample. The test requires the following assumptions:
21
(1) Continuous random vaziables
(2) Symmetry of underlyinq distribution
(3) Independence of bivariate pairs.
Again the null hypothesis was that the population means be-
fore and after were equal and the level of significance a
was ten percent. Details of the analysis are as given in
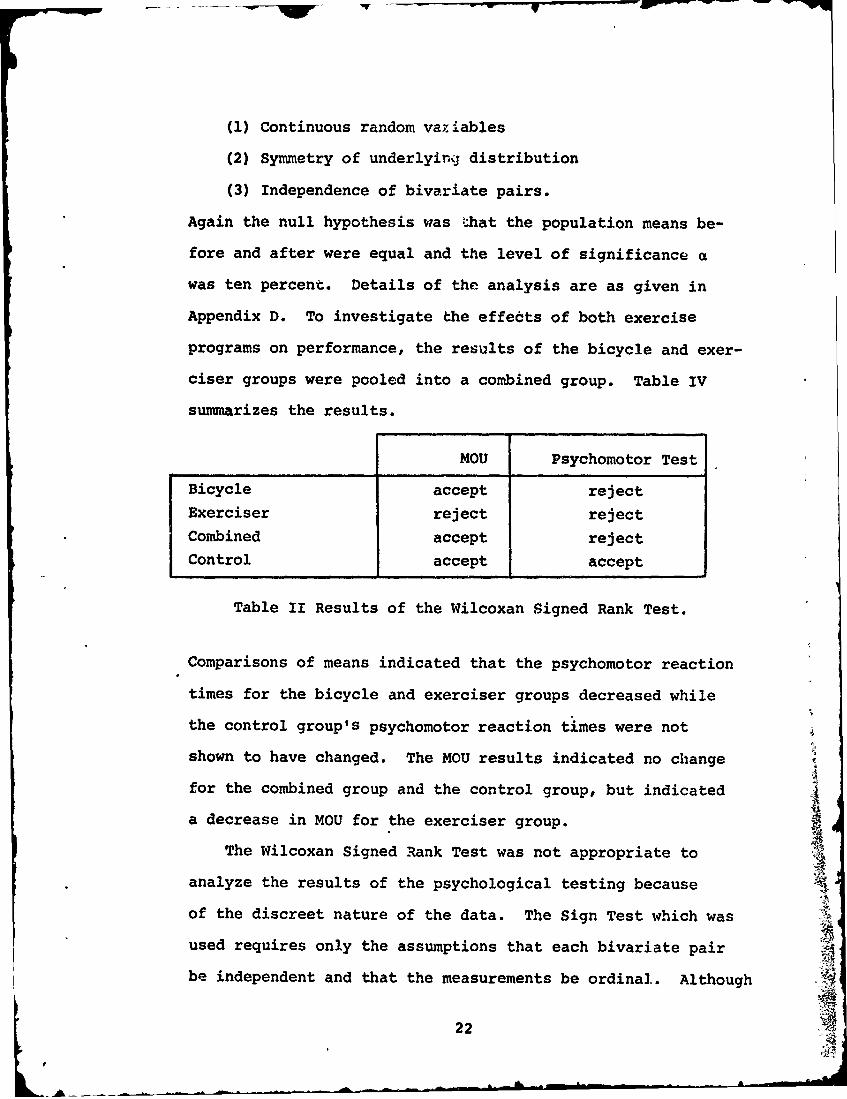
Appendix D. To investigate the effects of both exercise
programs on performance, the results of the bicycle and exer-
ciser groups were pooled into a combined group. Table IV
summarizes the results.
MOU Psychomotor Test
Bicycle accept rejectExerciser reject rejectCombined accept rejectControl accept accept
Table II Results of the Wilcoxan Signed Rank Test.
Comparisons of means indicated that the psychomotor reaction
times for the bicycle and exerciser groups decreased while
the control group's psychomotor reaction times were not
shown to have changed. The MOU results indicated no change
for the combined group and the control group, but indicated
a decrease in MOU for the exerciser group.
The Wilcoxan Signed Rank Test was not appropriate to
analyze the results of the psychological testing because
of the discreet nature of the data. The Sign Test which was
used requires only the assumptions that each bivariate pair 4
be independent and that the measurements be ordinal. Although
22

prescribed testing procedures [Zuckerman 1965] indicated the
use of the t test, the small sample sizes in this experiment
were not felt to be conducive to accurate results.
The null hypothesis tested was that the means before and
after were equal. The alternate hypothesis was they were
not equal with the direction of the inequality determined
by the sample averages. Table V summarizes the results.
Details of the analysis are given in Appendix D.
Anxiety Hostility Depression
Bicycle accept accept accept
ExercLser reject accept reject
Combined accept accept rejectControl accept accept reject
Table III Results of the Sign Test.
Comparison of means indicated that anxiety increased in the
exerciser group but it was not shown that anxiety changed
for the combined group. Depression decreased for the exerciser,
combined, and control groups. The null hypothesis that de-
pression for the combined and control groups decreased by
the same amount was tested by the Mann-Whitney Test and was
accepted.
23
LA

"if
IV. DISCUSSION OF RESULTS
A. MAXIMAL OXYGEN UPTAKE
Central to the entire experiment was the requirementI
that the subjects improve in physical fitness. The measure
of the physical fitness of a subject was the subject's maxi-
mal oxygen uptake (MOU) which was expected to increase over
the duration of the exercise program. Moreover, the results
of the experiment were that the exerciser group's average
MOU's significantly decreased and the bicycle group's average
MOU's were unchanged. Regardless of this fact, the experi-
menters believe that the physical fitness of all the exercising
subjects was considerably increased. This belief is based
on the following observations:
(1) During the initial testing phase, the heartbeat of
each subject was monitored to prevent the possibility of any
physical damage to the subjects. If the pulse rate exceeded
160 beats per minute, the treadmill was slowed until a pulse
rate of 160 was achieved. Approximately four-fifths of the
subjects required that the treadmill be slowed during the
initial testing. During the final testing, not one of the
subject's heartbeats exceeded 160 beats per minute. Shephard
[Ref. 6] has indicated that due to inherent difficulties in
measuring MOU, the pulse rate may be a better indicator of
physical fitness for a constant effort task.
(2) At the conclusion of the experiment, each subject
completed a questionnaire on the overall program. Nineteen
24

of the twenty stated that they personally felt in "better"
condition. Of these nineteen, six stated that they felt in
"much better" condition.
(3) The data from the exercise programs indicated that
all of the subjects showed improvement in their capabilities
to perform work.
Several potential explanations for the possible failure
of the MOU to reflect this increased fitness have been listed
below:
(1) Final testi.ng did not place the improved subjects
under as great a relative stress as the initial testing had
and hence the final MOU's were less of a "maximal" measure
than the initial MOU's.
(2) Oxygen uptake during the short test periods (0 - 3
minutes) was erratic. Cooper [Ref. 2] would claim that a much
longer test period is required to determine MOU, no matter
what the stress. In this experiment, it is possible that
neither the stress nor the test period or possibly both were
sufficient. The MOU formula at less than "maximal" efforts
is extremely sensitive to the quantity of air exhaled, i.e.,
a person who hyperventilated would exhibit a higher oxygen
uptake than a person who did not do so.
B. PSYCHOMOTOR TEST
The psychomotor reaction times for both the bicycle and
exerciser groups decreased at a significance level a of ten
percent. The times for the control group were not shown to
change. The experimenters felt that effects of any learning
25
effects should have been minimized by the rather simple nature
of the test. This feeling was reinforced by the result of
no significant chanae in psychomotor reaction times for the
control group. Hence, it was concluded that psychomotor
reaction times decreased because of the exercise proerams.
C. PSYCHOLOGICAL TEST
The psychological test produced mixed results. For the
combined group and control groups, depression decreased at a
ten percent significance level. No change was observed for
anxiety and hostility. Between exercise groups, the exerciser
group increased in anxiety. From this experiment, no change
in the psychological state of the subjects was determined.
The failure to detect any change could possibly have resulted
from one or more of the following reasons:
(1) There was no change.
(2) The sample size was too small to detect a change at
the ten percent level of significance.
(3) The student population from which the sample was
drawn was not a representative one.
Of these three reasons, the second and third seem the most
likely. In the case of the third reason, the test periods
directly followed and preceded quarterly final examinations
and this could have influenced the results of the psychological
test.
In conclusion, the results of this experiment are that
the subjects in the exercise programs decreased their
26
L A '
1W1
psychomotor reaction times. An increase in physical fitness Iof the subjects was not shown by measurements of the subject's
I
MOU's. No psychological changes in the subjects were indicated
by the MAACL test.I
I
2
4
I
I
I'
27I

V. OTHER RESULTS
An interesting phenomenon was observed during the psy-
chomotor response testing of this experiment. The experimen-
ters had assumed that the response time of part three of the
psychomotor response test would be greater than the response
time of part one for all the subjects involved in the ex-
periment. However, almost ninety-five percent of all the
subjects had shorter response times for part three of this
test. The experimenters thus concluded that the task of
jogging for three minutes on the treadmill had stimulated
the subject's circulatory and respiratory systems without
noticeably fatiguing them. It was further concluded that
the subjects would have to reach some level of fatigue before
appreciable increases in response times for part three of the
test would be observed.
28
VI. COMMENTS
Because of the difficulty in determining MOU's, the
heartbeats per minute might have been a better index for
measuring physical fitne3s.
A final comment concerns the population from which the
subjects for this type of experiment might best be chosen.
Our subjects were all young men under thirty-two years of
age and of apparently good physical and mental health. For
this reason, the experimenters felt that the sensitivity of
the psychological test was somewhat minimized. The basis
for this conjecture is that older and perhaps weaker subjects
would have greater psychological gains as a result of a
sustained period of physical conditioning.
Combined analysis of all individual progress records was
not attempted. This was partly due to equipment breakdown
in the case of the bicycle as mentioned earlier. Also, the
ropes of the exercisers soiled easily. This rapidly led
to fraying which made the ropes unacceptable for this ex-
periment. Because of the fraying, the ropes were subsequently
changed for new ones three times during the ten week exercise
period. New ropes created less friction than the old frayed
ones, thus the workloads varied radically during these rope
replacement periods.
29Ko

APPENDIX A
The specific instructions that were given to the bicycle
program participants are contained below.
Exercise Program
This program is designed to be a progressive program. At
the end of 10 weeks, you can expect a significant increase in
your body's ability to consume oxygen. This increase, in
turn, indicates physical improvement. Each participant will
begin at load level 40 and increases or decreases in this
level will be determined by your maximum pluse reading
(expected during the 4th hill). Each participant will adjust
his own daily load level using the following criteria:
Max Pulse Level Action
150 & below Increase load level by 10at next session
150-160 Increase load level by 10at next session if you feelthat you can maintain thehigher level
160 & above Decrease level by the nextsession
Crank speed should be maintained at 80 rpm except during the
100 rpm portion. During the last minute of the program, the
crank speed may gradually be reduced to zero.
If the initial load level of 40 is too high, i.e., your
pulse exceeds 160, decrease (during the program) the load
level by 10 and your crank speed to 60 rpm. When your pulse A
rate decreases to 150, increase your crank speed to 80 rpm.LO

If your pulse does not decrease to 150, decrease the load by
an additional 10 units and proceed as above.
If the initial load level of 40 is too low, i.e., your
pulse is below 160, follow the instructions for increasing
your load level as given above.
Operating Instructions
1. Adjust seat hei-rht (leg should be slightly bent)
2. Turn on and set to PROG. (programmed mode).
3. Set load level (10-100).
4. Attach earclip to fleshy part of earlobe with light
source to outside. Compute reading (blinking red light) with
your heart beat after 5-15 second warmup. Occasionally there
are fluctuations caused by such things as random outside
light striking the photo cell, etc.
5. The timer should be at the 12 minute (zero time) mark
when beginning. To start program, press start button for
three seconds and begin pedaling. If you should stop before
the program is completed, let the timer continue running until
the program is completed. Then turn the off-on switch to off.
Caution
1) If your feet slip off the pedals, the pedals will
continue to spin. Wait for crank revolutions to decrease
prior to replacing feet.
2) If you stop pedaling during a heavy load, the
pedals may lock. To correct, turn switch to manual mode,
place load level on lowest setting, and press start button
while attempting to turn pedals. This procedure should correct
the locked pedals.
31

Program Mode
The program mode consists of 4 parts as follows:
a. Warm-up (0-2 minutes)
b. Test (2-4.5 minutes)
c. Cardio-vascular stimulation (4.5-9 minutes)
d. Warm down (9-12 minutes) tRecord your puise on the daily form when the yellow check
pulse light comes on. This occurs at 5 minutes, the end of
each hill, the end of the 100 rpm phase, and the conclusion
of the entire program. Turn in this daily form.
32
I ECYCLESCOREPAD
Name
Date
Level
Test
Hill I
2
3
4
100 rpm
Final 1
2
MOU
Comments
Record your pulse rate each time the "pulse check" Indicator lightgoes on. You can then transfer figures to the LIFECYCLE progresscard for a historical record of your progress.FOR THE LIFE OF YOU '
LIFECYCLE INC., 1006 SHARY CIRCLE, CONCORD, CAL. 94520
Daily Form
33
K • .. d ..'u- 1 ..I n |

LPCYCLEPROGRESS CARD
Date -. Level . MOU. Date . Level . MOUL Date - Level.MOU.___....
Wt - Hp$s - Wst Wt _ _ HpS - Wst _ Wt _ Hp$ Wst-
Pulse TI Hill 1100 Final Pulse T Hill IOFinal Pulse T Hill 100 FinalRate 5 11_2 [ 14 2rj'P Rate 5 "1 = P4 rrf1- 2 Rate 5 11213 4 rprrr1
200 200 _ . 200
196 196 , 196192. _ i92 192... ... ... .. p.g._ -_? _ . .
188 188. 88
184 184.. 184:.,180 ...... 180 , 180176 -• i ; 1 7' 176' -172 " i172 ' . : 1"72'
168 * 168 168
164 * 164 • 164160 : 160 160156 . .:156 156152. 152 152148 ' ' , 148, 148.144 : 144,-"-,-. 144-
14014 140 ')' -! : '•"
136 136 136:132. ' . . 1321 - . . . : 132.
1. 128 .128
124 .>.A§124Z ZZ124 w.
12- 120 120116 * 116~ -; 116'j ; 411i2 °112' 112!
108 .. _- 108 8108104 104 i 104
100' 100-100 _ _.....-_-• .. =._ .
96 96 96i * ''92 : : '92 " 92: -- '••
688 88, 88I-
80 80. 60 :
FOR THE LIFE OF YOU I LIFECYCLE. INC.. 10C6 SHARY CIRCLE. CONCORD. CALIFORNIA 94520 - PHONE (415) 687-1250
34
: i
APPENDIX B
Eye
Cilbrated ResistanceBullet Pin,, - Reaaings
Shaf
Casing , Shaft
t~41Rotatable Assembly ScrewHub /Snap Ring
Slip Sleeve
5ne
35
~- --- ,9 u- - -•
BIG FOUR
1, Ancht at qround level or to footboa. . Use double han-dl. Set resistance for 'clean'.
2. Assume deadlift position. Grasp handle and pull isometri-cally for 10 seconds, worling all major muscle groups.
3. Keep arms straight, rotate hips forward, ease resistanceand 'press' with legs to standing position (4 seconds). DONOT LIFT WITH BACL
4. Drop trail line, raise handle to chin - 'clean' (4 seconds).5. Rotate hands, palms outward, and complete military press
(4 seconds).S. Stretch while completing heel raise (2 sec=uds).
36 4
SJ - : J n t ua m• -L ....i,.i Jd•--••

SIT UP - STANDING
1. Anchor at head level Us. doublehandles.
2. With knees bent, legs in strideposition and head lowered, grasphandle behind neck with over-hand grip. Keep elbows forwardand pull isometrically for 10 sec-onds.
3. Ease resistance and bond down-
ward, working abdominal mus- -cles (12 seconds).
SIT UP - LYING
1. Anchor 6 iniches above ground level. Use double handles.2. Keep knees bent. feet flat on floor and grasp handle be-
hind neck. With elbows forward and lower ':,.xck on floor,raise shoulders and pull isometrically for 10 seconds.
3. Ease resistance and curl forward until elbows touch knees(12 seconds). DO NOT ARCH BACK.
37
11
M W - -- - - ------------- ..... W -- W- -r q--.P-
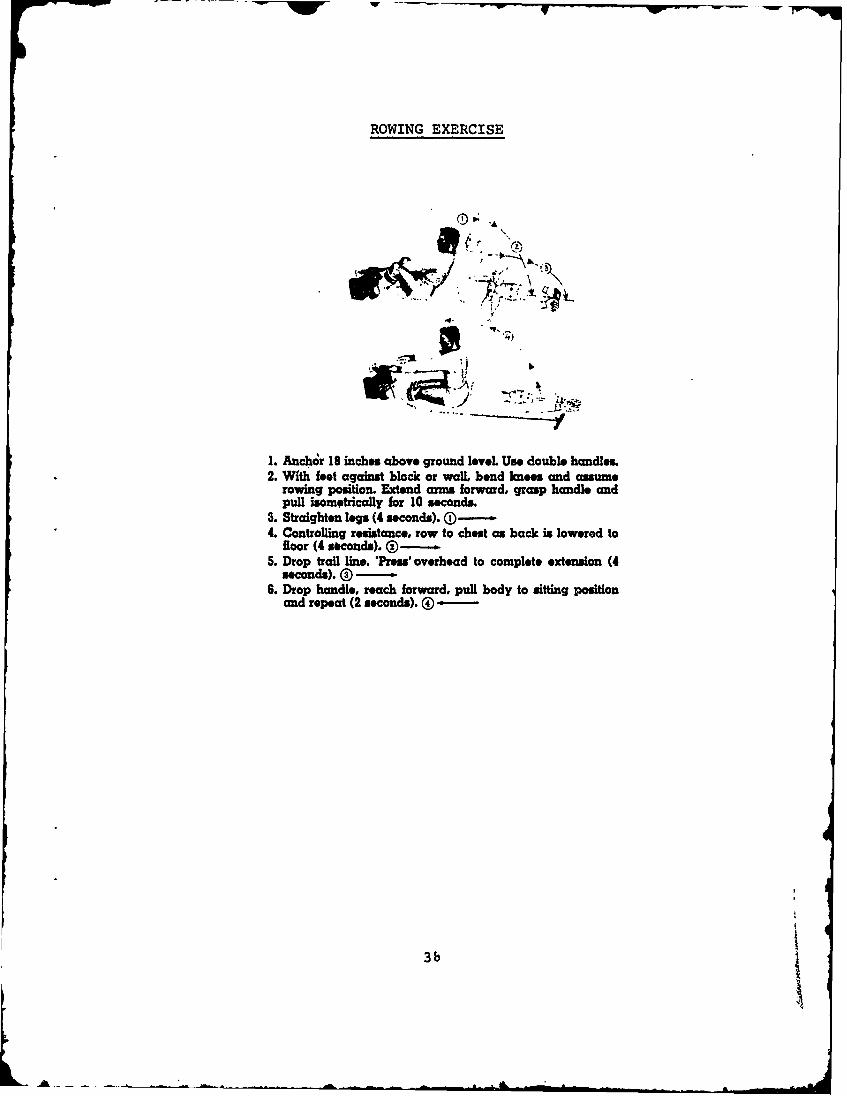
ROWING EXERCISE
"A
-4
1. Anch&r 18 inches above ground leveL Use double handles.2. With feet against block or wall, bend mees and assume
rowing position. Extend arms forward, grasp handle andpull isometrically for 10 seconds.
3. Straighten legs (4 seconds). D----4. Controlling resistance, row to chest as back is lowered to
floor (4 seconds). @----..5. Drop trail line. 'Press overhead to complete extension (4
seconds). ®--
6. Drop handle, reach forward, pull body to sitting positionand repeat (2 seconds). ) -
3b

-li sp,
SIDE BEND
1. Anchor to foowiard. Use wire handles. Shorten line (dia-gram).
2. Keep shoulders back, bend directly to one side, grasphandles and pull isometrically for 10 secondo.
3. Ease resistance and bend to other side (12 seconds).4. Again pull isometrically for 10 seconds.5. Ease resistance and return (12 seconds).
35 SECOND RUN
39
L.

- -
NAME
I
DATE__
EXERCISE LOAD PULSE
BIG FOURS:
SIT UPS
standing: -
Lying:
ROWING:
SIDE BENDS:
35-SEC RUNS: _
TOTAL TIME:
EXER-GENIE DAILY PROGRESS RECORD
40L -

INDIVIDUAL PROGRESS CHART
LOAD ~'~JLDS3 TlIMS(M J)
100 10 t
1*0
¶ or
o do
50.6 -V 0.
CHART NOMENCLATURE
------• Time
iii : Sit Ups - Star,,•ing/Lying: Big Four
S.. ... : Rowing--------- : 35-Sec Run-- A--A-4-J •side Bend
Note:
1. Load levels are the highest levels achieved during aweek period.
2. Times are average times per week to complete all fiveexercises.
3. Complete explanation of this chart is contained inthe text of this report. •
41
. - •_ _ _ _ _ _ _ _ __ir • I10 - i• - • . - . . d
APPENDIX C
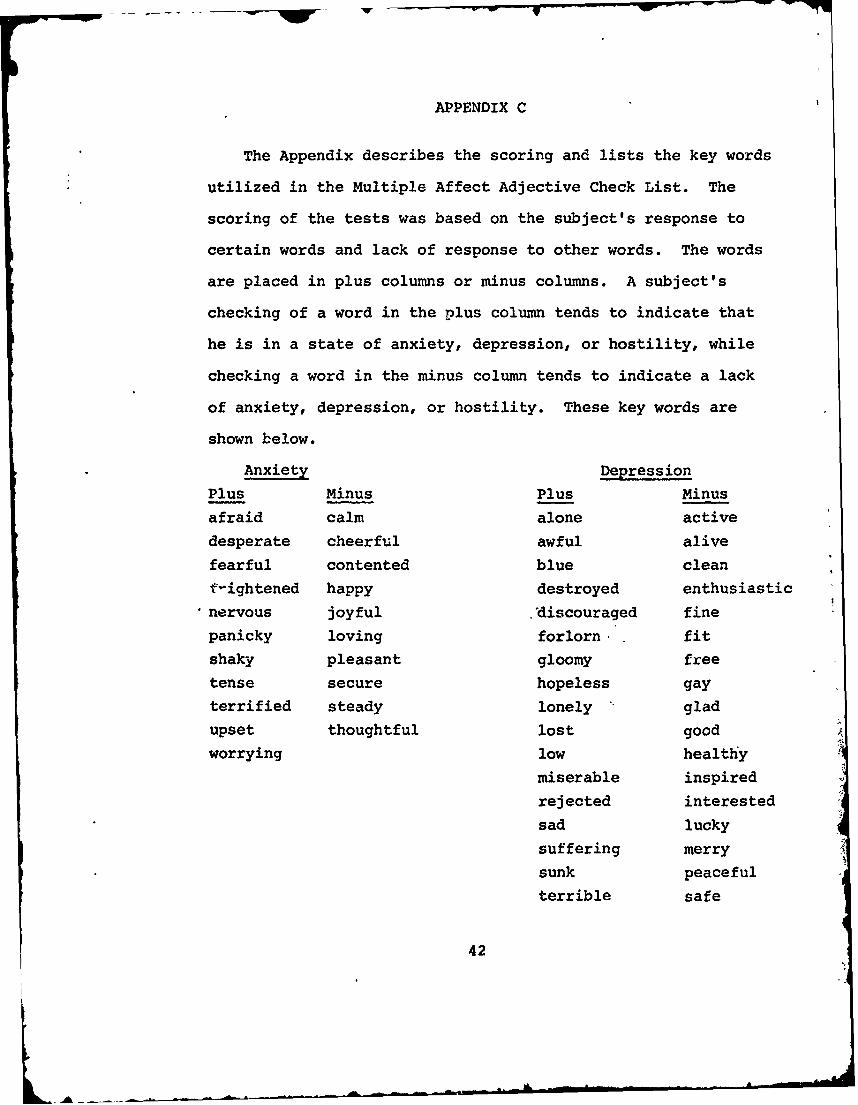
The Appendix describes the scoring and lists the key words
utilized in the Multiple Affect Adjective Check List. The
scoring of the tests was based on the subject's response to
certain words and lack of response to other words. The words
are placed in plus columns or minus columns. A subject's
checking of a word in the plus column tends to indicate that
he is in a state of anxiety, depression, or hostility, while
checking a word in the minus column tends to indicate a lack
of anxiety, depression, or hostility. These key words are
shown below.
Anxiety Depression
Plus Minus Plus Minus
afraid calm alone active
desperate cheerful awful alive
fearful contented blue clean
f-ightened happy destroyed enthusiastic
,nervous joyful discouraged fine
panicky loving forlorn. fit
shaky pleasant gloomy free
tense secure hopeless gay
terrified steady lonely glad
upset thoughtful lost good
worrying low healthy
miserable inspired
rejected interested
sad lucky
suffering merry
sunk peaceful
terrible safe
42

Depression cont.
tormented strong
unhappy whole
wilted young
Hostility
Plus Minus
angry agreeable
bitter amiable
cruel cooperative
disagreeable friendly
discontented good-natured
disgusted kindly
enraged polite
furious sympathetic
irritated tame
mad tender
mean understanding
offended willful
outraged warmstorym devoted
unsociablevexed
To obtain the raw score for the test add the number of
words not checked on the minus list to the number of words that
are checked on the plus list. An exact copy of the MAACL
4follows.
AU
43 4
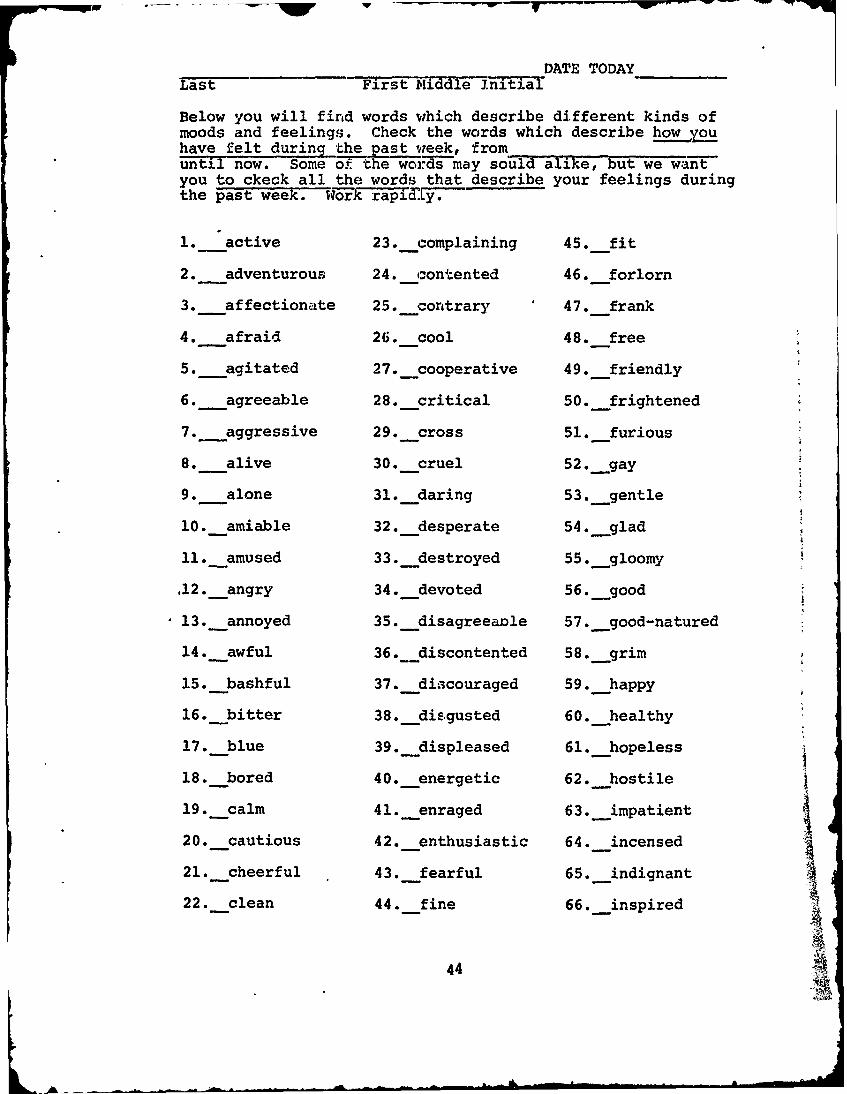
DATE TODAYLast First Middle initial
Below you will find words which describe different kinds ofmoods and feelings. Check the words which describe how youhave felt during the past week, fromuntil now. Some of the words may sould alike, but we wantyou to ckeck all the words that describe your feelings duringthe past week. Work rapid.y.
1. active 23._complaining 45._fit
2. adventurous 24. contented 46._forlorn
3. affectionate 25._contrary 47._frank
4. afraid 26._cool 48. free
5._agitated 27._cooperative 49. friendly
6. agreeable 28.__critical 50.__frightened
7. aggressive 29.__cross 51. furious
8. alive 30.__cruel 52._gay
9. alone 31.__daring 53.__gentle
10. amiable 32.__desperate 54._glad
ll._amused 33. destroyed 55. gloomy
.12.__angry 34. devoted 56._good
13.__annoyed 35.__disagreeanle 57.__good-natured
14. _awful 36. __discontented 58. grim
15. bashful 37._discouraged 59._happy
16._bitter 38.__dis.gusted 60._healthy
17. blue 39.__displeased 61._hopeless
18. bored 40._energetic 62._hostile
19.__calm 41._enraged 63._impatient
20._cautious 42._enthusiastic 64._incensed
21.__cheerful 43.__fearful 65._indignant
22. clean 44. fine 66. inspired
44
K
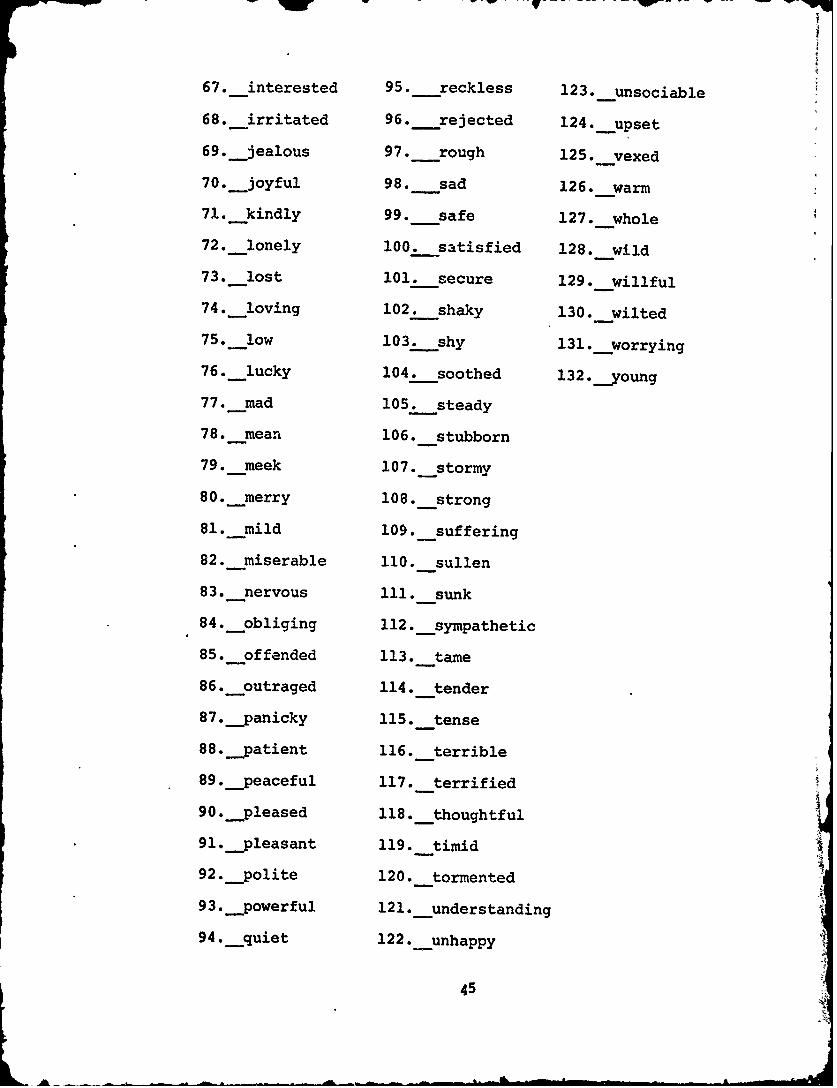
67. interested 95. reckless 123.__unsociable
68.__irritated 96. rejected 124.__upset
69.__jealous 97. rough 125.__vexed
70. joyful 98. sad 126.__warm
71.__kindly 99. safe 127.__whole
72. lonely 100. satisfied 128.__wild
73. lost 101. secure 129.__willful
74. loving 102. shaky 130.__wilted
75.__low 103.__shy 131.__worrying
76.__lucky 104.__soothed 132 .joung
77.__mad 105.__steady
78.__mean 106.__stubborn
79.__meek 107.__stormy
80.__merry 108.__strong
81.__mild 109. suffering
82.__miserable 110. sullen
83.__nervous 111.__sunk
84.__obliging 112.__sympathetic
85.__offended 113.__tame
86.__outraged 114. tender
87.__panicky 115.__tense
88.-patient 116.__terrible
89.__eaceful 117.__terrified-P3
90.-pleased 118. thoughtful
91. leasant 119. timid
92.__polite 120.__tormented
93.__powerful 121.__understanding
94.__quiet 122. unhappy
L 45

APPENDIX D
1. Paired Sample t Test
The paired sample t test was used to determine differences
in the populations before and after the exercise programs for
all the variables. The assumption of normality is required
to use this test. The null hypothesis was that the means
before and after were equal. If the null hypothesis was
rejected, the direction of the inequality was determined by
the sample means. Each t statistic had 18 degrees of freedom
and the level of significance a chosen was ten percent. The
null hypothesis that no change has occurred was accepted if
the event,
-1.734 < T < 1.734 , occurred.
The following table summarizes the values of the t statistic.
Psychological Test
PsychomotorMOU Test Anxiety Hostility Depression
Bicycle -0.042 0.685 0.053 0.325 0.909
Exerciser 2.568 0.405 -1.380 0.531 0.831
Control -0.116 0.606 0.906 0.045 0.770
In all cases the null hypothesis was accepted except for the
exerciser group in which it was concluded that the mean MOU
had decreased.
46
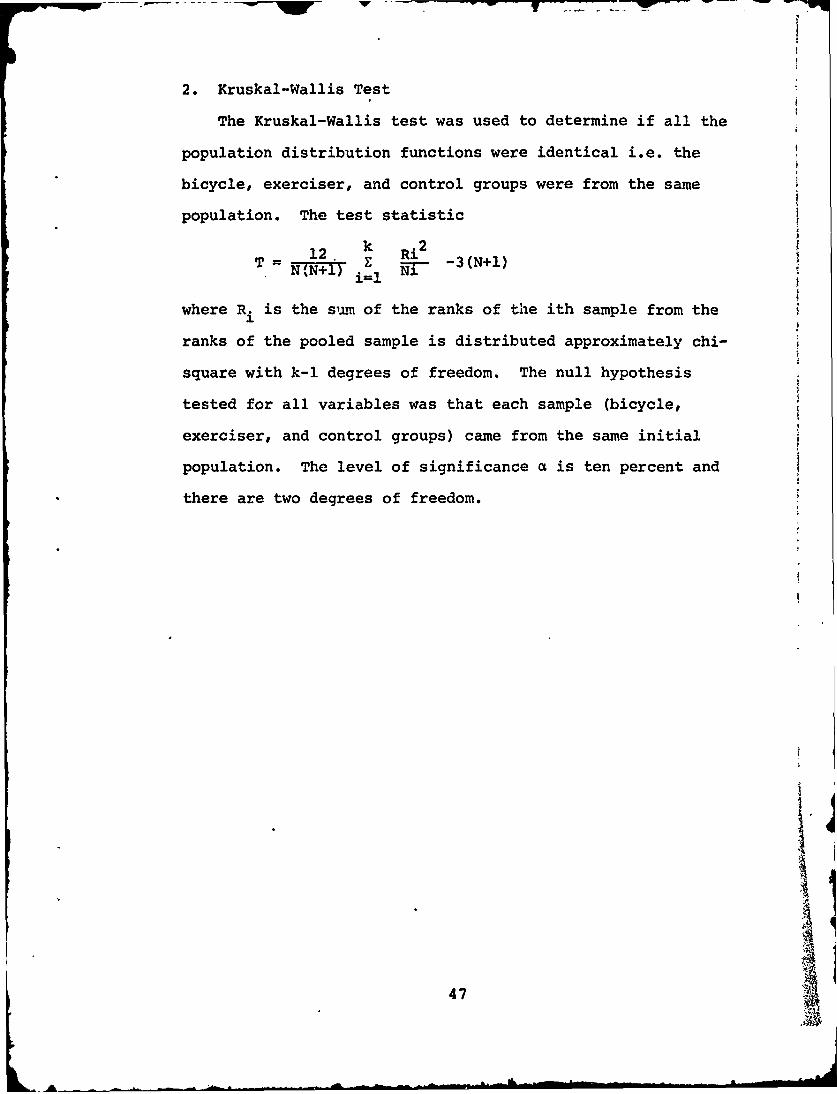
2. Kruskal-Wallis Test
The Kruskal-Wallis test was used to determine if all the
population distribution functions were identical i.e. the
bicycle, exerciser, and control groups were from the same
population. The test statistic12 k .2
T.= N,•+, ,Z E -.i -3(N+l)i=l
where R, is the slam of the ranks of the ith sample from the
ranks of the pooled sample is distributed approximately chi-
square with k-l degrees of freedom. The null hypothesis
tested for all variables was that each sample (bicycle,
exerciser, and control groups) came from the same initial
population. The level of significance a is ten percent and Ithere are two degrees of freedom.
47
A

MOU Scores
Bicycle Exercisor Control
Score Rank Score Rank Score Rank
35.76 22 48.21 30 33.33 1626.08 4 41.26 28 29.37 7
29.40 8 30.68 12 23.53 233.73 18 41.02 27 43.29 29
40.26 26 31.71 14 29.68 10
33.78 19 26.90 5 36.90 23
34.27 20 38.25 24 23.20 1
31.82 15 39.52 25 33.56 17
30.67 11 27.78 6 25.72 3
34.80 21 31.04 13 29.55 9
R1 =164 R2 =184 R3 =117
Psychomotor Scores
224.93 30 127.79 1 148.67 8
.209.07 29 181.19 23 171.93 20
"154.59 12 148.77 9 159.88 15
189.26 25 131.15 2 165.35 16
167.97 17 156.34 13 145.23 5
171.81 19 153.17 11 138.52 4
175.65 21 137.27 3 147.67 7
149.82 10 200.80 28 192.66 26
145.89 6 158.87 14 171.52 18
181.79 24 180.12 22 194.27 27
R1 =193 R2 =126 R3 =146
48
a

lw -
Depression' Scores
Bicycle Exercisor Control
Score Rank Score Rank Score Rank
12 9.5 21 26.5 12 9.5
21 26.5 13 11.5 15 15
18 22 15 15 38 30
7 4 17 20 10 8
6 3 9 6 15 15
15 15 22 28.5 18 22
9 6 9 6 18 22
13 11.5 19 24.5 19 24.5
5 1.5 5 1.5 16 18.5
22 28.5 15 15 16 18.5
R =127.5 R2 15 4 .5 R3 =183
Anxiety Scores
7 14 9 21 7 14
9 21 8 17.5 10 24.5
0 1.5 6 11.5 15 29.5
0 1.5 8 17.5 4 7
8 17.5 2 3.5 3 5
4 7 8 17.5 7 14
15 29.5 6 11.5 10 24.5 1
2 3.5 10 24.5 10 24.5
5 9.5, 4 7 12 28
9 21 5 9.5 11 27
R 126 R2 14 1 R3 =198
49

Hostility Scores
11 17 14 23 10 13.5
14 23 12 18 5 4.5
14 23 7 7 15 27
6 6 18 29 10 13.510 13.5 5 4.5 4 2
10 13.5 14 23 14 23
10 13.5 10 .13.5 13 19
9 9.5 14 23 9 9.5
4 12 4 2 22 30
17 28 8 8 4 23
R =149 R = 151 R3 165
50
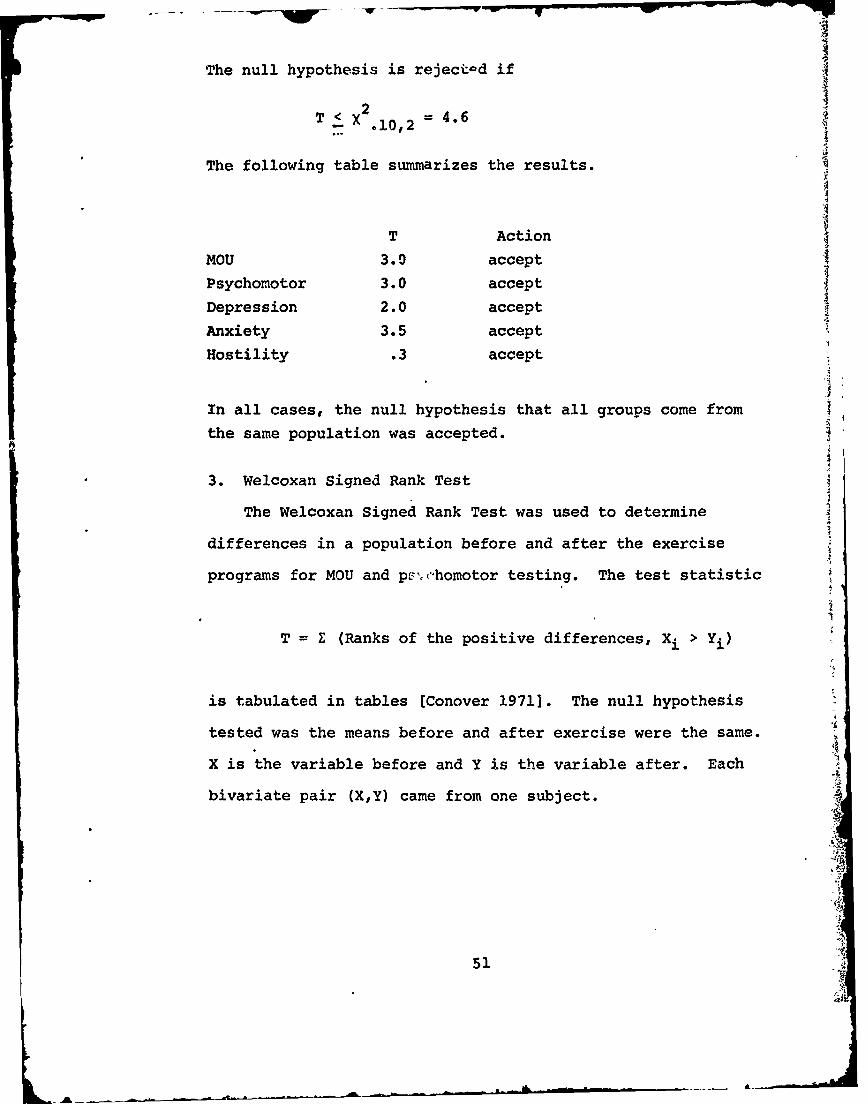
The null hypothesis is rejectod if
T < X2 oi 0,2 = 4.6
The following table summarizes the results.
T Action
MOU 3.0 accept
Psychomotor 3.0 accept
Depression 2.0 accept
Anxiety 3.5 accept
Hostility .3 accept
In all cases, the null hypothesis that all groups come from
the same population was accepted.
3. Welcoxan Signed Rank Test
The Welcoxan Signed Rank Test was used to determine
differences in a population before and after the exercise
programs for MOU and p',-,ohomotor testing. The test statistic
T = Z (Ranks of the positive differences, Xi > Yi)
is tabulated in tables [Conover 1971]. The null hypothesis
tested was the means before and after exercise were the same.
X is the variable before and Y is the variable after. Each
bivariate pair (X,Y) came from one subject.
51

a. MOU Computations
Grou Xi Yi Xi-Yi Rank Combined Rank
35.76 41.79 -6.03 6 12
26.08 40.70 -14.62 9 19
29.40 19.97 9.53 8 15
33.73 36.80 -3.07 4 8
Bicycle 40.26 35.90 4.36 5 11
33.78 34.54 -. 76 1 1
34.27 36.94 -2.67 3 7
31.82 38.91 -7.09 7 14
30.67 31.80 -1.13 2 4
34.80 14.54 20.26 10 20
= 33.06 Y = 33.19 T = 23
48.21 37.32 .89 1 2
41.26 27.30 13.94 10 18
30.68 26.79 3.89 6 10 ,
41.02 28.OE 12.96 9 17
Exer- 31.71 30.78 .93 2 3
ciser 26.90 20.80 6.10 7 13
38.25 34.95 3.30 5 9
39.52 18.57 10.95 8 16
27.78. 29.70 -1.92 3 5
31.04. 29.05 1.99 4 6
= 35.64 Y = 28.33 T = 52
Combined X = 34.35 = 30.76 T = 145
52
IJ

-~~ ~ - --- -
Grop X. Y X- Rank
33.33 26.06 7.27 10
29.37 31.92 -2.55 6
23.53 26.99 -3.46 7
43.29 4i.63 1.66 4
Control 29.68 32.11 -2.43 5
36.90 36.56 .34 2
23.20 29.15 -5.95 9
33.56 29.83 3.73 8
25.72 26.00 -. 28 1
29.55 30.79 -1.24 3
30.81 Y = 31.10 T = 24
Conclusions MOU Testing:
Bicycle: Accept Ho if 11 < T < 44 at a 10
T = 23
Accept Ho
Exerciser: Accept Ho if 11 < T < 44 at a = .10
T = 52
Reject Ho
Combined: Accept Ho if 61 < T < 149 at a .10
T = 145
Accept Ho
Control: Accept Ho if 11 < T < 44 at a = .10
T = 24
Accept Ho
53
L i

b. Psychomotor Computations
4
Group X Y. W i-Y Rank Combined Rank_i
224.93 220.59 4.34 2 5
209.07 195.53 14.54 9 19
154.59 143.90 10.69 5 14
189.26 172.11 17.15 10 20Bicycle 167.97 156.10 11.87 7 17
171.81 165.98 5.83 3 7
175.65 174.20 1.45 1 3
149.82 141.80 8.02 4 12
145.89 157.05 -11.16 -6 -15
181.79 168.15 13.64 8 18
= 177.08 ' = 169.54 T = 49
127.79 134.41 -6.62 -7.5 -10.5
181.19 '69.49 11.70 10 16
148.77 142.72 6.05 5 8131.15 131.72 -. 57 -1 -1
Exerciser 156.34 146.57 9.77 9 13
153.17 146.55 6.62 7.5 10.5
137.27 131.19 6.08 6 9
200.80 199.56 1.24 2 2
158.87 157.08 1.79 3 4
180.12 174.77 5.35 4 6
= 157.55 Y = 153.41 T = 46.5
Combined X = 167.31 • = 161.47 T = 183.5
54
KA___

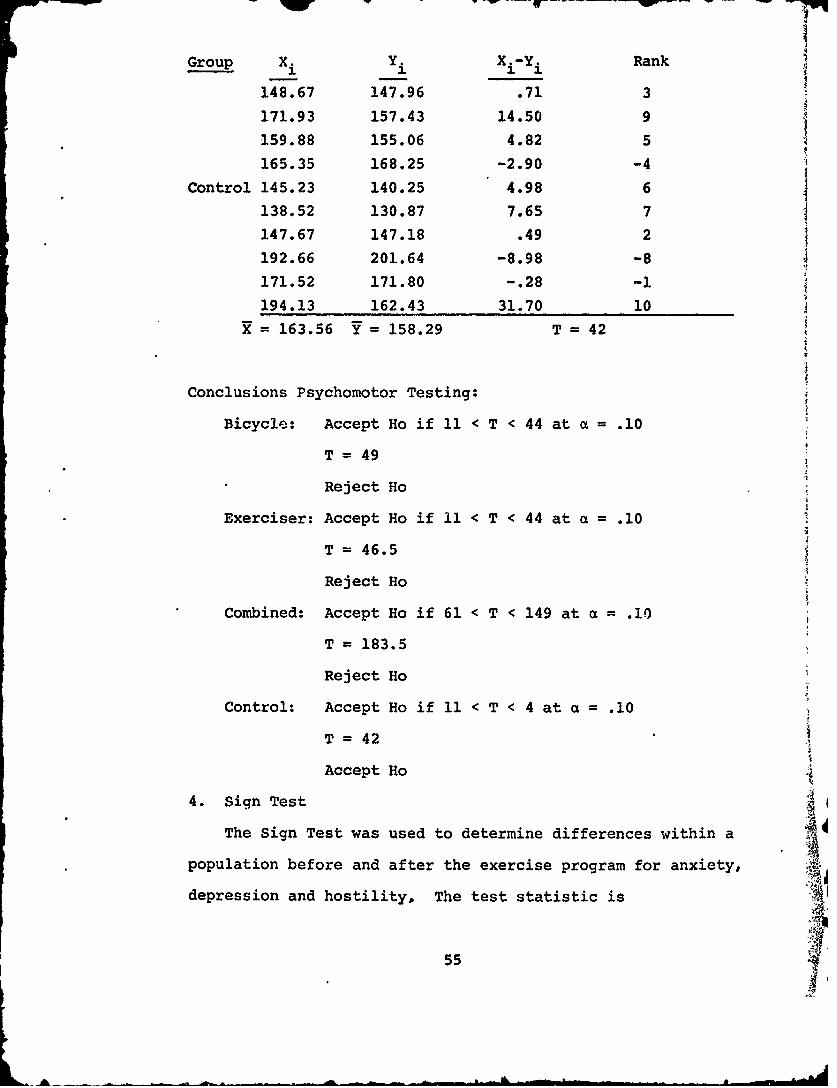
Group Xi Yi Xi-Yi Rank
148.'7 147.96 .71 3
171.93 157.43 14.50 9
159.88 155.06 4.82 5
165.35 168.25 -2.90 -4
Control 145.23 140.25 4.98 6
138.52 130.87 7.65 7147.67 147.18 .49 2
192.66 201.64 -8.98 -8
171.52 171.80 -. 28 -1
194.13 162.43 31.70 10
= 163.56 Y = 158.29 T = 42
Conclusions Psychomotor Testing:
Bicycle- Accept Ho if 11 < T < 44 at a = .10
T= 49
Reject Ho
Exerciser: Accept Ho if 11 < T ' 44 at a = .10
T = 46.5
Reject Ho
Combined: Accept Ho if 61 < T < 149 at a = .10
T = 183.5
Reject Ho
Control: Accept Ho if 11 < T < 4 at a = .10
T = 42
Accept Ho
4. Sign Test
The Sign Test was used to determine differences within a
population before and after the exercise program for anxiety,
depression and hostility, The test statistic is
55
L --
IMP-
Group Xi Y. Xi-Yi Rank
148.67 147.96 .71 3
171.93 157.43 14.50 9
159.88 155.06 4.82 5
165.35 168.25 -2.90 -4
Control 145.23 140.25 4.98 6
138.52 130.87 7.65 7
147.67 147.18 .49 2
192.66 201.64 -8.98 -8
171.52 171.80 -. 28 -1
194.13 162.43 31.70 10
S=163.56 Y=158.29 T =42
Conclusions Psychomotor Testing:
Bicycle: Accept Ho if 11 < T < 44 at a = .10
T= 49
Reject Ho
Exerciser: Accept Ho if 11 < T < 44 at a = .10
T = 46.5
Reject Ho
Combined: Accept Ho if 61 < T < 149 at a .10
T = 183.5
Reject Ho
Control: Accept Ho if 11 < T < 4 at a = .10
T= 42 i
Accept Ho
4. Sign TestThe Sign Test was used to determine differences within a 1-
population before and after the exercise program for anxiety, og
depression and hostility, The test statistic is
55

I
1 xi > YiT =Z +'s where+ =+1
0 Xi < Yi
The null hypothesis tested was that the means before and
after the exercise programs were the same. Again X is the
specified random variable before the exercise program; Y,
after. Under the null hypothesis T is binomial (n, 1/2).
The null hypothesis is rejected if T is too large or too
small. At a level of significance a of ten percent reject
the null hypothesis if
T_< W c/2 or T > Wa 2
where W is the itical value of T at the specified level of
significance a.
i5
56
3
K1
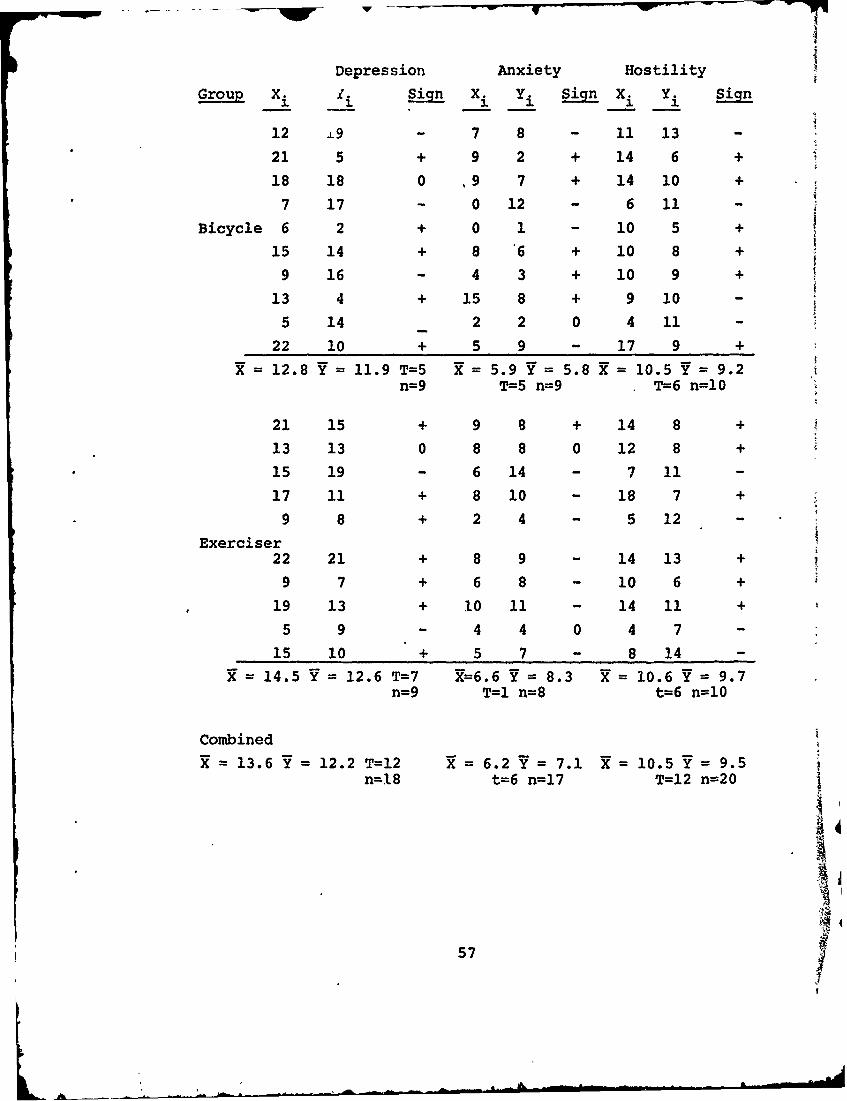
Depression Anxiety Hostility
Group Xi Sig X Yi Sign Xi Y.
12 L9 - 7 8 - 11 13 -
21 5 + 9 2 + 14 6 +
18 18 0 9 7 + 14 10 +
7 17 - 0 12 - 6 11 -
Bicycle 6 2 + 0 1 - 10 5 +
15 14 + 8 '6 + 10 8 +
9 16 - 4 3 + 10 9 +
13 4 + 15 8 + 9 10 -
5 14 2 2 0 4 11 -
22 10 + 5 9 - 17 9 +
= 12.8 Y = 11.9 T=5 X = 5.9 Y = 5.8 1 = 10.5 Y = 9.2n=9 T=5 n=9 T=6 n=10
21 15 + 9 8 + 14 8 +
13 13 0 8 8 0 12 8 +
15 19 - 6 14 - 7 11 -
17 11 + 8 10 - 18 7 +
9 8 + 2 4 - 5 12 -
Exerciser22 21 + 8 9 - 14 13 +
9 7 + 6 8 - 10 6 +
19 13 + 10 11 - 14 11 +
5 9 - 4 4 0 4 7 -
15 10 + 5 7 - 8 14 -
= 14.5 Y = 12.6 T=7 3X=6.6 Y = 8.3 X = 10.6 Y = 9.7n=9 T=1 n=8 t=6 n=10
CombinedX=13.6 =12.2 T=12 =6.2 =7.1 1=0.5 Y=9.5
n=18 t=6 n=17 T=12 n=20
5$
57T
L - k' |:I
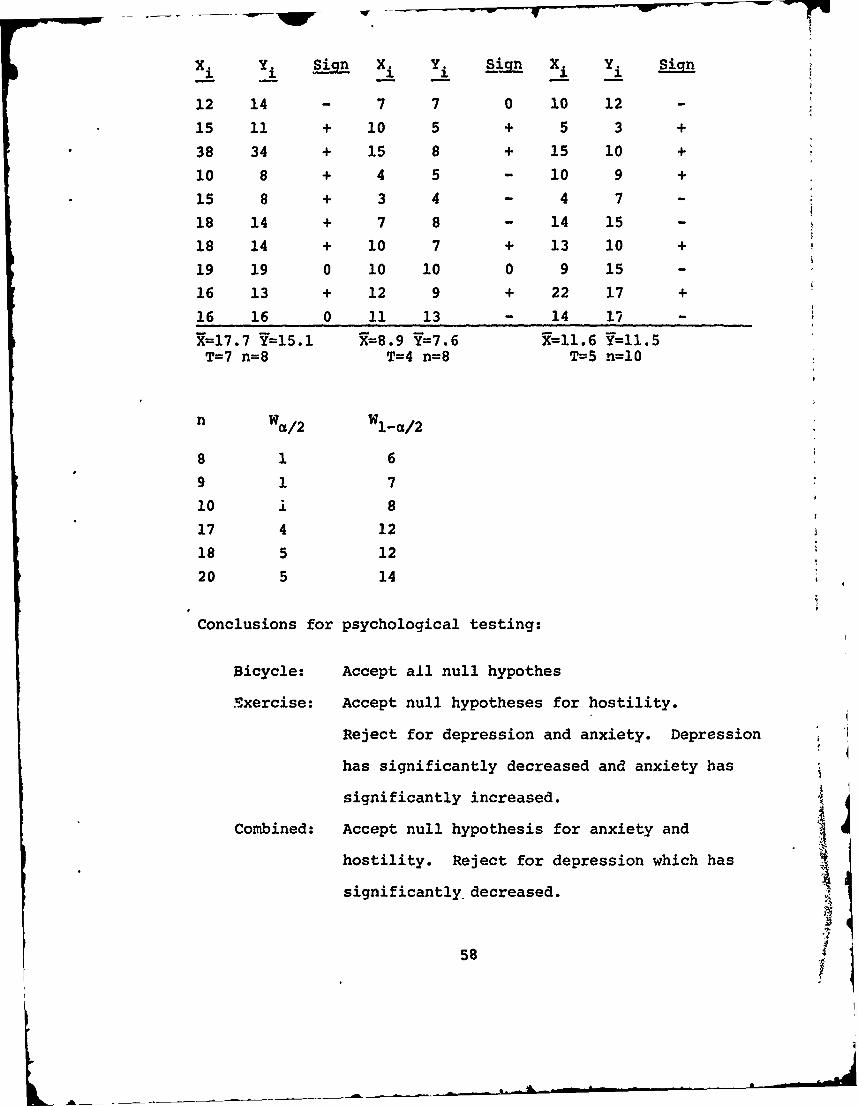
Xi Y. sign X Y si.g3 Xi Sqin
12 14 - 7 7 0 10 12 -
15 11 + 10 5 + 5 3 +
38 34 + 15 8 + 15 10 +
10 8 + 4 5 - 10 9 +
15 8 + 3 4 - 4 7 -
18 14 + 7 8 - 14 15 -
18 14 + 10 7 + 13 10 +
19 19 0 10 10 0 9 15 -
16 13 + 12 9 + 22 17 +
16 16 0 11 13 - 14 17 -
'9=17.7 Y=15.1 R=8.9 Y=7.6 R=11.6 Y=ll. 5T=7 n=8 T=4 n=8 T=5 n=10
n Wa/ 2 Wla/ 2
8 1 6
9 1 7
10 i 8
17 4 12
18 5 12
20 5 14
Conclusions for psychological testing:
Bicycle: Accept all null hypothes
Exercise: Accept null hypotheses for hostility.
Reject for depression and anxiety. Depression
has significantly decreased and anxiety has
significantly increased.
Combined: Accept null hypothesis for anxiety and
hostility. Reject for depression which has
significantlydecreased.
58

Control: Accept null hypotheses for anxiety and
hostility. Reject for depression which has
significantly decreased.
I 1
". " " .. - .. . . ' l
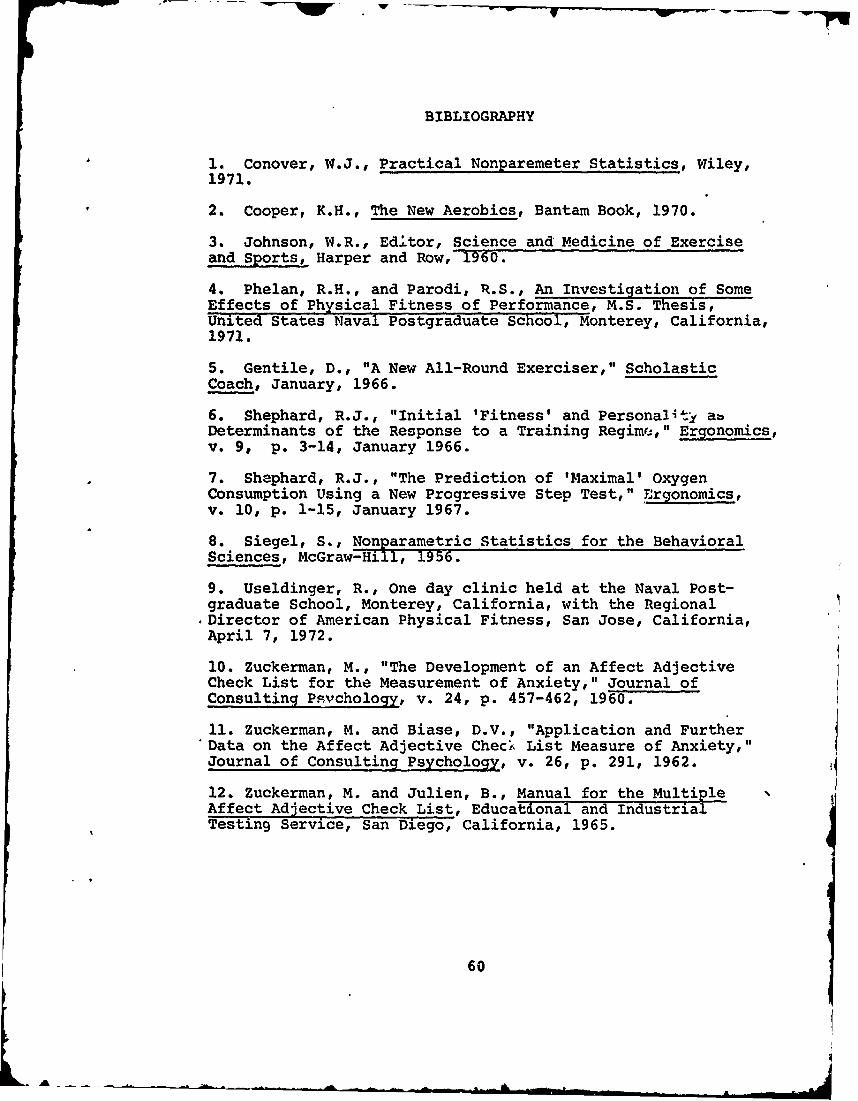
BIBLIOGRAPHY
"1. Conover, W.J., Practical Nonparemeter Statistics, Wiley,
1971.
2. Cooper, K.H., The New Aerobics, Bantam Book, 1970.
3. Johnson, W.R., Editor, Science and Medicine of Exerciseand Sports, Harper and Row, 1960.
4. Phelan, R.H., and Parodi, R.S., An Investigation of SomeEffects of Physical Fitness of Performance, M.S. Thesis,United States Naval Postgraduate School, Monterey, California,1971.
5. Gentile, D., "A New All-Round Exerciser," ScholasticCoach, January, 1966.
6. Shephard, R.J., "Initial 'Fitness' and Personality abDeterminants of the Response to a Training Regimre-," Ergonomics,v. 9, p. 3-14, January 1966.
7. Shephard, R.J., "The Prediction of 'Maximal' OxygenConsumption Using a New Progressive Step Test," Ergonomics,v. 10, p. 1-15, January 1967.
8. Siegel, S., Nonparametric Statistics for the BehavioralSciences, McGraw-Hill, 1956.
9. Useldinger, R., One day clinic held at the Naval Post-graduate School, Monterey, California, with the Regional
-Director of American Physical Fitness, San Jose, California,April 7, 1972.
10. Zuckerman, M., "The Development of an Affect AdjectiveCheck List for the Measurement of Anxiety," Journal ofConsulting Psychology, v. 24, p. 457-462, 1960.
11. Zuckerman, M. and Biase, D.V., "Application and Further"Data on the Affect Adjective Chec& List Measure of Anxiety,"Journal of Consulting Psychology, v. 26, p. 291, 1962.
12. Zuckerman, M. and Julien, B., Manual for the MultipleAffect Adjective Check List, Educat&onal and IndustrialTesting Service, San Diego, California, 1965.
60
![THE ARCHITECTS ACT, 1972*architexturez.net/system/files/pdf/architects.act_.1972.pdf · THE ARCHITECTS ACT, 1972* No. 20 of 1972 [31st May, 1972] An Act to provide for the registration](https://img.pdfslide.net/doc/110x75/5e7bad6b8ce0624bb233ab49/the-architects-act-1972-the-architects-act-1972-no-20-of-1972-31st-may-1972.jpg)