Embed Size (px)
Citation preview
P. Campos et al. (Eds.): INTERACT 2011, Part II, LNCS 6947, pp. 589–604, 2011. © IFIP International Federation for Information Processing 2011
Co-located Collaborative Sensemaking on a Large High-Resolution Display with Multiple Input Devices
Katherine Vogt1, Lauren Bradel2, Christopher Andrews2, Chris North2, Alex Endert2, and Duke Hutchings1
1 Department of Computing Sciences Elon University, Elon, NC 27244, USA {kvogt,dhutchings}@elon.edu
2 Department of Computer Science Virginia Tech, Blacksburg, VA 24060, USA
{lbradel1,cpa,north,aendert}@cs.vt.edu
Abstract. This study adapts existing tools (Jigsaw and a text editor) to support multiple input devices, which were then used in a co-located collaborative intel-ligence analysis study conducted on a large, high-resolution display. Exploring the sensemaking process and user roles in pairs of analysts, the two-hour study used a fictional data set composed of 50 short textual documents that contained a terrorist plot and subject pairs who had experience working together. The large display facilitated the paired sensemaking process, allowing teams to spa-tially arrange information and conduct individual work as needed. We discuss how the space and the tools affected the approach to the analysis, how the teams collaborated, and the user roles that developed. Using these findings, we sug-gest design guidelines for future co-located collaborative tools.
Keywords: Visual analytics, sensemaking, co-located, CSCW, large high-resolution display.
1 Introduction
As analysts sort through the growing amounts of data every day, tools that can display the information in a useful manner without overwhelming their sensemaking process are a beneficial component of their workflow. Visual analytics works to improve analysts’ experience in their work and productivity. As such, exploring what collaborative visual analytics may contribute to this challenge has become a key area of research within vis-ual analytics [1]. Through the support of collaboration within the analytic process, designers can improve the effectiveness though leveraging various social and group dy-namics [2]. Various design guidelines and structured collaborative techniques exist [3], but, as the culture of intelligence analyst working within an agency can be described as “competitive”, where sharing of knowledge may adversely affect their job security, col-laboration occurs at a much less formal level, if at all [4]. The study presented here does not present a formal collaborative method, but places the users in a setting where information and knowledge is inherently shared through the use of a shared workspace.
590 K. Vogt et al.
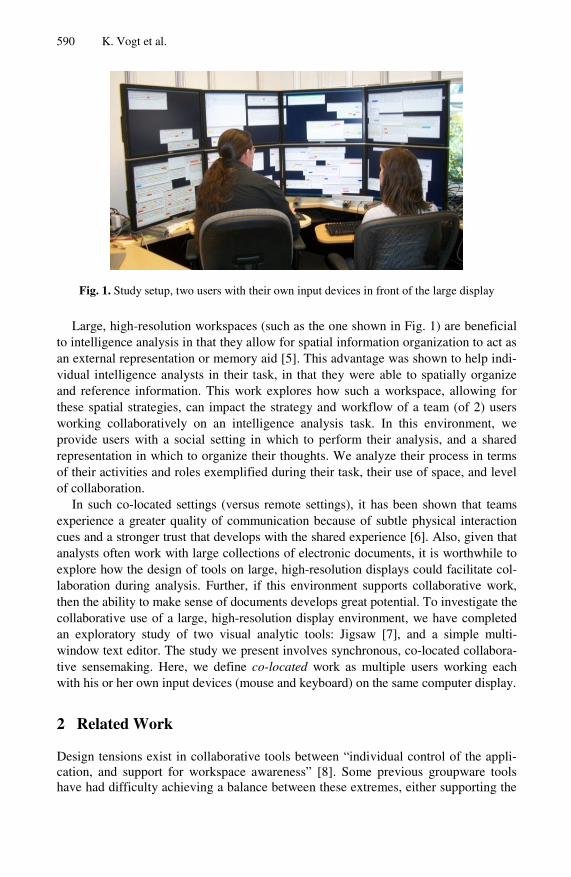
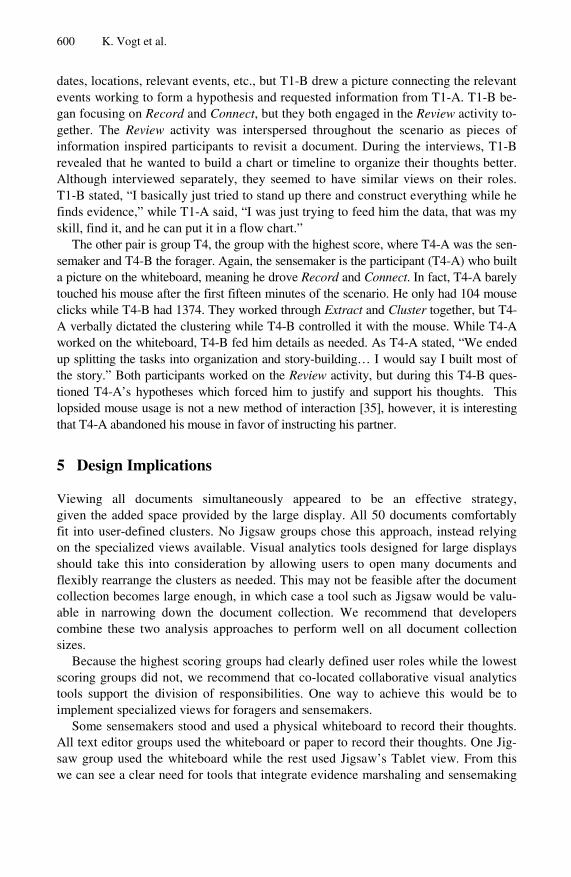
Fig. 1. Study setup, two users with their own input devices in front of the large display
Large, high-resolution workspaces (such as the one shown in Fig. 1) are beneficial to intelligence analysis in that they allow for spatial information organization to act as an external representation or memory aid [5]. This advantage was shown to help indi-vidual intelligence analysts in their task, in that they were able to spatially organize and reference information. This work explores how such a workspace, allowing for these spatial strategies, can impact the strategy and workflow of a team (of 2) users working collaboratively on an intelligence analysis task. In this environment, we provide users with a social setting in which to perform their analysis, and a shared representation in which to organize their thoughts. We analyze their process in terms of their activities and roles exemplified during their task, their use of space, and level of collaboration.
In such co-located settings (versus remote settings), it has been shown that teams experience a greater quality of communication because of subtle physical interaction cues and a stronger trust that develops with the shared experience [6]. Also, given that analysts often work with large collections of electronic documents, it is worthwhile to explore how the design of tools on large, high-resolution displays could facilitate col-laboration during analysis. Further, if this environment supports collaborative work, then the ability to make sense of documents develops great potential. To investigate the collaborative use of a large, high-resolution display environment, we have completed an exploratory study of two visual analytic tools: Jigsaw [7], and a simple multi-window text editor. The study we present involves synchronous, co-located collabora-tive sensemaking. Here, we define co-located work as multiple users working each with his or her own input devices (mouse and keyboard) on the same computer display.
2 Related Work
Design tensions exist in collaborative tools between “individual control of the appli-cation, and support for workspace awareness” [8]. Some previous groupware tools have had difficulty achieving a balance between these extremes, either supporting the
Co-located Collaborative Sensemaking on a Large High-Resolution Display 591
group through consistent view sharing (“What You See Is What I See” – WYSIWIS) or the individual through relaxed view sharing [9]. However, Gutwin and Greenberg feel that a solution to this tension exists, stating that “the ideal solution would be to support both needs – show everyone the same objects as in WYSIWIS systems, but also let people move freely around the workspace, as in relaxed-WYSIWIS group-ware” [8]. Single display groupware provides an interface to achieve this balance.
Single Display Groupware (SDG) concerns face-to-face collaboration around a single shared display [10]. Early SDG systems include Liveboard [11], Tivoli [12], and the Digital Whiteboard [13]. When compared to co-located multi-display groupware, SDG resulted in increased collaborative awareness [14]. Stewart et al. continued to investigate SDG systems in subsequent work ([15, 16]). They proposed that the multi-user nature of SDG systems on early displays with limited screen size “may result in reduced func-tionality compared with similar single-user programs” [16], although this concern can be alleviated by increasing the physical size (and resolution) of the SDG display.
SDG systems using multiple input devices have been found to increase interaction between participants and keep participants “in the zone” [15]. Providing a separate mouse and keyboard to each participant has been shown to allow users to complete more work in parallel than if they were restricted to a single mouse and keyboard [17]. Multiple input devices provide the benefit of allowing reticent users to contrib-ute to the task [18, 19]. As a result of our desire to keep participants in the “cognitive zone” [20], given the cognitively demanding nature of sensemaking tasks, we chose to implement multiple input devices for our set-up.
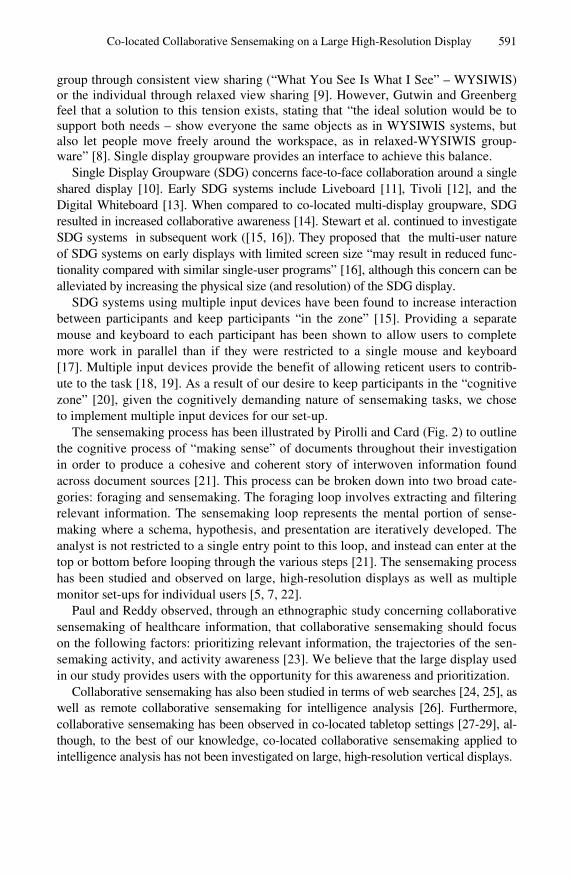
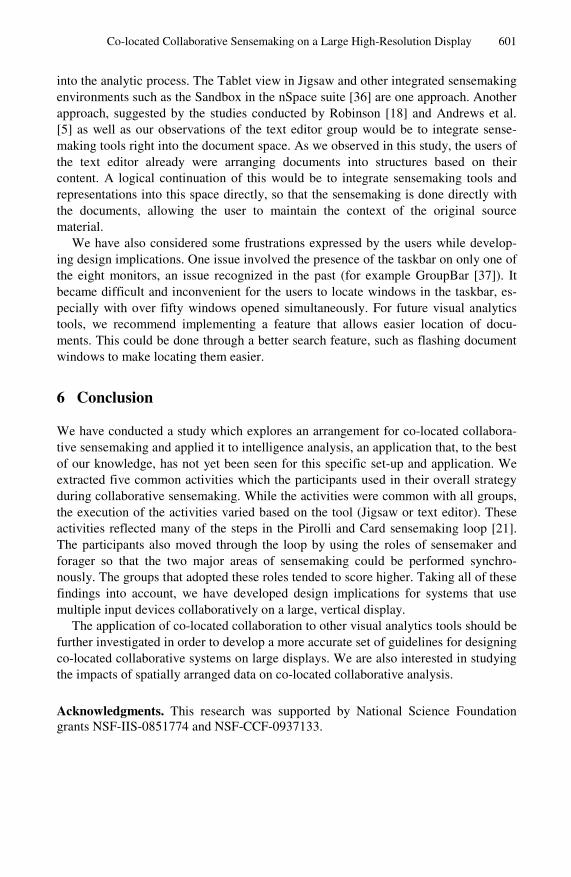
The sensemaking process has been illustrated by Pirolli and Card (Fig. 2) to outline the cognitive process of “making sense” of documents throughout their investigation in order to produce a cohesive and coherent story of interwoven information found across document sources [21]. This process can be broken down into two broad cate-gories: foraging and sensemaking. The foraging loop involves extracting and filtering relevant information. The sensemaking loop represents the mental portion of sense-making where a schema, hypothesis, and presentation are iteratively developed. The analyst is not restricted to a single entry point to this loop, and instead can enter at the top or bottom before looping through the various steps [21]. The sensemaking process has been studied and observed on large, high-resolution displays as well as multiple monitor set-ups for individual users [5, 7, 22].
Paul and Reddy observed, through an ethnographic study concerning collaborative sensemaking of healthcare information, that collaborative sensemaking should focus on the following factors: prioritizing relevant information, the trajectories of the sen-semaking activity, and activity awareness [23]. We believe that the large display used in our study provides users with the opportunity for this awareness and prioritization.
Collaborative sensemaking has also been studied in terms of web searches [24, 25], as well as remote collaborative sensemaking for intelligence analysis [26]. Furthermore, collaborative sensemaking has been observed in co-located tabletop settings [27-29], al-though, to the best of our knowledge, co-located collaborative sensemaking applied to intelligence analysis has not been investigated on large, high-resolution vertical displays.
592 K. Vogt et al.
Fig. 2. Adapted from sensemaking loop, Pirolli and Card [21]
User performance on simple tasks, such as pattern matching, has been shown to im-prove when using a large, high-resolution vertical display when contrasted with a stan-dard single monitor display [30]. In addition to quantitative improvement, users were ob-served using more physical navigation (e.g. glancing, head/body turning) than virtual navigation (e.g. manually switching windows or tasks, minimizing/maximizing docu-ments) when using large, high-resolution displays, such as the one shown in Fig. 1.
Andrews et al. expanded the benefits of using large, high-resolution display to cognitively demanding tasks (i.e., sensemaking) [5]. We chose to use these displays to explore collaborative sensemaking on large vertical displays, especially the user roles that develop throughout the sensemaking process and how the sensemaking process is tackled by teams of two.
3 Study Design
We have conducted an exploratory study examining the collaborative sensemaking process on a large, high-resolution display. Teams of two were asked to assume the role of intelligence analysts tasked with analyzing a collection of text documents to uncover a hidden plot against the United States. The teams were provided with one of two tools, Jigsaw or a multi-document text editor, with which they were asked to con-duct their analysis. While each team was told that they were expected to work col-laboratively, the nature of that collaboration was left entirely up to the participants.
3.1 Participants
We recruited eight pairs of participants (J1-J4 used Jigsaw, T1-T4 used the text editor). All pairs knew one another and had experience working together prior to the study. Six of the eight pairs were students and the other two pairs consisted of research associates

Co-located Collaborative Sensemaking on a Large High-Resolution Display 593
and faculty. There were four all male groups, one all female, and three mixed gender. Each participant was compensated $15 for participation. As a form of motivation, the so-lutions generated by the pairs of participants were scored and the participants received an additional financial award for the four highest scores. The rubric for evaluating the par-ticipants’ verbal and written solutions was based on the strategy for scoring Visual Analytics Science and Technology (VAST) challenges [22]. The participants earned positive points for the people, events, and locations related to the solution and negative points for those that were irrelevant or incorrect. They also received points based on the accuracy of their overall prediction of an attack.
3.2 Apparatus
Each pair of users sat in front of a large display consisting of a 4x2 grid of 30” LCD 2560x1600 pixel monitors totaling 10,240x3,200 pixels or 32 megapixels (Fig. 1). The display was slightly curved around the users, letting them view the majority, if not all, of the display in their peripheral vision. A single machine running Fedora 8 drove the display. A multi-cursor window manager based on modified versions of the IceWM and x2x was used to support two independent mice and keyboards [31]. Thus, each user was able to type and use the mouse independently and simultaneously in the shared workspace. This multi-input technology allowed two windows to be “active” at the same time, allowing participants to conduct separate investigations if they chose. A whiteboard, markers, paper, and pens were also available for use. These ex-ternal artifacts were provided as a result of a pilot study where participants explicitly requested to use the whiteboard or write on sheets of paper. Each participant was pro-vided with a rolling chair and free-standing, rolling table top holding the keyboard and mouse so that they could move around if they chose to do so. The desks and chairs were initially positioned side-by-side in the central area of the screen space.
3.3 Analytic Environment
During this exploratory study, four of the pairs (J1-J4) examined the documents within Jigsaw, a recent visual analytics tool, while the other four (T1-T4) used a basic text edi-tor, AbiWord [32], as a contrasting tool. We chose to investigate these two tools due to the different analytical approaches the tools inherently foster. Jigsaw supports a function-based approach to analysis, allowing the tool to highlight connections between docu-ments and entities. The Text Editor instead forces the participants to read each document first, and then draw connections themselves without any analytical aid. We do not intend for these two tools to be representative of all visual analytics tools. Instead, we sought to explore co-located collaborative sensemaking in two different environments. This text editor allows the user to highlight individual document sections and edit existing docu-ments or create text notes. Teams using this text editor were also provided with a file browser in which they could search for keywords across the document collection. Jigsaw [7, 33] is a system that has been designed to support analysts; it visualizes document col-lections in multiple views based on the entities (people, organizations, locations, etc.) within those documents. It also allows textual search queries of the documents and enti-ties. The views are linked by default so that exploring an entity in one visualization will simultaneously expand it in another. This feature is controlled by the user and can be turned on or off within each view. We were not able to change Jigsaw’s source code to

594 K. Vogt et al.
allow windows to be linked separately for each participant, therefore all Jigsaw views were connected unless the linking feature was disabled by the participant teams. Jigsaw can sort documents based on entity frequency, type, and relations. This information can be displayed in many different ways, including interactive graphs, lists, word clouds, and timelines. Jigsaw also comes equipped with a recently added Tablet view where users can record notes, label connections made between entities, identify aliases, and create timelines. As a result of the complexity of the visualizations available in Jigsaw, pairs using this visual analytics tool were given a thirty minute tutorial prior to the start of the scenario, while pairs using the text editor only required a five minute tutorial.
3.4 Task and Procedure
After a tutorial on Jigsaw or the text editor with a sample set of documents, each pair was given two hours to analyze a set of 50 text documents and use the information gathered to predict a future event. This scenario comes from an exercise developed to train intelli-gence analysts and consists of a number of synthetic intelligence reports concerning vari-ous incidents around the United States, some of which can be connected to gain insight into a potential terrorist attack. This same scenario was also used in a previous study evaluating individual analysts with Jigsaw [33]. Following the completion of the sce-nario, each participant filled out a report sheet to quantitatively assess their individual understanding of the analysis scenario, then verbally reported their final solution together to the observers. Finally, individual semi-structured interviews were conducted where each participant commented on how they solved the scenario, how this involved collabo-ration, and their sense of territoriality.
3.5 Data Collection
During each scenario, an observer was always present taking notes. Video and audio of every scenario, debriefing, and interview was recorded. The video was coded using PeCoTo [34]. We also collected screenshots in fifteen second intervals and logged mouse actions and active windows. The screenshots played two roles in our analysis. Their primary role was to allow us to “play back” the process of the analysis so that we could observe window movements and the use of the space. Furthermore, we ap-plied the previously described point system in order to evaluate the accuracy of their debriefing, providing a way to quantitatively measure their performance. The scores can be seen below in Table 1. There was no significant difference between overall performance between the Jigsaw and Text Editor tool conditions when evaluated with a t-test, although statistical significance is difficult to show with small sample sizes.
Table 1. Overall team scores grouped by tool used comparing aggregated performance
Jigsaw Text Editor J1 11 T1 13 J2 -1 T2 -1 J3 -2 T3 10
J4 -7 T4 14
Co-located Collaborative Sensemaking on a Large High-Resolution Display 595
4 Analysis
4.1 User Activities
Each group exhibited a variety of activities depending on their amount of progress to achieve a satisfactory solution. After analyzing the video, interviews, and solution re-ports, we have concluded that five major activities that were used by the participants, which together formed a strategy for analyzing the data. These were not usually ex-plicitly identified by the participants, but rather tasks that the participants naturally took on in order to uncover the underlying terrorist plot. The five activities are ex-tract, cluster, record, connect, and review and will be described in greater detail be-low. Although each group exhibited the execution of each activity (one exception being cluster which we will discuss later), the groups used different methods to im-plement that activity that were often based on the interface condition (Jigsaw or text editor) of the group [Table 2].
Extract. The groups had no starting point or lead to begin with - just fifty text docu-ments and the knowledge that there was a terrorist threat to the nation. Therefore, they needed to familiarize themselves with the information presented within the documents and then extract that which seemed important. In Jigsaw, the visualizations allowed for participants to begin this process by looking at frequently occurring entities and the other entities and documents to which they connected. With the text editor, these features were not available therefore the participants were forced to open and read each document. They then all used color-coded highlighting to distinguish entities and/or important phrases. The coloring scheme was decided upon by the participants, whereas Jigsaw maintains a set color scheme for entities. In the text editor groups, the subjects opened documents in consistent locations to read them, but soon moved the opened documents into meaningful clusters (see next activity). The Extract activity required little display space to complete in either study condition. This activity was done together in some groups with both participants simultaneously reading the same document and in parallel in others with each participant reading half of the docu-ments, often split by document number.
Table 2. Five sensemaking activities and their methods for corresponding tool
Activity Tool Method Extract Jigsaw Look over frequently occurring entities and related documents
Text Editor Read all of the documents, together or separately, and highlight Cluster Jigsaw (did not occur with this tool as Jigsaw automatically color codes
and groups the entities by type) Text Editor Group document windows by related content
Record Jigsaw Tablet (3 groups), whiteboard & paper (1 group) Text Editor Whiteboard, paper
Connect Jigsaw Loop between list, document view, and Tablet (or pa-per/whiteboard), together or separately
Text Editor Search function; reread paper, whiteboard, and documents Review Jigsaw Reread, search for unviewed documents (2 groups)
Text Editor Reread, possibly close windows after reviewing
596 K. Vogt et al.
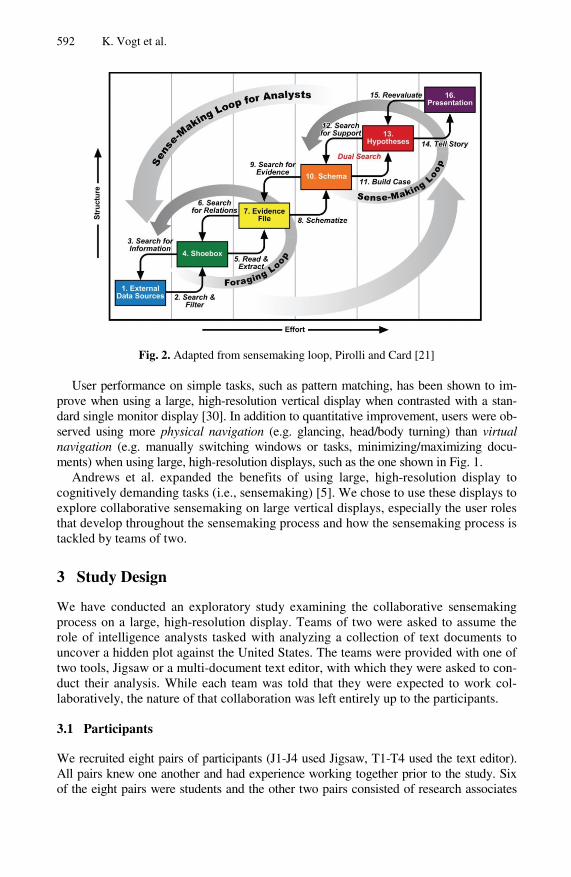
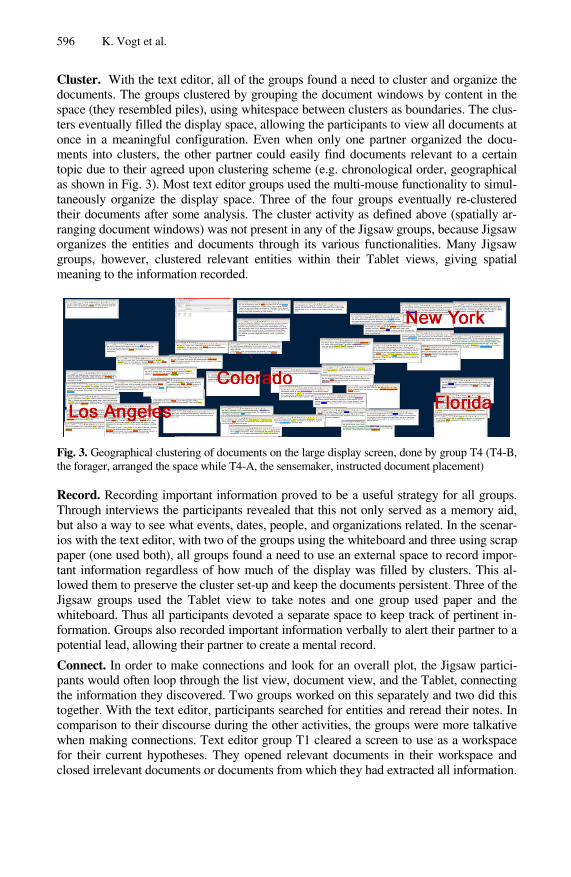
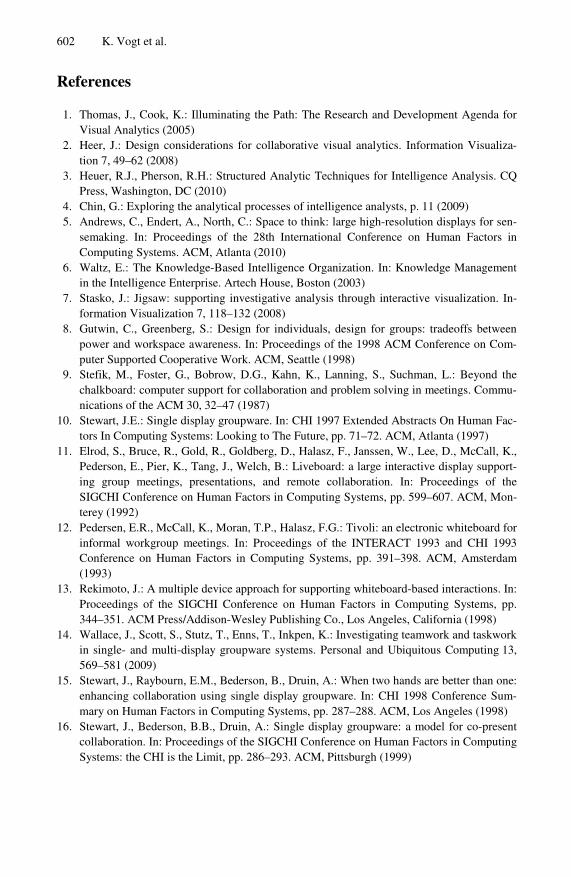
Cluster. With the text editor, all of the groups found a need to cluster and organize the documents. The groups clustered by grouping the document windows by content in the space (they resembled piles), using whitespace between clusters as boundaries. The clus-ters eventually filled the display space, allowing the participants to view all documents at once in a meaningful configuration. Even when only one partner organized the docu-ments into clusters, the other partner could easily find documents relevant to a certain topic due to their agreed upon clustering scheme (e.g. chronological order, geographical as shown in Fig. 3). Most text editor groups used the multi-mouse functionality to simul-taneously organize the display space. Three of the four groups eventually re-clustered their documents after some analysis. The cluster activity as defined above (spatially ar-ranging document windows) was not present in any of the Jigsaw groups, because Jigsaw organizes the entities and documents through its various functionalities. Many Jigsaw groups, however, clustered relevant entities within their Tablet views, giving spatial meaning to the information recorded.
Fig. 3. Geographical clustering of documents on the large display screen, done by group T4 (T4-B, the forager, arranged the space while T4-A, the sensemaker, instructed document placement)
Record. Recording important information proved to be a useful strategy for all groups. Through interviews the participants revealed that this not only served as a memory aid, but also a way to see what events, dates, people, and organizations related. In the scenar-ios with the text editor, with two of the groups using the whiteboard and three using scrap paper (one used both), all groups found a need to use an external space to record impor-tant information regardless of how much of the display was filled by clusters. This al-lowed them to preserve the cluster set-up and keep the documents persistent. Three of the Jigsaw groups used the Tablet view to take notes and one group used paper and the whiteboard. Thus all participants devoted a separate space to keep track of pertinent in-formation. Groups also recorded important information verbally to alert their partner to a potential lead, allowing their partner to create a mental record.
Connect. In order to make connections and look for an overall plot, the Jigsaw partici-pants would often loop through the list view, document view, and the Tablet, connecting the information they discovered. Two groups worked on this separately and two did this together. With the text editor, participants searched for entities and reread their notes. In comparison to their discourse during the other activities, the groups were more talkative when making connections. Text editor group T1 cleared a screen to use as a workspace for their current hypotheses. They opened relevant documents in their workspace and closed irrelevant documents or documents from which they had extracted all information.
Co-located Collaborative Sensemaking on a Large High-Resolution Display 597
In all text editor cases, the meaning conveyed by clustered documents on the display was helpful in drawing connections.
Review. This appeared to be a very important element in the groups’ analyses. Often when one or both partners reread a document for the second, third, or even fourth time, it took on a new meaning to them after they understood the greater context of the scenario. This element of review could also help the participants as they worked to Connect. Two of the Jigsaw groups chose to search for unviewed documents to ensure that they had encountered all potentially important information. Two of the text editor groups began closing windows after they had reread them. Sometimes this was be-cause the document was considered irrelevant. For example, group T3 moved unre-lated documents to what they called the “trash window”. They later reread all of the trash window documents and closed those which still seemed irrelevant. The Review activity also included discussing current and alternative hypotheses.
While the activities listed in the table can be loosely defined in this sequential or-der, the order is certainly not set nor were they visited only once within each scenario. Rather, there was often rapid but natural movement between these activities and their methods depending on the current needs of the analysis. In particular, the middle three activities were present many times throughout the study. Extract was only necessary during the first part of each scenario and review was usually only seen after a significant portion of the first activity had been completed.
4.2 Comparison between Sensemaking Loop and Activities
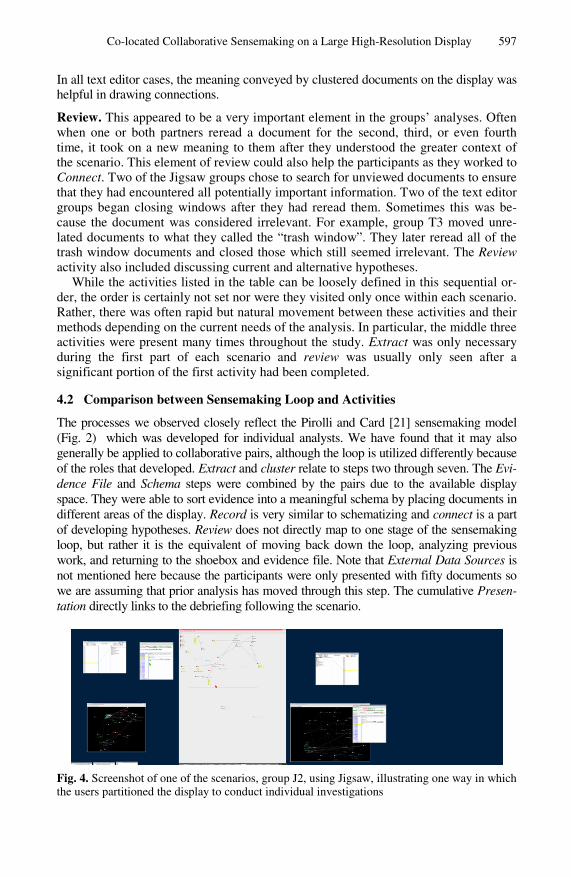
The processes we observed closely reflect the Pirolli and Card [21] sensemaking model (Fig. 2) which was developed for individual analysts. We have found that it may also generally be applied to collaborative pairs, although the loop is utilized differently because of the roles that developed. Extract and cluster relate to steps two through seven. The Evi-dence File and Schema steps were combined by the pairs due to the available display space. They were able to sort evidence into a meaningful schema by placing documents in different areas of the display. Record is very similar to schematizing and connect is a part of developing hypotheses. Review does not directly map to one stage of the sensemaking loop, but rather it is the equivalent of moving back down the loop, analyzing previous work, and returning to the shoebox and evidence file. Note that External Data Sources is not mentioned here because the participants were only presented with fifty documents so we are assuming that prior analysis has moved through this step. The cumulative Presen-tation directly links to the debriefing following the scenario.
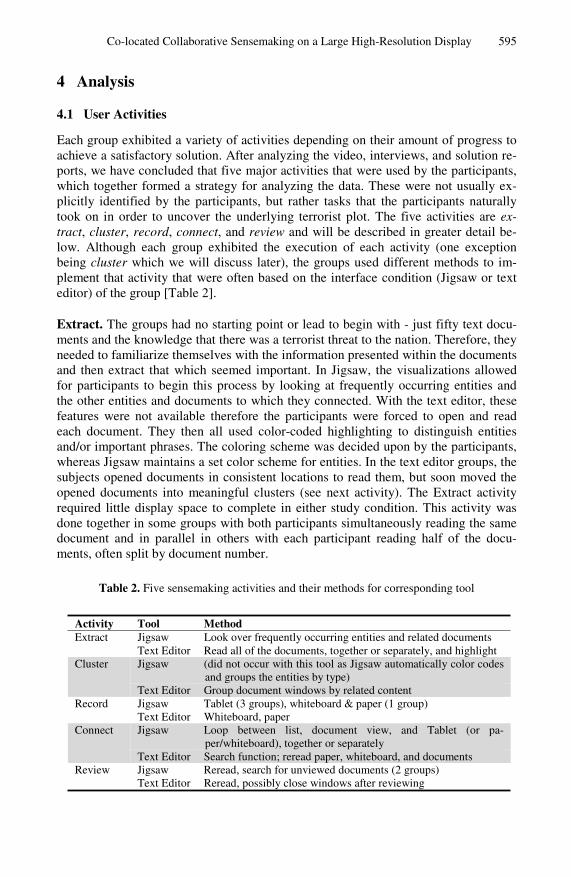
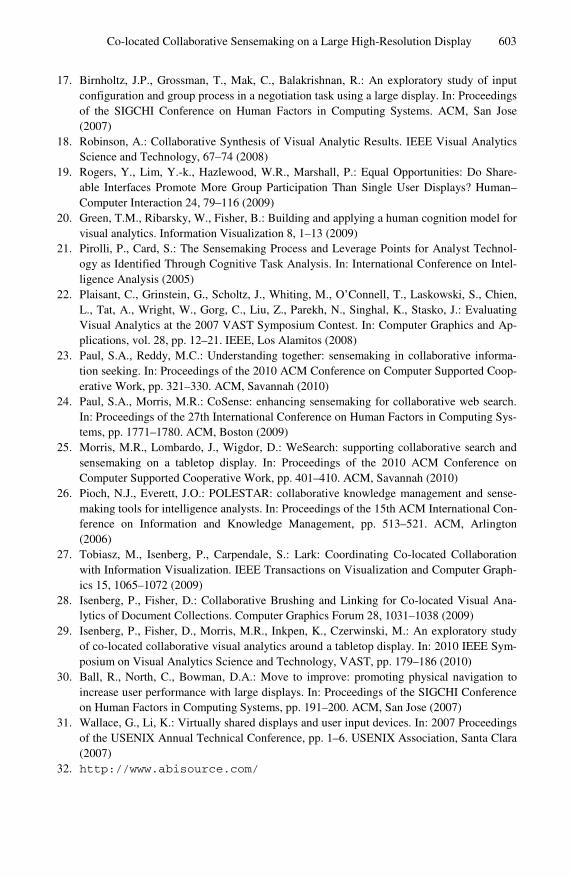
Fig. 4. Screenshot of one of the scenarios, group J2, using Jigsaw, illustrating one way in which the users partitioned the display to conduct individual investigations
598 K. Vogt et al.
While the activities described above and the sensemaking loop hold parallel ideas, we do want to distinguish the two concepts. The overall strategy we propose has been condensed to five activities as a result of the collaboration and space. Additionally, we have given the idea of review new emphasis. This is a very important element in the sensemaking process, but is not explicitly identified in the sensemaking loop.
All of the activities, excluding Cluster, were present in both scenarios. This is notable considering the vast differences of the scenarios based on tool type. Since the activities we observed correspond to the Pirolli and Card sensemaking model [21], with the primary difference in user behavior being the tool-specific methods adopted to fulfill those activities, we propose that these activities are very likely to be universal.
4.3 Collaboration Levels
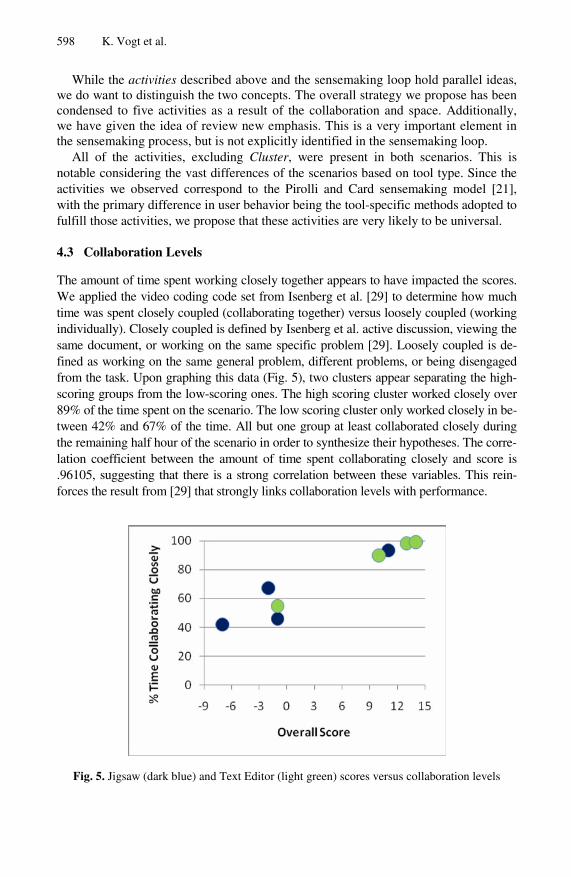
The amount of time spent working closely together appears to have impacted the scores. We applied the video coding code set from Isenberg et al. [29] to determine how much time was spent closely coupled (collaborating together) versus loosely coupled (working individually). Closely coupled is defined by Isenberg et al. active discussion, viewing the same document, or working on the same specific problem [29]. Loosely coupled is de-fined as working on the same general problem, different problems, or being disengaged from the task. Upon graphing this data (Fig. 5), two clusters appear separating the high-scoring groups from the low-scoring ones. The high scoring cluster worked closely over 89% of the time spent on the scenario. The low scoring cluster only worked closely in be-tween 42% and 67% of the time. All but one group at least collaborated closely during the remaining half hour of the scenario in order to synthesize their hypotheses. The corre-lation coefficient between the amount of time spent collaborating closely and score is .96105, suggesting that there is a strong correlation between these variables. This rein-forces the result from [29] that strongly links collaboration levels with performance.
Fig. 5. Jigsaw (dark blue) and Text Editor (light green) scores versus collaboration levels
Co-located Collaborative Sensemaking on a Large High-Resolution Display 599
4.4 User Roles
All groups divided the responsibilities of the collaborative sensemaking task. The roles could be observed during the study because of actions and conversation, but they were also evident during the interviews following the study. Five of the eight groups established clearly defined collaborative roles (measured through video cod-ing). This appeared to be because the three groups were going through the steps of the analysis independently, but in parallel. Therefore various team-related roles and responsibilities in the analysis were less likely to develop.
For the five groups who established clearly defined roles, the two broad roles we identified through this analysis are sensemaker and forager. These high-level roles were primarily established after a considerable amount of the investigation had been completed, normally after the half-way point of the study session. Primarily, the sen-semaker tended to be the dominant partner, often dictating what the forager did. Common activities for the sensemaker included standing, writing on the whiteboard, using a hand to point to information (instead of using a cursor), and rarely using a mouse, instead requesting the forager to perform various activities. The forager’s role consisted of questioning the current hypotheses, finding information, and maintaining a better awareness of where the information was located. For example, the sense-maker would request actions such as “can you open [a particular document]?” and the forager would perform the action.
These two roles closely match the two primary sub-loops (Fig. 2) in the Pirolli and Card model [21]. The first loop, foraging, involves sorting through data to distinguish what is relevant from the rest of the information. The second loop, sensemaking, in-volves utilizing the information pulled aside during the foraging process to schema-tize and form a hypothesis during the analysis. Thus, the sensemaker was more con-cerned with the synthesizing of the information, while the forager was more involved in the gathering, verifying, and organizing of the information. While the sensemaker and forager each spent the majority of their time at their respective ends of the loop, they did not isolate themselves from the rest of the sensemaking process.
To illustrate the distribution of responsibilities prompted by the roles adopted, we will explain in detail two of the pairs where the participants formed distinct roles. These are the two groups in which the roles are most clearly defined, and are therefore the most interesting to talk about.
In group T1, the team with the second-highest score, both participants spent the first hour foraging (i.e., exposing, clustering) for information while taking a few breaks to engage in sensemaking activities (i.e., connecting). Participant T1-A (the subject who sat on the left) at times led T1-B’s (the participant who sat on the right) actions by initializing activities or finalizing decisions. At the 68-minute mark, par-ticipant T1-B moved to the whiteboard (never to return to the computer input devices) and established a clear, dominant role as sensemaker while T1-A continued to forage for information. Specifically, T1-A organized the documents, searched, and provided
600 K. Vogt et al.
dates, locations, relevant events, etc., but T1-B drew a picture connecting the relevant events working to form a hypothesis and requested information from T1-A. T1-B be-gan focusing on Record and Connect, but they both engaged in the Review activity to-gether. The Review activity was interspersed throughout the scenario as pieces of information inspired participants to revisit a document. During the interviews, T1-B revealed that he wanted to build a chart or timeline to organize their thoughts better. Although interviewed separately, they seemed to have similar views on their roles. T1-B stated, “I basically just tried to stand up there and construct everything while he finds evidence,” while T1-A said, “I was just trying to feed him the data, that was my skill, find it, and he can put it in a flow chart.”
The other pair is group T4, the group with the highest score, where T4-A was the sen-semaker and T4-B the forager. Again, the sensemaker is the participant (T4-A) who built a picture on the whiteboard, meaning he drove Record and Connect. In fact, T4-A barely touched his mouse after the first fifteen minutes of the scenario. He only had 104 mouse clicks while T4-B had 1374. They worked through Extract and Cluster together, but T4-A verbally dictated the clustering while T4-B controlled it with the mouse. While T4-A worked on the whiteboard, T4-B fed him details as needed. As T4-A stated, “We ended up splitting the tasks into organization and story-building… I would say I built most of the story.” Both participants worked on the Review activity, but during this T4-B ques-tioned T4-A’s hypotheses which forced him to justify and support his thoughts. This lopsided mouse usage is not a new method of interaction [35], however, it is interesting that T4-A abandoned his mouse in favor of instructing his partner.
5 Design Implications
Viewing all documents simultaneously appeared to be an effective strategy, given the added space provided by the large display. All 50 documents comfortably fit into user-defined clusters. No Jigsaw groups chose this approach, instead relying on the specialized views available. Visual analytics tools designed for large displays should take this into consideration by allowing users to open many documents and flexibly rearrange the clusters as needed. This may not be feasible after the document collection becomes large enough, in which case a tool such as Jigsaw would be valu-able in narrowing down the document collection. We recommend that developers combine these two analysis approaches to perform well on all document collection sizes.
Because the highest scoring groups had clearly defined user roles while the lowest scoring groups did not, we recommend that co-located collaborative visual analytics tools support the division of responsibilities. One way to achieve this would be to implement specialized views for foragers and sensemakers.
Some sensemakers stood and used a physical whiteboard to record their thoughts. All text editor groups used the whiteboard or paper to record their thoughts. One Jig-saw group used the whiteboard while the rest used Jigsaw’s Tablet view. From this we can see a clear need for tools that integrate evidence marshaling and sensemaking
Co-located Collaborative Sensemaking on a Large High-Resolution Display 601
into the analytic process. The Tablet view in Jigsaw and other integrated sensemaking environments such as the Sandbox in the nSpace suite [36] are one approach. Another approach, suggested by the studies conducted by Robinson [18] and Andrews et al. [5] as well as our observations of the text editor group would be to integrate sense-making tools right into the document space. As we observed in this study, the users of the text editor already were arranging documents into structures based on their content. A logical continuation of this would be to integrate sensemaking tools and representations into this space directly, so that the sensemaking is done directly with the documents, allowing the user to maintain the context of the original source material.
We have also considered some frustrations expressed by the users while develop-ing design implications. One issue involved the presence of the taskbar on only one of the eight monitors, an issue recognized in the past (for example GroupBar [37]). It became difficult and inconvenient for the users to locate windows in the taskbar, es-pecially with over fifty windows opened simultaneously. For future visual analytics tools, we recommend implementing a feature that allows easier location of docu-ments. This could be done through a better search feature, such as flashing document windows to make locating them easier.
6 Conclusion
We have conducted a study which explores an arrangement for co-located collabora-tive sensemaking and applied it to intelligence analysis, an application that, to the best of our knowledge, has not yet been seen for this specific set-up and application. We extracted five common activities which the participants used in their overall strategy during collaborative sensemaking. While the activities were common with all groups, the execution of the activities varied based on the tool (Jigsaw or text editor). These activities reflected many of the steps in the Pirolli and Card sensemaking loop [21]. The participants also moved through the loop by using the roles of sensemaker and forager so that the two major areas of sensemaking could be performed synchro-nously. The groups that adopted these roles tended to score higher. Taking all of these findings into account, we have developed design implications for systems that use multiple input devices collaboratively on a large, vertical display.
The application of co-located collaboration to other visual analytics tools should be further investigated in order to develop a more accurate set of guidelines for designing co-located collaborative systems on large displays. We are also interested in studying the impacts of spatially arranged data on co-located collaborative analysis.
Acknowledgments. This research was supported by National Science Foundation grants NSF-IIS-0851774 and NSF-CCF-0937133.
602 K. Vogt et al.
References
1. Thomas, J., Cook, K.: Illuminating the Path: The Research and Development Agenda for Visual Analytics (2005)
2. Heer, J.: Design considerations for collaborative visual analytics. Information Visualiza-tion 7, 49–62 (2008)
3. Heuer, R.J., Pherson, R.H.: Structured Analytic Techniques for Intelligence Analysis. CQ Press, Washington, DC (2010)
4. Chin, G.: Exploring the analytical processes of intelligence analysts, p. 11 (2009) 5. Andrews, C., Endert, A., North, C.: Space to think: large high-resolution displays for sen-
semaking. In: Proceedings of the 28th International Conference on Human Factors in Computing Systems. ACM, Atlanta (2010)
6. Waltz, E.: The Knowledge-Based Intelligence Organization. In: Knowledge Management in the Intelligence Enterprise. Artech House, Boston (2003)
7. Stasko, J.: Jigsaw: supporting investigative analysis through interactive visualization. In-formation Visualization 7, 118–132 (2008)
8. Gutwin, C., Greenberg, S.: Design for individuals, design for groups: tradeoffs between power and workspace awareness. In: Proceedings of the 1998 ACM Conference on Com-puter Supported Cooperative Work. ACM, Seattle (1998)
9. Stefik, M., Foster, G., Bobrow, D.G., Kahn, K., Lanning, S., Suchman, L.: Beyond the chalkboard: computer support for collaboration and problem solving in meetings. Commu-nications of the ACM 30, 32–47 (1987)
10. Stewart, J.E.: Single display groupware. In: CHI 1997 Extended Abstracts On Human Fac-tors In Computing Systems: Looking to The Future, pp. 71–72. ACM, Atlanta (1997)
11. Elrod, S., Bruce, R., Gold, R., Goldberg, D., Halasz, F., Janssen, W., Lee, D., McCall, K., Pederson, E., Pier, K., Tang, J., Welch, B.: Liveboard: a large interactive display support-ing group meetings, presentations, and remote collaboration. In: Proceedings of the SIGCHI Conference on Human Factors in Computing Systems, pp. 599–607. ACM, Mon-terey (1992)
12. Pedersen, E.R., McCall, K., Moran, T.P., Halasz, F.G.: Tivoli: an electronic whiteboard for informal workgroup meetings. In: Proceedings of the INTERACT 1993 and CHI 1993 Conference on Human Factors in Computing Systems, pp. 391–398. ACM, Amsterdam (1993)
13. Rekimoto, J.: A multiple device approach for supporting whiteboard-based interactions. In: Proceedings of the SIGCHI Conference on Human Factors in Computing Systems, pp. 344–351. ACM Press/Addison-Wesley Publishing Co., Los Angeles, California (1998)
14. Wallace, J., Scott, S., Stutz, T., Enns, T., Inkpen, K.: Investigating teamwork and taskwork in single- and multi-display groupware systems. Personal and Ubiquitous Computing 13, 569–581 (2009)
15. Stewart, J., Raybourn, E.M., Bederson, B., Druin, A.: When two hands are better than one: enhancing collaboration using single display groupware. In: CHI 1998 Conference Sum-mary on Human Factors in Computing Systems, pp. 287–288. ACM, Los Angeles (1998)
16. Stewart, J., Bederson, B.B., Druin, A.: Single display groupware: a model for co-present collaboration. In: Proceedings of the SIGCHI Conference on Human Factors in Computing Systems: the CHI is the Limit, pp. 286–293. ACM, Pittsburgh (1999)
Co-located Collaborative Sensemaking on a Large High-Resolution Display 603
17. Birnholtz, J.P., Grossman, T., Mak, C., Balakrishnan, R.: An exploratory study of input configuration and group process in a negotiation task using a large display. In: Proceedings of the SIGCHI Conference on Human Factors in Computing Systems. ACM, San Jose (2007)
18. Robinson, A.: Collaborative Synthesis of Visual Analytic Results. IEEE Visual Analytics Science and Technology, 67–74 (2008)
19. Rogers, Y., Lim, Y.-k., Hazlewood, W.R., Marshall, P.: Equal Opportunities: Do Share-able Interfaces Promote More Group Participation Than Single User Displays? Human–Computer Interaction 24, 79–116 (2009)
20. Green, T.M., Ribarsky, W., Fisher, B.: Building and applying a human cognition model for visual analytics. Information Visualization 8, 1–13 (2009)
21. Pirolli, P., Card, S.: The Sensemaking Process and Leverage Points for Analyst Technol-ogy as Identified Through Cognitive Task Analysis. In: International Conference on Intel-ligence Analysis (2005)
22. Plaisant, C., Grinstein, G., Scholtz, J., Whiting, M., O’Connell, T., Laskowski, S., Chien, L., Tat, A., Wright, W., Gorg, C., Liu, Z., Parekh, N., Singhal, K., Stasko, J.: Evaluating Visual Analytics at the 2007 VAST Symposium Contest. In: Computer Graphics and Ap-plications, vol. 28, pp. 12–21. IEEE, Los Alamitos (2008)
23. Paul, S.A., Reddy, M.C.: Understanding together: sensemaking in collaborative informa-tion seeking. In: Proceedings of the 2010 ACM Conference on Computer Supported Coop-erative Work, pp. 321–330. ACM, Savannah (2010)
24. Paul, S.A., Morris, M.R.: CoSense: enhancing sensemaking for collaborative web search. In: Proceedings of the 27th International Conference on Human Factors in Computing Sys-tems, pp. 1771–1780. ACM, Boston (2009)
25. Morris, M.R., Lombardo, J., Wigdor, D.: WeSearch: supporting collaborative search and sensemaking on a tabletop display. In: Proceedings of the 2010 ACM Conference on Computer Supported Cooperative Work, pp. 401–410. ACM, Savannah (2010)
26. Pioch, N.J., Everett, J.O.: POLESTAR: collaborative knowledge management and sense-making tools for intelligence analysts. In: Proceedings of the 15th ACM International Con-ference on Information and Knowledge Management, pp. 513–521. ACM, Arlington (2006)
27. Tobiasz, M., Isenberg, P., Carpendale, S.: Lark: Coordinating Co-located Collaboration with Information Visualization. IEEE Transactions on Visualization and Computer Graph-ics 15, 1065–1072 (2009)
28. Isenberg, P., Fisher, D.: Collaborative Brushing and Linking for Co-located Visual Ana-lytics of Document Collections. Computer Graphics Forum 28, 1031–1038 (2009)
29. Isenberg, P., Fisher, D., Morris, M.R., Inkpen, K., Czerwinski, M.: An exploratory study of co-located collaborative visual analytics around a tabletop display. In: 2010 IEEE Sym-posium on Visual Analytics Science and Technology, VAST, pp. 179–186 (2010)
30. Ball, R., North, C., Bowman, D.A.: Move to improve: promoting physical navigation to increase user performance with large displays. In: Proceedings of the SIGCHI Conference on Human Factors in Computing Systems, pp. 191–200. ACM, San Jose (2007)
31. Wallace, G., Li, K.: Virtually shared displays and user input devices. In: 2007 Proceedings of the USENIX Annual Technical Conference, pp. 1–6. USENIX Association, Santa Clara (2007)
32. http://www.abisource.com/

604 K. Vogt et al.
33. Kang, Y.-a., Gorg, C., Stasko, J.: Evaluating visual analytics systems for investigative analysis: Deriving design principles from a case study. In: IEEE Visual Analytics Science and Technology, Atlantic City, NJ, pp. 139–146 (2009)
34. http://www.lri.fr/~isenberg/wiki/pmwiki.php?n=MyUniversity.PeCoTo
35. Pickens, J.: Algorithmic mediation for collaborative exploratory search, p. 315 (2008) 36. Wright, W., Schroh, D., Proulx, P., Skaburskis, A., Cort, B.: The Sandbox for analysis:
concepts and methods. In: CHI 2006: Proceedings of the SIGCHI Conference on Human Factors in Computing Systems, pp. 801–810. ACM, New York (2006)
37. Patrick, G.S., Baudisch, P., Robertson, G., Czerwinski, M., Meyers, B., Robbins, D., An-drews, D.: GroupBar: The TaskBar Evolved. In: OZCHI, pp. 34–43 (2003)
![A Comparison of Two Display Models for Collaborative ... · display [6]. 3. PROPOSED DISPLAY MODELS FOR COLLABORATIVE SENSEMAKING We now describe the design of our prototype multi-display](https://img.pdfslide.net/doc/110x75/612330d882414036e70733bb/a-comparison-of-two-display-models-for-collaborative-display-6-3-proposed.jpg)


![Collaborative Visual Analysis - Stanford University · 2009-03-10 · Apply Visual Encoding Author Software Sensemaking. Design Considerations [VAST 07, IVS 08] Division, allocation,](https://img.pdfslide.net/doc/110x75/5f4b2aabf7c1ae482f356395/collaborative-visual-analysis-stanford-university-2009-03-10-apply-visual-encoding.jpg)