Embed Size (px)
Citation preview
1
Load and Resistance Factor Design Considering Design Robustness: R-LRFD
Hsein Juang, PhD, PE, F.ASCE
Glenn Professor
Glenn Department of Civil Engineering
Clemson University
2
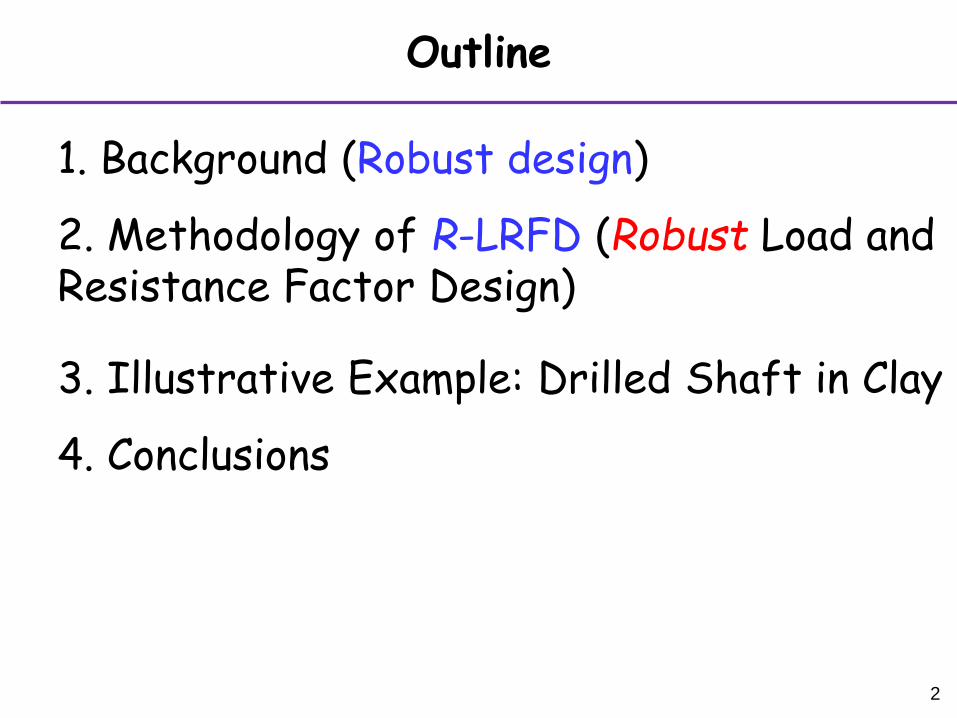
Outline
1. Background (Robust design)
2. Methodology of R-LRFD (Robust Load and Resistance Factor Design)
3. Illustrative Example: Drilled Shaft in Clay
4. Conclusions
3
Outline
1. Background
2. Methodology of R-LRFD
3. Illustrative Example: Drilled Shaft in Clay
4. Conclusions
4
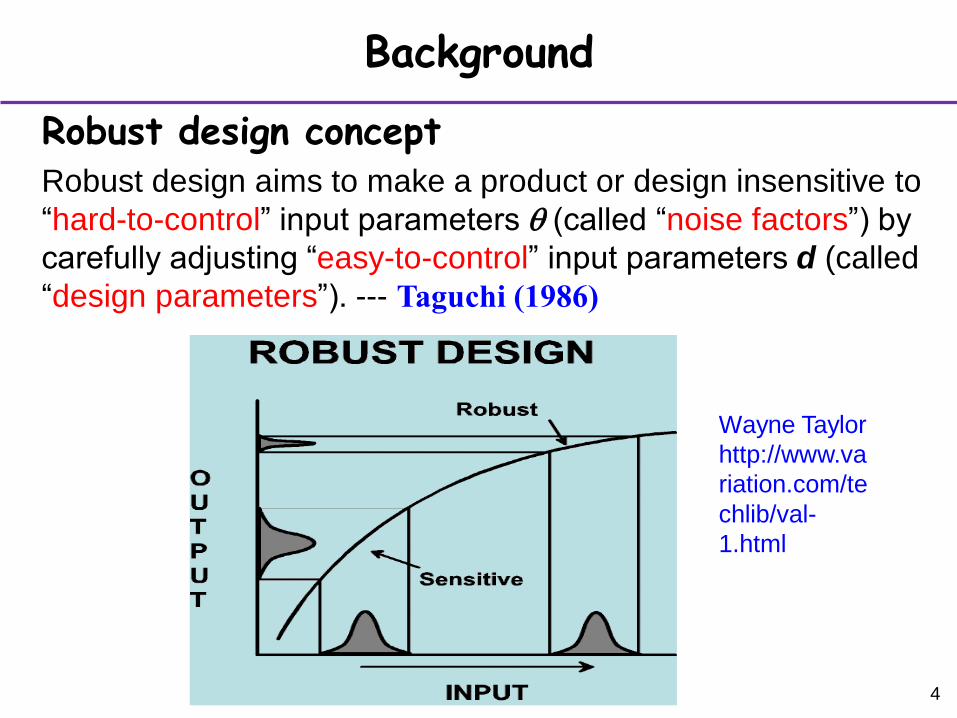
Background
Robust design aims to make a product or design insensitive to
“hard-to-control” input parameters q (called “noise factors”) by
carefully adjusting “easy-to-control” input parameters d (called
“design parameters”). --- Taguchi (1986)
Robust design concept
Wayne Taylor
http://www.va
riation.com/te
chlib/val-
1.html
5
Background
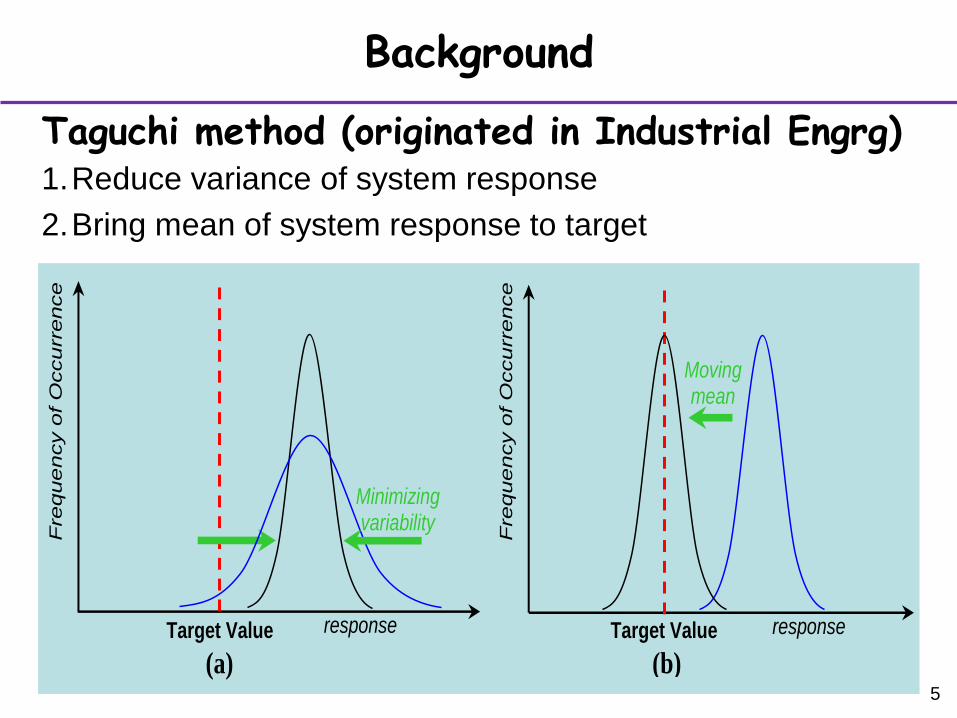
Taguchi method (originated in Industrial Engrg)
(a) (b)
Fre
que
ncy o
f O
ccurr
ence
response Target Value
Fre
que
ncy o
f O
ccurr
ence
response Target Value
Minimizing variability
Moving mean
1.Reduce variance of system response
2.Bring mean of system response to target

6
Background
Transforming Robust Design Concept
into a Novel Geotechnical Design Tool
(National Science Foundation
grant No. CMMI-1200117)
7
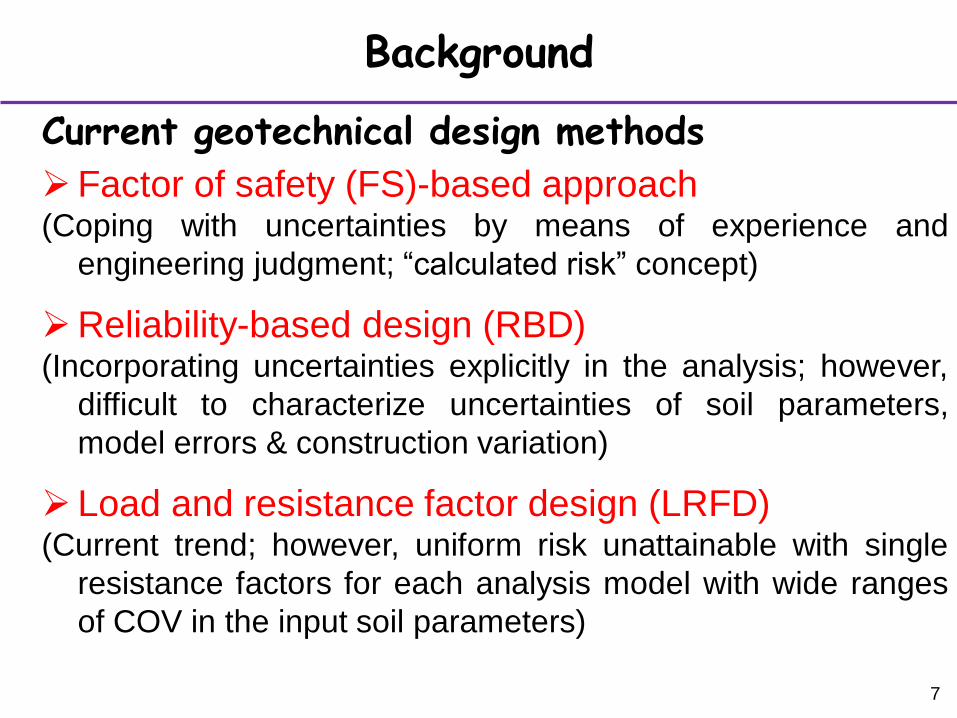
Background
Factor of safety (FS)-based approach (Coping with uncertainties by means of experience and
engineering judgment; “calculated risk” concept)
Reliability-based design (RBD) (Incorporating uncertainties explicitly in the analysis; however,
difficult to characterize uncertainties of soil parameters,
model errors & construction variation)
Load and resistance factor design (LRFD) (Current trend; however, uniform risk unattainable with single
resistance factors for each analysis model with wide ranges
of COV in the input soil parameters)
Current geotechnical design methods
8
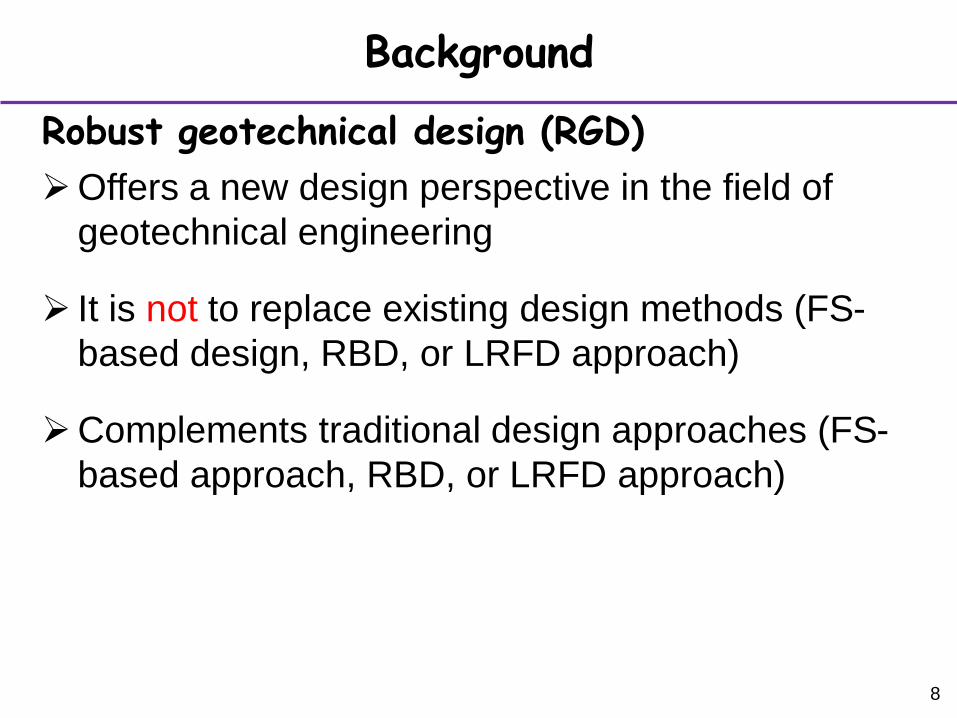
Background
Offers a new design perspective in the field of
geotechnical engineering
It is not to replace existing design methods (FS-
based design, RBD, or LRFD approach)
Complements traditional design approaches (FS-
based approach, RBD, or LRFD approach)
Robust geotechnical design (RGD)
9
Outline
1. Background
2. Methodology of R-LRFD
3. Illustrative Example: Drilled Shaft in Clay
4. Conclusions
10
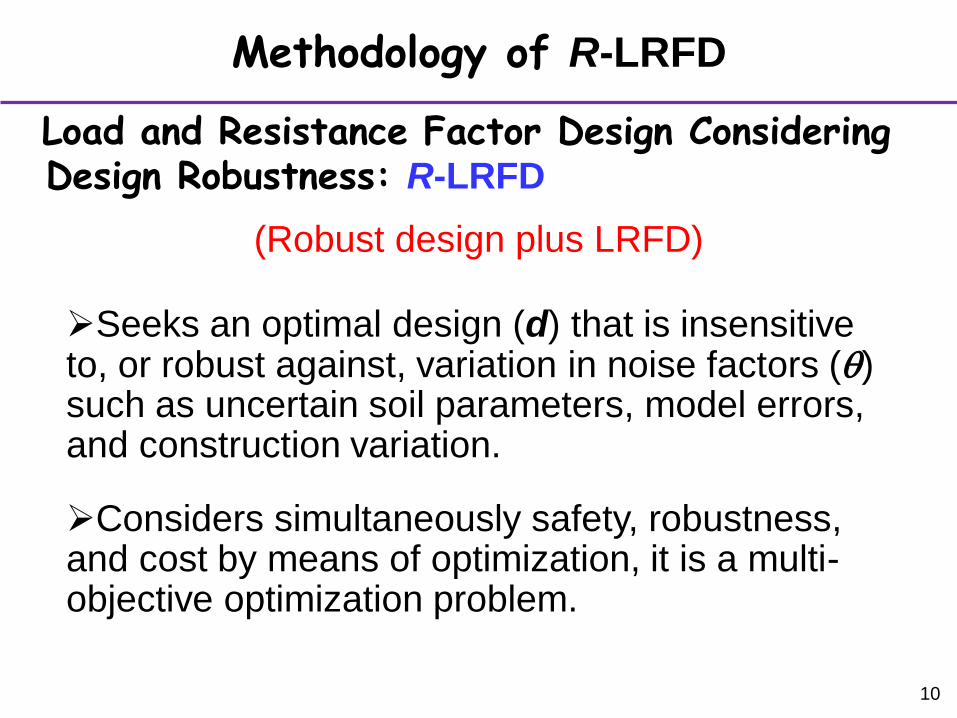
Methodology of R-LRFD
Seeks an optimal design (d) that is insensitive to, or robust against, variation in noise factors (q) such as uncertain soil parameters, model errors, and construction variation.
Considers simultaneously safety, robustness, and cost by means of optimization, it is a multi-objective optimization problem.
Load and Resistance Factor Design Considering Design Robustness: R-LRFD
(Robust design plus LRFD)
11
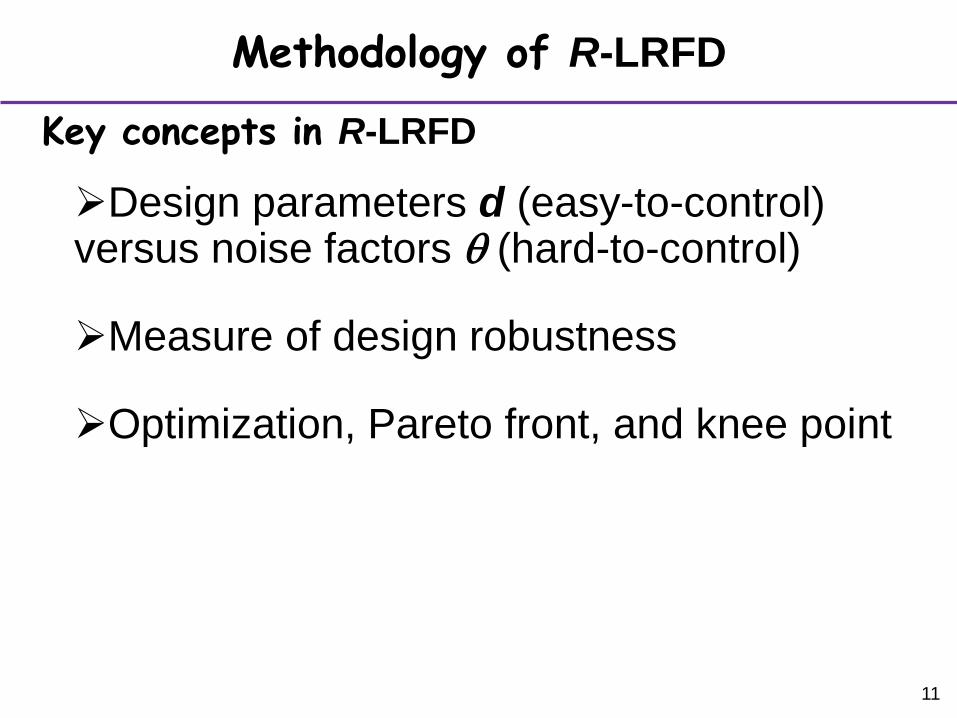
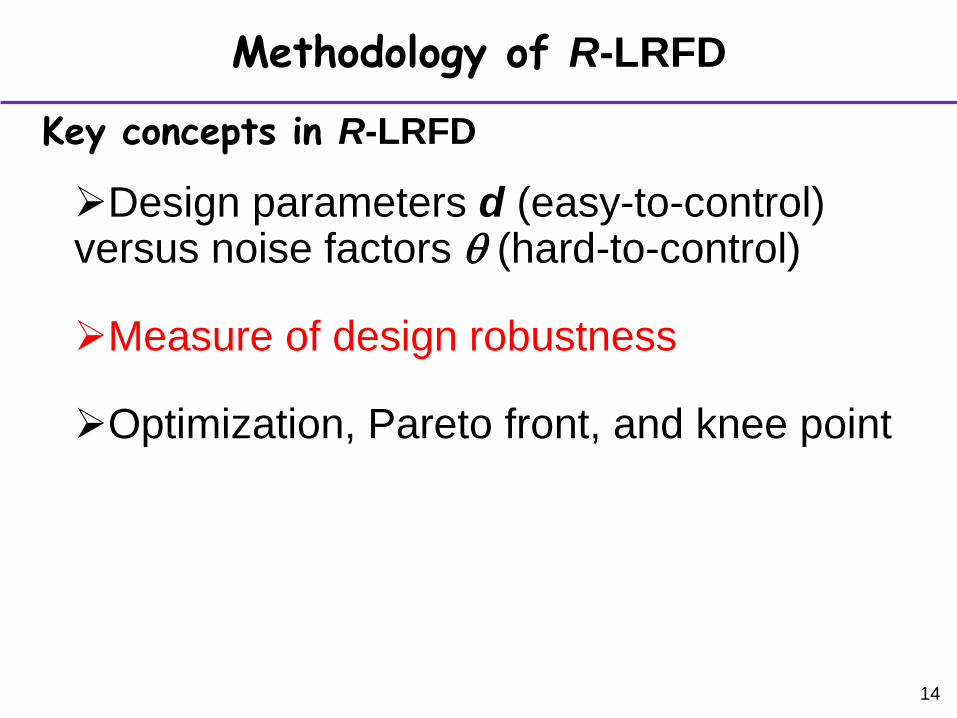
Methodology of R-LRFD
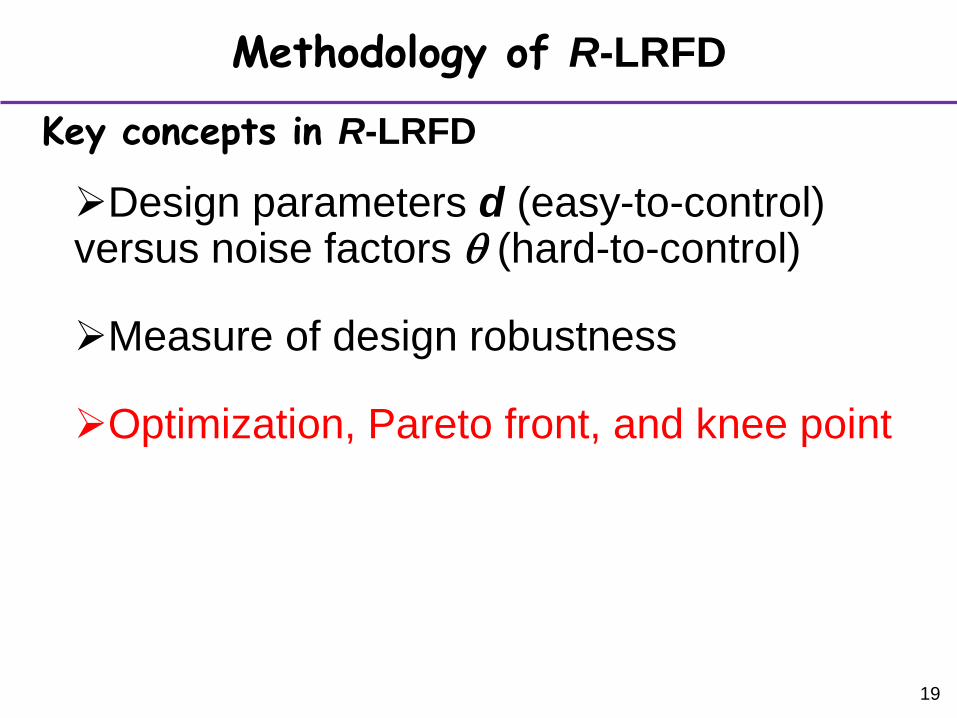
Key concepts in R-LRFD
Design parameters d (easy-to-control) versus noise factors q (hard-to-control)
Measure of design robustness
Optimization, Pareto front, and knee point
12
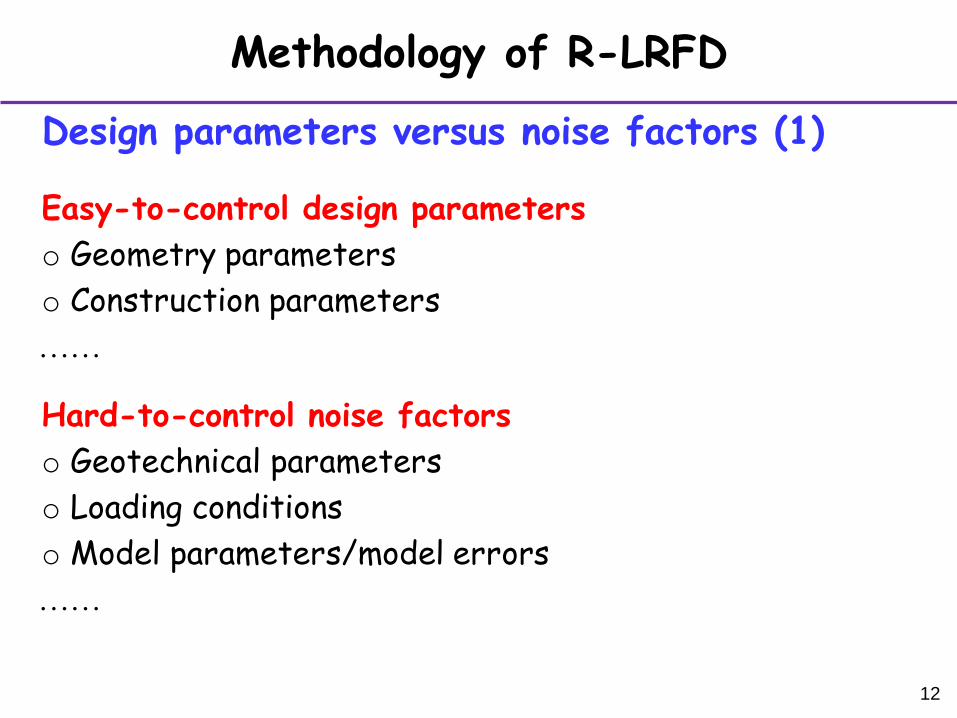
Methodology of R-LRFD
Design parameters versus noise factors (1)
Easy-to-control design parameters
o Geometry parameters
o Construction parameters
Hard-to-control noise factors
o Geotechnical parameters
o Loading conditions
o Model parameters/model errors
13
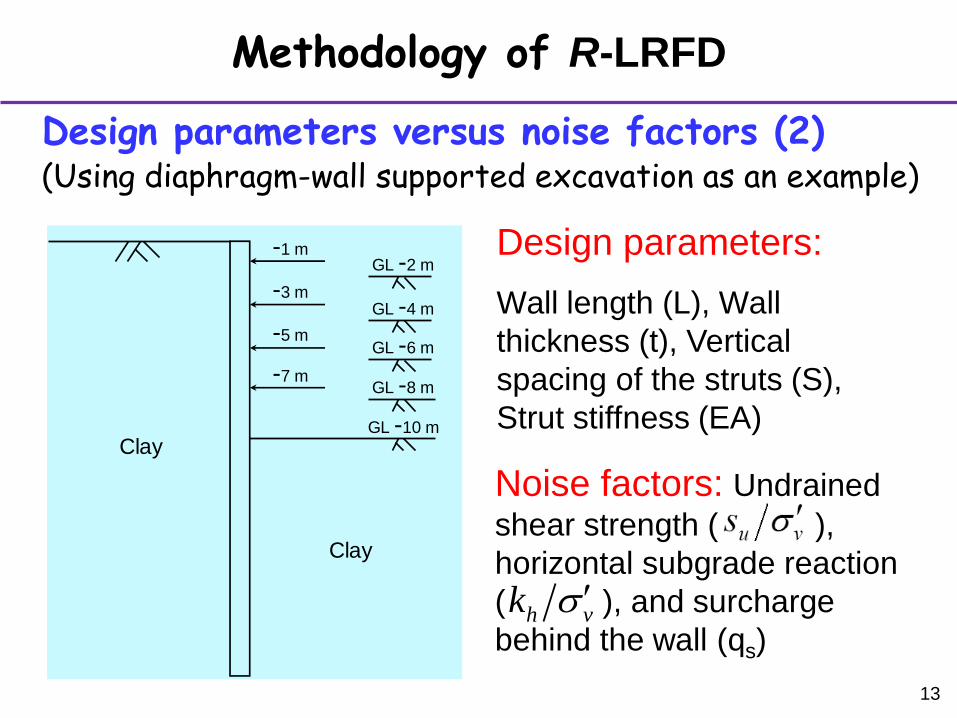
Methodology of R-LRFD
Design parameters versus noise factors (2)
Design parameters:
Wall length (L), Wall
thickness (t), Vertical
spacing of the struts (S),
Strut stiffness (EA)
GL -2 m-1 m
-7 mGL -8 m
GL -4 m-3 m
GL -6 m-5 m
GL -10 m
Clay
Clay
Noise factors: Undrained
shear strength ( ),
horizontal subgrade reaction
( ), and surcharge
behind the wall (qs)
(Using diaphragm-wall supported excavation as an example)
h vk
14
Methodology of R-LRFD
Key concepts in R-LRFD
Design parameters d (easy-to-control) versus noise factors q (hard-to-control)
Measure of design robustness
Optimization, Pareto front, and knee point
15
Methodology of R-LRFD
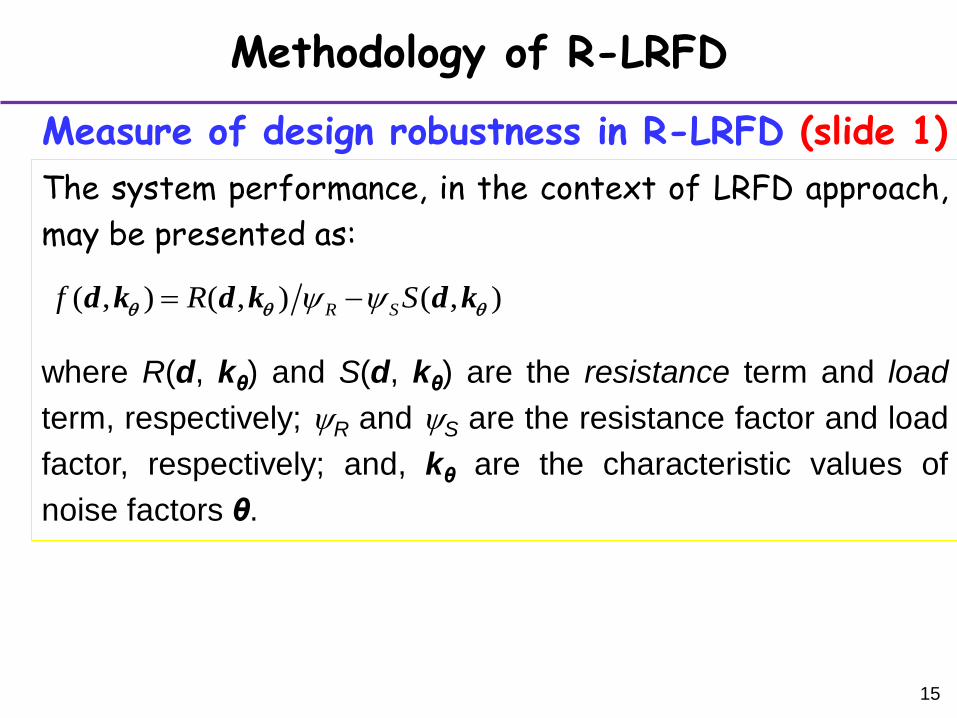
Measure of design robustness in R-LRFD (slide 1)
The system performance, in the context of LRFD approach,
may be presented as:
where R(d, kθ) and S(d, kθ) are the resistance term and load
term, respectively; R and S are the resistance factor and load
factor, respectively; and, kθ are the characteristic values of
noise factors θ.
( , ) ( , ) ( , )R Sf R S d k d k d kq q q
16
Methodology of R-LRFD
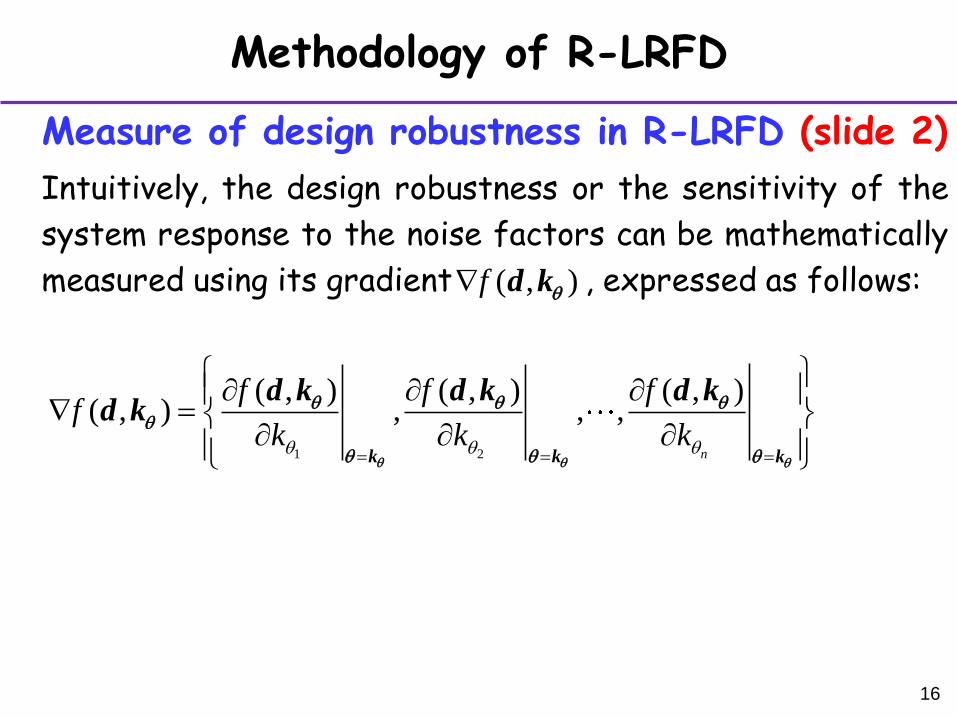
Measure of design robustness in R-LRFD (slide 2)
Intuitively, the design robustness or the sensitivity of the
system response to the noise factors can be mathematically
measured using its gradient , expressed as follows:
1 2
( , ) ( , ) ( , )( , ) , , ,
n
f f ff
k k kq q q
k k k
d k d k d kd k
q q q
q q qq
q q q
( , )f d kq
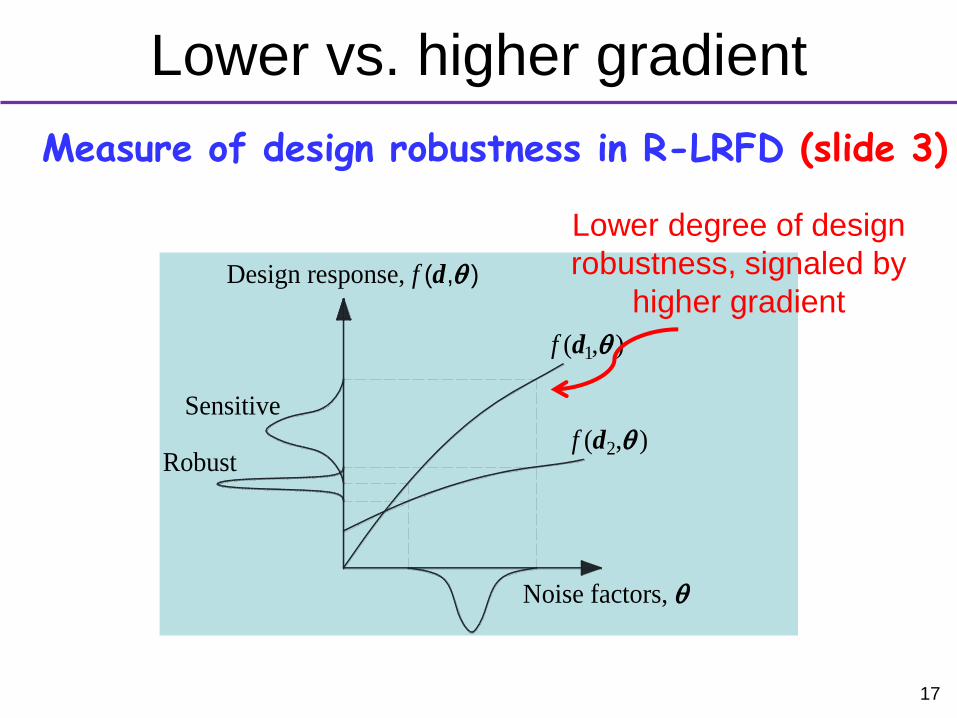
17
f (d1,q )
Sensitive
Design response, f (d,q )
Noise factors, q
f (d2,q )Robust
Lower vs. higher gradient
Measure of design robustness in R-LRFD (slide 3)
Lower degree of design
robustness, signaled by
higher gradient
18
Methodology of R-LRFD
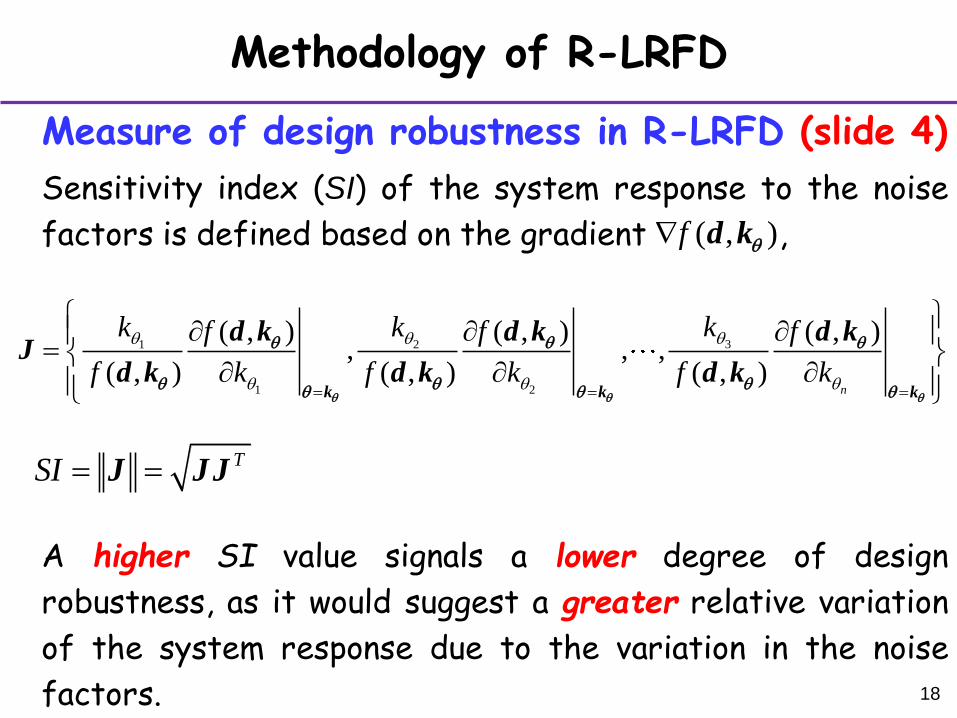
Measure of design robustness in R-LRFD (slide 4)
Sensitivity index (SI) of the system response to the noise
factors is defined based on the gradient ,
A higher SI value signals a lower degree of design
robustness, as it would suggest a greater relative variation
of the system response due to the variation in the noise
factors.
31 2
1 2
( , ) ( , ) ( , ), , ,
( , ) ( , ) ( , )n
kk kf f f
f k f k f k
qq q
q q q
k k k
d k d k d kJ
d k d k d kq q q
q q q
q q qq q q
TSI J JJ
( , )f d kq
19
Methodology of R-LRFD
Key concepts in R-LRFD
Design parameters d (easy-to-control) versus noise factors q (hard-to-control)
Measure of design robustness
Optimization, Pareto front, and knee point
20
Methodology of R-LRFD
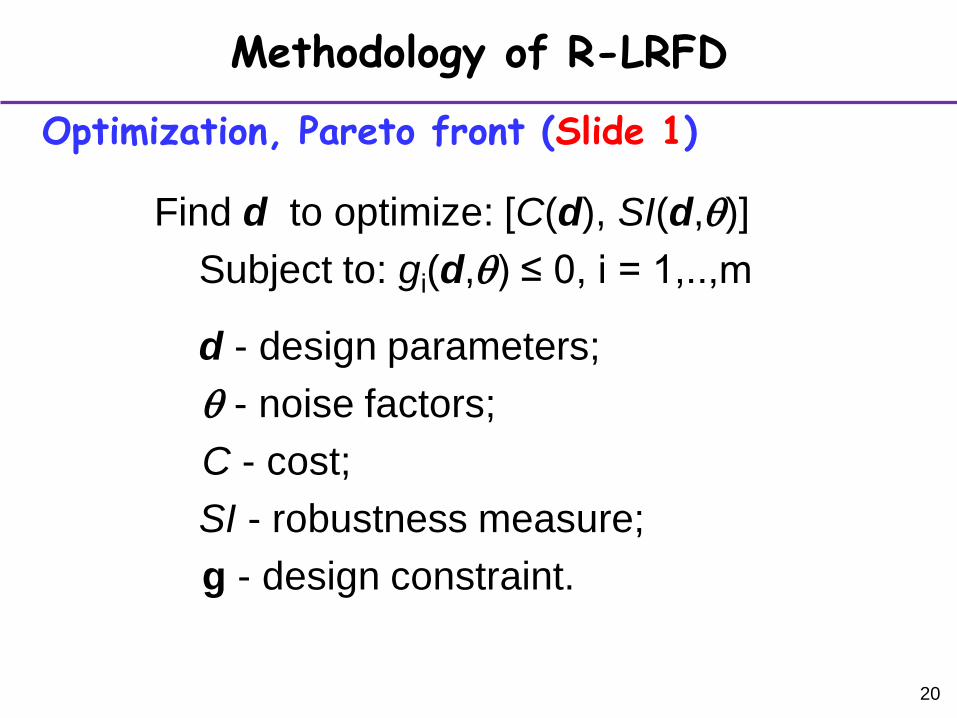
Optimization, Pareto front (Slide 1)
Find d to optimize: [C(d), SI(d,q)]
Subject to: gi(d,q) ≤ 0, i = 1,..,m
d - design parameters;
q - noise factors;
C - cost;
SI - robustness measure;
g - design constraint.
21
Methodology of R-LRFD
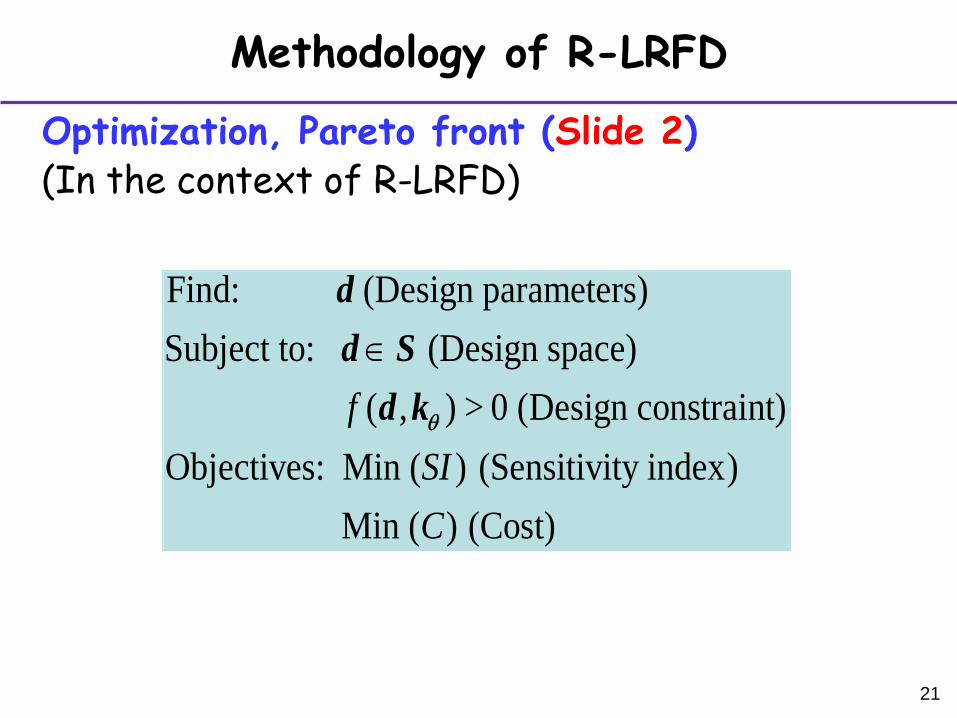
Optimization, Pareto front (Slide 2)
Find: (Design parameters)
Subject to: (Design space)
( , ) 0 ( )
Objectives: Min ( ) (Sensitivity index)
Min ( ) (Cos
Design constrai
t
t
)
n f >
SI
C
d
d S
d kq
(In the context of R-LRFD)
22
Methodology of R-LRFD
Optimization, Pareto front, and knee point
(Slide 3)
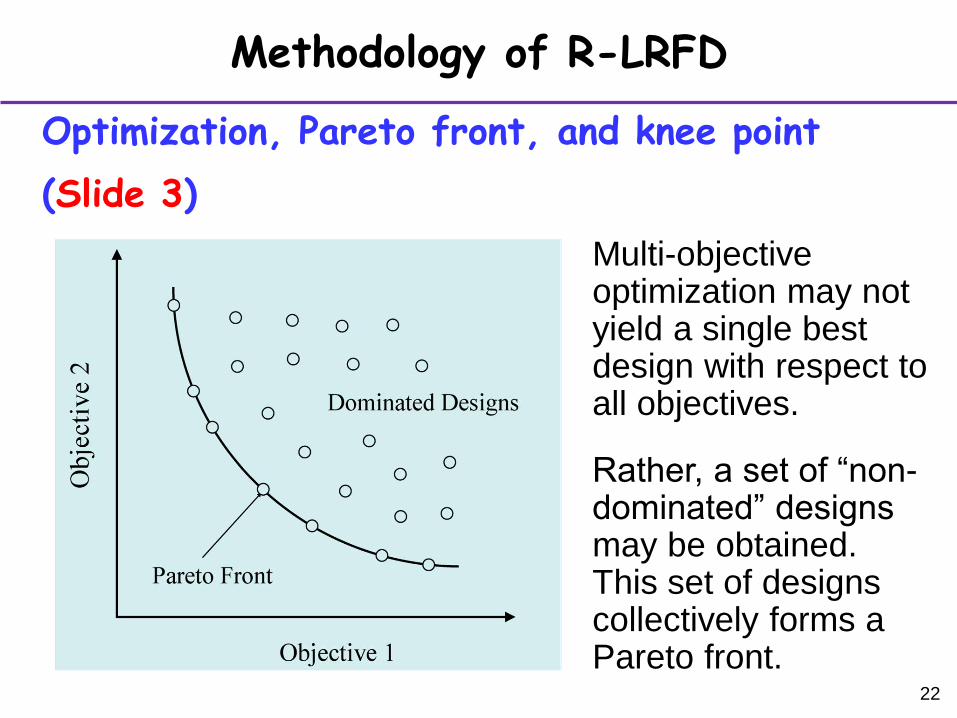
Multi-objective optimization may not yield a single best design with respect to all objectives.
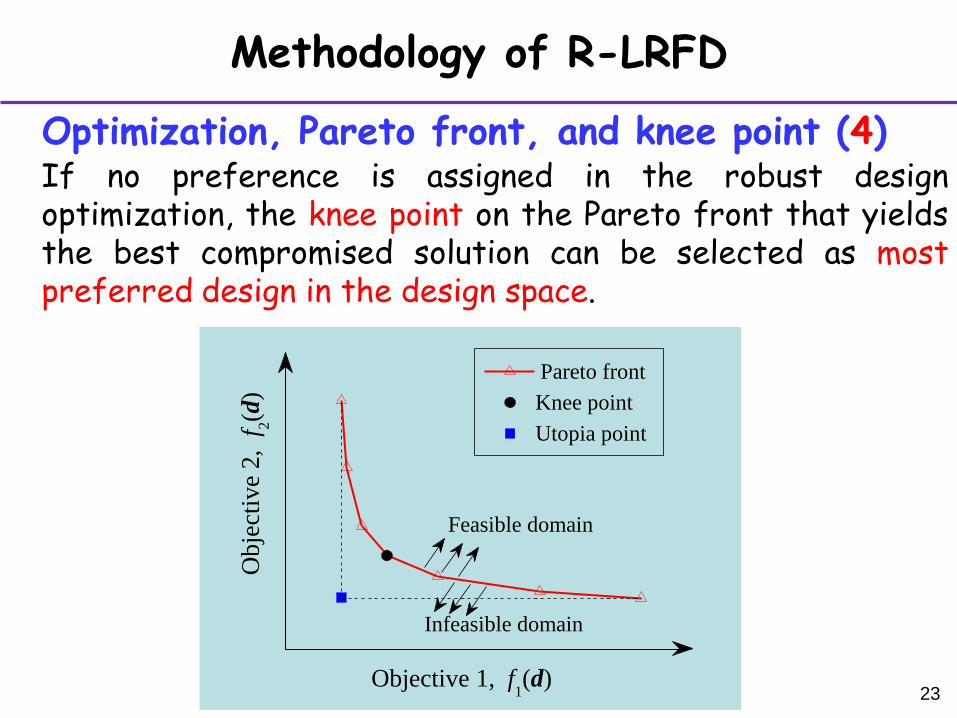
Rather, a set of “non-dominated” designs may be obtained. This set of designs collectively forms a Pareto front.
23
Methodology of R-LRFD
Optimization, Pareto front, and knee point (4) If no preference is assigned in the robust design optimization, the knee point on the Pareto front that yields the best compromised solution can be selected as most preferred design in the design space.
Infeasible domain
Pareto front
Ob
ject
ive
2,
f2(d
)
Objective 1, f1(d)
Feasible domain
Knee point
Utopia point
24
Outline
1. Background
2. Methodology of R-LRFD
3. Illustrative Example: Drilled Shaft in Clay
4. Conclusions
25
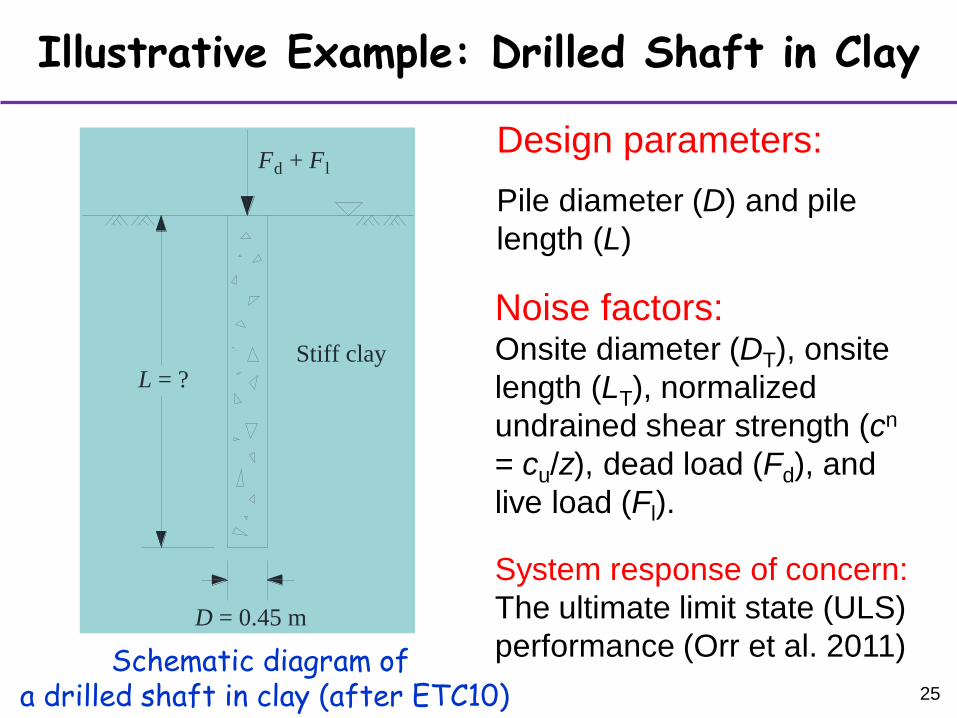
Illustrative Example: Drilled Shaft in Clay
Schematic diagram of a drilled shaft in clay (after ETC10)
Design parameters:
Pile diameter (D) and pile
length (L)
Noise factors: Onsite diameter (DT), onsite
length (LT), normalized
undrained shear strength (cn
= cu/z), dead load (Fd), and
live load (Fl).
System response of concern:
The ultimate limit state (ULS)
performance (Orr et al. 2011)
Fd + Fl
L = ?
D = 0.45 m
Stiff clay
26
Illustrative Example: Drilled Shaft in Clay
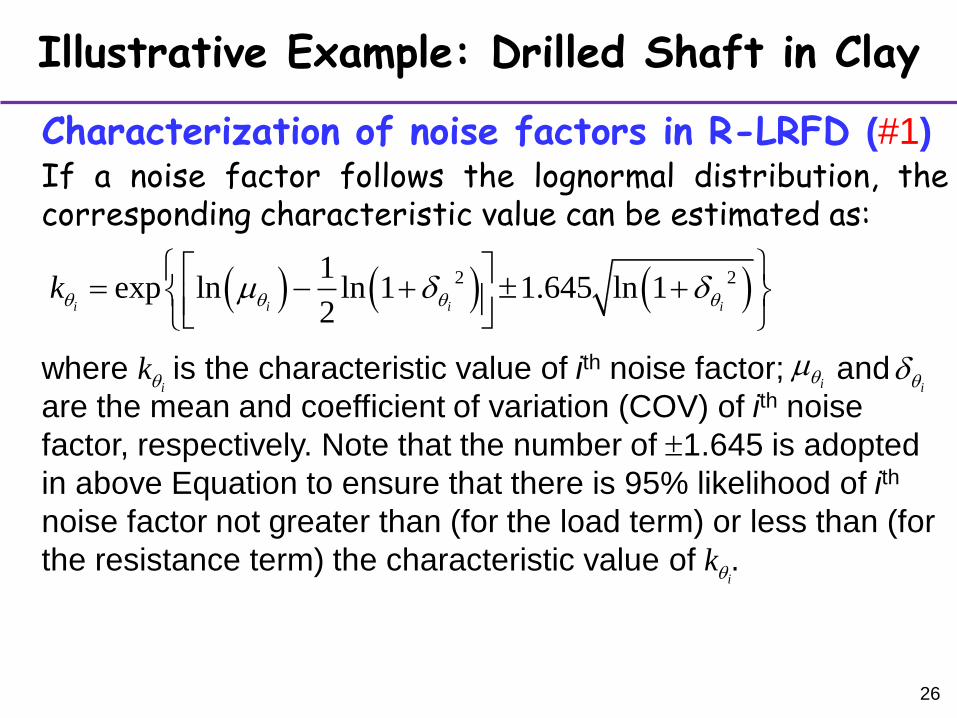
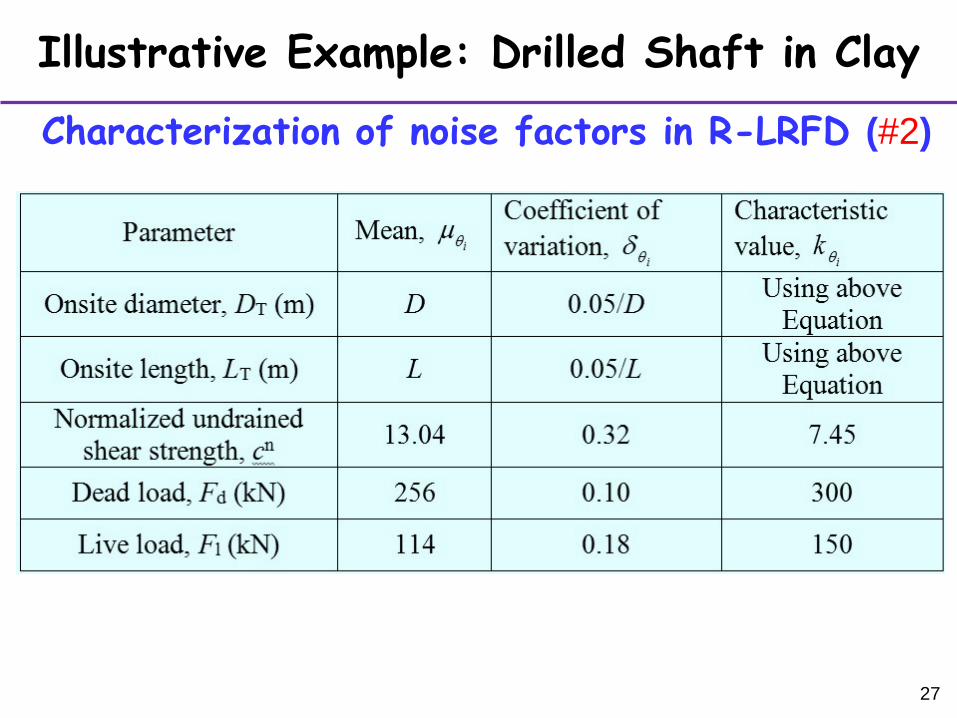
Characterization of noise factors in R-LRFD (#1) If a noise factor follows the lognormal distribution, the corresponding characteristic value can be estimated as: where is the characteristic value of ith noise factor; and
are the mean and coefficient of variation (COV) of ith noise
factor, respectively. Note that the number of 1.645 is adopted
in above Equation to ensure that there is 95% likelihood of ith
noise factor not greater than (for the load term) or less than (for
the resistance term) the characteristic value of .
2 21exp ln ln 1 1.645 ln 1
2i i i ikq q q q
ikq
ikq iq
iq
27
Illustrative Example: Drilled Shaft in Clay
Characterization of noise factors in R-LRFD (#2)
28
Illustrative Example: Drilled Shaft in Clay
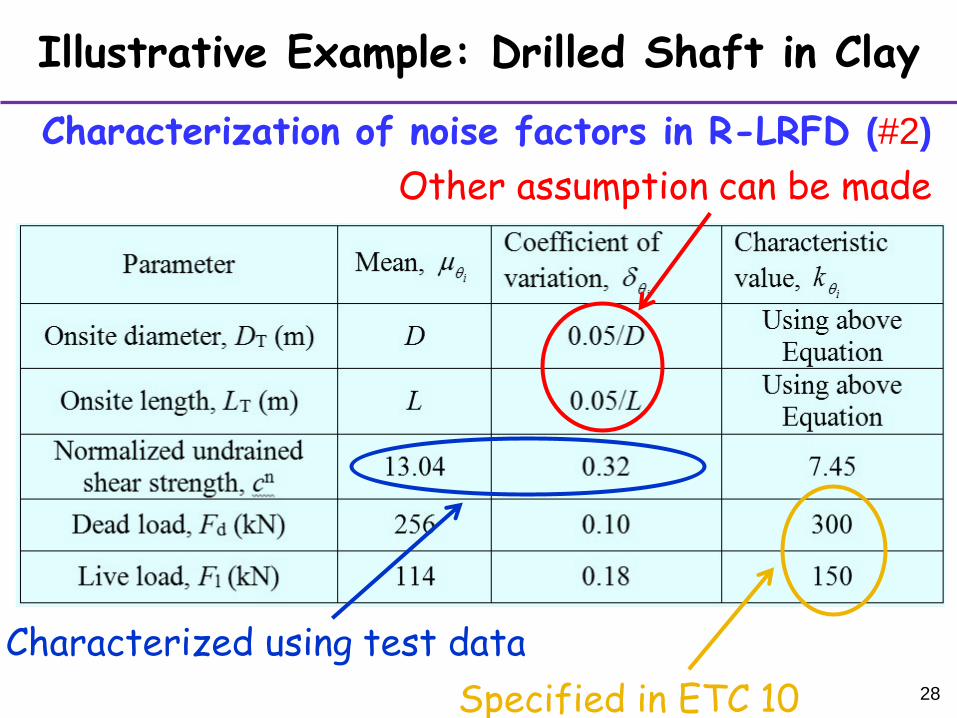
Characterization of noise factors in R-LRFD (#2)
Other assumption can be made
Characterized using test data
Specified in ETC 10
29
Illustrative Example: Drilled Shaft in Clay
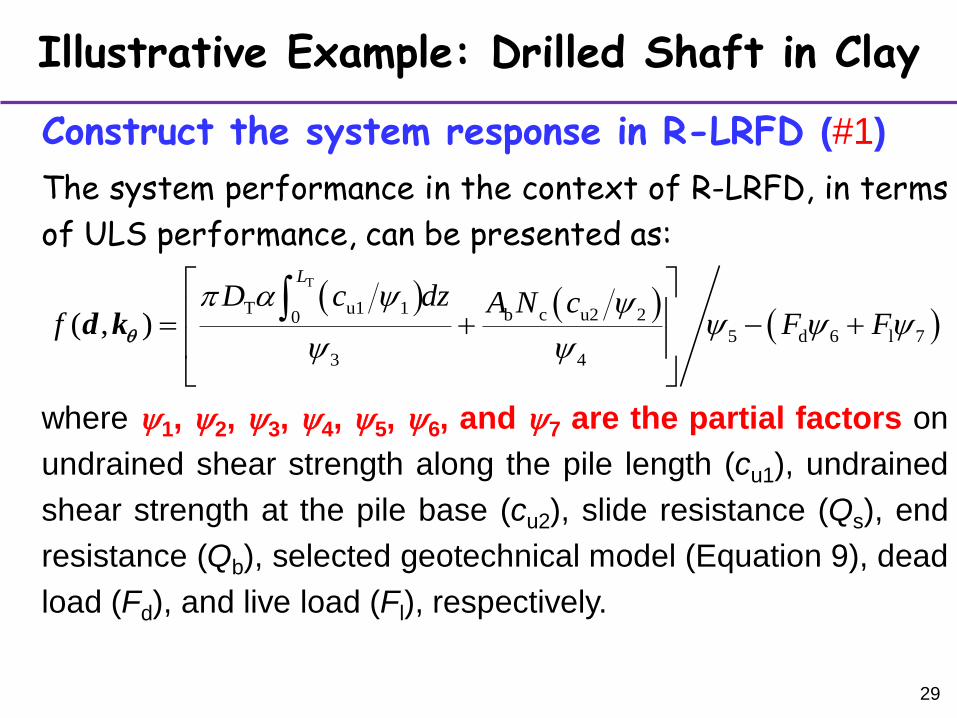
Construct the system response in R-LRFD (#1)
The system performance in the context of R-LRFD, in terms
of ULS performance, can be presented as:
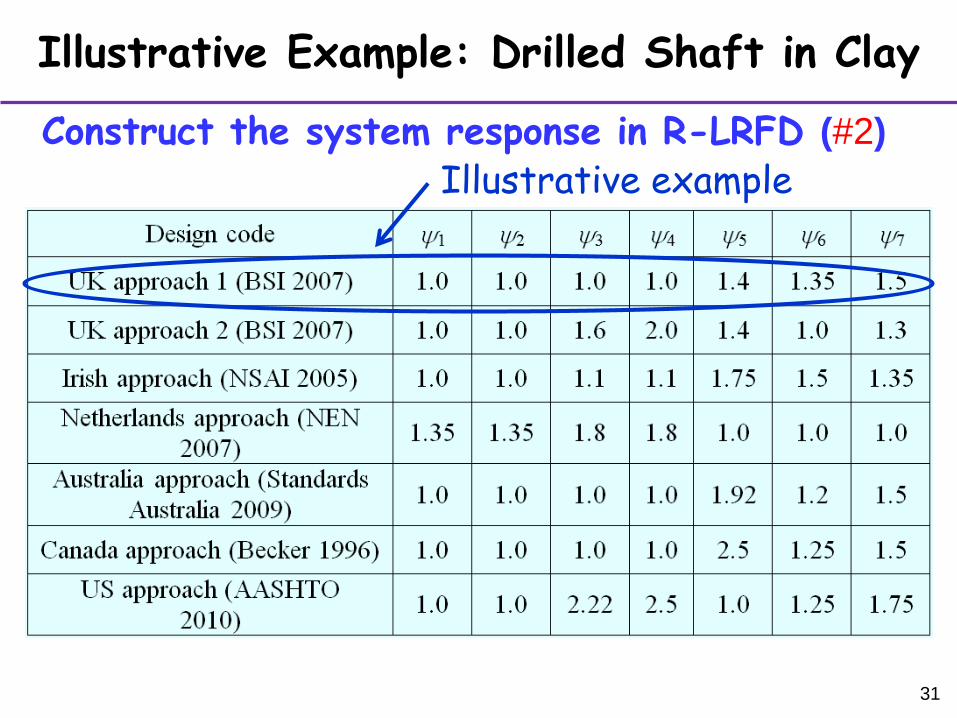
where 1, 2, 3, 4, 5, 6, and 7 are the partial factors on
undrained shear strength along the pile length (cu1), undrained
shear strength at the pile base (cu2), slide resistance (Qs), end
resistance (Qb), selected geotechnical model (Equation 9), dead
load (Fd), and live load (Fl), respectively.
T
T u1 1 b c u2 205 d 6 l 7
3 4
( , )
L
D c dz A N cf F F
d kq
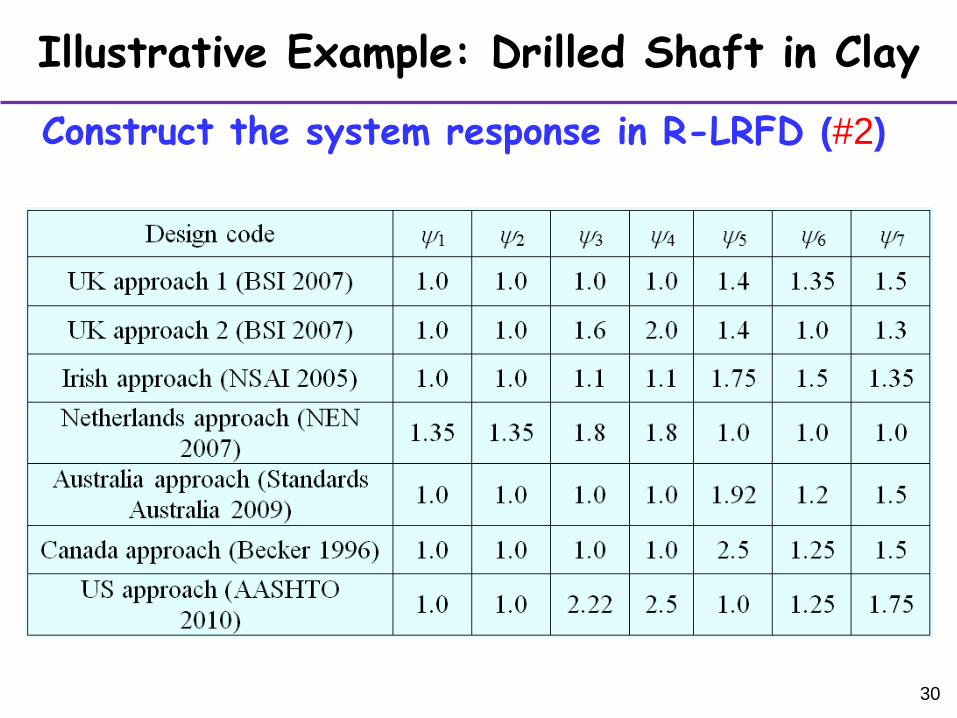
30
Illustrative Example: Drilled Shaft in Clay
Construct the system response in R-LRFD (#2)
31
Illustrative Example: Drilled Shaft in Clay
Construct the system response in R-LRFD (#2)
Illustrative example
32
Illustrative Example: Drilled Shaft in Clay
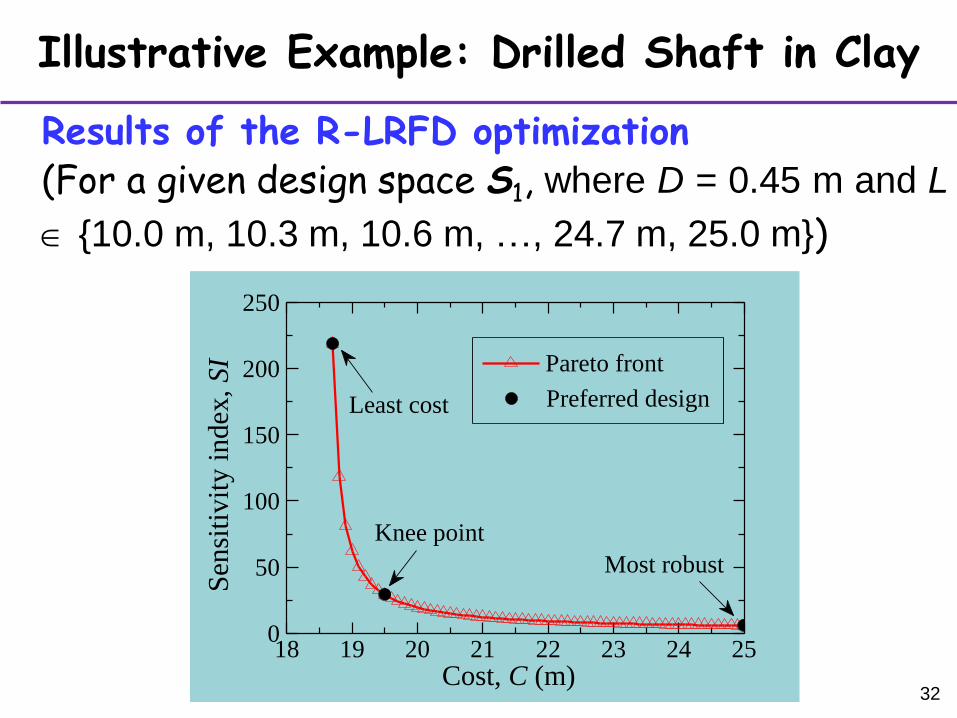
Results of the R-LRFD optimization
18 19 20 21 22 23 24 250
50
100
150
200
250
Sen
siti
vit
y i
nd
ex,
SI
Cost, C (m)
Pareto front
Least cost Preferred design
Knee point
Most robust
(For a given design space S1, where D = 0.45 m and L
{10.0 m, 10.3 m, 10.6 m, …, 24.7 m, 25.0 m})

33
Illustrative Example: Drilled Shaft in Clay
The optimization results of R-LRFD
18 19 20 21 22 23 24 250
50
100
150
200
250
Sen
siti
vit
y i
nd
ex,
SI
Cost, C (m)
Pareto front
Least cost Preferred design
Knee point
Most robust
(For a given design space S1, where D = 0.45 m and L
{10.0 m, 10.3 m, 10.6 m, …, 24.7 m, 25.0 m})
, (kN)
34
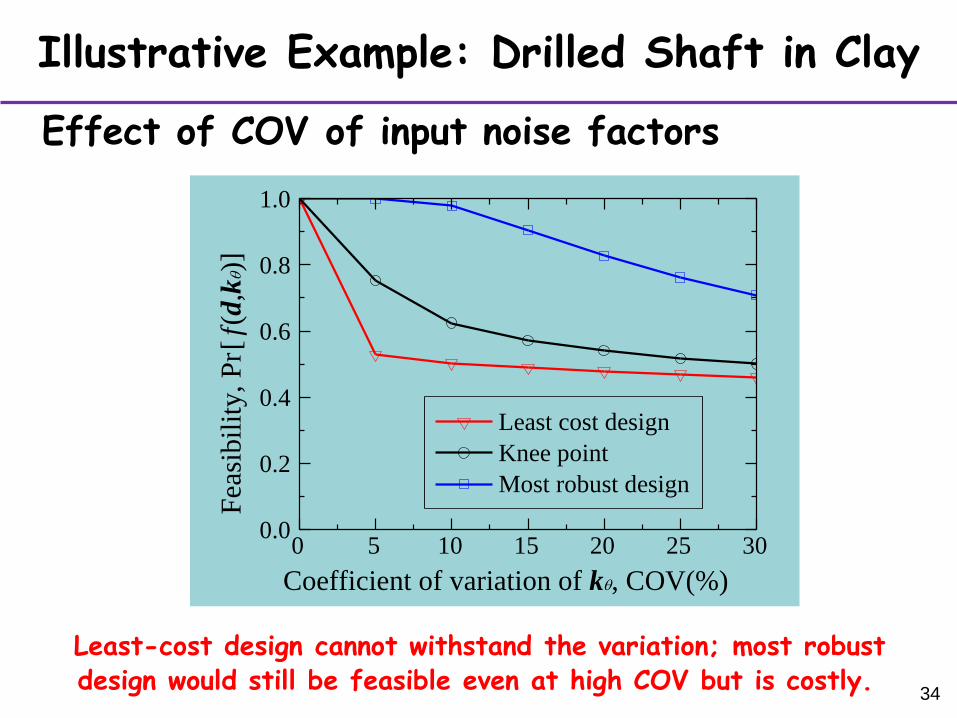
Illustrative Example: Drilled Shaft in Clay
Effect of COV of input noise factors
0 5 10 15 20 25 300.0
0.2
0.4
0.6
0.8
1.0
Fea
sib
ilit
y,
Pr [
f (
d,k
q)]
Coefficient of variation of kq, COV(%)
Least cost design
Knee point
Most robust design
Least-cost design cannot withstand the variation; most robust design would still be feasible even at high COV but is costly.
35
Illustrative Example: Drilled Shaft in Clay
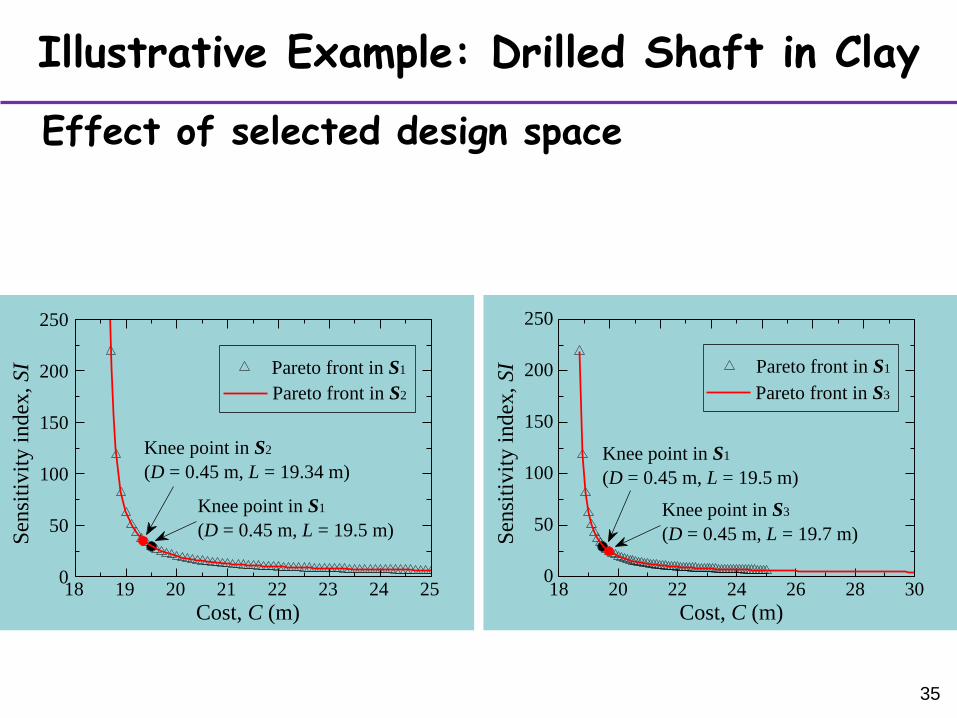
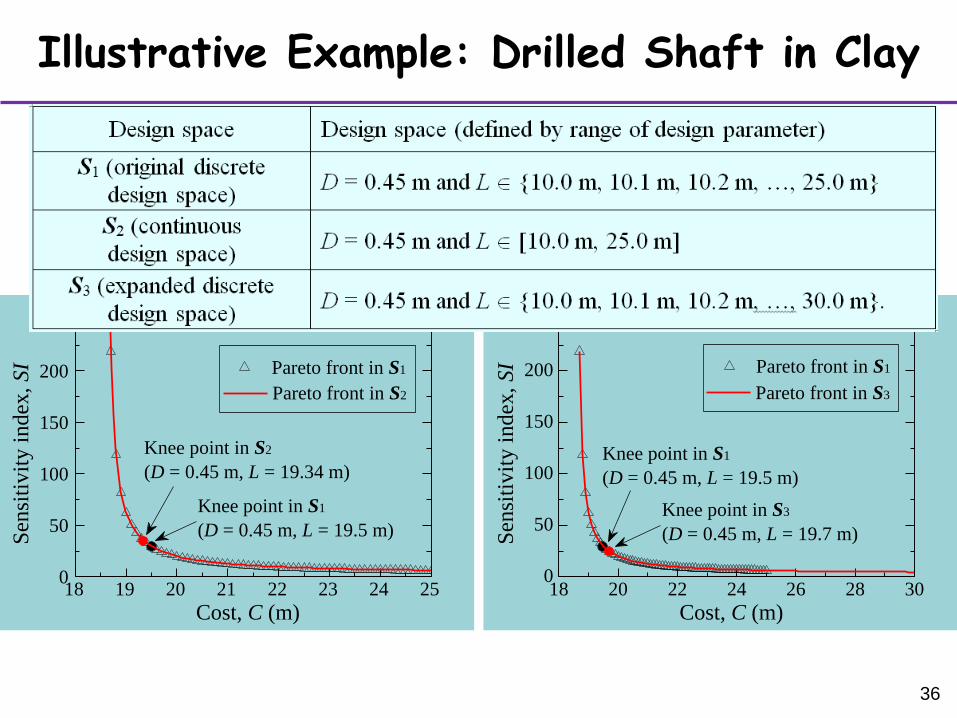
Effect of selected design space
18 19 20 21 22 23 24 250
50
100
150
200
250
Sen
siti
vit
y i
ndex
, SI
Cost, C (m)
Pareto front in S1
Knee point in S1
(D = 0.45 m, L = 19.5 m)
Knee point in S2
(D = 0.45 m, L = 19.34 m)
Pareto front in S2
18 20 22 24 26 28 300
50
100
150
200
250
Knee point in S1
(D = 0.45 m, L = 19.5 m)
Sen
siti
vit
y i
ndex
, SI
Cost, C (m)
Pareto front in S1
Pareto front in S3
Knee point in S3
(D = 0.45 m, L = 19.7 m)
36
Illustrative Example: Drilled Shaft in Clay
18 19 20 21 22 23 24 250
50
100
150
200
250
Sen
siti
vit
y i
ndex
, SI
Cost, C (m)
Pareto front in S1
Knee point in S1
(D = 0.45 m, L = 19.5 m)
Knee point in S2
(D = 0.45 m, L = 19.34 m)
Pareto front in S2
18 20 22 24 26 28 300
50
100
150
200
250
Knee point in S1
(D = 0.45 m, L = 19.5 m)
Sen
siti
vit
y i
ndex
, SI
Cost, C (m)
Pareto front in S1
Pareto front in S3
Knee point in S3
(D = 0.45 m, L = 19.7 m)
Effect of selected design space
37
Outline
1. Background
2. Methodology of R-LRFD
3. Illustrative Example: Drilled Shaft in Clay
4. Conclusions
38
Conclusions
R-LRFD, a new design paradigm, has been demonstrated as
an effective tool to obtain optimal designs that are robust
against variation in noise factors (e.g., uncertain soil parameters,
model errors, and construction variation).
R-LRFD consider safety, cost, and robustness simultaneously
and is shown as an effective tool.
Pareto front and knee point concepts can aid in making
informed decision in the design.
The proposed gradient-based robust design methodology
complements all existing design methods, including the FS-
based approach, RBD, or LRFD approach.
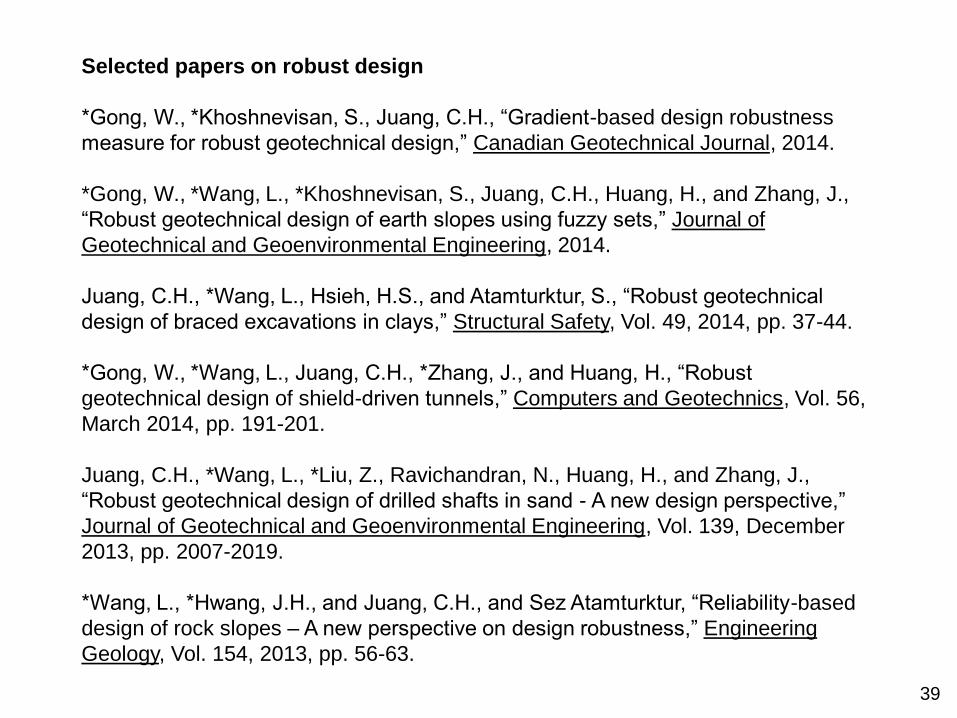
Selected papers on robust design
*Gong, W., *Khoshnevisan, S., Juang, C.H., “Gradient-based design robustness
measure for robust geotechnical design,” Canadian Geotechnical Journal, 2014.
*Gong, W., *Wang, L., *Khoshnevisan, S., Juang, C.H., Huang, H., and Zhang, J.,
“Robust geotechnical design of earth slopes using fuzzy sets,” Journal of
Geotechnical and Geoenvironmental Engineering, 2014.
Juang, C.H., *Wang, L., Hsieh, H.S., and Atamturktur, S., “Robust geotechnical
design of braced excavations in clays,” Structural Safety, Vol. 49, 2014, pp. 37-44.
*Gong, W., *Wang, L., Juang, C.H., *Zhang, J., and Huang, H., “Robust
geotechnical design of shield-driven tunnels,” Computers and Geotechnics, Vol. 56,
March 2014, pp. 191-201.
Juang, C.H., *Wang, L., *Liu, Z., Ravichandran, N., Huang, H., and Zhang, J.,
“Robust geotechnical design of drilled shafts in sand - A new design perspective,”
Journal of Geotechnical and Geoenvironmental Engineering, Vol. 139, December
2013, pp. 2007-2019.
*Wang, L., *Hwang, J.H., and Juang, C.H., and Sez Atamturktur, “Reliability-based
design of rock slopes – A new perspective on design robustness,” Engineering
Geology, Vol. 154, 2013, pp. 56-63.
39

40
Thank You!