Embed Size (px)
Citation preview
i
Load and Resistance Factor Design (LRFD) for Analysis/Design of Piles Axial Capacity
By
M. S. Rahman, Ph.D., P.E., Professor
M. A. Gabr, Ph.D., P.E., Professor
R. Z. Sarica, Graduate Assistant
M. S. Hossain, Graduate Assistant
Department of Civil, Construction and Environmental Engineering
North Carolina State University
In Cooperation with
The North Carolina Department of Transportation
Final Report
Raleigh, North Carolina
July 28, 2002
ii
Technical Report Documentation Page 1. Report No. FHWA/NC/2005-08
2. Government Accession No.
3. Recipient’s Catalog No.
4. Title and Subtitle Load and Resistance Factor Design (LRFD) for Analysis/Design of Piles Axial Capacity
5. Report Date July 28, 2002
6. Performing Organization Code
7. Author(s) M. S. Rahman, M. A. Gabr, R.Z. Sarcia, and M. S. Hossain
8. Performing Organization Report No.
9. Performing Organization Name and Address Department of Civil Engineering CB 7908, Mann Hall North Carolina State University Raleigh, NC 27695-7908
10. Work Unit No. (TRAIS)
11. Contract or Grant No.
12. Sponsoring Agency Name and Address
13. Type of Report and Period Covered Final Report July 2001 to June 2002
North Carolina Department of Transportation Research and Analysis Group One South Wilmington Street Raleigh, NC 27601
14. Sponsoring Agency Code 2002-14
15. Supplementary Notes
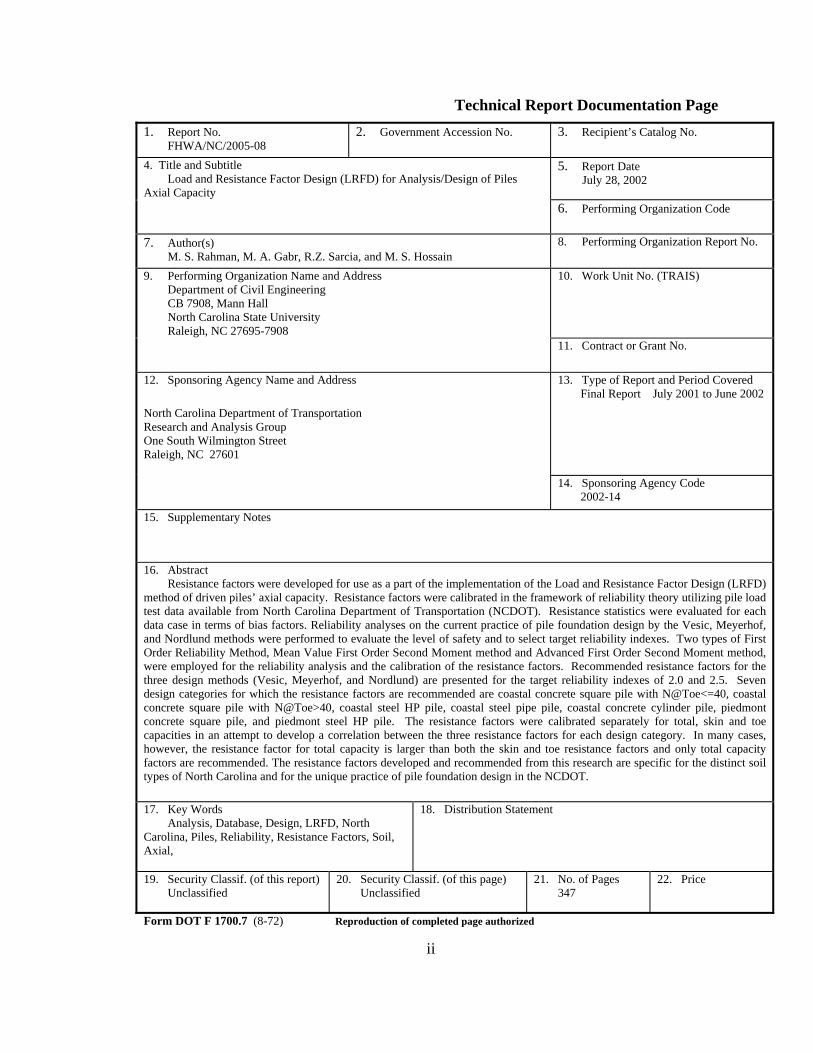
16. Abstract Resistance factors were developed for use as a part of the implementation of the Load and Resistance Factor Design (LRFD) method of driven piles’ axial capacity. Resistance factors were calibrated in the framework of reliability theory utilizing pile load test data available from North Carolina Department of Transportation (NCDOT). Resistance statistics were evaluated for each data case in terms of bias factors. Reliability analyses on the current practice of pile foundation design by the Vesic, Meyerhof, and Nordlund methods were performed to evaluate the level of safety and to select target reliability indexes. Two types of First Order Reliability Method, Mean Value First Order Second Moment method and Advanced First Order Second Moment method, were employed for the reliability analysis and the calibration of the resistance factors. Recommended resistance factors for the three design methods (Vesic, Meyerhof, and Nordlund) are presented for the target reliability indexes of 2.0 and 2.5. Seven design categories for which the resistance factors are recommended are coastal concrete square pile with N@Toe<=40, coastal concrete square pile with N@Toe>40, coastal steel HP pile, coastal steel pipe pile, coastal concrete cylinder pile, piedmont concrete square pile, and piedmont steel HP pile. The resistance factors were calibrated separately for total, skin and toe capacities in an attempt to develop a correlation between the three resistance factors for each design category. In many cases, however, the resistance factor for total capacity is larger than both the skin and toe resistance factors and only total capacity factors are recommended. The resistance factors developed and recommended from this research are specific for the distinct soil types of North Carolina and for the unique practice of pile foundation design in the NCDOT. 17. Key Words Analysis, Database, Design, LRFD, North Carolina, Piles, Reliability, Resistance Factors, Soil, Axial,
18. Distribution Statement
19. Security Classif. (of this report) Unclassified
20. Security Classif. (of this page) Unclassified
21. No. of Pages 347
22. Price
Form DOT F 1700.7 (8-72) Reproduction of completed page authorized
iii
Disclaimer: The contents of this report reflect the views of the author(s) and not necessarily the views of the University. The author(s) are responsible for the facts and the accuracy of the data presented herein. The contents do not necessarily reflect the official views or policies of either the North Carolina Department of Transportation or the Federal Highway Administration at the time of publication. This report does not constitute a standard, specification, or regulation.

iv
ACKNOWLEDGEMENTS
This research project entitled “Load and Resistance Factor Design (LRFD) for
Analysis/Design of Piles Axial Capacity” was sponsored by North Carolina Department
of Transportation (NCDOT). The authors would like to thank Mr. Rodger Rochelle and
Dr. Moy Biswas of NCDOT research and development for their support of this project.
Special thanks go to Mr. K. J. Kim and Mr. Mohammed Mulla for their valuable input to
the project and for being a vital part of the research team. Mr. Paul Simon was the
FHWA representative on the project. The opinions, findings and conclusions expressed
are those of the authors and do not necessarily represent those of the NCDOT.
v
Executive Summary
Resistance factors were developed in the framework of reliability theory for axial
capacity of driven piles in two North Carolina geologic provinces. The development of
resistance factors utilized 140 Pile Driving Analyzer (PDA) data and 35 static load test
data available from the North Carolina Department of Transportation. Pile records were
compiled and grouped into different design categories encopmassing four pile types and
two geologic regions. Resistance statistics were evaluated for each category in terms of
bias factors. Bayesian updating was employed in an attempt to improve the statistics of
the resistance bias factors, given the limited number of pile load test data. Load statistics
presented in the current AASHTO LRFD bridge design specifications were used in the
reliability analysis and the calibration of the resistance factors.
Resistance factor calibration was performed for the three methods of static pile
capacity analysis commonly used in the NCDOT: Vesic, Nordlund, and Meyerhof
methods. Two types of First Order Reliability Methods, Mean Value First Order Second
Moment method and Advanced First Order Second Moment method, were employed for
the reliability analysis and the calibration of the resistance factors. Recommended
resistance factors are presented for the three methods of static pile capacity analysis and
for seven different design categories of pile type and region. These are coastal concrete
square pile with N@Toe<=40, coastal concrete square pile with N@Toe>40, coastal steel
HP pile, coastal steel pipe pile, coastal concrete cylinder pile, piedmont concrete square
pile, and piedmont steel HP pile.
vi
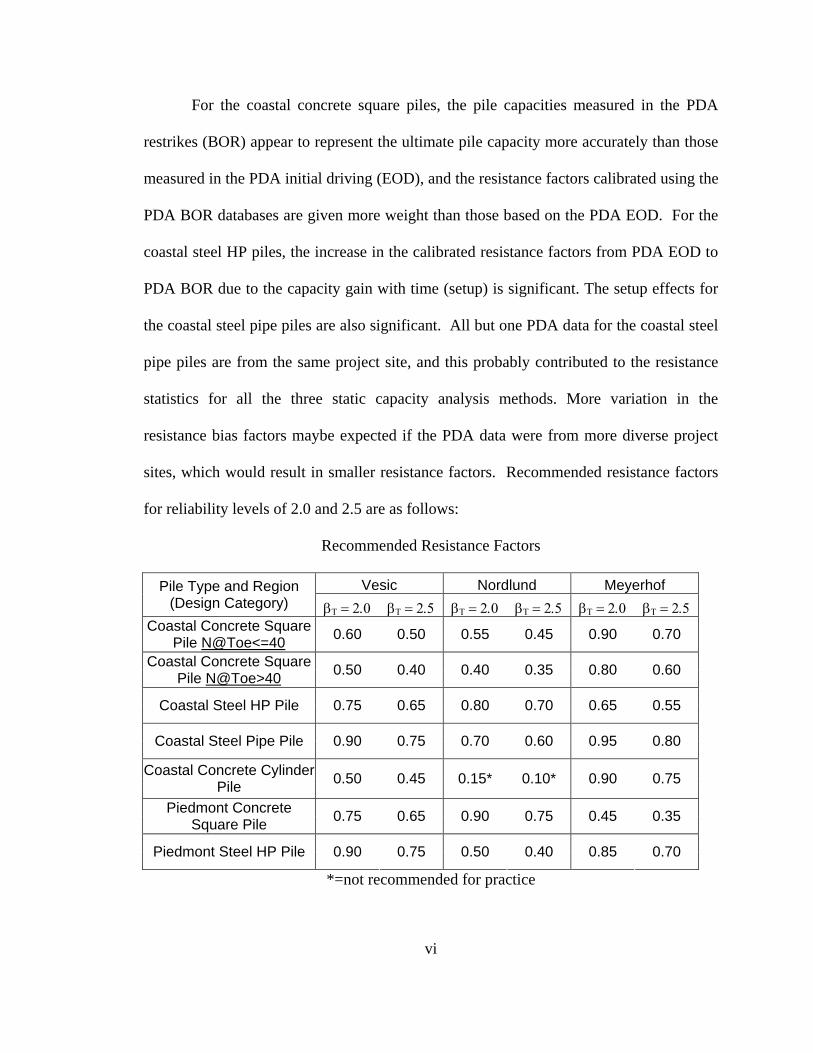
For the coastal concrete square piles, the pile capacities measured in the PDA
restrikes (BOR) appear to represent the ultimate pile capacity more accurately than those
measured in the PDA initial driving (EOD), and the resistance factors calibrated using the
PDA BOR databases are given more weight than those based on the PDA EOD. For the
coastal steel HP piles, the increase in the calibrated resistance factors from PDA EOD to
PDA BOR due to the capacity gain with time (setup) is significant. The setup effects for
the coastal steel pipe piles are also significant. All but one PDA data for the coastal steel
pipe piles are from the same project site, and this probably contributed to the resistance
statistics for all the three static capacity analysis methods. More variation in the
resistance bias factors maybe expected if the PDA data were from more diverse project
sites, which would result in smaller resistance factors. Recommended resistance factors
for reliability levels of 2.0 and 2.5 are as follows:
Recommended Resistance Factors
Vesic Nordlund Meyerhof Pile Type and Region (Design Category) βΤ = 2.0 βΤ = 2.5 βΤ = 2.0 βΤ = 2.5 βΤ = 2.0 βΤ = 2.5
Coastal Concrete Square Pile N@Toe<=40 0.60 0.50 0.55 0.45 0.90 0.70
Coastal Concrete Square Pile N@Toe>40 0.50 0.40 0.40 0.35 0.80 0.60
Coastal Steel HP Pile 0.75 0.65 0.80 0.70 0.65 0.55
Coastal Steel Pipe Pile 0.90 0.75 0.70 0.60 0.95 0.80
Coastal Concrete Cylinder Pile 0.50 0.45 0.15* 0.10* 0.90 0.75
Piedmont Concrete Square Pile 0.75 0.65 0.90 0.75 0.45 0.35
Piedmont Steel HP Pile 0.90 0.75 0.50 0.40 0.85 0.70
*=not recommended for practice
vii
Limitations to the values presented in this report include the resistance factors for
the coastal concrete cylinder piles are based on the least amount of the pile load test data,
and therefore are considered least reliable. The resistance factors calibrated for the
Nordlund method are extremely small and are not recommended for practical use. The
static load test data are considered more reliable than the PDA EOD data, and therefore
recommended resistance factors for the Vesic and Meyerhof methods are selected based
on the static load test data.
Conservatism is applied in the selection of the recommended resistance factors
due to the limited number of the data points. The resistance factors developed and
recommended from this research are specific for the distinct soil types of the geologic
regions of North Carolina and for the unique practice of pile foundation design at
NCDOT. The approach of the resistance factor calibration developed from this research
can be applied to the resistance factor calibration for other foundation types.
viii
TABLE OF CONTENTS LIST OF TABLES LIST OF FIGURES 1.0 INTRODUCTION 1 1.1 BACKGROUND 1
1.2 A BRIEF HISTORY OF LRFD FOR STRUCTURE DESIGN 2
1.3 A BRIEF HISTORY OF LRFD FOR GEOTECHNICAL DESIGN 3
1.4 PROBLEM STATEMENT 5
1.5 RESEARCH SCOPE AND OBJECTIVES 7
2.0 STATIC ANALYSIS OF AXIAL CAPACITY OF DRIVEN PILES 9 2.1 INTRODUCTION 9
2.2 ALLOWABLE STRENGTH DESIGN (ASD) 10
2.3 LOAD AND RESTITANCE FACTOR DESING (LRFD) 12
2.4 VESIC METHOD 15
2.5 TOMLINSON METHOD 22
2.6 NORDLUND METHOD 23
2.7 MEYERHOF METHOD 25
3.0 PILE LOAD TEST DATA 28 3.1 GENERAL DESCRIPTION OF NORTH CAROLINA GEOLOGY 28
3.1.1 Coastal Region 28
3.1.2 Piedmont Region 30
3.1.3 Mountain Region 30
3.2 PILE DRIVING ANALYZER (PDA) DATA 31
3.2.1 Case Pile Wave Analysis Program (CAPWAP) 32
3.2.2 Coastal Area Concrete Square Piles 33
3.2.3 Jetting Effects 40
3.2.4 Coastal Area Steel HP Piles 41
ix
3.2.5 Coastal Area Steel Pipe Piles 42
3.2.6 Coastal Area Concrete Cylinder Piles 43
3.2.7 Piedmont Area Concrete Square Piles 44
3.2.8 Piedmont Area Steel HP Piles 44
3.3 STATIC LOAD TEST DATA 45
4.0 RELIABILITY ANALYSIS 50 4.1 INTRODUCTION 50
4.2 LOAD STATISTICS 51
4.3 RESISTANCE STATISTICS 52
4.3.1 Bias Factor 52
4.3.2 Bayesian Updating of the Bias Factors 57
4.4 FIRST ORDER SECOND MOMENT (FOSM) ANALYSIS 60
4.5 ADVANCED FIRST ORDER SECOND MOMENT (AFOSM) ANALYSIS 62
4.6 RELIABILITY ESTIMATE OF THE CURRENT DESIGN PRACTICE 64
4.6.1 Introduction 64
4.6.2 Vesic Method 65
4.6.3 Nordlund Method 71
4.6.4 Meyerhof Method 77
4.7 TARGET RELIABILITY INDEX (βT) 82
5.0 CALIBRATION OF RESISTANCE FACTORS 83
5.1 INTRODUCTION 83
5.2 MVFOSM METHOD 84
5.3 AFOSM METHOD 86
5.4 RESISTANCE FACTORS FOR THE VESIC METHOD 88
5.5 RESISTANCE FACTORS FOR THE NORDLUND METHOD 94
5.6 RESISTANCE FACTORS FOR THE MEYERHOF METHOD 101
5.7 EFFECTS OF JETTING ON THE RESISTANCE FACTORS 107
x
6.0 COMPARISON OF ASD AND LRFD – EXAMPLES 110
7.0 CONCLUSIONS AND RECOMMENDATIONS 113
REFERENCES 117
APPENDIX A: 124
APPENDIX B: 134
APPENDIX C: 147
APPENDIX D: 239
xi
LIST OF TABLES
Table 2-1. Bearing Capacity Factors (Nc and Nσ) for Vesic Method (Vesic, 1977) 21
Table 2-2. Coefficient of Adhesion for Tomlinson’s Method (NCDOT, 1995) 22
Table 3-1. PDA EOD Coastal Concrete Square Piles 34
Table 3-2. PDA BOR Coastal Concrete Square Piles 36
Table 3-3. Coastal Concrete Square Piles 37
Table 3-4. PDA EOD Coastal Steel HP Piles 41
Table 3-5. PDA BOR Coastal Steel HP Piles 42
Table 3-6. PDA EOD Coastal Steel Pipe Piles 42
Table 3-7. PDA BOR Coastal Steel Pipe Piles 43
Table 3-8. PDA EOD Coastal Concrete Cylinder Piles 44
Table 3-9. PDA EOD Piedmont Concrete Square Piles 44
Table 3-10. PDA EOD Piedmont Steel HP Piles 45
Table 3-11. Static Pile Load Test Data 46
Table 4-1. Statistics of Bridge Load Components 52
Table 4-2. Bias Factor Statistics for Coastal Steel HP Piles – Vesic Method 53
Table 4-3. Summary of Bias Factor Statistics – Coastal Concrete Square Pile 55
Table 4-4. Summary of Bias Factor Statistics – Coastal Steel HP Pile 56
Table 4-5. Summary of Bias Factor Statistics – Coastal Steel Pipe Pile 56
Table 4-6. Summary of Bias Factor Statistics – Coastal Concrete Cylinder Pile 56
Table 4-7. Summary of Bias Factor Statistics – Piedmont Concrete Square Pile 57
Table 4-8. Summary of Bias Factor Statistics – Piedmont Steel HP Pile 57
Table 4-9. Bayesian Updating: C-C-SQ, Total Capacity 59
Table 4-10. Bayesian Updating: C-S-HP, Total Capacity 59
Table 4-11. Bayesian Updating: C-S-PP, Total Capacity 59
Table 4-12. Bayesian Updating: C-C-CL, Total Capacity 60
Table 4-13. Summary of Reliability Analyses: C-C-SQ, Vesic 66
Table 4-14. Summary of Reliability Analyses: C-S-HP, Vesic 67
Table 4-15. Summary of Reliability Analyses: C-S-PP, Vesic 68
Table 4-16. Summary of Reliability Analyses: C-C-CL, Vesic 69
Table 4-17. Summary of Reliability Analyses: P-C-SQ, Vesic 70
xii
Table 4-18. Summary of Reliability Analyses: P-S-HP, Vesic 71
Table 4-19. Summary of Reliability Analyses: C-C-SQ, Nordlund 71
Table 4-20. Summary of Reliability Analyses: C-S-HP, Nordlund 73
Table 4-21. Summary of Reliability Analyses: C-S-PP, Nordlund 74
Table 4-22. Summary of Reliability Analyses: C-C-CL, Nordlund 75
Table 4-23. Summary of Reliability Analyses: P-C-SQ, Nordlund 76
Table 4-24. Summary of Reliability Analyses: P-S-HP, Nordlund 76
Table 4-25. Summary of Reliability Analyses: C-C-SQ, Meyerhof 77
Table 4-26. Summary of Reliability Analyses: C-S-HP, Meyerhof 78
Table 4-27. Summary of Reliability Analyses: C-S-PP, Meyerhof 79
Table 4-28. Summary of Reliability Analyses: C-C-CL, Meyerhof 80
Table 4-29. Summary of Reliability Analyses: P-C-SQ, Meyerhof 81
Table 4-30. Summary of Reliability Analyses: P-S-HP, Meyerhof 82
Table 5-1. MVFOSM Calibration for PDA BOR C-C-SQ, Vesic 85
Table 5-2. Resistance Factors for Coastal Concrete Square Piles (QD/QL = 1.5) 89
Table 5-3. Resistance Factors for Coastal Steel HP Piles (QD/QL = 1.5) 90
Table 5-4. Resistance Factors for Coastal Steel Pipe Piles (QD/QL = 1.5) 91
Table 5-5. Resistance Factors for Coastal Concrete Cylinder Piles (QD/QL = 1.5) 92
Table 5-6. Resistance Factors for Piedmont Concrete Square Piles (QD/QL = 1.5) 93
Table 5-7. Resistance Factors for Piedmont Steel HP Piles (QD/QL = 1.5) 94
Table 5-8. Resistance Factors for Coastal Concrete Square Piles (QD/QL = 1.5) 95
Table 5-9. Resistance Factors for Coastal Steel HP Piles (QD/QL = 1.5) 96
Table 5-10. Resistance Factors for Coastal Steel Pipe Piles (QD/QL = 1.5) 98
Table 5-11. Resistance Factors for Coastal Concrete Cylinder Piles (QD/QL = 1.5) 99
Table 5-12. Resistance Factors for Piedmont Concrete Square Piles (QD/QL = 1.5) 100
Table 5-13. Resistance Factors for Piedmont Steel HP Piles (QD/QL = 1.5) 100
Table 5-14. Resistance Factors for Coastal Concrete Square Piles (QD/QL = 1.5) 102
Table 5-15. Resistance Factors for Coastal Steel HP Piles (QD/QL = 1.5) 103
Table 5-16. Resistance Factors for Coastal Steel Pipe Piles (QD/QL = 1.5) 105
Table 5-17. Resistance Factors for Coastal Concrete Cylinder Piles (QD/QL = 1.5) 106
Table 5-18. Resistance Factors for Piedmont Concrete Square Piles (QD/QL = 1.5) 106
Table 5-19. Resistance Factors for Piedmont Steel HP Piles (QD/QL = 1.5) 107
xiii
Table 5-20. Jetting Effects on Resistance Factor 109
Table 7-1. Recommended Resistance Factors 116
xiv
LIST OF FIGURES
Figure 2-1. Distribution of Load and Resistance 13
Figure 2-2. Relationship between Standard Penetration Resistance, Relative
Density, and Effective Overburden Pressure 17
Figure 2-3. Relationship between Mean Normal Ground Stress, Relative
Density, and Rigidity Index 19
Figure 2-4. Relationship between Maximum Unit Toe Resistance
and Friction Angle 27
Figure 3-1. North Carolina Geologic Map 28
Figure 3-2. Coastal Concrete Square Piles – Setup Effect (Total Capacity) 38
Figure 3-3. Coastal Concrete Square Piles – Setup Effect (Skin Capacity) 39
Figure 3-4. Coastal Concrete Square Piles – Setup Effect (Toe Capacity) 39
Figure 3-5. Davisson’s Failure Criteria 48
Figure 5-1. AFOSM Calibration Graphical Output 87
1
CHAPTER 1. INTRODUCTION
1.1 BACKGROUND
Driven piles are one of the main elements of bridge foundations. Currently, North
Carolina Department of Transportation (NCDOT) uses static methods of design of the
foundation piles with the conventional factor of safety (referred to as Allowable Strength
Design). In addition Wave Equation Analysis is used to provide the pile driving criteria,
which show the required hammer blow counts for achieving the pile design capacity.
Static load tests and Pile Driving Analyzer (PDA) are sometimes used to verify the
design. The American Association of State Highway and Transportation Officials
(AASHTO) has called for the implementation of Load and Resistance Factor Design
(LRFD) for bridges including their foundations. Presently, virtually all reinforced
concrete superstructures are designed using LRFD method, and steel design is in the
process of transition from the Allowable Strength Design (ASD) code to the newer LRFD
code.
Over the past 18 years there has been a general move toward the increased use of
LRFD in structural and geotechnical design. In order to adopt a consistent design for
both the superstructures and the foundations, many state DOT’s are now moving to the
implementation of the AASHTO LRFD Specifications (Passe, 1997). In LRFD
approach, load and resistance factors need to be defined. For the geotechnical design of
driven piles, AASHTO guidelines provide these factors for general soil conditions.
However, the AASHTO factors are not appropriate for specific local conditions. The
2
available literature indicates that several users found the AASHTO-recommended factors
lead to inappropriate design conflicting with their experiences (Goble, 1999). A recent
study team organized by the Federal Highway Administration (FHWA) reviewed the
developments in load and resistance factor design methods in Canada, Germany, France,
Denmark, Norway, and Sweden (DiMaggio et al, 1999). The main recommendation of
the team was the need for calibration of geotechnical load and resistance factors for
different geotechnical applications utilizing existing databases.
1.2 A BRIEF HISTORY OF LRFD FOR STRUCTURE DESIGN
The earliest use of LRFD was in the American Concrete Institute (ACI) “Building
Code Requirements for Reinforced Concrete”, adopted in 1956 by ACI Committee 318
(ACI 1956). The document was brief, and the design method was called “Ultimate
Strength Design”. In this code, resistance factor concept was not introduced, so all of the
safety factors were embedded in the load factors. However, the load factors were
different for different load types and also for different load combinations. In the next
version of the ACI 318 Code (ACI 1963), a complete LRFD format was used including
resistance factors. The design method was still known as Ultimate Strength Design, but it
was identical in format with LRFD concept. However, both the load and resistance
factors in the ACI Codes were not selected based on a rational analysis, but by the
intuition and judgment of the committee members.
Cornell (1969) presented a paper “A Probability Based Structural Code” in the
ACI journal proposing probability based design codes. Cornell outlined the framework
of probability-based structural design codes and discussed the detailed procedures to
3
develop the resistance and load factors. Ellingwood et al. (1980) presented in the
National Bureau of Standard (NBS) Report #577 the development of load factors for
design of buildings based on a probabilistic analysis. The basic concepts of probability
theory application for load factor calibration were presented in the paper. The American
Institute of Steel Construction (AISC) did extensive calibration study to develop
resistance factors for the various steel structural elements. AISC adopted the load factors
presented in NBS Report #577 when they published the LRFD Specification in 1986
(AISC 1986).
The bridge design code adopted by AASHTO in 1977 contained a design
procedure called Load Factor Design (LFD) along with the conventional ASD procedure.
Both working loads and factored loads were included, and either method could be used in
design. In 1994 AASHTO adopted a LRFD code developed from National Cooperative
Highway Research Program (NCHRP) Project 12-33 (Nowak, 1992). Interim
specifications have been adopted and the new design procedure is now being
implemented into practice. Most government agencies as well as private firms are now
using LRFD procedures for the bridge superstructure design, and they are in the process
of adopting the LRFD procedures for the substructure elements.
1.3 A BRIEF HISTORY OF LRFD FOR GEOTECHNICAL DESIGN
In 1950’s the Danish Geotechnical Institute investigated a limit state design
method for geotechnical applications. Hansen (1966) presented a limit state code for
foundation engineering, which was adopted by the Danish Engineering Association. This
code used factors on both the load and the resistance and appears to be the first attempt of

4
LRFD for geotechnical design. These factors were derived from previous Danish
experience, and the resistance factors were applied to the soil properties rather than
directly to the resistance. The Danish Code published by the Danish Geotechnical
Institute (1985) is the successor of the original limit state code developed by Hansen. It
dealt with the design of both shallow and deep foundations, and specific procedures for
earth pressure calculations were included.
The province of Ontario in Canada adopted LRFD for bridge design in 1979 with
the publication of Ontario Highway Bridge Design Code and Commentary. In 1983, the
second edition of the LRFD Code with Commentary was adopted in Ontario and its use
became mandatory. This code was developed based on a reliability index of 3.5 for
superstructure elements. The corresponding results of using similar reliability index in
geotechnical engineering were not encouraging since the foundation elements generally
became larger and the design became more conservative. The third edition of the Ontario
Bridge Code with Commentary was adopted in 1992, and its use yields more reasonable
design of foundations but still more conservative than the previous AASHTO-based
designs using ASD method.
When the LRFD method was adopted for the new AASHTO bridge design
specification in 1994, it was necessary to include LRFD version for foundation design.
Goble (1980) investigated the LRFD concept for pile foundation design. Barker et al.
(1991) presented an extensive research effort for the development of LRFD for bridge
foundation design. Their research led to NCHRP Report 343, which became the basis for
the 1994 AASHTO bridge design specification. The research made the rational
probabilistic approach on the model variability and the inherent spatial variability of soil
5
properties. However it did not include the site variability. Goble (1999) presented his
findings of the survey on the state DOT’s practice of LRFD for geotechnical design.
Several users of the AASHTO specifications reported that the resistance factors for the
foundation design did not fit in their design practice and resulted in an over-conservative
design. Withiam et al. (1998) authored a manual titled ‘LRFD for Highway Bridge
Substructures’ published by the Federal Highway Administration (FHWA). Using this
manual, FHWA offered a National Highway Institute (NHI) training course to many of
the state DOT’s in an effort to implement LRFD for foundation design.
In 1997 the Florida Department of Transportation (FDOT) developed LRFD Code
for their bridge design (Passe, 1997). The Code was developed using the AASHTO-
recommended load combinations and load factors. The reliability index was calculated
for the safety factor used in their ASD practice, and a target reliability index was chosen.
The resistance factors were then calibrated for the target reliability index. Though no
probabilistic analysis was performed in the calibration process, FDOT was a pioneer
among the state DOT’s in implementing the LRFD for geotechnical applications.
1.4 PROBLEM STATEMENT
NCDOT is currently using static design methods for estimating the axial capacity
of pile foundations based on the allowable strength design (ASD) principles with a
predetermined factor of safety. The factor of safety used in the axial pile capacity
analysis is the same for all pile types, soil conditions and the static design methods. This
practice does not consider any variation in uncertainties regarding the pile types, the
subsurface conditions, or the design methods.
6
AASHTO has mandated the implementation of LRFD for all bridge structures
including foundations beginning year 2007. FHWA also has called for LRFD in all
federally-funded projects from year 2007. NCDOT’s transition from ASD to LRFD is
inevitable in order to meet the mandates of AASHTO and FHWA and to provide
geotechnical design measures, which are more consistent with the bridge superstructure
design.
NCDOT has been using the Vesic method (Vesic, 1977) as the main tool for the
static analysis of pile’s capacities, supplemented by other methods such as the Nordlund
method and the Standard Penetration Test (SPT) method. The Vesic method has been
proven effective based on the many years of experience and a previous study (Keane,
1990). However, this method was not included in any of the previous studies conducted
to develop the resistance factors for driven piles’ axial capacity, and the resistance factor
for this method is not available in literature including the AASHTO LRFD Bridge Design
Specifications. In addition, the factor of safety used in the NCDOT practice, based on
many years of the pile foundation design and construction experience, is different from
the factor of safety used in the calibration of the resistance factors recommended in the
current AASHTO LRFD Specifications.
There are several factors that can influence the prediction of a pile’s capacity.
Among them are the static analysis model, the site geology, the in-situ and laboratory
tests for estimating soil strength parameters, and the designer’s judgment and experience.
Therefore, it is important to consider all these design aspects in the development of
resistance factors. The resistance factors in the AASHTO LRFD Specifications are based
on nationwide general geologic conditions and do not address local specific conditions.
7
It has been proven that the AASHTO resistance factors do not provide a reasonable
foundation design that conforms to the local experiences (Goble, 1999).
It is necessary and urgent to develop the resistance factors for the axial capacity of
driven piles in North Carolina. These factors must be developed for the unique soil types
for the region, in which the piles are used, incorporating the many years of pile design
and construction experience.
1.5 RESEARCH SCOPE AND OBJECTIVES
The main objective of this research is to develop the resistance factors for the
design of driven piles in North Carolina. The resistance factors are developed for the
different types of the static pile capacity analysis methods, for different pile types, and for
the unique geologic coastal and piedmont regions of the state. These factors are
developed in the framework of ‘reliability analysis’ using the Pile Driving Analyzer
(PDA) test and static load test data embodying the uncertainties associated with the
capacity prediction model, the pile type and geometry, and the soil parameters. The form
of probability distribution function describing the pile capacity is studied, and the
associated parameters are quantified. The first-order reliability method (FORM) is used
to evaluate the reliability index of the current design methods and to select the target
reliability index, which is used to develop the resistance factors for the design of the axial
capacity of the driven piles in North Carolina. Specifically, the following objectives are
achieved:
8
i. Review the NCDOT’s current design practice for the bearing capacity of the
driven piles along with the geologic characteristics of the different regions of
the state,
ii. Review and compile the PDA and static load test data maintained by NCDOT,
and do the static analysis of the pile’s bearing capacity for each test data with
the different methods of the static analysis,
iii. Perform the statistical analysis of the pile’s predicted and measured bearing
capacities and establish the resistance statistics including the probability
distribution and the parameters,
iv. Perform the reliability analysis of the current design methods using the First
Order Reliability Methods (both MVFOSM and AFOSM) and select the target
reliability index,
v. Calibrate the resistance factors for the different static analysis methods, for the
different pile types (concrete, steel HP and pipe piles) and geometry, and for the
different geologic regions (coastal and piedmont) of North Carolina,
vi. Perform parametric and comparative studies to evaluate the influence of the pile
length over diameter ratio, the effect of jetting, and the set-up or relaxation
effect on the resistance factors, and
vii. Develop detailed LRFD procedures for the axial capacity of driven piles in
North Carolina and compare the design by the LRFD procedures with the
design by the current ASD methods.
9
CHAPTER 2.
STATIC ANALYSIS OF AXIAL CAPACITY OF DRIVEN PILES
2.1 INTRODUCTION
There are many static analysis methods available to estimate the required pile
lengths and the number of piles for a given set of applied loads to the substructure. Some
of them such as the Meyerhof method, the α-method and the CPT method are mainly
empirical, and others such as the Nordlund method, the β-method, and the Vesic method
are semi-empirical. There are some advantages and disadvantages in each method, and
the selection of the most appropriate method depends on the site geology, pile type,
availability of soil parameters, and the designer’s experience. NCDOT has traditionally
been using the Vesic method as the main model for the driven pile’s axial capacity
analysis, supplemented by the Nordlund method and the Meyerhof method. Each of the
three methods has a provision in its algorithm that employs the Tomlinson method for the
section of the pile in a soft to medium dense clay layer. The resistance factors developed
in this study are for these three models.
The ultimate capacity of a single pile is the sum of skin and toe resistance (RU =
RS + RT). The calculation assumes that the skin and toe resistances can be determined
separately and these two values do not affect each other. The ultimate load on a pile is
the load that can cause failure of either the pile or the soil. The pile failure condition may
govern the design where pile points penetrate dense sand or rock, but in most situations,

10
ultimate load is determined by the soil failure. Axial capacity of piles is greatly affected
by the assumed distribution of the soil parameters and the soil-pile interaction. Gabr
(1993) listed the uncertainties in parameters affecting the axial capacity including
physical soil properties, the characterization of the interface side friction, and the pile
material and loading conditions. Sensitivity study of the cyclic axial capacity of a single
pile also indicated the variation in the level of contribution of these parameters as a
function of pile deformation (Nadim et al., 1989).
In broad terms, there are two methods of design in current use: the working stress
design, referred to by AISC as Allowable Strength Design (ASD) and limit state design,
referred to as Load and Resistance Factor Design (LRFD). ASD has been the principal
method of design used during the past 100 years. During the past 20 years or so, design
has been moving toward more rational approach of LRFD, in which the reliability of the
design is ensured in a rational framework. In the following, these two types of design
methods and the four static analysis methods are presented.
2.2 ALLOWABLE STRENGTH DESIGN (ASD)
Considering R to represent the capacity or resistance of a system and Q (=ΣQi) the
demand or load acting on it, safety is ensured in the design by use of a factor of safety (F)
in the following equation:
R/F = Q (2-1)
The reason for using a factor of safety to reduce the nominal resistance is the uncertainty
associated with the evaluation of both R and Q (even though we are applying F to the
resistance only). Meyerhof (1970) presented a very good discussion of safety factors in
11
geotechnical engineering. The following should provide an insight into the way in which
a value for safety factor is arrived at. Suppose the actual pile load is expected to exceed
the service load by an amount ∆Q, and the actual resistance is less than the evaluated
resistance by an amount ∆R. A pile that is just adequate would have
R – ∆R = Q+ ∆Q
or, R(1- ∆R/R) = Q(1+ ∆Q/Q) (2-2)
The safety factor, F as defined above, can be written as
F = R/Q = (1+ ∆Q/Q)/ (1- ∆R/R) (2-3)
The above equation illustrates the effect of over-load (∆Q/Q) and under-strength
(∆R/R) on the safety factor without identifying the factors contributing to either. In order
to arrive at a numerical value of safety factor, numerical estimates of over-load and
under-strength have to be made according to judgment and prior experience. For
example, if one assumes that the occasional over-load may be 20% and that the
occasional under-strength may be 30%, the safety factor will then be given as:
F = (1+0.2) / (1-0.3) = 1.72 (2-4)
The advantage of ASD is its simplicity; however, the shortcomings of this
approach are:
• The degree of uncertainty associated with R and Q is not incorporated in a
systematic way. The factor of safety as used here is not a good measure of
reliability. For a system designed by this method, different probabilities of
failure may correspond to the same factor of safety.
• The factor of safety is selected on the basis of experience and judgment, and
therefore tends to be subjective and arbitrary (Tang et al, 1976).
12
• Additional information through intensive soil exploration, improved testing
techniques, or better correlation studies cannot be incorporated in the
evaluation of the uncertainty and subsequent reduction of the required factor
of safety for design.
2.3 Load and Resistance Factor Design (LRFD)
In the LRFD procedure, margins for safety are incorporated through load factors
and resistance factors. Goble (1996) illustrated the load and resistance factor design
(LRFD) bridge specification that was accepted by the AASHTO Bridge Committee. He
tested the design procedure for driven pile foundations using a hypothetical example and
concluded that the AASHTO LRFD specification would work effectively, but the
resistance factors should be modified to be more effective through further research.
Green (1994) identified several technical problems in using the LRFD specification with
issues relating to earth pressures, shallow and deep foundations.
The basic requirements for LRFD-based design can be expressed as: φR = Σ γi Qi (2-5) where φ is a resistance factor and γi are load factors. The idea here is to reduce the
resistance and increase the load in order to account for the uncertainty associated with
both of them. However, in this method, these factors can be systematically developed in
the framework of reliability theory. The uncertainties associated with both the resistance
and the load may be fully defined through their probability distributions. The probability
of failure may be considered through the extent of overlap (Figure 2-1) between the
distributions of the resistance and the load. This area of overlap depends on three factors:
13
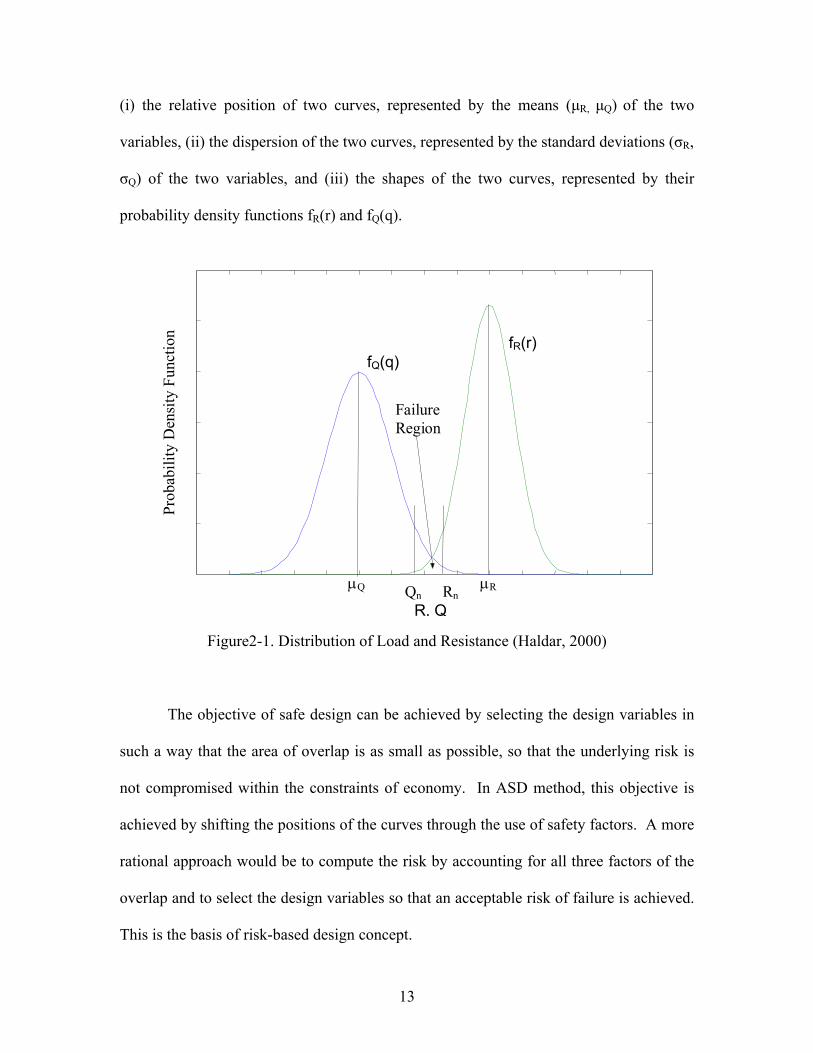
(i) the relative position of two curves, represented by the means (µR, µQ) of the two
variables, (ii) the dispersion of the two curves, represented by the standard deviations (σR,
σQ) of the two variables, and (iii) the shapes of the two curves, represented by their
probability density functions fR(r) and fQ(q).
µQ Qn RnµR
R, Q
Prob
abili
ty D
ensi
ty F
unct
ion
fQ(q)fR(r)
FailureRegion
Figure2-1. Distribution of Load and Resistance (Haldar, 2000)
The objective of safe design can be achieved by selecting the design variables in
such a way that the area of overlap is as small as possible, so that the underlying risk is
not compromised within the constraints of economy. In ASD method, this objective is
achieved by shifting the positions of the curves through the use of safety factors. A more
rational approach would be to compute the risk by accounting for all three factors of the
overlap and to select the design variables so that an acceptable risk of failure is achieved.
This is the basis of risk-based design concept.

14
The advantages of this approach are:
• The uncertainties associated with the soil properties are handled in a rational
framework of the theory of probability.
• The reliability, or risk, is quantified through a consistent measure, and a
consistent level of safety can be assured.
• Additional information can be incorporated in the evaluation of uncertainty
and subsequent updating of the load and resistance factors.
• LRFD is being widely adopted in practice, and the adoption of this approach
for pile design will be consistent with the design of other components of a
civil engineering system.
• The rationality of LRFD is attractive, and it will also lead to a safer and more
economical design.
• LRFD provides the framework to handle unusual loads that may not be
covered by the specifications. The design may have uncertainty relating to the
resistance of a pile, in which case the resistance factors may be modified.
• Future adjustments in the calibration of the method can be made without much
complication. Calibration of LRFD is usually done for an average situation,
but it might need to be adjusted in the future.
• Design practice is still at the beginning stage with regard to the serviceability
limit states; however, at least the LRFD provides the approach.
15
The disadvantages of the LRFD are:
• The reliability analysis to develop and adjust resistance factors for individual
situations requires considerable amounts of statistical data and probabilistic
design algorithms.
• The quality of data can influence the resistance factors significantly.
• Implementation requires some degree of training and understanding of the
LRFD methodologies and a change in design procedures.
2.4 VESIC METHOD
Vesic (1977) presented his design method for pile foundations in the NCHRP
Synthesis #42. This is a semi-empirical method based on a number of field test data from
several different locations of the U.S. and the abroad. The Vesic method has been used
most widely in NCDOT to predict a driven pile’s bearing capacity for a long period of
time. Keane (1990) reported that the Vesic method predicted the pile’s bearing capacity
most closely to the measured values from the 13 static load tests performed in the past by
NCDOT. In the early 1990, NCDOT coded a computer program ‘PILECAP’ following
the general algorithm of the Vesic method. PILECAP calculates a pile’s bearing
capacities and pile toe settlements at predetermined depth intervals. An example
PILECAP output is included in Appendix A.
The Vesic method equates the ultimate bearing capacity to the sum of the total
skin resistance and the total toe resistance. The unit skin resistance, fs, consists of two
parts as shown in the following equation.
16
fs = ca + qs tanδ (2-6)
In the equation tanδ represents the coefficient of friction between the soil and the pile,
which can be taken equal to tanφ, the coefficient of friction of the remolded soil in terms
of effective stresses. The pile-soil cohesion (ca) is normally small for granular soils and
is neglected in the design. The normal stress on the skin (qs) is related to the effective
vertical stress (qv) at the point of interest and the coefficient of lateral earth pressure (K),
and the Equation 2-6 can be rewritten as follows.
fs = K tanφ qv = Ns qv (2-7)
Vesic reported the measured Ns values for driven piles in very dense sand varying
from about 2 for very short piles to about 0.4 for very long piles. In loose sand Ns can be
as low as 0.1 with no obvious decrease with increasing pile length. Vesic also reported
that for piles in medium to dense sand, fs reaches a quasi-constant limit value after some
penetration into the sand stratum, which is a function of only the initial sand density and
the overconsolidation ratio of the deposit. He proposed the following simple formula for
the unit skin resistance of piles in a granular soil deposit in terms of the soil’s relative
density (Dr) in each layer.
fs = (1.5) (0.08) (10)1.5Dr^4 tsf for driven piles (2-8)
fs = (1.5) (0.025) (10)1.5Dr^4 tsf for bored or jacked piles (2-9)
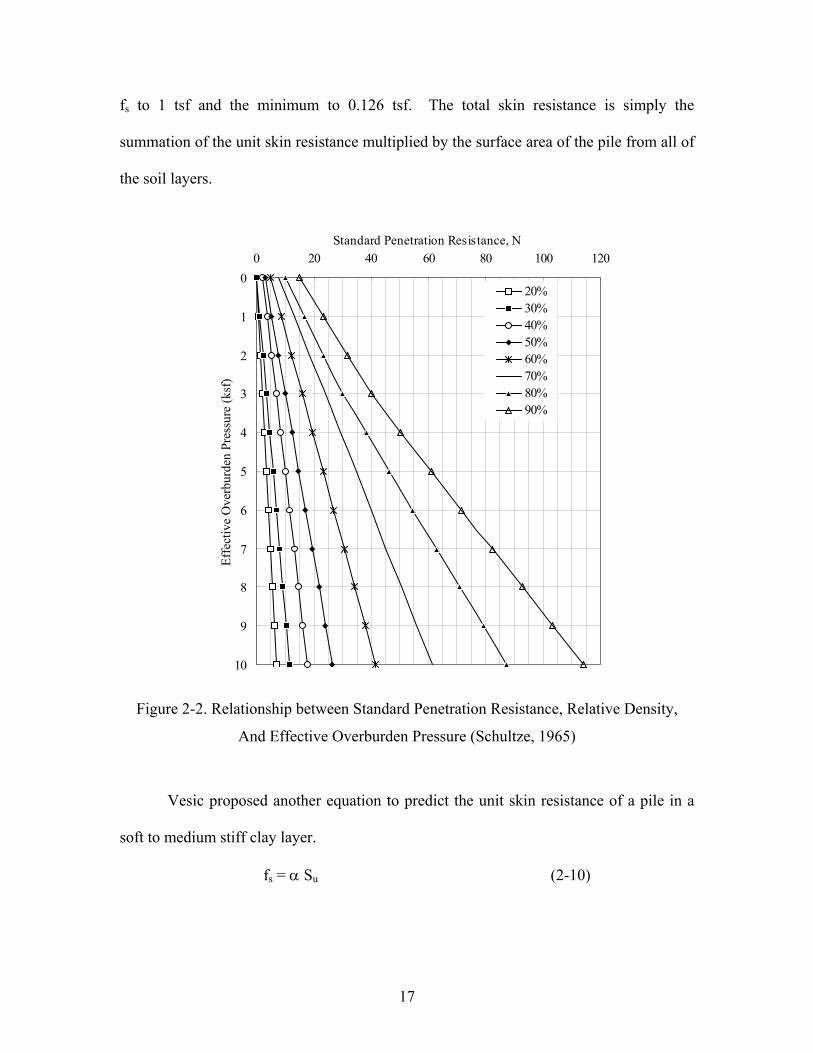
The relative density can be represented as a function of the effective overburden
pressure (qv) and the soil’s strength parameters. Figure 2-2 shows the relationship
between the relative density, the effective overburden pressure, and the standard
penetration test (SPT) blow counts (N). This is the figure NCDOT uses along with the
Equations 2-8 and 2-9 to compute the unit skin resistance. NCDOT limits the maximum
17
fs to 1 tsf and the minimum to 0.126 tsf. The total skin resistance is simply the
summation of the unit skin resistance multiplied by the surface area of the pile from all of
the soil layers.
0
1
2
3
4
5
6
7
8
9
10
0 20 40 60 80 100 120Standard Penetration Resistance, N
Effe
ctiv
e O
verb
urde
n Pr
essu
re (k
sf)
20%30%40%50%60%70%80%90%
Figure 2-2. Relationship between Standard Penetration Resistance, Relative Density,
And Effective Overburden Pressure (Schultze, 1965)
Vesic proposed another equation to predict the unit skin resistance of a pile in a
soft to medium stiff clay layer.
fs = α Su (2-10)
18
This is identical to the Tomlinson’s equation for the unit skin resistance, in which α is an
empirical adhesion factor. However, the adhesion factor in the Vesic method, which
varies from 0.2 to 1.5 for different pile types and soil conditions, is different from that in
the Tomlinson method. The experience within NCDOT has found that this equation does
not predict the skin resistance adequately for the clay soils in North Carolina. Instead of
using this equation, NCDOT has a provision in the Vesic method that uses the
Tomlinson’s α method for the skin resistance in a soft to medium stiff clay layer. Many
researchers including Vesic (1977) found that the behavior of piles in stiff clay is
frictional in nature and fundamentally similar to that of piles in dense sand. In NCDOT’s
practice, a clay soil with the SPT N value over 20 is treated as a granular soil in the
bearing capacity predictions.
The unit toe resistance is represented by the following equation based on
nonlinear elasto-plastic theories.
qt = c Nc + qvNq (2-11)
in which c represents the strength intercept (cohesion) of the assumed straight line Mohr
envelope and qv, the effective vertical stress in the ground at the depth of consideration.
Nc and Nq are dimensionless bearing capacity factors, related to each other by the
equation
Nc = (Nq –1) cot φ (2-12)
where φ is the soil’s angle of frictional resistance. Vesic confirmed that the toe resistance
is governed not by the vertical effective stress (qv) but by the mean normal ground stress
(σo), which is related to qv by the expression
σo = [(1 + 2 Ko) / 3] qv (2-13)
19
in which Ko represents the coefficient of at-rest lateral earth pressure. Thus, Equation 2-
11 can be revised to the following form.
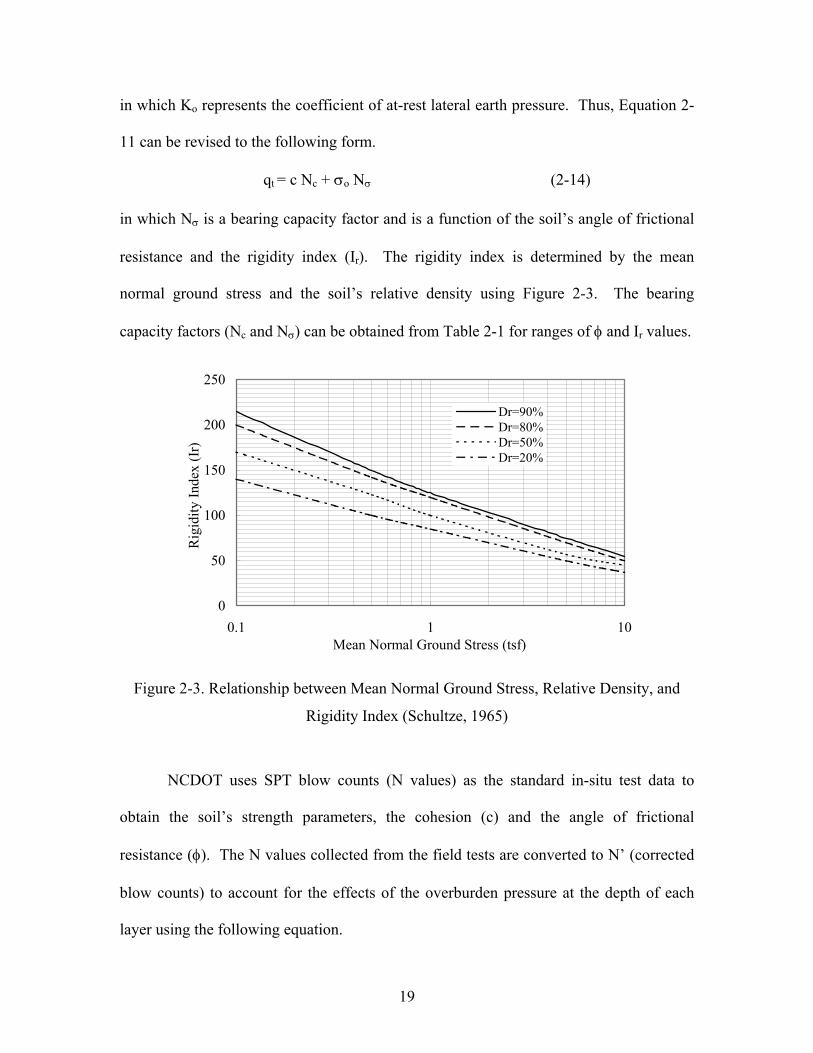
qt = c Nc + σo Nσ (2-14)
in which Nσ is a bearing capacity factor and is a function of the soil’s angle of frictional
resistance and the rigidity index (Ir). The rigidity index is determined by the mean
normal ground stress and the soil’s relative density using Figure 2-3. The bearing
capacity factors (Nc and Nσ) can be obtained from Table 2-1 for ranges of φ and Ir values.
0
50
100
150
200
250
0.1 1 10Mean Normal Ground Stress (tsf)
Rig
idity
Inde
x (I
r)
Dr=90%Dr=80%Dr=50%Dr=20%
Figure 2-3. Relationship between Mean Normal Ground Stress, Relative Density, and
Rigidity Index (Schultze, 1965)
NCDOT uses SPT blow counts (N values) as the standard in-situ test data to
obtain the soil’s strength parameters, the cohesion (c) and the angle of frictional
resistance (φ). The N values collected from the field tests are converted to N’ (corrected
blow counts) to account for the effects of the overburden pressure at the depth of each
layer using the following equation.
20
N’ = 0.77 log (20/ qv) N (2-15)
in which qv is the effective overburden pressure in tsf. N’ is limited to two times N
regardless of qv. When there is no laboratory test data available for the angle of frictional
resistance, which is the case most of the time, φ is estimated using N’ in the equation.
φ = 0.3 (N’ + 90) degrees (2-16)
The N value used here is the average N value for each layer. When jetting or predrilling
is used to install the piles to a required depth, the soil is severely disturbed and loses its
strengths considerably. To account for the effect of jetting or predrilling, the N value of
one was used in this study regardless of the original SPT blow counts for the soil layers
where jetting or predrilling was used.
When the pile toe is in a soft to medium stiff clay layer, the Tomlinson method is
used to predict the toe resistance in the same way as for the skin resistance. It is
important to note that the toe resistance is influenced by the soil within a certain distance
from the toe. This influence zone depends on several factors including the pile type, the
soil type near the toe and the capacity prediction model. No documented information on
the influence zone is available for the Vesic method, and the influence zone is assumed in
this study to be 3D above the toe to 3D below the toe, where D is the pile diameter or
width.
21
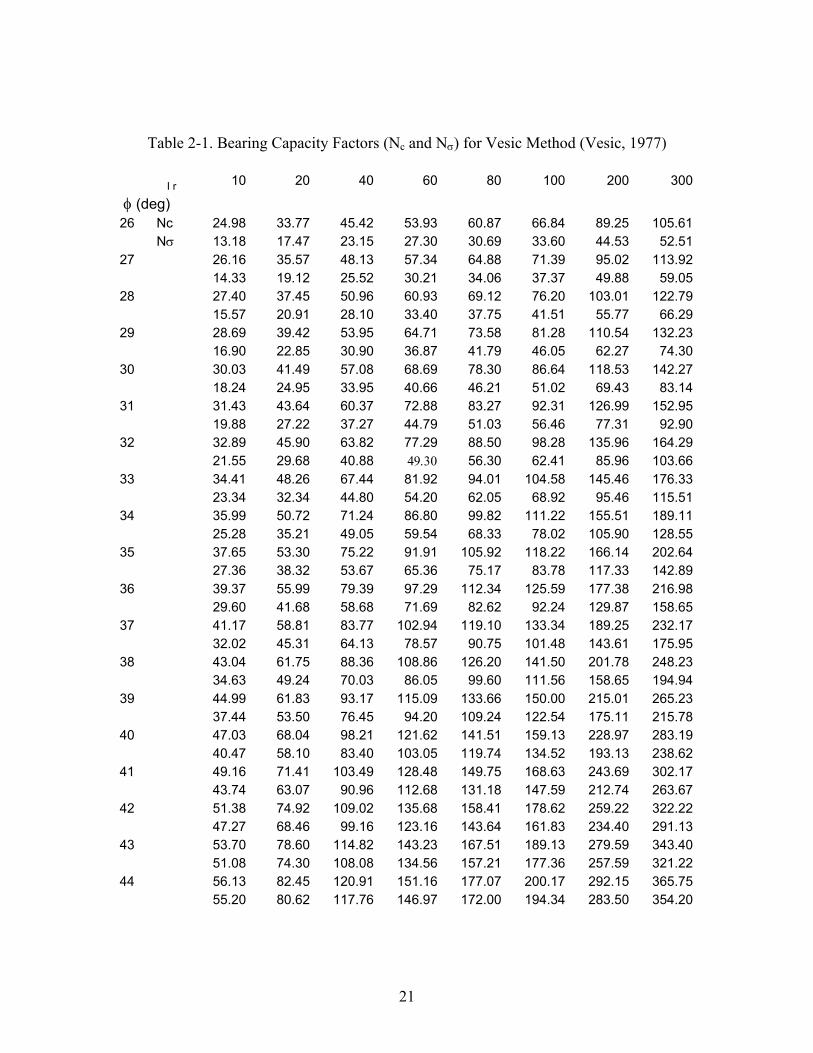
Table 2-1. Bearing Capacity Factors (Nc and Nσ) for Vesic Method (Vesic, 1977)
I r 10 20 40 60 80 100 200 300
φ (deg) 26 Nc 24.98 33.77 45.42 53.93 60.87 66.84 89.25 105.61 Nσ 13.18 17.47 23.15 27.30 30.69 33.60 44.53 52.5127 26.16 35.57 48.13 57.34 64.88 71.39 95.02 113.92 14.33 19.12 25.52 30.21 34.06 37.37 49.88 59.0528 27.40 37.45 50.96 60.93 69.12 76.20 103.01 122.79 15.57 20.91 28.10 33.40 37.75 41.51 55.77 66.2929 28.69 39.42 53.95 64.71 73.58 81.28 110.54 132.23 16.90 22.85 30.90 36.87 41.79 46.05 62.27 74.3030 30.03 41.49 57.08 68.69 78.30 86.64 118.53 142.27 18.24 24.95 33.95 40.66 46.21 51.02 69.43 83.1431 31.43 43.64 60.37 72.88 83.27 92.31 126.99 152.95 19.88 27.22 37.27 44.79 51.03 56.46 77.31 92.9032 32.89 45.90 63.82 77.29 88.50 98.28 135.96 164.29 21.55 29.68 40.88 49.30 56.30 62.41 85.96 103.6633 34.41 48.26 67.44 81.92 94.01 104.58 145.46 176.33 23.34 32.34 44.80 54.20 62.05 68.92 95.46 115.5134 35.99 50.72 71.24 86.80 99.82 111.22 155.51 189.11 25.28 35.21 49.05 59.54 68.33 78.02 105.90 128.5535 37.65 53.30 75.22 91.91 105.92 118.22 166.14 202.64 27.36 38.32 53.67 65.36 75.17 83.78 117.33 142.8936 39.37 55.99 79.39 97.29 112.34 125.59 177.38 216.98 29.60 41.68 58.68 71.69 82.62 92.24 129.87 158.6537 41.17 58.81 83.77 102.94 119.10 133.34 189.25 232.17 32.02 45.31 64.13 78.57 90.75 101.48 143.61 175.9538 43.04 61.75 88.36 108.86 126.20 141.50 201.78 248.23 34.63 49.24 70.03 86.05 99.60 111.56 158.65 194.9439 44.99 61.83 93.17 115.09 133.66 150.00 215.01 265.23 37.44 53.50 76.45 94.20 109.24 122.54 175.11 215.7840 47.03 68.04 98.21 121.62 141.51 159.13 228.97 283.19 40.47 58.10 83.40 103.05 119.74 134.52 193.13 238.6241 49.16 71.41 103.49 128.48 149.75 168.63 243.69 302.17 43.74 63.07 90.96 112.68 131.18 147.59 212.74 263.6742 51.38 74.92 109.02 135.68 158.41 178.62 259.22 322.22 47.27 68.46 99.16 123.16 143.64 161.83 234.40 291.1343 53.70 78.60 114.82 143.23 167.51 189.13 279.59 343.40 51.08 74.30 108.08 134.56 157.21 177.36 257.59 321.2244 56.13 82.45 120.91 151.16 177.07 200.17 292.15 365.75 55.20 80.62 117.76 146.97 172.00 194.34 283.50 354.20
22
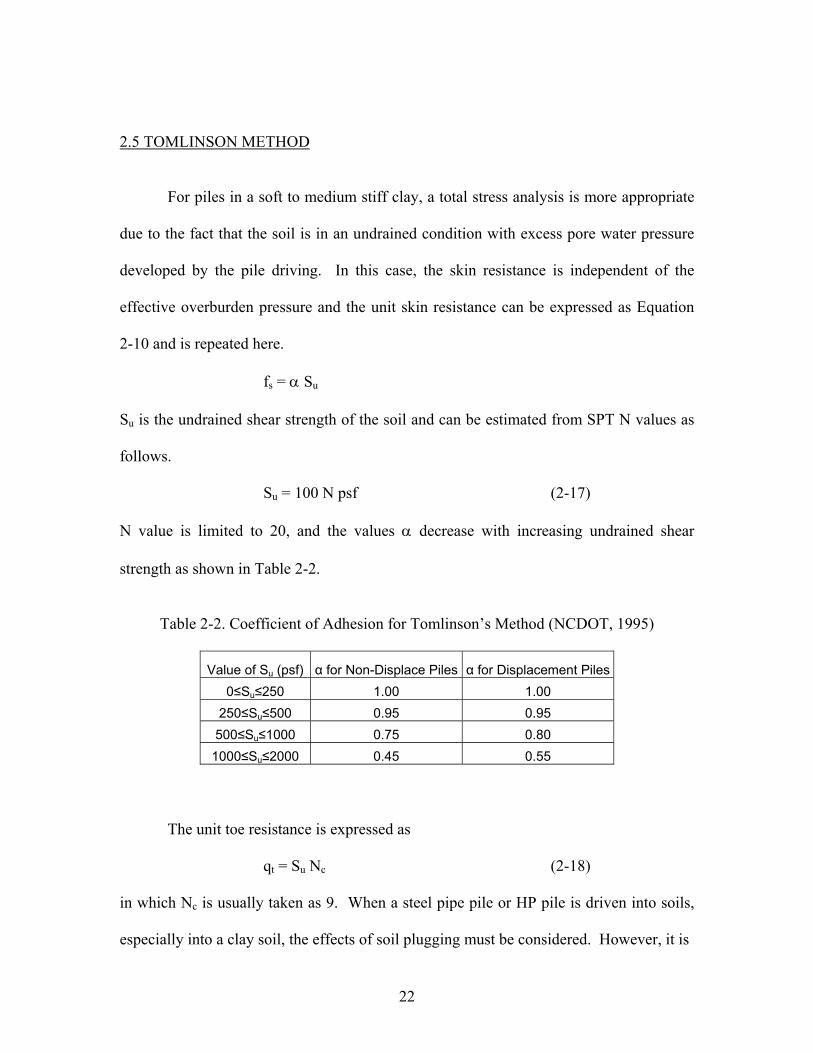
2.5 TOMLINSON METHOD
For piles in a soft to medium stiff clay, a total stress analysis is more appropriate
due to the fact that the soil is in an undrained condition with excess pore water pressure
developed by the pile driving. In this case, the skin resistance is independent of the
effective overburden pressure and the unit skin resistance can be expressed as Equation
2-10 and is repeated here.
fs = α Su
Su is the undrained shear strength of the soil and can be estimated from SPT N values as
follows.
Su = 100 N psf (2-17)
N value is limited to 20, and the values α decrease with increasing undrained shear
strength as shown in Table 2-2.
Table 2-2. Coefficient of Adhesion for Tomlinson’s Method (NCDOT, 1995)
Value of Su (psf) α for Non-Displace Piles α for Displacement Piles 0≤Su≤250 1.00 1.00
250≤Su≤500 0.95 0.95 500≤Su≤1000 0.75 0.80
1000≤Su≤2000 0.45 0.55
The unit toe resistance is expressed as
qt = Su Nc (2-18)
in which Nc is usually taken as 9. When a steel pipe pile or HP pile is driven into soils,
especially into a clay soil, the effects of soil plugging must be considered. However, it is
23
very difficult to quantify the amount of plugging without a load test. Also it should be
noted that the movement required to mobilize the toe resistance is several times greater
than that required to mobilize the skin resistance. Therefore, the toe resistance
contribution to the ultimate pile capacity of a steel pipe pile or HP pile is usually very
small.
2.6 NORDLUND METHOD
Nordlund (1963) presented his method for computing the ultimate bearing
capacity of a pile and the results of the field test programs, in which several pile types
including timber, steel HP, closed-end pipe, monotubes, and Raymond step taper piles
were used. The Nordlund method (1963, 1979) is a semi-empirical model based on the
field load tests in cohesionless soils and considers the shape of pile taper and the soil
displacement in calculating the skin resistance. Blue-Six Software, Inc. coded the
computer program ‘DRIVEN’ in 1997 under a contract with FHWA, which follows the
methods and equations of Nordlund (1963, 1979), Thurman (1964), Meyerhof (1976),
and Tomlinson (1980, 1985). DRIVEN Version 1.1 was used in this study to predict the
pile bearing capacity by the Nordlund method. The program has a provision to use the
Tomlinson method for a total stress analysis, and this method is applied to the sections of
the piles embedded in a soft to medium stiff clay layer with the average N value not more
than 20.
Nordlund proposed the following equation for calculating total skin resistance.
Qs = ∑=
=
Ld
d 0Kδ CF Pd sin(δ+ω) sec(ω) Cd ∆d (2-19)
24
in which, d: depth
L: embedded pile length
Kδ: coefficient of lateral earth pressure
CF: correction factor for Kδ when δ ≠ φ
Pd: effective overburden pressure at center of depth increment d
δ: friction angle between pile and soil
ω: angle of pile taper from vertical
φ: soil friction angle
Cd: pile perimeter at depth d
∆d: length of pile segment
For a pile with a uniform cross section (ω = 0), the equation simplifies as follows.
Qs = ∑=
=
Ld
d 0Kδ CF Pd sin(δ) Cd ∆d (2-20)
The soil friction angle φ influences most the bearing capacity in the Nordlund
method. In the absence of laboratory test data, φ is estimated from corrected SPT blow
counts (N’) in a similar way as in the Vesic method. The estimated φ values from the
Nordlund method are very much identical to those from Vesic method, except that the
Nordlund method gives slightly lower values than the Vesic method for N’ over 35. The
ratio δ/φ depends on the amount of soil displaced by pile driving and the type of pile. It
increases as the displaced soil volume increases, but it is always less than one for timber
piles, precast concrete piles, steel HP piles, and closed-end and open-end steel pipe piles.
Coefficient of lateral earth pressure (Kδ) is determined for a given φ value, the displaced
25
soil volume, and the pile taper angle. When δ and φ are different, a correction factor (CF)
needs to be applied to Kδ.
The Nordlund method computes the total toe resistance in the following form.
Qt = α Nq At qt (2-21)
in which, α: dimensionless factor dependent on φ and pile embedment depth
over width ratio
Nq: bearing capacity factor, which is a function of φ
qt: effective overburden pressure at pile toe
At: pile cross sectional area at toe
Both α and Nq are determined for φ at the pile toe, which can be estimated from the
corrected SPT N’ values. As mentioned in the Vesic method, the N’ value is selected as
the average value within the toe influence zone that is from 3 pile width/diameter above
the toe to 3 pile width/diameter below the toe. If DRIVEN computes a pile toe resistance
exceeding the limiting value suggested by Meyerhof (1976), then the program gives the
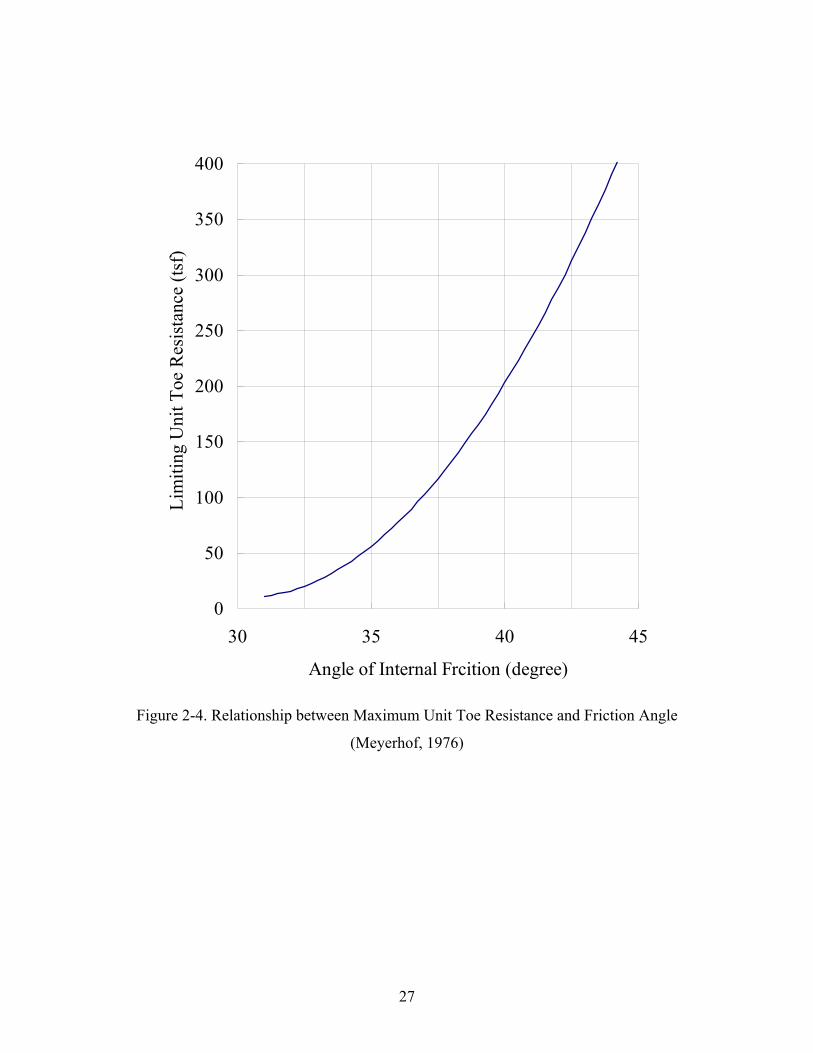
limiting value as the output value. Figure 2-4 shows the Meyerhof’s limiting unit toe
resistance for range of φ values. Also, the program has an option to account for the soil
plugging effects. An example output of DRIVEN is included in Appendix A.
2.7 MEYERHOF METHOD
Meyerhof (1976) made empirical correlations between SPT results and static pile
load tests performed in a variety of cohesionless soil deposits. He reported that the unit
skin resistance, fs, of driven displacement piles such as precast concrete piles and closed-
end steel pipe piles is:
26
fs = 0.02 N’ tsf ≤ 1 tsf (2-22)
The unit skin resistance of driven non-displacement piles such as steel HP piles is:
fs = 0.01 N’ tsf ≤ 1 tsf (2-23)
N’ is the corrected N value using Equation 2-15. The total skin resistance is fs multiplied
by the total pile skin surface area. Soil plugging needs to be considered in the skin
surface calculation for non-displacement piles.
The unit toe resistance, qt, is computed in the following equations.
qt = 0.4 Nt’ L / D ≤ 4 Nt’ tsf for sand and gravel (2-24)
qt = 0.3 Nt’ L / D ≤ 3 Nt’ tsf for non-plastic silts (2-25)
in which, L is the pile embedment depth to the toe and D is the pile diameter or width.
Nt’ is the average corrected SPT blow count within the toe influence zone. Meyerhof
(1976) suggested the toe influence zone to be from 4D above the toe to 1D below the toe,
which was used in this study with the Meyerhof method.
In this study, the above procedures of computing the bearing capacity by the
Meyerhof method have been coded in a spreadsheet format using the computer program
Excel to accelerate the calculation process. As in the case of the other two methods
described above, the spreadsheet includes the Tomlinson method to compute the bearing
capacity of the sections of a pile in a soft to medium stiff clay layer with the average N
value not more than 20. The computed unit toe resistance is limited to the maximum
value for the soil friction angle as shown in Figure 2-4, in the same way as in the
Nordlund method. To estimate the limiting unit toe resistance, the corrected N value
from the toe influence zone (Nt’) is converted to the friction angle φ using Equation 2-16.
An example spread sheet for the Meyerhof method is included in Appendix A.
27
0
50
100
150
200
250
300
350
400
30 35 40 45
Angle of Internal Frcition (degree)
Lim
iting
Uni
t Toe
Res
ista
nce
(tsf)
Figure 2-4. Relationship between Maximum Unit Toe Resistance and Friction Angle
(Meyerhof, 1976)
28
CHAPTER 3. PILE LOAD TEST DATA
3.1 GENERAL DESCRIPTION OF NORTH CAROLINA GEOLOGY
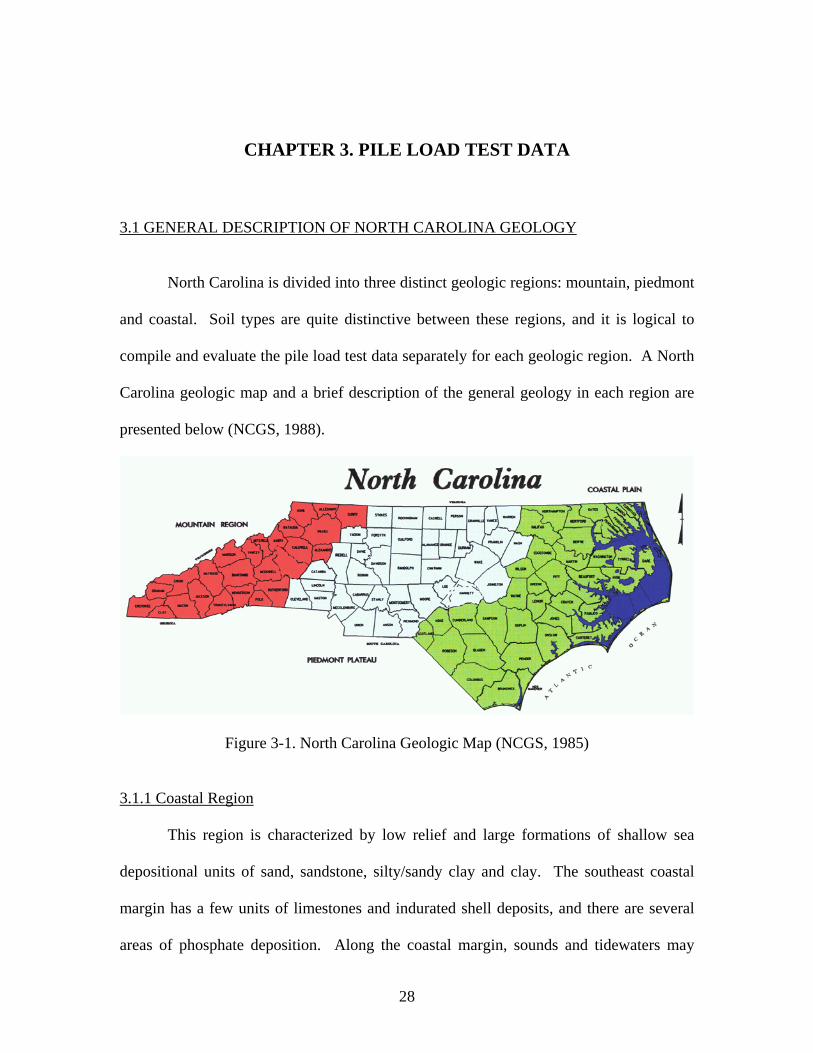
North Carolina is divided into three distinct geologic regions: mountain, piedmont
and coastal. Soil types are quite distinctive between these regions, and it is logical to
compile and evaluate the pile load test data separately for each geologic region. A North
Carolina geologic map and a brief description of the general geology in each region are
presented below (NCGS, 1988).
Figure 3-1. North Carolina Geologic Map (NCGS, 1985)
3.1.1 Coastal Region
This region is characterized by low relief and large formations of shallow sea
depositional units of sand, sandstone, silty/sandy clay and clay. The southeast coastal
margin has a few units of limestones and indurated shell deposits, and there are several
areas of phosphate deposition. Along the coastal margin, sounds and tidewaters may
29
contain high organic levels. The extreme east and northeast parts of the region contain
large swamps, sounds and estuary areas, which have deposited surficial unconsolidated
sands, silts, clays, peat and muck. The vertical soil profile in this region is generally
mixed soils with more granular soil deposits than fine grained soils. Four distinct
geologic sub-formations within this region are Black Creek, Peedee, Yorktown, and
Undifferentiated formations.
The Black Creek Formation consists typically of sands and clays that vary
abruptly with sand predominating in some places and clay in others. Soils in this
formation were laid down either in shallow sea water as in bays or estuaries or in deeper
marine waters. The Peedee Formation crops out in a belt east of the Black Creek
formation with a width ranging from 3 to 25 miles. The thickness of this formation
varies from 220 to 700 feet in Craven and Dare counties and to 900 feet near
Wilmington. The Peedee was laid down in shallow open marine waters and consists of
sands and impure limestone. Dark marine clay layers are found amongst the sand
deposits. The Yorktown Formation was deposited in the Miocene age and is exposed
over most of the western half of the coastal region north of the Neuse River. The
formation was laid down in shallow marine waters with its typical thickness of 200 feet.
It consists of clay, sand and shell marl. A blue clay that varies from arenaceous to
calcareous is the dominant feature in this formation. The clay contains lenses of sand and
shell marl. The Undifferentiated Formation encompasses all sediments in the coastal
region younger than the Miocene age. The deposits consist of fine to coarse sand, silty
sand, sandy silt and interbedded clay. The deposits are usually less than 30 feet thick, but
some deposits are much thicker.
30
3.1.2 Piedmont Region
This region encompasses rock types from plutonic granite intrusions and gneisses
to high metamorphic grade slates, mudstones and volcanic rocks. Outcrops are most
common in stream bottoms and on the steeper slopes, and conversely deep weathering is
most common on the uplands. In many locales, the thickness of weathered material can
vary greatly over a few tens of feet. Some rock types such as argillite in the Carolina
Slate belt are not deeply weathered, which results in shallow soil and saprolite layers.
This central region is also defined by the Durham Triassic basins. Soils in this region are
deeply weathered into sandy silts, silty clays and clays. The vertical soil profile in this
region is generally mixed soils with more fine grained soils than granular soils.
3.1.3 Mountain Region
The vast majority of rock cuts in North Carolina is in this region and involves
rock types consisting of gneisses, schists and metamorphosed sand, silt and mudstones.
Discontinuity orientations are rarely orthogonal or predictable because of the tectonic
history. Faster erosion rates limit deep weathering of the rock. Residual soils are
generally silty sands and clays are very limited, usually forming along narrow alluvial
floodplains. Many rocks weather into saprolite, which is usually a 20 to 100 SPT blow
count soil material and retains its rock structure. This allows it to fail in planar fashion
like rock or circular like a soil, or a combination of both. A distinct feature of this region
are colluvium deposits, which are usually wet deposits of landslide obviously jumbled
into a mass of unconsolidated material consisting of everything from sand to car-sized
rock blocks. Few pile load tests have been done by NCDOT in this region due to the fact
31
that piles are usually driven into shallow depths of dense soil or rock layers without a
significant concern of the bearing capacity.
3.2 PILE DRIVING ANALYZER (PDA) DATA
NCDOT has performed many pile driving analyzer (PDA) tests over the past 16
years to measure the actual performance of pile driving. PDA is a computerized system
that applies Case Method (Goble, et al., 1975) equations on measured pile dynamic data
in order to determine, among other quantities, the pile’s ultimate bearing capacity. The
wave propagation data are received from piezoelectric accelerometers and strain
transducers attached near the top of the pile. The most useful and convenient quantities
for measurement are force and acceleration at the pile top. Forces are measured from the
strain transducers. As the transducer is deformed by the passing stress wave, signals
proportional to the strain magnitude are generated. Acceleration measurements can be
made using any of a number of commercially available accelerometers modified to be
attached to the pile. The result of the measurement activity is matching records of force
and velocity along the pile in the ground. These two quantities are particularly useful in
the application of one-dimensional wave mechanics to the analysis of pile driving. In
addition, since force and velocity are known to be proportional as long as wave
propagation is in one direction only, a check of this proportionality provides a
verification of the correctness of the two independent measurements.
When a pile is driven into the soil, the soil is greatly disturbed. As the soil
surrounding the pile recovers from the driving disturbance, a time dependent change in
pile capacity often occurs. The pile capacity may increase with time due to soil setup
32
effects or decrease due to soil relaxation. Therefore, the actual pile capacity should be
measured a sufficient time after pile driving to account for soil setup or relaxation effects.
For this reason, PDA tests are often performed with restrike of the piles that have already
been installed. However, this is not always the case due to the practical restrictions of the
construction schedule or cost considerations.
All of the NCDOT bridge construction projects, in which a PDA test was
performed, were reviewed. One hundred and forth (140) PDA/CAPWAP cases were
found to be usable in this study. The summary of PDA/CAPWAP data is included in
Appendix B. One hundred twenty nine (129) of the case studies are from the coastal area
and the remaining eleven (11) are from the piedmont area. There are no PDA data
available for the mountain area, and therefore the mountain area is not considered in this
study. The majority of the PDA were performed on prestressed concrete square piles in
the coastal area. The sizes of the concrete piles ranged from 12” square to 30” square.
Details of the data for each region and pile type are described in the following sections of
this chapter.
3.2.1 Case Pile Wave Analysis Program (CAPWAP)
The PDA data are further evaluated by the rigorous numerical analysis program
CAPWAP (Hannigan, 1990) to determine static bearing capacity, and to distinguish
between the toe resistance and the distribution of the skin resistance along the pile. In the
analysis of pile driving, there are three unknowns: pile forces, pile motion and boundary
conditions. If two of the three are known, the third can be calculated. It is not possible to
determine the soil response from the measured force and velocity records. However, it is
possible to analyze a pile under the action of either the force or the velocity record, with
33
an assumed soil model. The other unused record is then plotted and compared against an
equivalent computed plot. Differences between the measured and the computed curves
lead an experienced engineer to conclusions regarding the differences between the actual
soil behavior and the assumed set of soil parameters. He may then modify these
parameters to obtain a better match in a second iteration. CAPWAP was written to
facilitate this type of analysis.
Soil reaction forces can be accurately expressed as a function of pile motion only.
It is generally assumed that the soil reaction consists of elasto-plastic, and linear viscous
components. In this way, the soil model has at each point three unknowns: the ultimate
static resistance, the quake or elastic soil deformation, and a damping constant. An error
minimization procedure is used to assess the differences between the measured and
computed curves, and quantify the sum of these differences with the so-called Match
Quality Number (MQN). MQN = SUM ( ABS (fjc – fjm) / Fi ) where, fjc and fjm are the
computed and the measured pile top variables at time step j, respectively. SUM stands
for a summation over a time period and Fi is the pile top force at the time of the
maximum pile top velocity. Reducing the MQN to a minimum value subject to several
constraints will result in a unique solution.
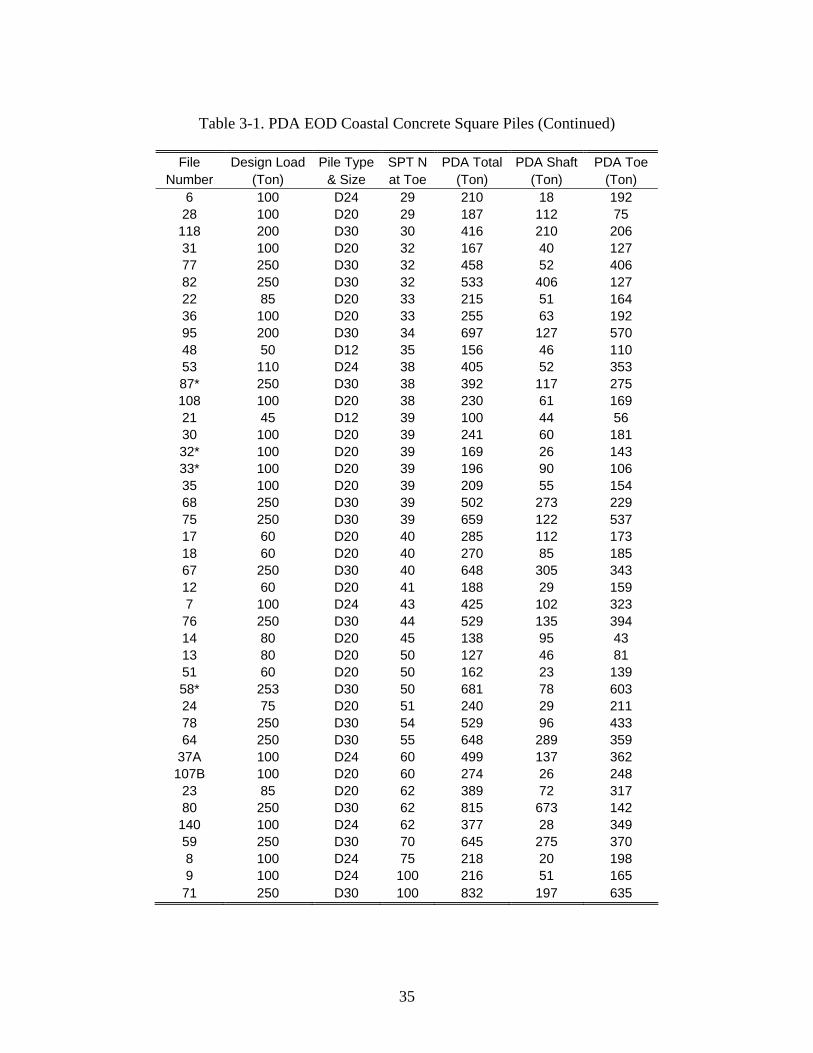
3.2.2 Coastal Area Concrete Square Piles
There are 85 end of driving (EOD) and 26 beginning of restrike (BOR) PDA data
available under this category from 32 different project sites. The summary of EOD and
BOR data is shown in Table 3-1 and Table 3-2, respectively. Twenty of the PDA files
have both EOD and BOR data for the same pile, and they are marked by an asterisk (*)
after the file number (Tables 3-1 and 3-2). The size of pile ranges from 12” to 30”

34
Table 3-1. PDA EOD Coastal Concrete Square Piles
File Design Load Pile Type SPT N PDA Total PDA Shaft PDA Toe
Number (Ton) & Size at Toe (Ton) (Ton) (Ton) 85* 250 D30 4 227 114 113 98 200 D30 8 519 308 211 56* 80 D20 12 142 81 61 105 45 D12 12 85 4 81 4C* 100 D20 13 220 157 63 86* 250 D30 13 135 48 87 94* 237 D30 13 315 135 180 70 250 D30 14 890 235 655 92* 200 D30 14 392 110 282 122 100 D20 14 297 108 189 4B 100 D24 15 417 128 289 39 70 D16 15 144 50 94
60B* 250 D30 16 797 212 585 90 200 D30 16 302 65 237 69 250 D30 17 502 339 163 89* 237 D30 17 355 55 300
60A* 250 D30 18 683 462 221 45 30 D12 19 75 28 47 61 250 D30 19 553 443 110 74* 250 D30 19 565 241 324 141 100 D24 19 378 165 213 93* 200 D30 20 177 111 66 66 250 D30 21 574 455 119 99 200 D30 21 603 145 458
101 45 D12 21 75 13 62 115 100 D24 21 316 51 265 4A* 100 D24 22 107 30 77 46 60 D20 22 155 9 146 91* 100 D20 22 213 81 132 1* 100 D20 23 116 35 81 11 85 D20 23 91 22 69 54 70 D20 23 143 25 118
37B 100 D24 24 270 88 182 52 60 D20 25 211 36 175 55 60 D20 25 238 15 223
114 100 D24 26 223 127 96 19 80 D24 27 285 46 239 62 250 D30 27 505 312 193
107A* 100 D20 27 222 26 196 96* 200 D30 28 575 179 396 117 200 D30 28 461 153 308
3 55 D20 29 156 117 39 5 50 D12 29 117 24.5 92.5
35
Table 3-1. PDA EOD Coastal Concrete Square Piles (Continued)
File Design Load Pile Type SPT N PDA Total PDA Shaft PDA Toe
Number (Ton) & Size at Toe (Ton) (Ton) (Ton) 6 100 D24 29 210 18 192 28 100 D20 29 187 112 75
118 200 D30 30 416 210 206 31 100 D20 32 167 40 127 77 250 D30 32 458 52 406 82 250 D30 32 533 406 127 22 85 D20 33 215 51 164 36 100 D20 33 255 63 192 95 200 D30 34 697 127 570 48 50 D12 35 156 46 110 53 110 D24 38 405 52 353 87* 250 D30 38 392 117 275 108 100 D20 38 230 61 169 21 45 D12 39 100 44 56 30 100 D20 39 241 60 181 32* 100 D20 39 169 26 143 33* 100 D20 39 196 90 106 35 100 D20 39 209 55 154 68 250 D30 39 502 273 229 75 250 D30 39 659 122 537 17 60 D20 40 285 112 173 18 60 D20 40 270 85 185 67 250 D30 40 648 305 343 12 60 D20 41 188 29 159 7 100 D24 43 425 102 323 76 250 D30 44 529 135 394 14 80 D20 45 138 95 43 13 80 D20 50 127 46 81 51 60 D20 50 162 23 139 58* 253 D30 50 681 78 603 24 75 D20 51 240 29 211 78 250 D30 54 529 96 433 64 250 D30 55 648 289 359
37A 100 D24 60 499 137 362 107B 100 D20 60 274 26 248
23 85 D20 62 389 72 317 80 250 D30 62 815 673 142
140 100 D24 62 377 28 349 59 250 D30 70 645 275 370 8 100 D24 75 218 20 198 9 100 D24 100 216 51 165 71 250 D30 100 832 197 635
36
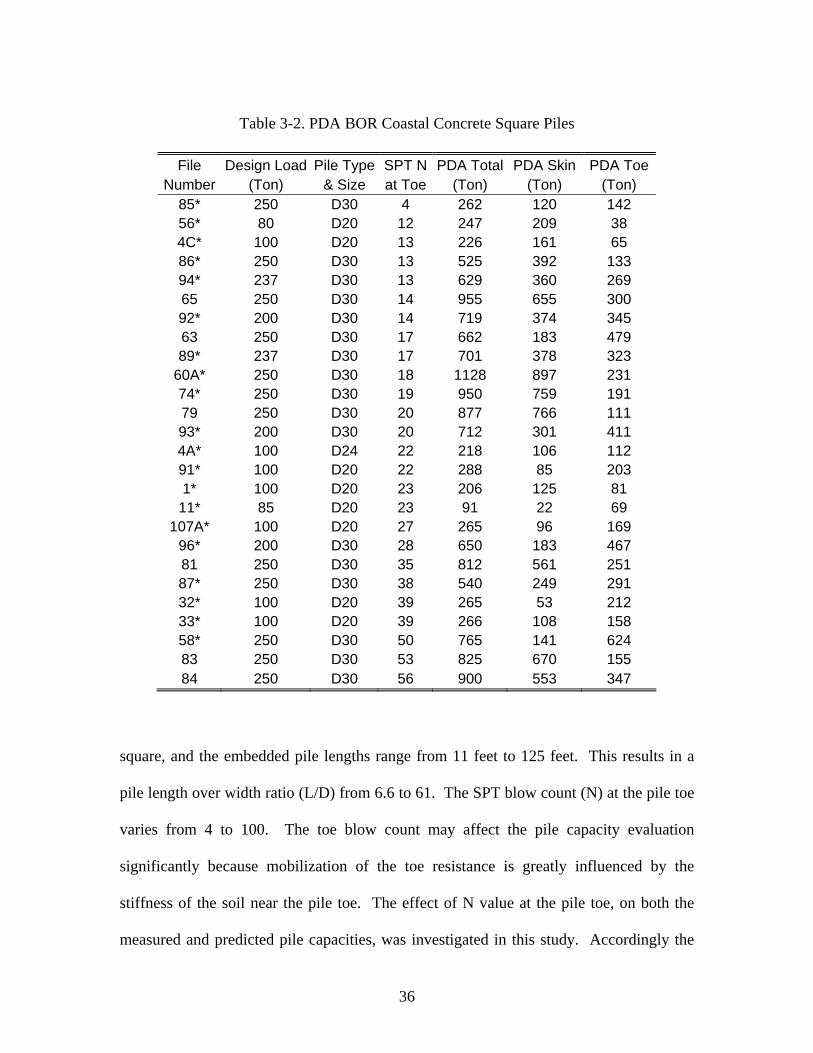
Table 3-2. PDA BOR Coastal Concrete Square Piles
File Design Load Pile Type SPT N PDA Total PDA Skin PDA Toe
Number (Ton) & Size at Toe (Ton) (Ton) (Ton) 85* 250 D30 4 262 120 142 56* 80 D20 12 247 209 38 4C* 100 D20 13 226 161 65 86* 250 D30 13 525 392 133 94* 237 D30 13 629 360 269 65 250 D30 14 955 655 300 92* 200 D30 14 719 374 345 63 250 D30 17 662 183 479 89* 237 D30 17 701 378 323
60A* 250 D30 18 1128 897 231 74* 250 D30 19 950 759 191 79 250 D30 20 877 766 111 93* 200 D30 20 712 301 411 4A* 100 D24 22 218 106 112 91* 100 D20 22 288 85 203 1* 100 D20 23 206 125 81
11* 85 D20 23 91 22 69 107A* 100 D20 27 265 96 169
96* 200 D30 28 650 183 467 81 250 D30 35 812 561 251 87* 250 D30 38 540 249 291 32* 100 D20 39 265 53 212 33* 100 D20 39 266 108 158 58* 250 D30 50 765 141 624 83 250 D30 53 825 670 155 84 250 D30 56 900 553 347
square, and the embedded pile lengths range from 11 feet to 125 feet. This results in a
pile length over width ratio (L/D) from 6.6 to 61. The SPT blow count (N) at the pile toe
varies from 4 to 100. The toe blow count may affect the pile capacity evaluation
significantly because mobilization of the toe resistance is greatly influenced by the
stiffness of the soil near the pile toe. The effect of N value at the pile toe, on both the
measured and predicted pile capacities, was investigated in this study. Accordingly the
37
PDA data were sub-grouped for N-value less than or equal to 40 and for N-value more
than 40.
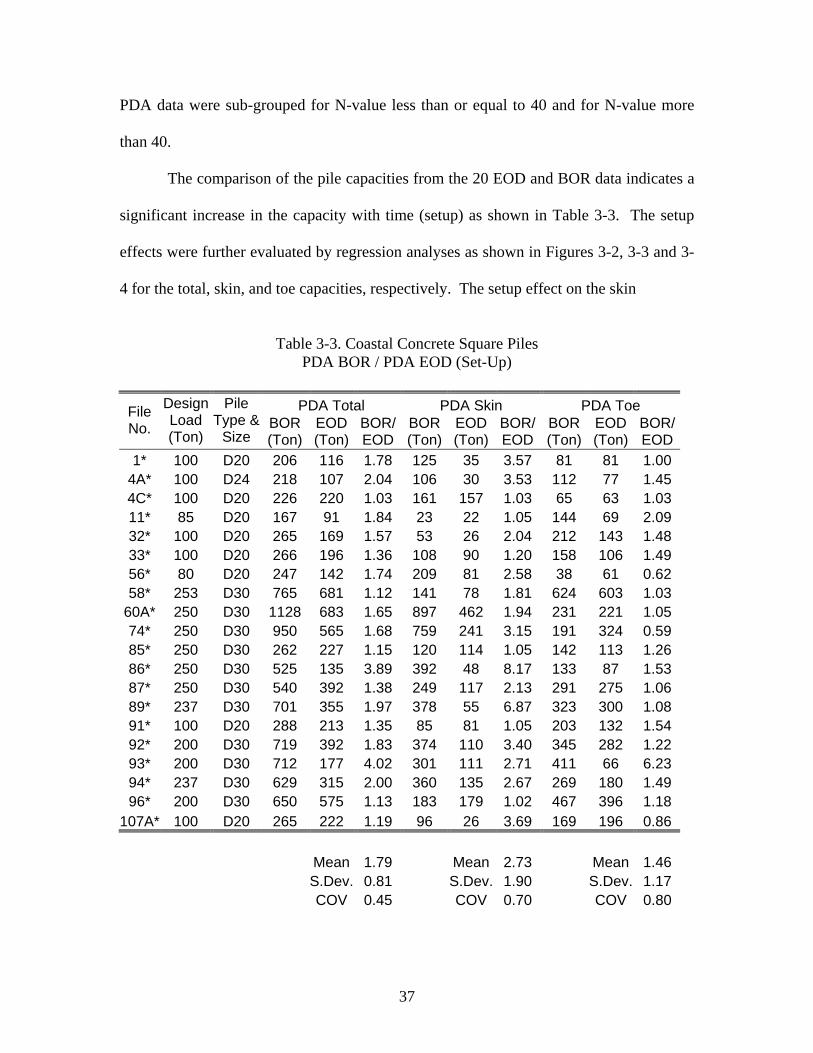
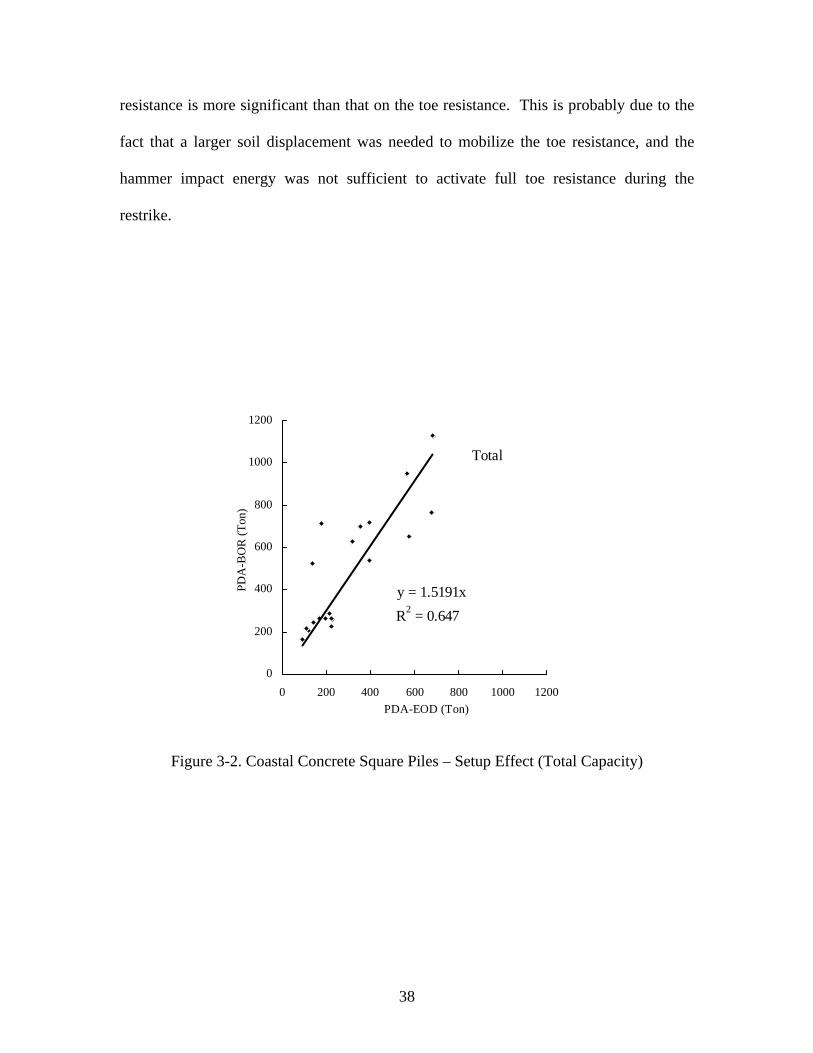
The comparison of the pile capacities from the 20 EOD and BOR data indicates a
significant increase in the capacity with time (setup) as shown in Table 3-3. The setup
effects were further evaluated by regression analyses as shown in Figures 3-2, 3-3 and 3-
4 for the total, skin, and toe capacities, respectively. The setup effect on the skin
Table 3-3. Coastal Concrete Square Piles
PDA BOR / PDA EOD (Set-Up)
PDA Total PDA Skin PDA Toe File No.
Design Load (Ton)
Pile Type &
Size BOR (Ton)
EOD (Ton)
BOR/ EOD
BOR (Ton)
EOD (Ton)
BOR/ EOD
BOR (Ton)
EOD (Ton)
BOR/ EOD
1* 100 D20 206 116 1.78 125 35 3.57 81 81 1.00 4A* 100 D24 218 107 2.04 106 30 3.53 112 77 1.45 4C* 100 D20 226 220 1.03 161 157 1.03 65 63 1.03 11* 85 D20 167 91 1.84 23 22 1.05 144 69 2.09 32* 100 D20 265 169 1.57 53 26 2.04 212 143 1.48 33* 100 D20 266 196 1.36 108 90 1.20 158 106 1.49 56* 80 D20 247 142 1.74 209 81 2.58 38 61 0.62 58* 253 D30 765 681 1.12 141 78 1.81 624 603 1.03
60A* 250 D30 1128 683 1.65 897 462 1.94 231 221 1.05 74* 250 D30 950 565 1.68 759 241 3.15 191 324 0.59 85* 250 D30 262 227 1.15 120 114 1.05 142 113 1.26 86* 250 D30 525 135 3.89 392 48 8.17 133 87 1.53 87* 250 D30 540 392 1.38 249 117 2.13 291 275 1.06 89* 237 D30 701 355 1.97 378 55 6.87 323 300 1.08 91* 100 D20 288 213 1.35 85 81 1.05 203 132 1.54 92* 200 D30 719 392 1.83 374 110 3.40 345 282 1.22 93* 200 D30 712 177 4.02 301 111 2.71 411 66 6.23 94* 237 D30 629 315 2.00 360 135 2.67 269 180 1.49 96* 200 D30 650 575 1.13 183 179 1.02 467 396 1.18
107A* 100 D20 265 222 1.19 96 26 3.69 169 196 0.86 Mean 1.79 Mean 2.73 Mean 1.46 S.Dev. 0.81 S.Dev. 1.90 S.Dev. 1.17 COV 0.45 COV 0.70 COV 0.80
38
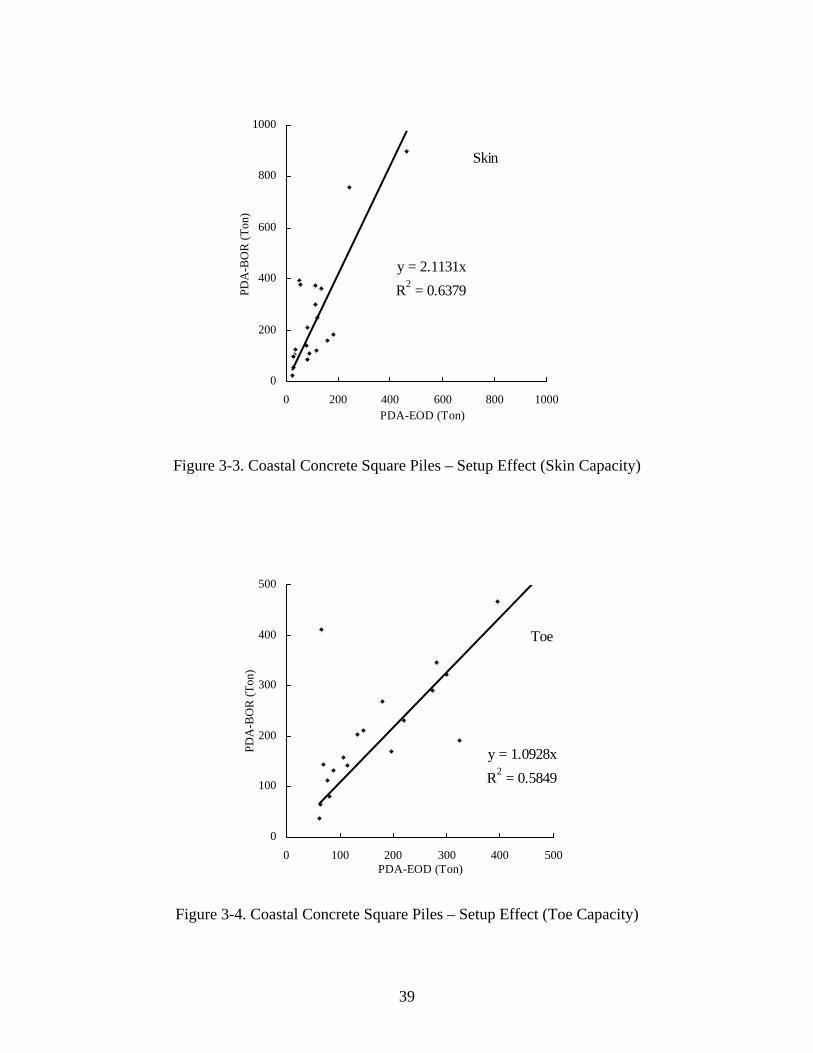
resistance is more significant than that on the toe resistance. This is probably due to the
fact that a larger soil displacement was needed to mobilize the toe resistance, and the
hammer impact energy was not sufficient to activate full toe resistance during the
restrike.
Total
y = 1.5191xR2 = 0.647
0
200
400
600
800
1000
1200
0 200 400 600 800 1000 1200PDA-EOD (Ton)
PDA
-BO
R (T
on)
Figure 3-2. Coastal Concrete Square Piles – Setup Effect (Total Capacity)
39
Skin
y = 2.1131xR2 = 0.6379
0
200
400
600
800
1000
0 200 400 600 800 1000PDA-EOD (Ton)
PDA
-BO
R (T
on)
Figure 3-3. Coastal Concrete Square Piles – Setup Effect (Skin Capacity)
Toe
y = 1.0928xR2 = 0.5849
0
100
200
300
400
500
0 100 200 300 400 500PDA-EOD (Ton)
PDA
-BO
R (T
on)
Figure 3-4. Coastal Concrete Square Piles – Setup Effect (Toe Capacity)
40
3.2.3 Jetting Effects
Piles are sometimes jetted to a prescribed depth in order to attain the pile
penetration depths required for the lateral stability of the structure. The use of jetting
results in a severe soil disturbance, and its effect on both the measured and predicted pile
capacities should be considered. However, there is no rational means to quantify the
percentage of the pile capacity reduction due to jetting, other than a pile load test. For
this reason, the PDA data were sub-grouped for the piles driven with jetting and those
without jetting in order to consider the jetting effects on the ratio of the measured
capacity over the predicted capacity. In the pile capacity prediction using the static
analysis methods, the SPT N value of one (1) was assumed for the soil layers where the
pile penetration was performed by jetting. Actual SPT blow count of the soil disturbed
by jetting may be more than one. But it would not be much larger than one, because piles
penetrate into the disturbed ground by their own weights when jetting is used. This
assumption is justified for the Vesic method, in which a minimum unit skin resistance of
0.126 ton per square foot (tsf) is used regardless of the SPT blow counts or the relative
density of the soil. This assumption is also justified for the Nordlund method because the
low range N-values (say, less than 5) would make little difference in the correlation of the
N-values with the soil friction angle (φ). This assumption may underpredict the pile skin
capacity in the Meyerhof method; however, this will be accounted for in the bias factors
and in the process of the resistance factor calibration. Of the 85 EOD PDA data, 50 piles
were initially installed with jetting, and 15 piles, out of the 26 PDA restrike data, were
initially installed with jetting.
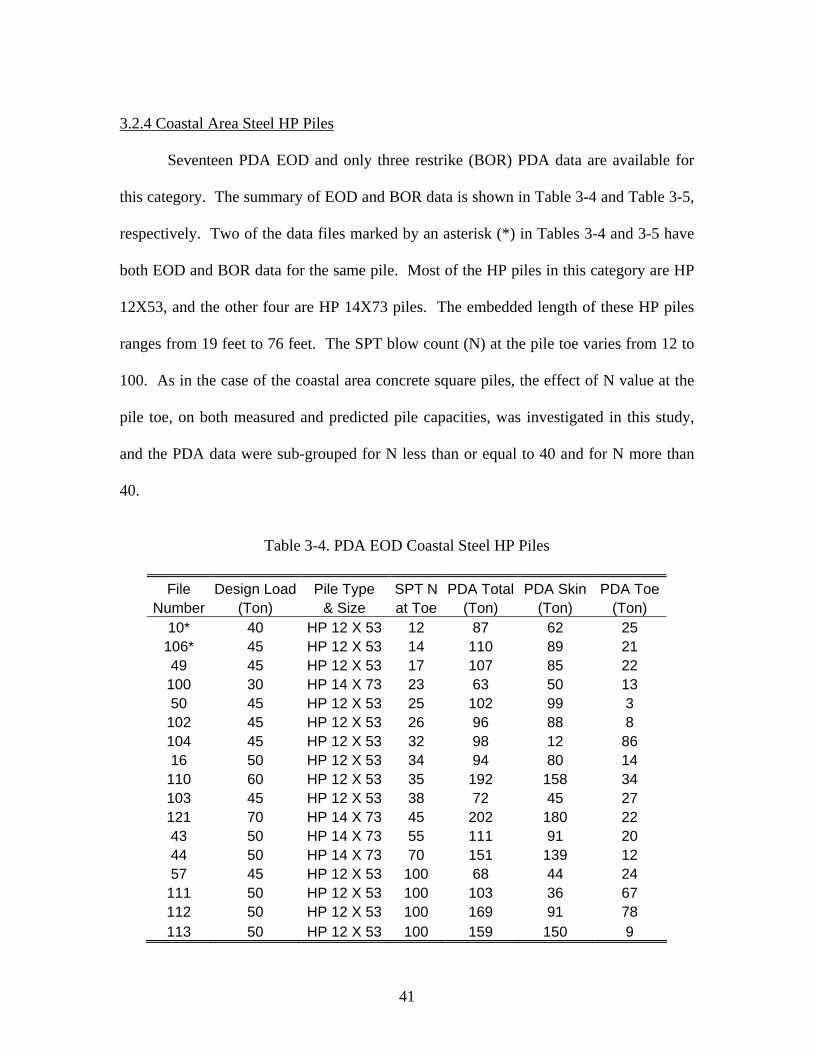
41
3.2.4 Coastal Area Steel HP Piles
Seventeen PDA EOD and only three restrike (BOR) PDA data are available for
this category. The summary of EOD and BOR data is shown in Table 3-4 and Table 3-5,
respectively. Two of the data files marked by an asterisk (*) in Tables 3-4 and 3-5 have
both EOD and BOR data for the same pile. Most of the HP piles in this category are HP
12X53, and the other four are HP 14X73 piles. The embedded length of these HP piles
ranges from 19 feet to 76 feet. The SPT blow count (N) at the pile toe varies from 12 to
100. As in the case of the coastal area concrete square piles, the effect of N value at the
pile toe, on both measured and predicted pile capacities, was investigated in this study,
and the PDA data were sub-grouped for N less than or equal to 40 and for N more than
40.
Table 3-4. PDA EOD Coastal Steel HP Piles
File Design Load Pile Type SPT N PDA Total PDA Skin PDA Toe
Number (Ton) & Size at Toe (Ton) (Ton) (Ton) 10* 40 HP 12 X 53 12 87 62 25
106* 45 HP 12 X 53 14 110 89 21 49 45 HP 12 X 53 17 107 85 22
100 30 HP 14 X 73 23 63 50 13 50 45 HP 12 X 53 25 102 99 3
102 45 HP 12 X 53 26 96 88 8 104 45 HP 12 X 53 32 98 12 86 16 50 HP 12 X 53 34 94 80 14
110 60 HP 12 X 53 35 192 158 34 103 45 HP 12 X 53 38 72 45 27 121 70 HP 14 X 73 45 202 180 22 43 50 HP 14 X 73 55 111 91 20 44 50 HP 14 X 73 70 151 139 12 57 45 HP 12 X 53 100 68 44 24
111 50 HP 12 X 53 100 103 36 67 112 50 HP 12 X 53 100 169 91 78 113 50 HP 12 X 53 100 159 150 9
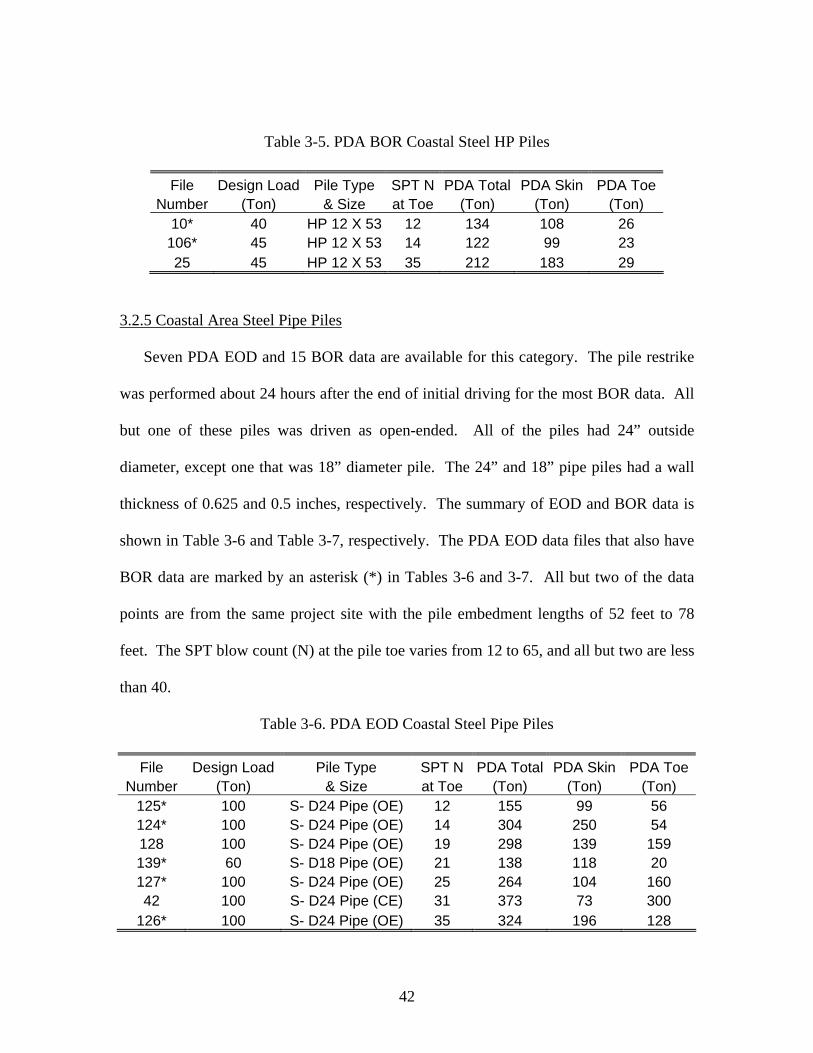
42
Table 3-5. PDA BOR Coastal Steel HP Piles
File Design Load Pile Type SPT N PDA Total PDA Skin PDA ToeNumber (Ton) & Size at Toe (Ton) (Ton) (Ton)
10* 40 HP 12 X 53 12 134 108 26 106* 45 HP 12 X 53 14 122 99 23 25 45 HP 12 X 53 35 212 183 29
3.2.5 Coastal Area Steel Pipe Piles
Seven PDA EOD and 15 BOR data are available for this category. The pile restrike
was performed about 24 hours after the end of initial driving for the most BOR data. All
but one of these piles was driven as open-ended. All of the piles had 24” outside
diameter, except one that was 18” diameter pile. The 24” and 18” pipe piles had a wall
thickness of 0.625 and 0.5 inches, respectively. The summary of EOD and BOR data is
shown in Table 3-6 and Table 3-7, respectively. The PDA EOD data files that also have
BOR data are marked by an asterisk (*) in Tables 3-6 and 3-7. All but two of the data
points are from the same project site with the pile embedment lengths of 52 feet to 78
feet. The SPT blow count (N) at the pile toe varies from 12 to 65, and all but two are less
than 40.
Table 3-6. PDA EOD Coastal Steel Pipe Piles
File Design Load Pile Type SPT N PDA Total PDA Skin PDA ToeNumber (Ton) & Size at Toe (Ton) (Ton) (Ton)
125* 100 S- D24 Pipe (OE) 12 155 99 56 124* 100 S- D24 Pipe (OE) 14 304 250 54 128 100 S- D24 Pipe (OE) 19 298 139 159 139* 60 S- D18 Pipe (OE) 21 138 118 20 127* 100 S- D24 Pipe (OE) 25 264 104 160 42 100 S- D24 Pipe (CE) 31 373 73 300
126* 100 S- D24 Pipe (OE) 35 324 196 128
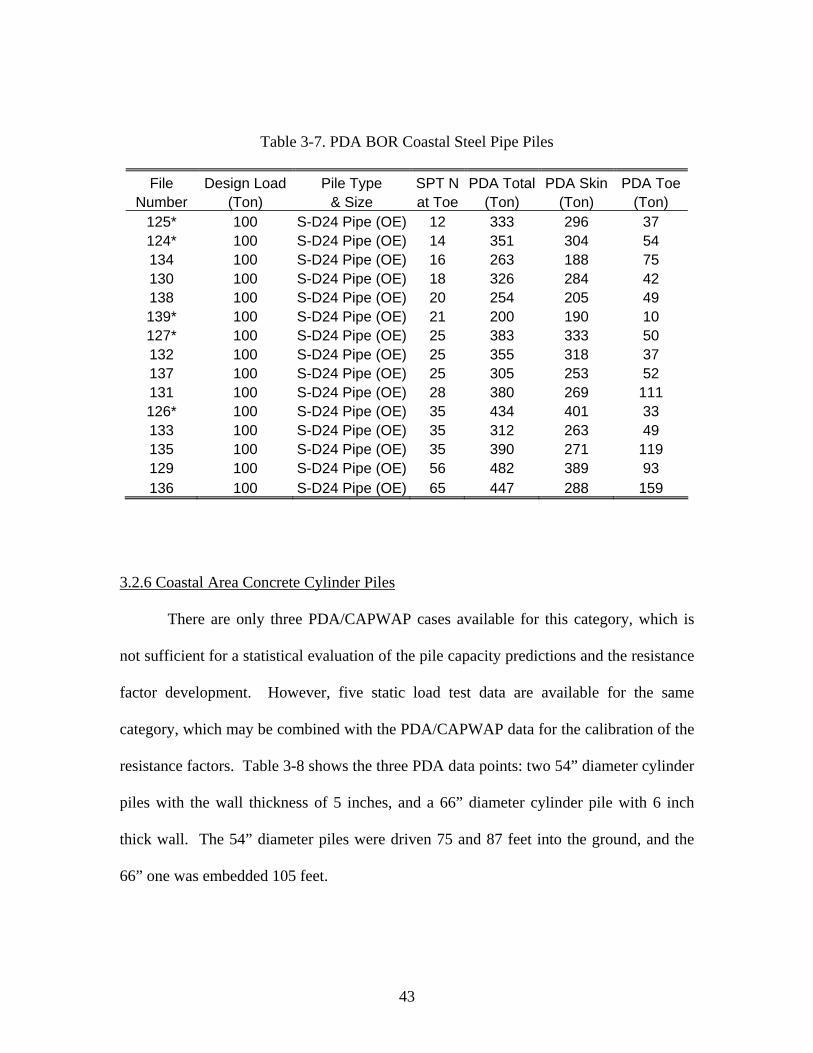
43
Table 3-7. PDA BOR Coastal Steel Pipe Piles
File Design Load Pile Type SPT N PDA Total PDA Skin PDA ToeNumber (Ton) & Size at Toe (Ton) (Ton) (Ton)
125* 100 S-D24 Pipe (OE) 12 333 296 37 124* 100 S-D24 Pipe (OE) 14 351 304 54 134 100 S-D24 Pipe (OE) 16 263 188 75 130 100 S-D24 Pipe (OE) 18 326 284 42 138 100 S-D24 Pipe (OE) 20 254 205 49 139* 100 S-D24 Pipe (OE) 21 200 190 10 127* 100 S-D24 Pipe (OE) 25 383 333 50 132 100 S-D24 Pipe (OE) 25 355 318 37 137 100 S-D24 Pipe (OE) 25 305 253 52 131 100 S-D24 Pipe (OE) 28 380 269 111 126* 100 S-D24 Pipe (OE) 35 434 401 33 133 100 S-D24 Pipe (OE) 35 312 263 49 135 100 S-D24 Pipe (OE) 35 390 271 119 129 100 S-D24 Pipe (OE) 56 482 389 93 136 100 S-D24 Pipe (OE) 65 447 288 159
3.2.6 Coastal Area Concrete Cylinder Piles
There are only three PDA/CAPWAP cases available for this category, which is
not sufficient for a statistical evaluation of the pile capacity predictions and the resistance
factor development. However, five static load test data are available for the same
category, which may be combined with the PDA/CAPWAP data for the calibration of the
resistance factors. Table 3-8 shows the three PDA data points: two 54” diameter cylinder
piles with the wall thickness of 5 inches, and a 66” diameter cylinder pile with 6 inch
thick wall. The 54” diameter piles were driven 75 and 87 feet into the ground, and the
66” one was embedded 105 feet.
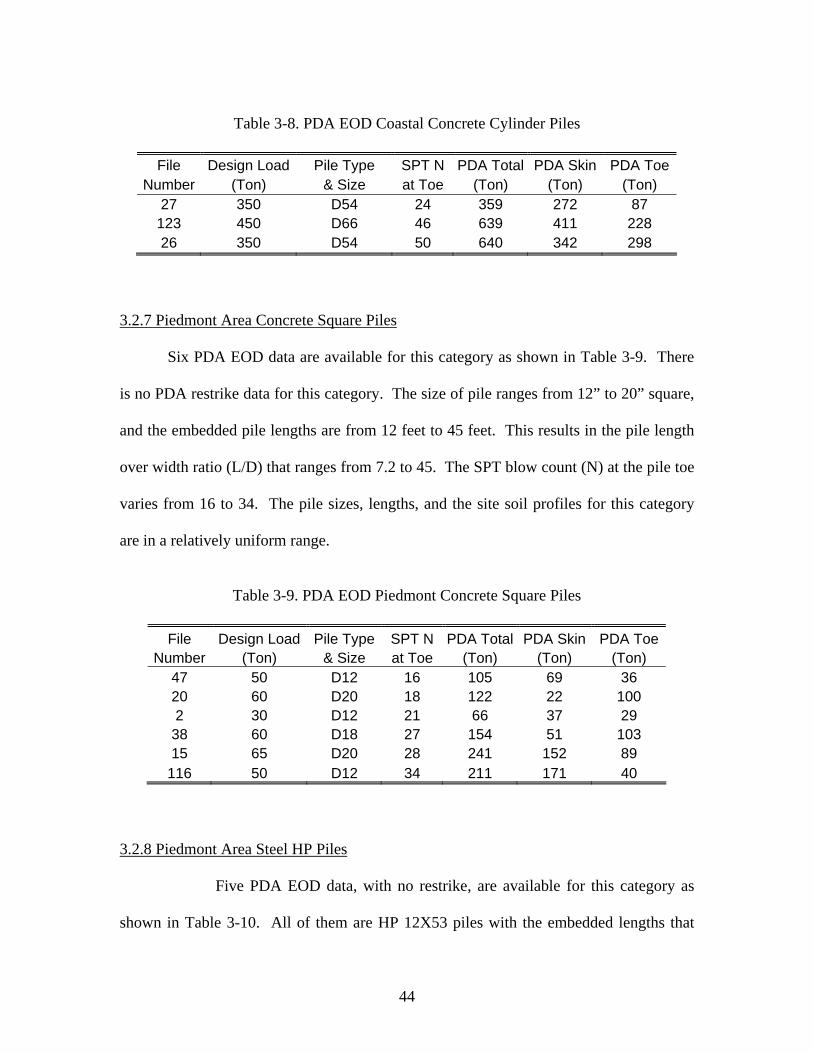
44
Table 3-8. PDA EOD Coastal Concrete Cylinder Piles
File Design Load Pile Type SPT N PDA Total PDA Skin PDA Toe
Number (Ton) & Size at Toe (Ton) (Ton) (Ton) 27 350 D54 24 359 272 87
123 450 D66 46 639 411 228 26 350 D54 50 640 342 298
3.2.7 Piedmont Area Concrete Square Piles
Six PDA EOD data are available for this category as shown in Table 3-9. There
is no PDA restrike data for this category. The size of pile ranges from 12” to 20” square,
and the embedded pile lengths are from 12 feet to 45 feet. This results in the pile length
over width ratio (L/D) that ranges from 7.2 to 45. The SPT blow count (N) at the pile toe
varies from 16 to 34. The pile sizes, lengths, and the site soil profiles for this category
are in a relatively uniform range.
Table 3-9. PDA EOD Piedmont Concrete Square Piles
File Design Load Pile Type SPT N PDA Total PDA Skin PDA Toe
Number (Ton) & Size at Toe (Ton) (Ton) (Ton) 47 50 D12 16 105 69 36 20 60 D20 18 122 22 100 2 30 D12 21 66 37 29
38 60 D18 27 154 51 103 15 65 D20 28 241 152 89
116 50 D12 34 211 171 40
3.2.8 Piedmont Area Steel HP Piles
Five PDA EOD data, with no restrike, are available for this category as
shown in Table 3-10. All of them are HP 12X53 piles with the embedded lengths that
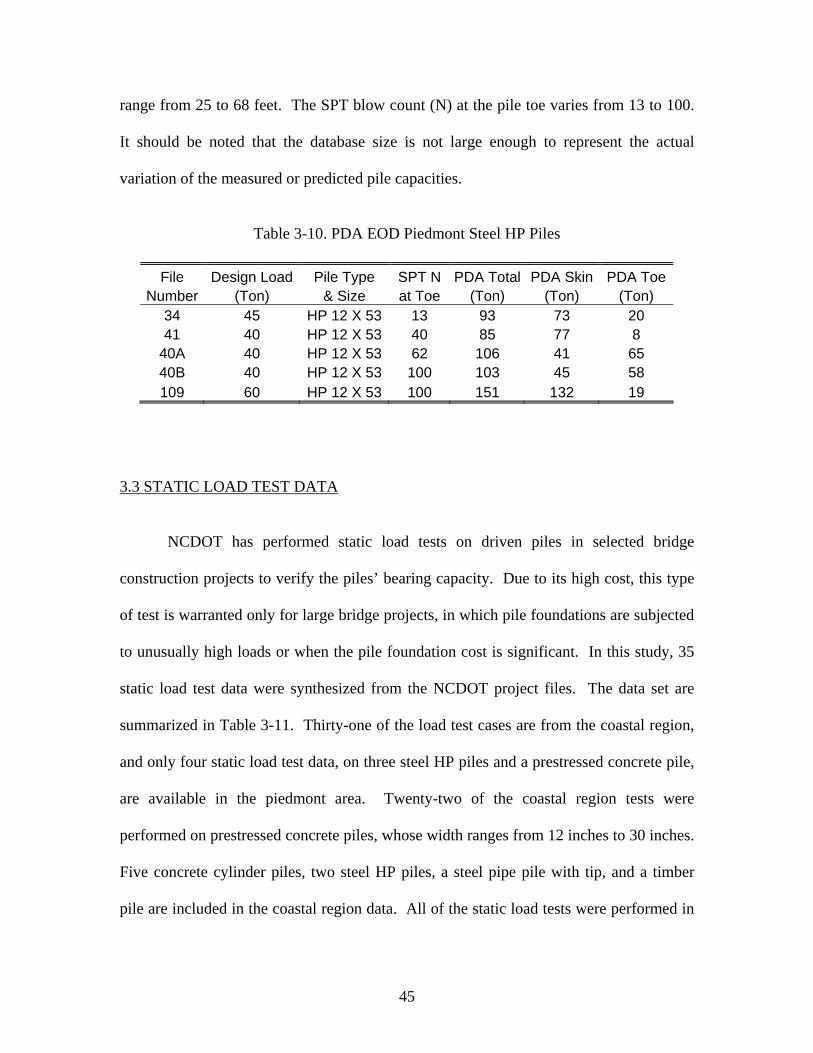
45
range from 25 to 68 feet. The SPT blow count (N) at the pile toe varies from 13 to 100.
It should be noted that the database size is not large enough to represent the actual
variation of the measured or predicted pile capacities.
Table 3-10. PDA EOD Piedmont Steel HP Piles
File Design Load Pile Type SPT N PDA Total PDA Skin PDA Toe
Number (Ton) & Size at Toe (Ton) (Ton) (Ton) 34 45 HP 12 X 53 13 93 73 20 41 40 HP 12 X 53 40 85 77 8
40A 40 HP 12 X 53 62 106 41 65 40B 40 HP 12 X 53 100 103 45 58 109 60 HP 12 X 53 100 151 132 19
3.3 STATIC LOAD TEST DATA
NCDOT has performed static load tests on driven piles in selected bridge
construction projects to verify the piles’ bearing capacity. Due to its high cost, this type
of test is warranted only for large bridge projects, in which pile foundations are subjected
to unusually high loads or when the pile foundation cost is significant. In this study, 35
static load test data were synthesized from the NCDOT project files. The data set are
summarized in Table 3-11. Thirty-one of the load test cases are from the coastal region,
and only four static load test data, on three steel HP piles and a prestressed concrete pile,
are available in the piedmont area. Twenty-two of the coastal region tests were
performed on prestressed concrete piles, whose width ranges from 12 inches to 30 inches.
Five concrete cylinder piles, two steel HP piles, a steel pipe pile with tip, and a timber
pile are included in the coastal region data. All of the static load tests were performed in
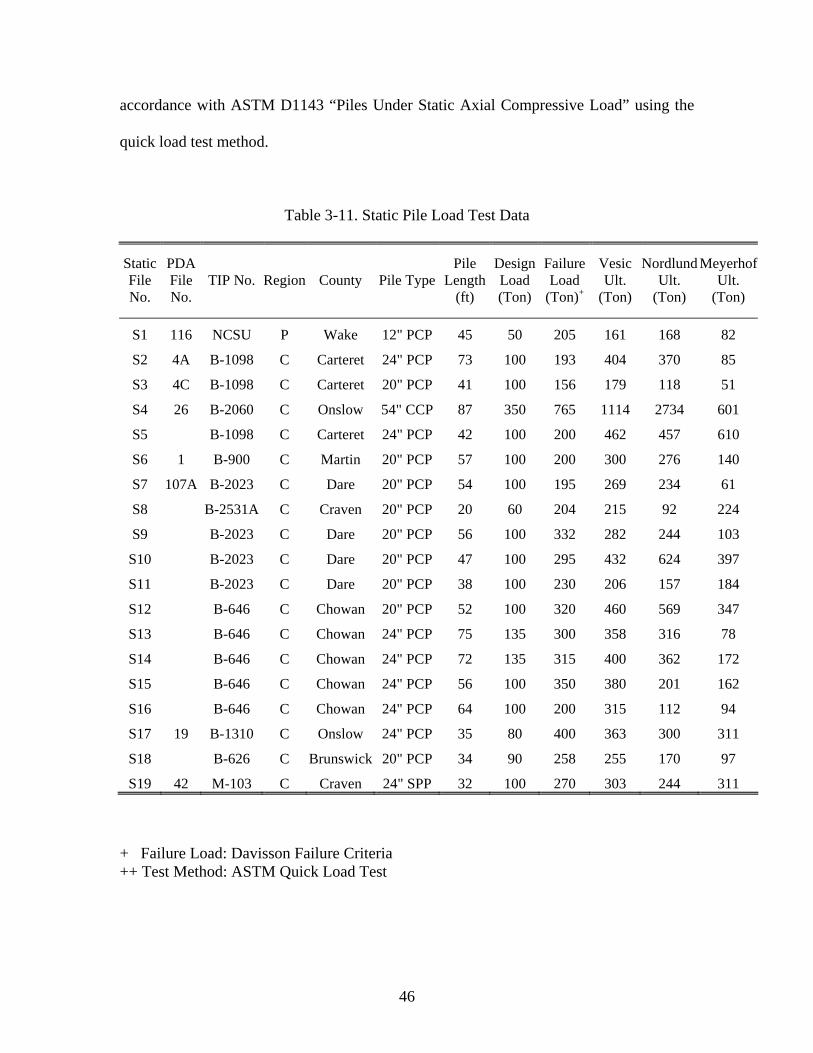
46
accordance with ASTM D1143 “Piles Under Static Axial Compressive Load” using the
quick load test method.
Table 3-11. Static Pile Load Test Data
Static File No.
PDA File No.
TIP No. Region County Pile TypePile
Length (ft)
Design Load (Ton)
Failure Load
(Ton)+
Vesic Ult.
(Ton)
Nordlund Ult.
(Ton)
Meyerhof Ult.
(Ton)
S1 116 NCSU P Wake 12" PCP 45 50 205 161 168 82
S2 4A B-1098 C Carteret 24" PCP 73 100 193 404 370 85
S3 4C B-1098 C Carteret 20" PCP 41 100 156 179 118 51
S4 26 B-2060 C Onslow 54" CCP 87 350 765 1114 2734 601
S5 B-1098 C Carteret 24" PCP 42 100 200 462 457 610
S6 1 B-900 C Martin 20" PCP 57 100 200 300 276 140
S7 107A B-2023 C Dare 20" PCP 54 100 195 269 234 61
S8 B-2531A C Craven 20" PCP 20 60 204 215 92 224
S9 B-2023 C Dare 20" PCP 56 100 332 282 244 103
S10 B-2023 C Dare 20" PCP 47 100 295 432 624 397
S11 B-2023 C Dare 20" PCP 38 100 230 206 157 184
S12 B-646 C Chowan 20" PCP 52 100 320 460 569 347
S13 B-646 C Chowan 24" PCP 75 135 300 358 316 78
S14 B-646 C Chowan 24" PCP 72 135 315 400 362 172
S15 B-646 C Chowan 24" PCP 56 100 350 380 201 162
S16 B-646 C Chowan 24" PCP 64 100 200 315 112 94
S17 19 B-1310 C Onslow 24" PCP 35 80 400 363 300 311
S18 B-626 C Brunswick 20" PCP 34 90 258 255 170 97
S19 42 M-103 C Craven 24" SPP 32 100 270 303 244 311
+ Failure Load: Davisson Failure Criteria ++ Test Method: ASTM Quick Load Test
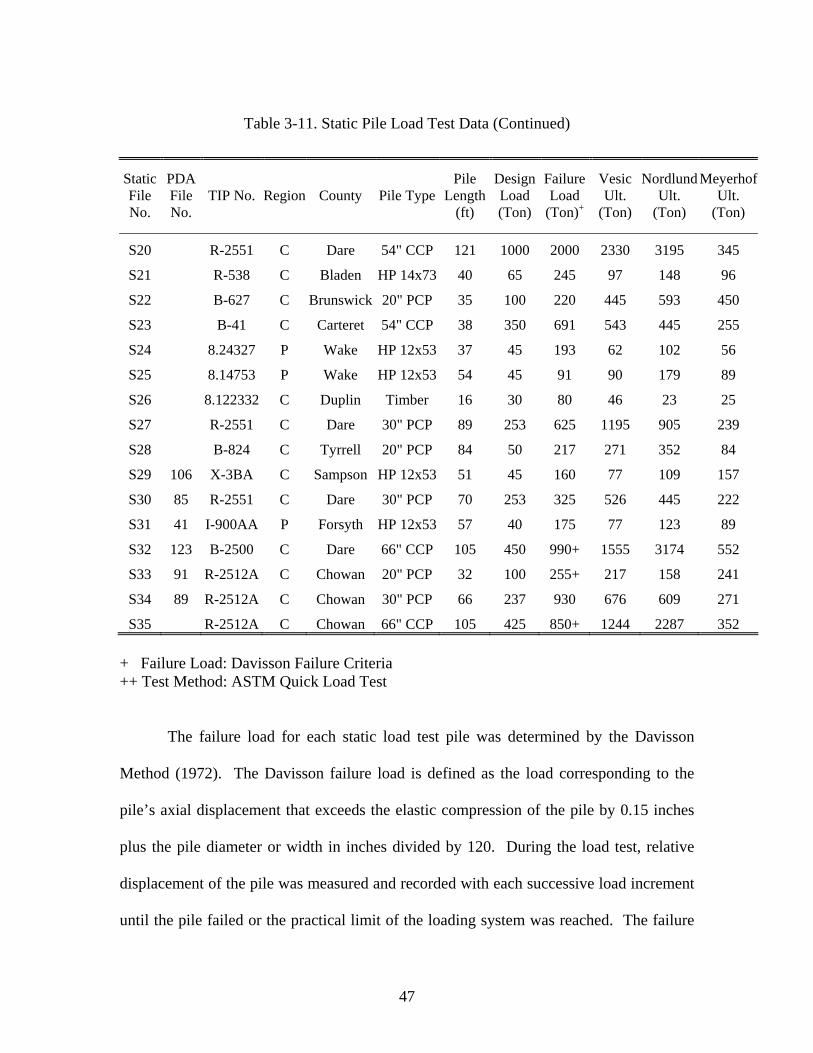
47
Table 3-11. Static Pile Load Test Data (Continued)
Static File No.
PDA File No.
TIP No. Region County Pile TypePile
Length (ft)
Design Load (Ton)
Failure Load
(Ton)+
Vesic Ult.
(Ton)
Nordlund Ult.
(Ton)
Meyerhof Ult.
(Ton)
S20 R-2551 C Dare 54" CCP 121 1000 2000 2330 3195 345
S21 R-538 C Bladen HP 14x73 40 65 245 97 148 96
S22 B-627 C Brunswick 20" PCP 35 100 220 445 593 450
S23 B-41 C Carteret 54" CCP 38 350 691 543 445 255
S24 8.24327 P Wake HP 12x53 37 45 193 62 102 56
S25 8.14753 P Wake HP 12x53 54 45 91 90 179 89
S26 8.122332 C Duplin Timber 16 30 80 46 23 25
S27 R-2551 C Dare 30" PCP 89 253 625 1195 905 239
S28 B-824 C Tyrrell 20" PCP 84 50 217 271 352 84
S29 106 X-3BA C Sampson HP 12x53 51 45 160 77 109 157
S30 85 R-2551 C Dare 30" PCP 70 253 325 526 445 222
S31 41 I-900AA P Forsyth HP 12x53 57 40 175 77 123 89
S32 123 B-2500 C Dare 66" CCP 105 450 990+ 1555 3174 552
S33 91 R-2512A C Chowan 20" PCP 32 100 255+ 217 158 241
S34 89 R-2512A C Chowan 30" PCP 66 237 930 676 609 271
S35 R-2512A C Chowan 66" CCP 105 425 850+ 1244 2287 352
+ Failure Load: Davisson Failure Criteria ++ Test Method: ASTM Quick Load Test
The failure load for each static load test pile was determined by the Davisson
Method (1972). The Davisson failure load is defined as the load corresponding to the
pile’s axial displacement that exceeds the elastic compression of the pile by 0.15 inches
plus the pile diameter or width in inches divided by 120. During the load test, relative
displacement of the pile was measured and recorded with each successive load increment
until the pile failed or the practical limit of the loading system was reached. The failure
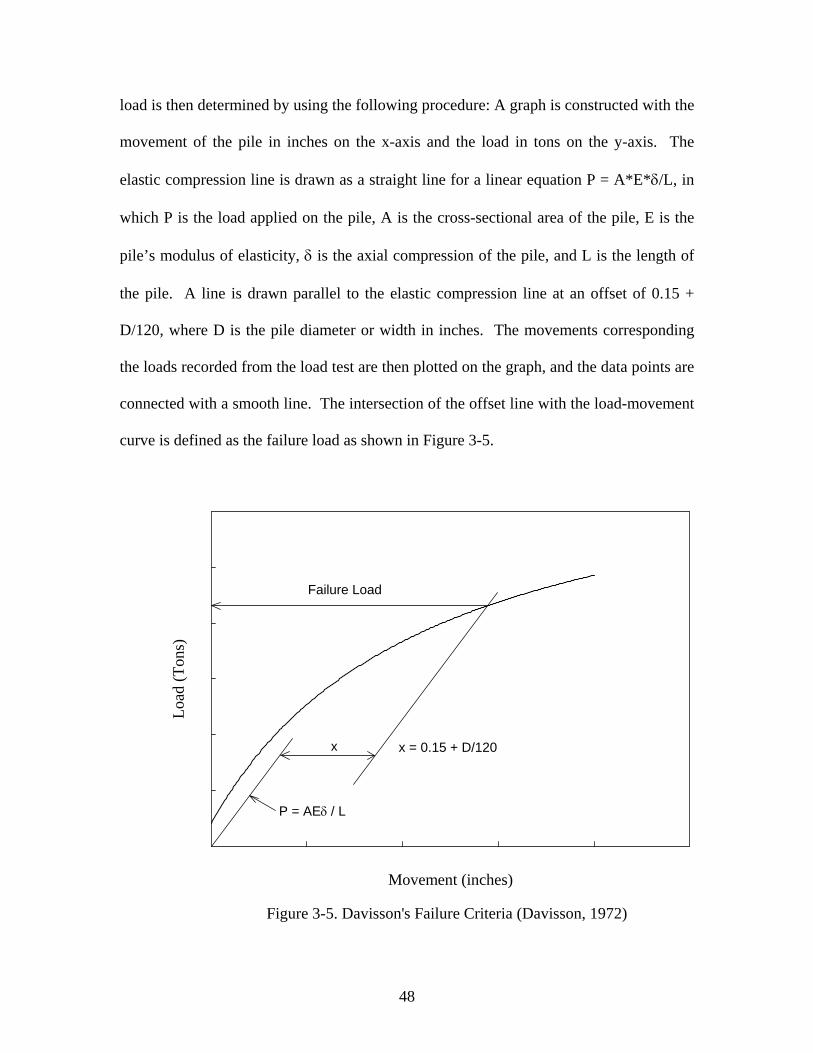
48
load is then determined by using the following procedure: A graph is constructed with the
movement of the pile in inches on the x-axis and the load in tons on the y-axis. The
elastic compression line is drawn as a straight line for a linear equation P = A*E*δ/L, in
which P is the load applied on the pile, A is the cross-sectional area of the pile, E is the
pile’s modulus of elasticity, δ is the axial compression of the pile, and L is the length of
the pile. A line is drawn parallel to the elastic compression line at an offset of 0.15 +
D/120, where D is the pile diameter or width in inches. The movements corresponding
the loads recorded from the load test are then plotted on the graph, and the data points are
connected with a smooth line. The intersection of the offset line with the load-movement
curve is defined as the failure load as shown in Figure 3-5.
Figure 3-5. Davisson's Failure Criteria (Davisson, 1972)
Movement (inches)
Load
(Ton
s)
Failure Load
x
P = AEδ / L
x = 0.15 + D/120
49
Information on the pile, soil profiles and the load test data were reviewed for the
purpose of extracting information to be used in the reliability analysis. The soils at each
test site were characterized based on the available geotechnical reports. The static
analysis of the pile bearing capacity was performed using the three methods (Vesic,
Nordlund, and Meyerhof) presented in Chapter 2. The predicted static pile capacities
were then compared with the load test results, and a bias factor, which is the ratio of the
measured capacity over the predicted capacity, was computed for each data case.
Bayesian updating technique was utilized to improve the statistics of the bias factors,
where appropriate. The statistical parameters of the bias factors were incorporated in the
calibration of the resistance factors. Details of the bias factors and the Bayesian updating
will be presented in the following chapter.
50
CHAPTER 4. RELIABILITY ANALYSIS
4.1 INTRODUCTION
The first step in evaluating the reliability or probability of failure of a pile
foundation is to decide on specific performance criteria in terms of a limit state function
and the relevant load and resistance parameters. Assume that there are two basic random
variables, the load (Q) and the resistance (R). The limit state function can be defined as
g(R, Q) = 0, which can be a linear or nonlinear function of R and Q. Failure occurs when
g(R, Q) < 0 and the probability of failure, Pf, is expressed by the integral (Haldar, et al.,
2000)
Pf = ∫∫<0
, ),(g
QR drdqqrf (4.1)
in which, f R,Q (r,q) is the joint probability density function for the basic random variables
R and Q, and the integration is performed over the failure region, that is, g < 0. If the
random variables are statistically independent, then the joint probability density function
may be replaced by the product of the individual probability density functions (PDF) in
the integral.
Equation 4.1 is considered to be the basic equation of reliability analysis, and the
computation of Pf by the integration is called the full distributional approach. In general,
the joint probability density function of random variables is practically not possible to
obtain, and the PDF of individual random variables may not always be available in
explicit form. Even if this information is available, evaluating the multiple integral is
very difficult. Therefore, analytical approximations of this integral are employed to
51
simplify the computation of the reliability or the probability of failure. These methods of
approximations are First-Order Reliability Methods (FORM) and Second-Order
Reliability Methods (SORM). In this study, two types of FORM, Mean Value First-
Order Second Moment (MVFOSM) method and Advanced First-Order Second Moment
(AFOSM) method, are used to evaluate the reliability of the current design methods for
axial capacity of driven piles. In the FORM, the reliability or the probability of failure is
expressed in terms of reliability index (β), which can be computed using the statistics of
the loads and resistance.
4.2 LOAD STATISTICS
This study employed the load statistics and the load factors from the current
AASHTO LRFD Specifications (1998) to make the pile foundation design consistent
with the bridge superstructure design. The load combination of dead load (QD) and live
load (QL) for the Strength Case I (AASHTO, 1998) was chosen for the reliability analysis
because this combination is considered the most conservative for the calibration of the
resistance factors. The load factors used in the reliability analysis are 1.25 for dead load
and 1.75 for live load. The load statistics are presented in terms of mean and coefficient
of variation (COV) of the bias factors. The bias factor is defined as the ratio of the
observed actual load over the nominal load. Nowak (1992) presented the results of
statistical analysis of highway dead and live loads, as summarized in Table 4.1. The
largest variation is the weight of the asphalt wearing surface placed on the bridge deck.
However, this is a very small percent of the total bridge dead load and can be ignored in
the calculation of the mean and COV of the overall bias factor of the dead load.
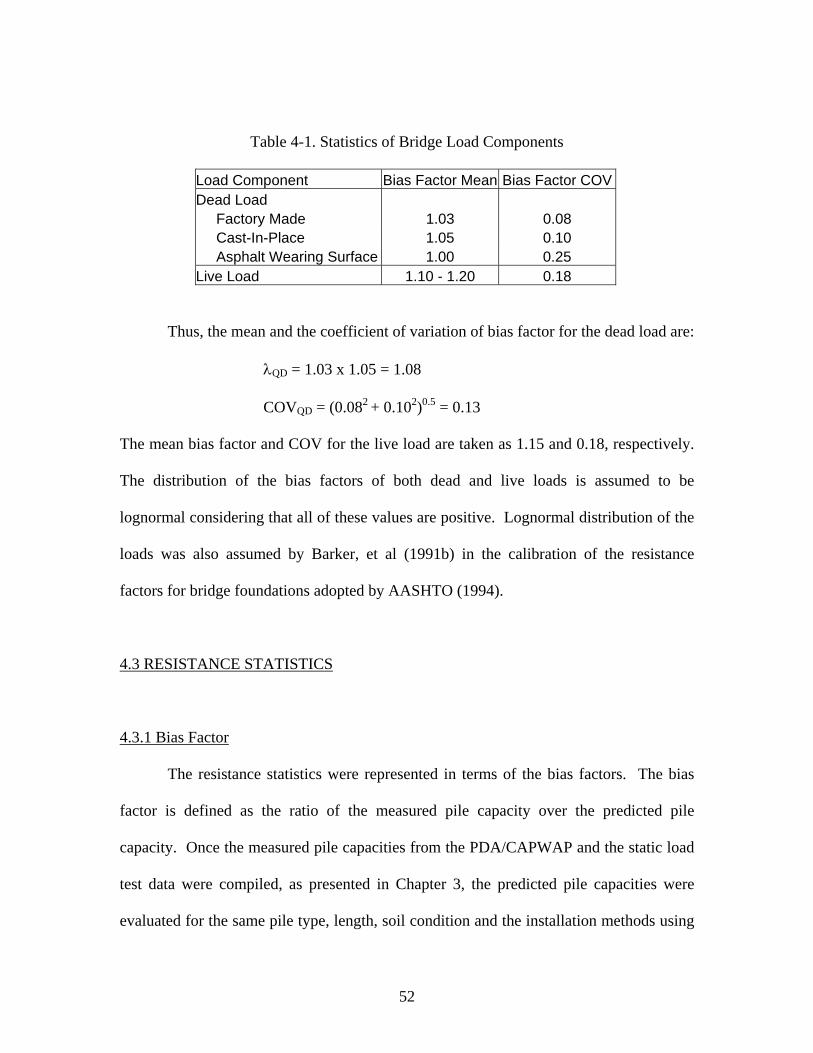
52
Table 4-1. Statistics of Bridge Load Components
Load Component Bias Factor Mean Bias Factor COV Dead Load Factory Made 1.03 0.08 Cast-In-Place 1.05 0.10 Asphalt Wearing Surface 1.00 0.25 Live Load 1.10 - 1.20 0.18
Thus, the mean and the coefficient of variation of bias factor for the dead load are:
λQD = 1.03 x 1.05 = 1.08
COVQD = (0.082 + 0.102)0.5 = 0.13
The mean bias factor and COV for the live load are taken as 1.15 and 0.18, respectively.
The distribution of the bias factors of both dead and live loads is assumed to be
lognormal considering that all of these values are positive. Lognormal distribution of the
loads was also assumed by Barker, et al (1991b) in the calibration of the resistance
factors for bridge foundations adopted by AASHTO (1994).
4.3 RESISTANCE STATISTICS
4.3.1 Bias Factor
The resistance statistics were represented in terms of the bias factors. The bias
factor is defined as the ratio of the measured pile capacity over the predicted pile
capacity. Once the measured pile capacities from the PDA/CAPWAP and the static load
test data were compiled, as presented in Chapter 3, the predicted pile capacities were
evaluated for the same pile type, length, soil condition and the installation methods using
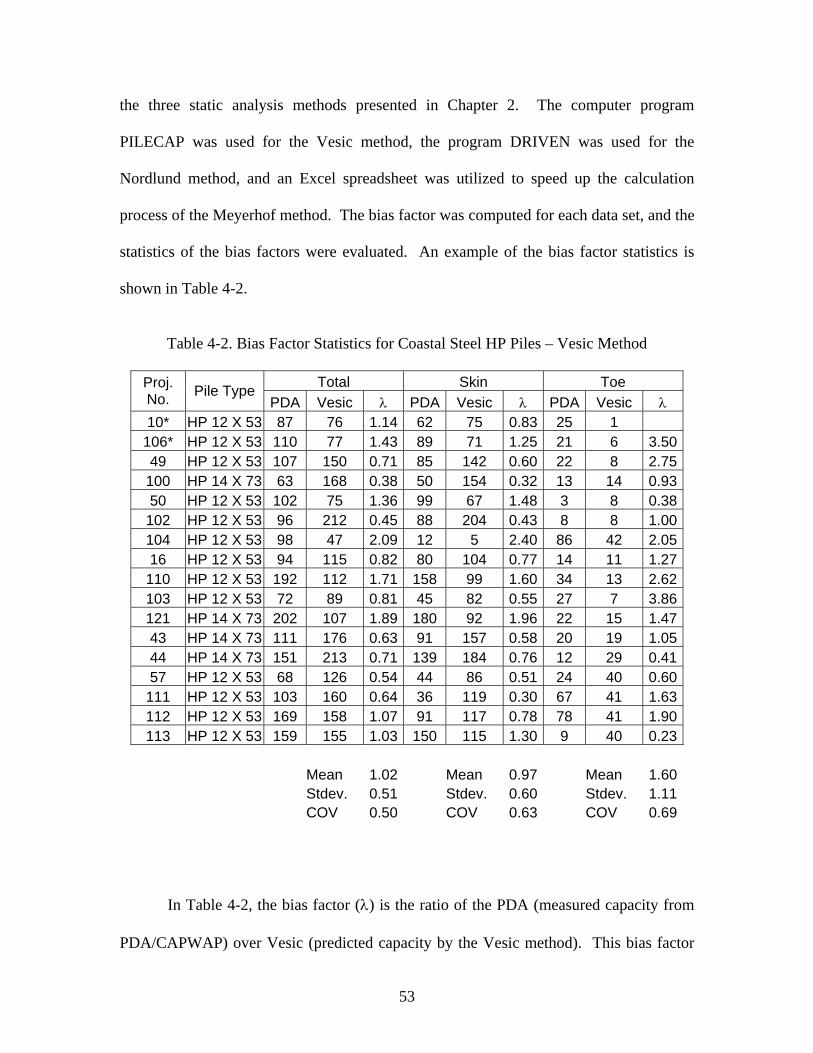
53
the three static analysis methods presented in Chapter 2. The computer program
PILECAP was used for the Vesic method, the program DRIVEN was used for the
Nordlund method, and an Excel spreadsheet was utilized to speed up the calculation
process of the Meyerhof method. The bias factor was computed for each data set, and the
statistics of the bias factors were evaluated. An example of the bias factor statistics is
shown in Table 4-2.
Table 4-2. Bias Factor Statistics for Coastal Steel HP Piles – Vesic Method
Total Skin Toe Proj. No. Pile Type
PDA Vesic λ PDA Vesic λ PDA Vesic λ 10* HP 12 X 53 87 76 1.14 62 75 0.83 25 1
106* HP 12 X 53 110 77 1.43 89 71 1.25 21 6 3.5049 HP 12 X 53 107 150 0.71 85 142 0.60 22 8 2.75
100 HP 14 X 73 63 168 0.38 50 154 0.32 13 14 0.9350 HP 12 X 53 102 75 1.36 99 67 1.48 3 8 0.38
102 HP 12 X 53 96 212 0.45 88 204 0.43 8 8 1.00104 HP 12 X 53 98 47 2.09 12 5 2.40 86 42 2.0516 HP 12 X 53 94 115 0.82 80 104 0.77 14 11 1.27
110 HP 12 X 53 192 112 1.71 158 99 1.60 34 13 2.62103 HP 12 X 53 72 89 0.81 45 82 0.55 27 7 3.86121 HP 14 X 73 202 107 1.89 180 92 1.96 22 15 1.4743 HP 14 X 73 111 176 0.63 91 157 0.58 20 19 1.0544 HP 14 X 73 151 213 0.71 139 184 0.76 12 29 0.4157 HP 12 X 53 68 126 0.54 44 86 0.51 24 40 0.60
111 HP 12 X 53 103 160 0.64 36 119 0.30 67 41 1.63112 HP 12 X 53 169 158 1.07 91 117 0.78 78 41 1.90113 HP 12 X 53 159 155 1.03 150 115 1.30 9 40 0.23
Mean 1.02 Mean 0.97 Mean 1.60 Stdev. 0.51 Stdev. 0.60 Stdev. 1.11 COV 0.50 COV 0.63 COV 0.69
In Table 4-2, the bias factor (λ) is the ratio of the PDA (measured capacity from
PDA/CAPWAP) over Vesic (predicted capacity by the Vesic method). This bias factor
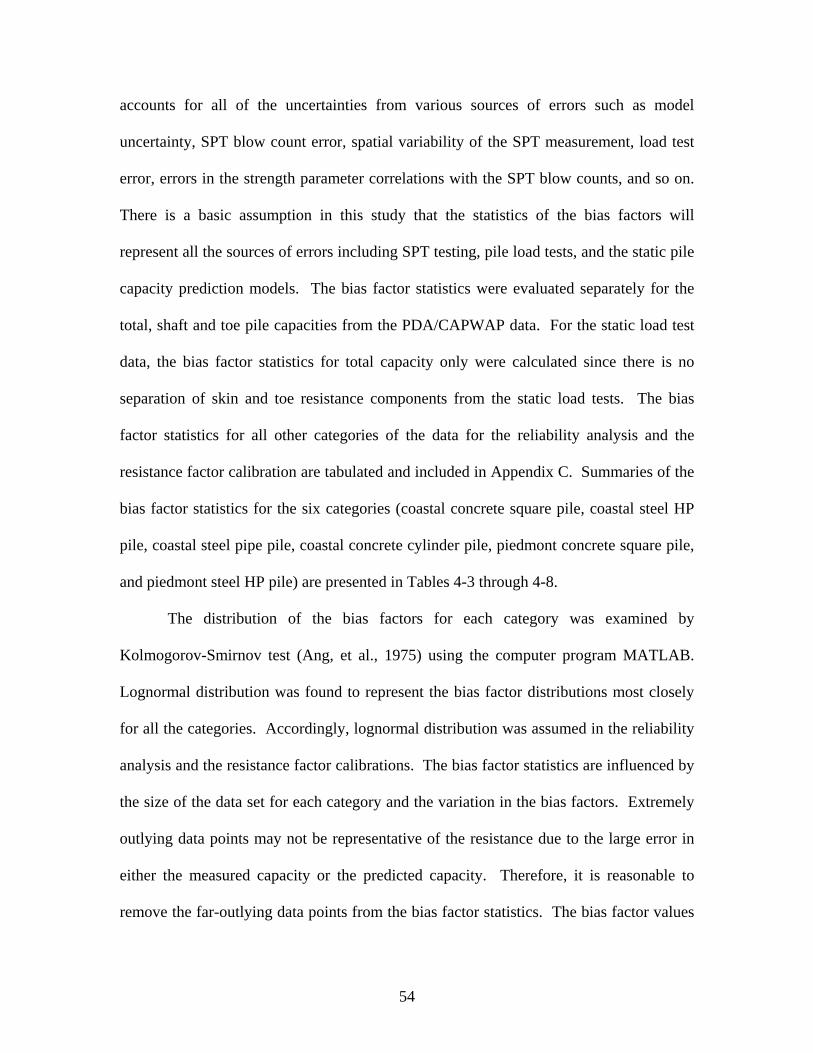
54
accounts for all of the uncertainties from various sources of errors such as model
uncertainty, SPT blow count error, spatial variability of the SPT measurement, load test
error, errors in the strength parameter correlations with the SPT blow counts, and so on.
There is a basic assumption in this study that the statistics of the bias factors will
represent all the sources of errors including SPT testing, pile load tests, and the static pile
capacity prediction models. The bias factor statistics were evaluated separately for the
total, shaft and toe pile capacities from the PDA/CAPWAP data. For the static load test
data, the bias factor statistics for total capacity only were calculated since there is no
separation of skin and toe resistance components from the static load tests. The bias
factor statistics for all other categories of the data for the reliability analysis and the
resistance factor calibration are tabulated and included in Appendix C. Summaries of the
bias factor statistics for the six categories (coastal concrete square pile, coastal steel HP
pile, coastal steel pipe pile, coastal concrete cylinder pile, piedmont concrete square pile,
and piedmont steel HP pile) are presented in Tables 4-3 through 4-8.
The distribution of the bias factors for each category was examined by
Kolmogorov-Smirnov test (Ang, et al., 1975) using the computer program MATLAB.
Lognormal distribution was found to represent the bias factor distributions most closely
for all the categories. Accordingly, lognormal distribution was assumed in the reliability
analysis and the resistance factor calibrations. The bias factor statistics are influenced by
the size of the data set for each category and the variation in the bias factors. Extremely
outlying data points may not be representative of the resistance due to the large error in
either the measured capacity or the predicted capacity. Therefore, it is reasonable to
remove the far-outlying data points from the bias factor statistics. The bias factor values
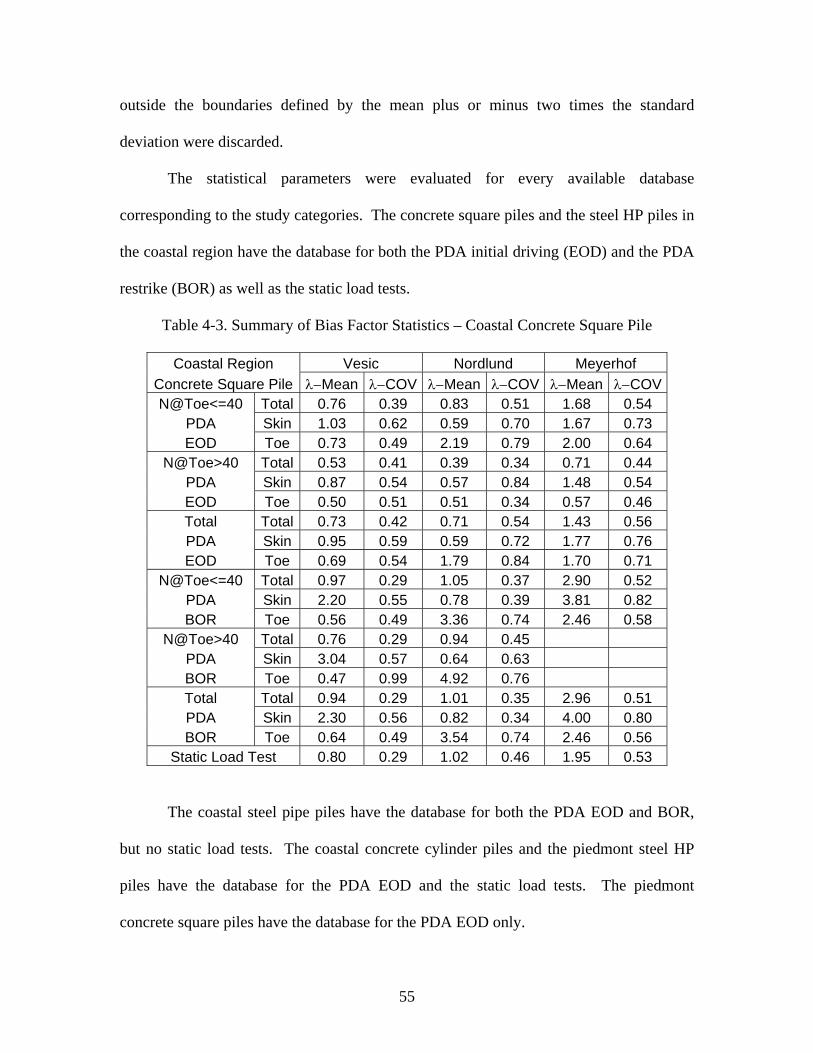
55
outside the boundaries defined by the mean plus or minus two times the standard
deviation were discarded.
The statistical parameters were evaluated for every available database
corresponding to the study categories. The concrete square piles and the steel HP piles in
the coastal region have the database for both the PDA initial driving (EOD) and the PDA
restrike (BOR) as well as the static load tests.
Table 4-3. Summary of Bias Factor Statistics – Coastal Concrete Square Pile
Coastal Region Vesic Nordlund Meyerhof Concrete Square Pile λ−Mean λ−COV λ−Mean λ−COV λ−Mean λ−COV N@Toe<=40 Total 0.76 0.39 0.83 0.51 1.68 0.54
PDA Skin 1.03 0.62 0.59 0.70 1.67 0.73 EOD Toe 0.73 0.49 2.19 0.79 2.00 0.64
N@Toe>40 Total 0.53 0.41 0.39 0.34 0.71 0.44 PDA Skin 0.87 0.54 0.57 0.84 1.48 0.54 EOD Toe 0.50 0.51 0.51 0.34 0.57 0.46 Total Total 0.73 0.42 0.71 0.54 1.43 0.56 PDA Skin 0.95 0.59 0.59 0.72 1.77 0.76 EOD Toe 0.69 0.54 1.79 0.84 1.70 0.71
N@Toe<=40 Total 0.97 0.29 1.05 0.37 2.90 0.52 PDA Skin 2.20 0.55 0.78 0.39 3.81 0.82 BOR Toe 0.56 0.49 3.36 0.74 2.46 0.58
N@Toe>40 Total 0.76 0.29 0.94 0.45 PDA Skin 3.04 0.57 0.64 0.63 BOR Toe 0.47 0.99 4.92 0.76 Total Total 0.94 0.29 1.01 0.35 2.96 0.51 PDA Skin 2.30 0.56 0.82 0.34 4.00 0.80 BOR Toe 0.64 0.49 3.54 0.74 2.46 0.56
Static Load Test 0.80 0.29 1.02 0.46 1.95 0.53
The coastal steel pipe piles have the database for both the PDA EOD and BOR,
but no static load tests. The coastal concrete cylinder piles and the piedmont steel HP
piles have the database for the PDA EOD and the static load tests. The piedmont
concrete square piles have the database for the PDA EOD only.
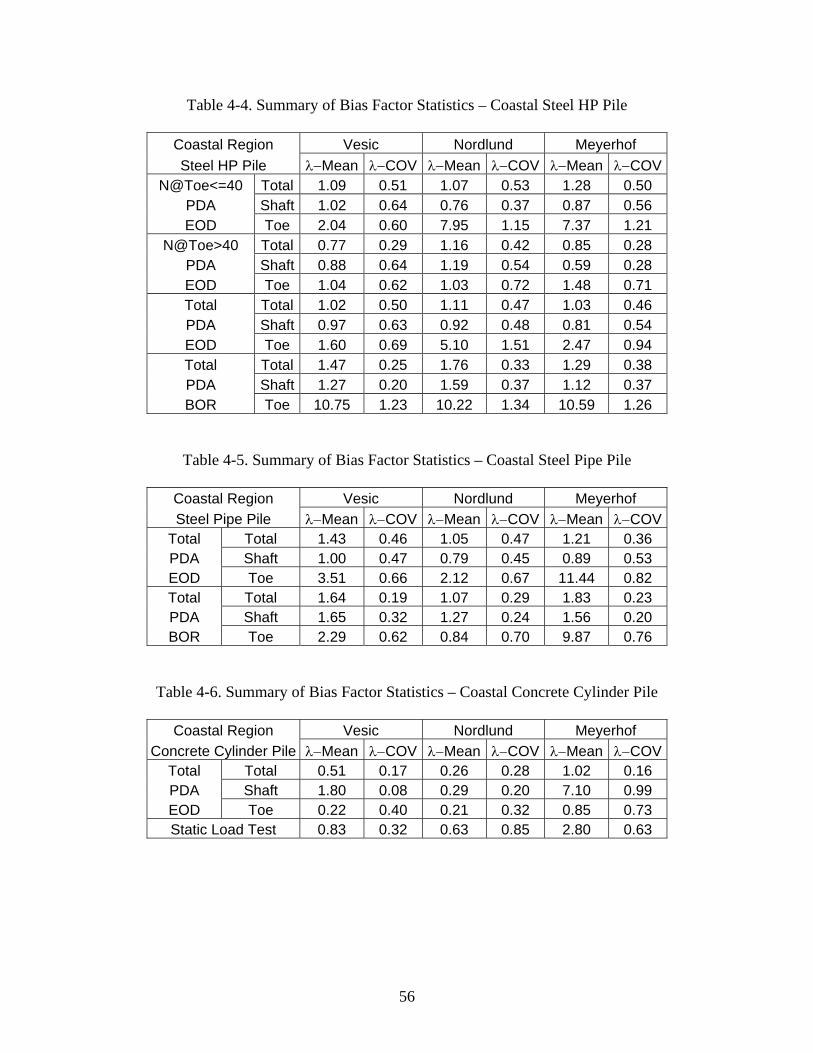
56
Table 4-4. Summary of Bias Factor Statistics – Coastal Steel HP Pile
Coastal Region Vesic Nordlund Meyerhof Steel HP Pile λ−Mean λ−COV λ−Mean λ−COV λ−Mean λ−COV
N@Toe<=40 Total 1.09 0.51 1.07 0.53 1.28 0.50 PDA Shaft 1.02 0.64 0.76 0.37 0.87 0.56 EOD Toe 2.04 0.60 7.95 1.15 7.37 1.21
N@Toe>40 Total 0.77 0.29 1.16 0.42 0.85 0.28 PDA Shaft 0.88 0.64 1.19 0.54 0.59 0.28 EOD Toe 1.04 0.62 1.03 0.72 1.48 0.71 Total Total 1.02 0.50 1.11 0.47 1.03 0.46 PDA Shaft 0.97 0.63 0.92 0.48 0.81 0.54 EOD Toe 1.60 0.69 5.10 1.51 2.47 0.94 Total Total 1.47 0.25 1.76 0.33 1.29 0.38 PDA Shaft 1.27 0.20 1.59 0.37 1.12 0.37 BOR Toe 10.75 1.23 10.22 1.34 10.59 1.26
Table 4-5. Summary of Bias Factor Statistics – Coastal Steel Pipe Pile
Coastal Region Vesic Nordlund Meyerhof Steel Pipe Pile λ−Mean λ−COV λ−Mean λ−COV λ−Mean λ−COV
Total Total 1.43 0.46 1.05 0.47 1.21 0.36 PDA Shaft 1.00 0.47 0.79 0.45 0.89 0.53 EOD Toe 3.51 0.66 2.12 0.67 11.44 0.82 Total Total 1.64 0.19 1.07 0.29 1.83 0.23 PDA Shaft 1.65 0.32 1.27 0.24 1.56 0.20 BOR Toe 2.29 0.62 0.84 0.70 9.87 0.76
Table 4-6. Summary of Bias Factor Statistics – Coastal Concrete Cylinder Pile
Coastal Region Vesic Nordlund Meyerhof Concrete Cylinder Pile λ−Mean λ−COV λ−Mean λ−COV λ−Mean λ−COV
Total Total 0.51 0.17 0.26 0.28 1.02 0.16 PDA Shaft 1.80 0.08 0.29 0.20 7.10 0.99 EOD Toe 0.22 0.40 0.21 0.32 0.85 0.73 Static Load Test 0.83 0.32 0.63 0.85 2.80 0.63
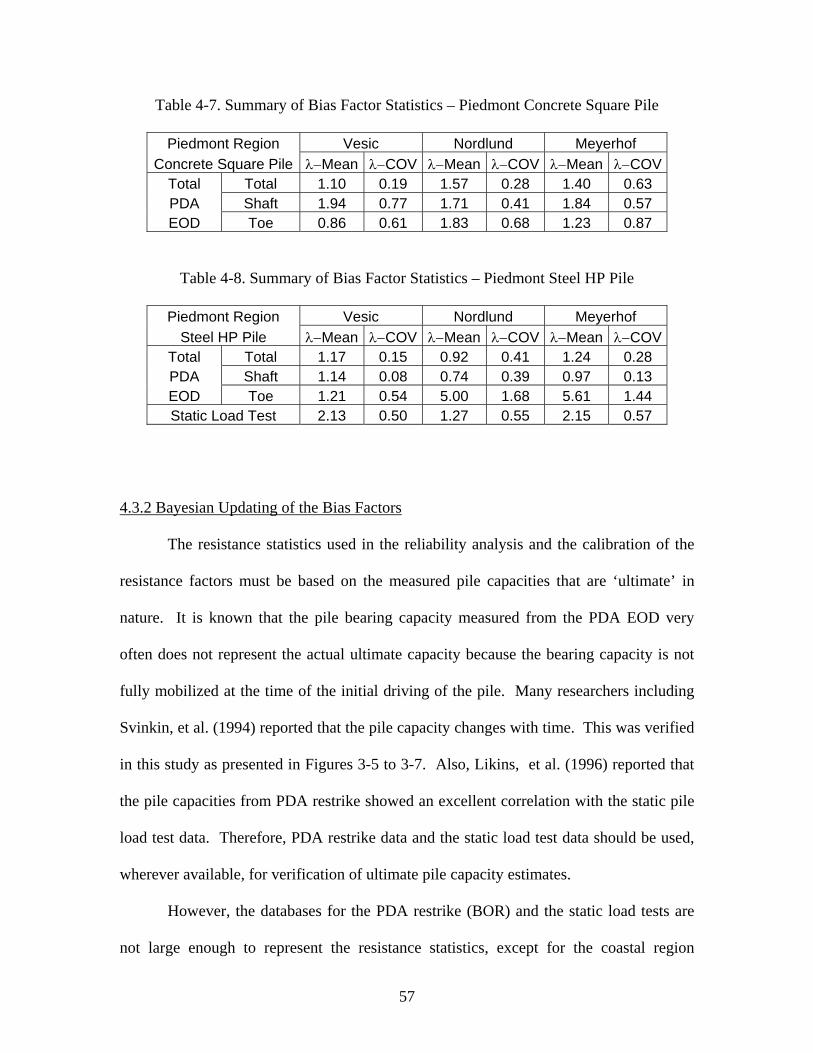
57
Table 4-7. Summary of Bias Factor Statistics – Piedmont Concrete Square Pile
Piedmont Region Vesic Nordlund Meyerhof Concrete Square Pile λ−Mean λ−COV λ−Mean λ−COV λ−Mean λ−COV
Total Total 1.10 0.19 1.57 0.28 1.40 0.63 PDA Shaft 1.94 0.77 1.71 0.41 1.84 0.57 EOD Toe 0.86 0.61 1.83 0.68 1.23 0.87
Table 4-8. Summary of Bias Factor Statistics – Piedmont Steel HP Pile
Piedmont Region Vesic Nordlund Meyerhof Steel HP Pile λ−Mean λ−COV λ−Mean λ−COV λ−Mean λ−COV
Total Total 1.17 0.15 0.92 0.41 1.24 0.28 PDA Shaft 1.14 0.08 0.74 0.39 0.97 0.13 EOD Toe 1.21 0.54 5.00 1.68 5.61 1.44 Static Load Test 2.13 0.50 1.27 0.55 2.15 0.57
4.3.2 Bayesian Updating of the Bias Factors
The resistance statistics used in the reliability analysis and the calibration of the
resistance factors must be based on the measured pile capacities that are ‘ultimate’ in
nature. It is known that the pile bearing capacity measured from the PDA EOD very
often does not represent the actual ultimate capacity because the bearing capacity is not
fully mobilized at the time of the initial driving of the pile. Many researchers including
Svinkin, et al. (1994) reported that the pile capacity changes with time. This was verified
in this study as presented in Figures 3-5 to 3-7. Also, Likins, et al. (1996) reported that
the pile capacities from PDA restrike showed an excellent correlation with the static pile
load test data. Therefore, PDA restrike data and the static load test data should be used,
wherever available, for verification of ultimate pile capacity estimates.
However, the databases for the PDA restrike (BOR) and the static load tests are
not large enough to represent the resistance statistics, except for the coastal region
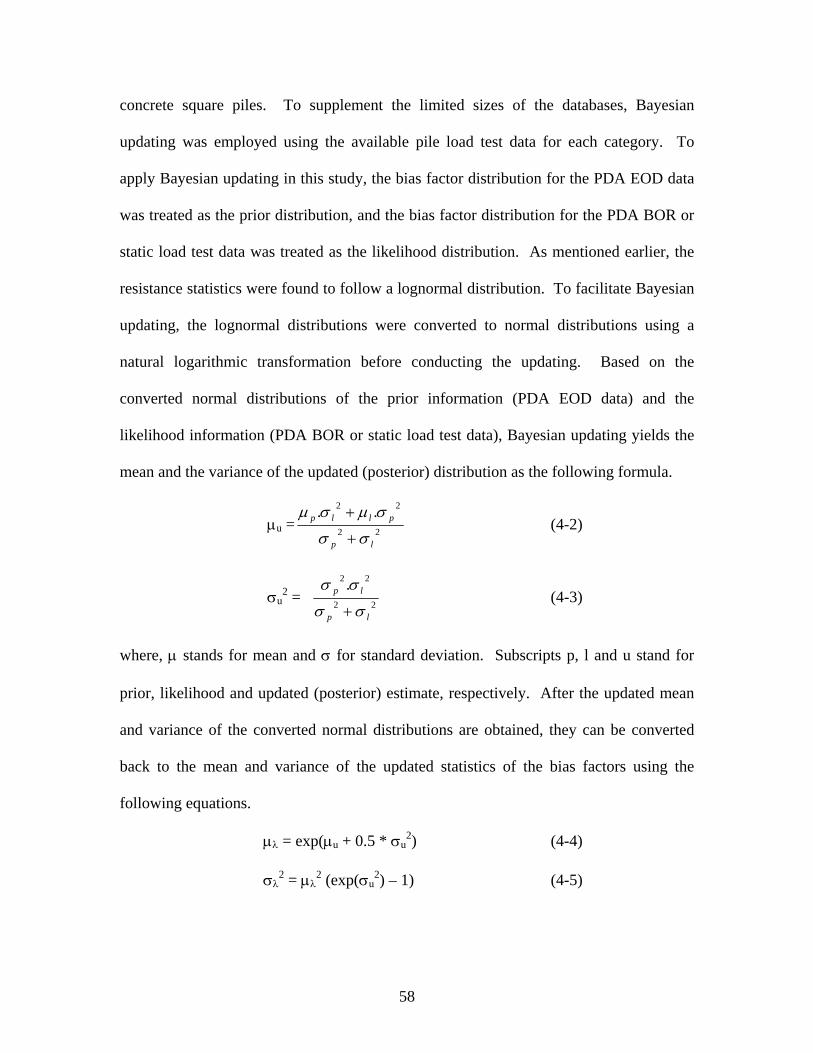
58
concrete square piles. To supplement the limited sizes of the databases, Bayesian
updating was employed using the available pile load test data for each category. To
apply Bayesian updating in this study, the bias factor distribution for the PDA EOD data
was treated as the prior distribution, and the bias factor distribution for the PDA BOR or
static load test data was treated as the likelihood distribution. As mentioned earlier, the
resistance statistics were found to follow a lognormal distribution. To facilitate Bayesian
updating, the lognormal distributions were converted to normal distributions using a
natural logarithmic transformation before conducting the updating. Based on the
converted normal distributions of the prior information (PDA EOD data) and the
likelihood information (PDA BOR or static load test data), Bayesian updating yields the
mean and the variance of the updated (posterior) distribution as the following formula.
µu = 22
22 ..
lp
pllp
σσ
σµσµ
+
+ (4-2)
σu2 = 22
22 .
lp
lp
σσ
σσ
+ (4-3)
where, µ stands for mean and σ for standard deviation. Subscripts p, l and u stand for
prior, likelihood and updated (posterior) estimate, respectively. After the updated mean
and variance of the converted normal distributions are obtained, they can be converted
back to the mean and variance of the updated statistics of the bias factors using the
following equations.
µλ = exp(µu + 0.5 * σu2) (4-4)
σλ2 = µλ
2 (exp(σu2) – 1) (4-5)
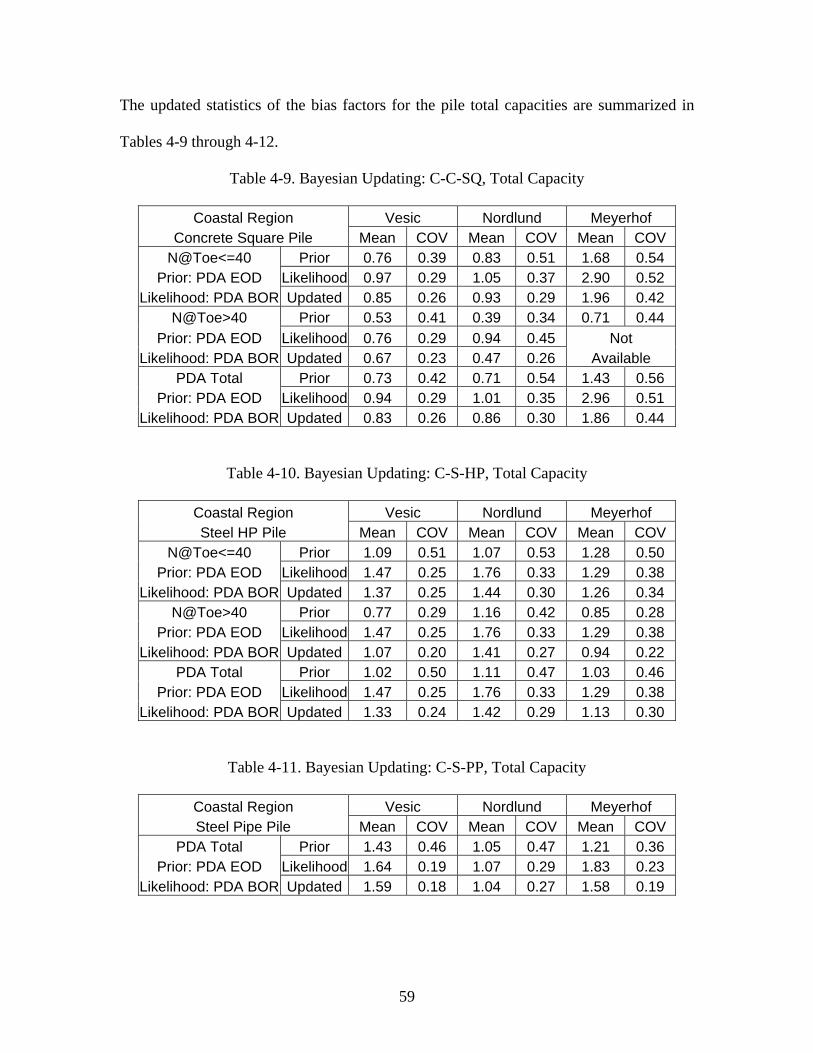
59
The updated statistics of the bias factors for the pile total capacities are summarized in
Tables 4-9 through 4-12.
Table 4-9. Bayesian Updating: C-C-SQ, Total Capacity
Coastal Region Vesic Nordlund Meyerhof Concrete Square Pile Mean COV Mean COV Mean COV
N@Toe<=40 Prior 0.76 0.39 0.83 0.51 1.68 0.54 Prior: PDA EOD Likelihood 0.97 0.29 1.05 0.37 2.90 0.52
Likelihood: PDA BOR Updated 0.85 0.26 0.93 0.29 1.96 0.42 N@Toe>40 Prior 0.53 0.41 0.39 0.34 0.71 0.44
Prior: PDA EOD Likelihood 0.76 0.29 0.94 0.45 Not Likelihood: PDA BOR Updated 0.67 0.23 0.47 0.26 Available
PDA Total Prior 0.73 0.42 0.71 0.54 1.43 0.56 Prior: PDA EOD Likelihood 0.94 0.29 1.01 0.35 2.96 0.51
Likelihood: PDA BOR Updated 0.83 0.26 0.86 0.30 1.86 0.44
Table 4-10. Bayesian Updating: C-S-HP, Total Capacity
Coastal Region Vesic Nordlund Meyerhof Steel HP Pile Mean COV Mean COV Mean COV
N@Toe<=40 Prior 1.09 0.51 1.07 0.53 1.28 0.50 Prior: PDA EOD Likelihood 1.47 0.25 1.76 0.33 1.29 0.38
Likelihood: PDA BOR Updated 1.37 0.25 1.44 0.30 1.26 0.34 N@Toe>40 Prior 0.77 0.29 1.16 0.42 0.85 0.28
Prior: PDA EOD Likelihood 1.47 0.25 1.76 0.33 1.29 0.38 Likelihood: PDA BOR Updated 1.07 0.20 1.41 0.27 0.94 0.22
PDA Total Prior 1.02 0.50 1.11 0.47 1.03 0.46 Prior: PDA EOD Likelihood 1.47 0.25 1.76 0.33 1.29 0.38
Likelihood: PDA BOR Updated 1.33 0.24 1.42 0.29 1.13 0.30
Table 4-11. Bayesian Updating: C-S-PP, Total Capacity
Coastal Region Vesic Nordlund Meyerhof Steel Pipe Pile Mean COV Mean COV Mean COV
PDA Total Prior 1.43 0.46 1.05 0.47 1.21 0.36 Prior: PDA EOD Likelihood 1.64 0.19 1.07 0.29 1.83 0.23
Likelihood: PDA BOR Updated 1.59 0.18 1.04 0.27 1.58 0.19
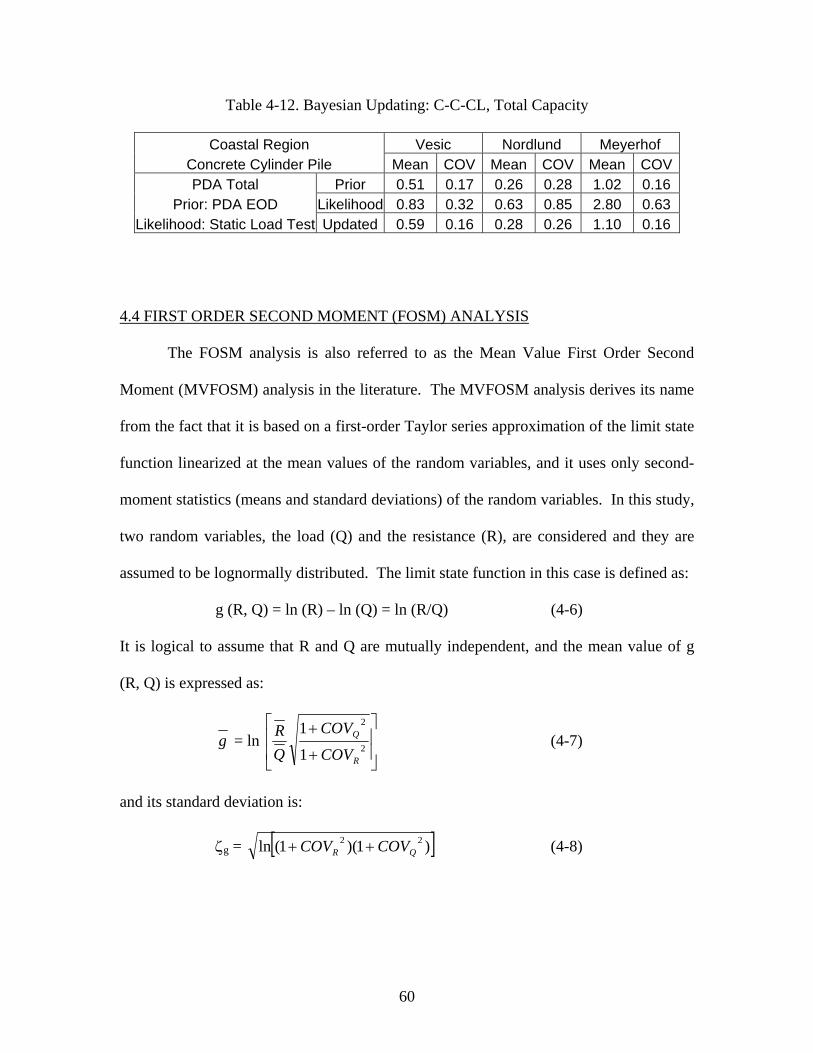
60
Table 4-12. Bayesian Updating: C-C-CL, Total Capacity
Coastal Region Vesic Nordlund Meyerhof Concrete Cylinder Pile Mean COV Mean COV Mean COVPDA Total Prior 0.51 0.17 0.26 0.28 1.02 0.16
Prior: PDA EOD Likelihood 0.83 0.32 0.63 0.85 2.80 0.63 Likelihood: Static Load Test Updated 0.59 0.16 0.28 0.26 1.10 0.16
4.4 FIRST ORDER SECOND MOMENT (FOSM) ANALYSIS
The FOSM analysis is also referred to as the Mean Value First Order Second
Moment (MVFOSM) analysis in the literature. The MVFOSM analysis derives its name
from the fact that it is based on a first-order Taylor series approximation of the limit state
function linearized at the mean values of the random variables, and it uses only second-
moment statistics (means and standard deviations) of the random variables. In this study,
two random variables, the load (Q) and the resistance (R), are considered and they are
assumed to be lognormally distributed. The limit state function in this case is defined as:
g (R, Q) = ln (R) – ln (Q) = ln (R/Q) (4-6)
It is logical to assume that R and Q are mutually independent, and the mean value of g
(R, Q) is expressed as:
g = ln ⎥⎥
⎦
⎤
⎢⎢
⎣
⎡
+
+2
2
1
1
R
Q
COV
COV
QR (4-7)
and its standard deviation is:
ζg = [ ])1)(1(ln 22QR COVCOV ++ (4-8)
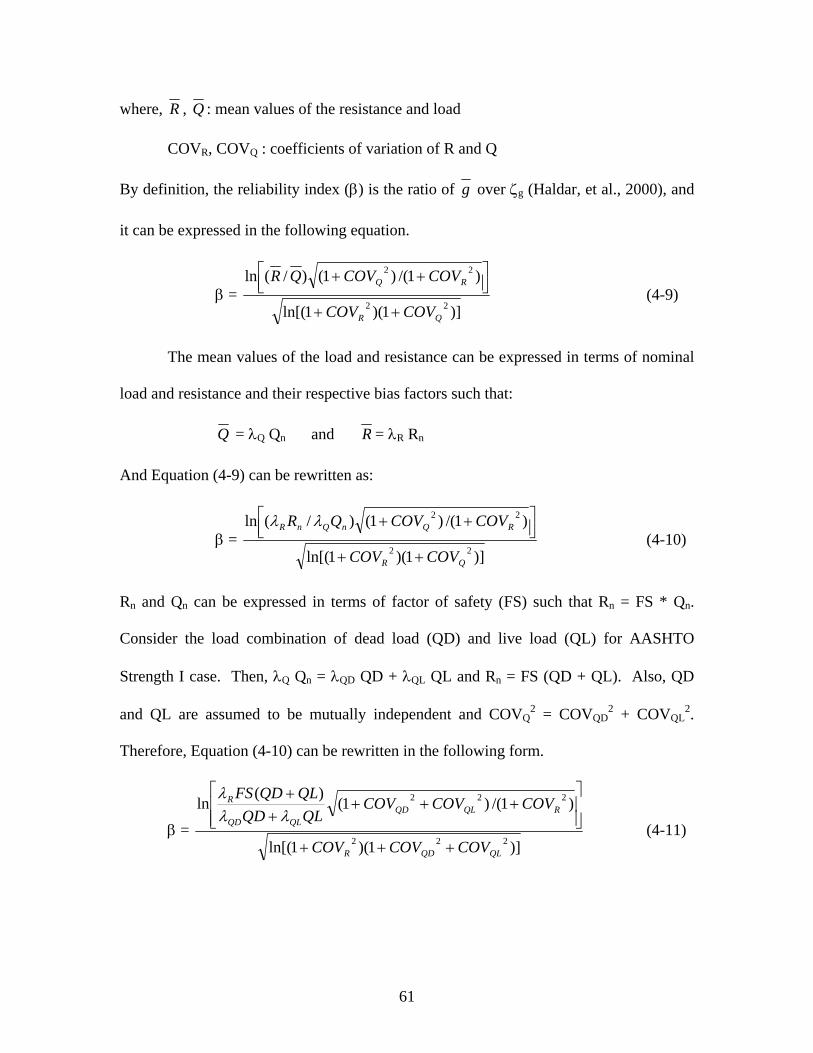
61
where, R , Q : mean values of the resistance and load
COVR, COVQ : coefficients of variation of R and Q
By definition, the reliability index (β) is the ratio of g over ζg (Haldar, et al., 2000), and
it can be expressed in the following equation.
β = )]1)(1ln[(
)1/()1()/(ln
22
22
QR
RQ
COVCOV
COVCOVQR
++
⎥⎦⎤
⎢⎣⎡ ++
(4-9)
The mean values of the load and resistance can be expressed in terms of nominal
load and resistance and their respective bias factors such that:
Q = λQ Qn and R = λR Rn
And Equation (4-9) can be rewritten as:
β = )]1)(1ln[(
)1/()1()/(ln
22
22
QR
RQnQnR
COVCOV
COVCOVQR
++
⎥⎦⎤
⎢⎣⎡ ++λλ
(4-10)
Rn and Qn can be expressed in terms of factor of safety (FS) such that Rn = FS * Qn.
Consider the load combination of dead load (QD) and live load (QL) for AASHTO
Strength I case. Then, λQ Qn = λQD QD + λQL QL and Rn = FS (QD + QL). Also, QD
and QL are assumed to be mutually independent and COVQ2 = COVQD
2 + COVQL2.
Therefore, Equation (4-10) can be rewritten in the following form.
β = )]1)(1ln[(
)1/()1()(ln
222
222
QLQDR
RQLQDQLQD
R
COVCOVCOV
COVCOVCOVQLQD
QLQDFS
+++
⎥⎥⎦
⎤
⎢⎢⎣
⎡+++
++
λλλ
(4-11)
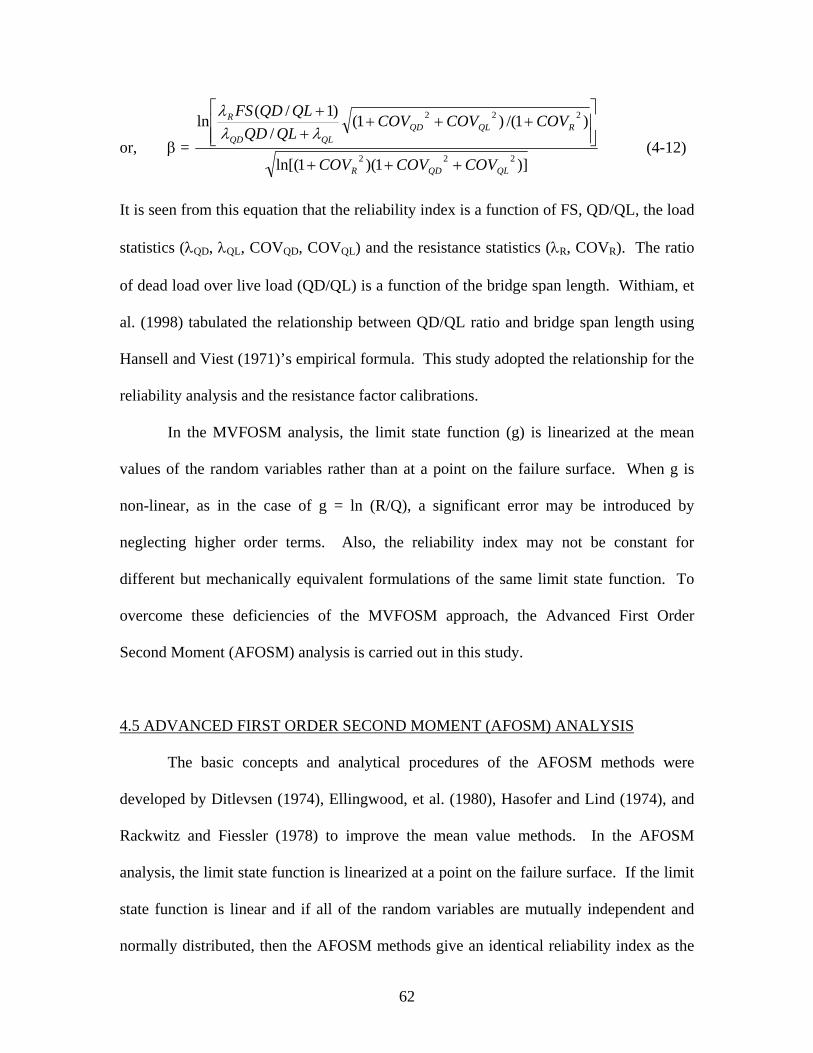
62
or, β = )]1)(1ln[(
)1/()1(/
)1/(ln
222
222
QLQDR
RQLQDQLQD
R
COVCOVCOV
COVCOVCOVQLQD
QLQDFS
+++
⎥⎥⎦
⎤
⎢⎢⎣
⎡+++
++λλ
λ
(4-12)
It is seen from this equation that the reliability index is a function of FS, QD/QL, the load
statistics (λQD, λQL, COVQD, COVQL) and the resistance statistics (λR, COVR). The ratio
of dead load over live load (QD/QL) is a function of the bridge span length. Withiam, et
al. (1998) tabulated the relationship between QD/QL ratio and bridge span length using
Hansell and Viest (1971)’s empirical formula. This study adopted the relationship for the
reliability analysis and the resistance factor calibrations.
In the MVFOSM analysis, the limit state function (g) is linearized at the mean
values of the random variables rather than at a point on the failure surface. When g is
non-linear, as in the case of g = ln (R/Q), a significant error may be introduced by
neglecting higher order terms. Also, the reliability index may not be constant for
different but mechanically equivalent formulations of the same limit state function. To
overcome these deficiencies of the MVFOSM approach, the Advanced First Order
Second Moment (AFOSM) analysis is carried out in this study.
4.5 ADVANCED FIRST ORDER SECOND MOMENT (AFOSM) ANALYSIS
The basic concepts and analytical procedures of the AFOSM methods were
developed by Ditlevsen (1974), Ellingwood, et al. (1980), Hasofer and Lind (1974), and
Rackwitz and Fiessler (1978) to improve the mean value methods. In the AFOSM
analysis, the limit state function is linearized at a point on the failure surface. If the limit
state function is linear and if all of the random variables are mutually independent and
normally distributed, then the AFOSM methods give an identical reliability index as the
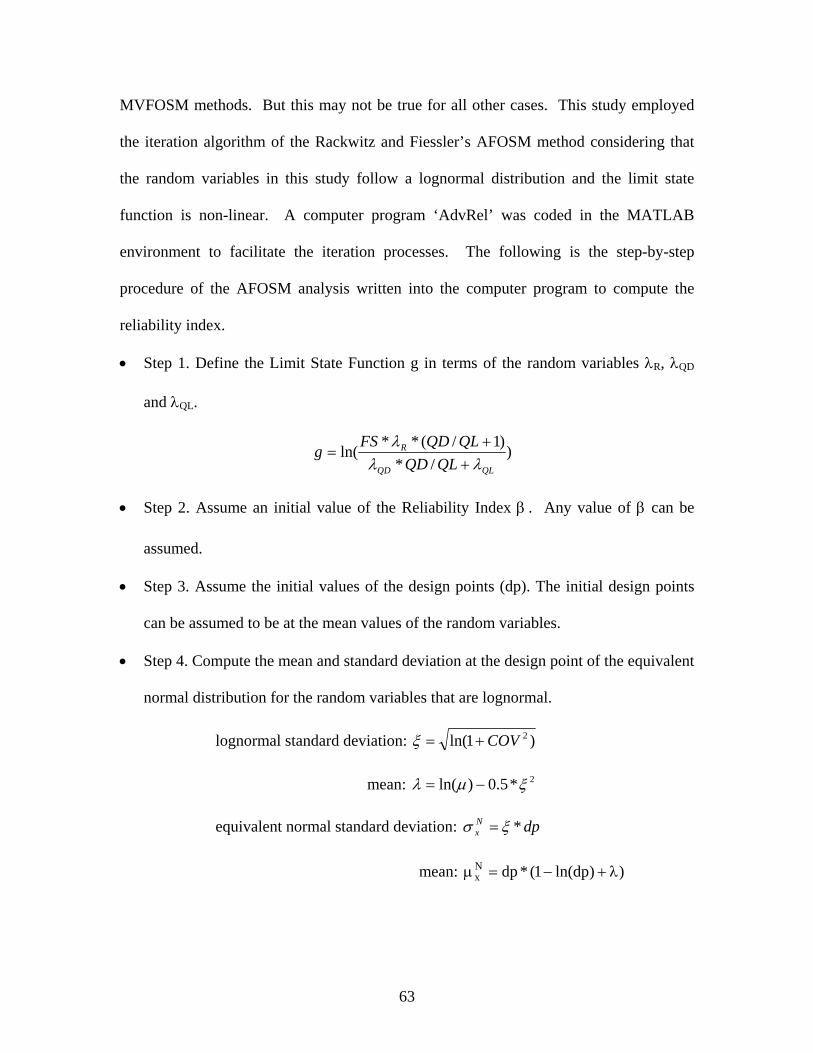
63
MVFOSM methods. But this may not be true for all other cases. This study employed
the iteration algorithm of the Rackwitz and Fiessler’s AFOSM method considering that
the random variables in this study follow a lognormal distribution and the limit state
function is non-linear. A computer program ‘AdvRel’ was coded in the MATLAB
environment to facilitate the iteration processes. The following is the step-by-step
procedure of the AFOSM analysis written into the computer program to compute the
reliability index.
• Step 1. Define the Limit State Function g in terms of the random variables λR, λQD
and λQL.
)/*
)1/(**ln(QLQD
R
QLQDQLQDFSg
λλλ
++
=
• Step 2. Assume an initial value of the Reliability Index β . Any value of β can be
assumed.
• Step 3. Assume the initial values of the design points (dp). The initial design points
can be assumed to be at the mean values of the random variables.
• Step 4. Compute the mean and standard deviation at the design point of the equivalent
normal distribution for the random variables that are lognormal.
lognormal standard deviation: )1ln( 2COV+=ξ
mean: 2*5.0)ln( ξµλ −=
equivalent normal standard deviation: dpNx *ξσ =
mean: ))dpln(1(*dpNx λ+−=µ
64
• Step 5. Compute the partial derivatives evaluated at the design points.
dpxxgpder
=
⎟⎠⎞
⎜⎝⎛
∂∂
=
• Step 6. Compute the direction cosines α at the design points.
dpx
n
i
Nx
Nx
xg
xg
=⎥⎥⎥⎥⎥
⎦
⎤
⎢⎢⎢⎢⎢
⎣
⎡
⎟⎠⎞
⎜⎝⎛
∂∂
∂∂
=
∑2
*
*
σ
σα
• Step 7. Compute the new values for the design points as:
Nx
Nx **dp σβα−µ=
Repeat the steps 4 through 7 until the direction cosines (α) converge to a specified
tolerance value of 0.005.
• Step 8. Once α 's converge, the new design points can be expressed in terms of β as
the unknown parameter. These new design points must satisfy the limit state
function. Substitute the random variables in the limit state function with these new
design points and solve g for β.
• Step 9. Repeat the steps 3 through 8 until β converges to a tolerance value of 0.001.
4.6 RELIABILITY ESTIMATE OF THE CURRENT DESIGN PRACTICE
4.6.1 Introduction
Reliability indexes of the NCDOT’s current allowable strength design practice on
the pile foundation design were evaluated using the two reliability analysis methods
described above. The reliability analysis was performed on all the compiled database of
65
the resistance statistics for the six different categories of the pile type and region
combinations: (i) coastal area concrete square pile, (ii) coastal area steel HP pile, (iii)
coastal area steel pipe pile, (iv) coastal area concrete cylinder pile, (v) piedmont area
concrete square pile, and (vi) piedmont area steel HP pile. Also, the three static pile
capacity analysis methods (Vesic, Nordlund, Meyerhof) were evaluated for each
category. In the NCDOT practice, a minimum factor of safety (FS) of two (2) is used for
the design bearing capacity of pile foundations. Therefore, the reliability analysis was
performed for FS of 2, 2.5 and 3. The results of the reliability analyses are summarized
in Tables 4-13 through 4-18 for the Vesic method, Tables 4-19 through 4-24 for the
Nordlund method, and Tables 4-25 through 4-30 for the Meyerhof method.
4.6.2 Vesic Method
Coastal Concrete Square Piles:
Table 4-13 shows the reliability indexes computed for the seven different
databases available for this category. There are large variations in the reliability indexes
between the PDA EOD and the PDA BOR and between the skin and toe resistance
components. Clearly the PDA restrike (BOR) data show a higher reliability than the
PDA initial driving (EOD) data, except for the toe capacities. This can be explained by
the fact that the PDA restrike mobilized a much larger set-up in the skin resistance than in
the toe resistance, as shown in Figures 3-1 through 3-3 of Chapter 3. Reliability indexes
from the static load test data are between those from the PDA EOD and those from the
PDA BOR. As expected, the reliability indexes reflect the bias factor statistics shown in
Table 4-3. On the average, AFOSM resulted in a higher reliability index than MVFOSM
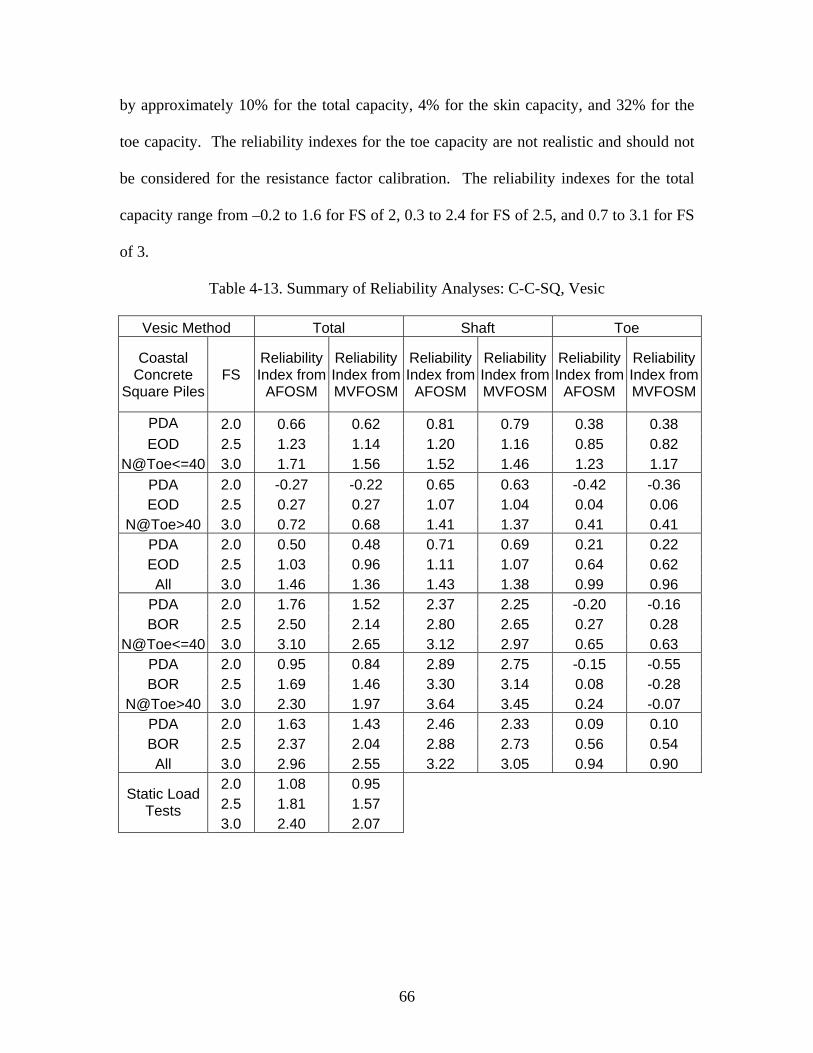
66
by approximately 10% for the total capacity, 4% for the skin capacity, and 32% for the
toe capacity. The reliability indexes for the toe capacity are not realistic and should not
be considered for the resistance factor calibration. The reliability indexes for the total
capacity range from –0.2 to 1.6 for FS of 2, 0.3 to 2.4 for FS of 2.5, and 0.7 to 3.1 for FS
of 3.
Table 4-13. Summary of Reliability Analyses: C-C-SQ, Vesic
Vesic Method Total Shaft Toe
Coastal Concrete
Square Piles FS
Reliability Index from
AFOSM
Reliability Index from MVFOSM
Reliability Index from
AFOSM
Reliability Index from MVFOSM
Reliability Index from
AFOSM
Reliability Index from MVFOSM
PDA 2.0 0.66 0.62 0.81 0.79 0.38 0.38 EOD 2.5 1.23 1.14 1.20 1.16 0.85 0.82
N@Toe<=40 3.0 1.71 1.56 1.52 1.46 1.23 1.17 PDA 2.0 -0.27 -0.22 0.65 0.63 -0.42 -0.36 EOD 2.5 0.27 0.27 1.07 1.04 0.04 0.06
N@Toe>40 3.0 0.72 0.68 1.41 1.37 0.41 0.41 PDA 2.0 0.50 0.48 0.71 0.69 0.21 0.22 EOD 2.5 1.03 0.96 1.11 1.07 0.64 0.62 All 3.0 1.46 1.36 1.43 1.38 0.99 0.96
PDA 2.0 1.76 1.52 2.37 2.25 -0.20 -0.16 BOR 2.5 2.50 2.14 2.80 2.65 0.27 0.28
N@Toe<=40 3.0 3.10 2.65 3.12 2.97 0.65 0.63 PDA 2.0 0.95 0.84 2.89 2.75 -0.15 -0.55 BOR 2.5 1.69 1.46 3.30 3.14 0.08 -0.28
N@Toe>40 3.0 2.30 1.97 3.64 3.45 0.24 -0.07 PDA 2.0 1.63 1.43 2.46 2.33 0.09 0.10 BOR 2.5 2.37 2.04 2.88 2.73 0.56 0.54 All 3.0 2.96 2.55 3.22 3.05 0.94 0.90
2.0 1.08 0.95 2.5 1.81 1.57
Static Load Tests
3.0 2.40 2.07
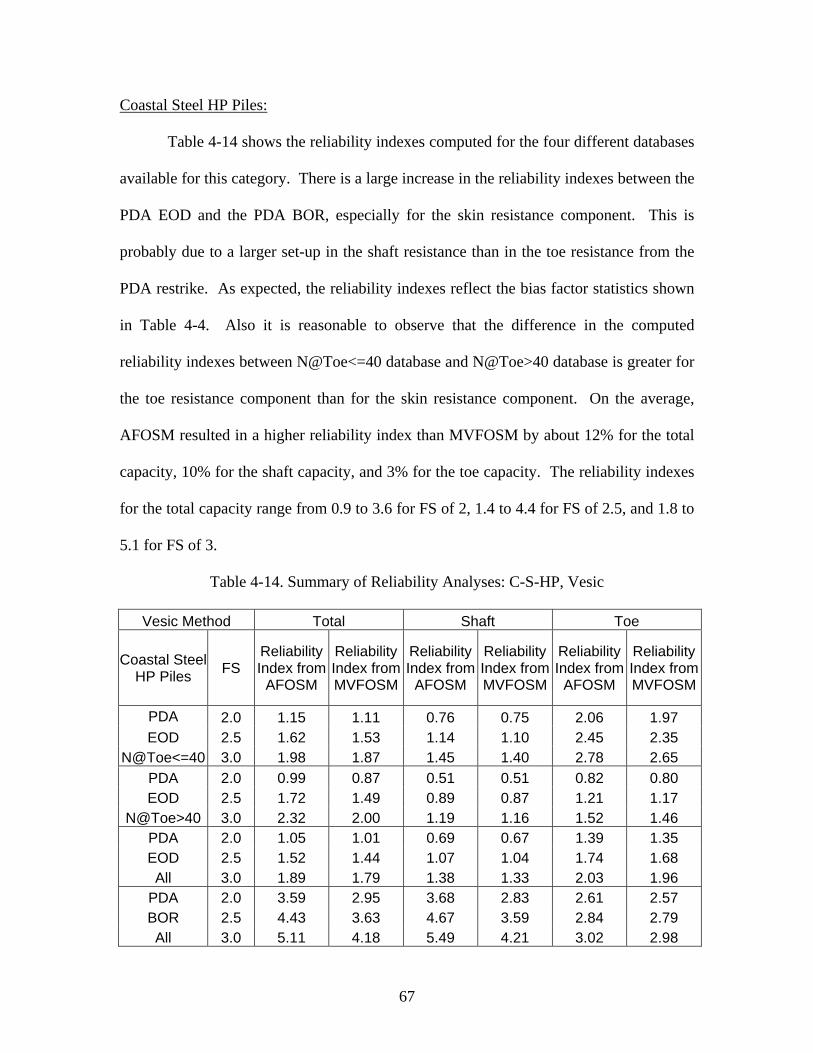
67
Coastal Steel HP Piles:
Table 4-14 shows the reliability indexes computed for the four different databases
available for this category. There is a large increase in the reliability indexes between the
PDA EOD and the PDA BOR, especially for the skin resistance component. This is
probably due to a larger set-up in the shaft resistance than in the toe resistance from the
PDA restrike. As expected, the reliability indexes reflect the bias factor statistics shown
in Table 4-4. Also it is reasonable to observe that the difference in the computed
reliability indexes between N@Toe<=40 database and N@Toe>40 database is greater for
the toe resistance component than for the skin resistance component. On the average,
AFOSM resulted in a higher reliability index than MVFOSM by about 12% for the total
capacity, 10% for the shaft capacity, and 3% for the toe capacity. The reliability indexes
for the total capacity range from 0.9 to 3.6 for FS of 2, 1.4 to 4.4 for FS of 2.5, and 1.8 to
5.1 for FS of 3.
Table 4-14. Summary of Reliability Analyses: C-S-HP, Vesic
Vesic Method Total Shaft Toe
Coastal Steel HP Piles FS
Reliability Index from
AFOSM
Reliability Index from MVFOSM
Reliability Index from
AFOSM
Reliability Index from MVFOSM
Reliability Index from
AFOSM
Reliability Index from MVFOSM
PDA 2.0 1.15 1.11 0.76 0.75 2.06 1.97 EOD 2.5 1.62 1.53 1.14 1.10 2.45 2.35
N@Toe<=40 3.0 1.98 1.87 1.45 1.40 2.78 2.65 PDA 2.0 0.99 0.87 0.51 0.51 0.82 0.80 EOD 2.5 1.72 1.49 0.89 0.87 1.21 1.17
N@Toe>40 3.0 2.32 2.00 1.19 1.16 1.52 1.46 PDA 2.0 1.05 1.01 0.69 0.67 1.39 1.35 EOD 2.5 1.52 1.44 1.07 1.04 1.74 1.68 All 3.0 1.89 1.79 1.38 1.33 2.03 1.96
PDA 2.0 3.59 2.95 3.68 2.83 2.61 2.57 BOR 2.5 4.43 3.63 4.67 3.59 2.84 2.79 All 3.0 5.11 4.18 5.49 4.21 3.02 2.98
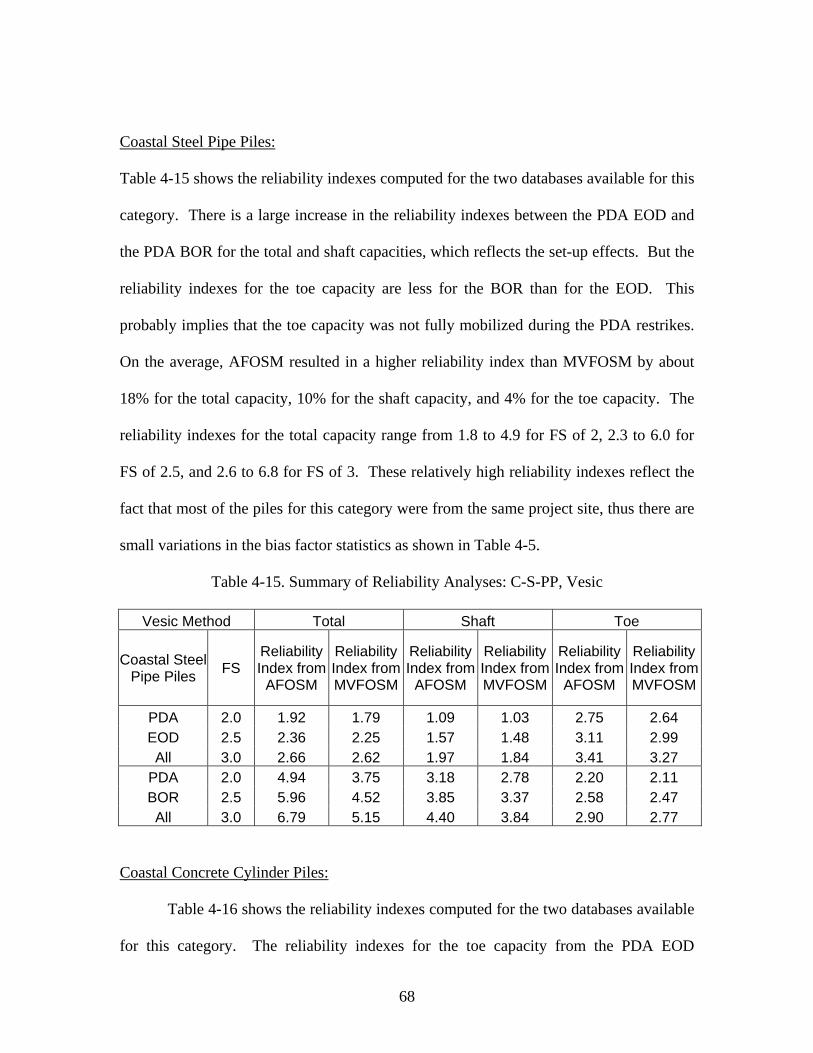
68
Coastal Steel Pipe Piles:
Table 4-15 shows the reliability indexes computed for the two databases available for this
category. There is a large increase in the reliability indexes between the PDA EOD and
the PDA BOR for the total and shaft capacities, which reflects the set-up effects. But the
reliability indexes for the toe capacity are less for the BOR than for the EOD. This
probably implies that the toe capacity was not fully mobilized during the PDA restrikes.
On the average, AFOSM resulted in a higher reliability index than MVFOSM by about
18% for the total capacity, 10% for the shaft capacity, and 4% for the toe capacity. The
reliability indexes for the total capacity range from 1.8 to 4.9 for FS of 2, 2.3 to 6.0 for
FS of 2.5, and 2.6 to 6.8 for FS of 3. These relatively high reliability indexes reflect the
fact that most of the piles for this category were from the same project site, thus there are
small variations in the bias factor statistics as shown in Table 4-5.
Table 4-15. Summary of Reliability Analyses: C-S-PP, Vesic
Vesic Method Total Shaft Toe
Coastal Steel Pipe Piles FS
Reliability Index from
AFOSM
Reliability Index from MVFOSM
Reliability Index from
AFOSM
Reliability Index from MVFOSM
Reliability Index from
AFOSM
Reliability Index from MVFOSM
PDA 2.0 1.92 1.79 1.09 1.03 2.75 2.64 EOD 2.5 2.36 2.25 1.57 1.48 3.11 2.99 All 3.0 2.66 2.62 1.97 1.84 3.41 3.27
PDA 2.0 4.94 3.75 3.18 2.78 2.20 2.11 BOR 2.5 5.96 4.52 3.85 3.37 2.58 2.47 All 3.0 6.79 5.15 4.40 3.84 2.90 2.77
Coastal Concrete Cylinder Piles:
Table 4-16 shows the reliability indexes computed for the two databases available
for this category. The reliability indexes for the toe capacity from the PDA EOD
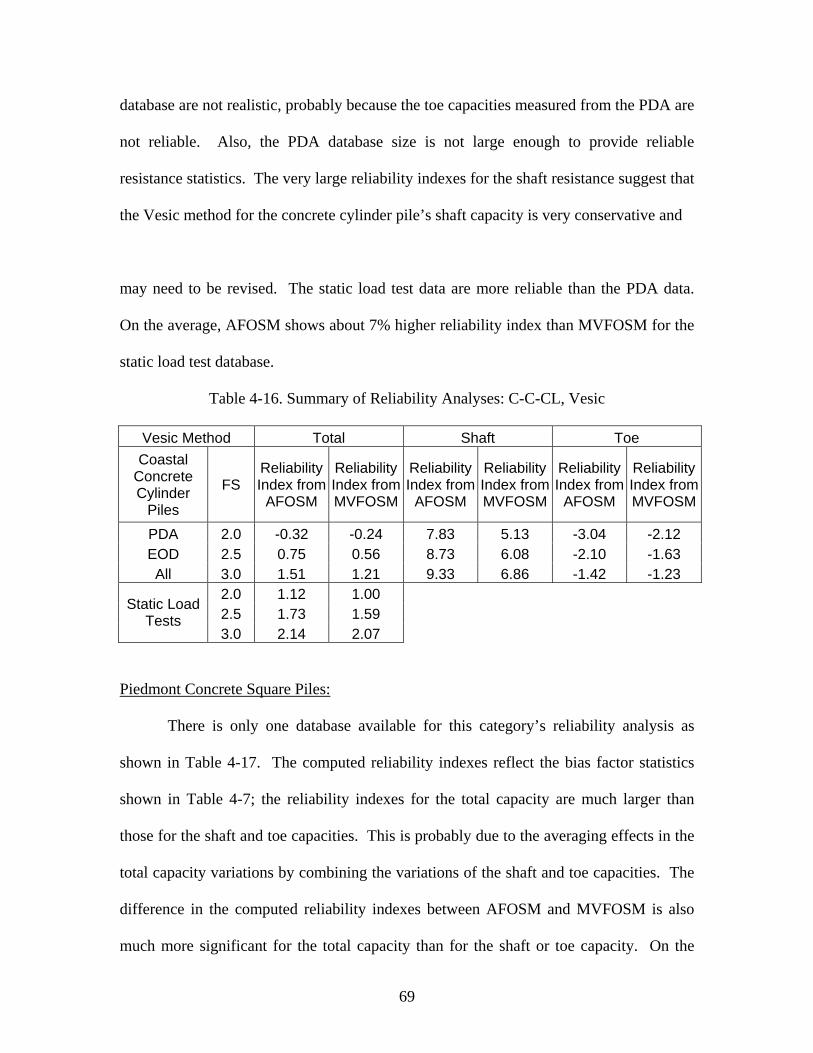
69
database are not realistic, probably because the toe capacities measured from the PDA are
not reliable. Also, the PDA database size is not large enough to provide reliable
resistance statistics. The very large reliability indexes for the shaft resistance suggest that
the Vesic method for the concrete cylinder pile’s shaft capacity is very conservative and
may need to be revised. The static load test data are more reliable than the PDA data.
On the average, AFOSM shows about 7% higher reliability index than MVFOSM for the
static load test database.
Table 4-16. Summary of Reliability Analyses: C-C-CL, Vesic
Vesic Method Total Shaft Toe Coastal
Concrete Cylinder
Piles
FS Reliability Index from
AFOSM
Reliability Index from MVFOSM
Reliability Index from
AFOSM
Reliability Index from MVFOSM
Reliability Index from
AFOSM
Reliability Index from MVFOSM
PDA 2.0 -0.32 -0.24 7.83 5.13 -3.04 -2.12 EOD 2.5 0.75 0.56 8.73 6.08 -2.10 -1.63 All 3.0 1.51 1.21 9.33 6.86 -1.42 -1.23
2.0 1.12 1.00 2.5 1.73 1.59
Static Load Tests
3.0 2.14 2.07
Piedmont Concrete Square Piles:
There is only one database available for this category’s reliability analysis as
shown in Table 4-17. The computed reliability indexes reflect the bias factor statistics
shown in Table 4-7; the reliability indexes for the total capacity are much larger than
those for the shaft and toe capacities. This is probably due to the averaging effects in the
total capacity variations by combining the variations of the shaft and toe capacities. The
difference in the computed reliability indexes between AFOSM and MVFOSM is also
much more significant for the total capacity than for the shaft or toe capacity. On the
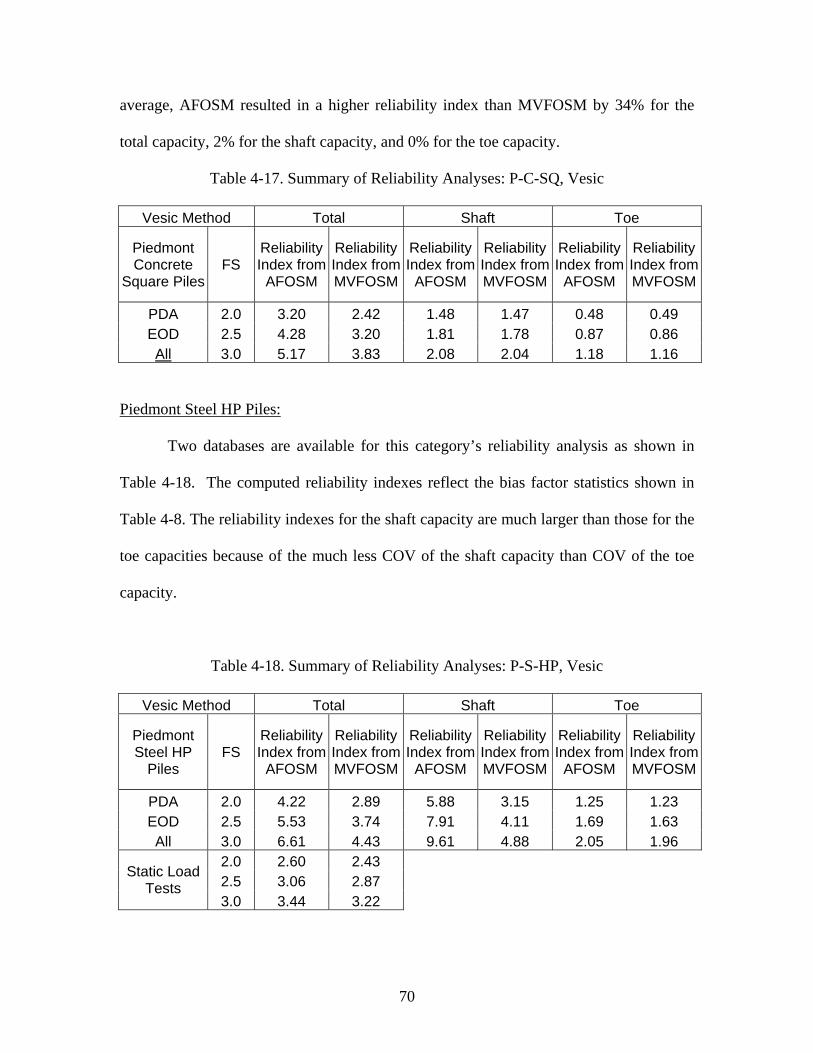
70
average, AFOSM resulted in a higher reliability index than MVFOSM by 34% for the
total capacity, 2% for the shaft capacity, and 0% for the toe capacity.
Table 4-17. Summary of Reliability Analyses: P-C-SQ, Vesic
Vesic Method Total Shaft Toe
Piedmont Concrete
Square Piles FS
Reliability Index from
AFOSM
Reliability Index from MVFOSM
Reliability Index from
AFOSM
Reliability Index from MVFOSM
Reliability Index from
AFOSM
Reliability Index from MVFOSM
PDA 2.0 3.20 2.42 1.48 1.47 0.48 0.49 EOD 2.5 4.28 3.20 1.81 1.78 0.87 0.86 All 3.0 5.17 3.83 2.08 2.04 1.18 1.16
Piedmont Steel HP Piles:
Two databases are available for this category’s reliability analysis as shown in
Table 4-18. The computed reliability indexes reflect the bias factor statistics shown in
Table 4-8. The reliability indexes for the shaft capacity are much larger than those for the
toe capacities because of the much less COV of the shaft capacity than COV of the toe
capacity.
Table 4-18. Summary of Reliability Analyses: P-S-HP, Vesic
Vesic Method Total Shaft Toe
Piedmont Steel HP
Piles FS
Reliability Index from
AFOSM
Reliability Index from MVFOSM
Reliability Index from
AFOSM
Reliability Index from MVFOSM
Reliability Index from
AFOSM
Reliability Index from MVFOSM
PDA 2.0 4.22 2.89 5.88 3.15 1.25 1.23 EOD 2.5 5.53 3.74 7.91 4.11 1.69 1.63 All 3.0 6.61 4.43 9.61 4.88 2.05 1.96
2.0 2.60 2.43 2.5 3.06 2.87
Static Load Tests
3.0 3.44 3.22
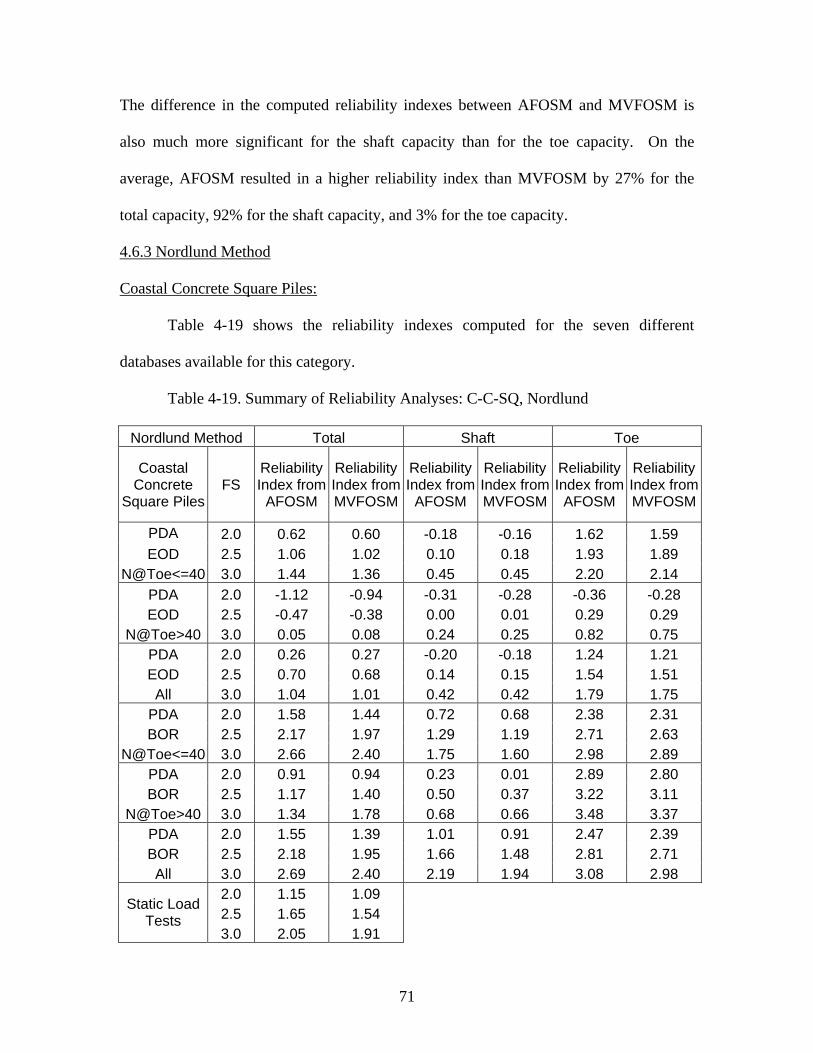
71
The difference in the computed reliability indexes between AFOSM and MVFOSM is
also much more significant for the shaft capacity than for the toe capacity. On the
average, AFOSM resulted in a higher reliability index than MVFOSM by 27% for the
total capacity, 92% for the shaft capacity, and 3% for the toe capacity.
4.6.3 Nordlund Method
Coastal Concrete Square Piles:
Table 4-19 shows the reliability indexes computed for the seven different
databases available for this category.
Table 4-19. Summary of Reliability Analyses: C-C-SQ, Nordlund
Nordlund Method Total Shaft Toe
Coastal Concrete
Square Piles FS
Reliability Index from
AFOSM
Reliability Index from MVFOSM
Reliability Index from
AFOSM
Reliability Index from MVFOSM
Reliability Index from
AFOSM
Reliability Index from MVFOSM
PDA 2.0 0.62 0.60 -0.18 -0.16 1.62 1.59 EOD 2.5 1.06 1.02 0.10 0.18 1.93 1.89
N@Toe<=40 3.0 1.44 1.36 0.45 0.45 2.20 2.14 PDA 2.0 -1.12 -0.94 -0.31 -0.28 -0.36 -0.28 EOD 2.5 -0.47 -0.38 0.00 0.01 0.29 0.29
N@Toe>40 3.0 0.05 0.08 0.24 0.25 0.82 0.75 PDA 2.0 0.26 0.27 -0.20 -0.18 1.24 1.21 EOD 2.5 0.70 0.68 0.14 0.15 1.54 1.51 All 3.0 1.04 1.01 0.42 0.42 1.79 1.75
PDA 2.0 1.58 1.44 0.72 0.68 2.38 2.31 BOR 2.5 2.17 1.97 1.29 1.19 2.71 2.63
N@Toe<=40 3.0 2.66 2.40 1.75 1.60 2.98 2.89 PDA 2.0 0.91 0.94 0.23 0.01 2.89 2.80 BOR 2.5 1.17 1.40 0.50 0.37 3.22 3.11
N@Toe>40 3.0 1.34 1.78 0.68 0.66 3.48 3.37 PDA 2.0 1.55 1.39 1.01 0.91 2.47 2.39 BOR 2.5 2.18 1.95 1.66 1.48 2.81 2.71 All 3.0 2.69 2.40 2.19 1.94 3.08 2.98
2.0 1.15 1.09 2.5 1.65 1.54
Static Load Tests
3.0 2.05 1.91
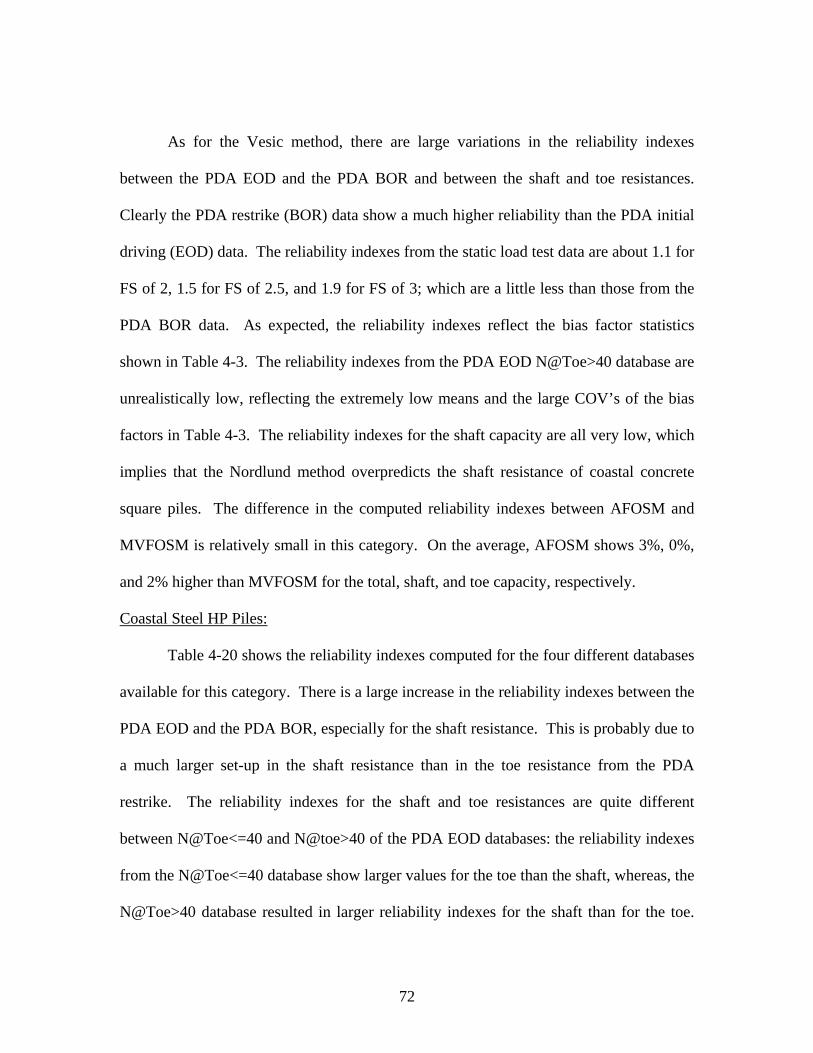
72
As for the Vesic method, there are large variations in the reliability indexes
between the PDA EOD and the PDA BOR and between the shaft and toe resistances.
Clearly the PDA restrike (BOR) data show a much higher reliability than the PDA initial
driving (EOD) data. The reliability indexes from the static load test data are about 1.1 for
FS of 2, 1.5 for FS of 2.5, and 1.9 for FS of 3; which are a little less than those from the
PDA BOR data. As expected, the reliability indexes reflect the bias factor statistics
shown in Table 4-3. The reliability indexes from the PDA EOD N@Toe>40 database are
unrealistically low, reflecting the extremely low means and the large COV’s of the bias
factors in Table 4-3. The reliability indexes for the shaft capacity are all very low, which
implies that the Nordlund method overpredicts the shaft resistance of coastal concrete
square piles. The difference in the computed reliability indexes between AFOSM and
MVFOSM is relatively small in this category. On the average, AFOSM shows 3%, 0%,
and 2% higher than MVFOSM for the total, shaft, and toe capacity, respectively.
Coastal Steel HP Piles:
Table 4-20 shows the reliability indexes computed for the four different databases
available for this category. There is a large increase in the reliability indexes between the
PDA EOD and the PDA BOR, especially for the shaft resistance. This is probably due to
a much larger set-up in the shaft resistance than in the toe resistance from the PDA
restrike. The reliability indexes for the shaft and toe resistances are quite different
between N@Toe<=40 and N@toe>40 of the PDA EOD databases: the reliability indexes
from the N@Toe<=40 database show larger values for the toe than the shaft, whereas, the
N@Toe>40 database resulted in larger reliability indexes for the shaft than for the toe.
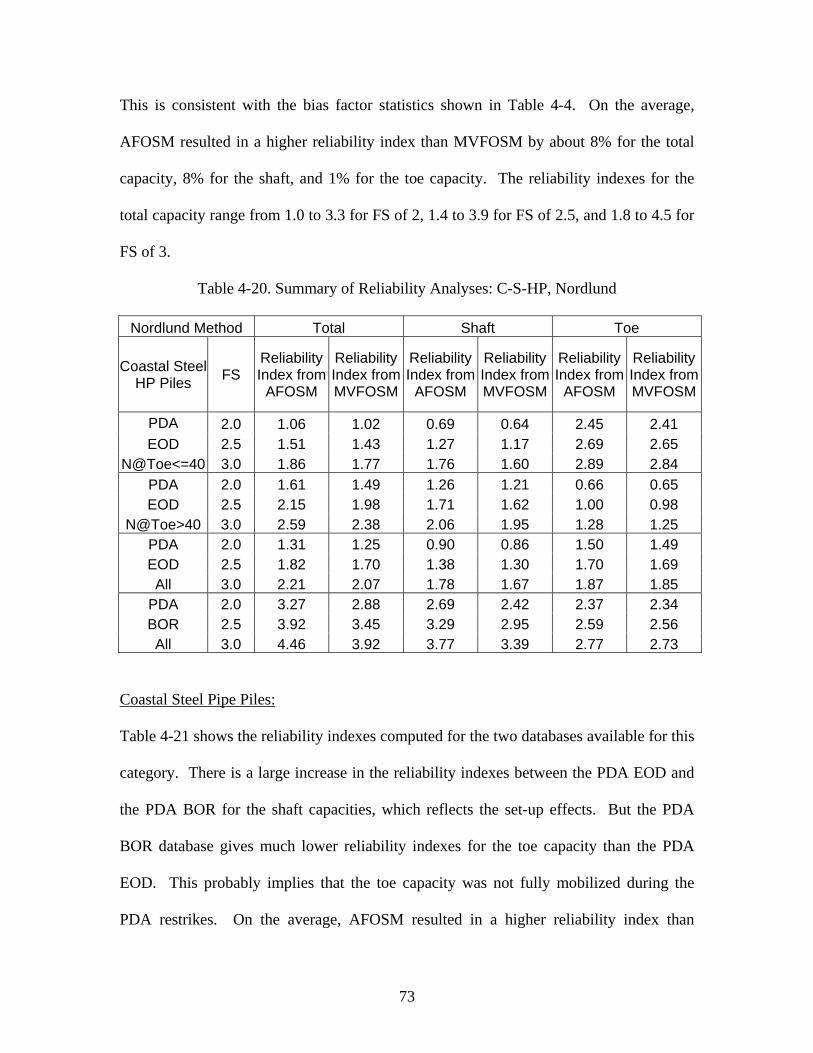
73
This is consistent with the bias factor statistics shown in Table 4-4. On the average,
AFOSM resulted in a higher reliability index than MVFOSM by about 8% for the total
capacity, 8% for the shaft, and 1% for the toe capacity. The reliability indexes for the
total capacity range from 1.0 to 3.3 for FS of 2, 1.4 to 3.9 for FS of 2.5, and 1.8 to 4.5 for
FS of 3.
Table 4-20. Summary of Reliability Analyses: C-S-HP, Nordlund
Nordlund Method Total Shaft Toe
Coastal Steel HP Piles FS
Reliability Index from
AFOSM
Reliability Index from MVFOSM
Reliability Index from
AFOSM
Reliability Index from MVFOSM
Reliability Index from
AFOSM
Reliability Index from MVFOSM
PDA 2.0 1.06 1.02 0.69 0.64 2.45 2.41 EOD 2.5 1.51 1.43 1.27 1.17 2.69 2.65
N@Toe<=40 3.0 1.86 1.77 1.76 1.60 2.89 2.84 PDA 2.0 1.61 1.49 1.26 1.21 0.66 0.65 EOD 2.5 2.15 1.98 1.71 1.62 1.00 0.98
N@Toe>40 3.0 2.59 2.38 2.06 1.95 1.28 1.25 PDA 2.0 1.31 1.25 0.90 0.86 1.50 1.49 EOD 2.5 1.82 1.70 1.38 1.30 1.70 1.69 All 3.0 2.21 2.07 1.78 1.67 1.87 1.85
PDA 2.0 3.27 2.88 2.69 2.42 2.37 2.34 BOR 2.5 3.92 3.45 3.29 2.95 2.59 2.56 All 3.0 4.46 3.92 3.77 3.39 2.77 2.73
Coastal Steel Pipe Piles:
Table 4-21 shows the reliability indexes computed for the two databases available for this
category. There is a large increase in the reliability indexes between the PDA EOD and
the PDA BOR for the shaft capacities, which reflects the set-up effects. But the PDA
BOR database gives much lower reliability indexes for the toe capacity than the PDA
EOD. This probably implies that the toe capacity was not fully mobilized during the
PDA restrikes. On the average, AFOSM resulted in a higher reliability index than
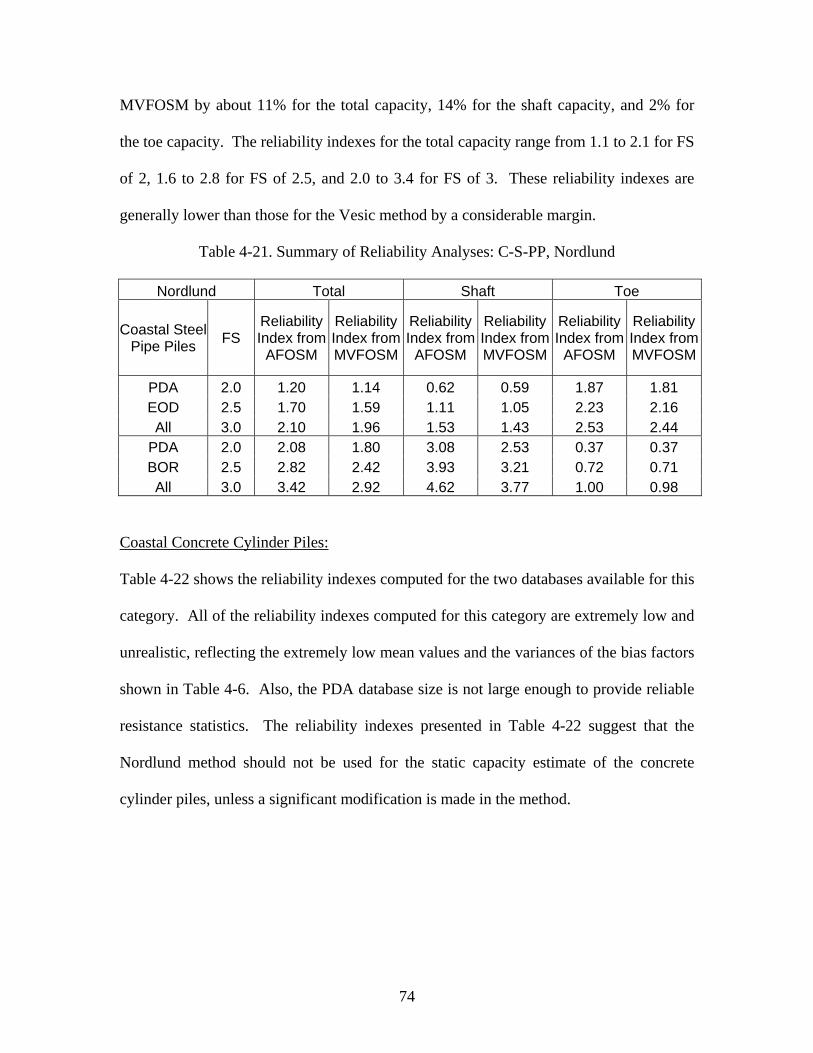
74
MVFOSM by about 11% for the total capacity, 14% for the shaft capacity, and 2% for
the toe capacity. The reliability indexes for the total capacity range from 1.1 to 2.1 for FS
of 2, 1.6 to 2.8 for FS of 2.5, and 2.0 to 3.4 for FS of 3. These reliability indexes are
generally lower than those for the Vesic method by a considerable margin.
Table 4-21. Summary of Reliability Analyses: C-S-PP, Nordlund
Nordlund Total Shaft Toe
Coastal Steel Pipe Piles FS
Reliability Index from
AFOSM
Reliability Index from MVFOSM
Reliability Index from
AFOSM
Reliability Index from MVFOSM
Reliability Index from
AFOSM
Reliability Index from MVFOSM
PDA 2.0 1.20 1.14 0.62 0.59 1.87 1.81 EOD 2.5 1.70 1.59 1.11 1.05 2.23 2.16 All 3.0 2.10 1.96 1.53 1.43 2.53 2.44
PDA 2.0 2.08 1.80 3.08 2.53 0.37 0.37 BOR 2.5 2.82 2.42 3.93 3.21 0.72 0.71 All 3.0 3.42 2.92 4.62 3.77 1.00 0.98
Coastal Concrete Cylinder Piles:
Table 4-22 shows the reliability indexes computed for the two databases available for this
category. All of the reliability indexes computed for this category are extremely low and
unrealistic, reflecting the extremely low mean values and the variances of the bias factors
shown in Table 4-6. Also, the PDA database size is not large enough to provide reliable
resistance statistics. The reliability indexes presented in Table 4-22 suggest that the
Nordlund method should not be used for the static capacity estimate of the concrete
cylinder piles, unless a significant modification is made in the method.
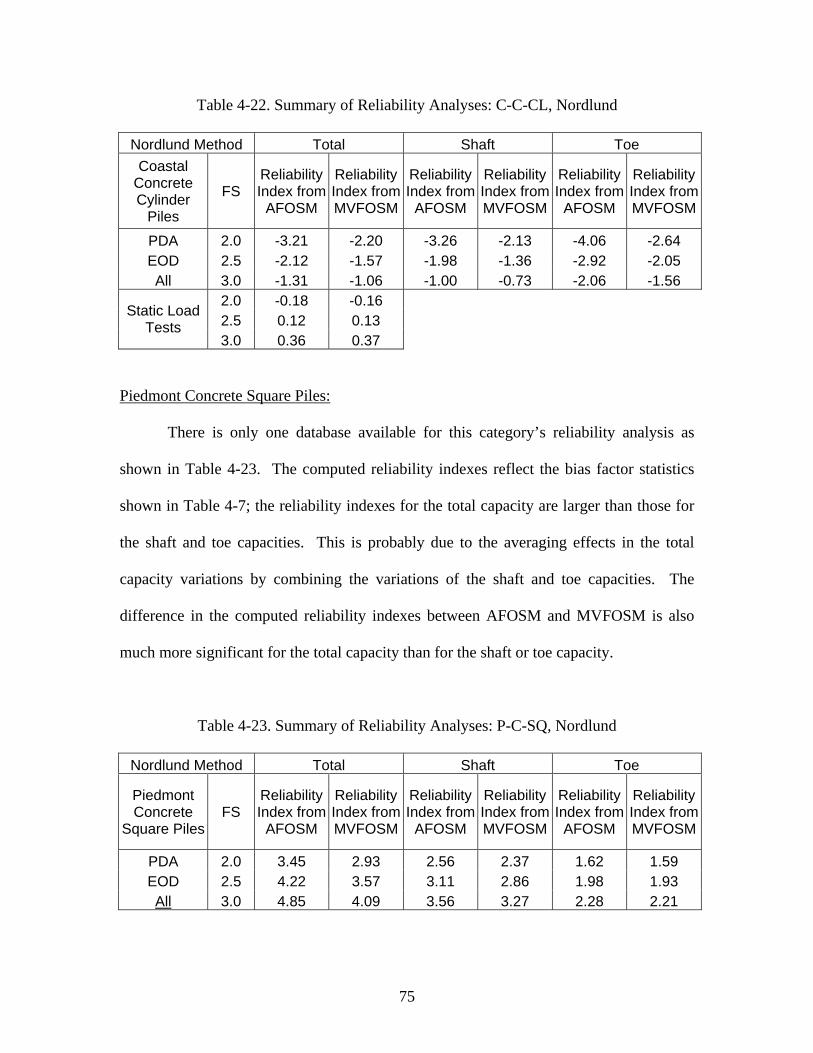
75
Table 4-22. Summary of Reliability Analyses: C-C-CL, Nordlund
Nordlund Method Total Shaft Toe Coastal
Concrete Cylinder
Piles
FS Reliability Index from
AFOSM
Reliability Index from MVFOSM
Reliability Index from
AFOSM
Reliability Index from MVFOSM
Reliability Index from
AFOSM
Reliability Index from MVFOSM
PDA 2.0 -3.21 -2.20 -3.26 -2.13 -4.06 -2.64 EOD 2.5 -2.12 -1.57 -1.98 -1.36 -2.92 -2.05 All 3.0 -1.31 -1.06 -1.00 -0.73 -2.06 -1.56
2.0 -0.18 -0.16 2.5 0.12 0.13
Static Load Tests
3.0 0.36 0.37
Piedmont Concrete Square Piles:
There is only one database available for this category’s reliability analysis as
shown in Table 4-23. The computed reliability indexes reflect the bias factor statistics
shown in Table 4-7; the reliability indexes for the total capacity are larger than those for
the shaft and toe capacities. This is probably due to the averaging effects in the total
capacity variations by combining the variations of the shaft and toe capacities. The
difference in the computed reliability indexes between AFOSM and MVFOSM is also
much more significant for the total capacity than for the shaft or toe capacity.
Table 4-23. Summary of Reliability Analyses: P-C-SQ, Nordlund
Nordlund Method Total Shaft Toe
Piedmont Concrete
Square Piles FS
Reliability Index from
AFOSM
Reliability Index from MVFOSM
Reliability Index from
AFOSM
Reliability Index from MVFOSM
Reliability Index from
AFOSM
Reliability Index from MVFOSM
PDA 2.0 3.45 2.93 2.56 2.37 1.62 1.59 EOD 2.5 4.22 3.57 3.11 2.86 1.98 1.93 All 3.0 4.85 4.09 3.56 3.27 2.28 2.21
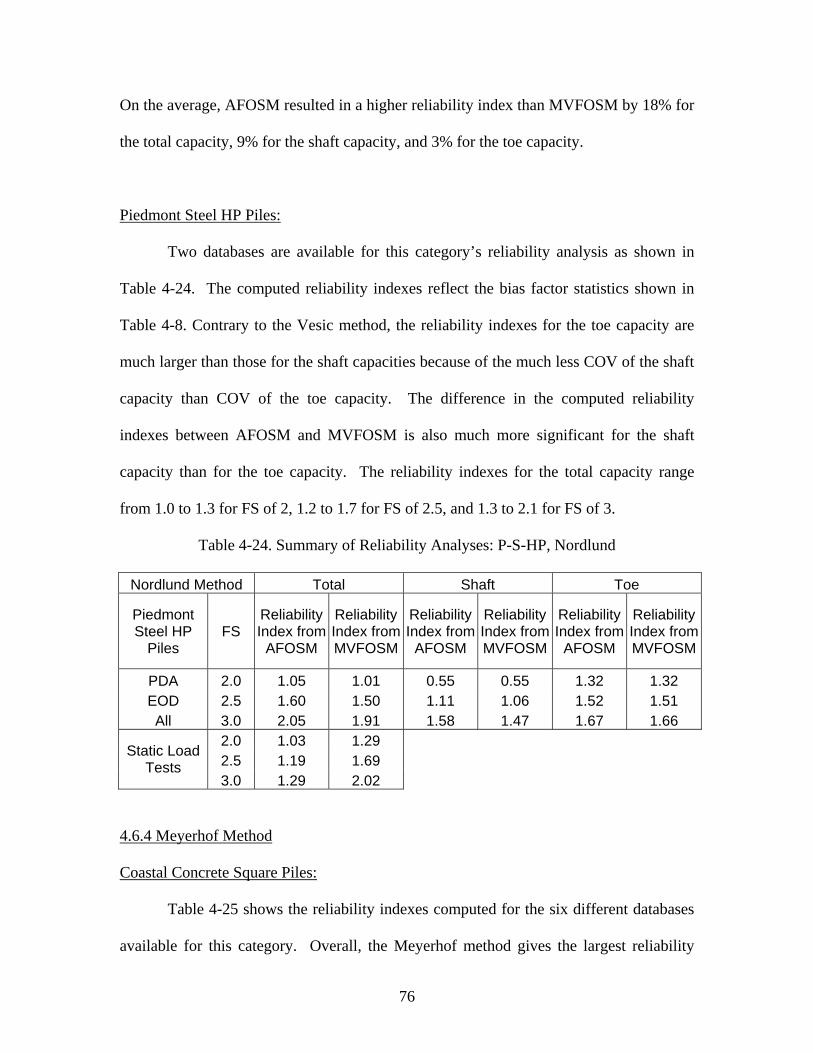
76
On the average, AFOSM resulted in a higher reliability index than MVFOSM by 18% for
the total capacity, 9% for the shaft capacity, and 3% for the toe capacity.
Piedmont Steel HP Piles:
Two databases are available for this category’s reliability analysis as shown in
Table 4-24. The computed reliability indexes reflect the bias factor statistics shown in
Table 4-8. Contrary to the Vesic method, the reliability indexes for the toe capacity are
much larger than those for the shaft capacities because of the much less COV of the shaft
capacity than COV of the toe capacity. The difference in the computed reliability
indexes between AFOSM and MVFOSM is also much more significant for the shaft
capacity than for the toe capacity. The reliability indexes for the total capacity range
from 1.0 to 1.3 for FS of 2, 1.2 to 1.7 for FS of 2.5, and 1.3 to 2.1 for FS of 3.
Table 4-24. Summary of Reliability Analyses: P-S-HP, Nordlund
Nordlund Method Total Shaft Toe
Piedmont Steel HP
Piles FS
Reliability Index from
AFOSM
Reliability Index from MVFOSM
Reliability Index from
AFOSM
Reliability Index from MVFOSM
Reliability Index from
AFOSM
Reliability Index from MVFOSM
PDA 2.0 1.05 1.01 0.55 0.55 1.32 1.32 EOD 2.5 1.60 1.50 1.11 1.06 1.52 1.51 All 3.0 2.05 1.91 1.58 1.47 1.67 1.66
2.0 1.03 1.29 2.5 1.19 1.69
Static Load Tests
3.0 1.29 2.02
4.6.4 Meyerhof Method
Coastal Concrete Square Piles:
Table 4-25 shows the reliability indexes computed for the six different databases
available for this category. Overall, the Meyerhof method gives the largest reliability
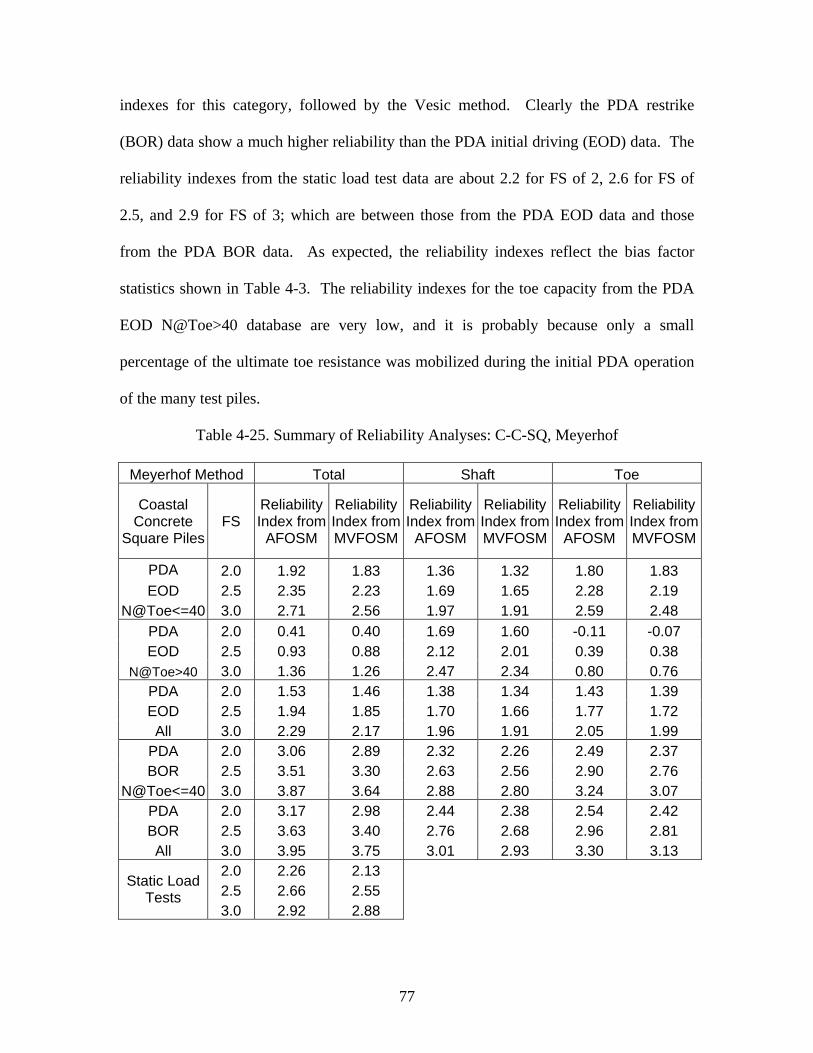
77
indexes for this category, followed by the Vesic method. Clearly the PDA restrike
(BOR) data show a much higher reliability than the PDA initial driving (EOD) data. The
reliability indexes from the static load test data are about 2.2 for FS of 2, 2.6 for FS of
2.5, and 2.9 for FS of 3; which are between those from the PDA EOD data and those
from the PDA BOR data. As expected, the reliability indexes reflect the bias factor
statistics shown in Table 4-3. The reliability indexes for the toe capacity from the PDA
EOD N@Toe>40 database are very low, and it is probably because only a small
percentage of the ultimate toe resistance was mobilized during the initial PDA operation
of the many test piles.
Table 4-25. Summary of Reliability Analyses: C-C-SQ, Meyerhof
Meyerhof Method Total Shaft Toe
Coastal Concrete
Square Piles FS
Reliability Index from
AFOSM
Reliability Index from MVFOSM
Reliability Index from
AFOSM
Reliability Index from MVFOSM
Reliability Index from
AFOSM
Reliability Index from MVFOSM
PDA 2.0 1.92 1.83 1.36 1.32 1.80 1.83 EOD 2.5 2.35 2.23 1.69 1.65 2.28 2.19
N@Toe<=40 3.0 2.71 2.56 1.97 1.91 2.59 2.48 PDA 2.0 0.41 0.40 1.69 1.60 -0.11 -0.07 EOD 2.5 0.93 0.88 2.12 2.01 0.39 0.38
N@Toe>40 3.0 1.36 1.26 2.47 2.34 0.80 0.76 PDA 2.0 1.53 1.46 1.38 1.34 1.43 1.39 EOD 2.5 1.94 1.85 1.70 1.66 1.77 1.72 All 3.0 2.29 2.17 1.96 1.91 2.05 1.99
PDA 2.0 3.06 2.89 2.32 2.26 2.49 2.37 BOR 2.5 3.51 3.30 2.63 2.56 2.90 2.76
N@Toe<=40 3.0 3.87 3.64 2.88 2.80 3.24 3.07 PDA 2.0 3.17 2.98 2.44 2.38 2.54 2.42 BOR 2.5 3.63 3.40 2.76 2.68 2.96 2.81 All 3.0 3.95 3.75 3.01 2.93 3.30 3.13
2.0 2.26 2.13 2.5 2.66 2.55
Static Load Tests
3.0 2.92 2.88
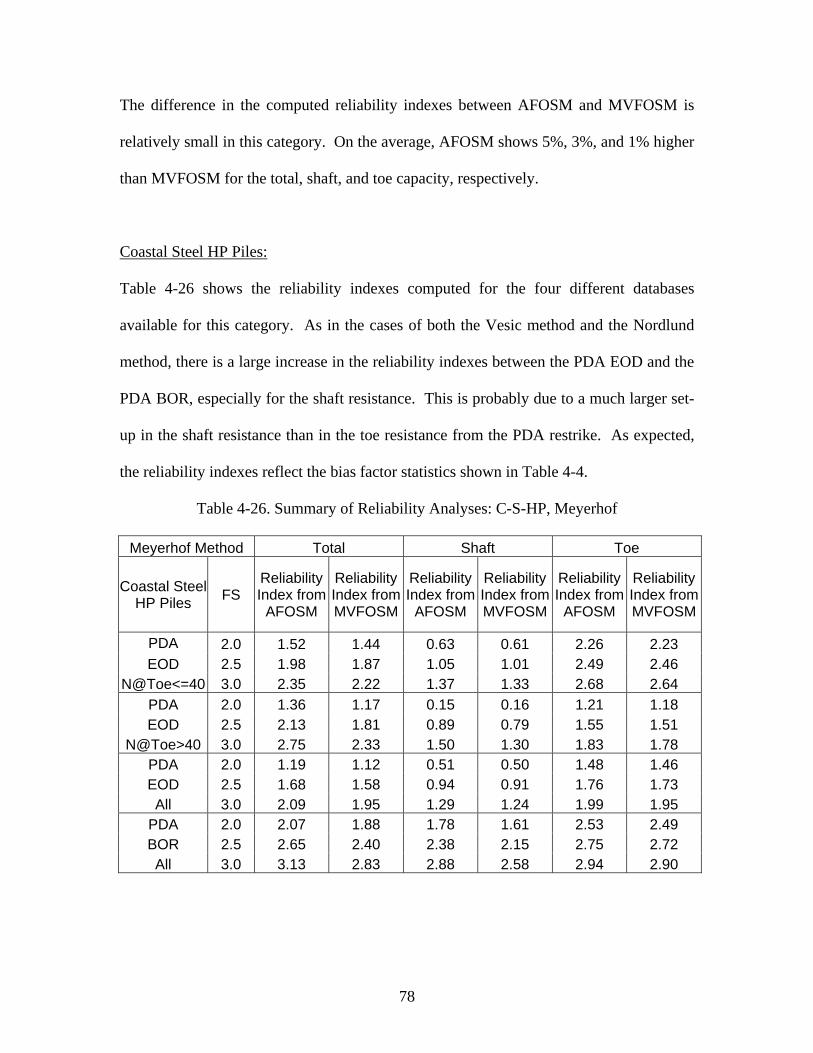
78
The difference in the computed reliability indexes between AFOSM and MVFOSM is
relatively small in this category. On the average, AFOSM shows 5%, 3%, and 1% higher
than MVFOSM for the total, shaft, and toe capacity, respectively.
Coastal Steel HP Piles:
Table 4-26 shows the reliability indexes computed for the four different databases
available for this category. As in the cases of both the Vesic method and the Nordlund
method, there is a large increase in the reliability indexes between the PDA EOD and the
PDA BOR, especially for the shaft resistance. This is probably due to a much larger set-
up in the shaft resistance than in the toe resistance from the PDA restrike. As expected,
the reliability indexes reflect the bias factor statistics shown in Table 4-4.
Table 4-26. Summary of Reliability Analyses: C-S-HP, Meyerhof
Meyerhof Method Total Shaft Toe
Coastal Steel HP Piles FS
Reliability Index from
AFOSM
Reliability Index from MVFOSM
Reliability Index from
AFOSM
Reliability Index from MVFOSM
Reliability Index from
AFOSM
Reliability Index from MVFOSM
PDA 2.0 1.52 1.44 0.63 0.61 2.26 2.23 EOD 2.5 1.98 1.87 1.05 1.01 2.49 2.46
N@Toe<=40 3.0 2.35 2.22 1.37 1.33 2.68 2.64 PDA 2.0 1.36 1.17 0.15 0.16 1.21 1.18 EOD 2.5 2.13 1.81 0.89 0.79 1.55 1.51
N@Toe>40 3.0 2.75 2.33 1.50 1.30 1.83 1.78 PDA 2.0 1.19 1.12 0.51 0.50 1.48 1.46 EOD 2.5 1.68 1.58 0.94 0.91 1.76 1.73 All 3.0 2.09 1.95 1.29 1.24 1.99 1.95
PDA 2.0 2.07 1.88 1.78 1.61 2.53 2.49 BOR 2.5 2.65 2.40 2.38 2.15 2.75 2.72 All 3.0 3.13 2.83 2.88 2.58 2.94 2.90
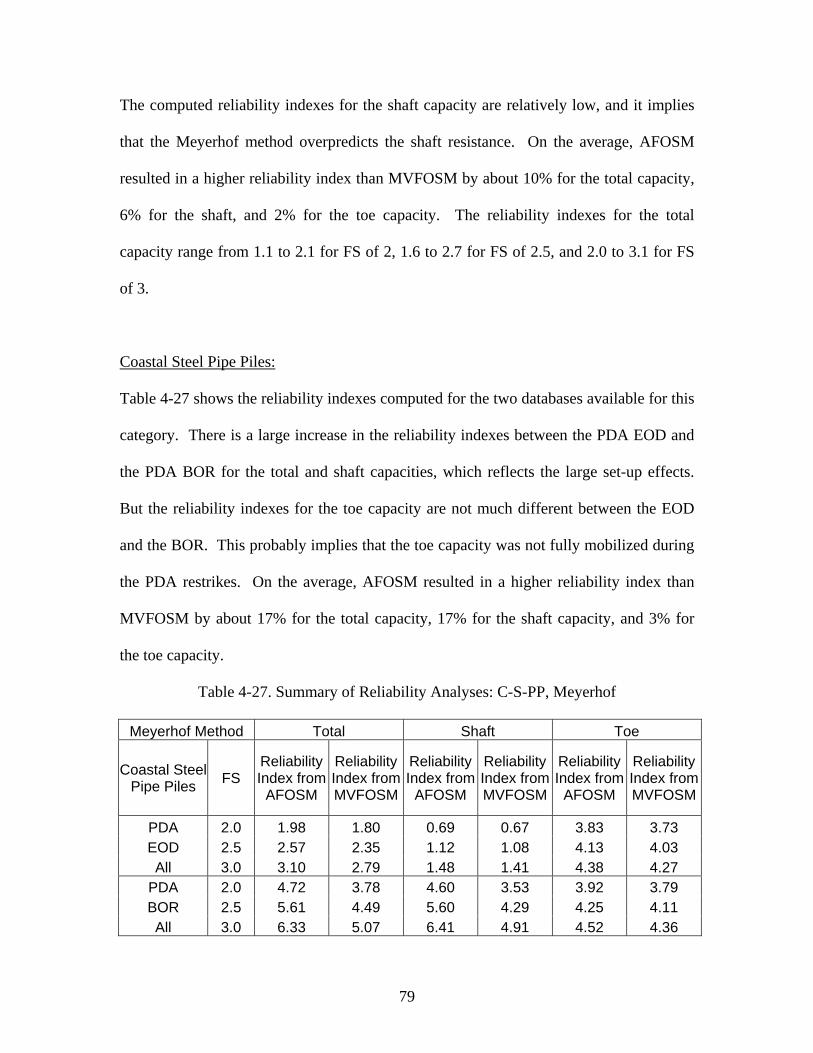
79
The computed reliability indexes for the shaft capacity are relatively low, and it implies
that the Meyerhof method overpredicts the shaft resistance. On the average, AFOSM
resulted in a higher reliability index than MVFOSM by about 10% for the total capacity,
6% for the shaft, and 2% for the toe capacity. The reliability indexes for the total
capacity range from 1.1 to 2.1 for FS of 2, 1.6 to 2.7 for FS of 2.5, and 2.0 to 3.1 for FS
of 3.
Coastal Steel Pipe Piles:
Table 4-27 shows the reliability indexes computed for the two databases available for this
category. There is a large increase in the reliability indexes between the PDA EOD and
the PDA BOR for the total and shaft capacities, which reflects the large set-up effects.
But the reliability indexes for the toe capacity are not much different between the EOD
and the BOR. This probably implies that the toe capacity was not fully mobilized during
the PDA restrikes. On the average, AFOSM resulted in a higher reliability index than
MVFOSM by about 17% for the total capacity, 17% for the shaft capacity, and 3% for
the toe capacity.
Table 4-27. Summary of Reliability Analyses: C-S-PP, Meyerhof
Meyerhof Method Total Shaft Toe
Coastal Steel Pipe Piles FS
Reliability Index from
AFOSM
Reliability Index from MVFOSM
Reliability Index from
AFOSM
Reliability Index from MVFOSM
Reliability Index from
AFOSM
Reliability Index from MVFOSM
PDA 2.0 1.98 1.80 0.69 0.67 3.83 3.73 EOD 2.5 2.57 2.35 1.12 1.08 4.13 4.03 All 3.0 3.10 2.79 1.48 1.41 4.38 4.27
PDA 2.0 4.72 3.78 4.60 3.53 3.92 3.79 BOR 2.5 5.61 4.49 5.60 4.29 4.25 4.11 All 3.0 6.33 5.07 6.41 4.91 4.52 4.36
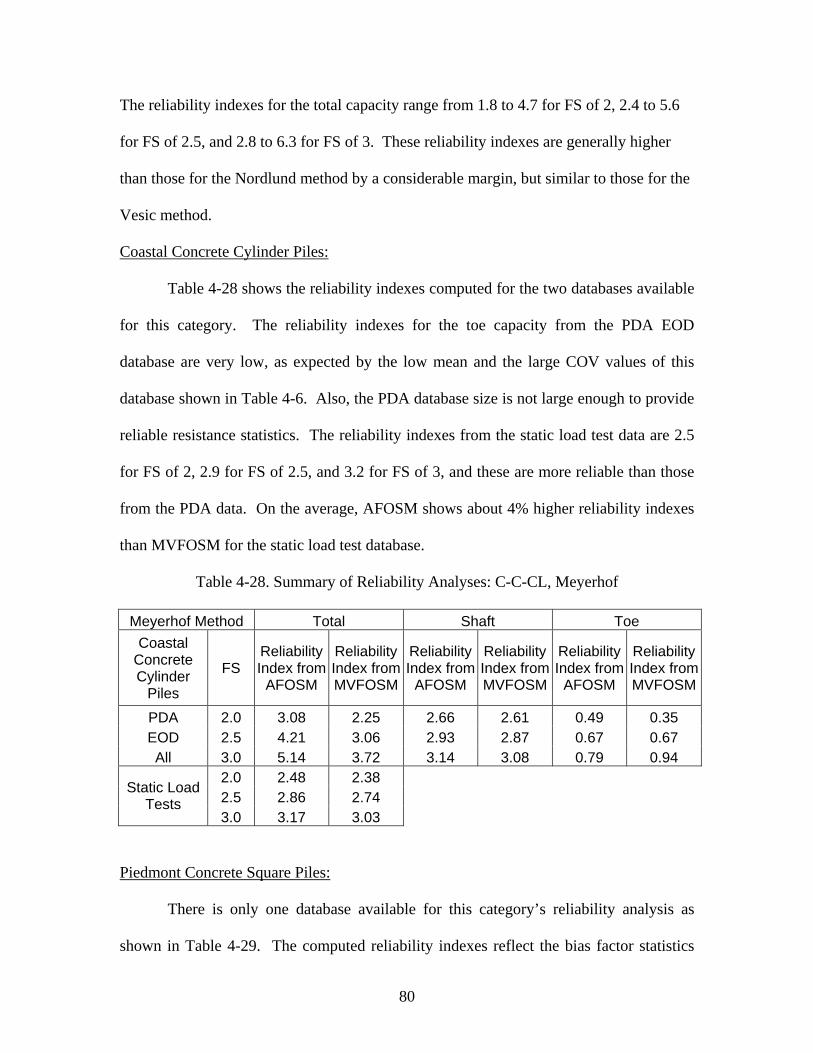
80
The reliability indexes for the total capacity range from 1.8 to 4.7 for FS of 2, 2.4 to 5.6
for FS of 2.5, and 2.8 to 6.3 for FS of 3. These reliability indexes are generally higher
than those for the Nordlund method by a considerable margin, but similar to those for the
Vesic method.
Coastal Concrete Cylinder Piles:
Table 4-28 shows the reliability indexes computed for the two databases available
for this category. The reliability indexes for the toe capacity from the PDA EOD
database are very low, as expected by the low mean and the large COV values of this
database shown in Table 4-6. Also, the PDA database size is not large enough to provide
reliable resistance statistics. The reliability indexes from the static load test data are 2.5
for FS of 2, 2.9 for FS of 2.5, and 3.2 for FS of 3, and these are more reliable than those
from the PDA data. On the average, AFOSM shows about 4% higher reliability indexes
than MVFOSM for the static load test database.
Table 4-28. Summary of Reliability Analyses: C-C-CL, Meyerhof
Meyerhof Method Total Shaft Toe Coastal
Concrete Cylinder
Piles
FS Reliability Index from
AFOSM
Reliability Index from MVFOSM
Reliability Index from
AFOSM
Reliability Index from MVFOSM
Reliability Index from
AFOSM
Reliability Index from MVFOSM
PDA 2.0 3.08 2.25 2.66 2.61 0.49 0.35 EOD 2.5 4.21 3.06 2.93 2.87 0.67 0.67 All 3.0 5.14 3.72 3.14 3.08 0.79 0.94
2.0 2.48 2.38 2.5 2.86 2.74
Static Load Tests
3.0 3.17 3.03
Piedmont Concrete Square Piles:
There is only one database available for this category’s reliability analysis as
shown in Table 4-29. The computed reliability indexes reflect the bias factor statistics
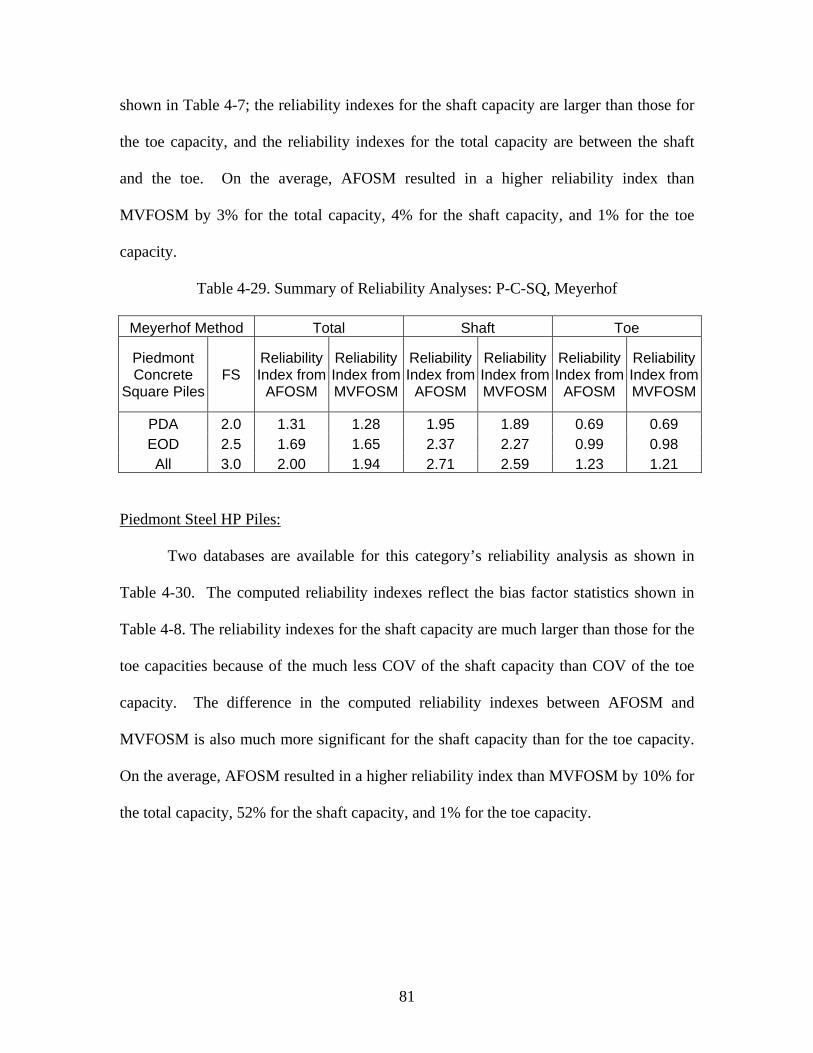
81
shown in Table 4-7; the reliability indexes for the shaft capacity are larger than those for
the toe capacity, and the reliability indexes for the total capacity are between the shaft
and the toe. On the average, AFOSM resulted in a higher reliability index than
MVFOSM by 3% for the total capacity, 4% for the shaft capacity, and 1% for the toe
capacity.
Table 4-29. Summary of Reliability Analyses: P-C-SQ, Meyerhof
Meyerhof Method Total Shaft Toe
Piedmont Concrete
Square Piles FS
Reliability Index from
AFOSM
Reliability Index from MVFOSM
Reliability Index from
AFOSM
Reliability Index from MVFOSM
Reliability Index from
AFOSM
Reliability Index from MVFOSM
PDA 2.0 1.31 1.28 1.95 1.89 0.69 0.69 EOD 2.5 1.69 1.65 2.37 2.27 0.99 0.98 All 3.0 2.00 1.94 2.71 2.59 1.23 1.21
Piedmont Steel HP Piles:
Two databases are available for this category’s reliability analysis as shown in
Table 4-30. The computed reliability indexes reflect the bias factor statistics shown in
Table 4-8. The reliability indexes for the shaft capacity are much larger than those for the
toe capacities because of the much less COV of the shaft capacity than COV of the toe
capacity. The difference in the computed reliability indexes between AFOSM and
MVFOSM is also much more significant for the shaft capacity than for the toe capacity.
On the average, AFOSM resulted in a higher reliability index than MVFOSM by 10% for
the total capacity, 52% for the shaft capacity, and 1% for the toe capacity.
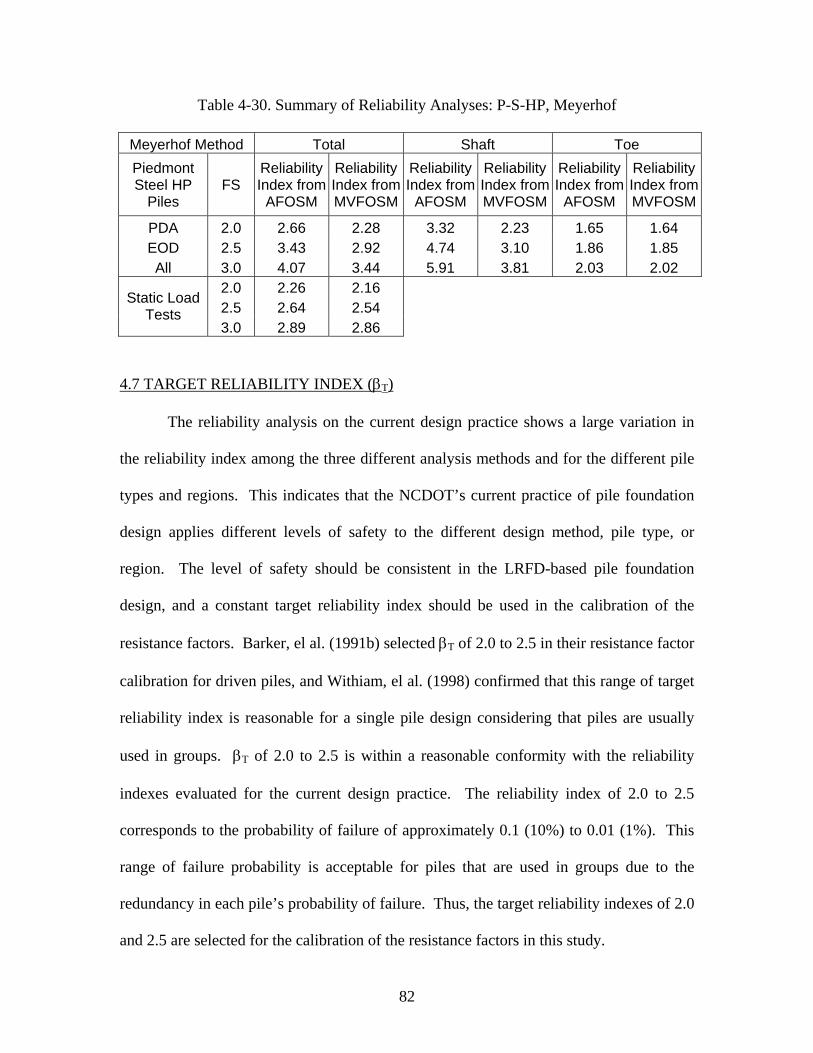
82
Table 4-30. Summary of Reliability Analyses: P-S-HP, Meyerhof
Meyerhof Method Total Shaft Toe Piedmont Steel HP
Piles FS
Reliability Index from
AFOSM
Reliability Index from MVFOSM
Reliability Index from
AFOSM
Reliability Index from MVFOSM
Reliability Index from
AFOSM
Reliability Index from MVFOSM
PDA 2.0 2.66 2.28 3.32 2.23 1.65 1.64 EOD 2.5 3.43 2.92 4.74 3.10 1.86 1.85 All 3.0 4.07 3.44 5.91 3.81 2.03 2.02
2.0 2.26 2.16 2.5 2.64 2.54
Static Load Tests
3.0 2.89 2.86
4.7 TARGET RELIABILITY INDEX (βT)
The reliability analysis on the current design practice shows a large variation in
the reliability index among the three different analysis methods and for the different pile
types and regions. This indicates that the NCDOT’s current practice of pile foundation
design applies different levels of safety to the different design method, pile type, or
region. The level of safety should be consistent in the LRFD-based pile foundation
design, and a constant target reliability index should be used in the calibration of the
resistance factors. Barker, el al. (1991b) selected βT of 2.0 to 2.5 in their resistance factor
calibration for driven piles, and Withiam, el al. (1998) confirmed that this range of target
reliability index is reasonable for a single pile design considering that piles are usually
used in groups. βT of 2.0 to 2.5 is within a reasonable conformity with the reliability
indexes evaluated for the current design practice. The reliability index of 2.0 to 2.5
corresponds to the probability of failure of approximately 0.1 (10%) to 0.01 (1%). This
range of failure probability is acceptable for piles that are used in groups due to the
redundancy in each pile’s probability of failure. Thus, the target reliability indexes of 2.0
and 2.5 are selected for the calibration of the resistance factors in this study.
83
CHAPTER 5. CALIBRATION OF RESISTANCE FACTORS
5.1 INTRODUCTION
Information from load statistics, resistance statistics, and the reliability analysis
are used for calibration process of resistance factors. Calibration is the process of
assigning values to the resistance factors or the load factors. In this study, calibration
was performed only for the resistance factors since predetermined load factors in the
current AASHTO LRFD specifications will be used. This research was focused on
developing the resistance factors in the LRFD approach of the axial capacity of driven
piles. Calibration was performed based on the three static pile capacity analysis methods
(Vesic, Nordlund, and Meyerhof) for each of the six categories of the resistance statistics:
coastal concrete square pile, coastal steel HP pile, coastal steel pipe pile, coastal concrete
cylinder pile, piedmont concrete square pile, and piedmont steel HP pile. The resistance
factors for total, skin, and toe capacities were calibrated separately. Also, calibration was
performed on every available database of the resistance statistics from the PDA initial
driving (EOD), the PDA restrike (BOR), the static load test, and the Bayesian updating.
In chapter 4, two types of the first order reliability methods were utilized for the
reliability analysis: MVFOSM and AFOSM. Results show some difference in the
computed reliability indexes between the two methods. This warrants that the two
methods be used for the calibration of the resistance factors. Calibration of the resistance
factors was performed for two target reliability indexes of 2.0 and 2.5, using the two
reliability methods. A brief description of each of the reliability method is presented
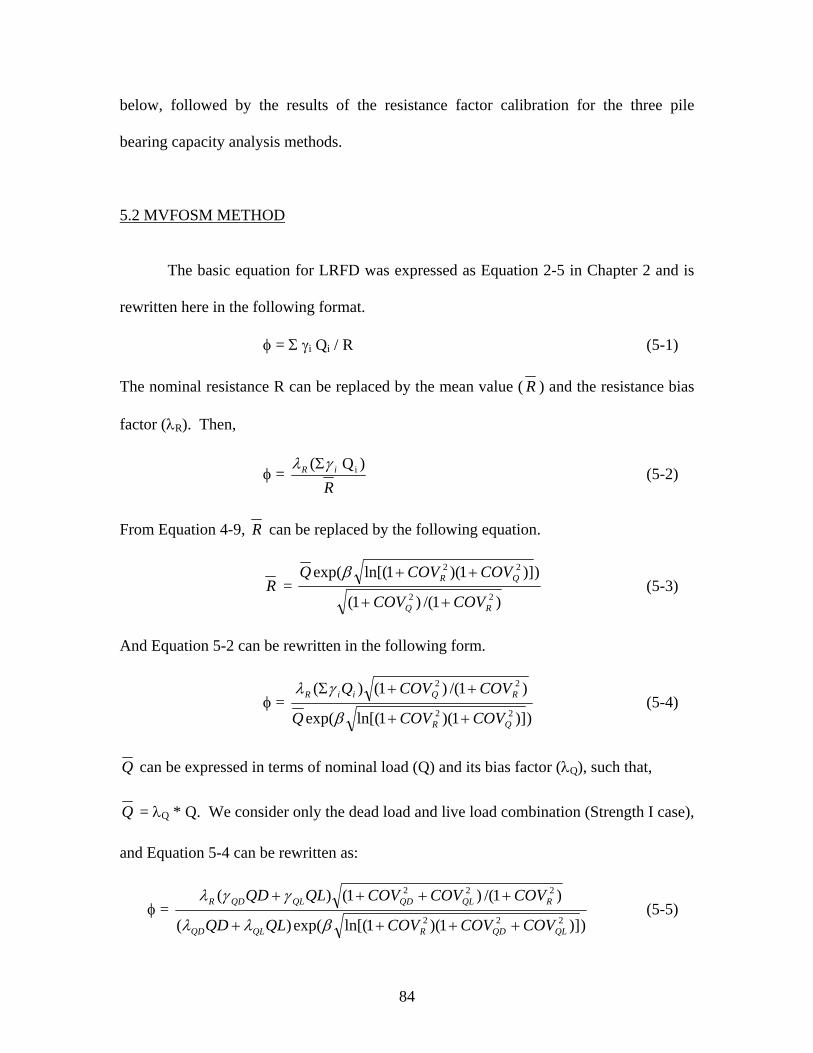
84
below, followed by the results of the resistance factor calibration for the three pile
bearing capacity analysis methods.
5.2 MVFOSM METHOD
The basic equation for LRFD was expressed as Equation 2-5 in Chapter 2 and is
rewritten here in the following format.
φ = Σ γi Qi / R (5-1)
The nominal resistance R can be replaced by the mean value ( R ) and the resistance bias
factor (λR). Then,
φ = R
iR )Q ( iγλ Σ (5-2)
From Equation 4-9, R can be replaced by the following equation.
R = )1/()1(
))]1)(1ln[(exp(22
22
RQ
QR
COVCOV
COVCOVQ
++
++β (5-3)
And Equation 5-2 can be rewritten in the following form.
φ = ))]1)(1ln[(exp(
)1/()1()(22
22
QR
RQiiR
COVCOVQ
COVCOVQ
++
++Σ
β
γλ (5-4)
Q can be expressed in terms of nominal load (Q) and its bias factor (λQ), such that,
Q = λQ * Q. We consider only the dead load and live load combination (Strength I case),
and Equation 5-4 can be rewritten as:
φ = ))]1)(1ln[(exp()(
)1/()1()(222
222
QLQDRQLQD
RQLQDQLQDR
COVCOVCOVQLQD
COVCOVCOVQLQD
++++
++++
βλλ
γγλ (5-5)
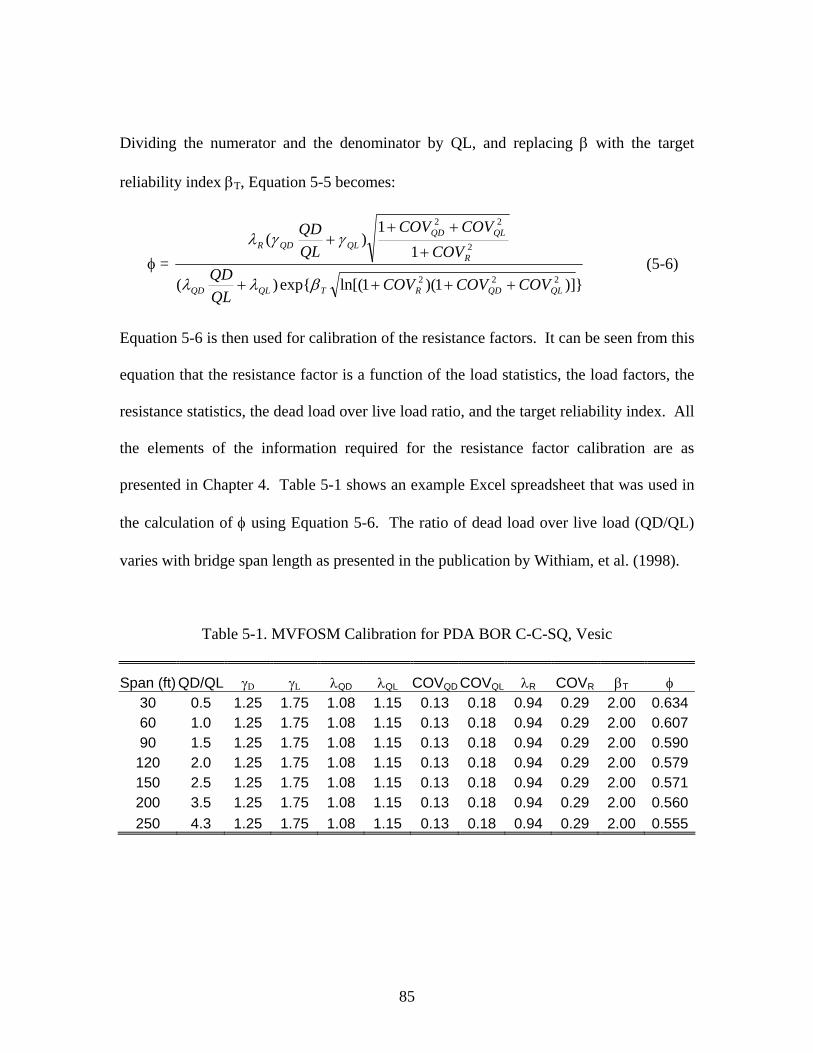
85
Dividing the numerator and the denominator by QL, and replacing β with the target
reliability index βT, Equation 5-5 becomes:
φ = })]1)(1ln[(exp{)(
11
)(
222
2
22
QLQDRTQLQD
R
QLQDQLQDR
COVCOVCOVQLQD
COVCOVCOV
QLQD
++++
+
+++
βλλ
γγλ (5-6)
Equation 5-6 is then used for calibration of the resistance factors. It can be seen from this
equation that the resistance factor is a function of the load statistics, the load factors, the
resistance statistics, the dead load over live load ratio, and the target reliability index. All
the elements of the information required for the resistance factor calibration are as
presented in Chapter 4. Table 5-1 shows an example Excel spreadsheet that was used in
the calculation of φ using Equation 5-6. The ratio of dead load over live load (QD/QL)
varies with bridge span length as presented in the publication by Withiam, et al. (1998).
Table 5-1. MVFOSM Calibration for PDA BOR C-C-SQ, Vesic
Span (ft) QD/QL γD γL λQD λQL COVQD COVQL λR COVR βT φ 30 0.5 1.25 1.75 1.08 1.15 0.13 0.18 0.94 0.29 2.00 0.63460 1.0 1.25 1.75 1.08 1.15 0.13 0.18 0.94 0.29 2.00 0.60790 1.5 1.25 1.75 1.08 1.15 0.13 0.18 0.94 0.29 2.00 0.590
120 2.0 1.25 1.75 1.08 1.15 0.13 0.18 0.94 0.29 2.00 0.579150 2.5 1.25 1.75 1.08 1.15 0.13 0.18 0.94 0.29 2.00 0.571200 3.5 1.25 1.75 1.08 1.15 0.13 0.18 0.94 0.29 2.00 0.560250 4.3 1.25 1.75 1.08 1.15 0.13 0.18 0.94 0.29 2.00 0.555
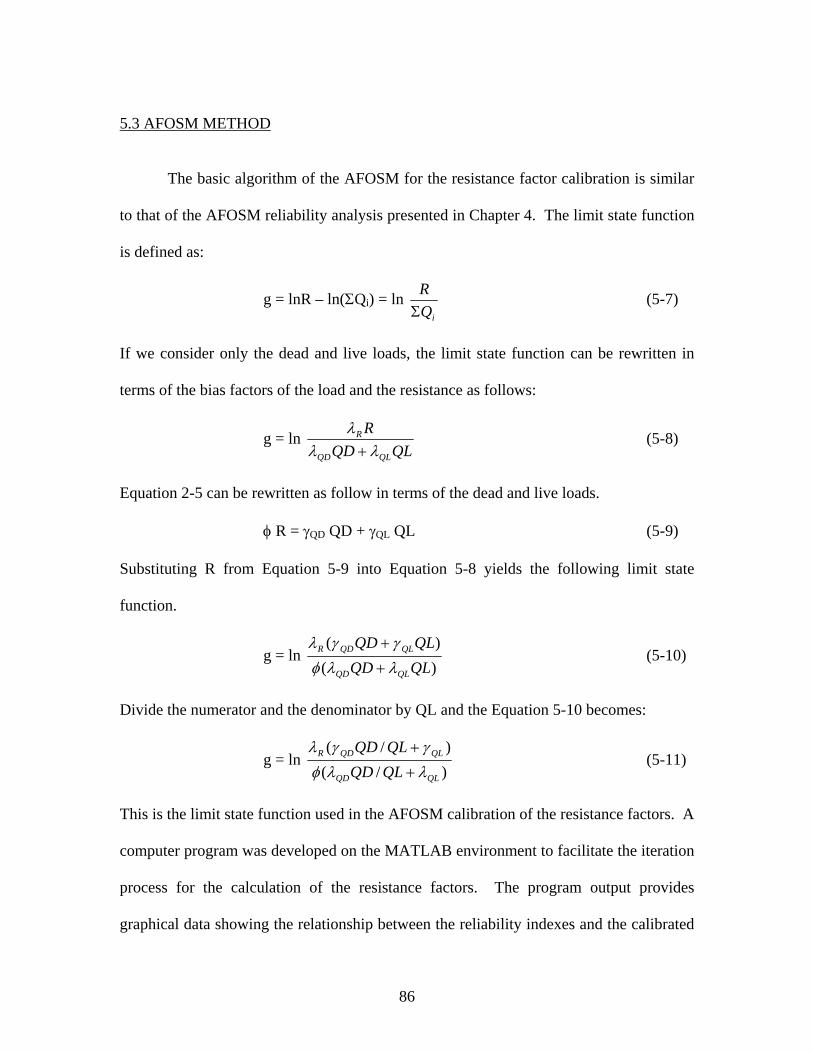
86
5.3 AFOSM METHOD
The basic algorithm of the AFOSM for the resistance factor calibration is similar
to that of the AFOSM reliability analysis presented in Chapter 4. The limit state function
is defined as:
g = lnR – ln(ΣQi) = ln iQ
RΣ
(5-7)
If we consider only the dead and live loads, the limit state function can be rewritten in
terms of the bias factors of the load and the resistance as follows:
g = ln QLQD
R
QLQD
R
λλλ
+ (5-8)
Equation 2-5 can be rewritten as follow in terms of the dead and live loads.
φ R = γQD QD + γQL QL (5-9)
Substituting R from Equation 5-9 into Equation 5-8 yields the following limit state
function.
g = ln )()(
QLQDQLQD
QLQD
QLQDR
λλφγγλ
+
+ (5-10)
Divide the numerator and the denominator by QL and the Equation 5-10 becomes:
g = ln )/()/(
QLQD
QLQDR
QLQDQLQD
λλφγγλ
+
+ (5-11)
This is the limit state function used in the AFOSM calibration of the resistance factors. A
computer program was developed on the MATLAB environment to facilitate the iteration
process for the calculation of the resistance factors. The program output provides
graphical data showing the relationship between the reliability indexes and the calibrated
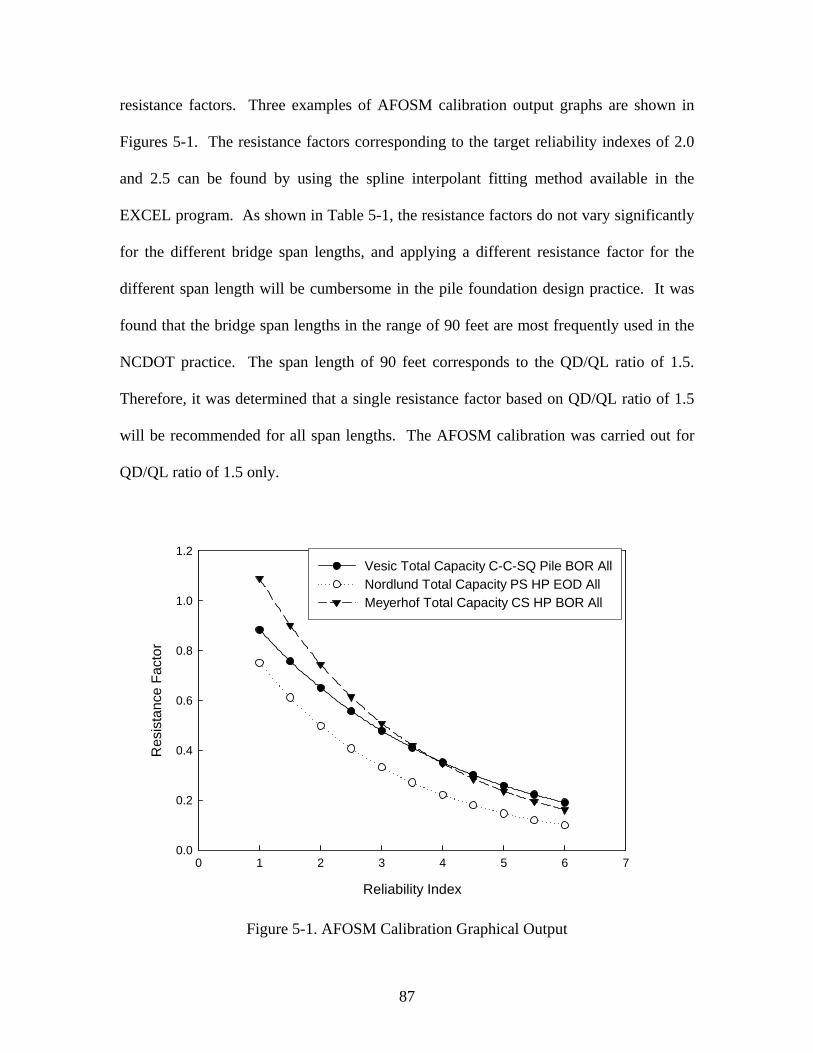
87
resistance factors. Three examples of AFOSM calibration output graphs are shown in
Figures 5-1. The resistance factors corresponding to the target reliability indexes of 2.0
and 2.5 can be found by using the spline interpolant fitting method available in the
EXCEL program. As shown in Table 5-1, the resistance factors do not vary significantly
for the different bridge span lengths, and applying a different resistance factor for the
different span length will be cumbersome in the pile foundation design practice. It was
found that the bridge span lengths in the range of 90 feet are most frequently used in the
NCDOT practice. The span length of 90 feet corresponds to the QD/QL ratio of 1.5.
Therefore, it was determined that a single resistance factor based on QD/QL ratio of 1.5
will be recommended for all span lengths. The AFOSM calibration was carried out for
QD/QL ratio of 1.5 only.
Reliability Index
0 1 2 3 4 5 6 7
Res
ista
nce
Fact
or
0.0
0.2
0.4
0.6
0.8
1.0
1.2Vesic Total Capacity C-C-SQ Pile BOR AllNordlund Total Capacity PS HP EOD AllMeyerhof Total Capacity CS HP BOR All
Figure 5-1. AFOSM Calibration Graphical Output
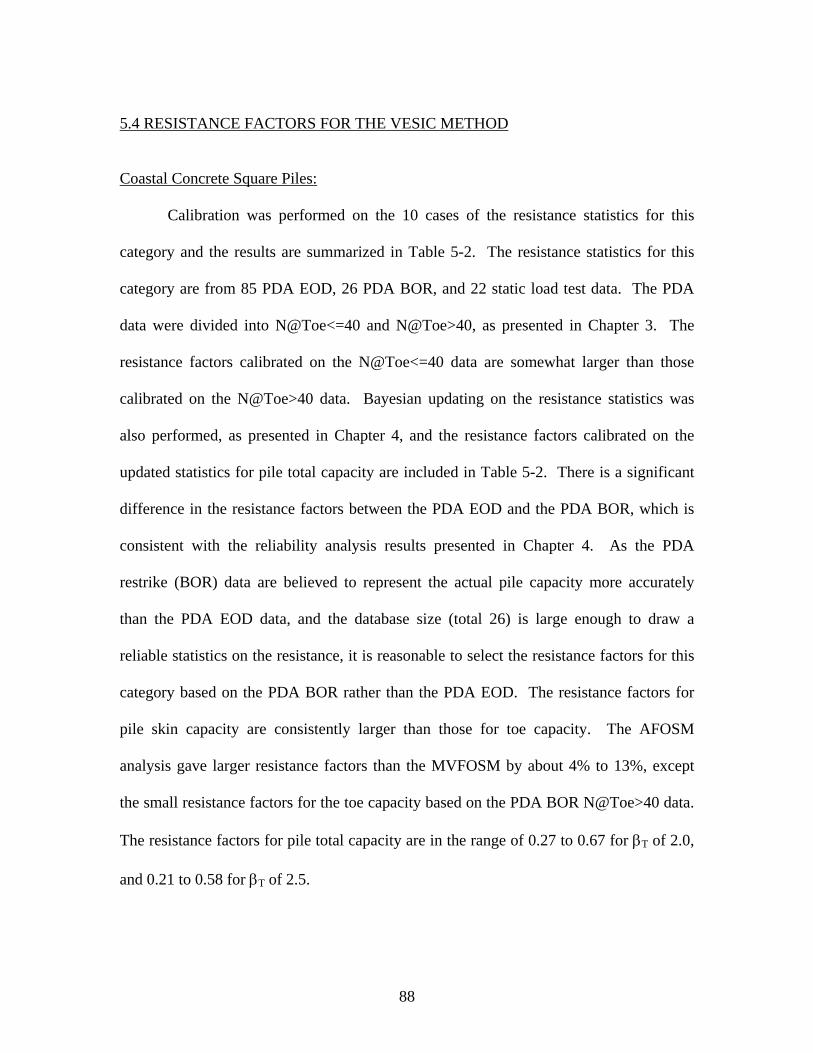
88
5.4 RESISTANCE FACTORS FOR THE VESIC METHOD
Coastal Concrete Square Piles:
Calibration was performed on the 10 cases of the resistance statistics for this
category and the results are summarized in Table 5-2. The resistance statistics for this
category are from 85 PDA EOD, 26 PDA BOR, and 22 static load test data. The PDA
data were divided into N@Toe<=40 and N@Toe>40, as presented in Chapter 3. The
resistance factors calibrated on the N@Toe<=40 data are somewhat larger than those
calibrated on the N@Toe>40 data. Bayesian updating on the resistance statistics was
also performed, as presented in Chapter 4, and the resistance factors calibrated on the
updated statistics for pile total capacity are included in Table 5-2. There is a significant
difference in the resistance factors between the PDA EOD and the PDA BOR, which is
consistent with the reliability analysis results presented in Chapter 4. As the PDA
restrike (BOR) data are believed to represent the actual pile capacity more accurately
than the PDA EOD data, and the database size (total 26) is large enough to draw a
reliable statistics on the resistance, it is reasonable to select the resistance factors for this
category based on the PDA BOR rather than the PDA EOD. The resistance factors for
pile skin capacity are consistently larger than those for toe capacity. The AFOSM
analysis gave larger resistance factors than the MVFOSM by about 4% to 13%, except
the small resistance factors for the toe capacity based on the PDA BOR N@Toe>40 data.
The resistance factors for pile total capacity are in the range of 0.27 to 0.67 for βT of 2.0,
and 0.21 to 0.58 for βT of 2.5.
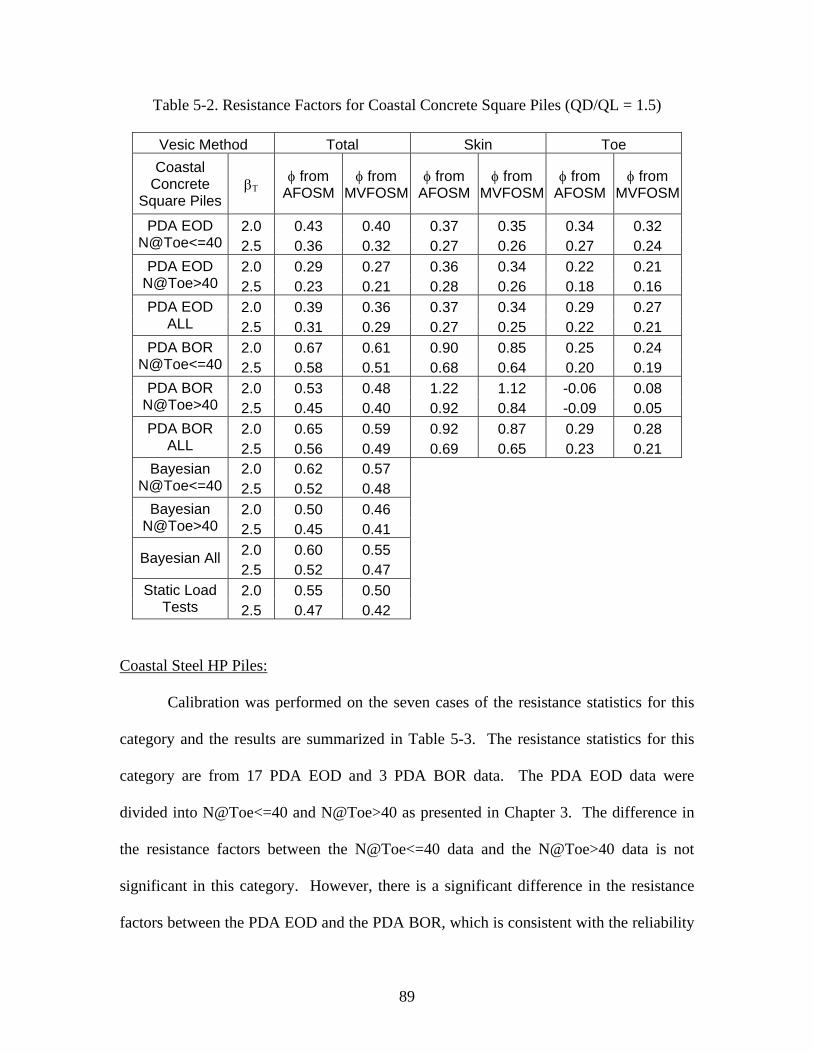
89
Table 5-2. Resistance Factors for Coastal Concrete Square Piles (QD/QL = 1.5)
Vesic Method Total Skin Toe Coastal
Concrete Square Piles
βΤ φ from AFOSM
φ from MVFOSM
φ from AFOSM
φ from MVFOSM
φ from AFOSM
φ from MVFOSM
2.0 0.43 0.40 0.37 0.35 0.34 0.32 PDA EOD N@Toe<=40 2.5 0.36 0.32 0.27 0.26 0.27 0.24
2.0 0.29 0.27 0.36 0.34 0.22 0.21 PDA EOD N@Toe>40 2.5 0.23 0.21 0.28 0.26 0.18 0.16
2.0 0.39 0.36 0.37 0.34 0.29 0.27 PDA EOD ALL 2.5 0.31 0.29 0.27 0.25 0.22 0.21
2.0 0.67 0.61 0.90 0.85 0.25 0.24 PDA BOR N@Toe<=40 2.5 0.58 0.51 0.68 0.64 0.20 0.19
2.0 0.53 0.48 1.22 1.12 -0.06 0.08 PDA BOR N@Toe>40 2.5 0.45 0.40 0.92 0.84 -0.09 0.05
2.0 0.65 0.59 0.92 0.87 0.29 0.28 PDA BOR ALL 2.5 0.56 0.49 0.69 0.65 0.23 0.21
2.0 0.62 0.57 Bayesian N@Toe<=40 2.5 0.52 0.48
2.0 0.50 0.46 Bayesian N@Toe>40 2.5 0.45 0.41
2.0 0.60 0.55 Bayesian All 2.5 0.52 0.47 2.0 0.55 0.50 Static Load
Tests 2.5 0.47 0.42
Coastal Steel HP Piles:
Calibration was performed on the seven cases of the resistance statistics for this
category and the results are summarized in Table 5-3. The resistance statistics for this
category are from 17 PDA EOD and 3 PDA BOR data. The PDA EOD data were
divided into N@Toe<=40 and N@Toe>40 as presented in Chapter 3. The difference in
the resistance factors between the N@Toe<=40 data and the N@Toe>40 data is not
significant in this category. However, there is a significant difference in the resistance
factors between the PDA EOD and the PDA BOR, which is consistent with the reliability
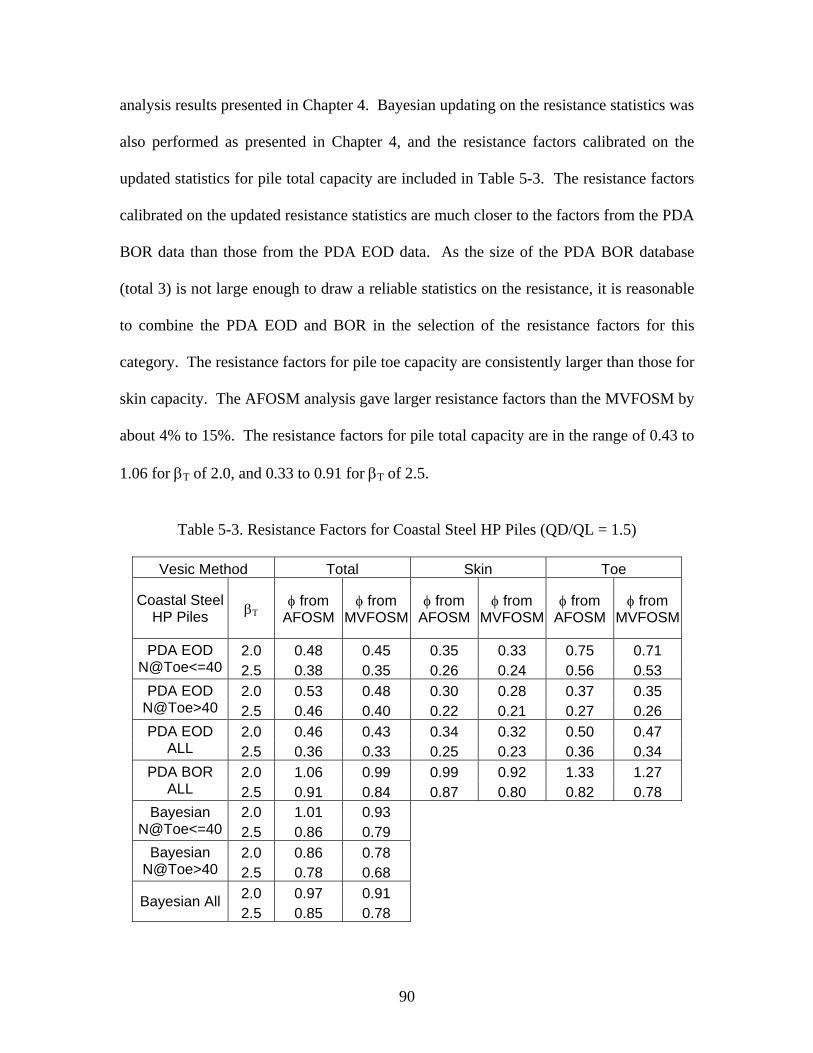
90
analysis results presented in Chapter 4. Bayesian updating on the resistance statistics was
also performed as presented in Chapter 4, and the resistance factors calibrated on the
updated statistics for pile total capacity are included in Table 5-3. The resistance factors
calibrated on the updated resistance statistics are much closer to the factors from the PDA
BOR data than those from the PDA EOD data. As the size of the PDA BOR database
(total 3) is not large enough to draw a reliable statistics on the resistance, it is reasonable
to combine the PDA EOD and BOR in the selection of the resistance factors for this
category. The resistance factors for pile toe capacity are consistently larger than those for
skin capacity. The AFOSM analysis gave larger resistance factors than the MVFOSM by
about 4% to 15%. The resistance factors for pile total capacity are in the range of 0.43 to
1.06 for βT of 2.0, and 0.33 to 0.91 for βT of 2.5.
Table 5-3. Resistance Factors for Coastal Steel HP Piles (QD/QL = 1.5)
Vesic Method Total Skin Toe
Coastal Steel HP Piles βΤ φ from
AFOSM φ from
MVFOSM φ from
AFOSM φ from
MVFOSM φ from
AFOSM φ from
MVFOSM
2.0 0.48 0.45 0.35 0.33 0.75 0.71 PDA EOD N@Toe<=40 2.5 0.38 0.35 0.26 0.24 0.56 0.53
2.0 0.53 0.48 0.30 0.28 0.37 0.35 PDA EOD N@Toe>40 2.5 0.46 0.40 0.22 0.21 0.27 0.26
2.0 0.46 0.43 0.34 0.32 0.50 0.47 PDA EOD ALL 2.5 0.36 0.33 0.25 0.23 0.36 0.34
2.0 1.06 0.99 0.99 0.92 1.33 1.27 PDA BOR ALL 2.5 0.91 0.84 0.87 0.80 0.82 0.78
2.0 1.01 0.93 Bayesian N@Toe<=40 2.5 0.86 0.79
2.0 0.86 0.78 Bayesian N@Toe>40 2.5 0.78 0.68
2.0 0.97 0.91 Bayesian All 2.5 0.85 0.78
91
Coastal Steel Pipe Piles:
Calibration was performed on the three cases of the resistance statistics for this
category and the results are summarized in Table 5-4. The resistance statistics for this
category are from 7 PDA EOD and 15 PDA BOR data. Bayesian updating on the
resistance statistics was also performed as presented in Chapter 4, and the resistance
factors calibrated on the updated statistics for the pile total capacity are included in Table
5-4. There is a significant difference in the resistance factors between the PDA EOD and
the PDA BOR. However, there is no consistency in the change of the resistance factors
for skin and toe capacities between the PDA EOD and BOR. The resistance factors
calibrated on the Bayesian updated data are very close to those calibrated on the PDA
BOR data. The calibrated resistance factors are relatively large, probably because of the
fact that most of the PDA data were collected from the same project site and this resulted
in relatively low variation in the resistance bias factors. The AFOSM analysis gave
larger resistance factors than the MVFOSM analysis by about 5% to 12%. The resistance
factors for pile total capacity are in the range of 0.65 to 1.33 for βT of 2.0, and 0.51 to
1.16 for βT of 2.5.
Table 5-4. Resistance Factors for Coastal Steel Pipe Piles (QD/QL = 1.5)
Vesic Method Total Skin Toe
Coastal Steel Pipe Piles βΤ φ from
AFOSM φ from
MVFOSM φ from
AFOSM φ from
MVFOSM φ from
AFOSM φ from
MVFOSM
2.0 0.70 0.65 0.48 0.45 1.14 1.09 PDA EOD ALL 2.5 0.55 0.51 0.38 0.35 0.83 0.79
2.0 1.33 1.21 1.07 0.98 0.81 0.77 PDA BOR ALL 2.5 1.16 1.05 0.91 0.81 0.60 0.57
2.0 1.31 1.20 Bayesian All 2.5 0.87 0.79
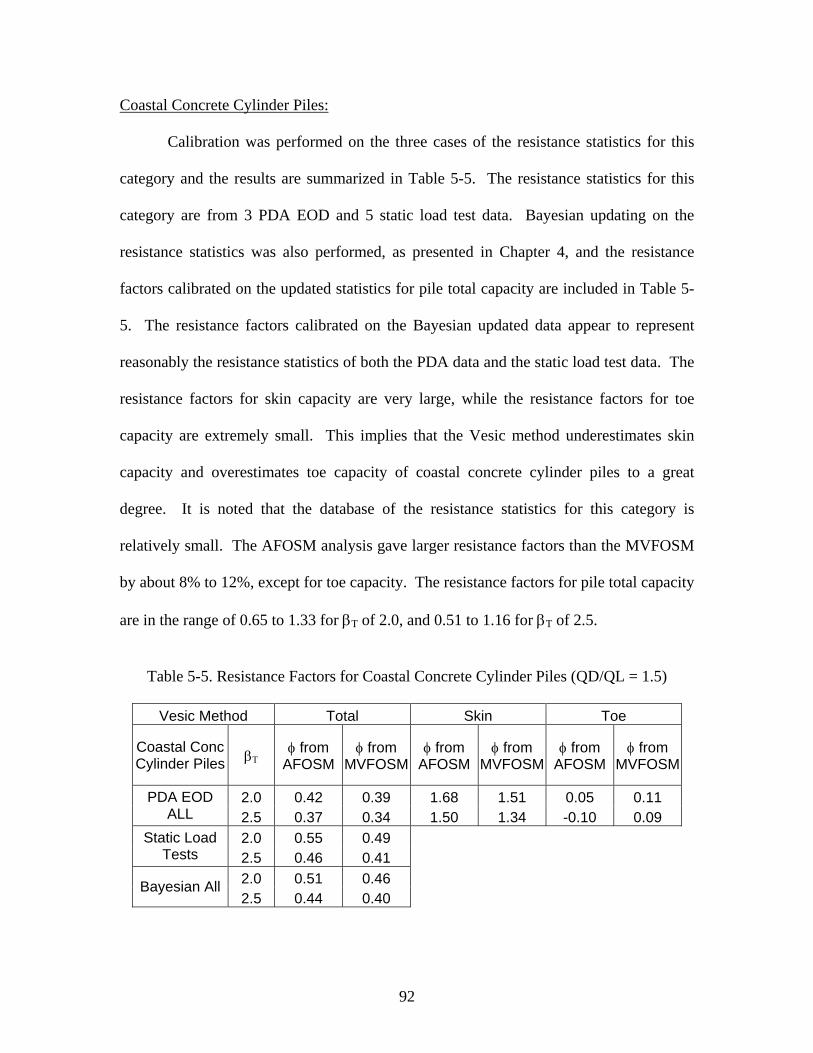
92
Coastal Concrete Cylinder Piles:
Calibration was performed on the three cases of the resistance statistics for this
category and the results are summarized in Table 5-5. The resistance statistics for this
category are from 3 PDA EOD and 5 static load test data. Bayesian updating on the
resistance statistics was also performed, as presented in Chapter 4, and the resistance
factors calibrated on the updated statistics for pile total capacity are included in Table 5-
5. The resistance factors calibrated on the Bayesian updated data appear to represent
reasonably the resistance statistics of both the PDA data and the static load test data. The
resistance factors for skin capacity are very large, while the resistance factors for toe
capacity are extremely small. This implies that the Vesic method underestimates skin
capacity and overestimates toe capacity of coastal concrete cylinder piles to a great
degree. It is noted that the database of the resistance statistics for this category is
relatively small. The AFOSM analysis gave larger resistance factors than the MVFOSM
by about 8% to 12%, except for toe capacity. The resistance factors for pile total capacity
are in the range of 0.65 to 1.33 for βT of 2.0, and 0.51 to 1.16 for βT of 2.5.
Table 5-5. Resistance Factors for Coastal Concrete Cylinder Piles (QD/QL = 1.5)
Vesic Method Total Skin Toe
Coastal Conc Cylinder Piles βΤ φ from
AFOSM φ from
MVFOSM φ from
AFOSM φ from
MVFOSM φ from
AFOSM φ from
MVFOSM
2.0 0.42 0.39 1.68 1.51 0.05 0.11 PDA EOD ALL 2.5 0.37 0.34 1.50 1.34 -0.10 0.09
2.0 0.55 0.49 Static Load Tests 2.5 0.46 0.41
2.0 0.51 0.46 Bayesian All 2.5 0.44 0.40
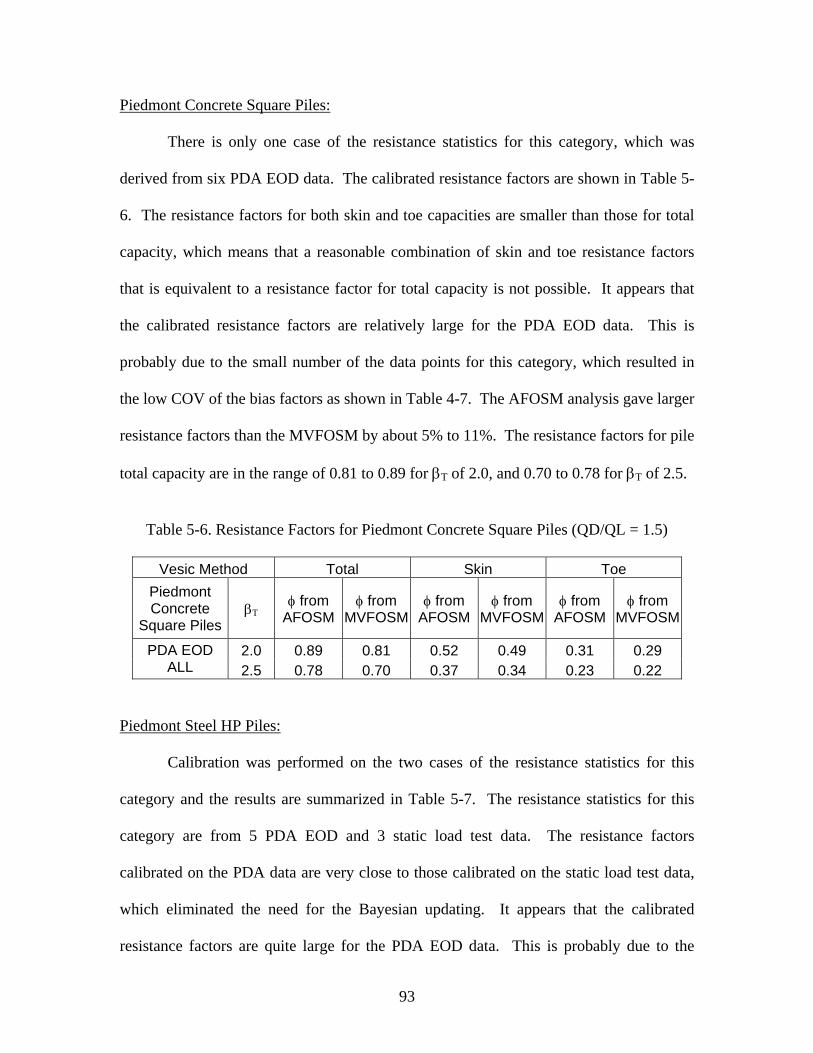
93
Piedmont Concrete Square Piles:
There is only one case of the resistance statistics for this category, which was
derived from six PDA EOD data. The calibrated resistance factors are shown in Table 5-
6. The resistance factors for both skin and toe capacities are smaller than those for total
capacity, which means that a reasonable combination of skin and toe resistance factors
that is equivalent to a resistance factor for total capacity is not possible. It appears that
the calibrated resistance factors are relatively large for the PDA EOD data. This is
probably due to the small number of the data points for this category, which resulted in
the low COV of the bias factors as shown in Table 4-7. The AFOSM analysis gave larger
resistance factors than the MVFOSM by about 5% to 11%. The resistance factors for pile
total capacity are in the range of 0.81 to 0.89 for βT of 2.0, and 0.70 to 0.78 for βT of 2.5.
Table 5-6. Resistance Factors for Piedmont Concrete Square Piles (QD/QL = 1.5)
Vesic Method Total Skin Toe Piedmont Concrete
Square Piles βΤ φ from
AFOSM φ from
MVFOSM φ from
AFOSM φ from
MVFOSM φ from
AFOSM φ from
MVFOSM
2.0 0.89 0.81 0.52 0.49 0.31 0.29 PDA EOD ALL 2.5 0.78 0.70 0.37 0.34 0.23 0.22
Piedmont Steel HP Piles:
Calibration was performed on the two cases of the resistance statistics for this
category and the results are summarized in Table 5-7. The resistance statistics for this
category are from 5 PDA EOD and 3 static load test data. The resistance factors
calibrated on the PDA data are very close to those calibrated on the static load test data,
which eliminated the need for the Bayesian updating. It appears that the calibrated
resistance factors are quite large for the PDA EOD data. This is probably due to the
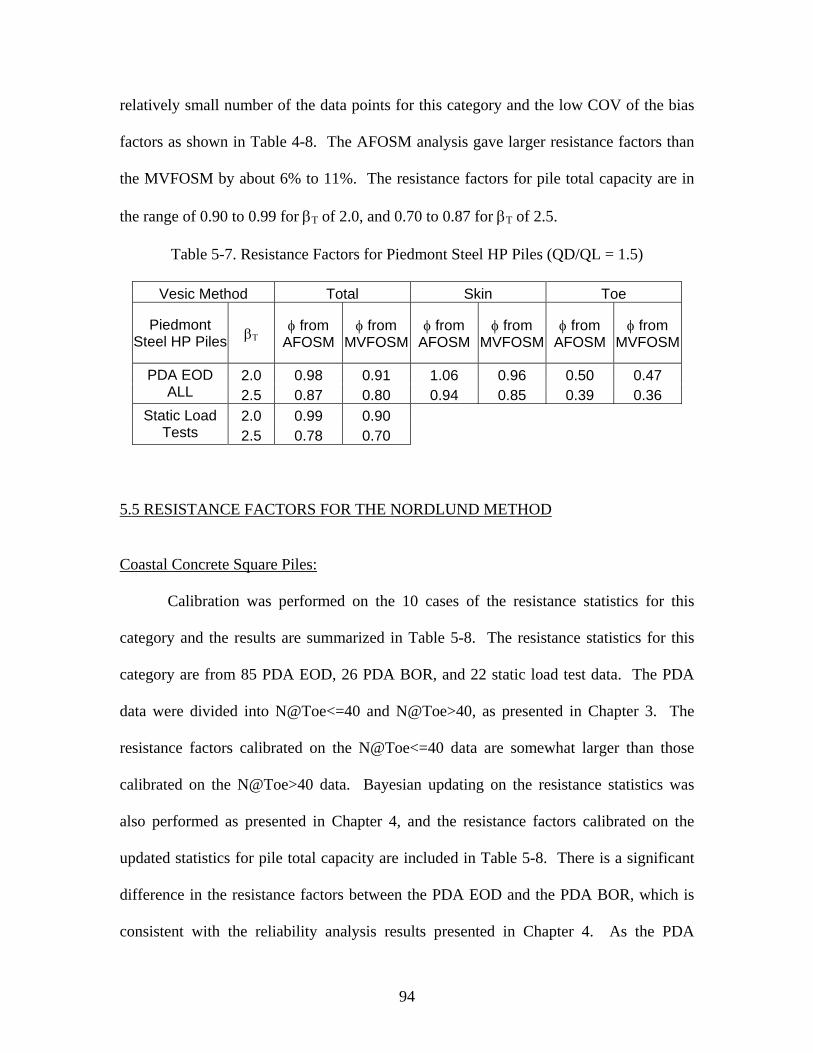
94
relatively small number of the data points for this category and the low COV of the bias
factors as shown in Table 4-8. The AFOSM analysis gave larger resistance factors than
the MVFOSM by about 6% to 11%. The resistance factors for pile total capacity are in
the range of 0.90 to 0.99 for βT of 2.0, and 0.70 to 0.87 for βT of 2.5.
Table 5-7. Resistance Factors for Piedmont Steel HP Piles (QD/QL = 1.5)
Vesic Method Total Skin Toe
Piedmont Steel HP Piles βΤ φ from
AFOSM φ from
MVFOSM φ from
AFOSM φ from
MVFOSM φ from
AFOSM φ from
MVFOSM
2.0 0.98 0.91 1.06 0.96 0.50 0.47 PDA EOD ALL 2.5 0.87 0.80 0.94 0.85 0.39 0.36
2.0 0.99 0.90 Static Load Tests 2.5 0.78 0.70
5.5 RESISTANCE FACTORS FOR THE NORDLUND METHOD
Coastal Concrete Square Piles:
Calibration was performed on the 10 cases of the resistance statistics for this
category and the results are summarized in Table 5-8. The resistance statistics for this
category are from 85 PDA EOD, 26 PDA BOR, and 22 static load test data. The PDA
data were divided into N@Toe<=40 and N@Toe>40, as presented in Chapter 3. The
resistance factors calibrated on the N@Toe<=40 data are somewhat larger than those
calibrated on the N@Toe>40 data. Bayesian updating on the resistance statistics was
also performed as presented in Chapter 4, and the resistance factors calibrated on the
updated statistics for pile total capacity are included in Table 5-8. There is a significant
difference in the resistance factors between the PDA EOD and the PDA BOR, which is
consistent with the reliability analysis results presented in Chapter 4. As the PDA
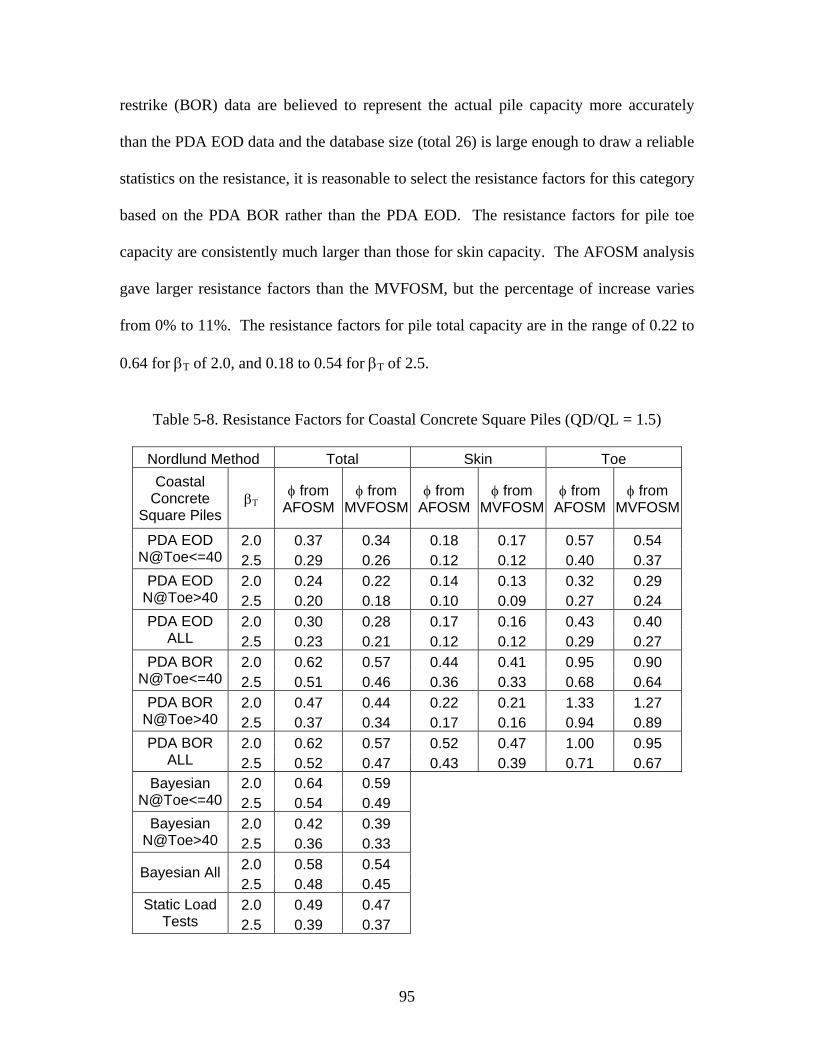
95
restrike (BOR) data are believed to represent the actual pile capacity more accurately
than the PDA EOD data and the database size (total 26) is large enough to draw a reliable
statistics on the resistance, it is reasonable to select the resistance factors for this category
based on the PDA BOR rather than the PDA EOD. The resistance factors for pile toe
capacity are consistently much larger than those for skin capacity. The AFOSM analysis
gave larger resistance factors than the MVFOSM, but the percentage of increase varies
from 0% to 11%. The resistance factors for pile total capacity are in the range of 0.22 to
0.64 for βT of 2.0, and 0.18 to 0.54 for βT of 2.5.
Table 5-8. Resistance Factors for Coastal Concrete Square Piles (QD/QL = 1.5)
Nordlund Method Total Skin Toe Coastal
Concrete Square Piles
βΤ φ from AFOSM
φ from MVFOSM
φ from AFOSM
φ from MVFOSM
φ from AFOSM
φ from MVFOSM
2.0 0.37 0.34 0.18 0.17 0.57 0.54 PDA EOD N@Toe<=40 2.5 0.29 0.26 0.12 0.12 0.40 0.37
2.0 0.24 0.22 0.14 0.13 0.32 0.29 PDA EOD N@Toe>40 2.5 0.20 0.18 0.10 0.09 0.27 0.24
2.0 0.30 0.28 0.17 0.16 0.43 0.40 PDA EOD ALL 2.5 0.23 0.21 0.12 0.12 0.29 0.27
2.0 0.62 0.57 0.44 0.41 0.95 0.90 PDA BOR N@Toe<=40 2.5 0.51 0.46 0.36 0.33 0.68 0.64
2.0 0.47 0.44 0.22 0.21 1.33 1.27 PDA BOR N@Toe>40 2.5 0.37 0.34 0.17 0.16 0.94 0.89
2.0 0.62 0.57 0.52 0.47 1.00 0.95 PDA BOR ALL 2.5 0.52 0.47 0.43 0.39 0.71 0.67
2.0 0.64 0.59 Bayesian N@Toe<=40 2.5 0.54 0.49
2.0 0.42 0.39 Bayesian N@Toe>40 2.5 0.36 0.33
2.0 0.58 0.54 Bayesian All 2.5 0.48 0.45 2.0 0.49 0.47 Static Load
Tests 2.5 0.39 0.37
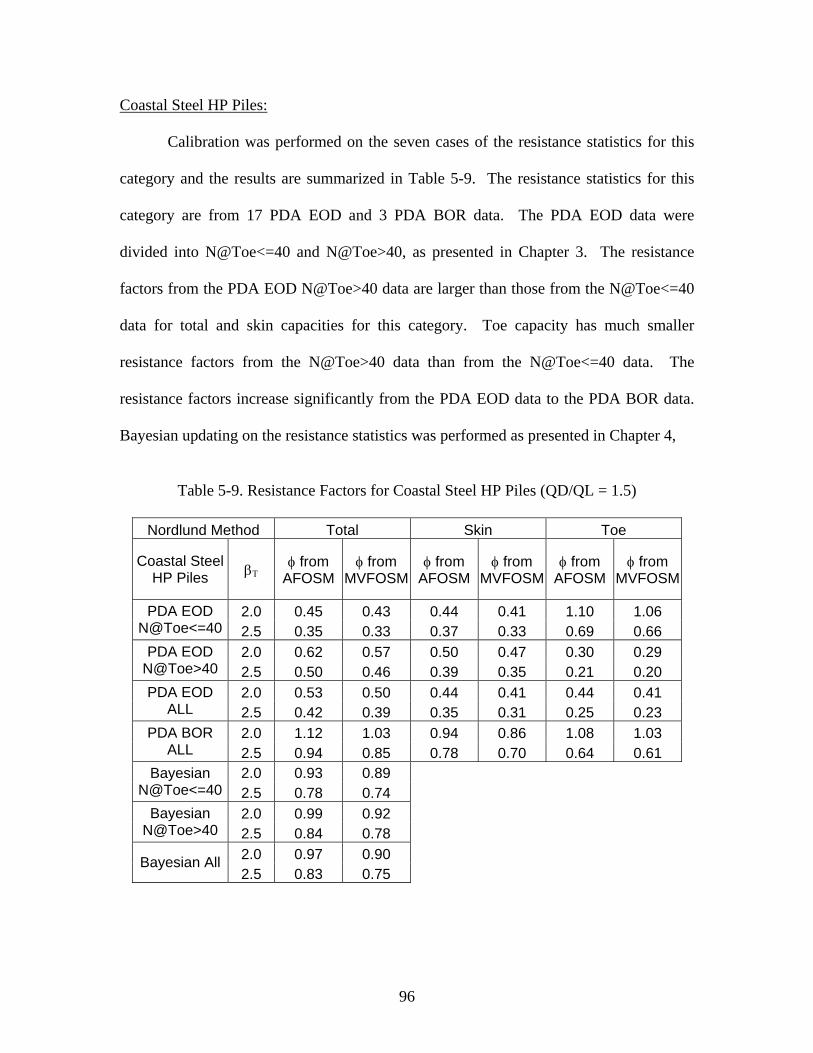
96
Coastal Steel HP Piles:
Calibration was performed on the seven cases of the resistance statistics for this
category and the results are summarized in Table 5-9. The resistance statistics for this
category are from 17 PDA EOD and 3 PDA BOR data. The PDA EOD data were
divided into N@Toe<=40 and N@Toe>40, as presented in Chapter 3. The resistance
factors from the PDA EOD N@Toe>40 data are larger than those from the N@Toe<=40
data for total and skin capacities for this category. Toe capacity has much smaller
resistance factors from the N@Toe>40 data than from the N@Toe<=40 data. The
resistance factors increase significantly from the PDA EOD data to the PDA BOR data.
Bayesian updating on the resistance statistics was performed as presented in Chapter 4,
Table 5-9. Resistance Factors for Coastal Steel HP Piles (QD/QL = 1.5)
Nordlund Method Total Skin Toe
Coastal Steel HP Piles βΤ φ from
AFOSM φ from
MVFOSM φ from
AFOSM φ from
MVFOSM φ from
AFOSM φ from
MVFOSM
2.0 0.45 0.43 0.44 0.41 1.10 1.06 PDA EOD N@Toe<=40 2.5 0.35 0.33 0.37 0.33 0.69 0.66
2.0 0.62 0.57 0.50 0.47 0.30 0.29 PDA EOD N@Toe>40 2.5 0.50 0.46 0.39 0.35 0.21 0.20
2.0 0.53 0.50 0.44 0.41 0.44 0.41 PDA EOD ALL 2.5 0.42 0.39 0.35 0.31 0.25 0.23
2.0 1.12 1.03 0.94 0.86 1.08 1.03 PDA BOR ALL 2.5 0.94 0.85 0.78 0.70 0.64 0.61
2.0 0.93 0.89 Bayesian N@Toe<=40 2.5 0.78 0.74
2.0 0.99 0.92 Bayesian N@Toe>40 2.5 0.84 0.78
2.0 0.97 0.90 Bayesian All 2.5 0.83 0.75
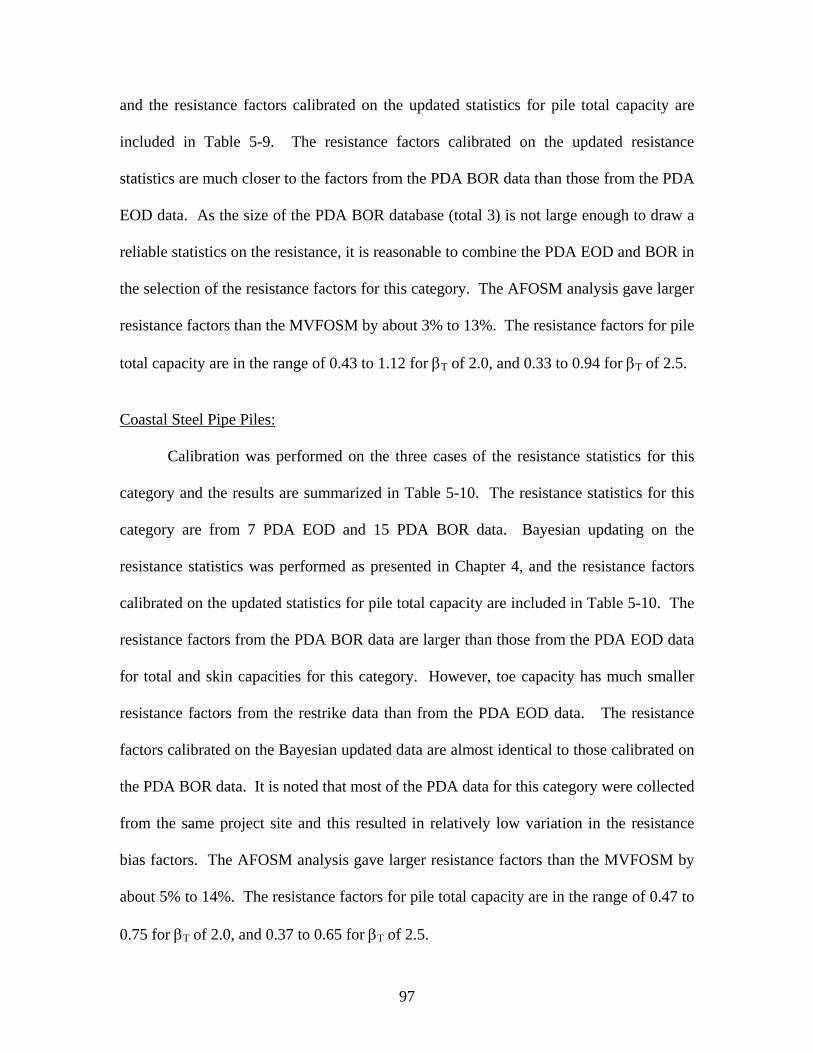
97
and the resistance factors calibrated on the updated statistics for pile total capacity are
included in Table 5-9. The resistance factors calibrated on the updated resistance
statistics are much closer to the factors from the PDA BOR data than those from the PDA
EOD data. As the size of the PDA BOR database (total 3) is not large enough to draw a
reliable statistics on the resistance, it is reasonable to combine the PDA EOD and BOR in
the selection of the resistance factors for this category. The AFOSM analysis gave larger
resistance factors than the MVFOSM by about 3% to 13%. The resistance factors for pile
total capacity are in the range of 0.43 to 1.12 for βT of 2.0, and 0.33 to 0.94 for βT of 2.5.
Coastal Steel Pipe Piles:
Calibration was performed on the three cases of the resistance statistics for this
category and the results are summarized in Table 5-10. The resistance statistics for this
category are from 7 PDA EOD and 15 PDA BOR data. Bayesian updating on the
resistance statistics was performed as presented in Chapter 4, and the resistance factors
calibrated on the updated statistics for pile total capacity are included in Table 5-10. The
resistance factors from the PDA BOR data are larger than those from the PDA EOD data
for total and skin capacities for this category. However, toe capacity has much smaller
resistance factors from the restrike data than from the PDA EOD data. The resistance
factors calibrated on the Bayesian updated data are almost identical to those calibrated on
the PDA BOR data. It is noted that most of the PDA data for this category were collected
from the same project site and this resulted in relatively low variation in the resistance
bias factors. The AFOSM analysis gave larger resistance factors than the MVFOSM by
about 5% to 14%. The resistance factors for pile total capacity are in the range of 0.47 to
0.75 for βT of 2.0, and 0.37 to 0.65 for βT of 2.5.
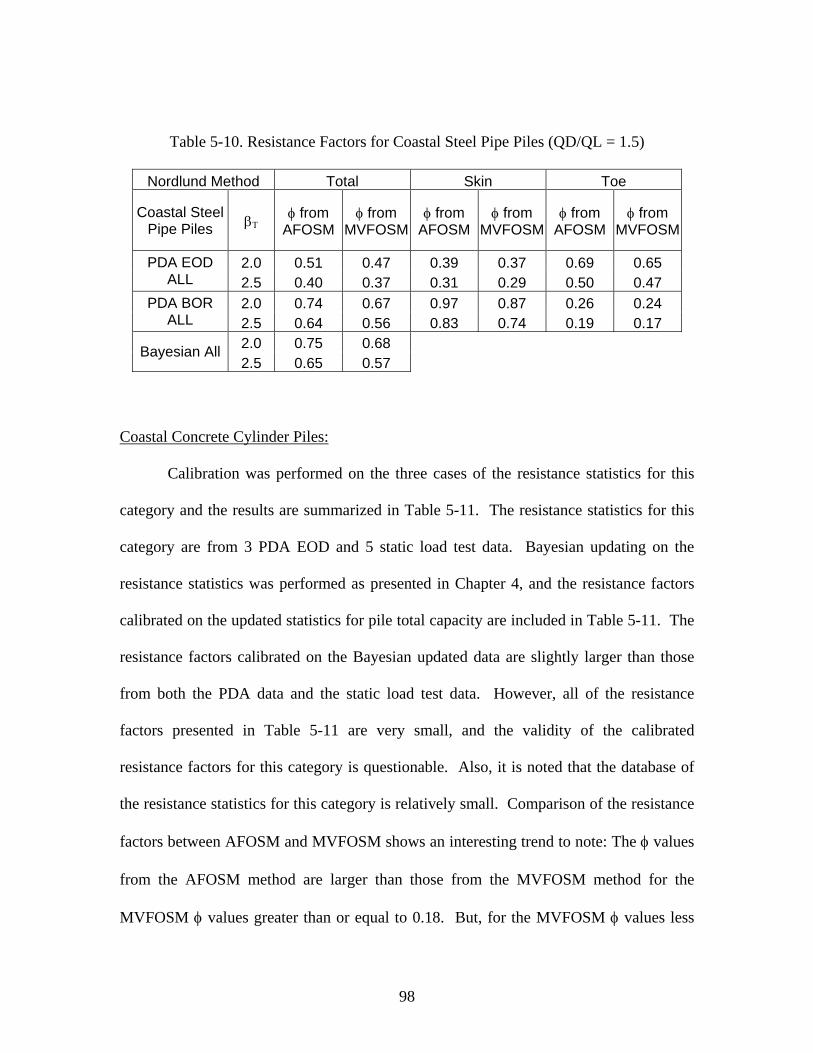
98
Table 5-10. Resistance Factors for Coastal Steel Pipe Piles (QD/QL = 1.5)
Nordlund Method Total Skin Toe
Coastal Steel Pipe Piles βΤ φ from
AFOSM φ from
MVFOSM φ from
AFOSM φ from
MVFOSM φ from
AFOSM φ from
MVFOSM
2.0 0.51 0.47 0.39 0.37 0.69 0.65 PDA EOD ALL 2.5 0.40 0.37 0.31 0.29 0.50 0.47
2.0 0.74 0.67 0.97 0.87 0.26 0.24 PDA BOR ALL 2.5 0.64 0.56 0.83 0.74 0.19 0.17
2.0 0.75 0.68 Bayesian All 2.5 0.65 0.57
Coastal Concrete Cylinder Piles:
Calibration was performed on the three cases of the resistance statistics for this
category and the results are summarized in Table 5-11. The resistance statistics for this
category are from 3 PDA EOD and 5 static load test data. Bayesian updating on the
resistance statistics was performed as presented in Chapter 4, and the resistance factors
calibrated on the updated statistics for pile total capacity are included in Table 5-11. The
resistance factors calibrated on the Bayesian updated data are slightly larger than those
from both the PDA data and the static load test data. However, all of the resistance
factors presented in Table 5-11 are very small, and the validity of the calibrated
resistance factors for this category is questionable. Also, it is noted that the database of
the resistance statistics for this category is relatively small. Comparison of the resistance
factors between AFOSM and MVFOSM shows an interesting trend to note: The φ values
from the AFOSM method are larger than those from the MVFOSM method for the
MVFOSM φ values greater than or equal to 0.18. But, for the MVFOSM φ values less
99
than 0.18, the AFOSM method gave a resistance factor smaller than or equal to that from
the MVFOSM method. The resistance factors for pile total capacity are in the range of
0.14 to 0.20 for βT of 2.0, and 0.09 to 0.16 for βT of 2.5.
Table 5-11. Resistance Factors for Coastal Concrete Cylinder Piles (QD/QL = 1.5)
Nordlund Method Total Skin Toe
Coastal Conc Cylinder Piles βΤ φ from
AFOSM φ from
MVFOSM φ from
AFOSM φ from
MVFOSM φ from
AFOSM φ from
MVFOSM
2.0 0.14 0.17 0.23 0.21 0.10 0.13 PDA EOD ALL 2.5 0.10 0.14 0.20 0.18 0.06 0.10
2.0 0.14 0.14 Static Load Tests 2.5 0.09 0.09
2.0 0.20 0.19 Bayesian All 2.5 0.16 0.16
Piedmont Concrete Square Piles:
There is only one case of the resistance statistics for this category, which was
derived from six PDA EOD data. The calibrated resistance factors are shown in Table 5-
12. The resistance factors for both skin and toe capacities are smaller than those for total
capacity, which means that a reasonable combination of skin and toe resistance factors
that is equivalent to a resistance factor for total capacity is not possible. The calibrated
resistance factors are very large considering that the calibration was based on the PDA
EOD data. This implies that the Nordlund method underestimates the capacity of
piedmont concrete square piles. The AFOSM analysis gave larger resistance factors than
the MVFOSM analysis by about 5% to 14%. The resistance factors for pile total capacity
are in the range of 1.00 to 1.11 for βT of 2.0, and 0.84 to 0.96 for βT of 2.5.
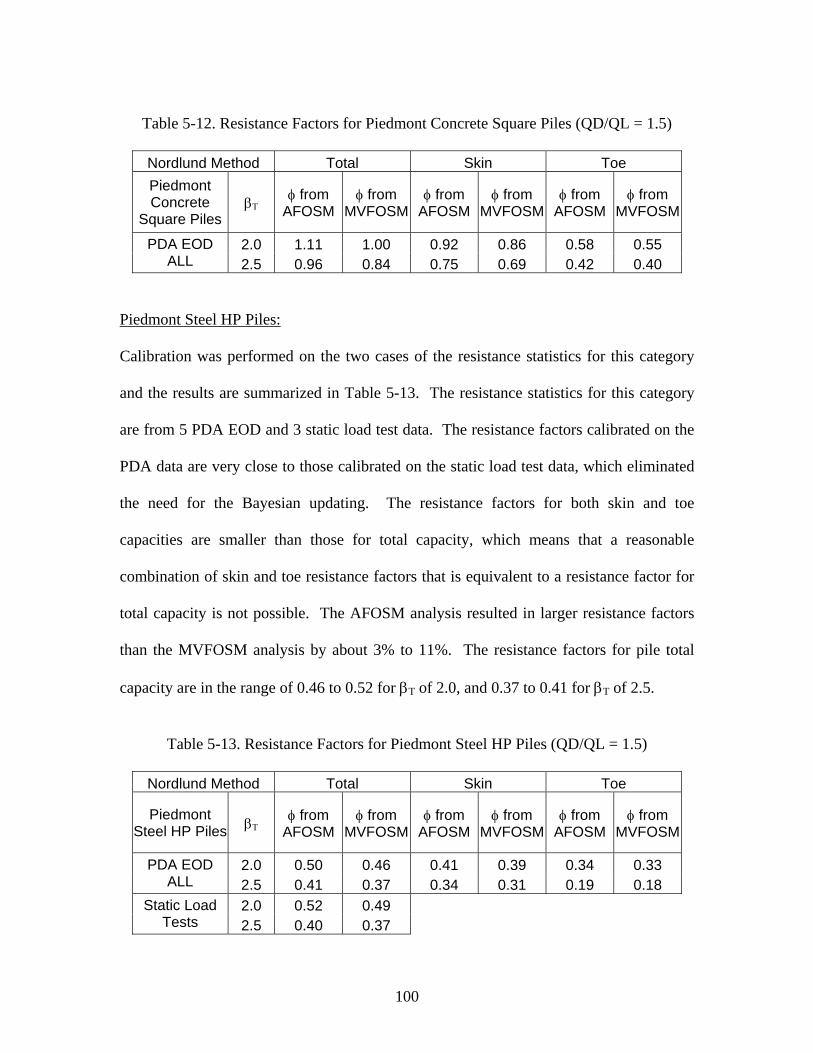
100
Table 5-12. Resistance Factors for Piedmont Concrete Square Piles (QD/QL = 1.5)
Nordlund Method Total Skin Toe Piedmont Concrete
Square Piles βΤ φ from
AFOSM φ from
MVFOSM φ from
AFOSM φ from
MVFOSM φ from
AFOSM φ from
MVFOSM
2.0 1.11 1.00 0.92 0.86 0.58 0.55 PDA EOD ALL 2.5 0.96 0.84 0.75 0.69 0.42 0.40
Piedmont Steel HP Piles:
Calibration was performed on the two cases of the resistance statistics for this category
and the results are summarized in Table 5-13. The resistance statistics for this category
are from 5 PDA EOD and 3 static load test data. The resistance factors calibrated on the
PDA data are very close to those calibrated on the static load test data, which eliminated
the need for the Bayesian updating. The resistance factors for both skin and toe
capacities are smaller than those for total capacity, which means that a reasonable
combination of skin and toe resistance factors that is equivalent to a resistance factor for
total capacity is not possible. The AFOSM analysis resulted in larger resistance factors
than the MVFOSM analysis by about 3% to 11%. The resistance factors for pile total
capacity are in the range of 0.46 to 0.52 for βT of 2.0, and 0.37 to 0.41 for βT of 2.5.
Table 5-13. Resistance Factors for Piedmont Steel HP Piles (QD/QL = 1.5)
Nordlund Method Total Skin Toe
Piedmont Steel HP Piles βΤ φ from
AFOSM φ from
MVFOSM φ from
AFOSM φ from
MVFOSM φ from
AFOSM φ from
MVFOSM
2.0 0.50 0.46 0.41 0.39 0.34 0.33 PDA EOD ALL 2.5 0.41 0.37 0.34 0.31 0.19 0.18
2.0 0.52 0.49 Static Load Tests 2.5 0.40 0.37
101
5.6 RESISTANCE FACTORS FOR THE MEYERHOF METHOD
Coastal Concrete Square Piles:
Calibration was performed on the 8 cases of the resistance statistics for this
category and the results are summarized in Table 5-14. The resistance statistics for this
category are from 85 PDA EOD, 26 PDA BOR, and 22 static load test data. The PDA
EOD data were divided into N@Toe<=40 and N@Toe>40, as presented in Chapter 3.
There is no N@Toe>40 case of the PDA BOR data for the Meyerhof method due to the
insufficient amount of data points. The resistance factors calibrated on the PDA EOD
N@Toe<=40 data case are larger than those calibrated on the N@Toe>40 data case for
total and toe capacities. But, N@Toe<=40 data case resulted in smaller resistance factors
than N@Toe>40 data case for skin capacity. Bayesian updating on the resistance
statistics was also performed as presented in Chapter 4, and the resistance factors
calibrated on the updated statistics for pile total capacity are included in Table 5-14.
There is a significant difference in the resistance factors between the PDA EOD and the
PDA BOR, which is consistent with the reliability analysis results presented in Chapter 4.
As the PDA restrike (BOR) data are believed to represent the actual pile capacity more
accurately than the PDA EOD data and the data size (total 26) is large enough to draw a
reliable statistics on the resistance, it is reasonable to select the resistance factors for this
category based on the PDA BOR rather than the PDA EOD. The resistance factors
calibrated on the static load test data case are a little larger than those from the PDA EOD
data case, but much smaller than those from the PDA BOR data case. The AFOSM
analysis resulted in larger resistance factors than the MVFOSM, with the percentage of
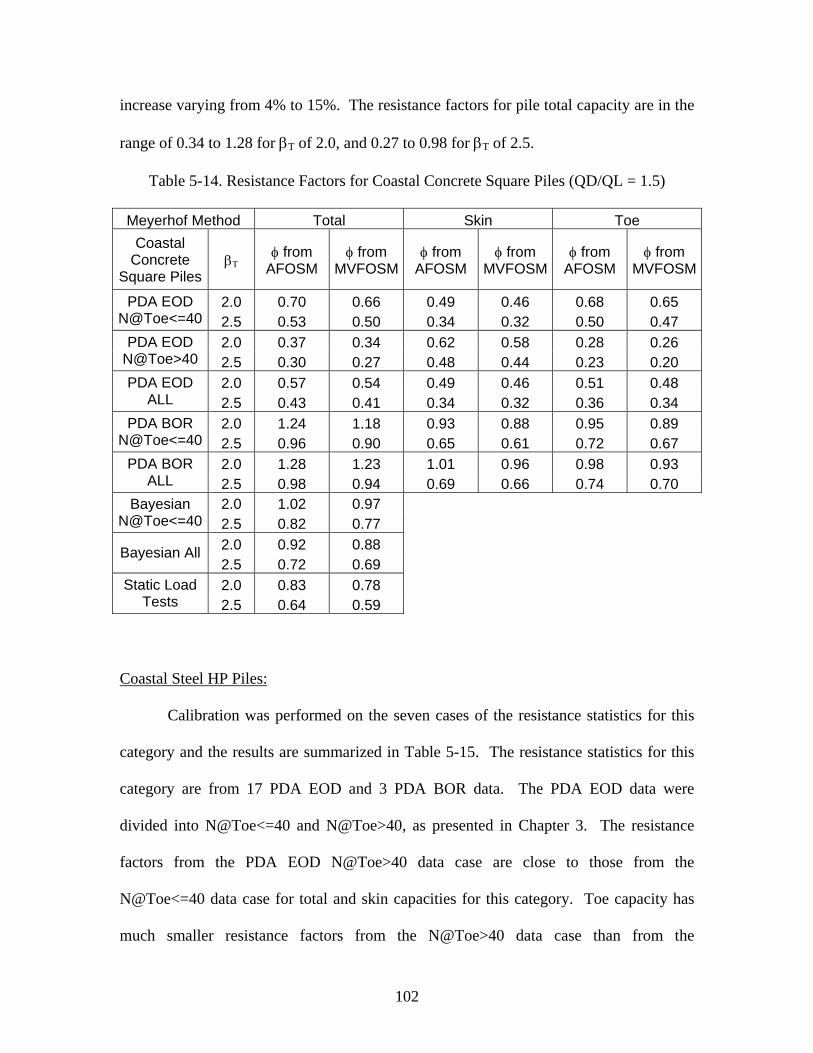
102
increase varying from 4% to 15%. The resistance factors for pile total capacity are in the
range of 0.34 to 1.28 for βT of 2.0, and 0.27 to 0.98 for βT of 2.5.
Table 5-14. Resistance Factors for Coastal Concrete Square Piles (QD/QL = 1.5)
Meyerhof Method Total Skin Toe Coastal
Concrete Square Piles
βΤ φ from AFOSM
φ from MVFOSM
φ from AFOSM
φ from MVFOSM
φ from AFOSM
φ from MVFOSM
2.0 0.70 0.66 0.49 0.46 0.68 0.65 PDA EOD N@Toe<=40 2.5 0.53 0.50 0.34 0.32 0.50 0.47
2.0 0.37 0.34 0.62 0.58 0.28 0.26 PDA EOD N@Toe>40 2.5 0.30 0.27 0.48 0.44 0.23 0.20
2.0 0.57 0.54 0.49 0.46 0.51 0.48 PDA EOD ALL 2.5 0.43 0.41 0.34 0.32 0.36 0.34
2.0 1.24 1.18 0.93 0.88 0.95 0.89 PDA BOR N@Toe<=40 2.5 0.96 0.90 0.65 0.61 0.72 0.67
2.0 1.28 1.23 1.01 0.96 0.98 0.93 PDA BOR ALL 2.5 0.98 0.94 0.69 0.66 0.74 0.70
2.0 1.02 0.97 Bayesian N@Toe<=40 2.5 0.82 0.77
2.0 0.92 0.88 Bayesian All 2.5 0.72 0.69 2.0 0.83 0.78 Static Load
Tests 2.5 0.64 0.59
Coastal Steel HP Piles:
Calibration was performed on the seven cases of the resistance statistics for this
category and the results are summarized in Table 5-15. The resistance statistics for this
category are from 17 PDA EOD and 3 PDA BOR data. The PDA EOD data were
divided into N@Toe<=40 and N@Toe>40, as presented in Chapter 3. The resistance
factors from the PDA EOD N@Toe>40 data case are close to those from the
N@Toe<=40 data case for total and skin capacities for this category. Toe capacity has
much smaller resistance factors from the N@Toe>40 data case than from the
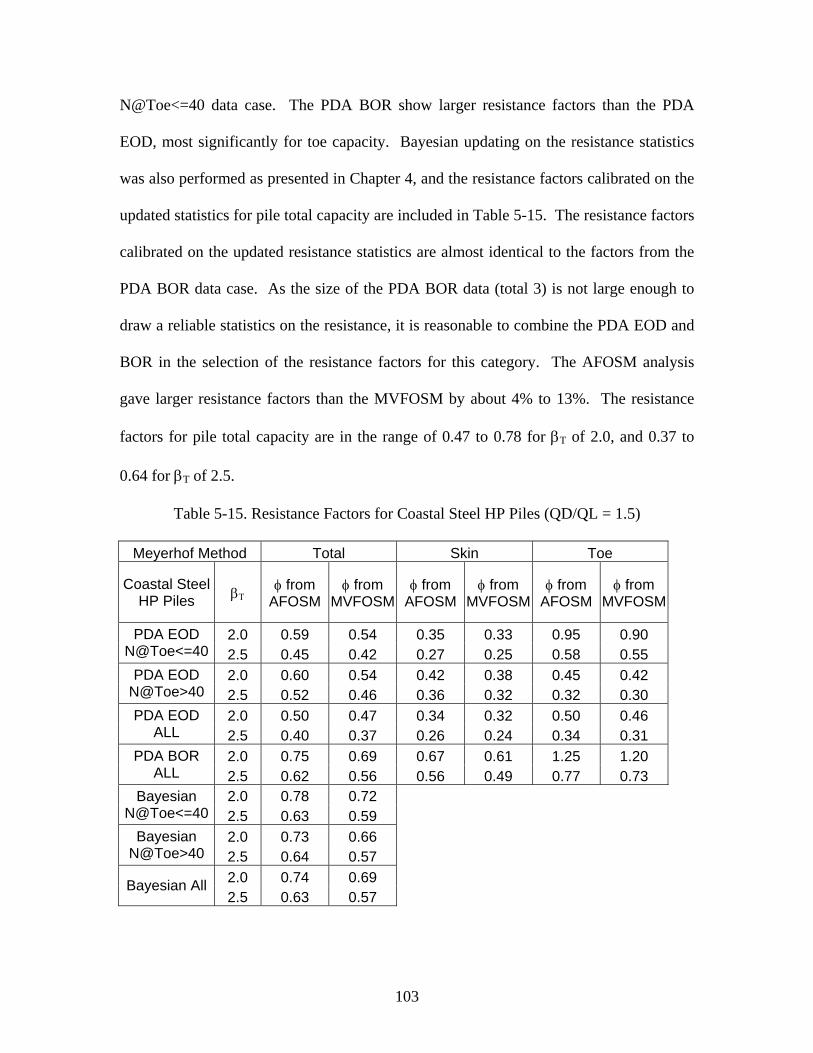
103
N@Toe<=40 data case. The PDA BOR show larger resistance factors than the PDA
EOD, most significantly for toe capacity. Bayesian updating on the resistance statistics
was also performed as presented in Chapter 4, and the resistance factors calibrated on the
updated statistics for pile total capacity are included in Table 5-15. The resistance factors
calibrated on the updated resistance statistics are almost identical to the factors from the
PDA BOR data case. As the size of the PDA BOR data (total 3) is not large enough to
draw a reliable statistics on the resistance, it is reasonable to combine the PDA EOD and
BOR in the selection of the resistance factors for this category. The AFOSM analysis
gave larger resistance factors than the MVFOSM by about 4% to 13%. The resistance
factors for pile total capacity are in the range of 0.47 to 0.78 for βT of 2.0, and 0.37 to
0.64 for βT of 2.5.
Table 5-15. Resistance Factors for Coastal Steel HP Piles (QD/QL = 1.5)
Meyerhof Method Total Skin Toe
Coastal Steel HP Piles βΤ φ from
AFOSM φ from
MVFOSM φ from
AFOSM φ from
MVFOSM φ from
AFOSM φ from
MVFOSM
2.0 0.59 0.54 0.35 0.33 0.95 0.90 PDA EOD N@Toe<=40 2.5 0.45 0.42 0.27 0.25 0.58 0.55
2.0 0.60 0.54 0.42 0.38 0.45 0.42 PDA EOD N@Toe>40 2.5 0.52 0.46 0.36 0.32 0.32 0.30
2.0 0.50 0.47 0.34 0.32 0.50 0.46 PDA EOD ALL 2.5 0.40 0.37 0.26 0.24 0.34 0.31
2.0 0.75 0.69 0.67 0.61 1.25 1.20 PDA BOR ALL 2.5 0.62 0.56 0.56 0.49 0.77 0.73
2.0 0.78 0.72 Bayesian N@Toe<=40 2.5 0.63 0.59
2.0 0.73 0.66 Bayesian N@Toe>40 2.5 0.64 0.57
2.0 0.74 0.69 Bayesian All 2.5 0.63 0.57
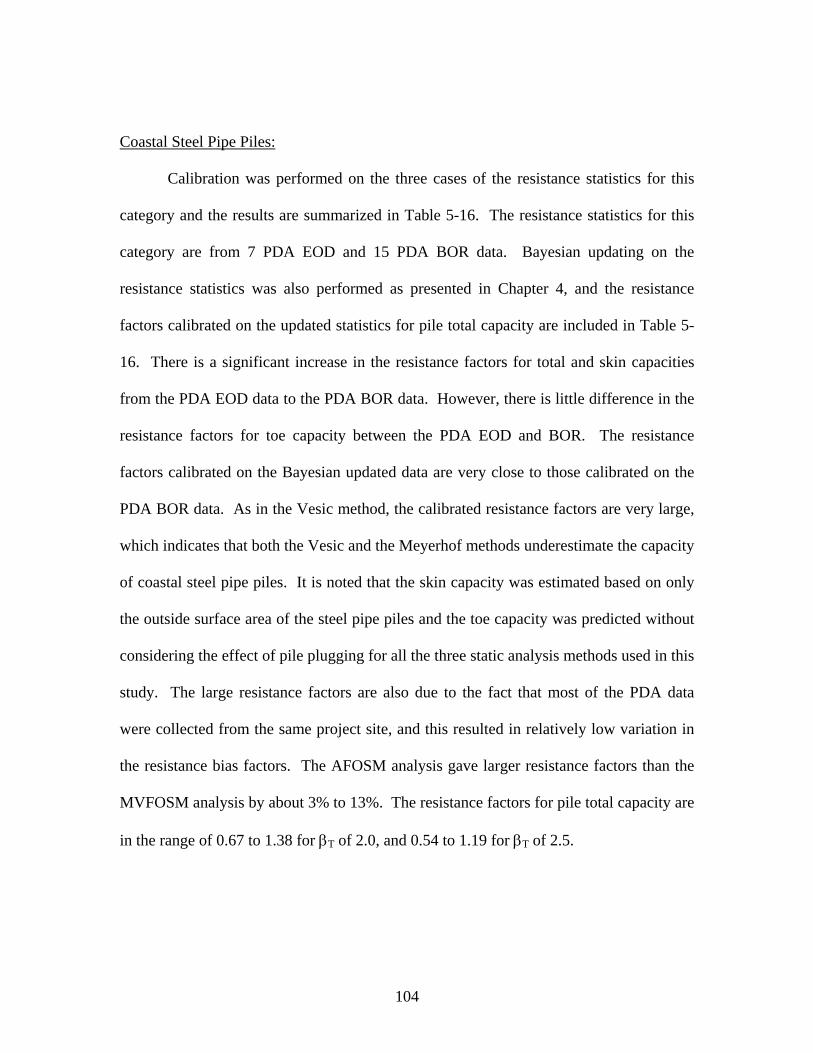
104
Coastal Steel Pipe Piles:
Calibration was performed on the three cases of the resistance statistics for this
category and the results are summarized in Table 5-16. The resistance statistics for this
category are from 7 PDA EOD and 15 PDA BOR data. Bayesian updating on the
resistance statistics was also performed as presented in Chapter 4, and the resistance
factors calibrated on the updated statistics for pile total capacity are included in Table 5-
16. There is a significant increase in the resistance factors for total and skin capacities
from the PDA EOD data to the PDA BOR data. However, there is little difference in the
resistance factors for toe capacity between the PDA EOD and BOR. The resistance
factors calibrated on the Bayesian updated data are very close to those calibrated on the
PDA BOR data. As in the Vesic method, the calibrated resistance factors are very large,
which indicates that both the Vesic and the Meyerhof methods underestimate the capacity
of coastal steel pipe piles. It is noted that the skin capacity was estimated based on only
the outside surface area of the steel pipe piles and the toe capacity was predicted without
considering the effect of pile plugging for all the three static analysis methods used in this
study. The large resistance factors are also due to the fact that most of the PDA data
were collected from the same project site, and this resulted in relatively low variation in
the resistance bias factors. The AFOSM analysis gave larger resistance factors than the
MVFOSM analysis by about 3% to 13%. The resistance factors for pile total capacity are
in the range of 0.67 to 1.38 for βT of 2.0, and 0.54 to 1.19 for βT of 2.5.
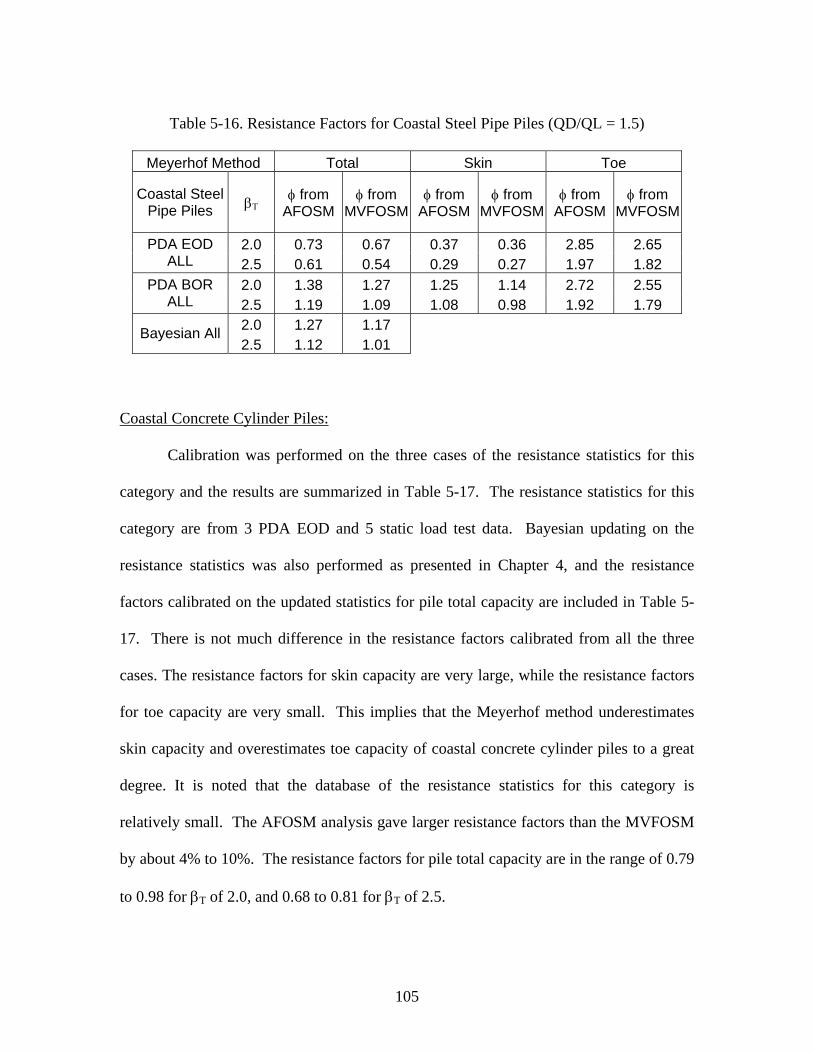
105
Table 5-16. Resistance Factors for Coastal Steel Pipe Piles (QD/QL = 1.5)
Meyerhof Method Total Skin Toe
Coastal Steel Pipe Piles βΤ φ from
AFOSM φ from
MVFOSM φ from
AFOSM φ from
MVFOSM φ from
AFOSM φ from
MVFOSM
2.0 0.73 0.67 0.37 0.36 2.85 2.65 PDA EOD ALL 2.5 0.61 0.54 0.29 0.27 1.97 1.82
2.0 1.38 1.27 1.25 1.14 2.72 2.55 PDA BOR ALL 2.5 1.19 1.09 1.08 0.98 1.92 1.79
2.0 1.27 1.17 Bayesian All 2.5 1.12 1.01
Coastal Concrete Cylinder Piles:
Calibration was performed on the three cases of the resistance statistics for this
category and the results are summarized in Table 5-17. The resistance statistics for this
category are from 3 PDA EOD and 5 static load test data. Bayesian updating on the
resistance statistics was also performed as presented in Chapter 4, and the resistance
factors calibrated on the updated statistics for pile total capacity are included in Table 5-
17. There is not much difference in the resistance factors calibrated from all the three
cases. The resistance factors for skin capacity are very large, while the resistance factors
for toe capacity are very small. This implies that the Meyerhof method underestimates
skin capacity and overestimates toe capacity of coastal concrete cylinder piles to a great
degree. It is noted that the database of the resistance statistics for this category is
relatively small. The AFOSM analysis gave larger resistance factors than the MVFOSM
by about 4% to 10%. The resistance factors for pile total capacity are in the range of 0.79
to 0.98 for βT of 2.0, and 0.68 to 0.81 for βT of 2.5.
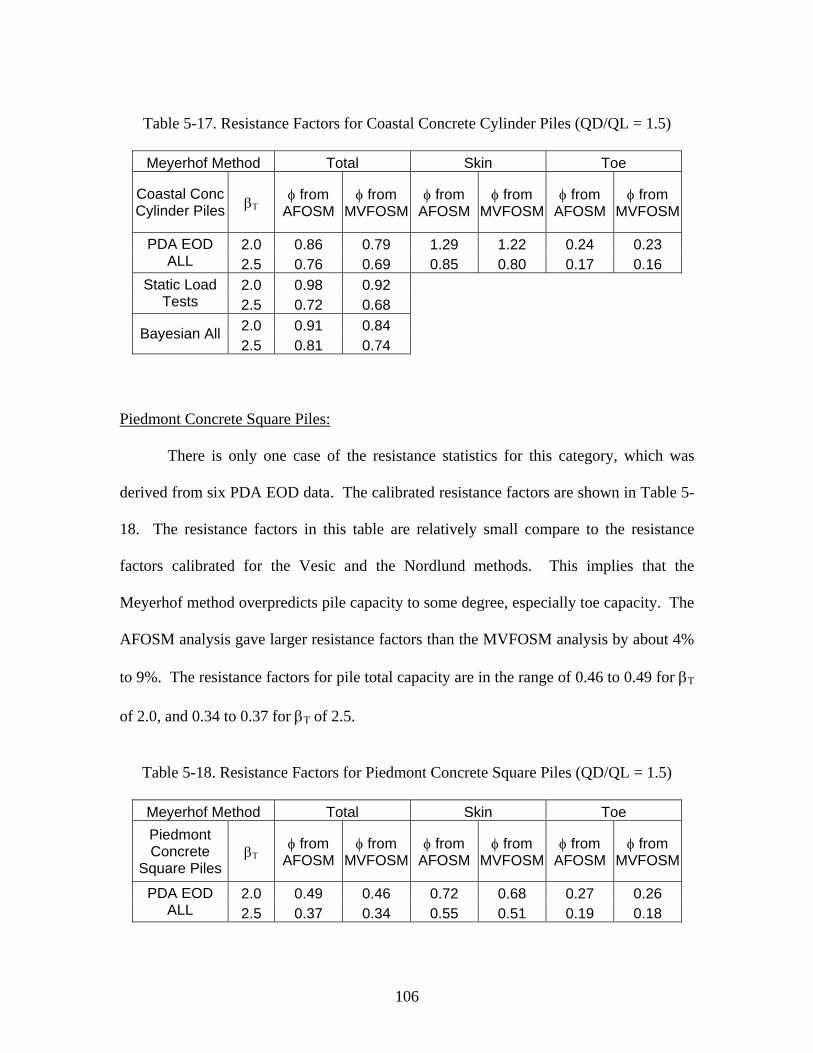
106
Table 5-17. Resistance Factors for Coastal Concrete Cylinder Piles (QD/QL = 1.5)
Meyerhof Method Total Skin Toe
Coastal Conc Cylinder Piles βΤ φ from
AFOSM φ from
MVFOSM φ from
AFOSM φ from
MVFOSM φ from
AFOSM φ from
MVFOSM
2.0 0.86 0.79 1.29 1.22 0.24 0.23 PDA EOD ALL 2.5 0.76 0.69 0.85 0.80 0.17 0.16
2.0 0.98 0.92 Static Load Tests 2.5 0.72 0.68
2.0 0.91 0.84 Bayesian All 2.5 0.81 0.74
Piedmont Concrete Square Piles:
There is only one case of the resistance statistics for this category, which was
derived from six PDA EOD data. The calibrated resistance factors are shown in Table 5-
18. The resistance factors in this table are relatively small compare to the resistance
factors calibrated for the Vesic and the Nordlund methods. This implies that the
Meyerhof method overpredicts pile capacity to some degree, especially toe capacity. The
AFOSM analysis gave larger resistance factors than the MVFOSM analysis by about 4%
to 9%. The resistance factors for pile total capacity are in the range of 0.46 to 0.49 for βT
of 2.0, and 0.34 to 0.37 for βT of 2.5.
Table 5-18. Resistance Factors for Piedmont Concrete Square Piles (QD/QL = 1.5)
Meyerhof Method Total Skin Toe Piedmont Concrete
Square Piles βΤ φ from
AFOSM φ from
MVFOSM φ from
AFOSM φ from
MVFOSM φ from
AFOSM φ from
MVFOSM
2.0 0.49 0.46 0.72 0.68 0.27 0.26 PDA EOD ALL 2.5 0.37 0.34 0.55 0.51 0.19 0.18
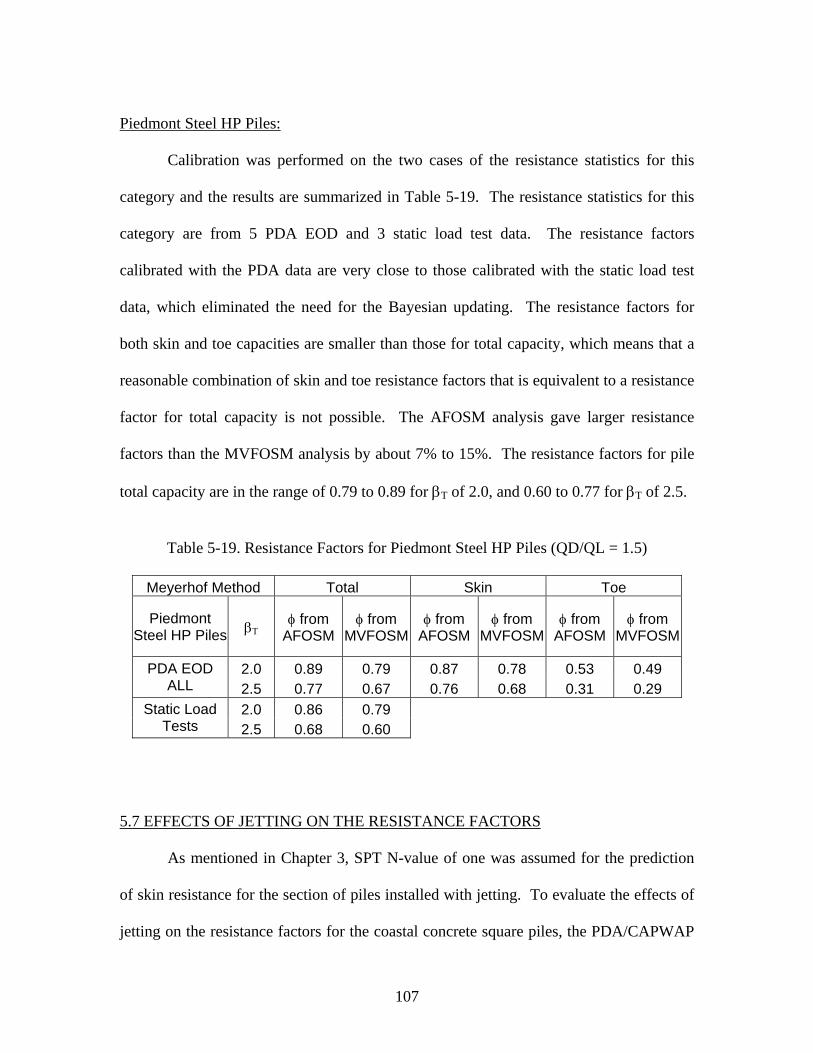
107
Piedmont Steel HP Piles:
Calibration was performed on the two cases of the resistance statistics for this
category and the results are summarized in Table 5-19. The resistance statistics for this
category are from 5 PDA EOD and 3 static load test data. The resistance factors
calibrated with the PDA data are very close to those calibrated with the static load test
data, which eliminated the need for the Bayesian updating. The resistance factors for
both skin and toe capacities are smaller than those for total capacity, which means that a
reasonable combination of skin and toe resistance factors that is equivalent to a resistance
factor for total capacity is not possible. The AFOSM analysis gave larger resistance
factors than the MVFOSM analysis by about 7% to 15%. The resistance factors for pile
total capacity are in the range of 0.79 to 0.89 for βT of 2.0, and 0.60 to 0.77 for βT of 2.5.
Table 5-19. Resistance Factors for Piedmont Steel HP Piles (QD/QL = 1.5)
Meyerhof Method Total Skin Toe
Piedmont Steel HP Piles βΤ φ from
AFOSM φ from
MVFOSM φ from
AFOSM φ from
MVFOSM φ from
AFOSM φ from
MVFOSM
2.0 0.89 0.79 0.87 0.78 0.53 0.49 PDA EOD ALL 2.5 0.77 0.67 0.76 0.68 0.31 0.29
2.0 0.86 0.79 Static Load Tests 2.5 0.68 0.60
5.7 EFFECTS OF JETTING ON THE RESISTANCE FACTORS
As mentioned in Chapter 3, SPT N-value of one was assumed for the prediction
of skin resistance for the section of piles installed with jetting. To evaluate the effects of
jetting on the resistance factors for the coastal concrete square piles, the PDA/CAPWAP
108
data were sub-grouped to piles driven with jetting and those driven without jetting.
Statistical evaluation of the resistance bias factors for each subgroup was performed and
the resistance factors were computed separately for the two subgroups using the
MVFOSM method. Table 5-20 shows the effects of jetting on the calibrated resistance
factors. In the table, ‘All’ means all the PDA/CAPWAP data points without
consideration of jetting effects. ‘Jetting’ means the subgroup of the piles driven with
jetting, and ‘No Jetting’ means the subgroup of the piles driven without jetting.
Generally the effect of jetting is not consistent for the three static pile capacity
analysis methods, or for total, skin and toe capacities. For the Vesic method, the jetting
effect on toe resistance is more significant than on skin resistance. The resistance factors
for total capacity of the Vesic method show somewhat lower values for the jetting
subgroup than for the no-jetting subgroup. One possible reason for the lower resistance
factors for the jetting subgroup is higher model uncertainty and higher variation in the
PDA capacity measurements due to inconsistent jetting operations. There has been no
specific guidance for the jetting procedures in NCDOT, and the degree of disturbance of
the surrounding soil by jetting varies widely from project to project depending on the
individual contractor’s operation. The resistance factors for both skin and toe capacities
of the Nordlund method show somewhat lower values for the jetting subgroup than for
the no-jetting subgroup, except for toe capacity of the PDA BOR case. But the resistance
factors for total capacity of the jetting subgroup are very close to those for ‘All’ data
case. The Meyerhof method shows more inconsistency in the jetting effects on the
resistance factors. For the two PDA EOD cases, the resistance factors for the jetting
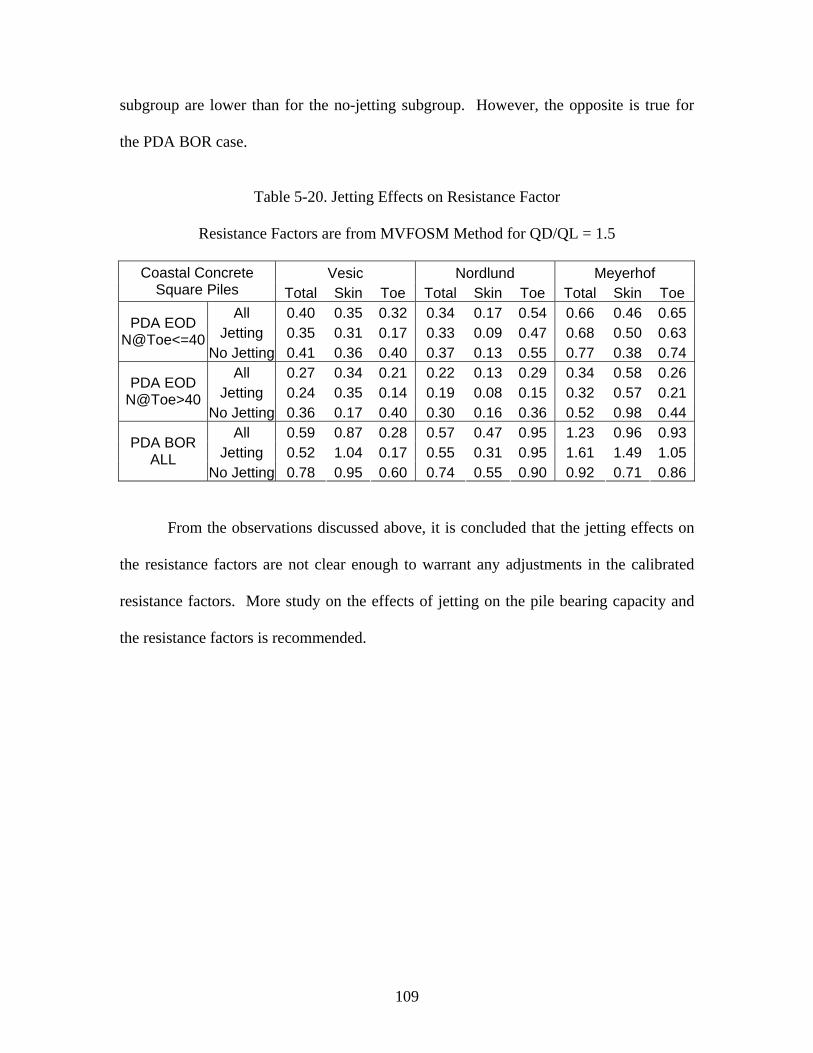
109
subgroup are lower than for the no-jetting subgroup. However, the opposite is true for
the PDA BOR case.
Table 5-20. Jetting Effects on Resistance Factor
Resistance Factors are from MVFOSM Method for QD/QL = 1.5
Vesic Nordlund Meyerhof Coastal Concrete Square Piles Total Skin Toe Total Skin Toe Total Skin Toe
All 0.40 0.35 0.32 0.34 0.17 0.54 0.66 0.46 0.65Jetting 0.35 0.31 0.17 0.33 0.09 0.47 0.68 0.50 0.63
PDA EOD N@Toe<=40
No Jetting 0.41 0.36 0.40 0.37 0.13 0.55 0.77 0.38 0.74All 0.27 0.34 0.21 0.22 0.13 0.29 0.34 0.58 0.26
Jetting 0.24 0.35 0.14 0.19 0.08 0.15 0.32 0.57 0.21PDA EOD
N@Toe>40 No Jetting 0.36 0.17 0.40 0.30 0.16 0.36 0.52 0.98 0.44
All 0.59 0.87 0.28 0.57 0.47 0.95 1.23 0.96 0.93Jetting 0.52 1.04 0.17 0.55 0.31 0.95 1.61 1.49 1.05
PDA BOR ALL
No Jetting 0.78 0.95 0.60 0.74 0.55 0.90 0.92 0.71 0.86
From the observations discussed above, it is concluded that the jetting effects on
the resistance factors are not clear enough to warrant any adjustments in the calibrated
resistance factors. More study on the effects of jetting on the pile bearing capacity and
the resistance factors is recommended.
110
CHAPTER 6. COMPARISON OF ASD AND LRFD - EXAMPLES
Three design cases are selected to illustrate the Load and Resistance Factor
Design (LRFD) procedure to determine the pile length for the required axial pile capacity
in comparison with the Allowable Strength Design (ASD) procedure. All the three
design cases are from the PDA data files complied for this study. A coastal concrete
square pile for the Vesic method is presented below as Example 1. A piedmont concrete
square pile for the Nordlund method is presented below as Example 2. And a coastal
steel HP pile for the Meyerhof method is presented below as Example 3.
Example 1:
20” square concrete piles were designed to support the interior bents of the bridge
in Dare County. The bridge span length was 90 feet, which corresponds to the dead load
over live load ratio (QD/QL) of 1.5. The program PILECAP was used for the Vesic
method to compute the bearing capacity of the pile for each pile length increment. The
computer program output is included in Appendix A.
In ASD, assume FS = 2. The unfactored design load is given as 85 tons per pile.
Then, the required ultimate pile capacity is 170 tons (QULT = QDESIGN x FS). From the
PILECAP output in Appendix A, the required pile length is estimated as 29 feet.
In LRFD, assume βT = 2.0. The recommended resistance factor is 0.6 for coastal
concrete square piles with SPT N-value at toe of 23. The basic LRFD equation can be
written as:
0.6 R = 1.25 QD + 1.75 QL (6-1)
111
Since QD/QL = 1.5, QD = 1.5 QL, or QD = 0.6 Q and QL = 0.4 Q, where Q = QD + QL.
Equation (6-1) can be rewritten as:
0.6 R = 1.25 (0.6 Q) + 1.75 (0.4 Q) = 1.45 Q
From this, R = 6.0
45.1 Q = 6.0
85*45.1 = 205 tons. From the PILECAP output in Appendix
A, the required pile length is estimated as 32 feet. The required pile length from LRFD is
longer than that from ASD by three feet.
Example 2:
12” square concrete piles were designed to support the end bents of the bridge in
Polk County (R-99BA). The bridge span length was 50 feet, which corresponds to the
dead load over live load ratio (QD/QL) of 1.0. The program DRIVEN was used for the
Nordlund method to compute the bearing capacity of the pile for each pile length
increment. The computer program output is included in Appendix A.
In ASD, assume FS = 2. The unfactored design load is given as 50 tons per pile.
Then, the required ultimate pile capacity is 100 tons (QULT = QDESIGN x FS). From the
DRIVEN output in Appendix A, the required pile length is estimated as 28 feet.
In LRFD, assume βT = 2.0. The recommended resistance factor is 0.9 for
piedmont concrete square piles. The basic LRFD equation can be written as:
0.9 R = 1.25 QD + 1.75 QL (6-2)
Since QD/QL = 1.0, QD = QL, or QD = 0.5 Q and QL = 0.5 Q, where Q = QD + QL.
Equation (6-2) can be rewritten as:
0.6 R = 1.25 (0.5 Q) + 1.75 (0.5 Q) = 1.5 Q
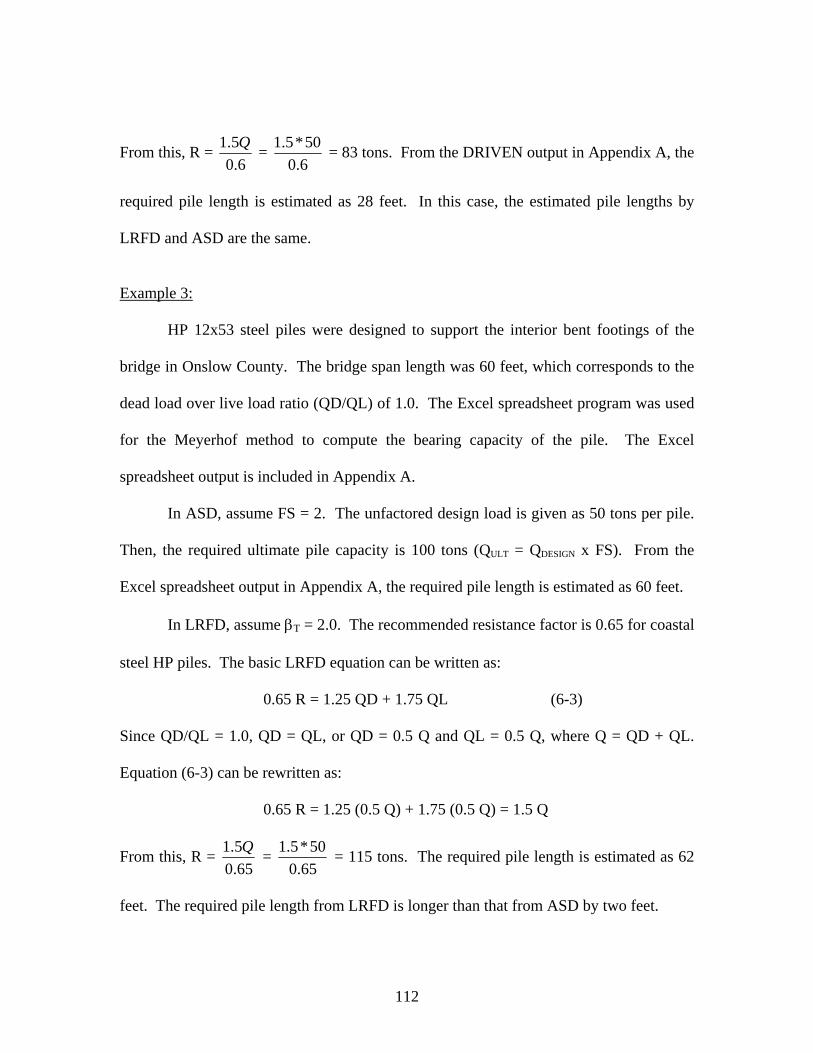
112
From this, R = 6.0
5.1 Q = 6.050*5.1 = 83 tons. From the DRIVEN output in Appendix A, the
required pile length is estimated as 28 feet. In this case, the estimated pile lengths by
LRFD and ASD are the same.
Example 3:
HP 12x53 steel piles were designed to support the interior bent footings of the
bridge in Onslow County. The bridge span length was 60 feet, which corresponds to the
dead load over live load ratio (QD/QL) of 1.0. The Excel spreadsheet program was used
for the Meyerhof method to compute the bearing capacity of the pile. The Excel
spreadsheet output is included in Appendix A.
In ASD, assume FS = 2. The unfactored design load is given as 50 tons per pile.
Then, the required ultimate pile capacity is 100 tons (QULT = QDESIGN x FS). From the
Excel spreadsheet output in Appendix A, the required pile length is estimated as 60 feet.
In LRFD, assume βT = 2.0. The recommended resistance factor is 0.65 for coastal
steel HP piles. The basic LRFD equation can be written as:
0.65 R = 1.25 QD + 1.75 QL (6-3)
Since QD/QL = 1.0, QD = QL, or QD = 0.5 Q and QL = 0.5 Q, where Q = QD + QL.
Equation (6-3) can be rewritten as:
0.65 R = 1.25 (0.5 Q) + 1.75 (0.5 Q) = 1.5 Q
From this, R = 65.05.1 Q =
65.050*5.1 = 115 tons. The required pile length is estimated as 62
feet. The required pile length from LRFD is longer than that from ASD by two feet.
113
CHAPTER 7. CONCLUSIONS AND RECOMMENDATIONS
Resistance factors for driven piles were developed using available databases of
the resistance bias. For the categories of coastal concrete square piles and coastal steel
HP piles, the resistance factors were evaluated separately for the two different subgroups
based on the SPT N-value at the pile toe: N@Toe<=40 and N@Toe>40. For coastal steel
HP piles, the difference in the calibrated resistance factors between the two subgroups is
insignificant. Thus, only one set of the resistance factors is recommended for this
category. For “coastal” concrete square piles, it is warranted to recommend a separate set
of resistance factors for each N-value category. The effect of Jetting on coastal concrete
square piles are not conclusive, thus at this time they are not considered in the selection
of the recommended resistance factors.
The resistance factors were calibrated separately for total, skin and toe capacities
in an attempt to develop a correlation between the three resistance factors for each design
category. In many cases, however, the resistance factor for total capacity is larger than
both the skin and toe resistance factors. Thus, the combination of the skin and toe
resistance factors cannot produce the factored resistance equivalent to that by the total
capacity resistance factor. One probable reason is the averaging effect of the variations
in skin and toe capacities when they are combined for total pile capacity. Also, most of
the driven piles develop both skin and toe resistances, but the percentage of skin or toe
capacity to total capacity is not constant. For these reasons, the resistance factors for
only total capacity are recommended.
This study considered seven design categories for which the resistance factors are
recommended for each of the three static pile capacity analysis methods. These are
114
coastal concrete square pile with N@Toe<=40, coastal concrete square pile with
N@Toe>40, coastal steel HP pile, coastal steel pipe pile, coastal concrete cylinder pile,
piedmont concrete square pile, and piedmont steel HP pile. The resistance factors
calibrated in Chapter 5 are based on many different sizes of pile load test databases with
different degrees of variety in pile sizes and lengths, test locations, and soil types. This
variation in the databases is considered and some degree of judgment is exercised in the
selection of the recommended resistance factors from the calibrated resistance factors for
each design category. Calibration was performed using both the PDA EOD databases
and the PDA BOR databases as well as the Bayesian updated databases, whenever the
databases are available. The resistance factors calibrated using the static load test
databases are compared with those calibrated using the PDA databases. All calibrated
resistance factors are then considered in the selection of the recommended resistance
factors for each design category.
For the coastal concrete square piles, the pile capacities measured in the PDA
restrikes (BOR) appear to represent the ultimate pile capacity more accurately than those
measured in the PDA initial driving (EOD) or even the static load tests (given that the
static load tests were not normally carried to failure). In this case, the resistance factors
calibrated using the PDA BOR databases are given more weight than those based on the
PDA EOD or static load test databases. For the coastal steel HP piles, the increase in the
calibrated resistance factors from PDA EOD to PDA BOR due to the capacity gain with
time (setup) is significant. However, the PDA EOD databases are rather small and
considered less reliable than the PDA EOD databases. The recommended resistance
factors are selected by weighing the calibrated resistance factors from the two databases
115
equally, though the resistance factors calibrated using the Bayesian updated databases are
closer to those calibrated using the PDA BOR databases.
The setup effects for the coastal steel pipe piles are also significant. All but one
PDA data for the coastal steel pipe piles are from the same project site, and this probably
contributed to the resistance statistics for all the three static capacity analysis methods.
More variation in the resistance bias factors is expected if the PDA data were from more
diverse project sites, which would result in smaller resistance factors. The recommended
resistance factors are selected conservatively considering this fact. The resistance factors
for the coastal concrete cylinder piles are based on the least amount of the pile load test
data, and therefore least reliable. The resistance factors calibrated for the Nordlund
method are extremely small and are not recommended for practical use. The static load
test data are considered more reliable than the PDA EOD data, and the recommended
resistance factors for the Vesic and Meyerhof methods are selected based on the static
load test data.
It is interesting to note that the calibrated resistance factors for the piedmont
concrete square piles are quite small compared to those for other categories of the
Meyerhof method or those for the same category of the Vesic and Nordlund methods. It
is probably because of the large COV of the resistance bias factors as shown in Table 4-7.
AFOSM resulted in larger resistance factors than MVFOSM (by 4 to 15 percent
for the total capacity.) Since AFOSM method is more accurate than MVFOSM method,
the results from AFOSM are used in the selection of the recommended resistance factors.
The resistance factors are recommended for the target reliability index (βT) of 2.0 and
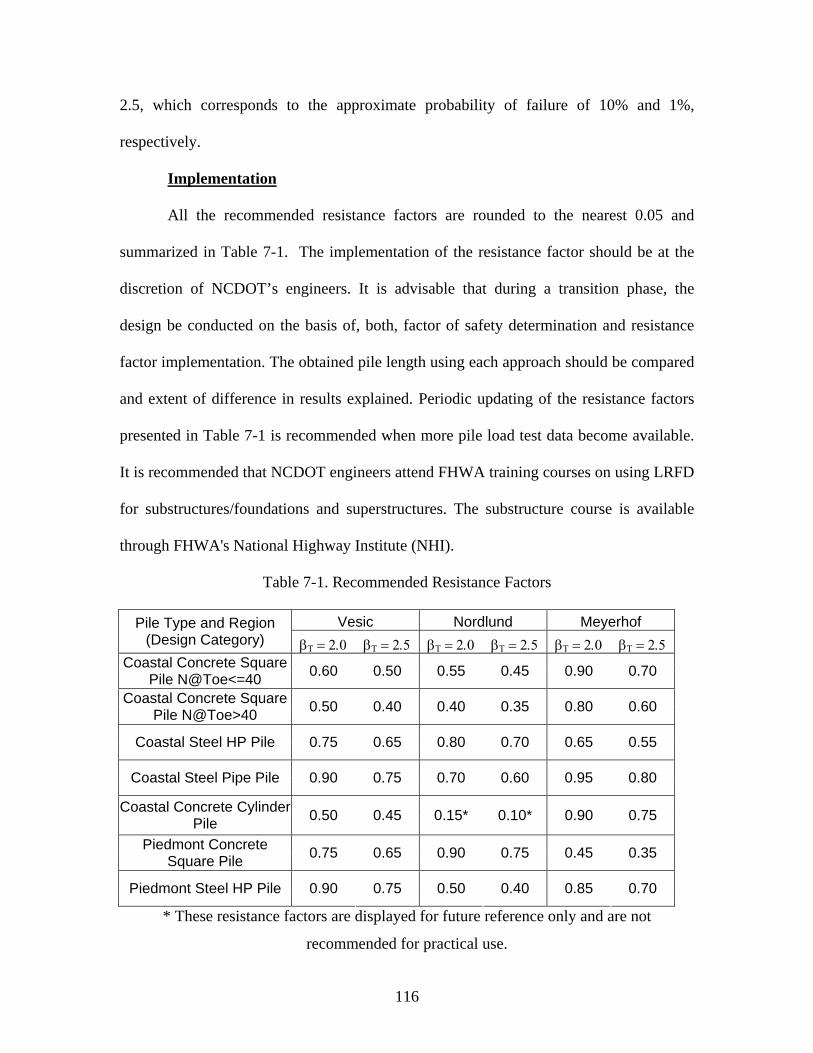
116
2.5, which corresponds to the approximate probability of failure of 10% and 1%,
respectively.
Implementation
All the recommended resistance factors are rounded to the nearest 0.05 and
summarized in Table 7-1. The implementation of the resistance factor should be at the
discretion of NCDOT’s engineers. It is advisable that during a transition phase, the
design be conducted on the basis of, both, factor of safety determination and resistance
factor implementation. The obtained pile length using each approach should be compared
and extent of difference in results explained. Periodic updating of the resistance factors
presented in Table 7-1 is recommended when more pile load test data become available.
It is recommended that NCDOT engineers attend FHWA training courses on using LRFD
for substructures/foundations and superstructures. The substructure course is available
through FHWA's National Highway Institute (NHI).
Table 7-1. Recommended Resistance Factors
Vesic Nordlund Meyerhof Pile Type and Region (Design Category) βΤ = 2.0 βΤ = 2.5 βΤ = 2.0 βΤ = 2.5 βΤ = 2.0 βΤ = 2.5
Coastal Concrete Square Pile N@Toe<=40 0.60 0.50 0.55 0.45 0.90 0.70
Coastal Concrete Square Pile N@Toe>40 0.50 0.40 0.40 0.35 0.80 0.60
Coastal Steel HP Pile 0.75 0.65 0.80 0.70 0.65 0.55
Coastal Steel Pipe Pile 0.90 0.75 0.70 0.60 0.95 0.80
Coastal Concrete Cylinder Pile 0.50 0.45 0.15* 0.10* 0.90 0.75
Piedmont Concrete Square Pile 0.75 0.65 0.90 0.75 0.45 0.35
Piedmont Steel HP Pile 0.90 0.75 0.50 0.40 0.85 0.70
* These resistance factors are displayed for future reference only and are not
recommended for practical use.
117
REFERENCES
1. American Association of State Highway and Transportation Officials,
Washington, D.C.
1994. AASHTO LRFD Bridge Design Specifications, 1st edition.
1998. AASHTO LRFD Bridge Design Specifications, 2nd edition.
1977. AASHTO Standard Specifications for Highway Bridges, 12th edition.
2. American Concrete Institute, Detroit, Michigan.
1956. Building Code Requirements for Reinforced Concrete, ACI 318-56.
1963. Building Code Requirements for Reinforced Concrete, ACI 318-63.
1969. Building Code Requirements for Reinforced Concrete, ACI 318-69.
3. American Institute of Steel Construction, Inc., 1986. Load and Resistance Factor
Design Specification for Structural Steel Buildings, Chicago, Illinois.
4. Ang, H.S. and Tang, W.H., 1975. Probability Concepts in Engineering Planning
and Design, Vol. I, Basic Principles, John Wiley & Sons, New York.
5. Barker, R.M., J.M. Duncan, K.B. Rojiani, P.S.K. Ooi, C.K. Tan, and S.G. Kim,
1991a. NCHRP Report 343: Manuals for the Design of Bridge Foundations.
Transportation Research Board, Washington, D.C.
6. Barker, R.M., J.M. Duncan, K.B. Rojiani, P.S.K. Ooi, C.K. Tan, and S.G. Kim,
1991b. NCHRP Project 24-4, Final Report: Load Factor Design Criteria for
Highway Structure Foundations. Virginia Polytechnic Institute and State
University, Blacksburg, VA.
118
7. Benjamin, J.R. and C.A. Cornell, 1970. Probability, Statistics, and Decision for
Civil Engineers, McGraw-Hill Inc., New York.
8. Berger, J.O. 1980. Statistical Decision Theory and Bayesian Analysis, 2nd edition,
Springer-Verlag Inc., New York.
9. Cornell, C.A., 1969. A Probability-Based Structural Code. Journal of American
Concrete Institute, Vol. 66, pp. 974-988.
10. Danish Geotechnical Institute, 1985. Code of Practice for Foundation
Engineering, DGI Bulletin No. 36, Lyngby, Denmark.
11. Davisson, M.T., 1972, High Capacity Piles, Proceedings of the Lecture Series on
Innovation in Foundation Construction, pp. 81-112, ASCE Illinois Section,
Chicago, IL.
12. DiMaggio, J., et al. 1999. Geotechnical Engineering Practices in Canada and
Europe, Report No. FHWA-PL-99-013, Office of International Program, Federal
Highway Administration, Washington, D.C.
13. Ditlevsin, O., 1974. Generalized Second Moment Reliability Index, Journal of
Structural Division, ASCE, Vol. 7, No. 4, pp. 435-451.
14. Ellingwood, B, T.V. Galambos, J.G. MacGregor and C.A. Cornell, 1980.
Development of a Probability Based Load Criterion for American National
Standard A58 – Building Code Requirements for Minimum Design Loads in
Buildings and Other Structures, National Bureau of Standards, Washington, D.C.
15. Fellenius, B.H., 1980. The Analysis of Results from Routine Pile Load Tests,
Ground Engineering, Vol. 13, No. 6 pp. 19-31, Foundations Publications, Ltd.
119
16. Gabr, M.A., 1993. Model for Capacity of Single Piles in Sand Using Fuzzy Sets,
Discussion of Paper by Juang et al., Journal of Geotechnical Engineering, Vol.
119(1), pp. 191-193, American Society of Civil Engineers.
17. Gibbs, H.J. and Holtz, W.G., 1957. Research on Determining the Density of
Sands by Spoon Penetration Testing, Proceedings, 4th International Conference on
Soil Mechanics and Foundation Engineering, Vol. I, London, UK.
18. Goble, G.G., Likins, G.E., and Rausche, F., 1975. Bearing Capacity of Piles from
Dynamic Measurements, Final Report, Department of Civil Engineering, Case
Western Reserve University, Cleveland, Ohio.
19. Goble, G.G., 2001. LRFD in Foundation Design Practice – Advantages and
Limitations, presentation at 2001 Transportation Research Board Meeting,
Washington, D.C.
20. Goble, G.G. 1999. Geotechnical Related Development and Implementation of
Load and Resistance Factor Design (LRFD) Methods. NCHRP Program,
Synthesis of Highway Practice 276, Transportation Research Board, Washington,
D.C.
21. Goble, G.G. 1996. Load And Resistance Factor Design of Driven Piles,
Transportation Research Record No. 1546, pp. 88-93, TRB, Washington, D.C.
22. Goble, G.G, F. Moses and R. Snyder, 1980. Pile Design and Installation
Specification Based on Load Factor Concept, Transportation Research Record
749, pp. 42-45, Transportation Research Board, Washington, D.C.
23. Haldar, A., and Mahadevan, S. 2000. Probability, Reliability and Statistical
Methods in Engineering Design, John Wiley and Sons, New York.
120
24. Hannigan, P.J., 1990. Dynamic Monitoring and Analysis of Pile Foundation
Installations, A Continuing Education Short Course Text, Deep Foundations
Institute, Sparta, N. J.
25. Hannigan, P.J., G.G. Goble, G. Thendean, G.E. Likins and F. Rausche, 1996.
Design and Construction of Driven Pile Foundations, Vol.1, Federal Highway
Administration, Washington, D.C.
26. Hansen, J.B., 1966. Code of Practice for Foundation Engineering, Bulletin No.
22, Danish Geotechnical Institute, Copenhagen, Denmark.
27. Hasofer, A.M. and Lind, N.C., 1974. Exact and Invariant Second-Moment Code
Format, Journal of Engineering Mechanics Division, ASCE, Vol. 100, No. EM1,
pp. 111-121.
28. Hohenbichler, M., Gollwitzer, S., Kruse, W., and Rackwitz, R.,1987. New Light
on First and Second Order Reliability Methods, Structural Safety, Vol. 4, pp.
267-284.
29. Keane, P.A., 1990. Comparison of Pile Capacity Predictions to Load Test Results
in Eastern North Carolina, Department of Civil Engineering, North Carolina State
University, Raleigh, NC.
30. Likins, G., Rausche, F., Thendean, G., and Svinkin, M., 1996. CAPWAP
Correlation Studies, Proceedings of 5th International Conference on the
Application of Stress-Wave Theory on Piles, Orlando, FL.
31. Mathias, D. and Cribbs, M., 1998. DRIVEN 1.0 User’s Manual, Blue-Six
Software, Inc., Federal Highway Administration, Washington, D.C.
121
32. Myerhof, G.G. 1970. Safety Factors in Soil Mechanics, Canadian Geotechnical
Journal, Vol. 7, pp. 349-355.
33. Myerhof, G.G. 1976. Bearing Capacity and Settlement of Pile Foundations,
Journal of Geotechnical Engineering Division, ASCE, Vol. 102, No. GT3, pp.
197-228.
34. Nadim, F., M.A. Gabr and B. Hansen, 1989. Sensitivity Study of the Cyclic Axial
Capacity of a Single Pile, Proceedings of the ASCE Foundation Engineering
Congress, Vol. 2, June, pp. 1473-1485, Evanston, Illinois.
35. Nguygen, T., McVay, M.C., Birgisson, B., and Kuo, C., 2001. Uncertainty in
LRFD Phi, φ, Factors for Driven Prestressed Concrete Piles, A Draft for
Presentation at 2002 TRB Annual Meeting.
36. Nordlund, R.L., 1963. Bearing Capacity of Piles in Cohesionless Soils, Journal of
the Soil Mechanics and Foundations Division, Vol. 89, No. SM3, pp. 1-35,
American Society of Civil Engineers.
37. Nordlund, R.L., 1979. Point Bearing and Shaft Friction of Piles in Sand, 5th
Annual Fundamentals of Deep Foundation Design, University of Missouri-Rolla.
38. North Carolina Department of Transportation, 1995. Pile Bearing Capacity
Analysis (PILECAP) User’s Manual, Raleigh, N. C.
39. North Carolina Geological Survey, 1985. Geologic Map of North Carolina, N. C.
Geological Survey, Raleigh, 1 sheet, scale 1:500,000.
40. North Carolina Geological Survey, 1988. Preliminary Explanatory Text for the
1985 Geological Map of North Carolina, Contractual Report 88-1, N. C.
Geological Survey, Raleigh.
122
41. Nowak, A.S., 1992. NCHRP Project 12-33: Calibration of LRFD Bridge Design
Code, Transportation Research Board, Washington, D.C.
42. Nowak, A.S., 1999. NCHRP Report 368: Calibration of LRFD Bridge Design
Code, Transportation Research Board, National Academy Press, Washington,
D.C.
43. Ontario Ministry of Transportation and Communication,
1979. Ontario Highway Bridge Design Code and Commentary, 1st edition.
1983. Ontario Highway Bridge Design Code and Commentary, 2nd edition.
1992. Ontario Highway Bridge Design Code and Commentary, 3rd edition.
44. Passe, P. 1997. Florida’s Move to the AASHTO LRFD Code, STGEC 97,
Chattanooga. TN.
45. Rackwitz, R. and Fiessier, B., 1978. Structural Reliability under Combined
Random Load Sequences, Computers and Structures, Vol. 9, pp. 489-494.
46. Rausche, F., Goble, G.G., and Likins, G.E., 1985. Dynamic Determination of Pile
Capacity, Journal of Geotechnical Engineering, Vol. 111, No. 3, pp. 367-383,
American Society of Civil Engineers.
47. Ronold, K.O. and Bjerager, P., 1992. Model Uncertainty Representation in
Geotechnical Reliability Analyses, Journal of Geotechnical Engineering, Vol.
118, No. 3, pp. 363-376, American Society of Civil Engineers.
48. Schultze, E. and Melzer, K.J., 1965. The Determination of Density and Modulus
of Compressibility of Non-Cohesive Soils by Soundings, Proceedings, 6th
International Conference on Soil Mechanics and Foundation Engineering.
123
49. Schultze, E. and Menzenbach, E., 1961. Standard Penetration Test on
Compressibility of Soils, Proceedings, 5th International Conference on Soil
Mechanics and Foundation Engineering.
50. Suzanne, L., 1987. Uncertainty in Offshore Geotechnical Engineering:
Deterministic and Probabilistic Analysis of Axial Capacity of Single Pile,
Norwegian Geotechnical Institute, Oslo, Norway.
51. Svinkin, M.R., Morgano, C.M., and Morvant, M., 1994. Pile Capacity as a
Function of Time in Clayey and Sandy Soils, Proceedings of International
Conference and Exhibition on Piling and Deep Foundation, DFI, Westrade Fairs
Ltd., Bruges, Belgium.
52. Tang, W.H., Yucemen, M.S. and Ang, H-S, 1976. Probability-Based Short Term
Design of Soil Slopes, Journal of Canadian Geotechnical Society, Vol. 13, pp.
127-148.
53. Vesic, A.S. 1977. NCHRP Synthesis of Highway Practice 42: Design of Pile
Foundations, Transportation Research Board, Washington, D.C.
54. Withiam, J.L. et al. 1998. Load and Resistance Factor Design (LRFD) of
Highway Bridge Substructures. FHWA Publication No. HI-98-032, Federal
Highway Administration, Washington, D.C.
55. Zhang, L. and W. H. Tang, 2001. Use of Load Tests for Reducing Pile Length,
Draft for 2002 ASCE-GI International Deep Foundations Congress, Orlando,
Florida.
124
APPENDIX A
Static Pile Capacity Analysis Example
The Vesic Method
The Nordlund Method
The Meyerhof Method
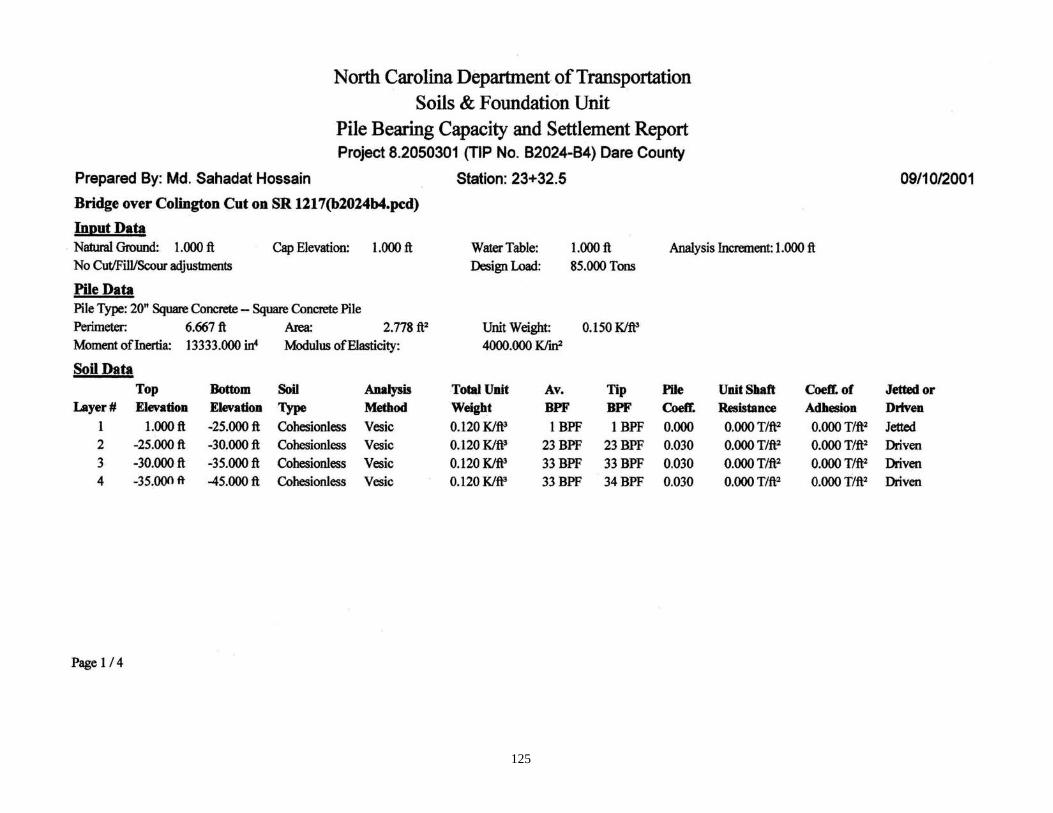
125
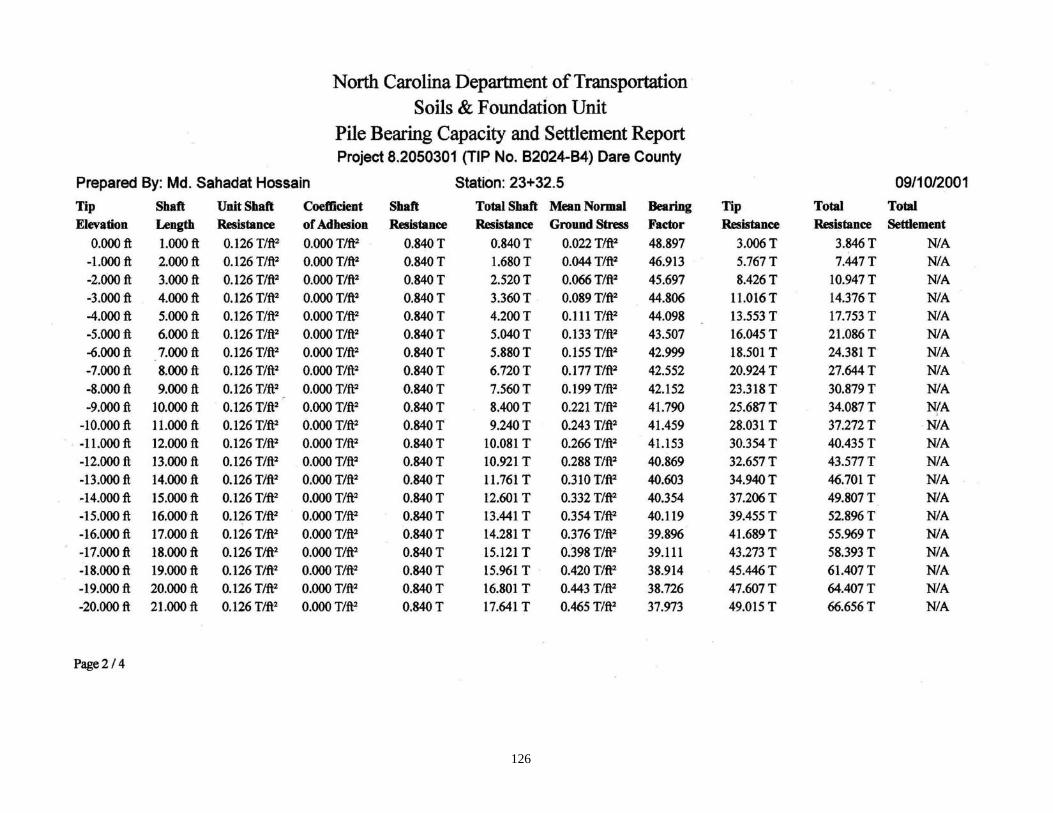
126
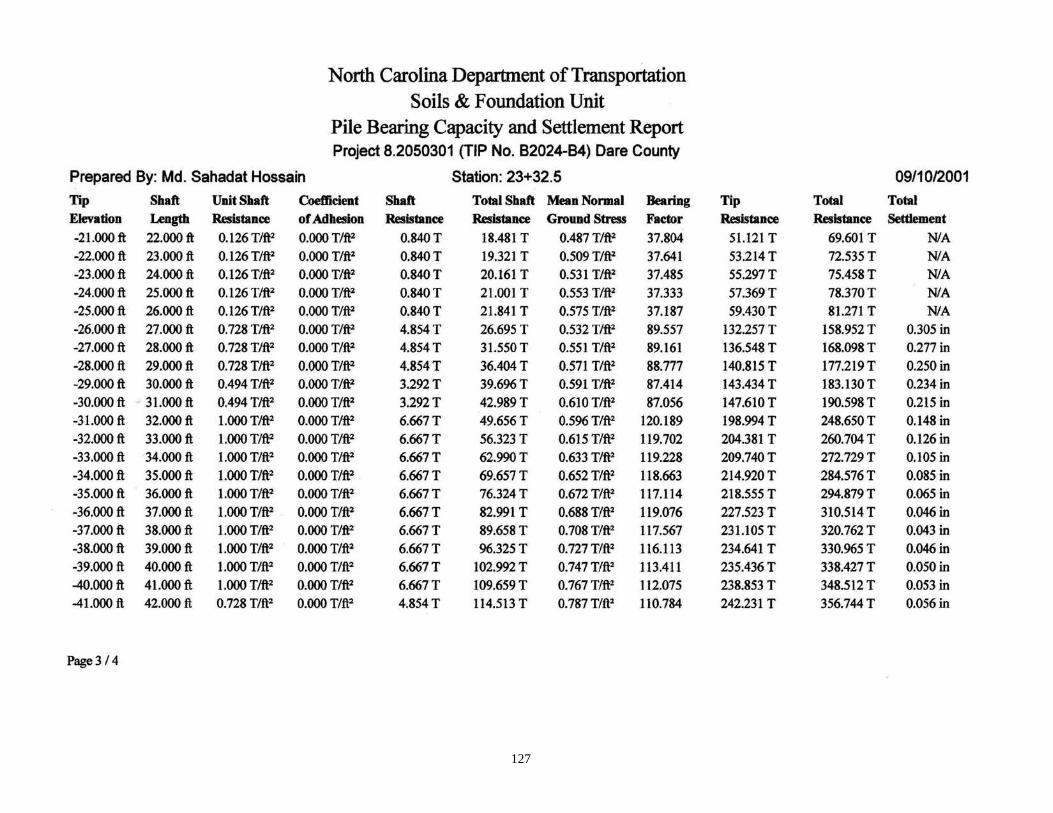
127
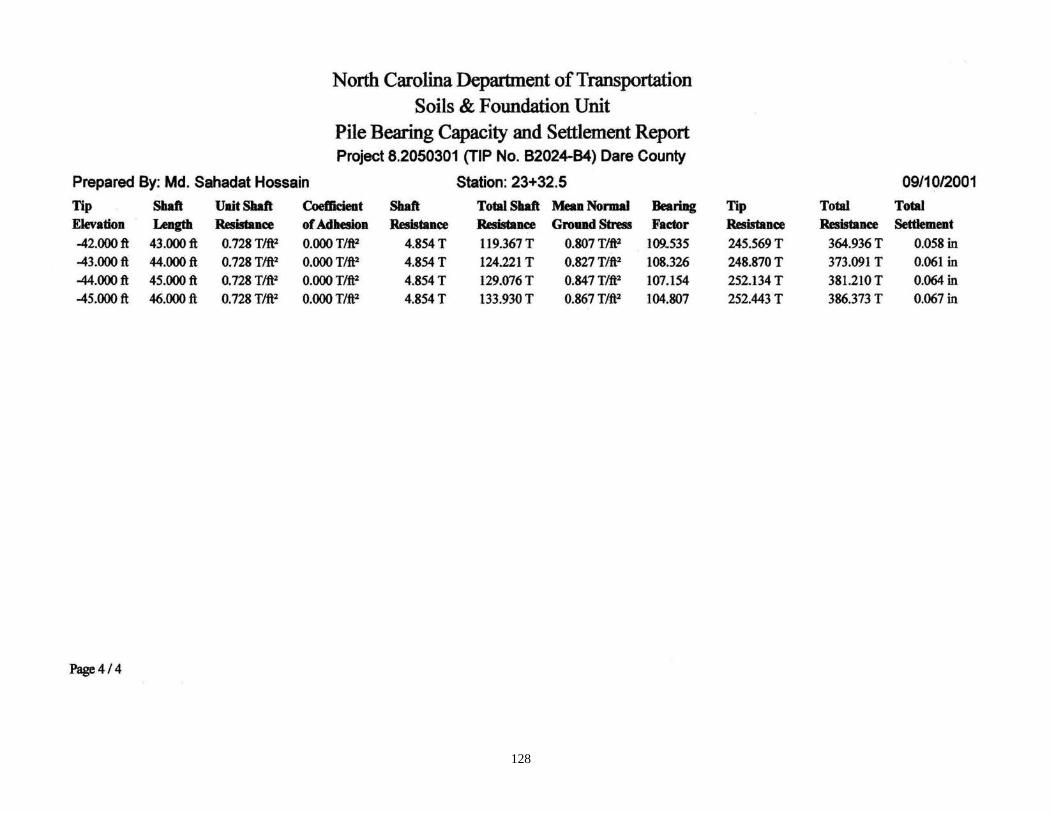
128
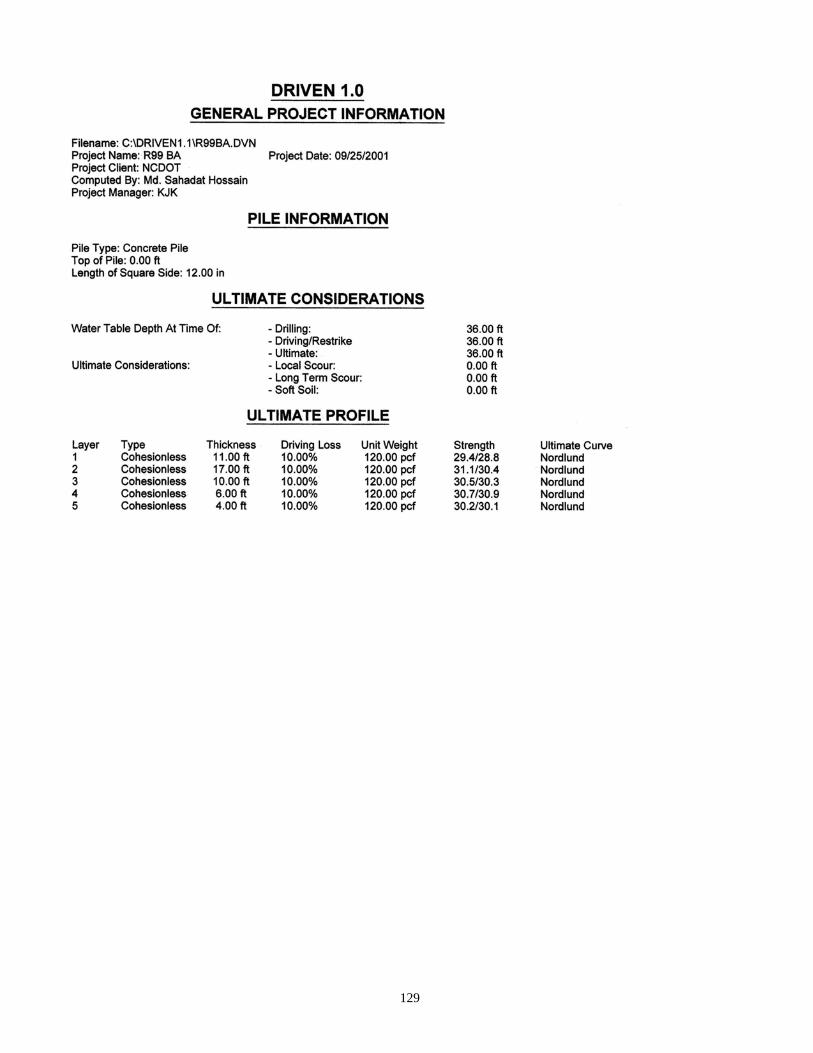
129
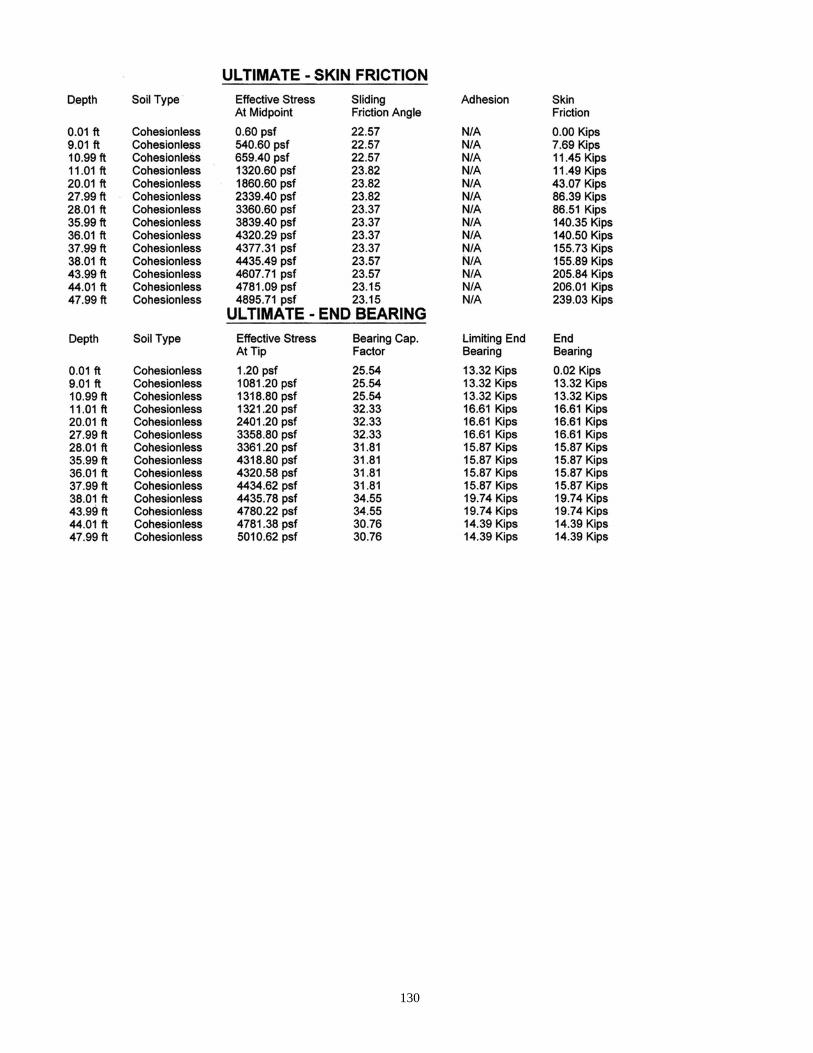
130
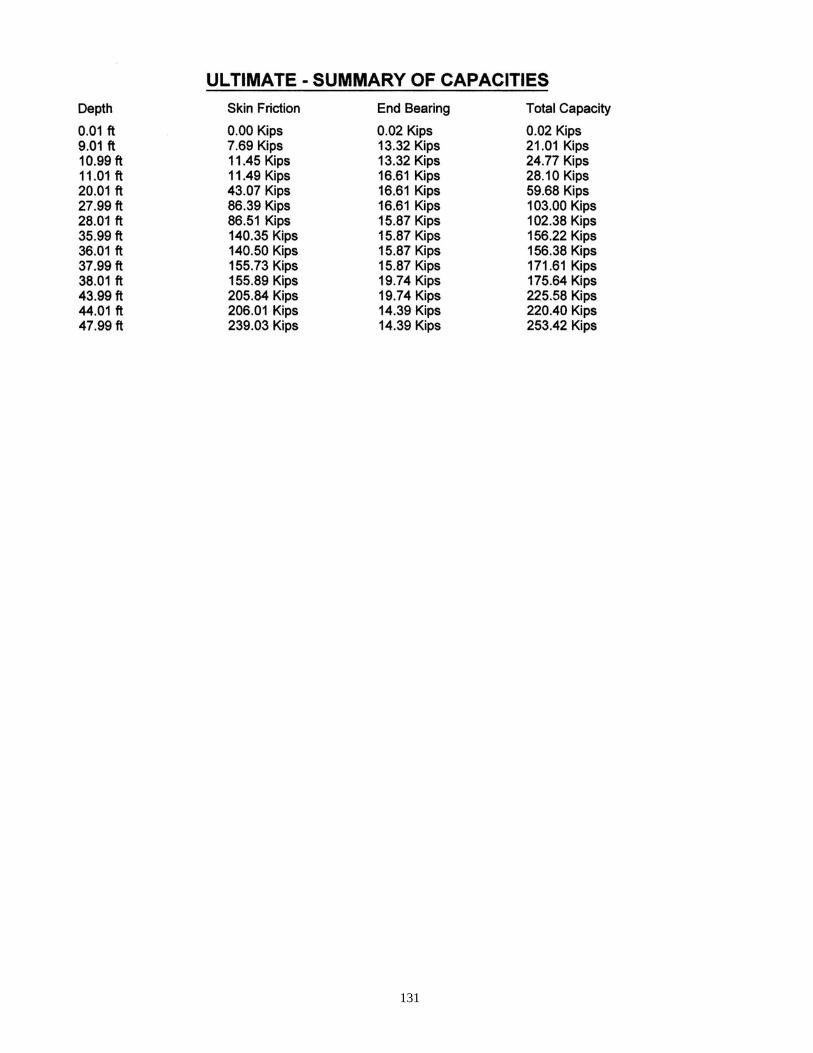
131
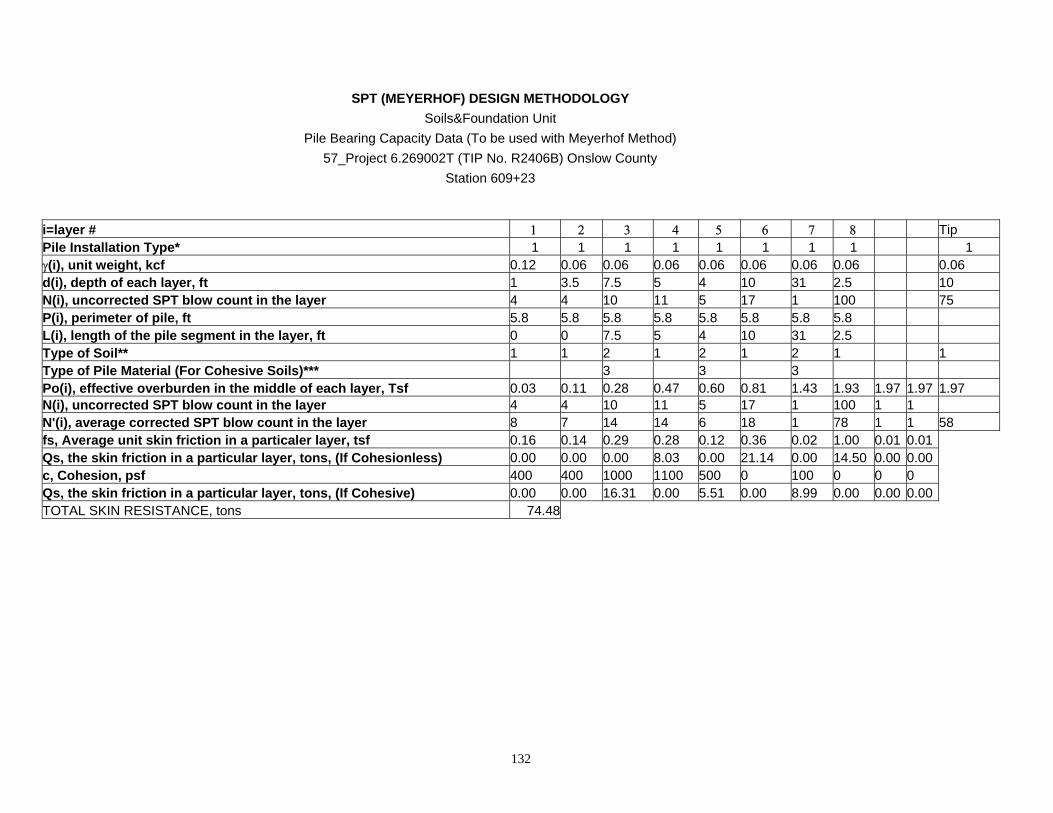
132
SPT (MEYERHOF) DESIGN METHODOLOGY Soils&Foundation Unit
Pile Bearing Capacity Data (To be used with Meyerhof Method) 57_Project 6.269002T (TIP No. R2406B) Onslow County
Station 609+23 i=layer # 1 2 3 4 5 6 7 8 Tip Pile Installation Type* 1 1 1 1 1 1 1 1 1 γ(i), unit weight, kcf 0.12 0.06 0.06 0.06 0.06 0.06 0.06 0.06 0.06 d(i), depth of each layer, ft 1 3.5 7.5 5 4 10 31 2.5 10 N(i), uncorrected SPT blow count in the layer 4 4 10 11 5 17 1 100 75 P(i), perimeter of pile, ft 5.8 5.8 5.8 5.8 5.8 5.8 5.8 5.8 L(i), length of the pile segment in the layer, ft 0 0 7.5 5 4 10 31 2.5 Type of Soil** 1 1 2 1 2 1 2 1 1 Type of Pile Material (For Cohesive Soils)*** 3 3 3 Po(i), effective overburden in the middle of each layer, Tsf 0.03 0.11 0.28 0.47 0.60 0.81 1.43 1.93 1.97 1.97 1.97 N(i), uncorrected SPT blow count in the layer 4 4 10 11 5 17 1 100 1 1 N'(i), average corrected SPT blow count in the layer 8 7 14 14 6 18 1 78 1 1 58 fs, Average unit skin friction in a particaler layer, tsf 0.16 0.14 0.29 0.28 0.12 0.36 0.02 1.00 0.01 0.01 Qs, the skin friction in a particular layer, tons, (If Cohesionless) 0.00 0.00 0.00 8.03 0.00 21.14 0.00 14.50 0.00 0.00 c, Cohesion, psf 400 400 1000 1100 500 0 100 0 0 0 Qs, the skin friction in a particular layer, tons, (If Cohesive) 0.00 0.00 16.31 0.00 5.51 0.00 8.99 0.00 0.00 0.00 TOTAL SKIN RESISTANCE, tons 74.48
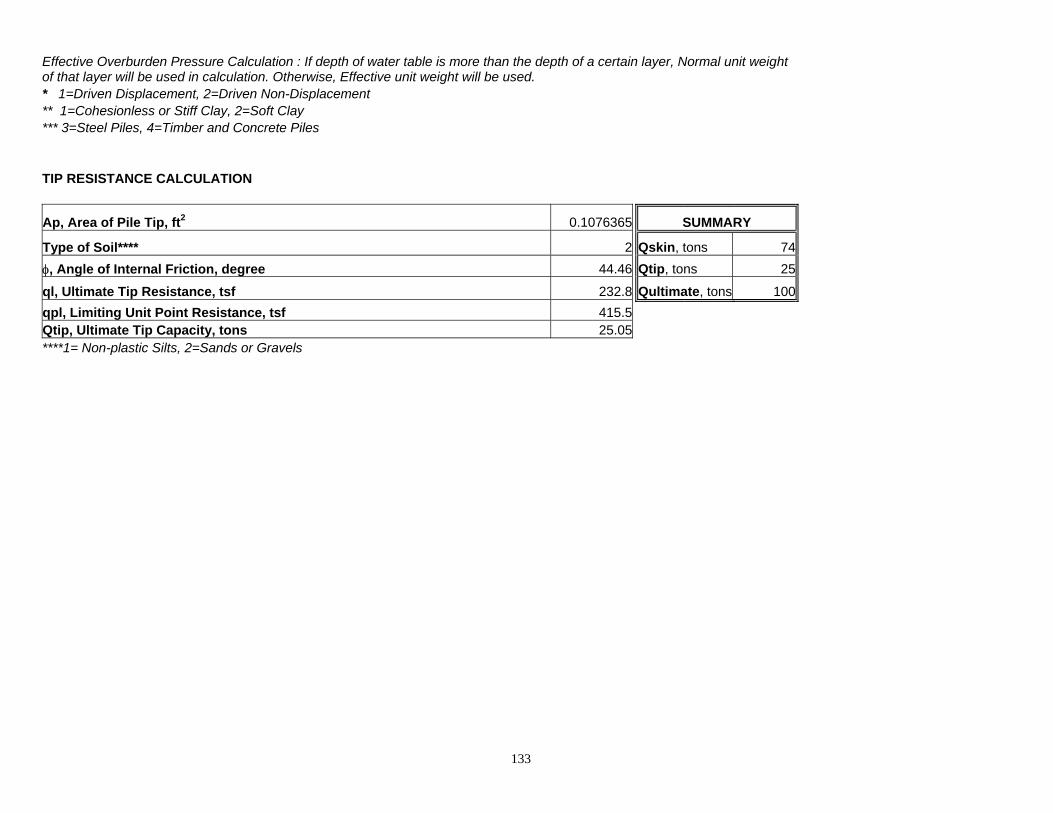
133
Effective Overburden Pressure Calculation : If depth of water table is more than the depth of a certain layer, Normal unit weight of that layer will be used in calculation. Otherwise, Effective unit weight will be used. * 1=Driven Displacement, 2=Driven Non-Displacement ** 1=Cohesionless or Stiff Clay, 2=Soft Clay *** 3=Steel Piles, 4=Timber and Concrete Piles TIP RESISTANCE CALCULATION
Ap, Area of Pile Tip, ft2 0.1076365 SUMMARY Type of Soil**** 2 Qskin, tons 74φ, Angle of Internal Friction, degree 44.46 Qtip, tons 25
ql, Ultimate Tip Resistance, tsf 232.8 Qultimate, tons 100qpl, Limiting Unit Point Resistance, tsf 415.5 Qtip, Ultimate Tip Capacity, tons 25.05 ****1= Non-plastic Silts, 2=Sands or Gravels
134
APPENDIX B
PDA/CAPWAP Data Summary Sheets
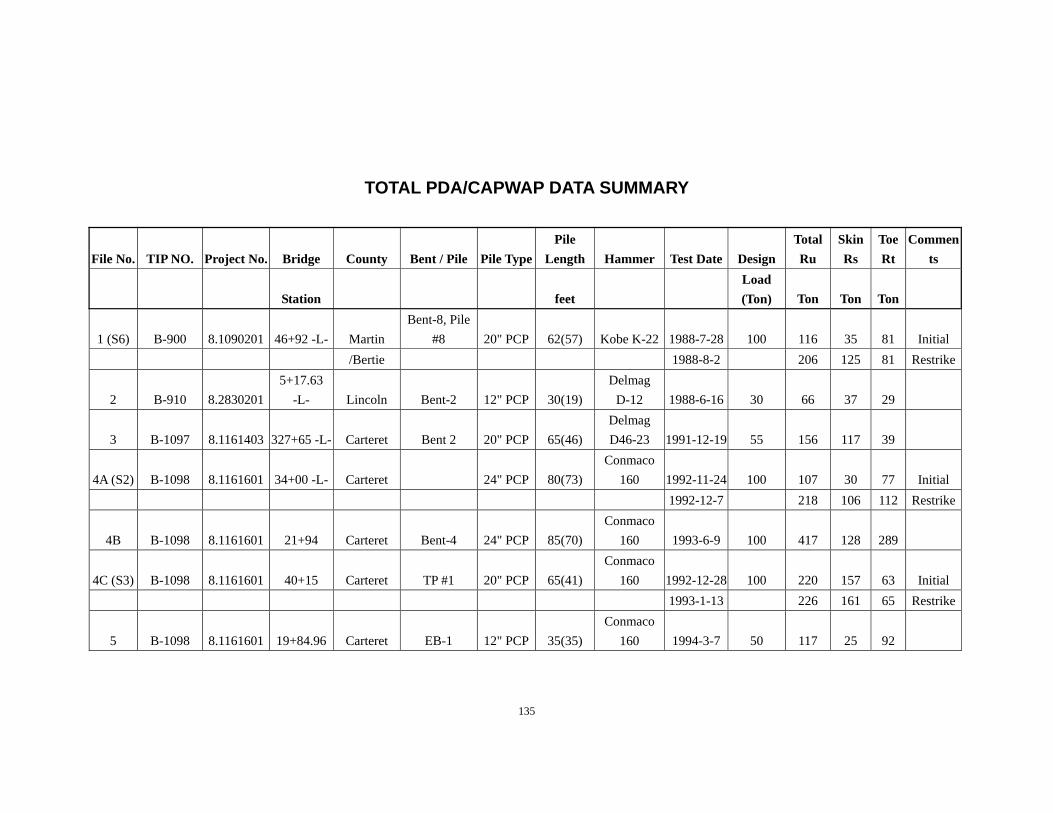
135
TOTAL PDA/CAPWAP DATA SUMMARY
File No. TIP NO. Project No. Bridge County Bent / Pile Pile TypePile
Length Hammer Test Date Design Total Ru
Skin Rs
Toe Rt
Comments
Station feet Load (Ton) Ton Ton Ton
1 (S6) B-900 8.1090201 46+92 -L- Martin Bent-8, Pile
#8 20" PCP 62(57) Kobe K-22 1988-7-28 100 116 35 81 Initial /Bertie 1988-8-2 206 125 81 Restrike
2 B-910 8.2830201 5+17.63
-L- Lincoln Bent-2 12" PCP 30(19) Delmag
D-12 1988-6-16 30 66 37 29
3 B-1097 8.1161403 327+65 -L- Carteret Bent 2 20" PCP 65(46) Delmag D46-23 1991-12-19 55 156 117 39
4A (S2) B-1098 8.1161601 34+00 -L- Carteret 24" PCP 80(73) Conmaco
160 1992-11-24 100 107 30 77 Initial 1992-12-7 218 106 112 Restrike
4B B-1098 8.1161601 21+94 Carteret Bent-4 24" PCP 85(70) Conmaco
160 1993-6-9 100 417 128 289
4C (S3) B-1098 8.1161601 40+15 Carteret TP #1 20" PCP 65(41) Conmaco
160 1992-12-28 100 220 157 63 Initial 1993-1-13 226 161 65 Restrike
5 B-1098 8.1161601 19+84.96 Carteret EB-1 12" PCP 35(35) Conmaco
160 1994-3-7 50 117 25 92
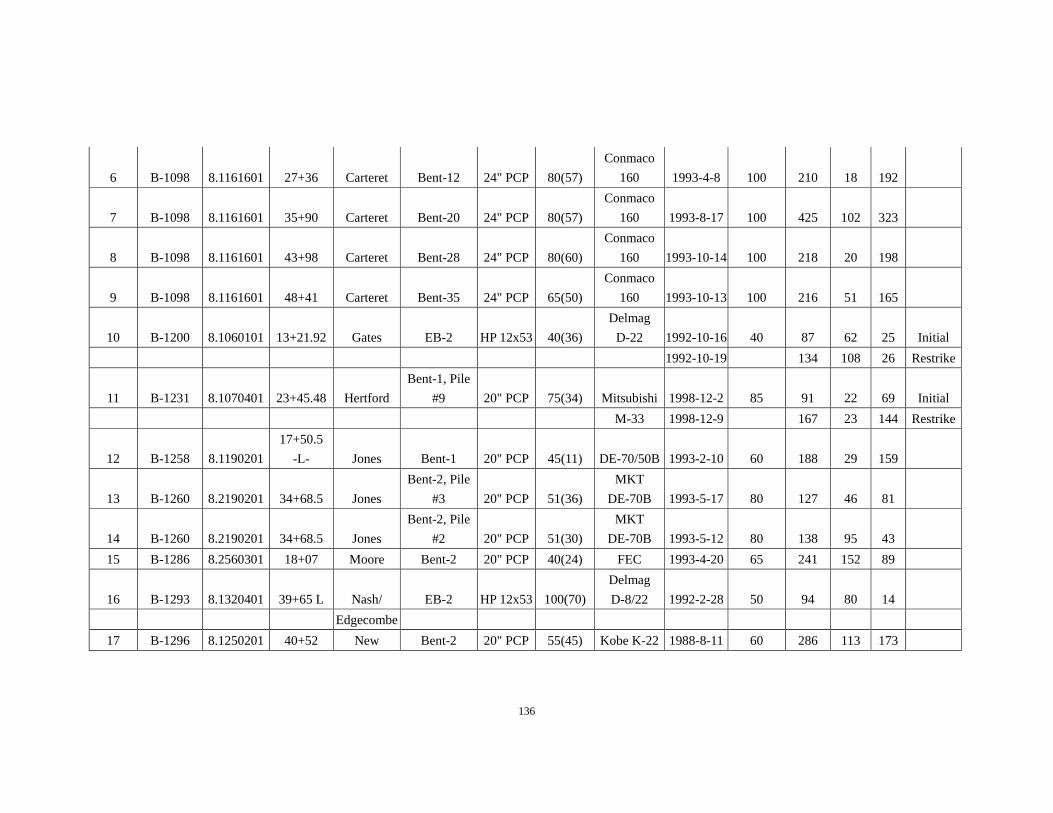
136
6 B-1098 8.1161601 27+36 Carteret Bent-12 24" PCP 80(57) Conmaco
160 1993-4-8 100 210 18 192
7 B-1098 8.1161601 35+90 Carteret Bent-20 24" PCP 80(57) Conmaco
160 1993-8-17 100 425 102 323
8 B-1098 8.1161601 43+98 Carteret Bent-28 24" PCP 80(60) Conmaco
160 1993-10-14 100 218 20 198
9 B-1098 8.1161601 48+41 Carteret Bent-35 24" PCP 65(50) Conmaco
160 1993-10-13 100 216 51 165
10 B-1200 8.1060101 13+21.92 Gates EB-2 HP 12x53 40(36) Delmag
D-22 1992-10-16 40 87 62 25 Initial 1992-10-19 134 108 26 Restrike
11 B-1231 8.1070401 23+45.48 Hertford Bent-1, Pile
#9 20" PCP 75(34) Mitsubishi 1998-12-2 85 91 22 69 Initial M-33 1998-12-9 167 23 144 Restrike
12 B-1258 8.1190201 17+50.5
-L- Jones Bent-1 20" PCP 45(11) DE-70/50B 1993-2-10 60 188 29 159
13 B-1260 8.2190201 34+68.5 Jones Bent-2, Pile
#3 20" PCP 51(36) MKT
DE-70B 1993-5-17 80 127 46 81
14 B-1260 8.2190201 34+68.5 Jones Bent-2, Pile
#2 20" PCP 51(30) MKT
DE-70B 1993-5-12 80 138 95 43 15 B-1286 8.2560301 18+07 Moore Bent-2 20" PCP 40(24) FEC 1993-4-20 65 241 152 89
16 B-1293 8.1320401 39+65 L Nash/ EB-2 HP 12x53 100(70) Delmag D-8/22 1992-2-28 50 94 80 14
Edgecombe 17 B-1296 8.1250201 40+52 New Bent-2 20" PCP 55(45) Kobe K-22 1988-8-11 60 286 113 173
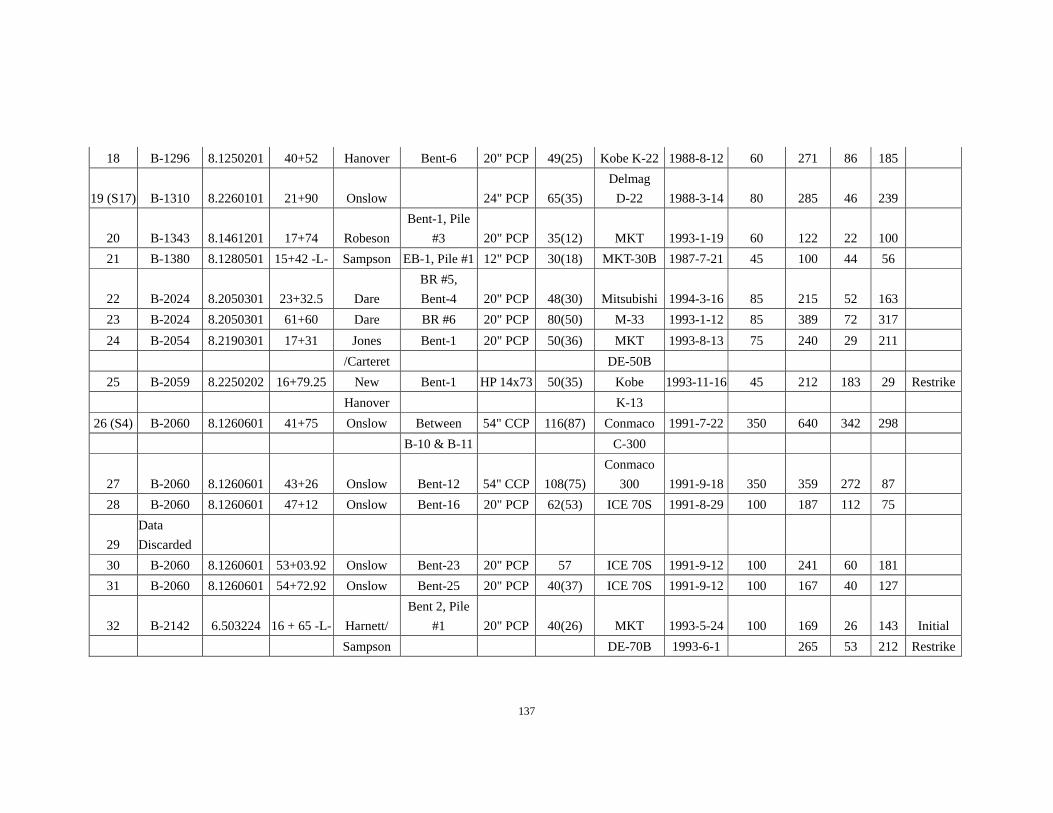
137
18 B-1296 8.1250201 40+52 Hanover Bent-6 20" PCP 49(25) Kobe K-22 1988-8-12 60 271 86 185
19 (S17) B-1310 8.2260101 21+90 Onslow 24" PCP 65(35) Delmag
D-22 1988-3-14 80 285 46 239
20 B-1343 8.1461201 17+74 Robeson Bent-1, Pile
#3 20" PCP 35(12) MKT 1993-1-19 60 122 22 100 21 B-1380 8.1280501 15+42 -L- Sampson EB-1, Pile #1 12" PCP 30(18) MKT-30B 1987-7-21 45 100 44 56
22 B-2024 8.2050301 23+32.5 Dare BR #5, Bent-4 20" PCP 48(30) Mitsubishi 1994-3-16 85 215 52 163
23 B-2024 8.2050301 61+60 Dare BR #6 20" PCP 80(50) M-33 1993-1-12 85 389 72 317 24 B-2054 8.2190301 17+31 Jones Bent-1 20" PCP 50(36) MKT 1993-8-13 75 240 29 211 /Carteret DE-50B
25 B-2059 8.2250202 16+79.25 New Bent-1 HP 14x73 50(35) Kobe 1993-11-16 45 212 183 29 Restrike Hanover K-13
26 (S4) B-2060 8.1260601 41+75 Onslow Between 54" CCP 116(87) Conmaco 1991-7-22 350 640 342 298 B-10 & B-11 C-300
27 B-2060 8.1260601 43+26 Onslow Bent-12 54" CCP 108(75) Conmaco
300 1991-9-18 350 359 272 87 28 B-2060 8.1260601 47+12 Onslow Bent-16 20" PCP 62(53) ICE 70S 1991-8-29 100 187 112 75
29 Data Discarded
30 B-2060 8.1260601 53+03.92 Onslow Bent-23 20" PCP 57 ICE 70S 1991-9-12 100 241 60 181 31 B-2060 8.1260601 54+72.92 Onslow Bent-25 20" PCP 40(37) ICE 70S 1991-9-12 100 167 40 127
32 B-2142 6.503224 16 + 65 -L- Harnett/ Bent 2, Pile
#1 20" PCP 40(26) MKT 1993-5-24 100 169 26 143 Initial Sampson DE-70B 1993-6-1 265 53 212 Restrike
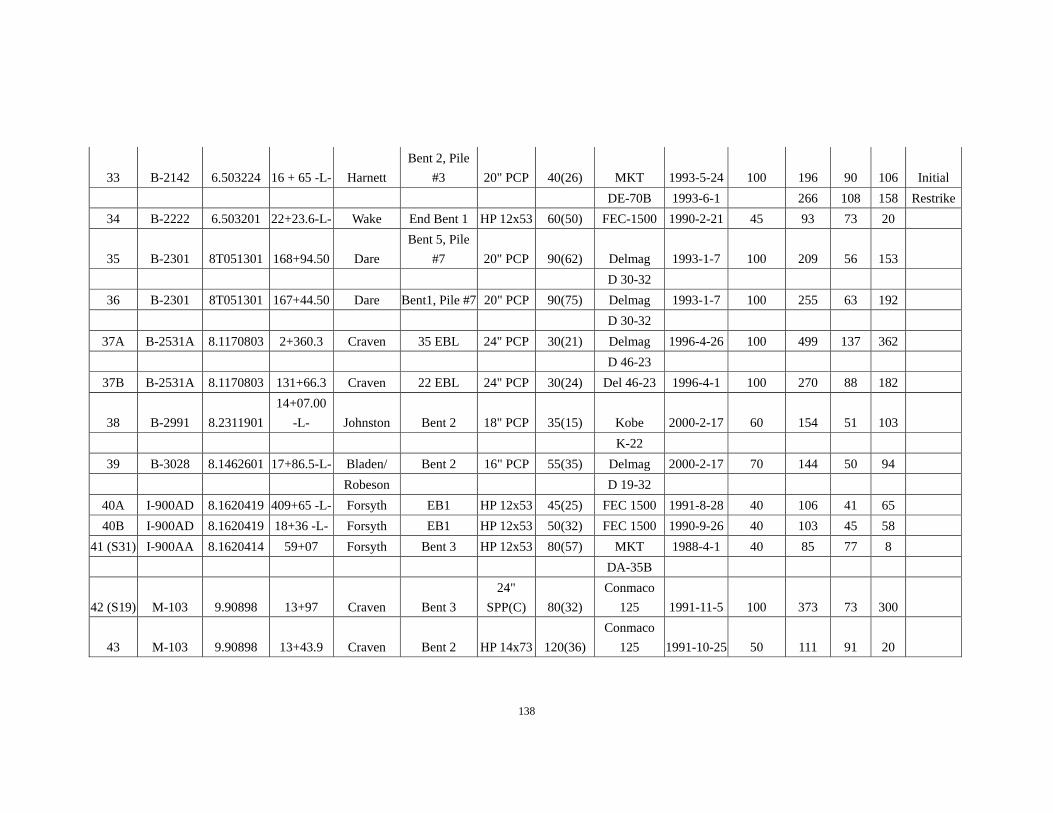
138
33 B-2142 6.503224 16 + 65 -L- Harnett Bent 2, Pile
#3 20" PCP 40(26) MKT 1993-5-24 100 196 90 106 Initial DE-70B 1993-6-1 266 108 158 Restrike
34 B-2222 6.503201 22+23.6-L- Wake End Bent 1 HP 12x53 60(50) FEC-1500 1990-2-21 45 93 73 20
35 B-2301 8T051301 168+94.50 Dare Bent 5, Pile
#7 20" PCP 90(62) Delmag 1993-1-7 100 209 56 153 D 30-32
36 B-2301 8T051301 167+44.50 Dare Bent1, Pile #7 20" PCP 90(75) Delmag 1993-1-7 100 255 63 192 D 30-32
37A B-2531A 8.1170803 2+360.3 Craven 35 EBL 24" PCP 30(21) Delmag 1996-4-26 100 499 137 362 D 46-23
37B B-2531A 8.1170803 131+66.3 Craven 22 EBL 24" PCP 30(24) Del 46-23 1996-4-1 100 270 88 182
38 B-2991 8.2311901 14+07.00
-L- Johnston Bent 2 18" PCP 35(15) Kobe 2000-2-17 60 154 51 103 K-22
39 B-3028 8.1462601 17+86.5-L- Bladen/ Bent 2 16" PCP 55(35) Delmag 2000-2-17 70 144 50 94 Robeson D 19-32
40A I-900AD 8.1620419 409+65 -L- Forsyth EB1 HP 12x53 45(25) FEC 1500 1991-8-28 40 106 41 65 40B I-900AD 8.1620419 18+36 -L- Forsyth EB1 HP 12x53 50(32) FEC 1500 1990-9-26 40 103 45 58
41 (S31) I-900AA 8.1620414 59+07 Forsyth Bent 3 HP 12x53 80(57) MKT 1988-4-1 40 85 77 8 DA-35B
42 (S19) M-103 9.90898 13+97 Craven Bent 3 24"
SPP(C) 80(32) Conmaco
125 1991-11-5 100 373 73 300
43 M-103 9.90898 13+43.9 Craven Bent 2 HP 14x73 120(36) Conmaco
125 1991-10-25 50 111 91 20
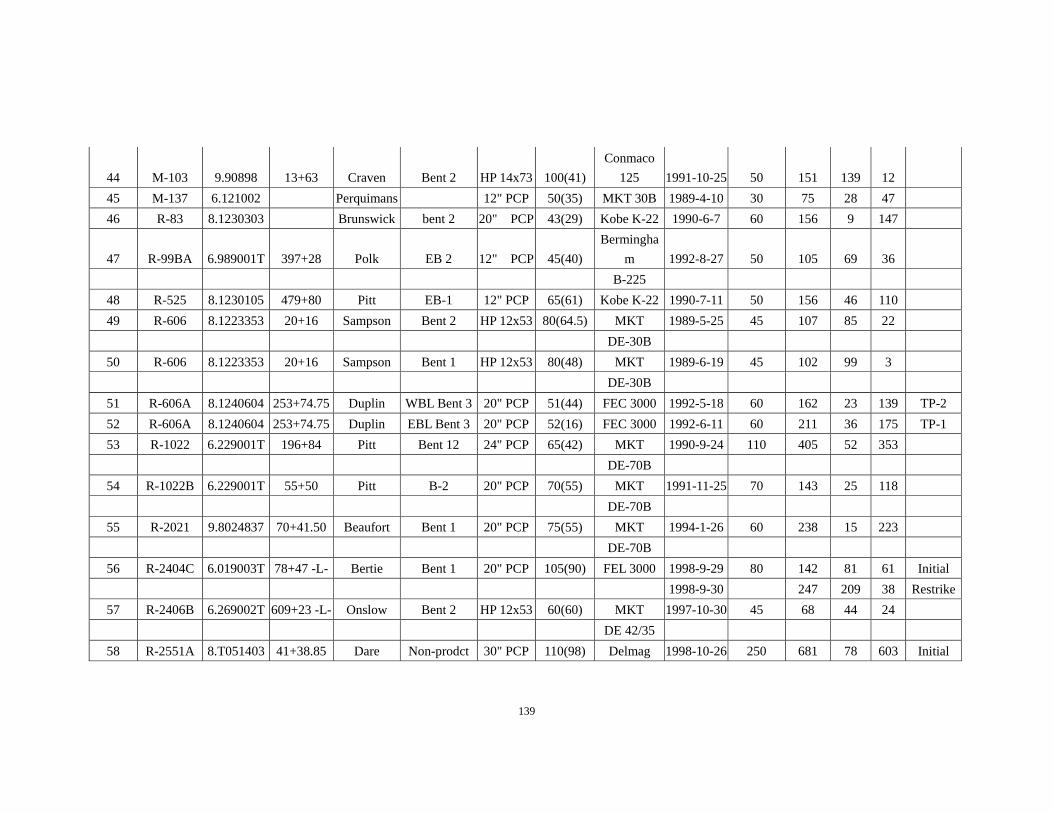
139
44 M-103 9.90898 13+63 Craven Bent 2 HP 14x73 100(41) Conmaco
125 1991-10-25 50 151 139 12 45 M-137 6.121002 Perquimans 12" PCP 50(35) MKT 30B 1989-4-10 30 75 28 47 46 R-83 8.1230303 Brunswick bent 2 20" PCP 43(29) Kobe K-22 1990-6-7 60 156 9 147
47 R-99BA 6.989001T 397+28 Polk EB 2 12" PCP 45(40) Bermingha
m 1992-8-27 50 105 69 36 B-225
48 R-525 8.1230105 479+80 Pitt EB-1 12" PCP 65(61) Kobe K-22 1990-7-11 50 156 46 110 49 R-606 8.1223353 20+16 Sampson Bent 2 HP 12x53 80(64.5) MKT 1989-5-25 45 107 85 22 DE-30B
50 R-606 8.1223353 20+16 Sampson Bent 1 HP 12x53 80(48) MKT 1989-6-19 45 102 99 3 DE-30B
51 R-606A 8.1240604 253+74.75 Duplin WBL Bent 3 20" PCP 51(44) FEC 3000 1992-5-18 60 162 23 139 TP-2 52 R-606A 8.1240604 253+74.75 Duplin EBL Bent 3 20" PCP 52(16) FEC 3000 1992-6-11 60 211 36 175 TP-1 53 R-1022 6.229001T 196+84 Pitt Bent 12 24" PCP 65(42) MKT 1990-9-24 110 405 52 353 DE-70B
54 R-1022B 6.229001T 55+50 Pitt B-2 20" PCP 70(55) MKT 1991-11-25 70 143 25 118 DE-70B
55 R-2021 9.8024837 70+41.50 Beaufort Bent 1 20" PCP 75(55) MKT 1994-1-26 60 238 15 223 DE-70B
56 R-2404C 6.019003T 78+47 -L- Bertie Bent 1 20" PCP 105(90) FEL 3000 1998-9-29 80 142 81 61 Initial 1998-9-30 247 209 38 Restrike
57 R-2406B 6.269002T 609+23 -L- Onslow Bent 2 HP 12x53 60(60) MKT 1997-10-30 45 68 44 24 DE 42/35
58 R-2551A 8.T051403 41+38.85 Dare Non-prodct 30" PCP 110(98) Delmag 1998-10-26 250 681 78 603 Initial
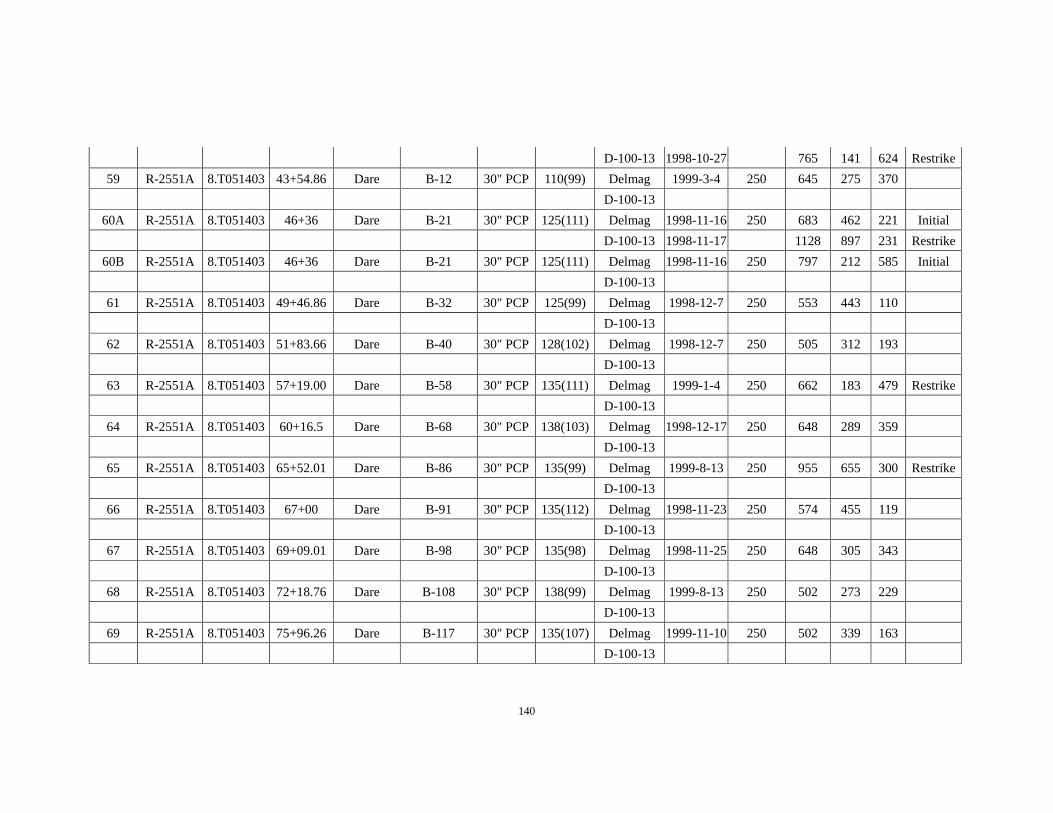
140
D-100-13 1998-10-27 765 141 624 Restrike59 R-2551A 8.T051403 43+54.86 Dare B-12 30" PCP 110(99) Delmag 1999-3-4 250 645 275 370 D-100-13
60A R-2551A 8.T051403 46+36 Dare B-21 30" PCP 125(111) Delmag 1998-11-16 250 683 462 221 Initial D-100-13 1998-11-17 1128 897 231 Restrike
60B R-2551A 8.T051403 46+36 Dare B-21 30" PCP 125(111) Delmag 1998-11-16 250 797 212 585 Initial D-100-13
61 R-2551A 8.T051403 49+46.86 Dare B-32 30" PCP 125(99) Delmag 1998-12-7 250 553 443 110 D-100-13
62 R-2551A 8.T051403 51+83.66 Dare B-40 30" PCP 128(102) Delmag 1998-12-7 250 505 312 193 D-100-13
63 R-2551A 8.T051403 57+19.00 Dare B-58 30" PCP 135(111) Delmag 1999-1-4 250 662 183 479 Restrike D-100-13
64 R-2551A 8.T051403 60+16.5 Dare B-68 30" PCP 138(103) Delmag 1998-12-17 250 648 289 359 D-100-13
65 R-2551A 8.T051403 65+52.01 Dare B-86 30" PCP 135(99) Delmag 1999-8-13 250 955 655 300 Restrike D-100-13
66 R-2551A 8.T051403 67+00 Dare B-91 30" PCP 135(112) Delmag 1998-11-23 250 574 455 119 D-100-13
67 R-2551A 8.T051403 69+09.01 Dare B-98 30" PCP 135(98) Delmag 1998-11-25 250 648 305 343 D-100-13
68 R-2551A 8.T051403 72+18.76 Dare B-108 30" PCP 138(99) Delmag 1999-8-13 250 502 273 229 D-100-13
69 R-2551A 8.T051403 75+96.26 Dare B-117 30" PCP 135(107) Delmag 1999-11-10 250 502 339 163 D-100-13
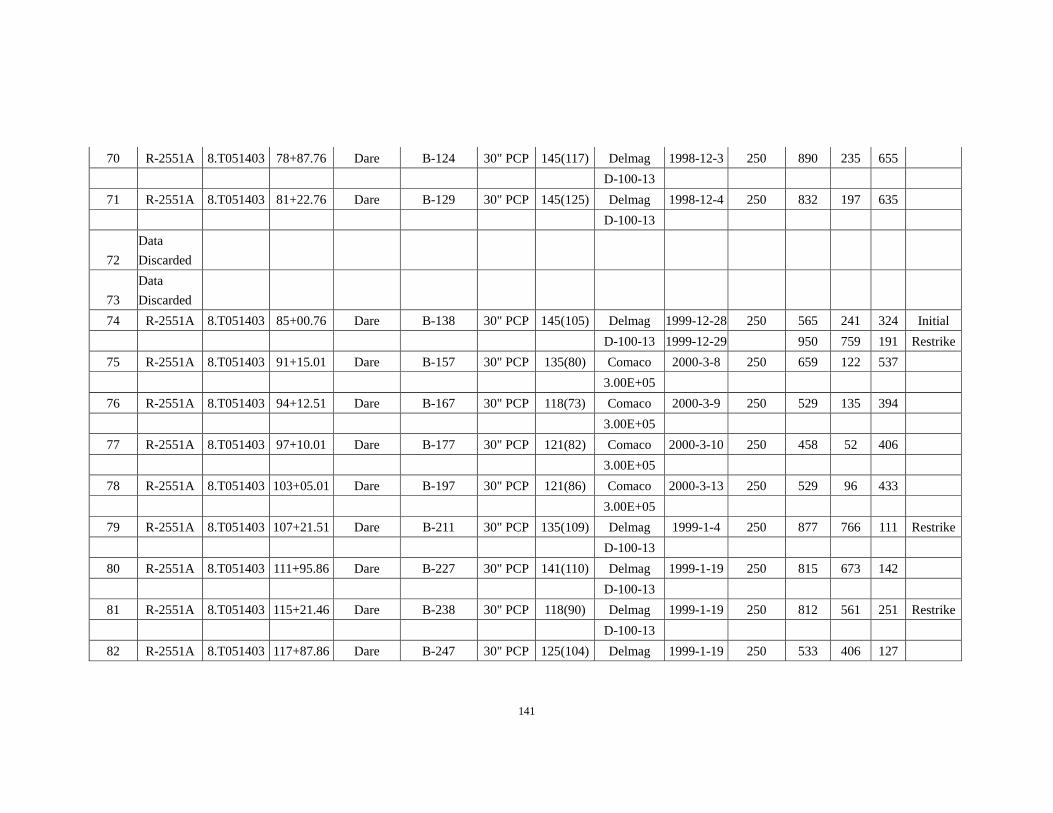
141
70 R-2551A 8.T051403 78+87.76 Dare B-124 30" PCP 145(117) Delmag 1998-12-3 250 890 235 655 D-100-13
71 R-2551A 8.T051403 81+22.76 Dare B-129 30" PCP 145(125) Delmag 1998-12-4 250 832 197 635 D-100-13
72 Data Discarded
73 Data Discarded
74 R-2551A 8.T051403 85+00.76 Dare B-138 30" PCP 145(105) Delmag 1999-12-28 250 565 241 324 Initial D-100-13 1999-12-29 950 759 191 Restrike
75 R-2551A 8.T051403 91+15.01 Dare B-157 30" PCP 135(80) Comaco 2000-3-8 250 659 122 537 3.00E+05
76 R-2551A 8.T051403 94+12.51 Dare B-167 30" PCP 118(73) Comaco 2000-3-9 250 529 135 394 3.00E+05
77 R-2551A 8.T051403 97+10.01 Dare B-177 30" PCP 121(82) Comaco 2000-3-10 250 458 52 406 3.00E+05
78 R-2551A 8.T051403 103+05.01 Dare B-197 30" PCP 121(86) Comaco 2000-3-13 250 529 96 433 3.00E+05
79 R-2551A 8.T051403 107+21.51 Dare B-211 30" PCP 135(109) Delmag 1999-1-4 250 877 766 111 Restrike D-100-13
80 R-2551A 8.T051403 111+95.86 Dare B-227 30" PCP 141(110) Delmag 1999-1-19 250 815 673 142 D-100-13
81 R-2551A 8.T051403 115+21.46 Dare B-238 30" PCP 118(90) Delmag 1999-1-19 250 812 561 251 Restrike D-100-13
82 R-2551A 8.T051403 117+87.86 Dare B-247 30" PCP 125(104) Delmag 1999-1-19 250 533 406 127
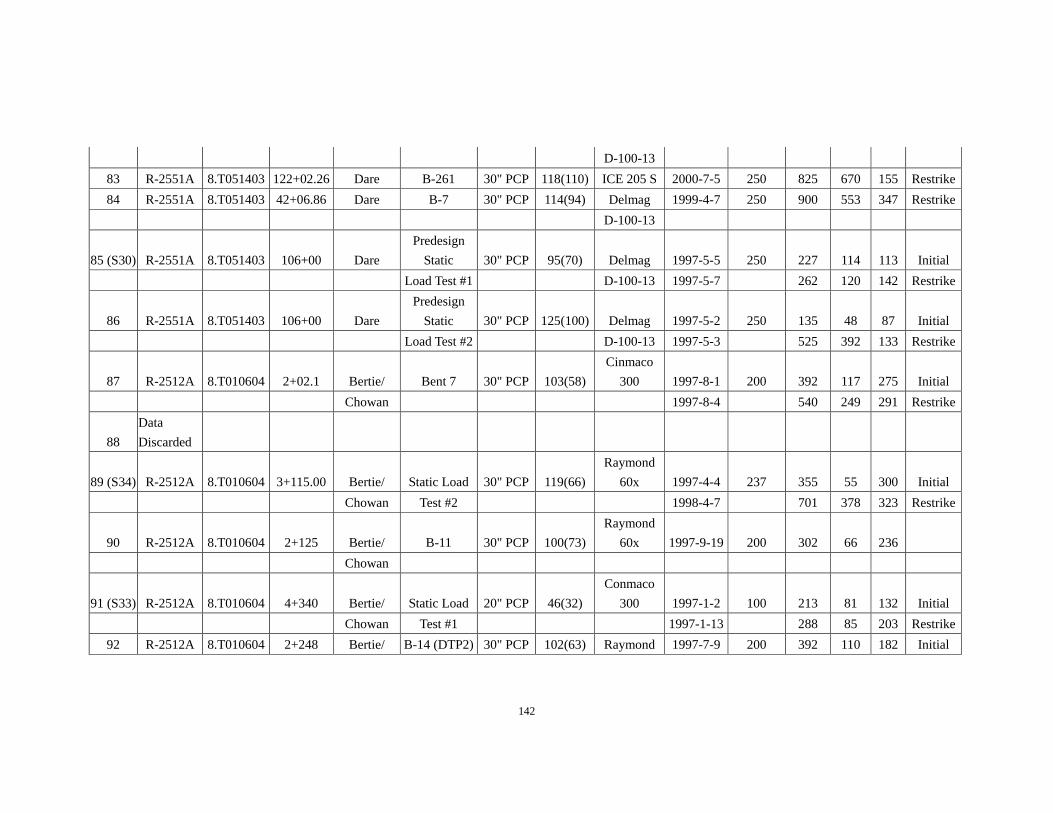
142
D-100-13 83 R-2551A 8.T051403 122+02.26 Dare B-261 30" PCP 118(110) ICE 205 S 2000-7-5 250 825 670 155 Restrike84 R-2551A 8.T051403 42+06.86 Dare B-7 30" PCP 114(94) Delmag 1999-4-7 250 900 553 347 Restrike D-100-13
85 (S30) R-2551A 8.T051403 106+00 Dare Predesign
Static 30" PCP 95(70) Delmag 1997-5-5 250 227 114 113 Initial Load Test #1 D-100-13 1997-5-7 262 120 142 Restrike
86 R-2551A 8.T051403 106+00 Dare Predesign
Static 30" PCP 125(100) Delmag 1997-5-2 250 135 48 87 Initial Load Test #2 D-100-13 1997-5-3 525 392 133 Restrike
87 R-2512A 8.T010604 2+02.1 Bertie/ Bent 7 30" PCP 103(58) Cinmaco
300 1997-8-1 200 392 117 275 Initial Chowan 1997-8-4 540 249 291 Restrike
88 Data Discarded
89 (S34) R-2512A 8.T010604 3+115.00 Bertie/ Static Load 30" PCP 119(66) Raymond
60x 1997-4-4 237 355 55 300 Initial Chowan Test #2 1998-4-7 701 378 323 Restrike
90 R-2512A 8.T010604 2+125 Bertie/ B-11 30" PCP 100(73) Raymond
60x 1997-9-19 200 302 66 236 Chowan
91 (S33) R-2512A 8.T010604 4+340 Bertie/ Static Load 20" PCP 46(32) Conmaco
300 1997-1-2 100 213 81 132 Initial Chowan Test #1 1997-1-13 288 85 203 Restrike
92 R-2512A 8.T010604 2+248 Bertie/ B-14 (DTP2) 30" PCP 102(63) Raymond 1997-7-9 200 392 110 182 Initial
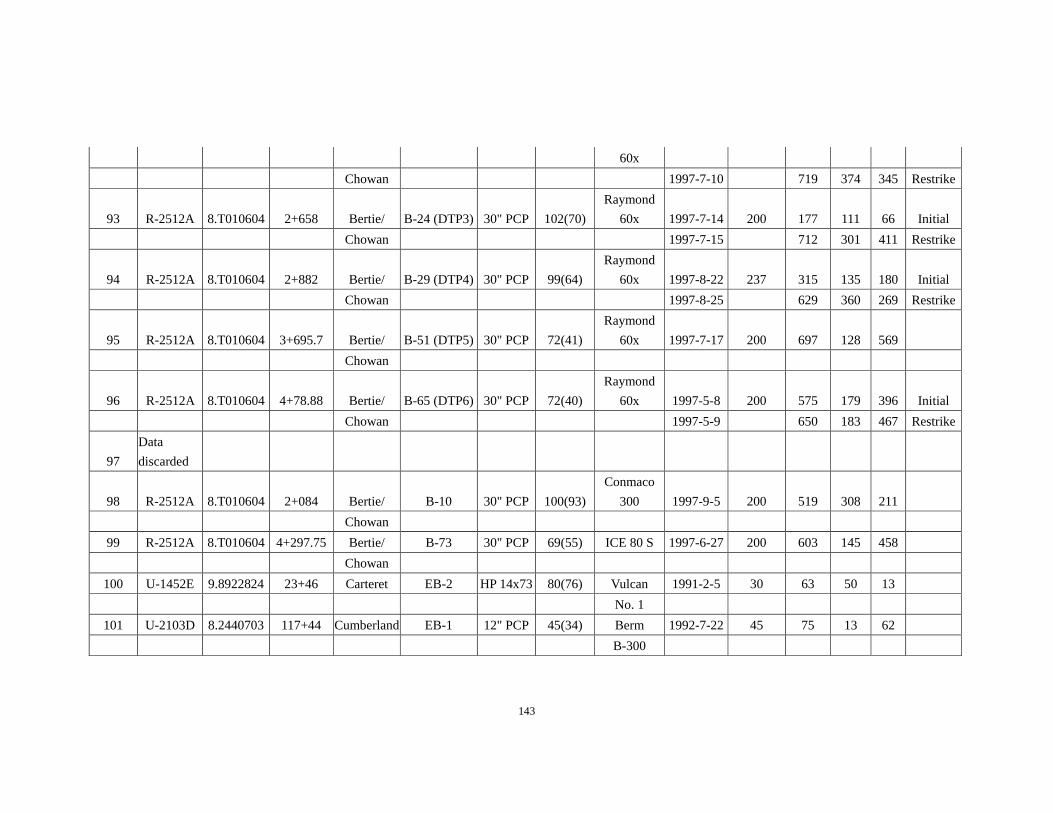
143
60x Chowan 1997-7-10 719 374 345 Restrike
93 R-2512A 8.T010604 2+658 Bertie/ B-24 (DTP3) 30" PCP 102(70) Raymond
60x 1997-7-14 200 177 111 66 Initial Chowan 1997-7-15 712 301 411 Restrike
94 R-2512A 8.T010604 2+882 Bertie/ B-29 (DTP4) 30" PCP 99(64) Raymond
60x 1997-8-22 237 315 135 180 Initial Chowan 1997-8-25 629 360 269 Restrike
95 R-2512A 8.T010604 3+695.7 Bertie/ B-51 (DTP5) 30" PCP 72(41) Raymond
60x 1997-7-17 200 697 128 569 Chowan
96 R-2512A 8.T010604 4+78.88 Bertie/ B-65 (DTP6) 30" PCP 72(40) Raymond
60x 1997-5-8 200 575 179 396 Initial Chowan 1997-5-9 650 183 467 Restrike
97 Data discarded
98 R-2512A 8.T010604 2+084 Bertie/ B-10 30" PCP 100(93) Conmaco
300 1997-9-5 200 519 308 211 Chowan
99 R-2512A 8.T010604 4+297.75 Bertie/ B-73 30" PCP 69(55) ICE 80 S 1997-6-27 200 603 145 458 Chowan
100 U-1452E 9.8922824 23+46 Carteret EB-2 HP 14x73 80(76) Vulcan 1991-2-5 30 63 50 13 No. 1
101 U-2103D 8.2440703 117+44 Cumberland EB-1 12" PCP 45(34) Berm 1992-7-22 45 75 13 62 B-300
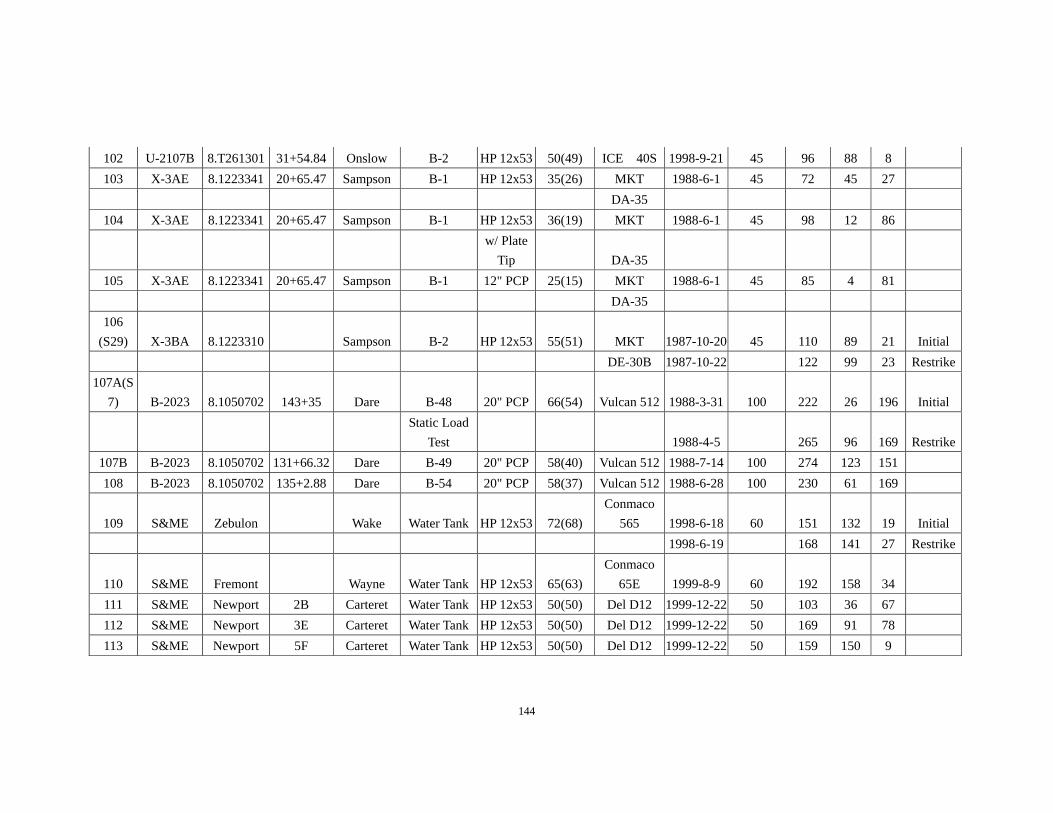
144
102 U-2107B 8.T261301 31+54.84 Onslow B-2 HP 12x53 50(49) ICE 40S 1998-9-21 45 96 88 8 103 X-3AE 8.1223341 20+65.47 Sampson B-1 HP 12x53 35(26) MKT 1988-6-1 45 72 45 27 DA-35
104 X-3AE 8.1223341 20+65.47 Sampson B-1 HP 12x53 36(19) MKT 1988-6-1 45 98 12 86
w/ Plate
Tip DA-35 105 X-3AE 8.1223341 20+65.47 Sampson B-1 12" PCP 25(15) MKT 1988-6-1 45 85 4 81 DA-35
106 (S29) X-3BA 8.1223310 Sampson B-2 HP 12x53 55(51) MKT 1987-10-20 45 110 89 21 Initial
DE-30B 1987-10-22 122 99 23 Restrike107A(S
7) B-2023 8.1050702 143+35 Dare B-48 20" PCP 66(54) Vulcan 512 1988-3-31 100 222 26 196 Initial
Static Load
Test 1988-4-5 265 96 169 Restrike107B B-2023 8.1050702 131+66.32 Dare B-49 20" PCP 58(40) Vulcan 512 1988-7-14 100 274 123 151 108 B-2023 8.1050702 135+2.88 Dare B-54 20" PCP 58(37) Vulcan 512 1988-6-28 100 230 61 169
109 S&ME Zebulon Wake Water Tank HP 12x53 72(68) Conmaco
565 1998-6-18 60 151 132 19 Initial 1998-6-19 168 141 27 Restrike
110 S&ME Fremont Wayne Water Tank HP 12x53 65(63) Conmaco
65E 1999-8-9 60 192 158 34 111 S&ME Newport 2B Carteret Water Tank HP 12x53 50(50) Del D12 1999-12-22 50 103 36 67 112 S&ME Newport 3E Carteret Water Tank HP 12x53 50(50) Del D12 1999-12-22 50 169 91 78 113 S&ME Newport 5F Carteret Water Tank HP 12x53 50(50) Del D12 1999-12-22 50 159 150 9
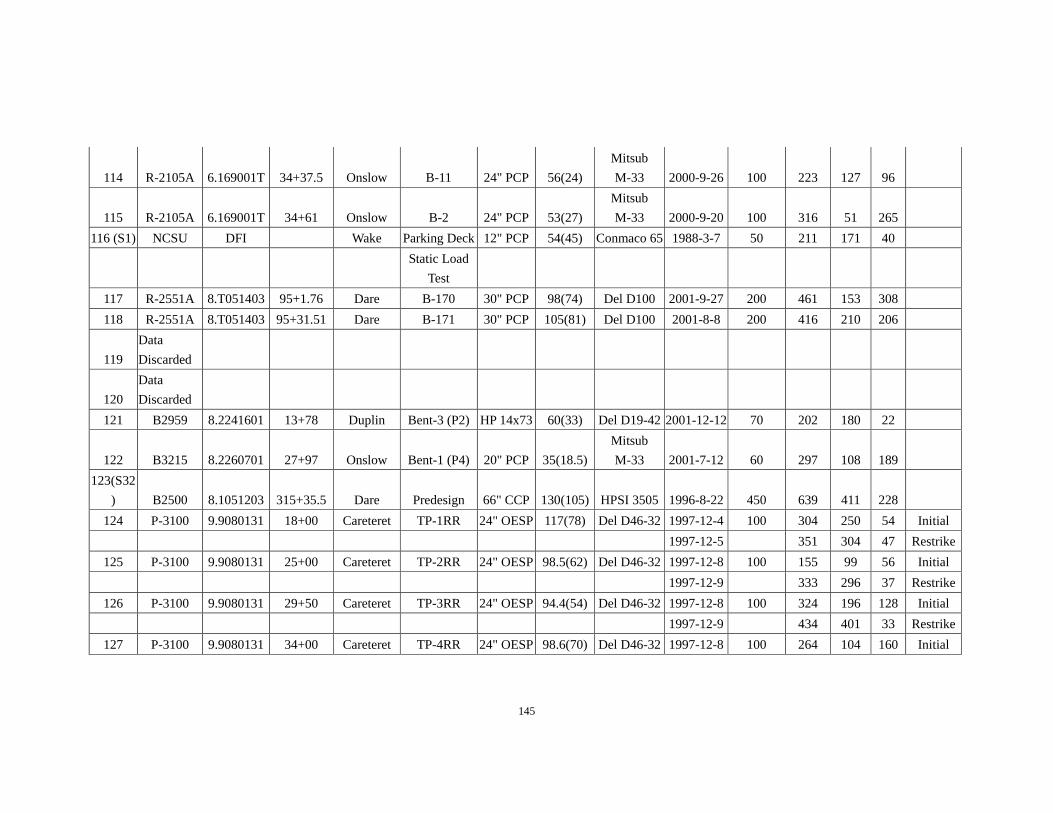
145
114 R-2105A 6.169001T 34+37.5 Onslow B-11 24" PCP 56(24) Mitsub M-33 2000-9-26 100 223 127 96
115 R-2105A 6.169001T 34+61 Onslow B-2 24" PCP 53(27) Mitsub M-33 2000-9-20 100 316 51 265
116 (S1) NCSU DFI Wake Parking Deck 12" PCP 54(45) Conmaco 65 1988-3-7 50 211 171 40
Static Load
Test 117 R-2551A 8.T051403 95+1.76 Dare B-170 30" PCP 98(74) Del D100 2001-9-27 200 461 153 308 118 R-2551A 8.T051403 95+31.51 Dare B-171 30" PCP 105(81) Del D100 2001-8-8 200 416 210 206
119 Data Discarded
120 Data Discarded
121 B2959 8.2241601 13+78 Duplin Bent-3 (P2) HP 14x73 60(33) Del D19-42 2001-12-12 70 202 180 22
122 B3215 8.2260701 27+97 Onslow Bent-1 (P4) 20" PCP 35(18.5)Mitsub M-33 2001-7-12 60 297 108 189
123(S32) B2500 8.1051203 315+35.5 Dare Predesign 66" CCP 130(105) HPSI 3505 1996-8-22 450 639 411 228
124 P-3100 9.9080131 18+00 Careteret TP-1RR 24" OESP 117(78) Del D46-32 1997-12-4 100 304 250 54 Initial 1997-12-5 351 304 47 Restrike
125 P-3100 9.9080131 25+00 Careteret TP-2RR 24" OESP 98.5(62) Del D46-32 1997-12-8 100 155 99 56 Initial 1997-12-9 333 296 37 Restrike
126 P-3100 9.9080131 29+50 Careteret TP-3RR 24" OESP 94.4(54) Del D46-32 1997-12-8 100 324 196 128 Initial 1997-12-9 434 401 33 Restrike
127 P-3100 9.9080131 34+00 Careteret TP-4RR 24" OESP 98.6(70) Del D46-32 1997-12-8 100 264 104 160 Initial
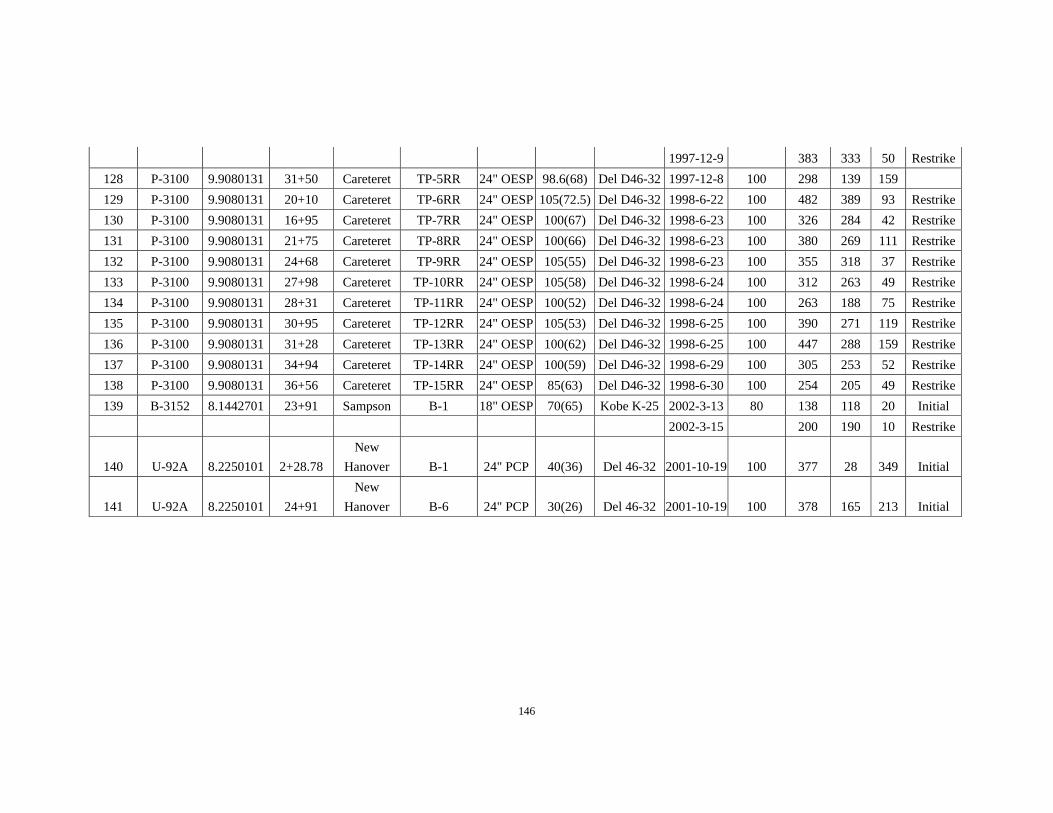
146
1997-12-9 383 333 50 Restrike128 P-3100 9.9080131 31+50 Careteret TP-5RR 24" OESP 98.6(68) Del D46-32 1997-12-8 100 298 139 159 129 P-3100 9.9080131 20+10 Careteret TP-6RR 24" OESP 105(72.5) Del D46-32 1998-6-22 100 482 389 93 Restrike130 P-3100 9.9080131 16+95 Careteret TP-7RR 24" OESP 100(67) Del D46-32 1998-6-23 100 326 284 42 Restrike131 P-3100 9.9080131 21+75 Careteret TP-8RR 24" OESP 100(66) Del D46-32 1998-6-23 100 380 269 111 Restrike132 P-3100 9.9080131 24+68 Careteret TP-9RR 24" OESP 105(55) Del D46-32 1998-6-23 100 355 318 37 Restrike133 P-3100 9.9080131 27+98 Careteret TP-10RR 24" OESP 105(58) Del D46-32 1998-6-24 100 312 263 49 Restrike134 P-3100 9.9080131 28+31 Careteret TP-11RR 24" OESP 100(52) Del D46-32 1998-6-24 100 263 188 75 Restrike135 P-3100 9.9080131 30+95 Careteret TP-12RR 24" OESP 105(53) Del D46-32 1998-6-25 100 390 271 119 Restrike136 P-3100 9.9080131 31+28 Careteret TP-13RR 24" OESP 100(62) Del D46-32 1998-6-25 100 447 288 159 Restrike137 P-3100 9.9080131 34+94 Careteret TP-14RR 24" OESP 100(59) Del D46-32 1998-6-29 100 305 253 52 Restrike138 P-3100 9.9080131 36+56 Careteret TP-15RR 24" OESP 85(63) Del D46-32 1998-6-30 100 254 205 49 Restrike139 B-3152 8.1442701 23+91 Sampson B-1 18" OESP 70(65) Kobe K-25 2002-3-13 80 138 118 20 Initial
2002-3-15 200 190 10 Restrike
140 U-92A 8.2250101 2+28.78 New
Hanover B-1 24" PCP 40(36) Del 46-32 2001-10-19 100 377 28 349 Initial
141 U-92A 8.2250101 24+91 New
Hanover B-6 24" PCP 30(26) Del 46-32 2001-10-19 100 378 165 213 Initial
147
APPENDIX C
Resistance Bias Factor Statistics
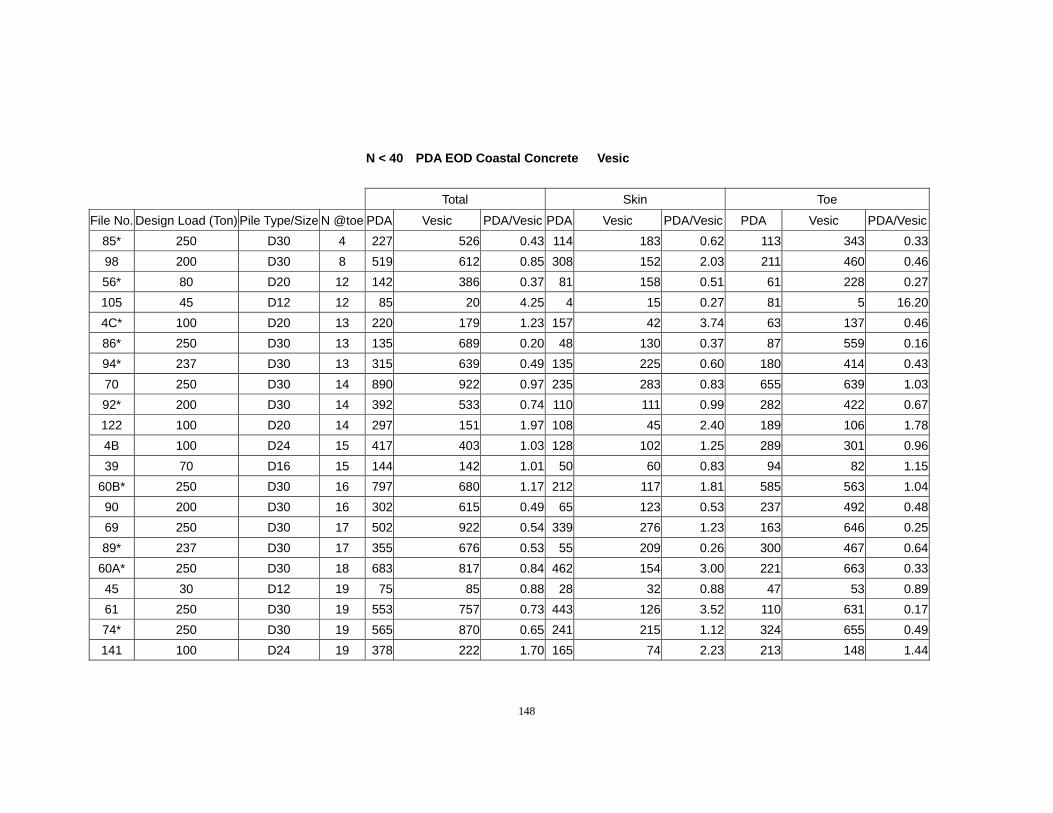
148
N < 40 PDA EOD Coastal Concrete Vesic
Total Skin Toe
File No. Design Load (Ton) Pile Type/Size N @toe PDA Vesic PDA/Vesic PDA Vesic PDA/Vesic PDA Vesic PDA/Vesic85* 250 D30 4 227 526 0.43 114 183 0.62 113 343 0.3398 200 D30 8 519 612 0.85 308 152 2.03 211 460 0.4656* 80 D20 12 142 386 0.37 81 158 0.51 61 228 0.27105 45 D12 12 85 20 4.25 4 15 0.27 81 5 16.204C* 100 D20 13 220 179 1.23 157 42 3.74 63 137 0.4686* 250 D30 13 135 689 0.20 48 130 0.37 87 559 0.1694* 237 D30 13 315 639 0.49 135 225 0.60 180 414 0.4370 250 D30 14 890 922 0.97 235 283 0.83 655 639 1.0392* 200 D30 14 392 533 0.74 110 111 0.99 282 422 0.67122 100 D20 14 297 151 1.97 108 45 2.40 189 106 1.784B 100 D24 15 417 403 1.03 128 102 1.25 289 301 0.9639 70 D16 15 144 142 1.01 50 60 0.83 94 82 1.15
60B* 250 D30 16 797 680 1.17 212 117 1.81 585 563 1.0490 200 D30 16 302 615 0.49 65 123 0.53 237 492 0.4869 250 D30 17 502 922 0.54 339 276 1.23 163 646 0.2589* 237 D30 17 355 676 0.53 55 209 0.26 300 467 0.64
60A* 250 D30 18 683 817 0.84 462 154 3.00 221 663 0.3345 30 D12 19 75 85 0.88 28 32 0.88 47 53 0.8961 250 D30 19 553 757 0.73 443 126 3.52 110 631 0.1774* 250 D30 19 565 870 0.65 241 215 1.12 324 655 0.49141 100 D24 19 378 222 1.70 165 74 2.23 213 148 1.44
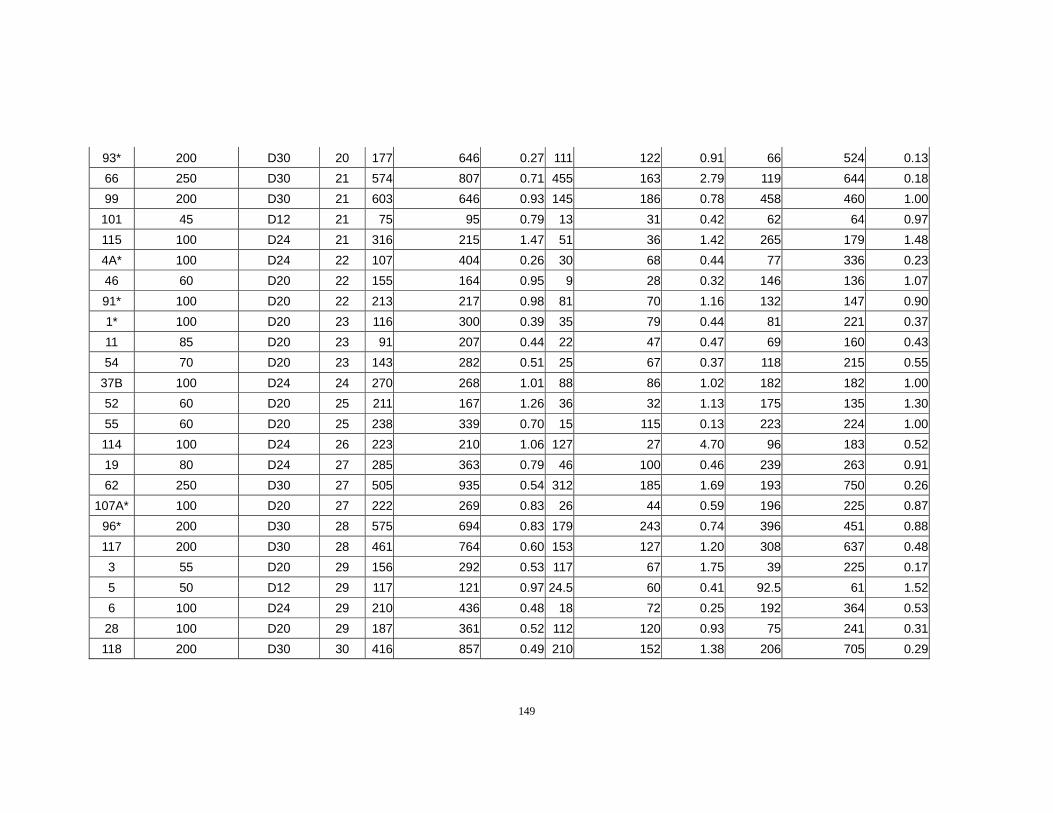
149
93* 200 D30 20 177 646 0.27 111 122 0.91 66 524 0.1366 250 D30 21 574 807 0.71 455 163 2.79 119 644 0.1899 200 D30 21 603 646 0.93 145 186 0.78 458 460 1.00101 45 D12 21 75 95 0.79 13 31 0.42 62 64 0.97115 100 D24 21 316 215 1.47 51 36 1.42 265 179 1.484A* 100 D24 22 107 404 0.26 30 68 0.44 77 336 0.2346 60 D20 22 155 164 0.95 9 28 0.32 146 136 1.0791* 100 D20 22 213 217 0.98 81 70 1.16 132 147 0.901* 100 D20 23 116 300 0.39 35 79 0.44 81 221 0.3711 85 D20 23 91 207 0.44 22 47 0.47 69 160 0.4354 70 D20 23 143 282 0.51 25 67 0.37 118 215 0.55
37B 100 D24 24 270 268 1.01 88 86 1.02 182 182 1.0052 60 D20 25 211 167 1.26 36 32 1.13 175 135 1.3055 60 D20 25 238 339 0.70 15 115 0.13 223 224 1.00114 100 D24 26 223 210 1.06 127 27 4.70 96 183 0.5219 80 D24 27 285 363 0.79 46 100 0.46 239 263 0.9162 250 D30 27 505 935 0.54 312 185 1.69 193 750 0.26
107A* 100 D20 27 222 269 0.83 26 44 0.59 196 225 0.8796* 200 D30 28 575 694 0.83 179 243 0.74 396 451 0.88117 200 D30 28 461 764 0.60 153 127 1.20 308 637 0.483 55 D20 29 156 292 0.53 117 67 1.75 39 225 0.175 50 D12 29 117 121 0.97 24.5 60 0.41 92.5 61 1.526 100 D24 29 210 436 0.48 18 72 0.25 192 364 0.53
28 100 D20 29 187 361 0.52 112 120 0.93 75 241 0.31118 200 D30 30 416 857 0.49 210 152 1.38 206 705 0.29
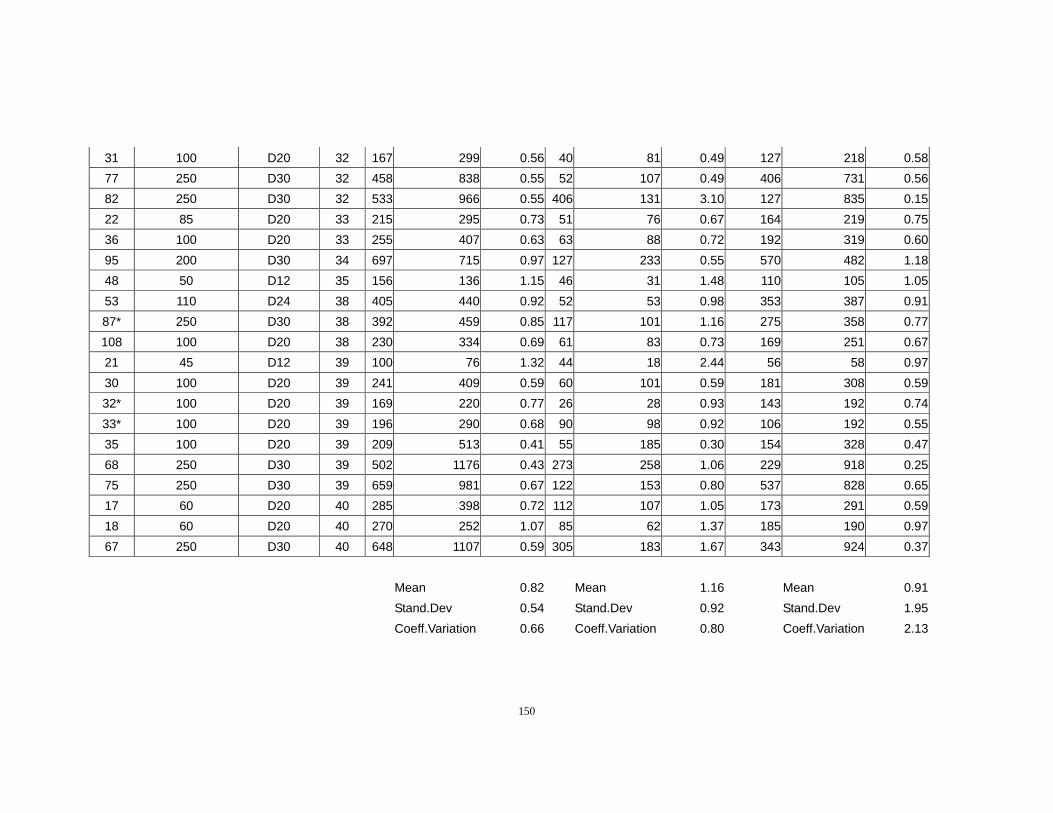
150
31 100 D20 32 167 299 0.56 40 81 0.49 127 218 0.5877 250 D30 32 458 838 0.55 52 107 0.49 406 731 0.5682 250 D30 32 533 966 0.55 406 131 3.10 127 835 0.1522 85 D20 33 215 295 0.73 51 76 0.67 164 219 0.7536 100 D20 33 255 407 0.63 63 88 0.72 192 319 0.6095 200 D30 34 697 715 0.97 127 233 0.55 570 482 1.1848 50 D12 35 156 136 1.15 46 31 1.48 110 105 1.0553 110 D24 38 405 440 0.92 52 53 0.98 353 387 0.9187* 250 D30 38 392 459 0.85 117 101 1.16 275 358 0.77108 100 D20 38 230 334 0.69 61 83 0.73 169 251 0.6721 45 D12 39 100 76 1.32 44 18 2.44 56 58 0.9730 100 D20 39 241 409 0.59 60 101 0.59 181 308 0.5932* 100 D20 39 169 220 0.77 26 28 0.93 143 192 0.7433* 100 D20 39 196 290 0.68 90 98 0.92 106 192 0.5535 100 D20 39 209 513 0.41 55 185 0.30 154 328 0.4768 250 D30 39 502 1176 0.43 273 258 1.06 229 918 0.2575 250 D30 39 659 981 0.67 122 153 0.80 537 828 0.6517 60 D20 40 285 398 0.72 112 107 1.05 173 291 0.5918 60 D20 40 270 252 1.07 85 62 1.37 185 190 0.9767 250 D30 40 648 1107 0.59 305 183 1.67 343 924 0.37
Mean 0.82 Mean 1.16 Mean 0.91 Stand.Dev 0.54 Stand.Dev 0.92 Stand.Dev 1.95 Coeff.Variation 0.66 Coeff.Variation 0.80 Coeff.Variation 2.13
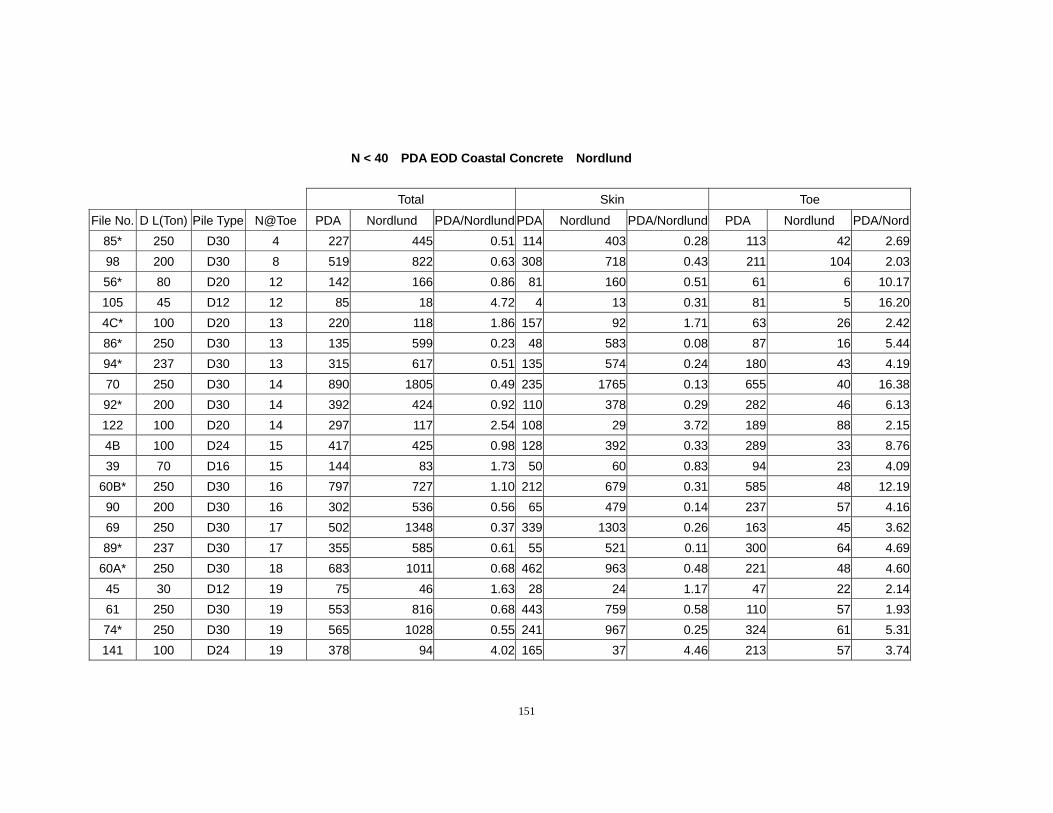
151
N < 40 PDA EOD Coastal Concrete Nordlund
Total Skin Toe
File No. D L(Ton) Pile Type N@Toe PDA Nordlund PDA/Nordlund PDA Nordlund PDA/Nordlund PDA Nordlund PDA/Nord85* 250 D30 4 227 445 0.51 114 403 0.28 113 42 2.6998 200 D30 8 519 822 0.63 308 718 0.43 211 104 2.0356* 80 D20 12 142 166 0.86 81 160 0.51 61 6 10.17105 45 D12 12 85 18 4.72 4 13 0.31 81 5 16.204C* 100 D20 13 220 118 1.86 157 92 1.71 63 26 2.4286* 250 D30 13 135 599 0.23 48 583 0.08 87 16 5.4494* 237 D30 13 315 617 0.51 135 574 0.24 180 43 4.1970 250 D30 14 890 1805 0.49 235 1765 0.13 655 40 16.3892* 200 D30 14 392 424 0.92 110 378 0.29 282 46 6.13122 100 D20 14 297 117 2.54 108 29 3.72 189 88 2.154B 100 D24 15 417 425 0.98 128 392 0.33 289 33 8.7639 70 D16 15 144 83 1.73 50 60 0.83 94 23 4.09
60B* 250 D30 16 797 727 1.10 212 679 0.31 585 48 12.1990 200 D30 16 302 536 0.56 65 479 0.14 237 57 4.1669 250 D30 17 502 1348 0.37 339 1303 0.26 163 45 3.6289* 237 D30 17 355 585 0.61 55 521 0.11 300 64 4.69
60A* 250 D30 18 683 1011 0.68 462 963 0.48 221 48 4.6045 30 D12 19 75 46 1.63 28 24 1.17 47 22 2.1461 250 D30 19 553 816 0.68 443 759 0.58 110 57 1.9374* 250 D30 19 565 1028 0.55 241 967 0.25 324 61 5.31141 100 D24 19 378 94 4.02 165 37 4.46 213 57 3.74
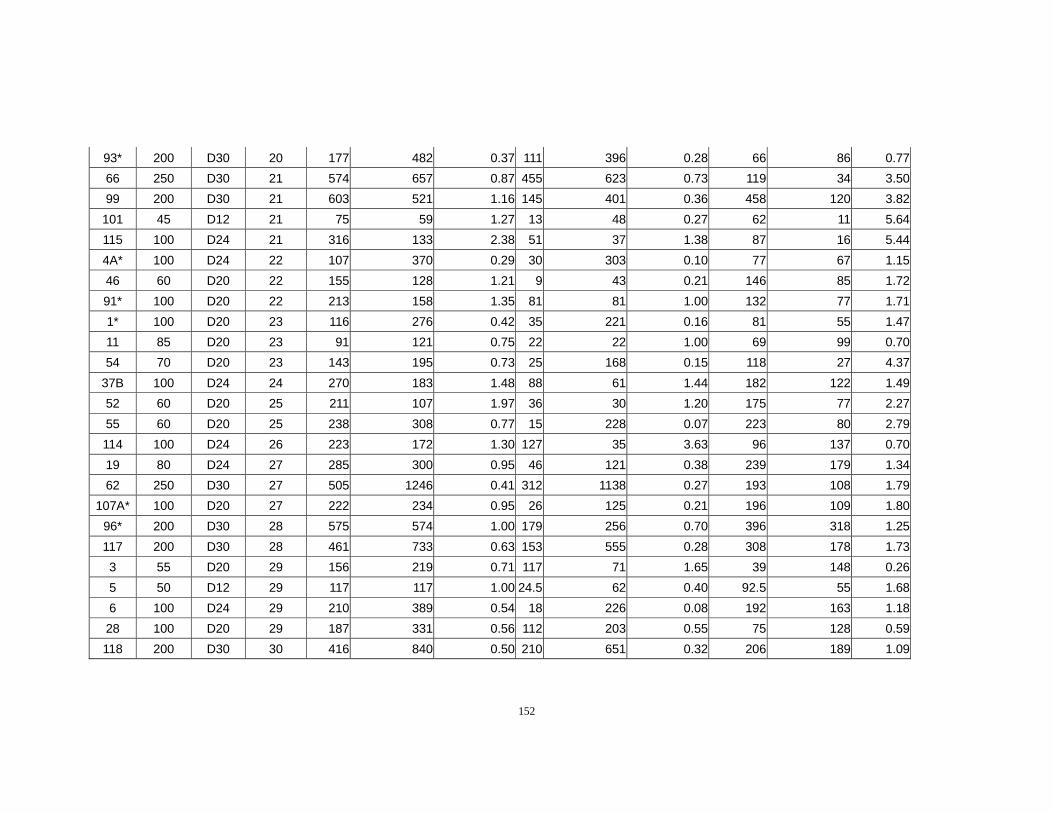
152
93* 200 D30 20 177 482 0.37 111 396 0.28 66 86 0.7766 250 D30 21 574 657 0.87 455 623 0.73 119 34 3.5099 200 D30 21 603 521 1.16 145 401 0.36 458 120 3.82
101 45 D12 21 75 59 1.27 13 48 0.27 62 11 5.64115 100 D24 21 316 133 2.38 51 37 1.38 87 16 5.444A* 100 D24 22 107 370 0.29 30 303 0.10 77 67 1.1546 60 D20 22 155 128 1.21 9 43 0.21 146 85 1.7291* 100 D20 22 213 158 1.35 81 81 1.00 132 77 1.711* 100 D20 23 116 276 0.42 35 221 0.16 81 55 1.4711 85 D20 23 91 121 0.75 22 22 1.00 69 99 0.7054 70 D20 23 143 195 0.73 25 168 0.15 118 27 4.37
37B 100 D24 24 270 183 1.48 88 61 1.44 182 122 1.4952 60 D20 25 211 107 1.97 36 30 1.20 175 77 2.2755 60 D20 25 238 308 0.77 15 228 0.07 223 80 2.79114 100 D24 26 223 172 1.30 127 35 3.63 96 137 0.7019 80 D24 27 285 300 0.95 46 121 0.38 239 179 1.3462 250 D30 27 505 1246 0.41 312 1138 0.27 193 108 1.79
107A* 100 D20 27 222 234 0.95 26 125 0.21 196 109 1.8096* 200 D30 28 575 574 1.00 179 256 0.70 396 318 1.25117 200 D30 28 461 733 0.63 153 555 0.28 308 178 1.733 55 D20 29 156 219 0.71 117 71 1.65 39 148 0.265 50 D12 29 117 117 1.00 24.5 62 0.40 92.5 55 1.686 100 D24 29 210 389 0.54 18 226 0.08 192 163 1.1828 100 D20 29 187 331 0.56 112 203 0.55 75 128 0.59118 200 D30 30 416 840 0.50 210 651 0.32 206 189 1.09
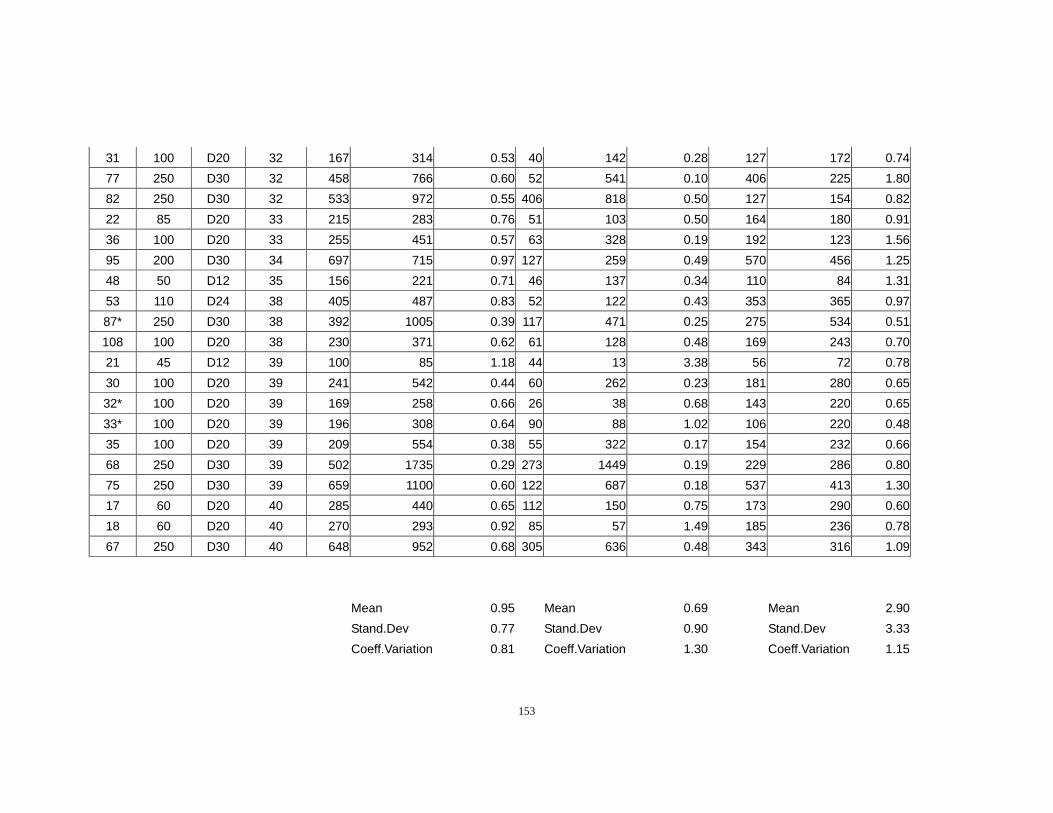
153
31 100 D20 32 167 314 0.53 40 142 0.28 127 172 0.7477 250 D30 32 458 766 0.60 52 541 0.10 406 225 1.8082 250 D30 32 533 972 0.55 406 818 0.50 127 154 0.8222 85 D20 33 215 283 0.76 51 103 0.50 164 180 0.9136 100 D20 33 255 451 0.57 63 328 0.19 192 123 1.5695 200 D30 34 697 715 0.97 127 259 0.49 570 456 1.2548 50 D12 35 156 221 0.71 46 137 0.34 110 84 1.3153 110 D24 38 405 487 0.83 52 122 0.43 353 365 0.9787* 250 D30 38 392 1005 0.39 117 471 0.25 275 534 0.51108 100 D20 38 230 371 0.62 61 128 0.48 169 243 0.7021 45 D12 39 100 85 1.18 44 13 3.38 56 72 0.7830 100 D20 39 241 542 0.44 60 262 0.23 181 280 0.6532* 100 D20 39 169 258 0.66 26 38 0.68 143 220 0.6533* 100 D20 39 196 308 0.64 90 88 1.02 106 220 0.4835 100 D20 39 209 554 0.38 55 322 0.17 154 232 0.6668 250 D30 39 502 1735 0.29 273 1449 0.19 229 286 0.8075 250 D30 39 659 1100 0.60 122 687 0.18 537 413 1.3017 60 D20 40 285 440 0.65 112 150 0.75 173 290 0.6018 60 D20 40 270 293 0.92 85 57 1.49 185 236 0.7867 250 D30 40 648 952 0.68 305 636 0.48 343 316 1.09
Mean 0.95 Mean 0.69 Mean 2.90 Stand.Dev 0.77 Stand.Dev 0.90 Stand.Dev 3.33 Coeff.Variation 0.81 Coeff.Variation 1.30 Coeff.Variation 1.15
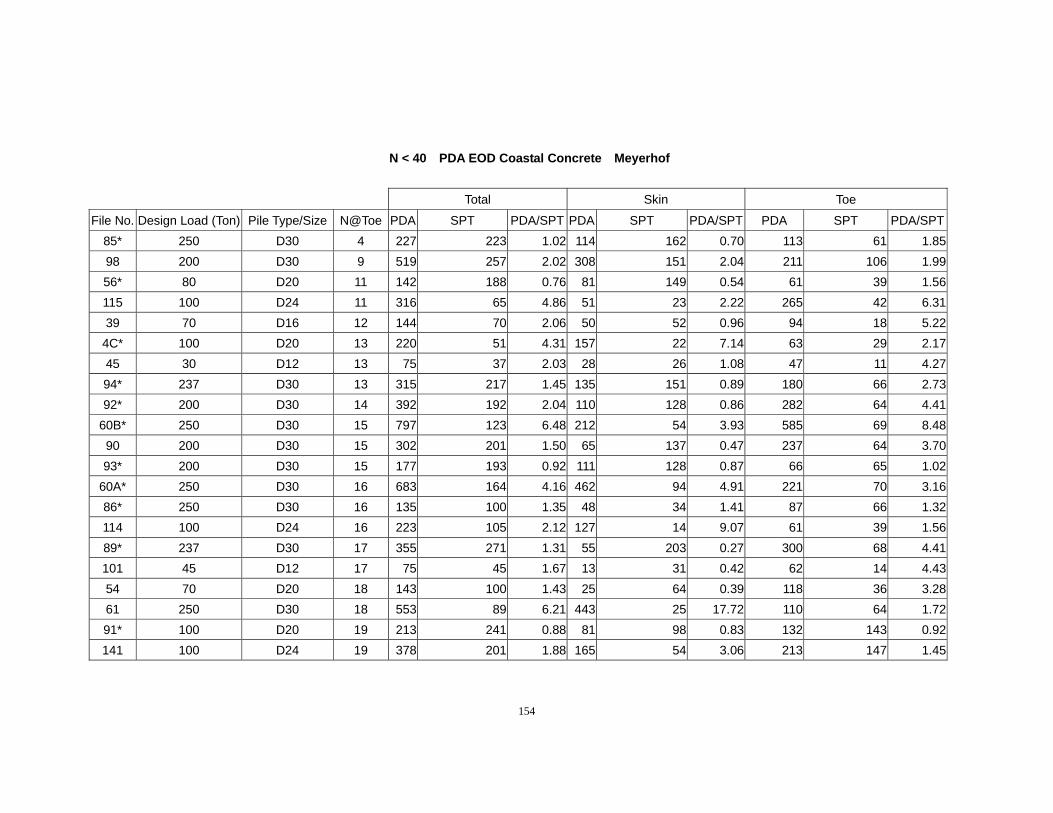
154
N < 40 PDA EOD Coastal Concrete Meyerhof
Total Skin Toe
File No. Design Load (Ton) Pile Type/Size N@Toe PDA SPT PDA/SPT PDA SPT PDA/SPT PDA SPT PDA/SPT85* 250 D30 4 227 223 1.02 114 162 0.70 113 61 1.8598 200 D30 9 519 257 2.02 308 151 2.04 211 106 1.9956* 80 D20 11 142 188 0.76 81 149 0.54 61 39 1.56115 100 D24 11 316 65 4.86 51 23 2.22 265 42 6.3139 70 D16 12 144 70 2.06 50 52 0.96 94 18 5.22
4C* 100 D20 13 220 51 4.31 157 22 7.14 63 29 2.1745 30 D12 13 75 37 2.03 28 26 1.08 47 11 4.2794* 237 D30 13 315 217 1.45 135 151 0.89 180 66 2.7392* 200 D30 14 392 192 2.04 110 128 0.86 282 64 4.41
60B* 250 D30 15 797 123 6.48 212 54 3.93 585 69 8.4890 200 D30 15 302 201 1.50 65 137 0.47 237 64 3.7093* 200 D30 15 177 193 0.92 111 128 0.87 66 65 1.02
60A* 250 D30 16 683 164 4.16 462 94 4.91 221 70 3.1686* 250 D30 16 135 100 1.35 48 34 1.41 87 66 1.32114 100 D24 16 223 105 2.12 127 14 9.07 61 39 1.5689* 237 D30 17 355 271 1.31 55 203 0.27 300 68 4.41101 45 D12 17 75 45 1.67 13 31 0.42 62 14 4.4354 70 D20 18 143 100 1.43 25 64 0.39 118 36 3.2861 250 D30 18 553 89 6.21 443 25 17.72 110 64 1.7291* 100 D20 19 213 241 0.88 81 98 0.83 132 143 0.92141 100 D24 19 378 201 1.88 165 54 3.06 213 147 1.45
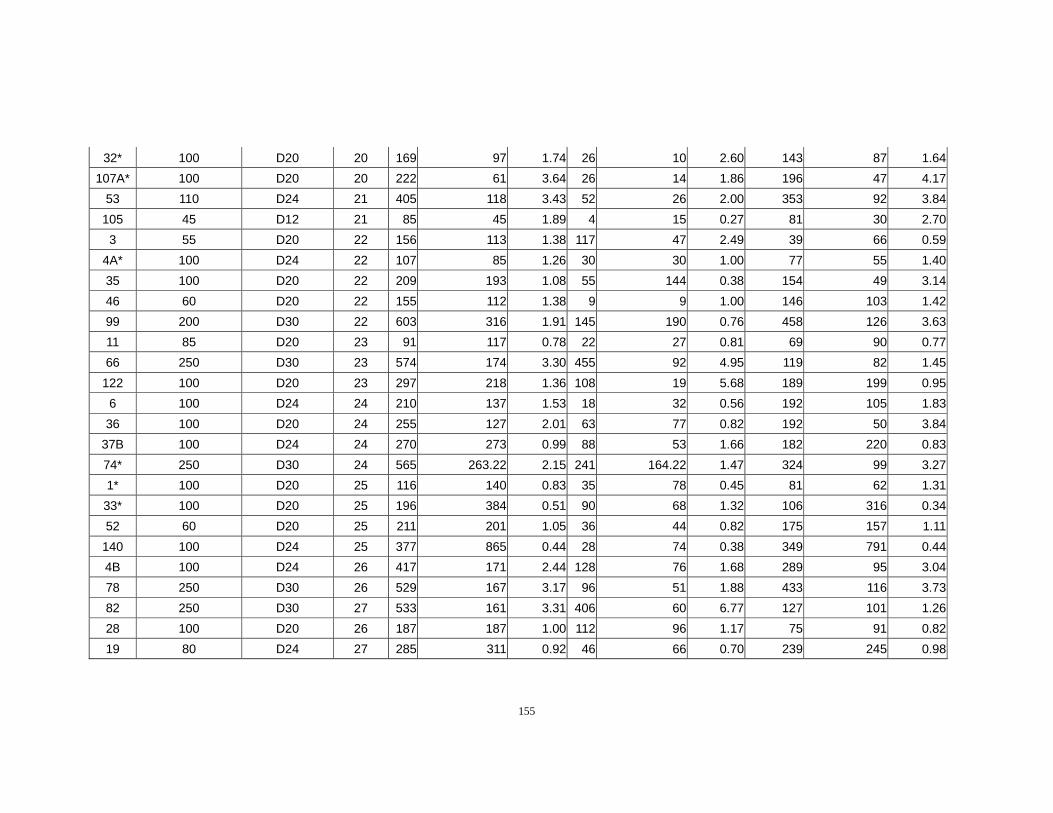
155
32* 100 D20 20 169 97 1.74 26 10 2.60 143 87 1.64107A* 100 D20 20 222 61 3.64 26 14 1.86 196 47 4.17
53 110 D24 21 405 118 3.43 52 26 2.00 353 92 3.84105 45 D12 21 85 45 1.89 4 15 0.27 81 30 2.70
3 55 D20 22 156 113 1.38 117 47 2.49 39 66 0.594A* 100 D24 22 107 85 1.26 30 30 1.00 77 55 1.4035 100 D20 22 209 193 1.08 55 144 0.38 154 49 3.1446 60 D20 22 155 112 1.38 9 9 1.00 146 103 1.4299 200 D30 22 603 316 1.91 145 190 0.76 458 126 3.6311 85 D20 23 91 117 0.78 22 27 0.81 69 90 0.7766 250 D30 23 574 174 3.30 455 92 4.95 119 82 1.45
122 100 D20 23 297 218 1.36 108 19 5.68 189 199 0.956 100 D24 24 210 137 1.53 18 32 0.56 192 105 1.8336 100 D20 24 255 127 2.01 63 77 0.82 192 50 3.84
37B 100 D24 24 270 273 0.99 88 53 1.66 182 220 0.8374* 250 D30 24 565 263.22 2.15 241 164.22 1.47 324 99 3.271* 100 D20 25 116 140 0.83 35 78 0.45 81 62 1.3133* 100 D20 25 196 384 0.51 90 68 1.32 106 316 0.3452 60 D20 25 211 201 1.05 36 44 0.82 175 157 1.11
140 100 D24 25 377 865 0.44 28 74 0.38 349 791 0.444B 100 D24 26 417 171 2.44 128 76 1.68 289 95 3.0478 250 D30 26 529 167 3.17 96 51 1.88 433 116 3.7382 250 D30 27 533 161 3.31 406 60 6.77 127 101 1.2628 100 D20 26 187 187 1.00 112 96 1.17 75 91 0.8219 80 D24 27 285 311 0.92 46 66 0.70 239 245 0.98
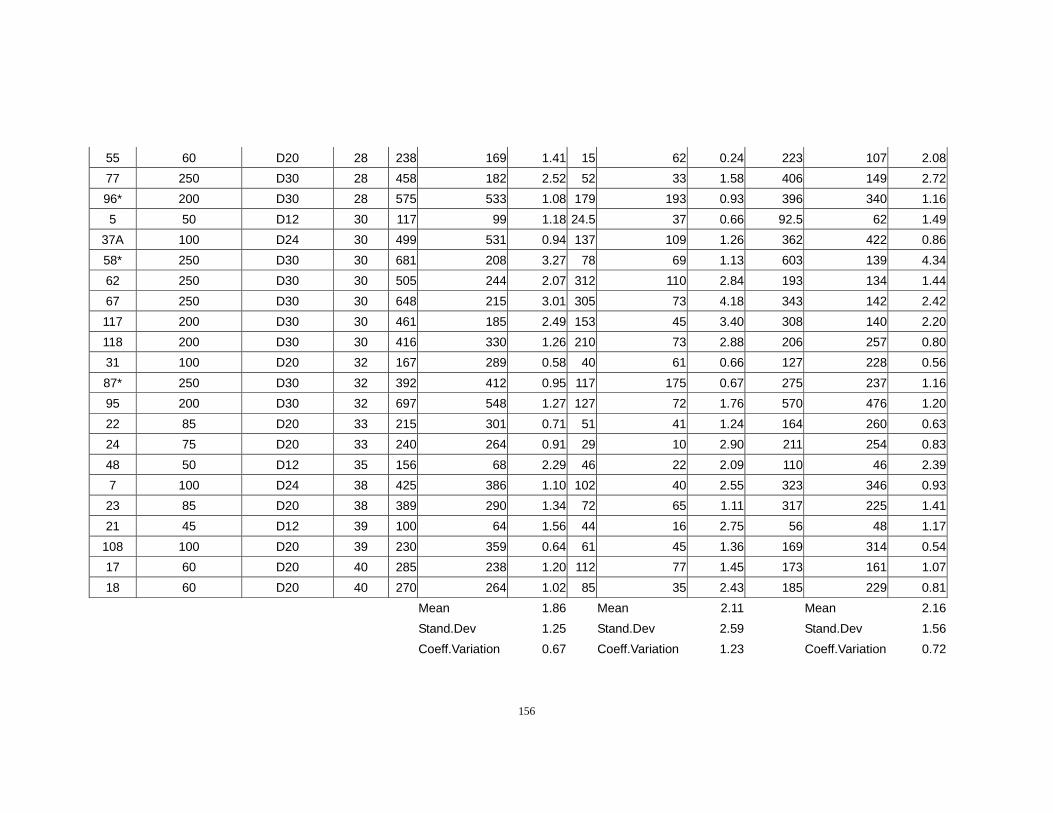
156
55 60 D20 28 238 169 1.41 15 62 0.24 223 107 2.0877 250 D30 28 458 182 2.52 52 33 1.58 406 149 2.7296* 200 D30 28 575 533 1.08 179 193 0.93 396 340 1.165 50 D12 30 117 99 1.18 24.5 37 0.66 92.5 62 1.49
37A 100 D24 30 499 531 0.94 137 109 1.26 362 422 0.8658* 250 D30 30 681 208 3.27 78 69 1.13 603 139 4.3462 250 D30 30 505 244 2.07 312 110 2.84 193 134 1.4467 250 D30 30 648 215 3.01 305 73 4.18 343 142 2.42117 200 D30 30 461 185 2.49 153 45 3.40 308 140 2.20118 200 D30 30 416 330 1.26 210 73 2.88 206 257 0.8031 100 D20 32 167 289 0.58 40 61 0.66 127 228 0.5687* 250 D30 32 392 412 0.95 117 175 0.67 275 237 1.1695 200 D30 32 697 548 1.27 127 72 1.76 570 476 1.2022 85 D20 33 215 301 0.71 51 41 1.24 164 260 0.6324 75 D20 33 240 264 0.91 29 10 2.90 211 254 0.8348 50 D12 35 156 68 2.29 46 22 2.09 110 46 2.397 100 D24 38 425 386 1.10 102 40 2.55 323 346 0.9323 85 D20 38 389 290 1.34 72 65 1.11 317 225 1.4121 45 D12 39 100 64 1.56 44 16 2.75 56 48 1.17
108 100 D20 39 230 359 0.64 61 45 1.36 169 314 0.5417 60 D20 40 285 238 1.20 112 77 1.45 173 161 1.0718 60 D20 40 270 264 1.02 85 35 2.43 185 229 0.81
Mean 1.86 Mean 2.11 Mean 2.16 Stand.Dev 1.25 Stand.Dev 2.59 Stand.Dev 1.56 Coeff.Variation 0.67 Coeff.Variation 1.23 Coeff.Variation 0.72
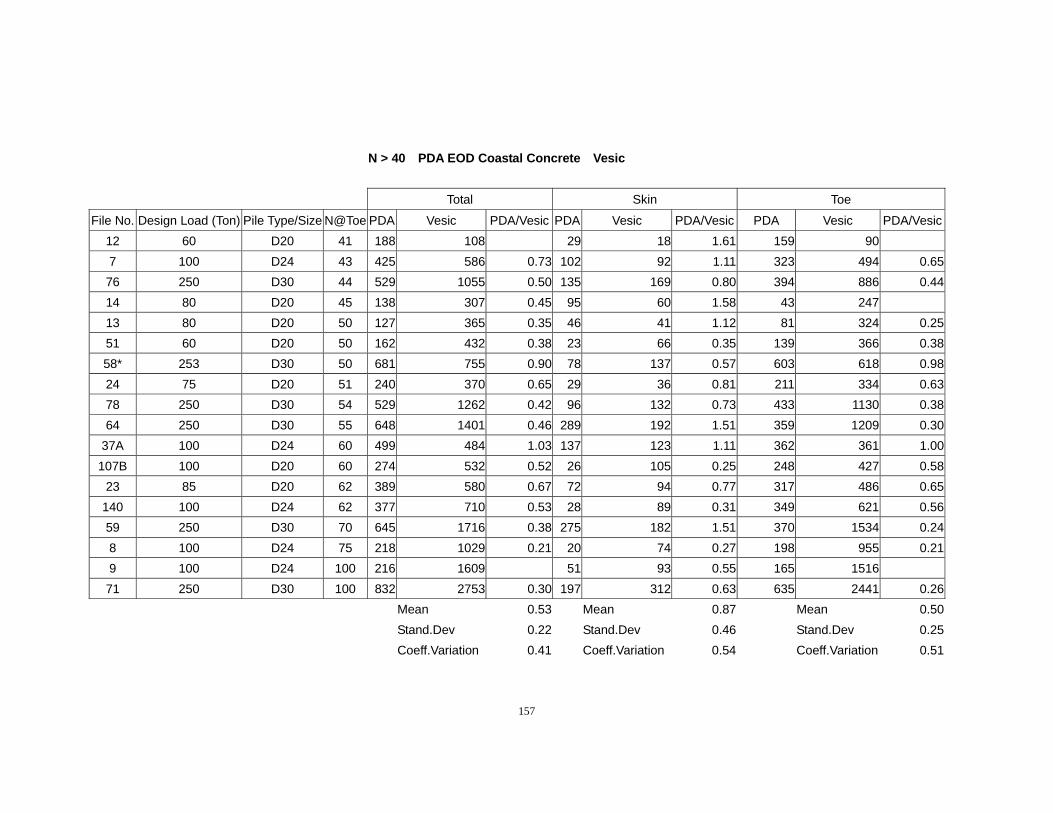
157
N > 40 PDA EOD Coastal Concrete Vesic
Total Skin Toe
File No. Design Load (Ton) Pile Type/Size N@Toe PDA Vesic PDA/Vesic PDA Vesic PDA/Vesic PDA Vesic PDA/Vesic12 60 D20 41 188 108 29 18 1.61 159 907 100 D24 43 425 586 0.73 102 92 1.11 323 494 0.6576 250 D30 44 529 1055 0.50 135 169 0.80 394 886 0.4414 80 D20 45 138 307 0.45 95 60 1.58 43 247 13 80 D20 50 127 365 0.35 46 41 1.12 81 324 0.2551 60 D20 50 162 432 0.38 23 66 0.35 139 366 0.3858* 253 D30 50 681 755 0.90 78 137 0.57 603 618 0.9824 75 D20 51 240 370 0.65 29 36 0.81 211 334 0.6378 250 D30 54 529 1262 0.42 96 132 0.73 433 1130 0.3864 250 D30 55 648 1401 0.46 289 192 1.51 359 1209 0.30
37A 100 D24 60 499 484 1.03 137 123 1.11 362 361 1.00107B 100 D20 60 274 532 0.52 26 105 0.25 248 427 0.58
23 85 D20 62 389 580 0.67 72 94 0.77 317 486 0.65140 100 D24 62 377 710 0.53 28 89 0.31 349 621 0.5659 250 D30 70 645 1716 0.38 275 182 1.51 370 1534 0.248 100 D24 75 218 1029 0.21 20 74 0.27 198 955 0.219 100 D24 100 216 1609 51 93 0.55 165 1516 71 250 D30 100 832 2753 0.30 197 312 0.63 635 2441 0.26
Mean 0.53 Mean 0.87 Mean 0.50 Stand.Dev 0.22 Stand.Dev 0.46 Stand.Dev 0.25 Coeff.Variation 0.41 Coeff.Variation 0.54 Coeff.Variation 0.51
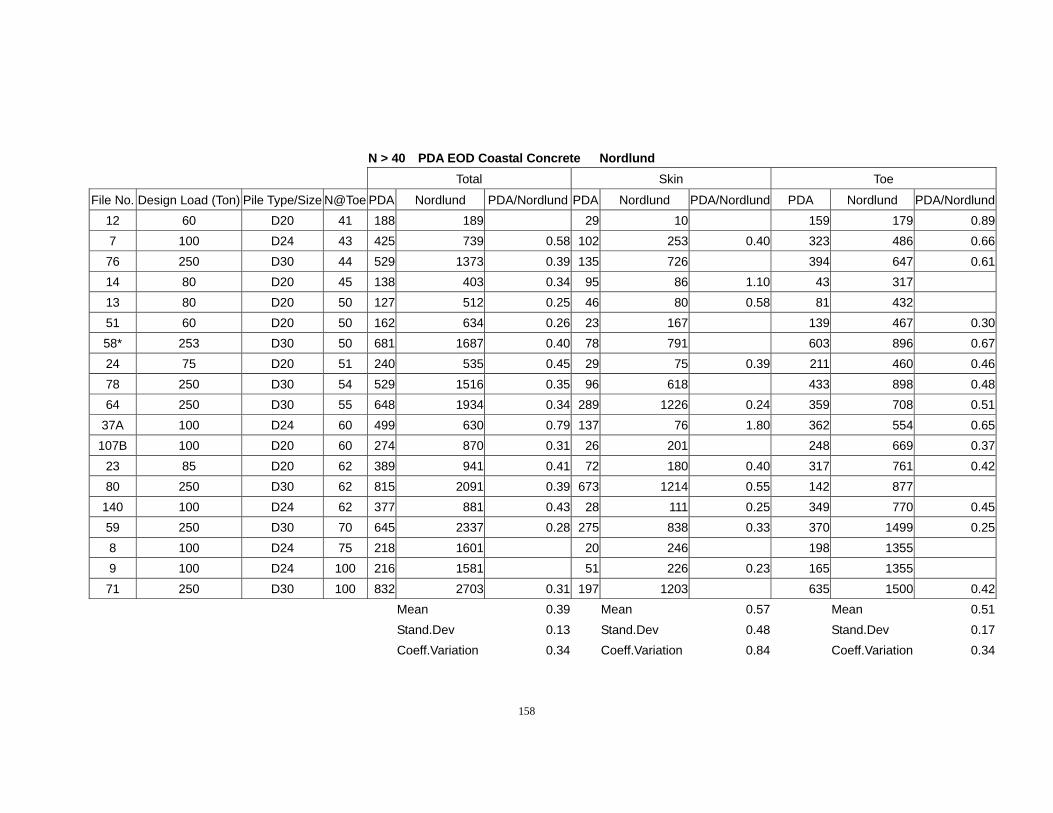
158
N > 40 PDA EOD Coastal Concrete Nordlund
Total Skin Toe
File No. Design Load (Ton) Pile Type/Size N@Toe PDA Nordlund PDA/Nordlund PDA Nordlund PDA/Nordlund PDA Nordlund PDA/Nordlund 12 60 D20 41 188 189 29 10 159 179 0.89 7 100 D24 43 425 739 0.58 102 253 0.40 323 486 0.66 76 250 D30 44 529 1373 0.39 135 726 394 647 0.61 14 80 D20 45 138 403 0.34 95 86 1.10 43 317 13 80 D20 50 127 512 0.25 46 80 0.58 81 432 51 60 D20 50 162 634 0.26 23 167 139 467 0.30 58* 253 D30 50 681 1687 0.40 78 791 603 896 0.67 24 75 D20 51 240 535 0.45 29 75 0.39 211 460 0.46 78 250 D30 54 529 1516 0.35 96 618 433 898 0.48 64 250 D30 55 648 1934 0.34 289 1226 0.24 359 708 0.51
37A 100 D24 60 499 630 0.79 137 76 1.80 362 554 0.65 107B 100 D20 60 274 870 0.31 26 201 248 669 0.37
23 85 D20 62 389 941 0.41 72 180 0.40 317 761 0.42 80 250 D30 62 815 2091 0.39 673 1214 0.55 142 877
140 100 D24 62 377 881 0.43 28 111 0.25 349 770 0.45 59 250 D30 70 645 2337 0.28 275 838 0.33 370 1499 0.25 8 100 D24 75 218 1601 20 246 198 1355 9 100 D24 100 216 1581 51 226 0.23 165 1355 71 250 D30 100 832 2703 0.31 197 1203 635 1500 0.42
Mean 0.39 Mean 0.57 Mean 0.51 Stand.Dev 0.13 Stand.Dev 0.48 Stand.Dev 0.17 Coeff.Variation 0.34 Coeff.Variation 0.84 Coeff.Variation 0.34
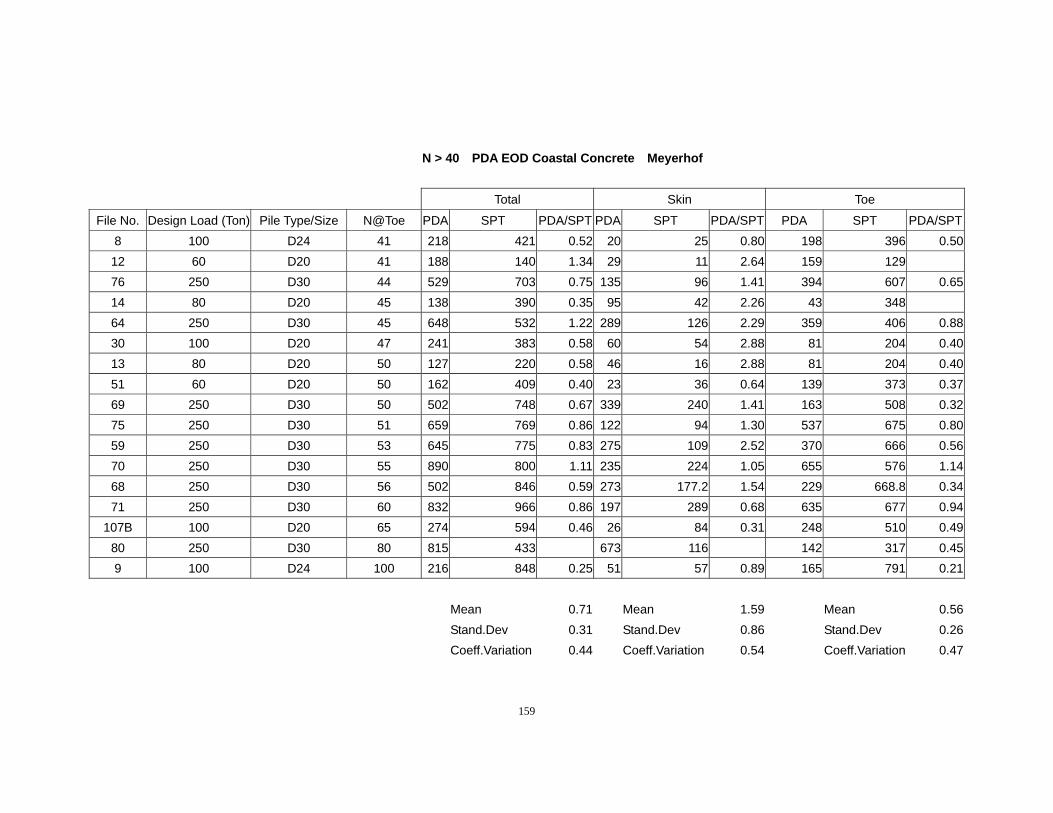
159
N > 40 PDA EOD Coastal Concrete Meyerhof
Total Skin Toe
File No. Design Load (Ton) Pile Type/Size N@Toe PDA SPT PDA/SPT PDA SPT PDA/SPT PDA SPT PDA/SPT8 100 D24 41 218 421 0.52 20 25 0.80 198 396 0.5012 60 D20 41 188 140 1.34 29 11 2.64 159 129 76 250 D30 44 529 703 0.75 135 96 1.41 394 607 0.6514 80 D20 45 138 390 0.35 95 42 2.26 43 348 64 250 D30 45 648 532 1.22 289 126 2.29 359 406 0.8830 100 D20 47 241 383 0.58 60 54 2.88 81 204 0.4013 80 D20 50 127 220 0.58 46 16 2.88 81 204 0.4051 60 D20 50 162 409 0.40 23 36 0.64 139 373 0.3769 250 D30 50 502 748 0.67 339 240 1.41 163 508 0.3275 250 D30 51 659 769 0.86 122 94 1.30 537 675 0.8059 250 D30 53 645 775 0.83 275 109 2.52 370 666 0.5670 250 D30 55 890 800 1.11 235 224 1.05 655 576 1.1468 250 D30 56 502 846 0.59 273 177.2 1.54 229 668.8 0.3471 250 D30 60 832 966 0.86 197 289 0.68 635 677 0.94
107B 100 D20 65 274 594 0.46 26 84 0.31 248 510 0.4980 250 D30 80 815 433 673 116 142 317 0.459 100 D24 100 216 848 0.25 51 57 0.89 165 791 0.21
Mean 0.71 Mean 1.59 Mean 0.56 Stand.Dev 0.31 Stand.Dev 0.86 Stand.Dev 0.26 Coeff.Variation 0.44 Coeff.Variation 0.54 Coeff.Variation 0.47
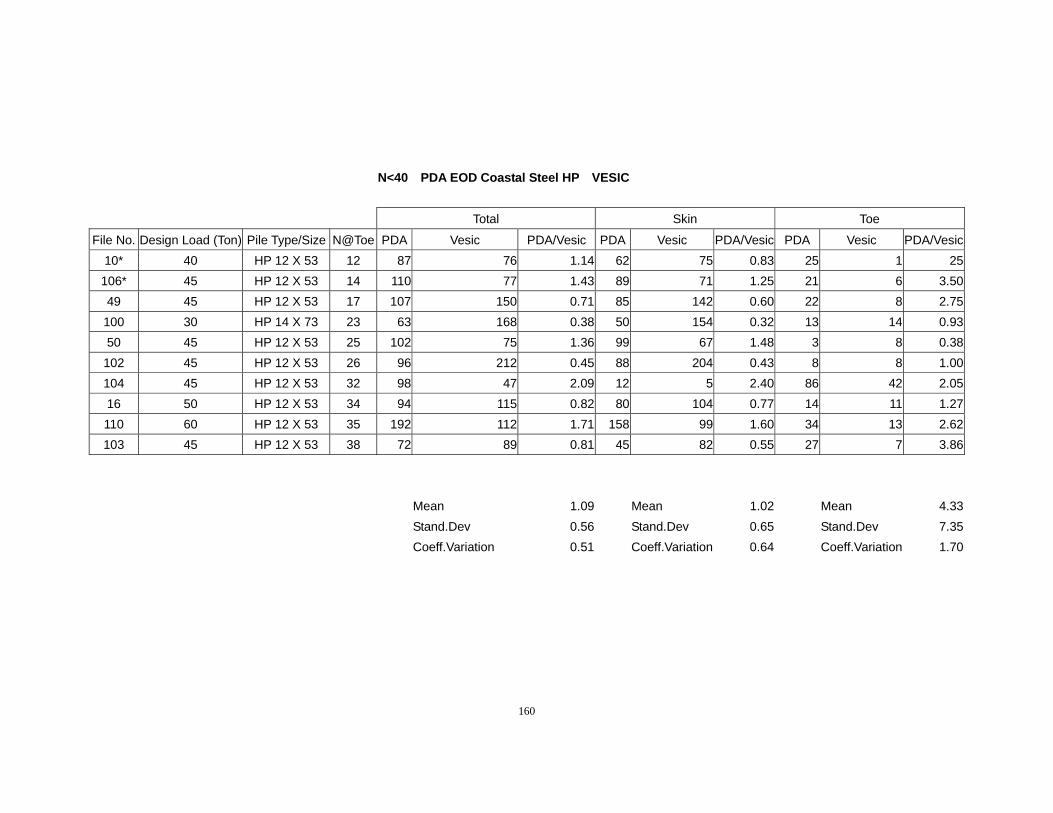
160
N<40 PDA EOD Coastal Steel HP VESIC
Total Skin Toe
File No. Design Load (Ton) Pile Type/Size N@Toe PDA Vesic PDA/Vesic PDA Vesic PDA/Vesic PDA Vesic PDA/Vesic10* 40 HP 12 X 53 12 87 76 1.14 62 75 0.83 25 1 25
106* 45 HP 12 X 53 14 110 77 1.43 89 71 1.25 21 6 3.5049 45 HP 12 X 53 17 107 150 0.71 85 142 0.60 22 8 2.75
100 30 HP 14 X 73 23 63 168 0.38 50 154 0.32 13 14 0.9350 45 HP 12 X 53 25 102 75 1.36 99 67 1.48 3 8 0.38
102 45 HP 12 X 53 26 96 212 0.45 88 204 0.43 8 8 1.00104 45 HP 12 X 53 32 98 47 2.09 12 5 2.40 86 42 2.0516 50 HP 12 X 53 34 94 115 0.82 80 104 0.77 14 11 1.27110 60 HP 12 X 53 35 192 112 1.71 158 99 1.60 34 13 2.62103 45 HP 12 X 53 38 72 89 0.81 45 82 0.55 27 7 3.86
Mean 1.09 Mean 1.02 Mean 4.33 Stand.Dev 0.56 Stand.Dev 0.65 Stand.Dev 7.35 Coeff.Variation 0.51 Coeff.Variation 0.64 Coeff.Variation 1.70
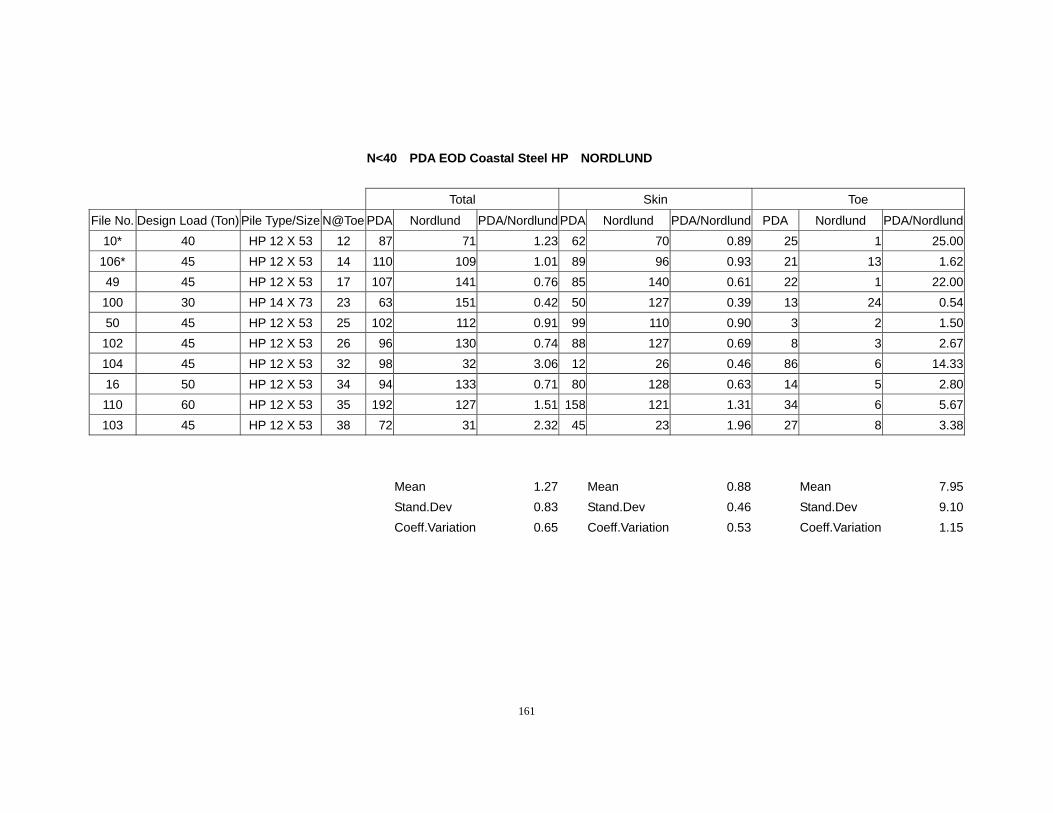
161
N<40 PDA EOD Coastal Steel HP NORDLUND
Total Skin Toe
File No. Design Load (Ton) Pile Type/Size N@Toe PDA Nordlund PDA/Nordlund PDA Nordlund PDA/Nordlund PDA Nordlund PDA/Nordlund10* 40 HP 12 X 53 12 87 71 1.23 62 70 0.89 25 1 25.00
106* 45 HP 12 X 53 14 110 109 1.01 89 96 0.93 21 13 1.6249 45 HP 12 X 53 17 107 141 0.76 85 140 0.61 22 1 22.00100 30 HP 14 X 73 23 63 151 0.42 50 127 0.39 13 24 0.5450 45 HP 12 X 53 25 102 112 0.91 99 110 0.90 3 2 1.50102 45 HP 12 X 53 26 96 130 0.74 88 127 0.69 8 3 2.67104 45 HP 12 X 53 32 98 32 3.06 12 26 0.46 86 6 14.3316 50 HP 12 X 53 34 94 133 0.71 80 128 0.63 14 5 2.80110 60 HP 12 X 53 35 192 127 1.51 158 121 1.31 34 6 5.67103 45 HP 12 X 53 38 72 31 2.32 45 23 1.96 27 8 3.38
Mean 1.27 Mean 0.88 Mean 7.95 Stand.Dev 0.83 Stand.Dev 0.46 Stand.Dev 9.10 Coeff.Variation 0.65 Coeff.Variation 0.53 Coeff.Variation 1.15
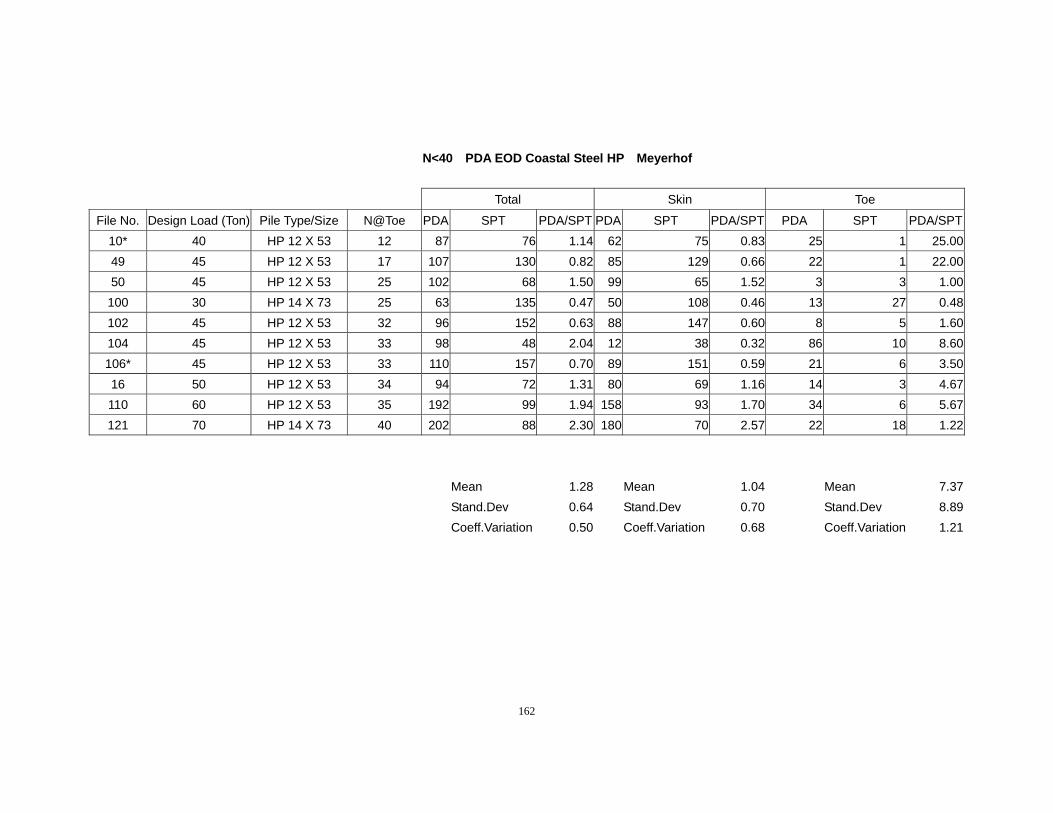
162
N<40 PDA EOD Coastal Steel HP Meyerhof
Total Skin Toe
File No. Design Load (Ton) Pile Type/Size N@Toe PDA SPT PDA/SPT PDA SPT PDA/SPT PDA SPT PDA/SPT10* 40 HP 12 X 53 12 87 76 1.14 62 75 0.83 25 1 25.0049 45 HP 12 X 53 17 107 130 0.82 85 129 0.66 22 1 22.0050 45 HP 12 X 53 25 102 68 1.50 99 65 1.52 3 3 1.00
100 30 HP 14 X 73 25 63 135 0.47 50 108 0.46 13 27 0.48102 45 HP 12 X 53 32 96 152 0.63 88 147 0.60 8 5 1.60104 45 HP 12 X 53 33 98 48 2.04 12 38 0.32 86 10 8.60106* 45 HP 12 X 53 33 110 157 0.70 89 151 0.59 21 6 3.5016 50 HP 12 X 53 34 94 72 1.31 80 69 1.16 14 3 4.67110 60 HP 12 X 53 35 192 99 1.94 158 93 1.70 34 6 5.67121 70 HP 14 X 73 40 202 88 2.30 180 70 2.57 22 18 1.22
Mean 1.28 Mean 1.04 Mean 7.37 Stand.Dev 0.64 Stand.Dev 0.70 Stand.Dev 8.89 Coeff.Variation 0.50 Coeff.Variation 0.68 Coeff.Variation 1.21
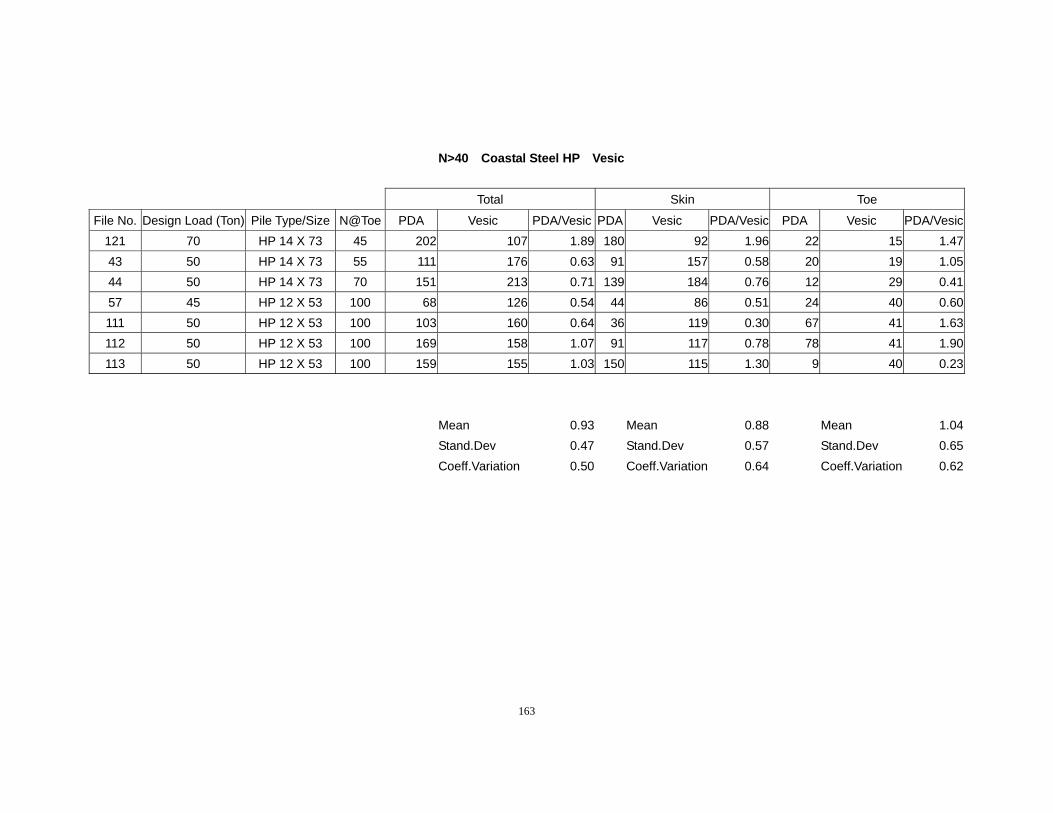
163
N>40 Coastal Steel HP Vesic
Total Skin Toe
File No. Design Load (Ton) Pile Type/Size N@Toe PDA Vesic PDA/Vesic PDA Vesic PDA/Vesic PDA Vesic PDA/Vesic121 70 HP 14 X 73 45 202 107 1.89 180 92 1.96 22 15 1.4743 50 HP 14 X 73 55 111 176 0.63 91 157 0.58 20 19 1.0544 50 HP 14 X 73 70 151 213 0.71 139 184 0.76 12 29 0.4157 45 HP 12 X 53 100 68 126 0.54 44 86 0.51 24 40 0.60111 50 HP 12 X 53 100 103 160 0.64 36 119 0.30 67 41 1.63112 50 HP 12 X 53 100 169 158 1.07 91 117 0.78 78 41 1.90113 50 HP 12 X 53 100 159 155 1.03 150 115 1.30 9 40 0.23
Mean 0.93 Mean 0.88 Mean 1.04 Stand.Dev 0.47 Stand.Dev 0.57 Stand.Dev 0.65 Coeff.Variation 0.50 Coeff.Variation 0.64 Coeff.Variation 0.62
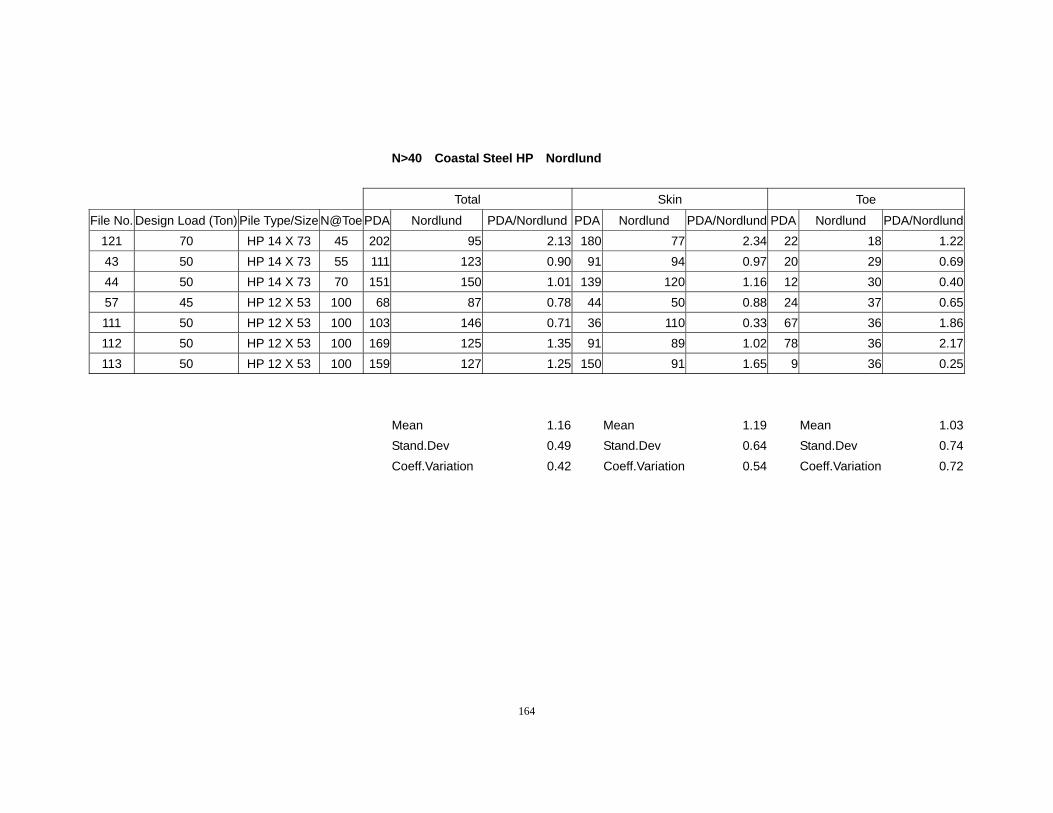
164
N>40 Coastal Steel HP Nordlund
Total Skin Toe
File No. Design Load (Ton) Pile Type/Size N@Toe PDA Nordlund PDA/Nordlund PDA Nordlund PDA/Nordlund PDA Nordlund PDA/Nordlund121 70 HP 14 X 73 45 202 95 2.13 180 77 2.34 22 18 1.2243 50 HP 14 X 73 55 111 123 0.90 91 94 0.97 20 29 0.6944 50 HP 14 X 73 70 151 150 1.01 139 120 1.16 12 30 0.4057 45 HP 12 X 53 100 68 87 0.78 44 50 0.88 24 37 0.65111 50 HP 12 X 53 100 103 146 0.71 36 110 0.33 67 36 1.86112 50 HP 12 X 53 100 169 125 1.35 91 89 1.02 78 36 2.17113 50 HP 12 X 53 100 159 127 1.25 150 91 1.65 9 36 0.25
Mean 1.16 Mean 1.19 Mean 1.03 Stand.Dev 0.49 Stand.Dev 0.64 Stand.Dev 0.74 Coeff.Variation 0.42 Coeff.Variation 0.54 Coeff.Variation 0.72
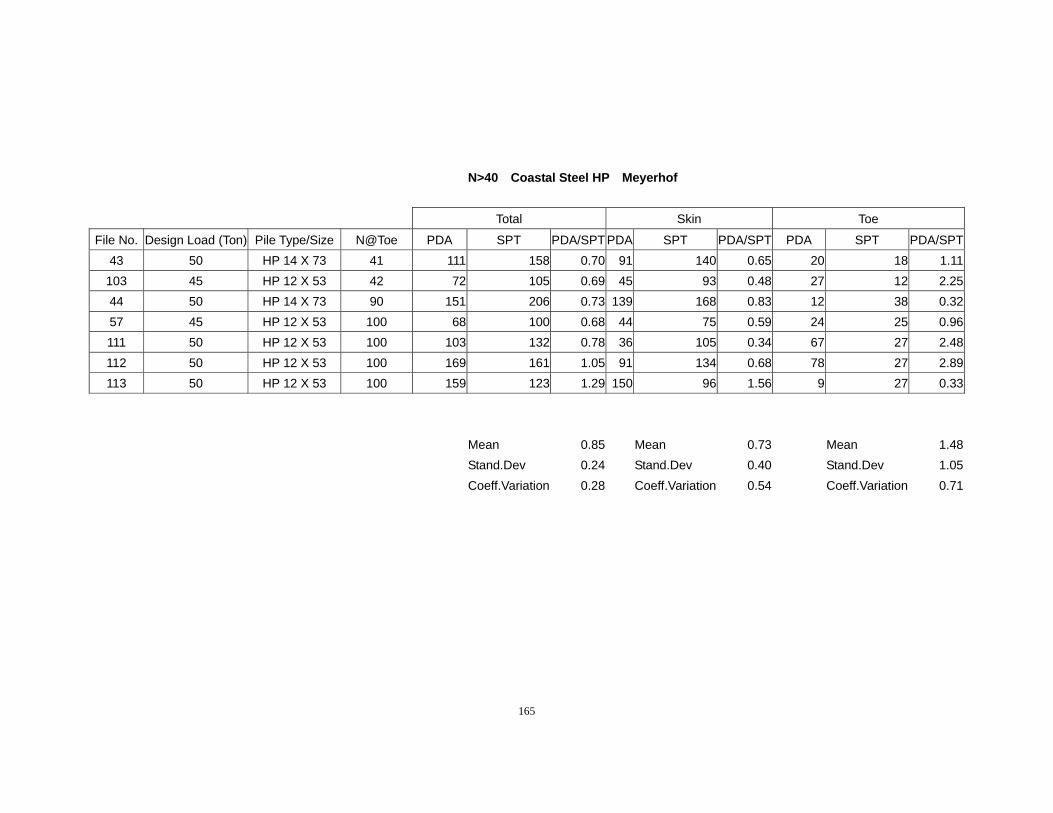
165
N>40 Coastal Steel HP Meyerhof
Total Skin Toe
File No. Design Load (Ton) Pile Type/Size N@Toe PDA SPT PDA/SPT PDA SPT PDA/SPT PDA SPT PDA/SPT43 50 HP 14 X 73 41 111 158 0.70 91 140 0.65 20 18 1.11
103 45 HP 12 X 53 42 72 105 0.69 45 93 0.48 27 12 2.2544 50 HP 14 X 73 90 151 206 0.73 139 168 0.83 12 38 0.3257 45 HP 12 X 53 100 68 100 0.68 44 75 0.59 24 25 0.96111 50 HP 12 X 53 100 103 132 0.78 36 105 0.34 67 27 2.48112 50 HP 12 X 53 100 169 161 1.05 91 134 0.68 78 27 2.89113 50 HP 12 X 53 100 159 123 1.29 150 96 1.56 9 27 0.33
Mean 0.85 Mean 0.73 Mean 1.48 Stand.Dev 0.24 Stand.Dev 0.40 Stand.Dev 1.05 Coeff.Variation 0.28 Coeff.Variation 0.54 Coeff.Variation 0.71
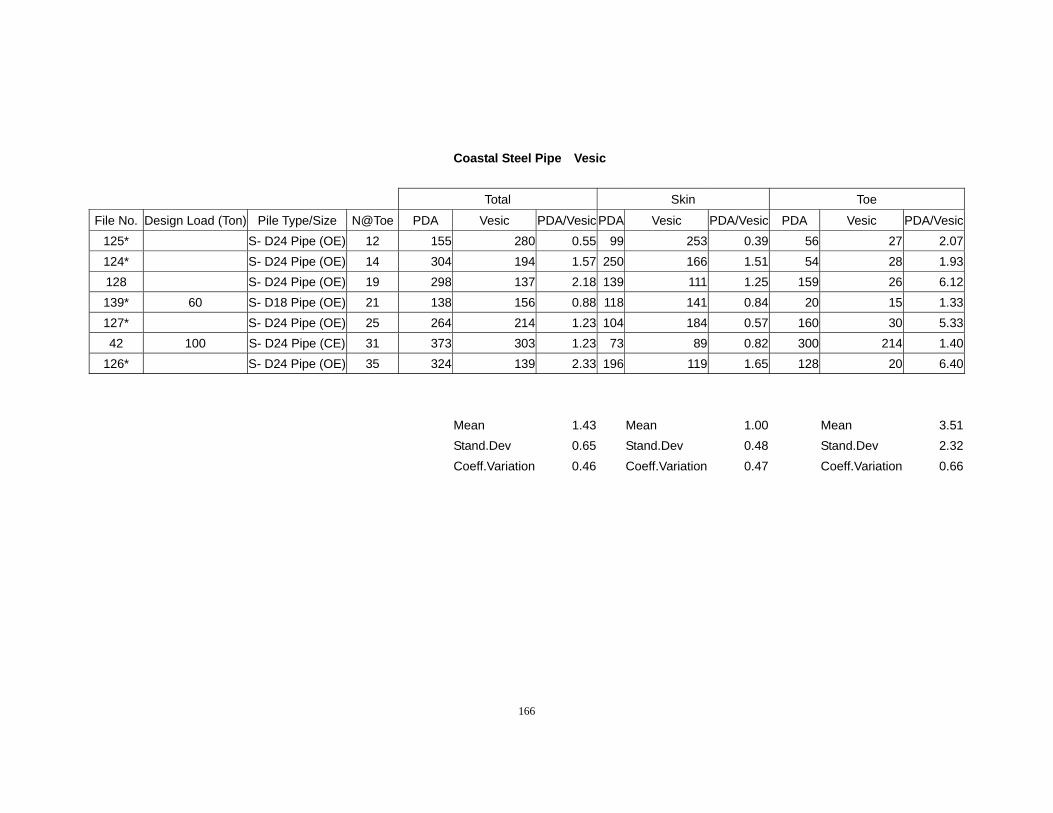
166
Coastal Steel Pipe Vesic
Total Skin Toe
File No. Design Load (Ton) Pile Type/Size N@Toe PDA Vesic PDA/Vesic PDA Vesic PDA/Vesic PDA Vesic PDA/Vesic125* S- D24 Pipe (OE) 12 155 280 0.55 99 253 0.39 56 27 2.07124* S- D24 Pipe (OE) 14 304 194 1.57 250 166 1.51 54 28 1.93128 S- D24 Pipe (OE) 19 298 137 2.18 139 111 1.25 159 26 6.12139* 60 S- D18 Pipe (OE) 21 138 156 0.88 118 141 0.84 20 15 1.33127* S- D24 Pipe (OE) 25 264 214 1.23 104 184 0.57 160 30 5.3342 100 S- D24 Pipe (CE) 31 373 303 1.23 73 89 0.82 300 214 1.40
126* S- D24 Pipe (OE) 35 324 139 2.33 196 119 1.65 128 20 6.40 Mean 1.43 Mean 1.00 Mean 3.51 Stand.Dev 0.65 Stand.Dev 0.48 Stand.Dev 2.32 Coeff.Variation 0.46 Coeff.Variation 0.47 Coeff.Variation 0.66
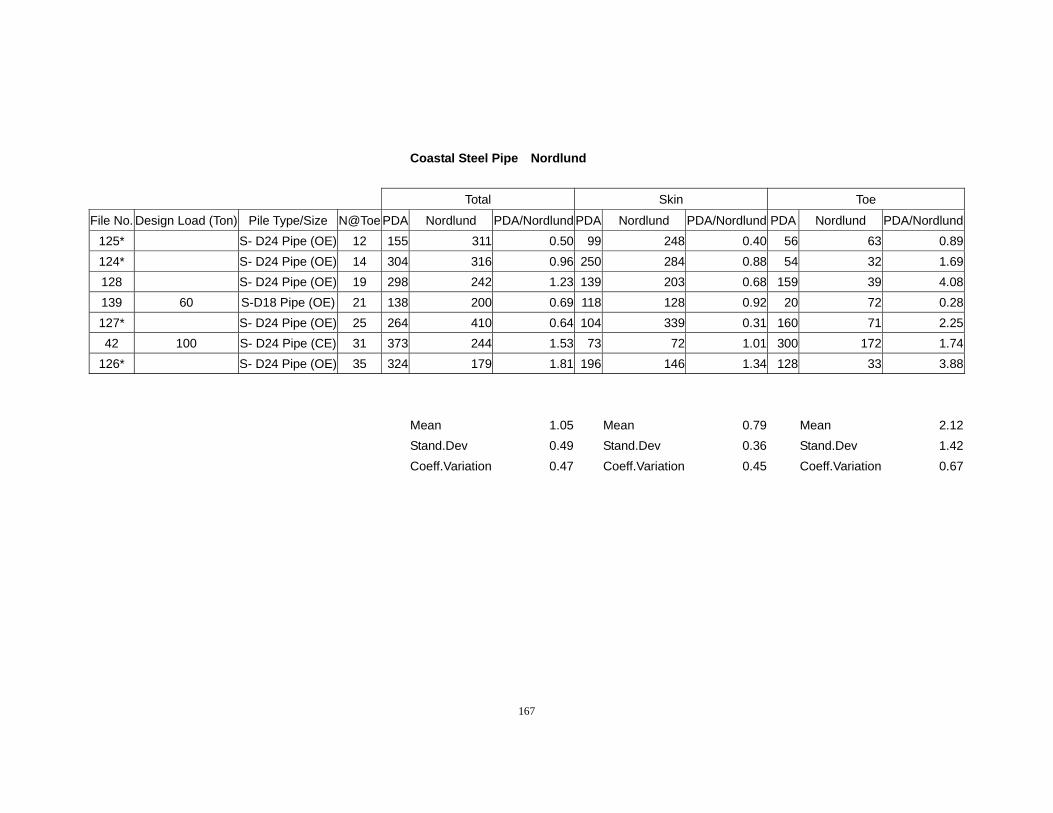
167
Coastal Steel Pipe Nordlund
Total Skin Toe
File No. Design Load (Ton) Pile Type/Size N@Toe PDA Nordlund PDA/Nordlund PDA Nordlund PDA/Nordlund PDA Nordlund PDA/Nordlund125* S- D24 Pipe (OE) 12 155 311 0.50 99 248 0.40 56 63 0.89124* S- D24 Pipe (OE) 14 304 316 0.96 250 284 0.88 54 32 1.69128 S- D24 Pipe (OE) 19 298 242 1.23 139 203 0.68 159 39 4.08139 60 S-D18 Pipe (OE) 21 138 200 0.69 118 128 0.92 20 72 0.28127* S- D24 Pipe (OE) 25 264 410 0.64 104 339 0.31 160 71 2.2542 100 S- D24 Pipe (CE) 31 373 244 1.53 73 72 1.01 300 172 1.74
126* S- D24 Pipe (OE) 35 324 179 1.81 196 146 1.34 128 33 3.88 Mean 1.05 Mean 0.79 Mean 2.12 Stand.Dev 0.49 Stand.Dev 0.36 Stand.Dev 1.42 Coeff.Variation 0.47 Coeff.Variation 0.45 Coeff.Variation 0.67
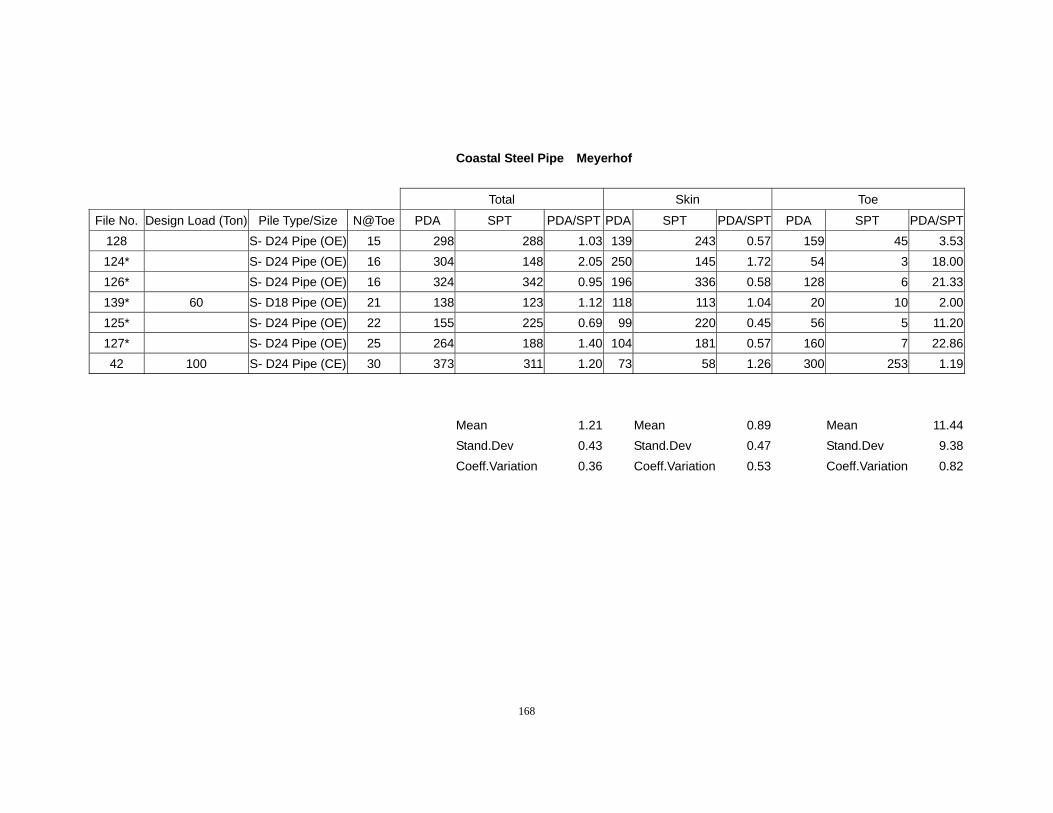
168
Coastal Steel Pipe Meyerhof
Total Skin Toe
File No. Design Load (Ton) Pile Type/Size N@Toe PDA SPT PDA/SPT PDA SPT PDA/SPT PDA SPT PDA/SPT128 S- D24 Pipe (OE) 15 298 288 1.03 139 243 0.57 159 45 3.53124* S- D24 Pipe (OE) 16 304 148 2.05 250 145 1.72 54 3 18.00126* S- D24 Pipe (OE) 16 324 342 0.95 196 336 0.58 128 6 21.33139* 60 S- D18 Pipe (OE) 21 138 123 1.12 118 113 1.04 20 10 2.00125* S- D24 Pipe (OE) 22 155 225 0.69 99 220 0.45 56 5 11.20127* S- D24 Pipe (OE) 25 264 188 1.40 104 181 0.57 160 7 22.8642 100 S- D24 Pipe (CE) 30 373 311 1.20 73 58 1.26 300 253 1.19
Mean 1.21 Mean 0.89 Mean 11.44 Stand.Dev 0.43 Stand.Dev 0.47 Stand.Dev 9.38 Coeff.Variation 0.36 Coeff.Variation 0.53 Coeff.Variation 0.82
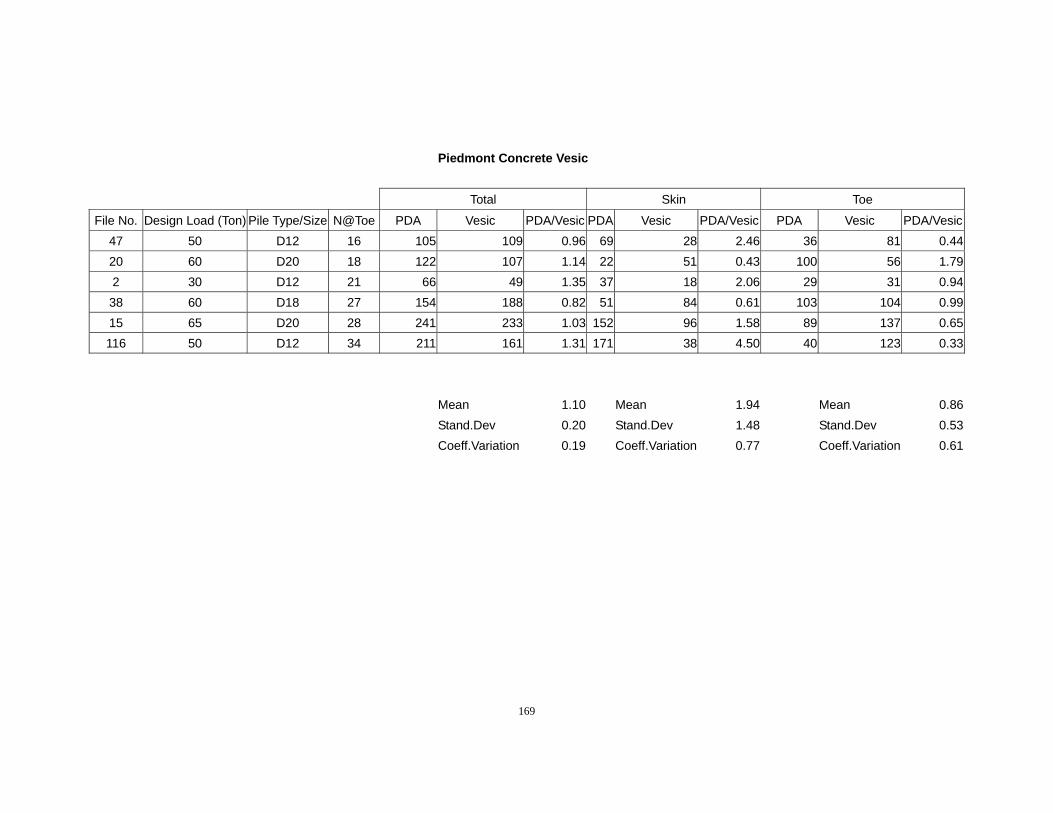
169
Piedmont Concrete Vesic
Total Skin Toe
File No. Design Load (Ton) Pile Type/Size N@Toe PDA Vesic PDA/Vesic PDA Vesic PDA/Vesic PDA Vesic PDA/Vesic47 50 D12 16 105 109 0.96 69 28 2.46 36 81 0.4420 60 D20 18 122 107 1.14 22 51 0.43 100 56 1.792 30 D12 21 66 49 1.35 37 18 2.06 29 31 0.9438 60 D18 27 154 188 0.82 51 84 0.61 103 104 0.9915 65 D20 28 241 233 1.03 152 96 1.58 89 137 0.65116 50 D12 34 211 161 1.31 171 38 4.50 40 123 0.33
Mean 1.10 Mean 1.94 Mean 0.86 Stand.Dev 0.20 Stand.Dev 1.48 Stand.Dev 0.53 Coeff.Variation 0.19 Coeff.Variation 0.77 Coeff.Variation 0.61
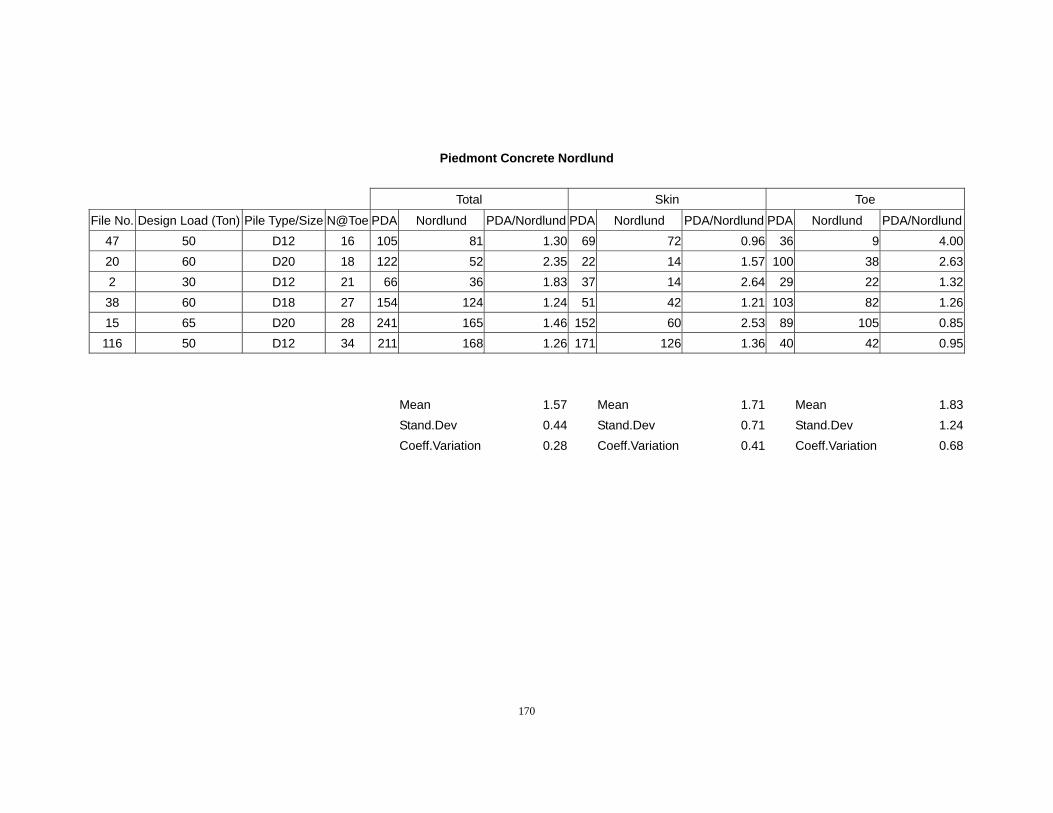
170
Piedmont Concrete Nordlund
Total Skin Toe
File No. Design Load (Ton) Pile Type/Size N@Toe PDA Nordlund PDA/Nordlund PDA Nordlund PDA/Nordlund PDA Nordlund PDA/Nordlund47 50 D12 16 105 81 1.30 69 72 0.96 36 9 4.0020 60 D20 18 122 52 2.35 22 14 1.57 100 38 2.632 30 D12 21 66 36 1.83 37 14 2.64 29 22 1.3238 60 D18 27 154 124 1.24 51 42 1.21 103 82 1.2615 65 D20 28 241 165 1.46 152 60 2.53 89 105 0.85116 50 D12 34 211 168 1.26 171 126 1.36 40 42 0.95
Mean 1.57 Mean 1.71 Mean 1.83 Stand.Dev 0.44 Stand.Dev 0.71 Stand.Dev 1.24 Coeff.Variation 0.28 Coeff.Variation 0.41 Coeff.Variation 0.68
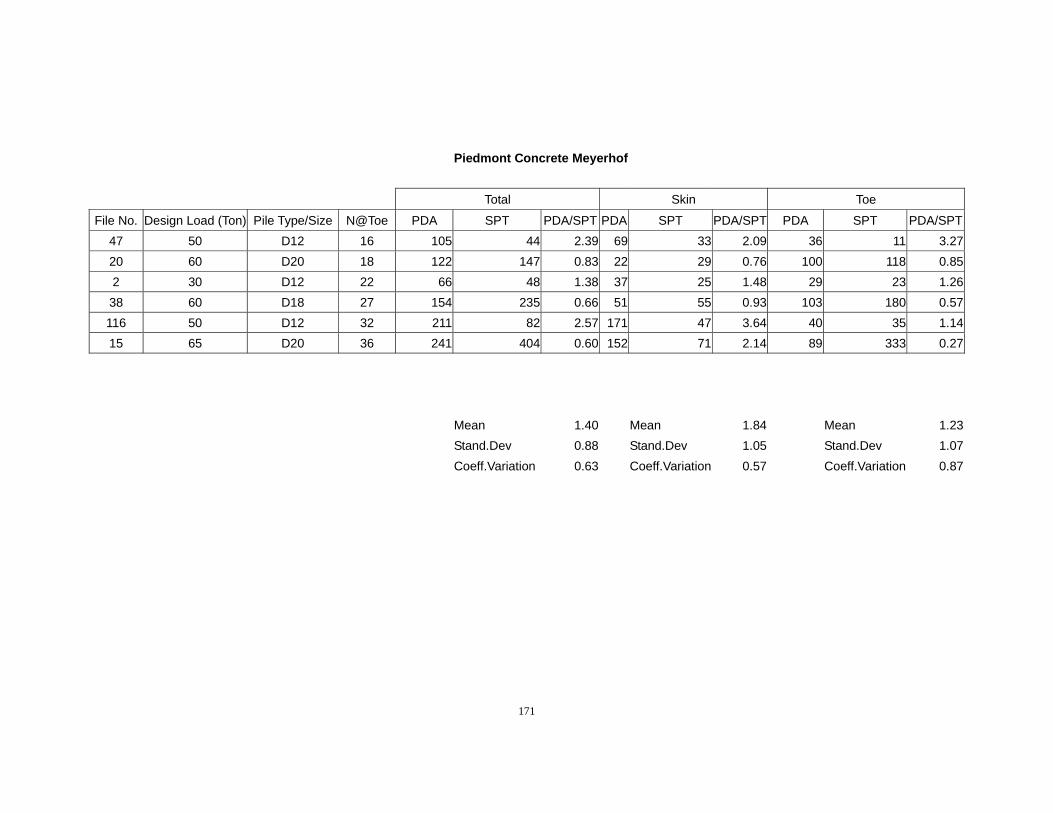
171
Piedmont Concrete Meyerhof
Total Skin Toe
File No. Design Load (Ton) Pile Type/Size N@Toe PDA SPT PDA/SPT PDA SPT PDA/SPT PDA SPT PDA/SPT47 50 D12 16 105 44 2.39 69 33 2.09 36 11 3.2720 60 D20 18 122 147 0.83 22 29 0.76 100 118 0.852 30 D12 22 66 48 1.38 37 25 1.48 29 23 1.2638 60 D18 27 154 235 0.66 51 55 0.93 103 180 0.57116 50 D12 32 211 82 2.57 171 47 3.64 40 35 1.1415 65 D20 36 241 404 0.60 152 71 2.14 89 333 0.27
Mean 1.40 Mean 1.84 Mean 1.23 Stand.Dev 0.88 Stand.Dev 1.05 Stand.Dev 1.07 Coeff.Variation 0.63 Coeff.Variation 0.57 Coeff.Variation 0.87
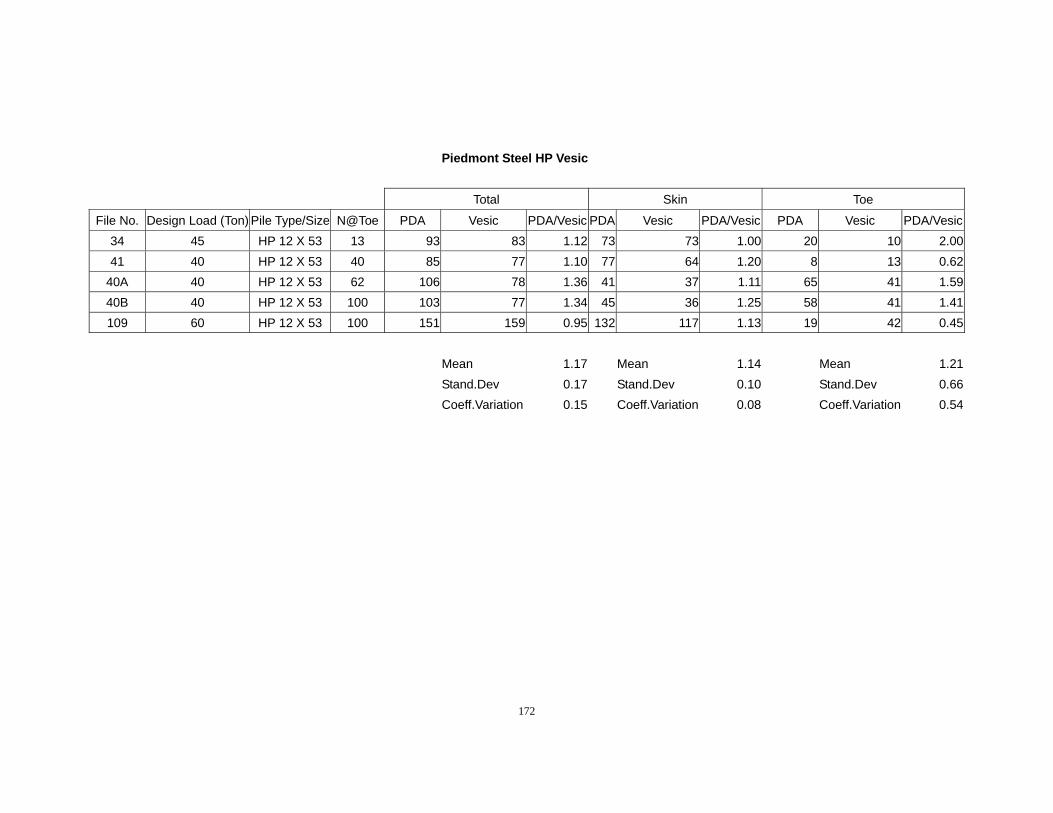
172
Piedmont Steel HP Vesic
Total Skin Toe
File No. Design Load (Ton) Pile Type/Size N@Toe PDA Vesic PDA/Vesic PDA Vesic PDA/Vesic PDA Vesic PDA/Vesic34 45 HP 12 X 53 13 93 83 1.12 73 73 1.00 20 10 2.0041 40 HP 12 X 53 40 85 77 1.10 77 64 1.20 8 13 0.62
40A 40 HP 12 X 53 62 106 78 1.36 41 37 1.11 65 41 1.5940B 40 HP 12 X 53 100 103 77 1.34 45 36 1.25 58 41 1.41109 60 HP 12 X 53 100 151 159 0.95 132 117 1.13 19 42 0.45
Mean 1.17 Mean 1.14 Mean 1.21 Stand.Dev 0.17 Stand.Dev 0.10 Stand.Dev 0.66 Coeff.Variation 0.15 Coeff.Variation 0.08 Coeff.Variation 0.54
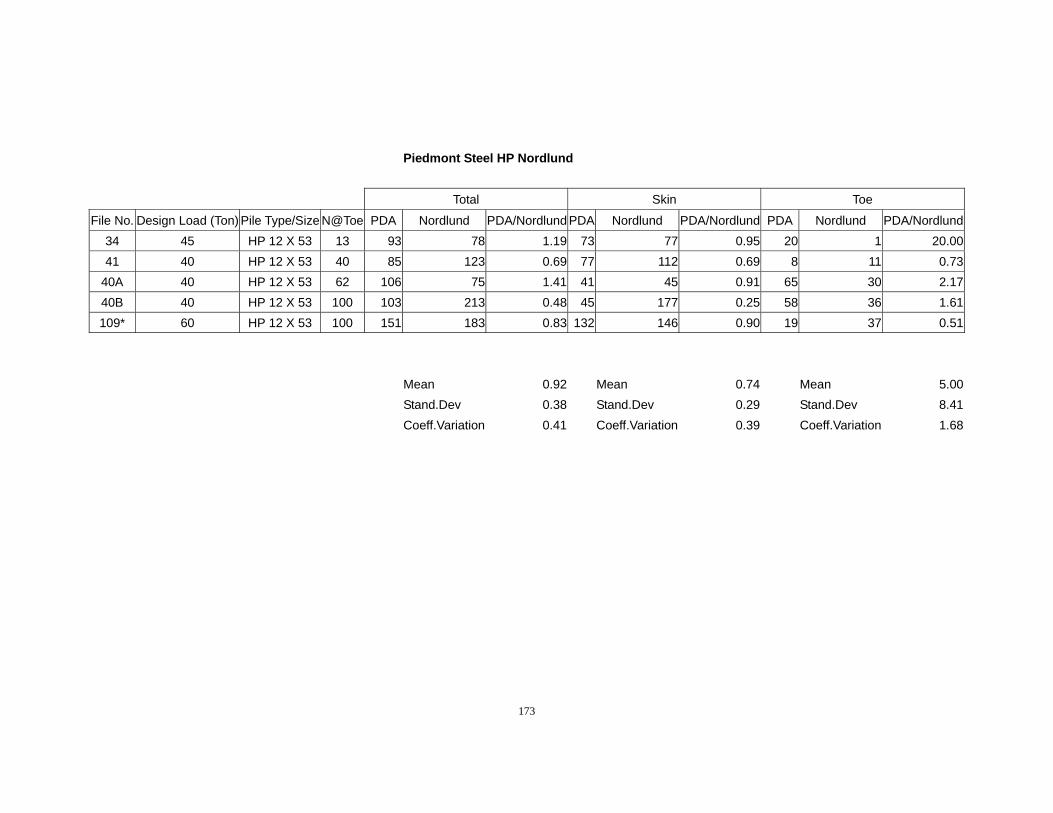
173
Piedmont Steel HP Nordlund
Total Skin Toe
File No. Design Load (Ton) Pile Type/Size N@Toe PDA Nordlund PDA/Nordlund PDA Nordlund PDA/Nordlund PDA Nordlund PDA/Nordlund34 45 HP 12 X 53 13 93 78 1.19 73 77 0.95 20 1 20.0041 40 HP 12 X 53 40 85 123 0.69 77 112 0.69 8 11 0.73
40A 40 HP 12 X 53 62 106 75 1.41 41 45 0.91 65 30 2.1740B 40 HP 12 X 53 100 103 213 0.48 45 177 0.25 58 36 1.61109* 60 HP 12 X 53 100 151 183 0.83 132 146 0.90 19 37 0.51
Mean 0.92 Mean 0.74 Mean 5.00 Stand.Dev 0.38 Stand.Dev 0.29 Stand.Dev 8.41 Coeff.Variation 0.41 Coeff.Variation 0.39 Coeff.Variation 1.68
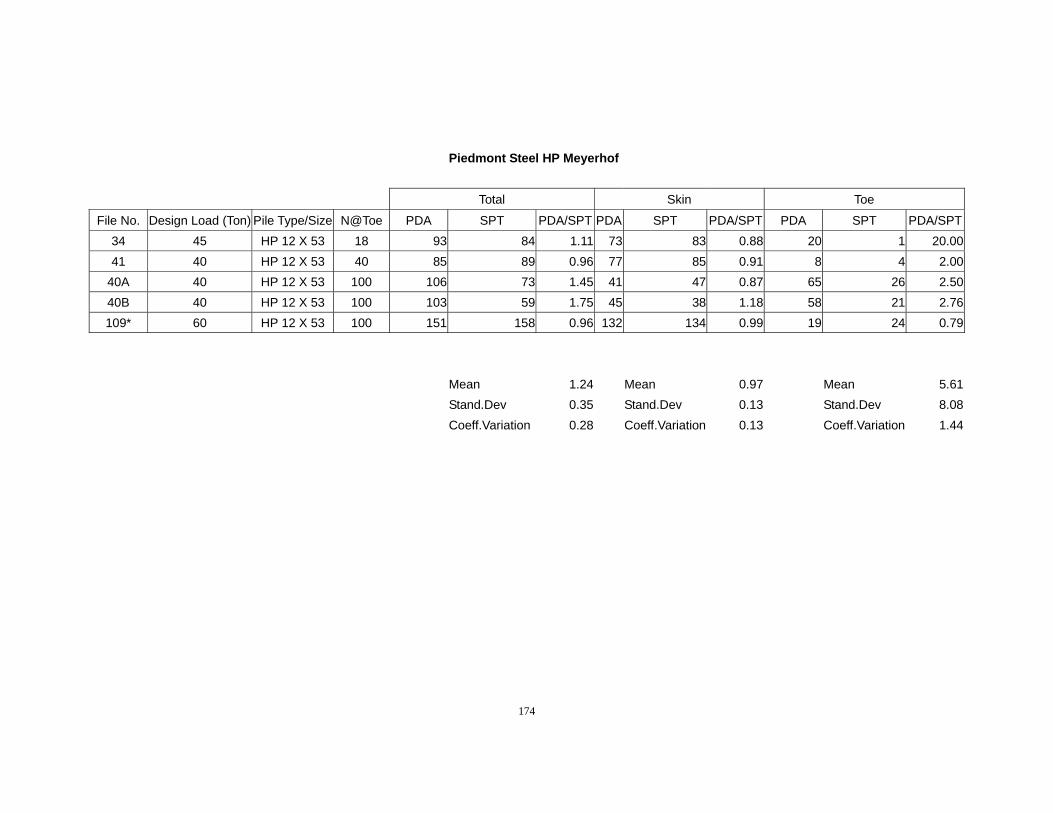
174
Piedmont Steel HP Meyerhof
Total Skin Toe
File No. Design Load (Ton) Pile Type/Size N@Toe PDA SPT PDA/SPT PDA SPT PDA/SPT PDA SPT PDA/SPT34 45 HP 12 X 53 18 93 84 1.11 73 83 0.88 20 1 20.0041 40 HP 12 X 53 40 85 89 0.96 77 85 0.91 8 4 2.00
40A 40 HP 12 X 53 100 106 73 1.45 41 47 0.87 65 26 2.5040B 40 HP 12 X 53 100 103 59 1.75 45 38 1.18 58 21 2.76109* 60 HP 12 X 53 100 151 158 0.96 132 134 0.99 19 24 0.79
Mean 1.24 Mean 0.97 Mean 5.61 Stand.Dev 0.35 Stand.Dev 0.13 Stand.Dev 8.08 Coeff.Variation 0.28 Coeff.Variation 0.13 Coeff.Variation 1.44
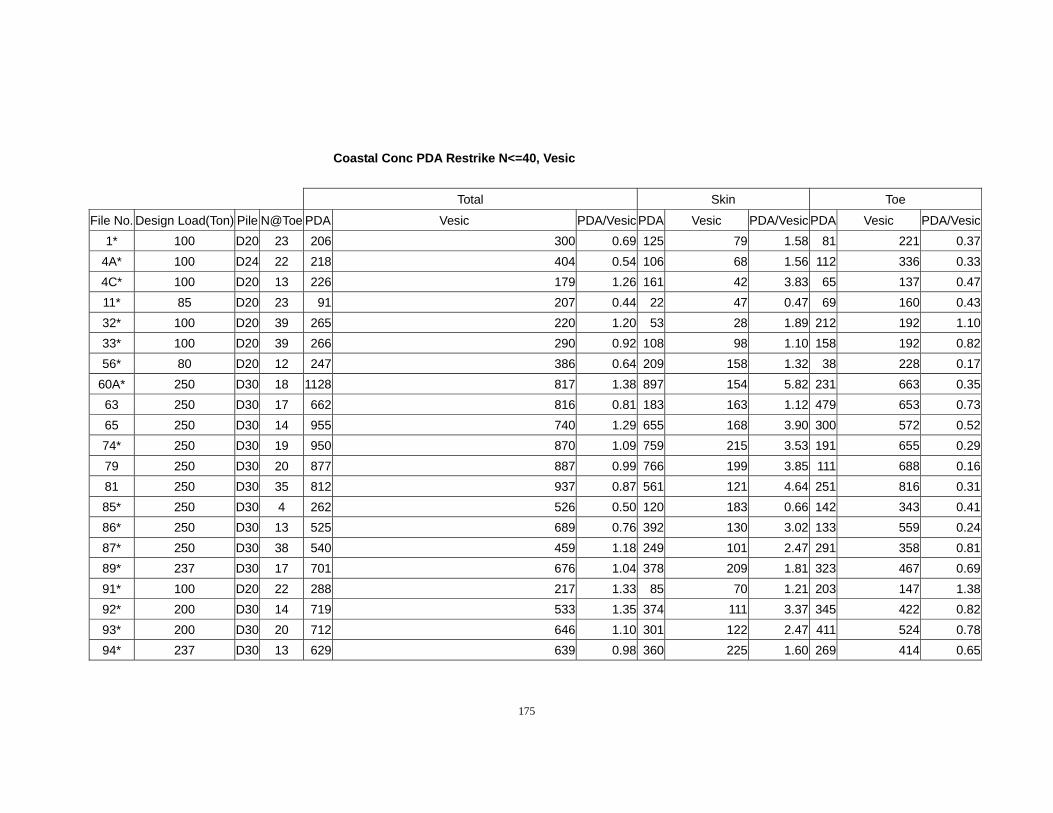
175
Coastal Conc PDA Restrike N<=40, Vesic
Total Skin Toe
File No. Design Load(Ton) Pile N@Toe PDA Vesic PDA/Vesic PDA Vesic PDA/Vesic PDA Vesic PDA/Vesic 1* 100 D20 23 206 300 0.69 125 79 1.58 81 221 0.37
4A* 100 D24 22 218 404 0.54 106 68 1.56 112 336 0.33 4C* 100 D20 13 226 179 1.26 161 42 3.83 65 137 0.47 11* 85 D20 23 91 207 0.44 22 47 0.47 69 160 0.43 32* 100 D20 39 265 220 1.20 53 28 1.89 212 192 1.10 33* 100 D20 39 266 290 0.92 108 98 1.10 158 192 0.82 56* 80 D20 12 247 386 0.64 209 158 1.32 38 228 0.17
60A* 250 D30 18 1128 817 1.38 897 154 5.82 231 663 0.35 63 250 D30 17 662 816 0.81 183 163 1.12 479 653 0.73 65 250 D30 14 955 740 1.29 655 168 3.90 300 572 0.52 74* 250 D30 19 950 870 1.09 759 215 3.53 191 655 0.29 79 250 D30 20 877 887 0.99 766 199 3.85 111 688 0.16 81 250 D30 35 812 937 0.87 561 121 4.64 251 816 0.31 85* 250 D30 4 262 526 0.50 120 183 0.66 142 343 0.41 86* 250 D30 13 525 689 0.76 392 130 3.02 133 559 0.24 87* 250 D30 38 540 459 1.18 249 101 2.47 291 358 0.81 89* 237 D30 17 701 676 1.04 378 209 1.81 323 467 0.69 91* 100 D20 22 288 217 1.33 85 70 1.21 203 147 1.38 92* 200 D30 14 719 533 1.35 374 111 3.37 345 422 0.82 93* 200 D30 20 712 646 1.10 301 122 2.47 411 524 0.78 94* 237 D30 13 629 639 0.98 360 225 1.60 269 414 0.65
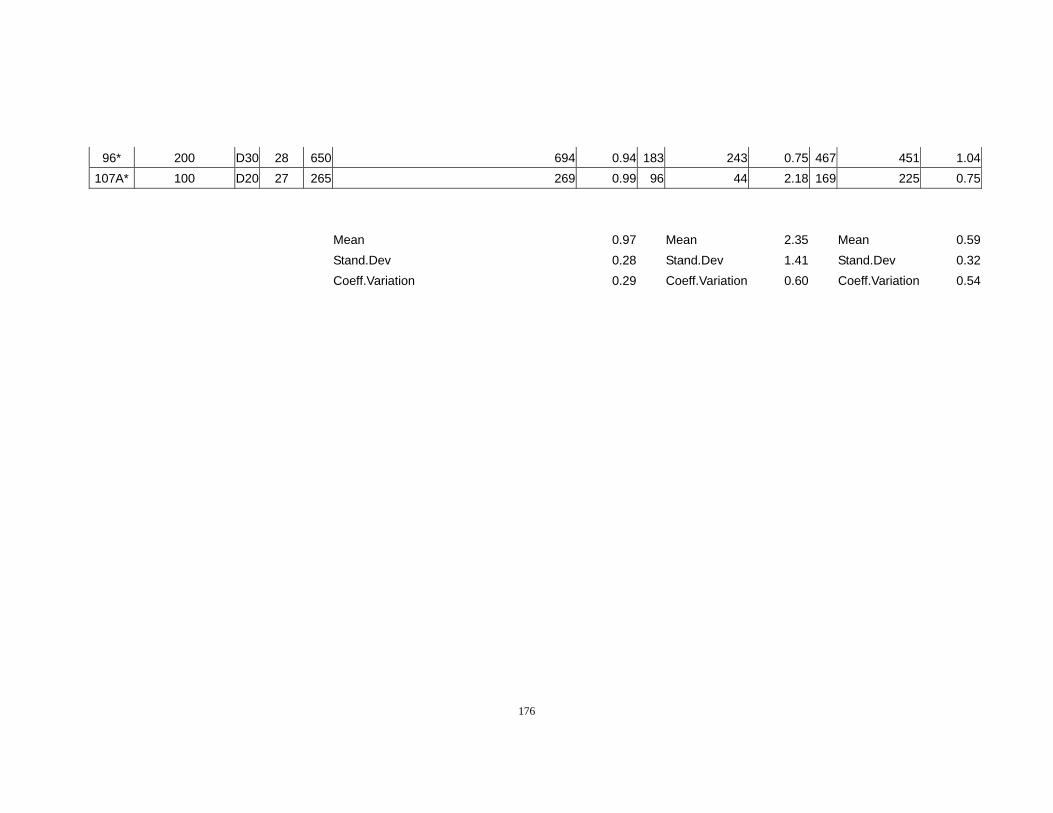
176
96* 200 D30 28 650 694 0.94 183 243 0.75 467 451 1.04 107A* 100 D20 27 265 269 0.99 96 44 2.18 169 225 0.75
Mean 0.97 Mean 2.35 Mean 0.59 Stand.Dev 0.28 Stand.Dev 1.41 Stand.Dev 0.32 Coeff.Variation 0.29 Coeff.Variation 0.60 Coeff.Variation 0.54
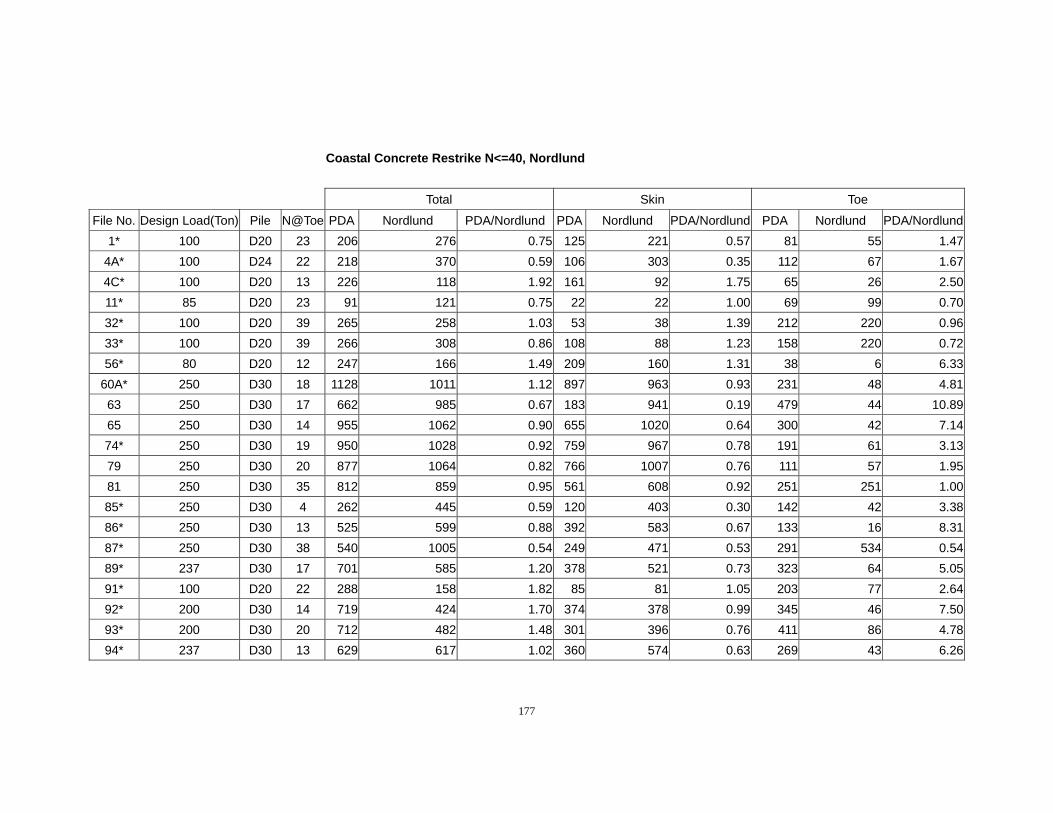
177
Coastal Concrete Restrike N<=40, Nordlund
Total Skin Toe
File No. Design Load(Ton) Pile N@Toe PDA Nordlund PDA/Nordlund PDA Nordlund PDA/Nordlund PDA Nordlund PDA/Nordlund1* 100 D20 23 206 276 0.75 125 221 0.57 81 55 1.47
4A* 100 D24 22 218 370 0.59 106 303 0.35 112 67 1.674C* 100 D20 13 226 118 1.92 161 92 1.75 65 26 2.5011* 85 D20 23 91 121 0.75 22 22 1.00 69 99 0.7032* 100 D20 39 265 258 1.03 53 38 1.39 212 220 0.9633* 100 D20 39 266 308 0.86 108 88 1.23 158 220 0.7256* 80 D20 12 247 166 1.49 209 160 1.31 38 6 6.33
60A* 250 D30 18 1128 1011 1.12 897 963 0.93 231 48 4.8163 250 D30 17 662 985 0.67 183 941 0.19 479 44 10.8965 250 D30 14 955 1062 0.90 655 1020 0.64 300 42 7.1474* 250 D30 19 950 1028 0.92 759 967 0.78 191 61 3.1379 250 D30 20 877 1064 0.82 766 1007 0.76 111 57 1.9581 250 D30 35 812 859 0.95 561 608 0.92 251 251 1.0085* 250 D30 4 262 445 0.59 120 403 0.30 142 42 3.3886* 250 D30 13 525 599 0.88 392 583 0.67 133 16 8.3187* 250 D30 38 540 1005 0.54 249 471 0.53 291 534 0.5489* 237 D30 17 701 585 1.20 378 521 0.73 323 64 5.0591* 100 D20 22 288 158 1.82 85 81 1.05 203 77 2.6492* 200 D30 14 719 424 1.70 374 378 0.99 345 46 7.5093* 200 D30 20 712 482 1.48 301 396 0.76 411 86 4.7894* 237 D30 13 629 617 1.02 360 574 0.63 269 43 6.26
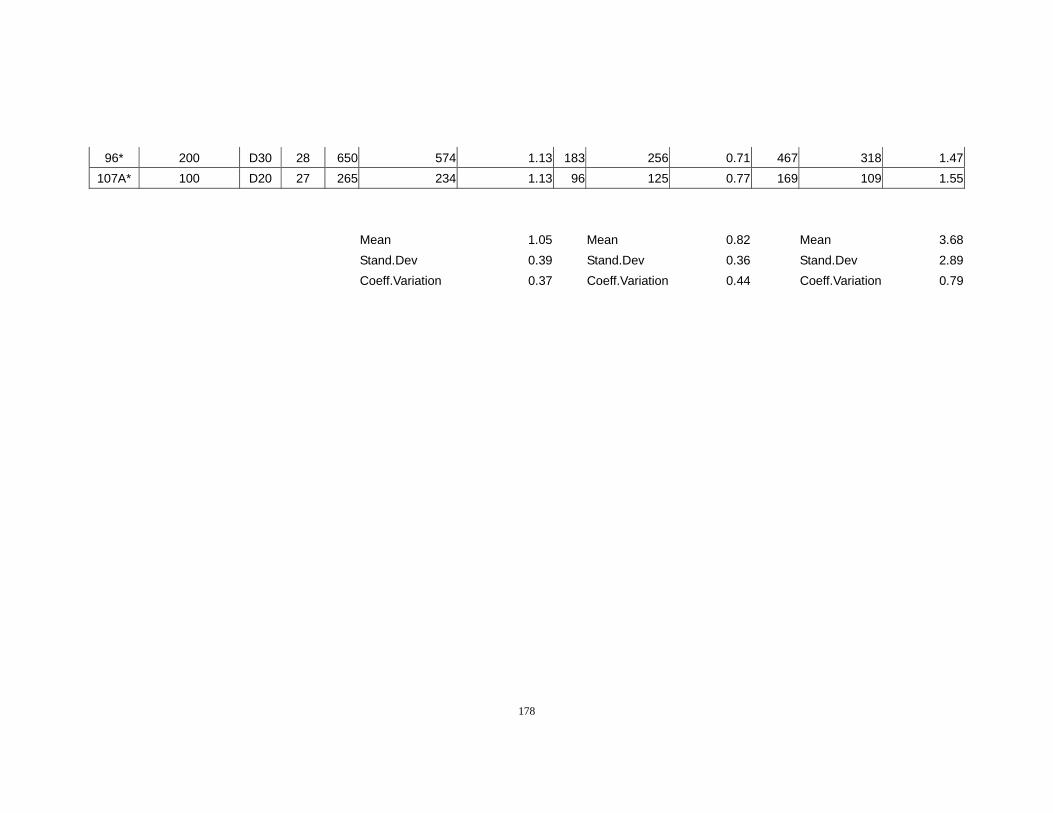
178
96* 200 D30 28 650 574 1.13 183 256 0.71 467 318 1.47107A* 100 D20 27 265 234 1.13 96 125 0.77 169 109 1.55
Mean 1.05 Mean 0.82 Mean 3.68 Stand.Dev 0.39 Stand.Dev 0.36 Stand.Dev 2.89 Coeff.Variation 0.37 Coeff.Variation 0.44 Coeff.Variation 0.79
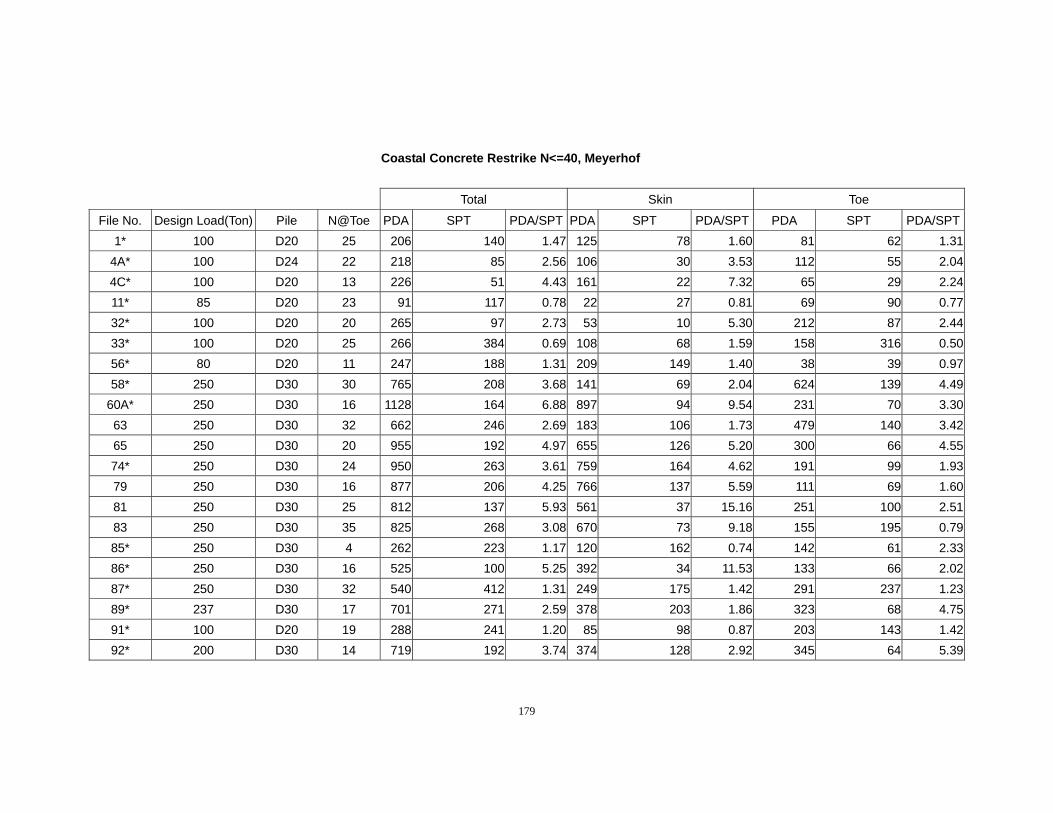
179
Coastal Concrete Restrike N<=40, Meyerhof
Total Skin Toe
File No. Design Load(Ton) Pile N@Toe PDA SPT PDA/SPT PDA SPT PDA/SPT PDA SPT PDA/SPT1* 100 D20 25 206 140 1.47 125 78 1.60 81 62 1.31
4A* 100 D24 22 218 85 2.56 106 30 3.53 112 55 2.044C* 100 D20 13 226 51 4.43 161 22 7.32 65 29 2.2411* 85 D20 23 91 117 0.78 22 27 0.81 69 90 0.7732* 100 D20 20 265 97 2.73 53 10 5.30 212 87 2.4433* 100 D20 25 266 384 0.69 108 68 1.59 158 316 0.5056* 80 D20 11 247 188 1.31 209 149 1.40 38 39 0.9758* 250 D30 30 765 208 3.68 141 69 2.04 624 139 4.49
60A* 250 D30 16 1128 164 6.88 897 94 9.54 231 70 3.3063 250 D30 32 662 246 2.69 183 106 1.73 479 140 3.4265 250 D30 20 955 192 4.97 655 126 5.20 300 66 4.5574* 250 D30 24 950 263 3.61 759 164 4.62 191 99 1.9379 250 D30 16 877 206 4.25 766 137 5.59 111 69 1.6081 250 D30 25 812 137 5.93 561 37 15.16 251 100 2.5183 250 D30 35 825 268 3.08 670 73 9.18 155 195 0.7985* 250 D30 4 262 223 1.17 120 162 0.74 142 61 2.3386* 250 D30 16 525 100 5.25 392 34 11.53 133 66 2.0287* 250 D30 32 540 412 1.31 249 175 1.42 291 237 1.2389* 237 D30 17 701 271 2.59 378 203 1.86 323 68 4.7591* 100 D20 19 288 241 1.20 85 98 0.87 203 143 1.4292* 200 D30 14 719 192 3.74 374 128 2.92 345 64 5.39
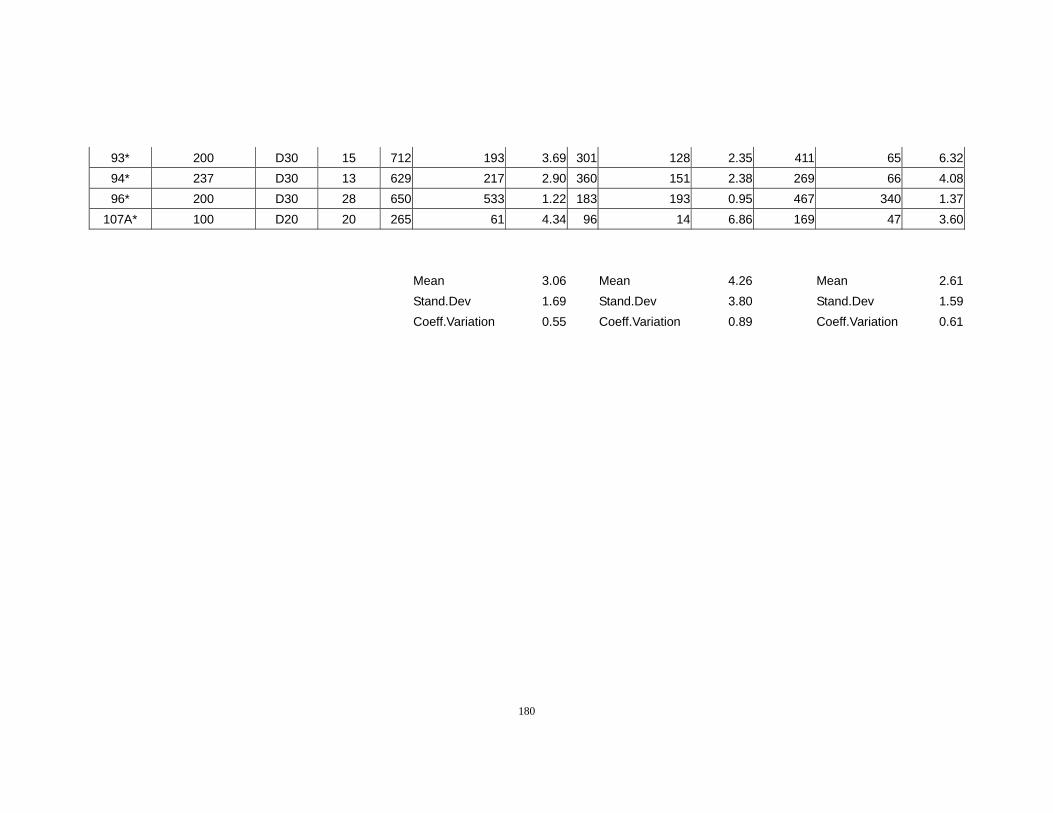
180
93* 200 D30 15 712 193 3.69 301 128 2.35 411 65 6.3294* 237 D30 13 629 217 2.90 360 151 2.38 269 66 4.0896* 200 D30 28 650 533 1.22 183 193 0.95 467 340 1.37
107A* 100 D20 20 265 61 4.34 96 14 6.86 169 47 3.60 Mean 3.06 Mean 4.26 Mean 2.61 Stand.Dev 1.69 Stand.Dev 3.80 Stand.Dev 1.59 Coeff.Variation 0.55 Coeff.Variation 0.89 Coeff.Variation 0.61
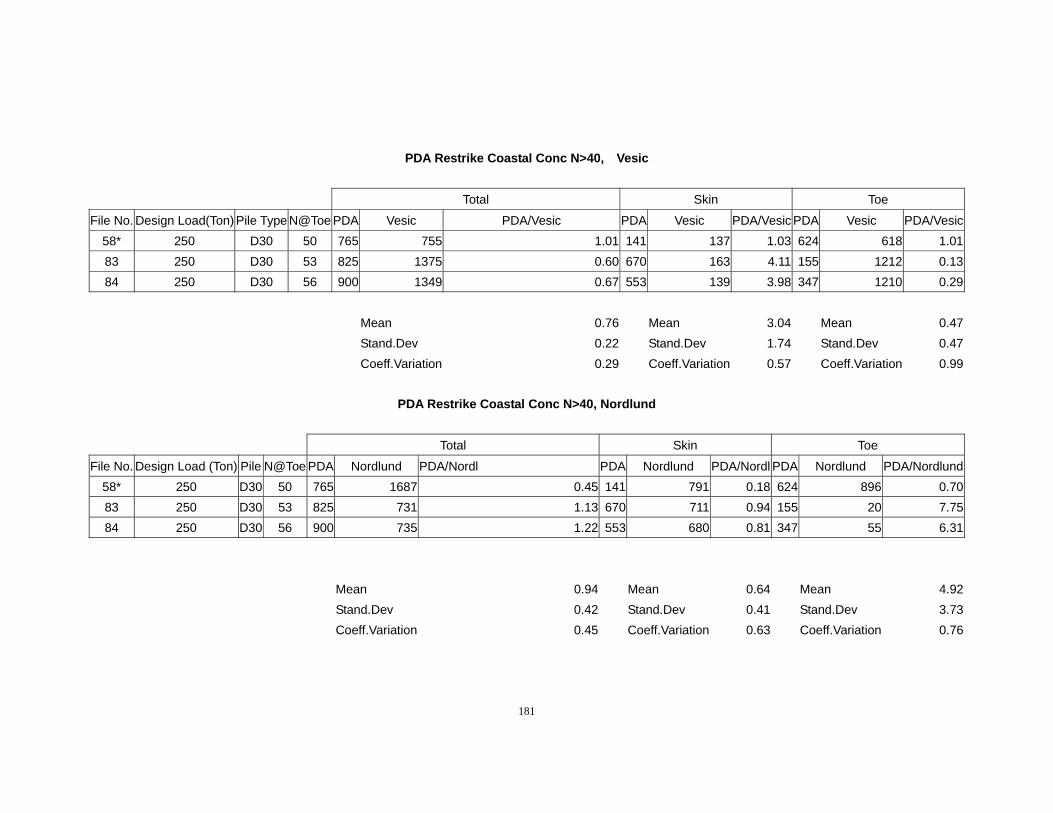
181
PDA Restrike Coastal Conc N>40, Vesic
Total Skin Toe
File No. Design Load(Ton) Pile Type N@Toe PDA Vesic PDA/Vesic PDA Vesic PDA/Vesic PDA Vesic PDA/Vesic58* 250 D30 50 765 755 1.01 141 137 1.03 624 618 1.0183 250 D30 53 825 1375 0.60 670 163 4.11 155 1212 0.1384 250 D30 56 900 1349 0.67 553 139 3.98 347 1210 0.29
Mean 0.76 Mean 3.04 Mean 0.47 Stand.Dev 0.22 Stand.Dev 1.74 Stand.Dev 0.47 Coeff.Variation 0.29 Coeff.Variation 0.57 Coeff.Variation 0.99
PDA Restrike Coastal Conc N>40, Nordlund
Total Skin Toe
File No. Design Load (Ton) Pile N@Toe PDA Nordlund PDA/Nordl PDA Nordlund PDA/Nordl PDA Nordlund PDA/Nordlund58* 250 D30 50 765 1687 0.45 141 791 0.18 624 896 0.7083 250 D30 53 825 731 1.13 670 711 0.94 155 20 7.7584 250 D30 56 900 735 1.22 553 680 0.81 347 55 6.31
Mean 0.94 Mean 0.64 Mean 4.92 Stand.Dev 0.42 Stand.Dev 0.41 Stand.Dev 3.73 Coeff.Variation 0.45 Coeff.Variation 0.63 Coeff.Variation 0.76
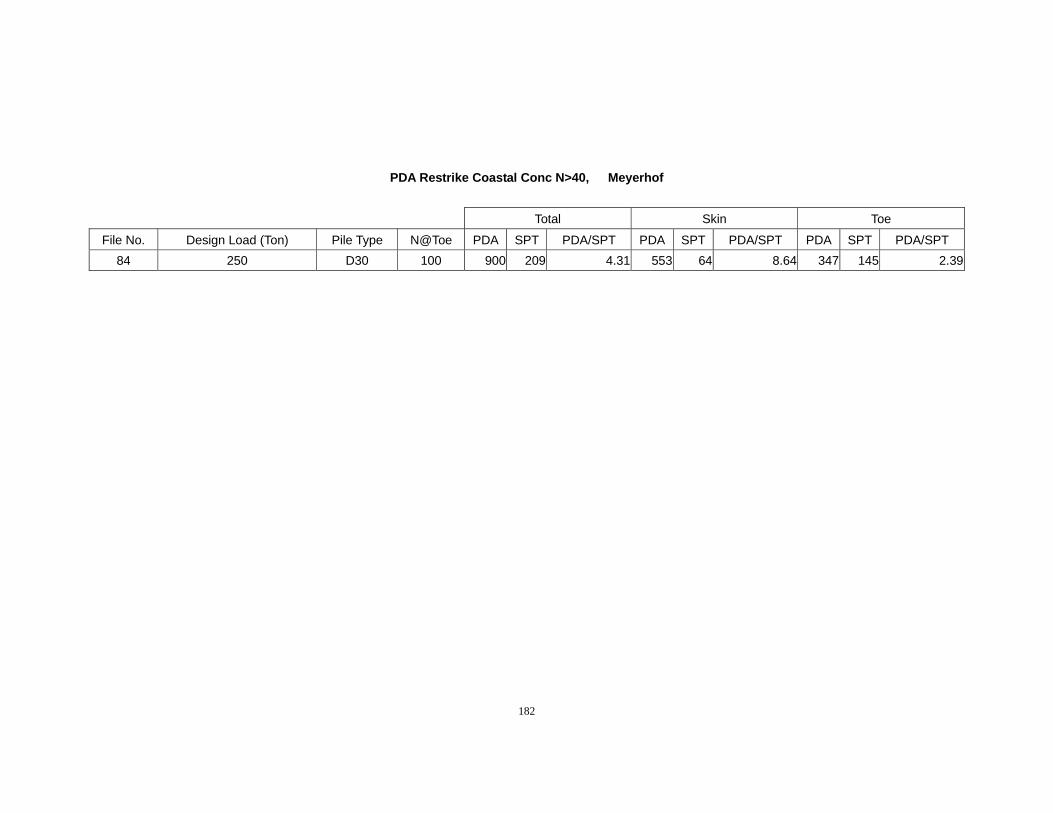
182
PDA Restrike Coastal Conc N>40, Meyerhof
Total Skin Toe
File No. Design Load (Ton) Pile Type N@Toe PDA SPT PDA/SPT PDA SPT PDA/SPT PDA SPT PDA/SPT 84 250 D30 100 900 209 4.31 553 64 8.64 347 145 2.39
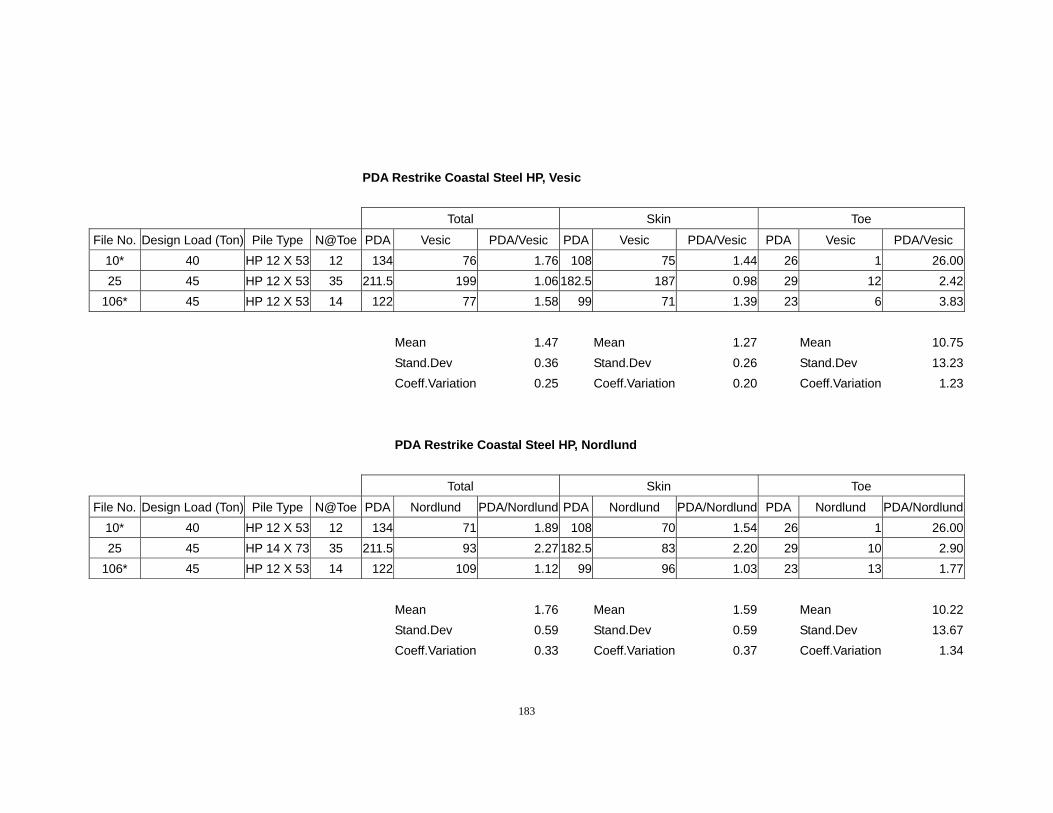
183
PDA Restrike Coastal Steel HP, Vesic
Total Skin Toe
File No. Design Load (Ton) Pile Type N@Toe PDA Vesic PDA/Vesic PDA Vesic PDA/Vesic PDA Vesic PDA/Vesic 10* 40 HP 12 X 53 12 134 76 1.76 108 75 1.44 26 1 26.0025 45 HP 12 X 53 35 211.5 199 1.06 182.5 187 0.98 29 12 2.42
106* 45 HP 12 X 53 14 122 77 1.58 99 71 1.39 23 6 3.83 Mean 1.47 Mean 1.27 Mean 10.75 Stand.Dev 0.36 Stand.Dev 0.26 Stand.Dev 13.23 Coeff.Variation 0.25 Coeff.Variation 0.20 Coeff.Variation 1.23 PDA Restrike Coastal Steel HP, Nordlund
Total Skin Toe
File No. Design Load (Ton) Pile Type N@Toe PDA Nordlund PDA/Nordlund PDA Nordlund PDA/Nordlund PDA Nordlund PDA/Nordlund10* 40 HP 12 X 53 12 134 71 1.89 108 70 1.54 26 1 26.0025 45 HP 14 X 73 35 211.5 93 2.27 182.5 83 2.20 29 10 2.90
106* 45 HP 12 X 53 14 122 109 1.12 99 96 1.03 23 13 1.77 Mean 1.76 Mean 1.59 Mean 10.22 Stand.Dev 0.59 Stand.Dev 0.59 Stand.Dev 13.67 Coeff.Variation 0.33 Coeff.Variation 0.37 Coeff.Variation 1.34
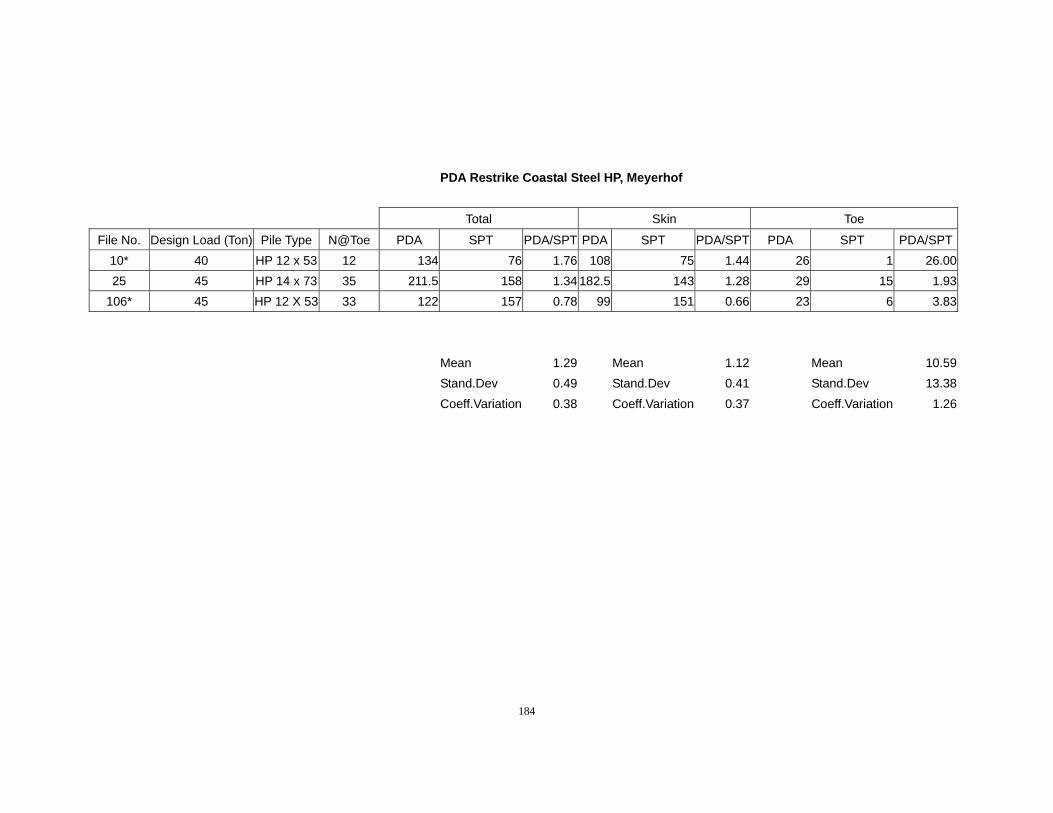
184
PDA Restrike Coastal Steel HP, Meyerhof
Total Skin Toe
File No. Design Load (Ton) Pile Type N@Toe PDA SPT PDA/SPT PDA SPT PDA/SPT PDA SPT PDA/SPT10* 40 HP 12 x 53 12 134 76 1.76 108 75 1.44 26 1 26.0025 45 HP 14 x 73 35 211.5 158 1.34 182.5 143 1.28 29 15 1.93
106* 45 HP 12 X 53 33 122 157 0.78 99 151 0.66 23 6 3.83 Mean 1.29 Mean 1.12 Mean 10.59 Stand.Dev 0.49 Stand.Dev 0.41 Stand.Dev 13.38 Coeff.Variation 0.38 Coeff.Variation 0.37 Coeff.Variation 1.26

185
PDA Restrike Coastal Steel Pipe, Vesic
Total Skin Toe
File No. Design Load (Ton) Pile Type N@Toe PDA Vesic PDA/Vesic PDA Vesic PDA/Vesic PDA Vesic PDA/Vesic124* S-D24 Pipe (OE) 14 351 194 1.57 304 166 1.51 54 28 1.93125* S-D24 Pipe (OE) 12 333 280 1.19 296 253 1.17 37 27 1.37126* S-D24 Pipe (OE) 35 434 139 3.12 401 119 3.37 33 20 1.65127* S-D24 Pipe (OE) 25 383 214 1.79 333 184 1.81 50 30 1.67129 S-D24 Pipe (OE) 56 482 319 1.51 389 263 1.48 93 56 1.66130 S-D24 Pipe (OE) 18 326 193 1.69 284 168 1.69 42 25 1.68131 S-D24 Pipe (OE) 28 380 256 1.48 269 225 1.20 111 31 3.58132 S-D24 Pipe (OE) 25 355 244 1.45 318 216 1.47 37 28 1.32133 S-D24 Pipe (OE) 35 312 175 1.78 263 141 1.87 49 34 1.44134 S-D24 Pipe (OE) 16 263 148 1.78 188 128 1.47 75 20 3.75135 S-D24 Pipe (OE) 35 390 180 2.17 271 143 1.90 119 37 3.22136 S-D24 Pipe (OE) 65 447 197 2.27 288 172 1.67 159 25 6.36137 S-D24 Pipe (OE) 25 305 180 1.69 253 156 1.62 52 24 2.17138 S-D24 Pipe (OE) 20 254 199 1.28 205 174 1.18 49 25 1.96139* 60 S-D24 Pipe (OE) 21 200 156 1.28 190 141 1.35 10 15 0.67
Mean 1.74 Mean 1.65 Mean 2.29 Stand.Dev 0.49 Stand.Dev 0.53 Stand.Dev 1.42 Coeff.Variation 0.28 Coeff.Variation 0.32 Coeff.Variation 0.62
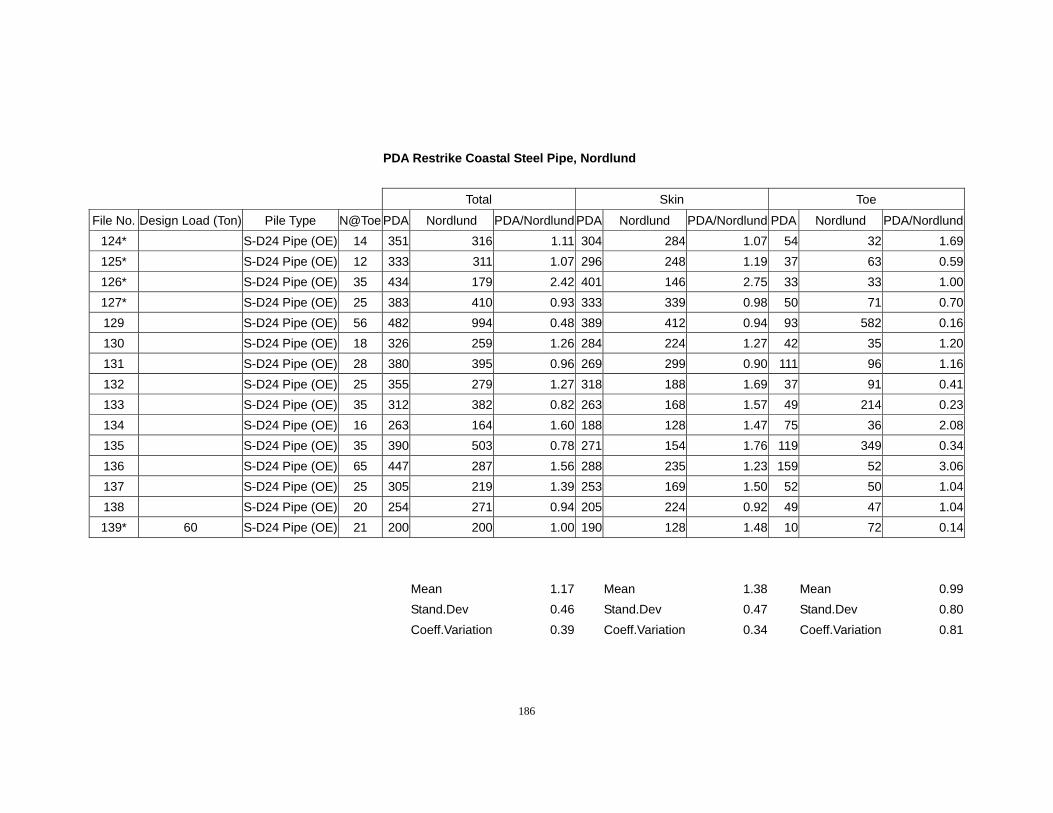
186
PDA Restrike Coastal Steel Pipe, Nordlund
Total Skin Toe
File No. Design Load (Ton) Pile Type N@Toe PDA Nordlund PDA/Nordlund PDA Nordlund PDA/Nordlund PDA Nordlund PDA/Nordlund124* S-D24 Pipe (OE) 14 351 316 1.11 304 284 1.07 54 32 1.69125* S-D24 Pipe (OE) 12 333 311 1.07 296 248 1.19 37 63 0.59126* S-D24 Pipe (OE) 35 434 179 2.42 401 146 2.75 33 33 1.00127* S-D24 Pipe (OE) 25 383 410 0.93 333 339 0.98 50 71 0.70129 S-D24 Pipe (OE) 56 482 994 0.48 389 412 0.94 93 582 0.16130 S-D24 Pipe (OE) 18 326 259 1.26 284 224 1.27 42 35 1.20131 S-D24 Pipe (OE) 28 380 395 0.96 269 299 0.90 111 96 1.16132 S-D24 Pipe (OE) 25 355 279 1.27 318 188 1.69 37 91 0.41133 S-D24 Pipe (OE) 35 312 382 0.82 263 168 1.57 49 214 0.23134 S-D24 Pipe (OE) 16 263 164 1.60 188 128 1.47 75 36 2.08135 S-D24 Pipe (OE) 35 390 503 0.78 271 154 1.76 119 349 0.34136 S-D24 Pipe (OE) 65 447 287 1.56 288 235 1.23 159 52 3.06137 S-D24 Pipe (OE) 25 305 219 1.39 253 169 1.50 52 50 1.04138 S-D24 Pipe (OE) 20 254 271 0.94 205 224 0.92 49 47 1.04139* 60 S-D24 Pipe (OE) 21 200 200 1.00 190 128 1.48 10 72 0.14
Mean 1.17 Mean 1.38 Mean 0.99 Stand.Dev 0.46 Stand.Dev 0.47 Stand.Dev 0.80 Coeff.Variation 0.39 Coeff.Variation 0.34 Coeff.Variation 0.81
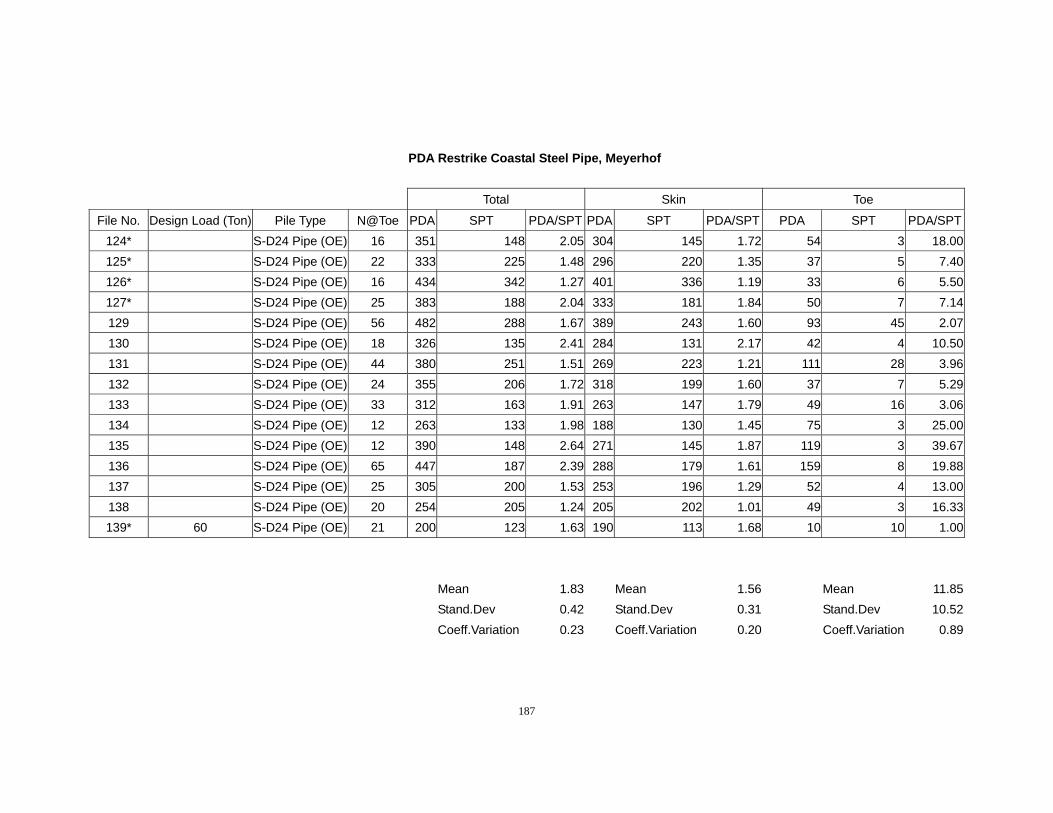
187
PDA Restrike Coastal Steel Pipe, Meyerhof
Total Skin Toe
File No. Design Load (Ton) Pile Type N@Toe PDA SPT PDA/SPT PDA SPT PDA/SPT PDA SPT PDA/SPT124* S-D24 Pipe (OE) 16 351 148 2.05 304 145 1.72 54 3 18.00125* S-D24 Pipe (OE) 22 333 225 1.48 296 220 1.35 37 5 7.40126* S-D24 Pipe (OE) 16 434 342 1.27 401 336 1.19 33 6 5.50127* S-D24 Pipe (OE) 25 383 188 2.04 333 181 1.84 50 7 7.14129 S-D24 Pipe (OE) 56 482 288 1.67 389 243 1.60 93 45 2.07130 S-D24 Pipe (OE) 18 326 135 2.41 284 131 2.17 42 4 10.50131 S-D24 Pipe (OE) 44 380 251 1.51 269 223 1.21 111 28 3.96132 S-D24 Pipe (OE) 24 355 206 1.72 318 199 1.60 37 7 5.29133 S-D24 Pipe (OE) 33 312 163 1.91 263 147 1.79 49 16 3.06134 S-D24 Pipe (OE) 12 263 133 1.98 188 130 1.45 75 3 25.00135 S-D24 Pipe (OE) 12 390 148 2.64 271 145 1.87 119 3 39.67136 S-D24 Pipe (OE) 65 447 187 2.39 288 179 1.61 159 8 19.88137 S-D24 Pipe (OE) 25 305 200 1.53 253 196 1.29 52 4 13.00138 S-D24 Pipe (OE) 20 254 205 1.24 205 202 1.01 49 3 16.33139* 60 S-D24 Pipe (OE) 21 200 123 1.63 190 113 1.68 10 10 1.00
Mean 1.83 Mean 1.56 Mean 11.85 Stand.Dev 0.42 Stand.Dev 0.31 Stand.Dev 10.52 Coeff.Variation 0.23 Coeff.Variation 0.20 Coeff.Variation 0.89
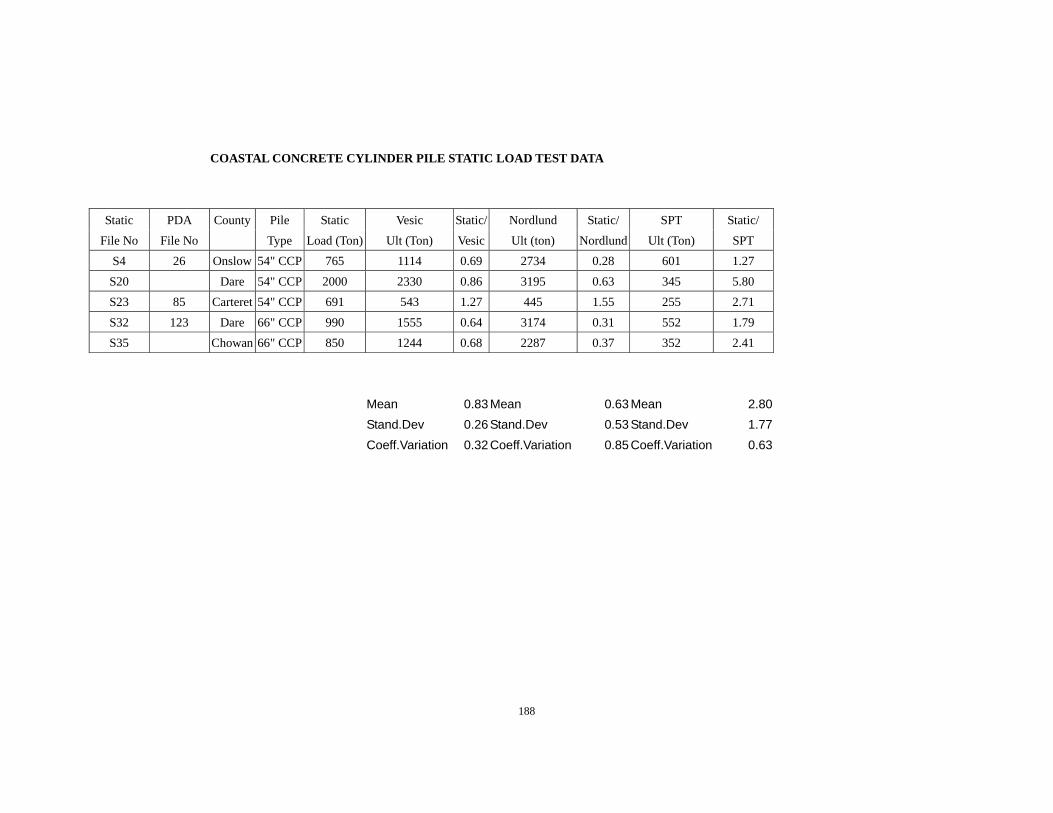
188
COASTAL CONCRETE CYLINDER PILE STATIC LOAD TEST DATA
Static PDA County Pile Static Vesic Static/ Nordlund Static/ SPT Static/ File No File No Type Load (Ton) Ult (Ton) Vesic Ult (ton) Nordlund Ult (Ton) SPT
S4 26 Onslow 54" CCP 765 1114 0.69 2734 0.28 601 1.27 S20 Dare 54" CCP 2000 2330 0.86 3195 0.63 345 5.80 S23 85 Carteret 54" CCP 691 543 1.27 445 1.55 255 2.71 S32 123 Dare 66" CCP 990 1555 0.64 3174 0.31 552 1.79 S35 Chowan 66" CCP 850 1244 0.68 2287 0.37 352 2.41
Mean 0.83 Mean 0.63 Mean 2.80 Stand.Dev 0.26 Stand.Dev 0.53 Stand.Dev 1.77 Coeff.Variation 0.32 Coeff.Variation 0.85 Coeff.Variation 0.63
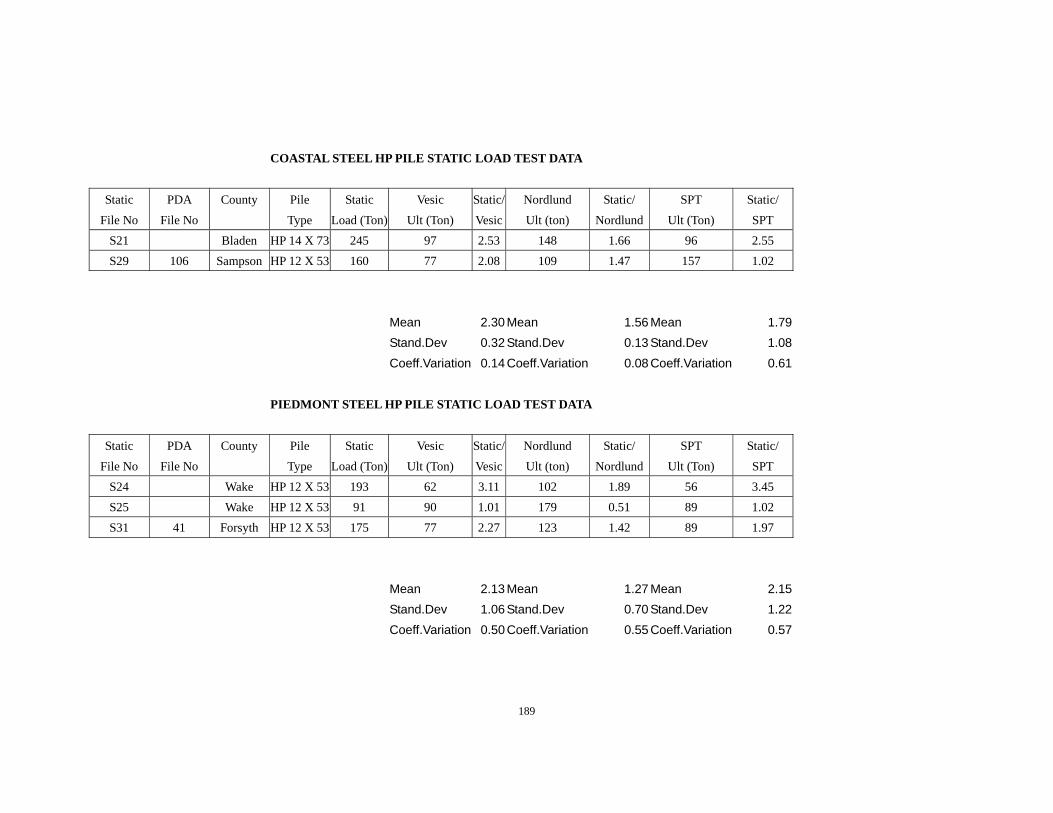
189
COASTAL STEEL HP PILE STATIC LOAD TEST DATA
Static PDA County Pile Static Vesic Static/ Nordlund Static/ SPT Static/ File No File No Type Load (Ton) Ult (Ton) Vesic Ult (ton) Nordlund Ult (Ton) SPT
S21 Bladen HP 14 X 73 245 97 2.53 148 1.66 96 2.55 S29 106 Sampson HP 12 X 53 160 77 2.08 109 1.47 157 1.02
Mean 2.30 Mean 1.56 Mean 1.79 Stand.Dev 0.32 Stand.Dev 0.13 Stand.Dev 1.08 Coeff.Variation 0.14 Coeff.Variation 0.08 Coeff.Variation 0.61 PIEDMONT STEEL HP PILE STATIC LOAD TEST DATA
Static PDA County Pile Static Vesic Static/ Nordlund Static/ SPT Static/ File No File No Type Load (Ton) Ult (Ton) Vesic Ult (ton) Nordlund Ult (Ton) SPT
S24 Wake HP 12 X 53 193 62 3.11 102 1.89 56 3.45 S25 Wake HP 12 X 53 91 90 1.01 179 0.51 89 1.02 S31 41 Forsyth HP 12 X 53 175 77 2.27 123 1.42 89 1.97
Mean 2.13 Mean 1.27 Mean 2.15 Stand.Dev 1.06 Stand.Dev 0.70 Stand.Dev 1.22 Coeff.Variation 0.50 Coeff.Variation 0.55 Coeff.Variation 0.57
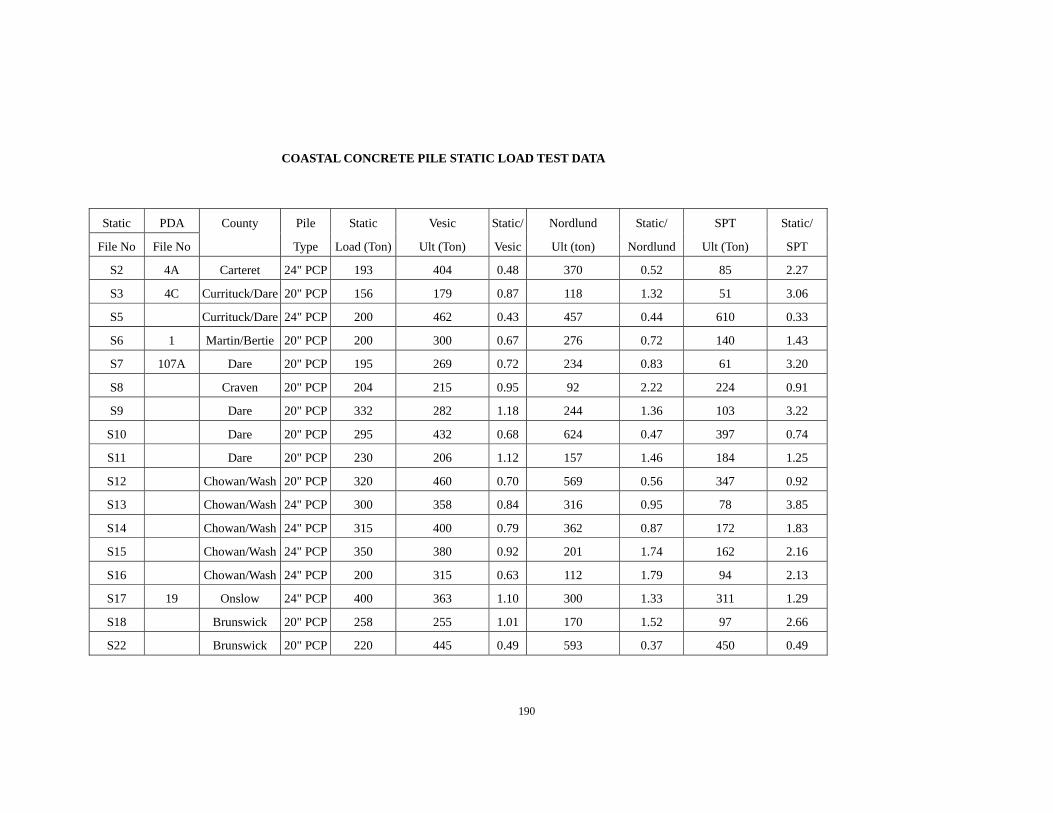
190
COASTAL CONCRETE PILE STATIC LOAD TEST DATA
Static PDA County Pile Static Vesic Static/ Nordlund Static/ SPT Static/
File No File No Type Load (Ton) Ult (Ton) Vesic Ult (ton) Nordlund Ult (Ton) SPT
S2 4A Carteret 24" PCP 193 404 0.48 370 0.52 85 2.27
S3 4C Currituck/Dare 20" PCP 156 179 0.87 118 1.32 51 3.06
S5 Currituck/Dare 24" PCP 200 462 0.43 457 0.44 610 0.33
S6 1 Martin/Bertie 20" PCP 200 300 0.67 276 0.72 140 1.43
S7 107A Dare 20" PCP 195 269 0.72 234 0.83 61 3.20
S8 Craven 20" PCP 204 215 0.95 92 2.22 224 0.91
S9 Dare 20" PCP 332 282 1.18 244 1.36 103 3.22
S10 Dare 20" PCP 295 432 0.68 624 0.47 397 0.74
S11 Dare 20" PCP 230 206 1.12 157 1.46 184 1.25
S12 Chowan/Wash 20" PCP 320 460 0.70 569 0.56 347 0.92
S13 Chowan/Wash 24" PCP 300 358 0.84 316 0.95 78 3.85
S14 Chowan/Wash 24" PCP 315 400 0.79 362 0.87 172 1.83
S15 Chowan/Wash 24" PCP 350 380 0.92 201 1.74 162 2.16
S16 Chowan/Wash 24" PCP 200 315 0.63 112 1.79 94 2.13
S17 19 Onslow 24" PCP 400 363 1.10 300 1.33 311 1.29
S18 Brunswick 20" PCP 258 255 1.01 170 1.52 97 2.66
S22 Brunswick 20" PCP 220 445 0.49 593 0.37 450 0.49
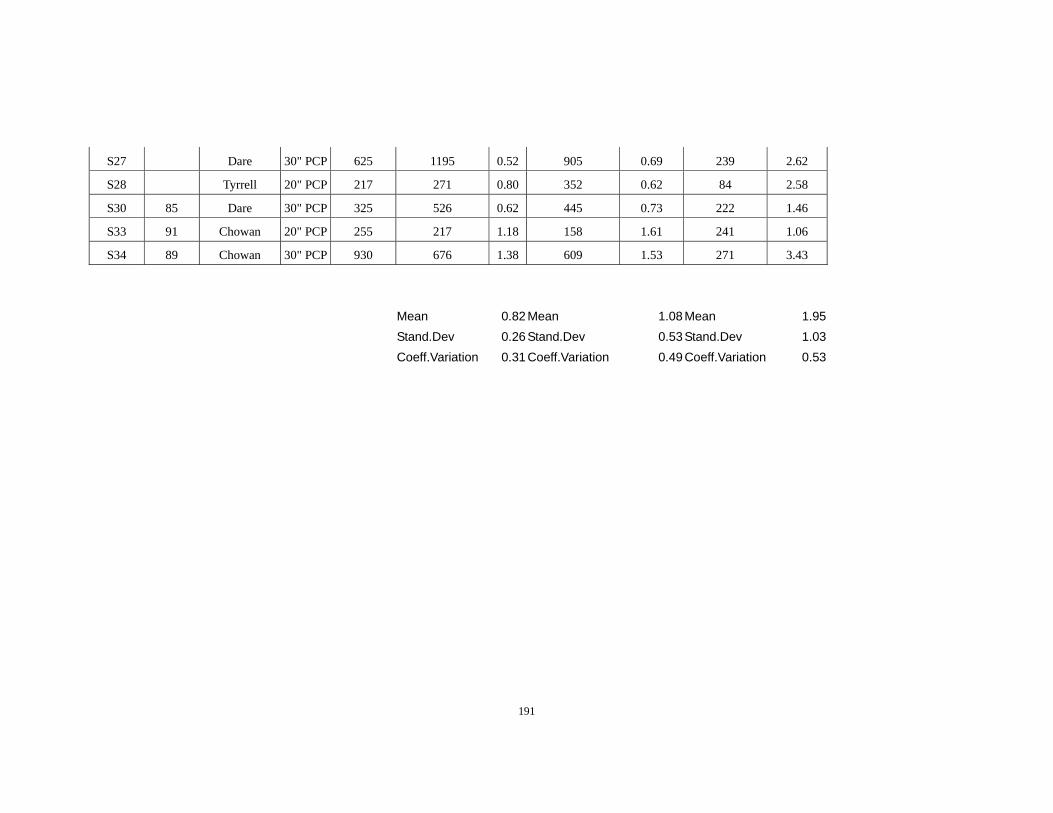
191
S27 Dare 30" PCP 625 1195 0.52 905 0.69 239 2.62
S28 Tyrrell 20" PCP 217 271 0.80 352 0.62 84 2.58
S30 85 Dare 30" PCP 325 526 0.62 445 0.73 222 1.46
S33 91 Chowan 20" PCP 255 217 1.18 158 1.61 241 1.06
S34 89 Chowan 30" PCP 930 676 1.38 609 1.53 271 3.43
Mean 0.82 Mean 1.08 Mean 1.95 Stand.Dev 0.26 Stand.Dev 0.53 Stand.Dev 1.03 Coeff.Variation 0.31 Coeff.Variation 0.49 Coeff.Variation 0.53
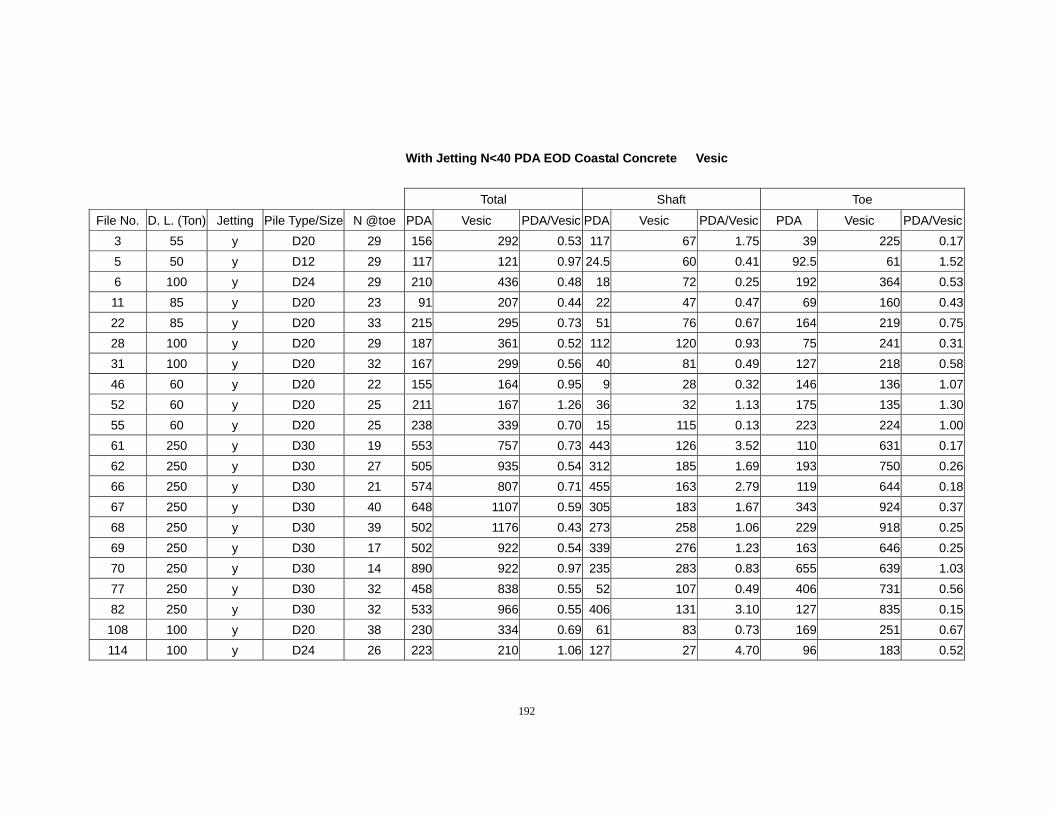
192
With Jetting N<40 PDA EOD Coastal Concrete Vesic
Total Shaft Toe
File No. D. L. (Ton) Jetting Pile Type/Size N @toe PDA Vesic PDA/Vesic PDA Vesic PDA/Vesic PDA Vesic PDA/Vesic3 55 y D20 29 156 292 0.53 117 67 1.75 39 225 0.175 50 y D12 29 117 121 0.97 24.5 60 0.41 92.5 61 1.526 100 y D24 29 210 436 0.48 18 72 0.25 192 364 0.5311 85 y D20 23 91 207 0.44 22 47 0.47 69 160 0.4322 85 y D20 33 215 295 0.73 51 76 0.67 164 219 0.7528 100 y D20 29 187 361 0.52 112 120 0.93 75 241 0.3131 100 y D20 32 167 299 0.56 40 81 0.49 127 218 0.5846 60 y D20 22 155 164 0.95 9 28 0.32 146 136 1.0752 60 y D20 25 211 167 1.26 36 32 1.13 175 135 1.3055 60 y D20 25 238 339 0.70 15 115 0.13 223 224 1.0061 250 y D30 19 553 757 0.73 443 126 3.52 110 631 0.1762 250 y D30 27 505 935 0.54 312 185 1.69 193 750 0.2666 250 y D30 21 574 807 0.71 455 163 2.79 119 644 0.1867 250 y D30 40 648 1107 0.59 305 183 1.67 343 924 0.3768 250 y D30 39 502 1176 0.43 273 258 1.06 229 918 0.2569 250 y D30 17 502 922 0.54 339 276 1.23 163 646 0.2570 250 y D30 14 890 922 0.97 235 283 0.83 655 639 1.0377 250 y D30 32 458 838 0.55 52 107 0.49 406 731 0.5682 250 y D30 32 533 966 0.55 406 131 3.10 127 835 0.15
108 100 y D20 38 230 334 0.69 61 83 0.73 169 251 0.67114 100 y D24 26 223 210 1.06 127 27 4.70 96 183 0.52
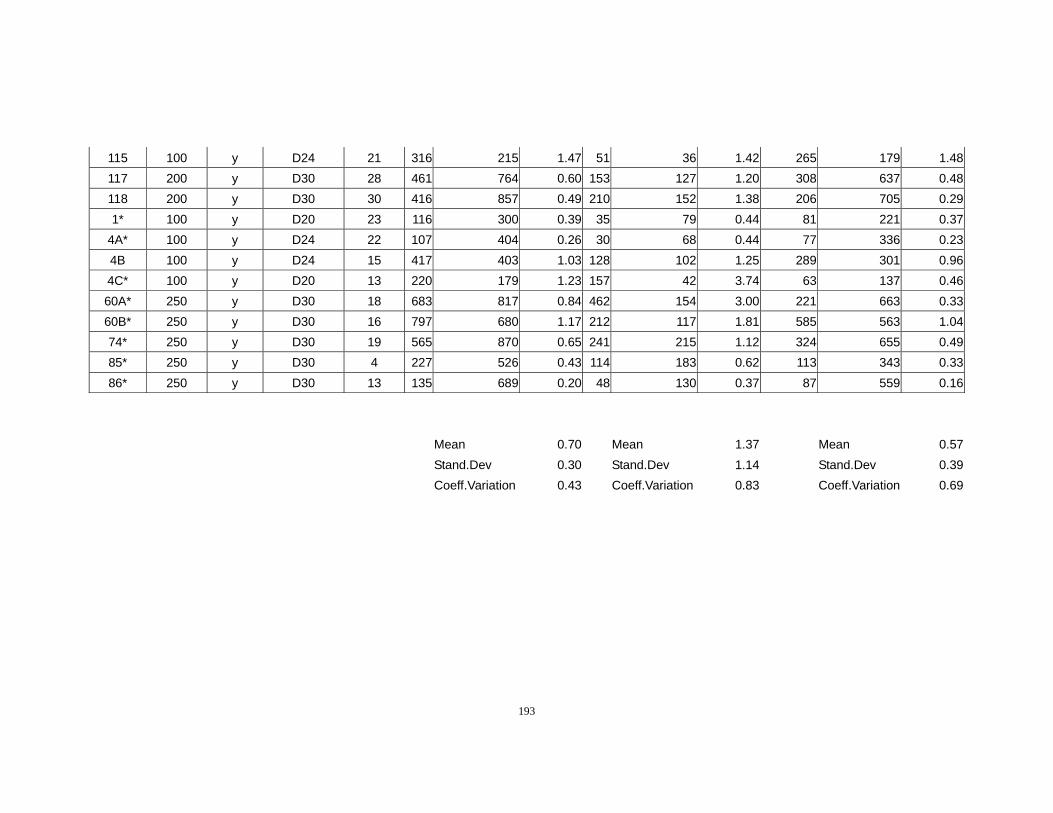
193
115 100 y D24 21 316 215 1.47 51 36 1.42 265 179 1.48117 200 y D30 28 461 764 0.60 153 127 1.20 308 637 0.48118 200 y D30 30 416 857 0.49 210 152 1.38 206 705 0.291* 100 y D20 23 116 300 0.39 35 79 0.44 81 221 0.37
4A* 100 y D24 22 107 404 0.26 30 68 0.44 77 336 0.234B 100 y D24 15 417 403 1.03 128 102 1.25 289 301 0.964C* 100 y D20 13 220 179 1.23 157 42 3.74 63 137 0.4660A* 250 y D30 18 683 817 0.84 462 154 3.00 221 663 0.3360B* 250 y D30 16 797 680 1.17 212 117 1.81 585 563 1.0474* 250 y D30 19 565 870 0.65 241 215 1.12 324 655 0.4985* 250 y D30 4 227 526 0.43 114 183 0.62 113 343 0.3386* 250 y D30 13 135 689 0.20 48 130 0.37 87 559 0.16
Mean 0.70 Mean 1.37 Mean 0.57 Stand.Dev 0.30 Stand.Dev 1.14 Stand.Dev 0.39 Coeff.Variation 0.43 Coeff.Variation 0.83 Coeff.Variation 0.69
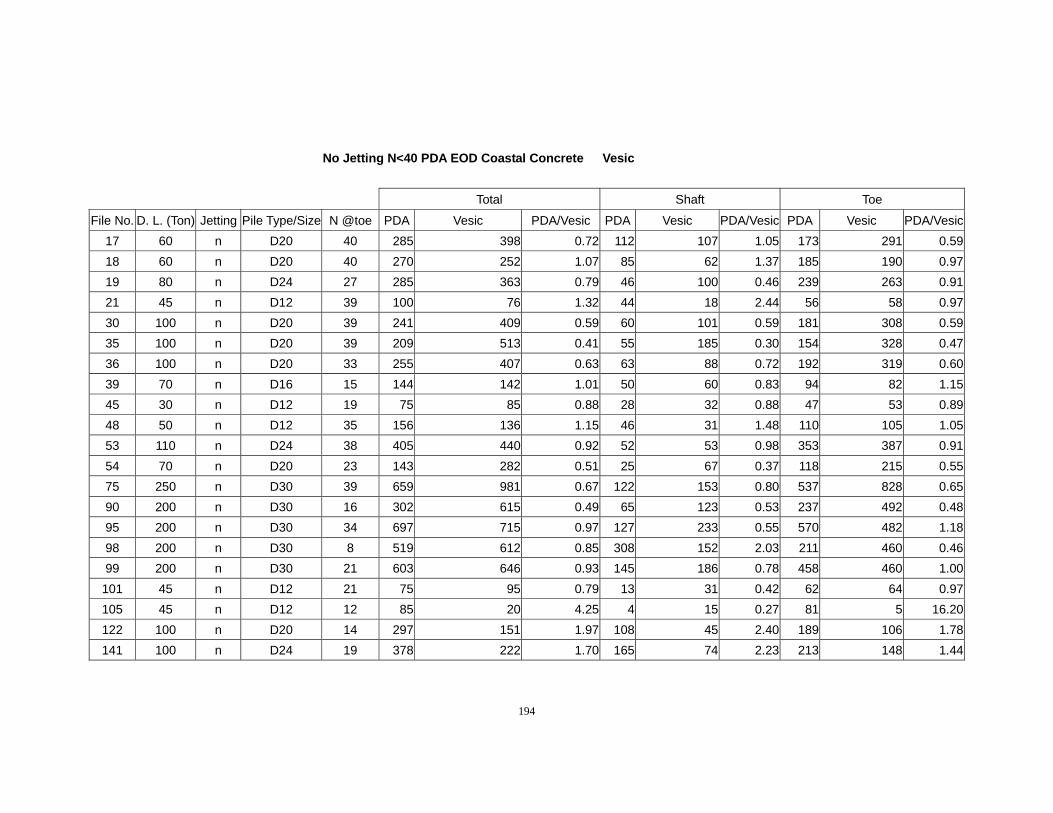
194
No Jetting N<40 PDA EOD Coastal Concrete Vesic
Total Shaft Toe
File No. D. L. (Ton) Jetting Pile Type/Size N @toe PDA Vesic PDA/Vesic PDA Vesic PDA/Vesic PDA Vesic PDA/Vesic17 60 n D20 40 285 398 0.72 112 107 1.05 173 291 0.5918 60 n D20 40 270 252 1.07 85 62 1.37 185 190 0.9719 80 n D24 27 285 363 0.79 46 100 0.46 239 263 0.9121 45 n D12 39 100 76 1.32 44 18 2.44 56 58 0.9730 100 n D20 39 241 409 0.59 60 101 0.59 181 308 0.5935 100 n D20 39 209 513 0.41 55 185 0.30 154 328 0.4736 100 n D20 33 255 407 0.63 63 88 0.72 192 319 0.6039 70 n D16 15 144 142 1.01 50 60 0.83 94 82 1.1545 30 n D12 19 75 85 0.88 28 32 0.88 47 53 0.8948 50 n D12 35 156 136 1.15 46 31 1.48 110 105 1.0553 110 n D24 38 405 440 0.92 52 53 0.98 353 387 0.9154 70 n D20 23 143 282 0.51 25 67 0.37 118 215 0.5575 250 n D30 39 659 981 0.67 122 153 0.80 537 828 0.6590 200 n D30 16 302 615 0.49 65 123 0.53 237 492 0.4895 200 n D30 34 697 715 0.97 127 233 0.55 570 482 1.1898 200 n D30 8 519 612 0.85 308 152 2.03 211 460 0.4699 200 n D30 21 603 646 0.93 145 186 0.78 458 460 1.00
101 45 n D12 21 75 95 0.79 13 31 0.42 62 64 0.97105 45 n D12 12 85 20 4.25 4 15 0.27 81 5 16.20122 100 n D20 14 297 151 1.97 108 45 2.40 189 106 1.78141 100 n D24 19 378 222 1.70 165 74 2.23 213 148 1.44
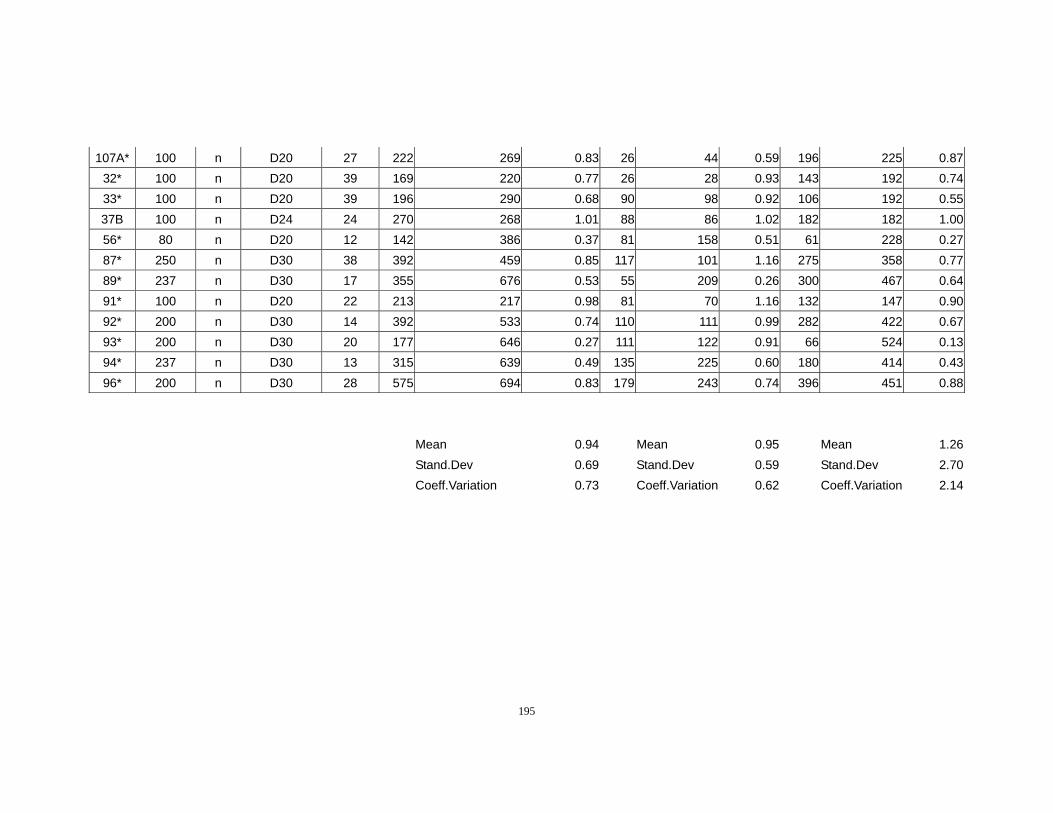
195
107A* 100 n D20 27 222 269 0.83 26 44 0.59 196 225 0.8732* 100 n D20 39 169 220 0.77 26 28 0.93 143 192 0.7433* 100 n D20 39 196 290 0.68 90 98 0.92 106 192 0.5537B 100 n D24 24 270 268 1.01 88 86 1.02 182 182 1.0056* 80 n D20 12 142 386 0.37 81 158 0.51 61 228 0.2787* 250 n D30 38 392 459 0.85 117 101 1.16 275 358 0.7789* 237 n D30 17 355 676 0.53 55 209 0.26 300 467 0.6491* 100 n D20 22 213 217 0.98 81 70 1.16 132 147 0.9092* 200 n D30 14 392 533 0.74 110 111 0.99 282 422 0.6793* 200 n D30 20 177 646 0.27 111 122 0.91 66 524 0.1394* 237 n D30 13 315 639 0.49 135 225 0.60 180 414 0.4396* 200 n D30 28 575 694 0.83 179 243 0.74 396 451 0.88
Mean 0.94 Mean 0.95 Mean 1.26 Stand.Dev 0.69 Stand.Dev 0.59 Stand.Dev 2.70 Coeff.Variation 0.73 Coeff.Variation 0.62 Coeff.Variation 2.14
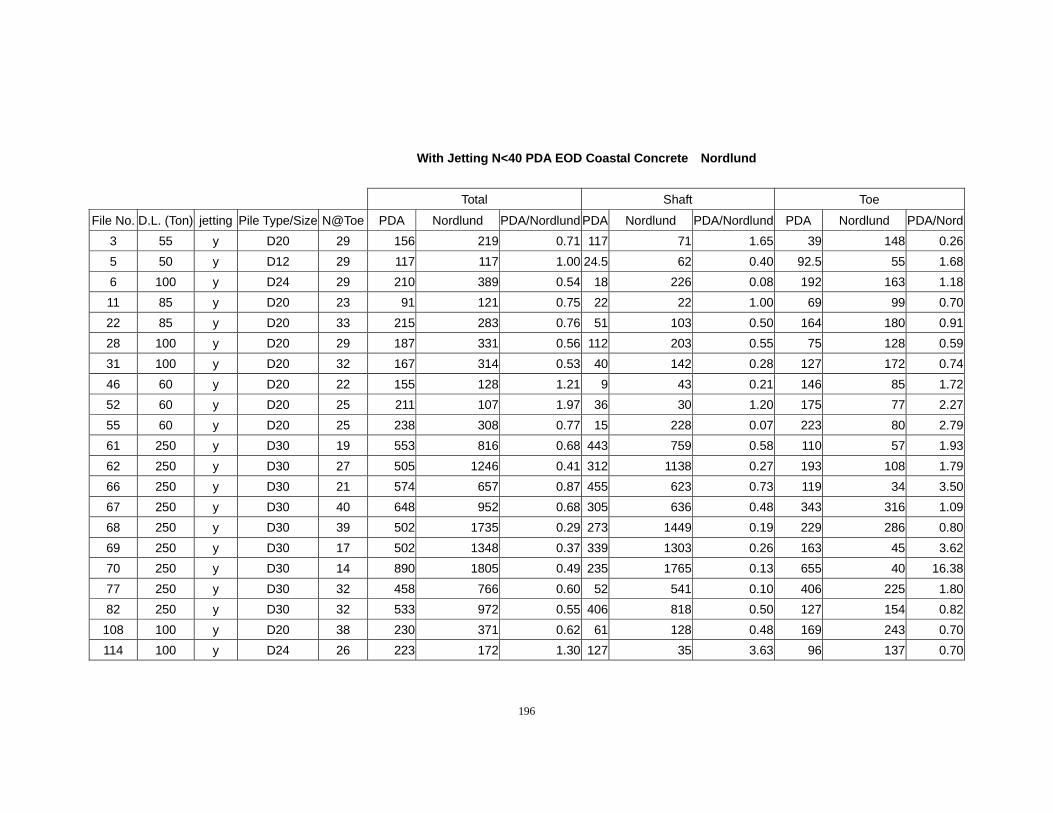
196
With Jetting N<40 PDA EOD Coastal Concrete Nordlund
Total Shaft Toe
File No. D.L. (Ton) jetting Pile Type/Size N@Toe PDA Nordlund PDA/Nordlund PDA Nordlund PDA/Nordlund PDA Nordlund PDA/Nord3 55 y D20 29 156 219 0.71 117 71 1.65 39 148 0.265 50 y D12 29 117 117 1.00 24.5 62 0.40 92.5 55 1.686 100 y D24 29 210 389 0.54 18 226 0.08 192 163 1.1811 85 y D20 23 91 121 0.75 22 22 1.00 69 99 0.7022 85 y D20 33 215 283 0.76 51 103 0.50 164 180 0.9128 100 y D20 29 187 331 0.56 112 203 0.55 75 128 0.5931 100 y D20 32 167 314 0.53 40 142 0.28 127 172 0.7446 60 y D20 22 155 128 1.21 9 43 0.21 146 85 1.7252 60 y D20 25 211 107 1.97 36 30 1.20 175 77 2.2755 60 y D20 25 238 308 0.77 15 228 0.07 223 80 2.7961 250 y D30 19 553 816 0.68 443 759 0.58 110 57 1.9362 250 y D30 27 505 1246 0.41 312 1138 0.27 193 108 1.7966 250 y D30 21 574 657 0.87 455 623 0.73 119 34 3.5067 250 y D30 40 648 952 0.68 305 636 0.48 343 316 1.0968 250 y D30 39 502 1735 0.29 273 1449 0.19 229 286 0.8069 250 y D30 17 502 1348 0.37 339 1303 0.26 163 45 3.6270 250 y D30 14 890 1805 0.49 235 1765 0.13 655 40 16.3877 250 y D30 32 458 766 0.60 52 541 0.10 406 225 1.8082 250 y D30 32 533 972 0.55 406 818 0.50 127 154 0.82
108 100 y D20 38 230 371 0.62 61 128 0.48 169 243 0.70114 100 y D24 26 223 172 1.30 127 35 3.63 96 137 0.70
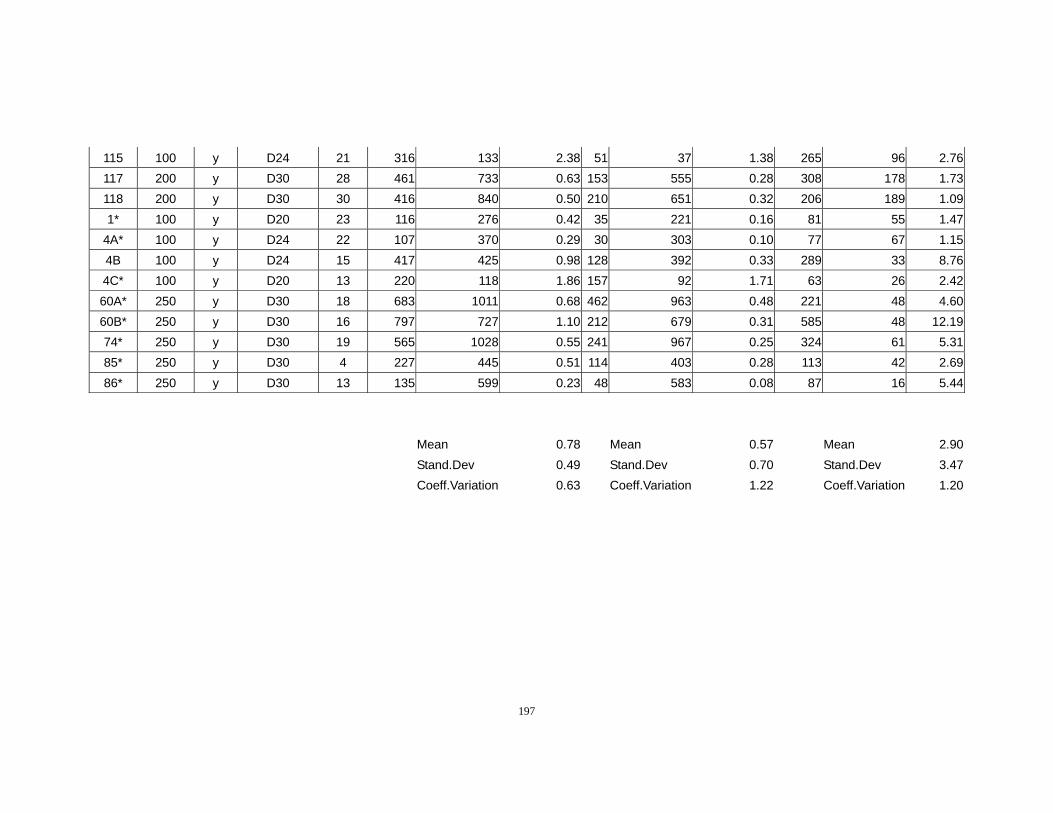
197
115 100 y D24 21 316 133 2.38 51 37 1.38 265 96 2.76117 200 y D30 28 461 733 0.63 153 555 0.28 308 178 1.73118 200 y D30 30 416 840 0.50 210 651 0.32 206 189 1.091* 100 y D20 23 116 276 0.42 35 221 0.16 81 55 1.47
4A* 100 y D24 22 107 370 0.29 30 303 0.10 77 67 1.154B 100 y D24 15 417 425 0.98 128 392 0.33 289 33 8.764C* 100 y D20 13 220 118 1.86 157 92 1.71 63 26 2.4260A* 250 y D30 18 683 1011 0.68 462 963 0.48 221 48 4.6060B* 250 y D30 16 797 727 1.10 212 679 0.31 585 48 12.1974* 250 y D30 19 565 1028 0.55 241 967 0.25 324 61 5.3185* 250 y D30 4 227 445 0.51 114 403 0.28 113 42 2.6986* 250 y D30 13 135 599 0.23 48 583 0.08 87 16 5.44
Mean 0.78 Mean 0.57 Mean 2.90 Stand.Dev 0.49 Stand.Dev 0.70 Stand.Dev 3.47 Coeff.Variation 0.63 Coeff.Variation 1.22 Coeff.Variation 1.20
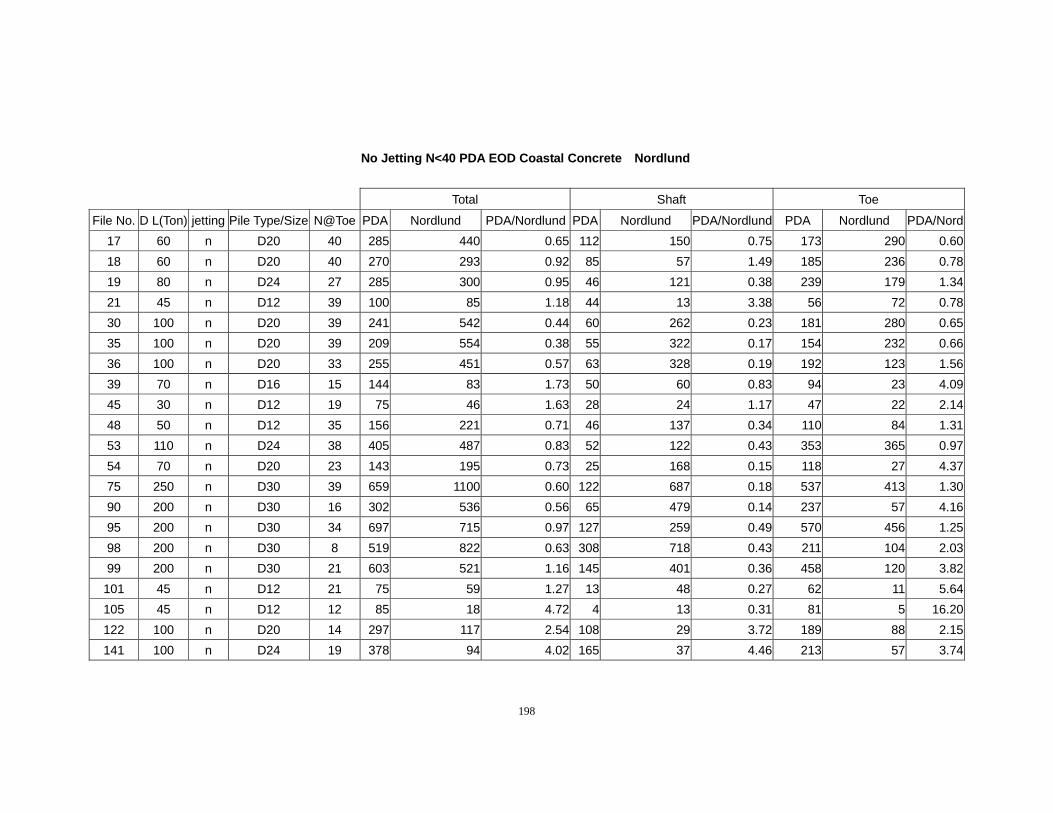
198
No Jetting N<40 PDA EOD Coastal Concrete Nordlund
Total Shaft Toe
File No. D L(Ton) jetting Pile Type/Size N@Toe PDA Nordlund PDA/Nordlund PDA Nordlund PDA/Nordlund PDA Nordlund PDA/Nord17 60 n D20 40 285 440 0.65 112 150 0.75 173 290 0.6018 60 n D20 40 270 293 0.92 85 57 1.49 185 236 0.7819 80 n D24 27 285 300 0.95 46 121 0.38 239 179 1.3421 45 n D12 39 100 85 1.18 44 13 3.38 56 72 0.7830 100 n D20 39 241 542 0.44 60 262 0.23 181 280 0.6535 100 n D20 39 209 554 0.38 55 322 0.17 154 232 0.6636 100 n D20 33 255 451 0.57 63 328 0.19 192 123 1.5639 70 n D16 15 144 83 1.73 50 60 0.83 94 23 4.0945 30 n D12 19 75 46 1.63 28 24 1.17 47 22 2.1448 50 n D12 35 156 221 0.71 46 137 0.34 110 84 1.3153 110 n D24 38 405 487 0.83 52 122 0.43 353 365 0.9754 70 n D20 23 143 195 0.73 25 168 0.15 118 27 4.3775 250 n D30 39 659 1100 0.60 122 687 0.18 537 413 1.3090 200 n D30 16 302 536 0.56 65 479 0.14 237 57 4.1695 200 n D30 34 697 715 0.97 127 259 0.49 570 456 1.2598 200 n D30 8 519 822 0.63 308 718 0.43 211 104 2.0399 200 n D30 21 603 521 1.16 145 401 0.36 458 120 3.82
101 45 n D12 21 75 59 1.27 13 48 0.27 62 11 5.64105 45 n D12 12 85 18 4.72 4 13 0.31 81 5 16.20122 100 n D20 14 297 117 2.54 108 29 3.72 189 88 2.15141 100 n D24 19 378 94 4.02 165 37 4.46 213 57 3.74
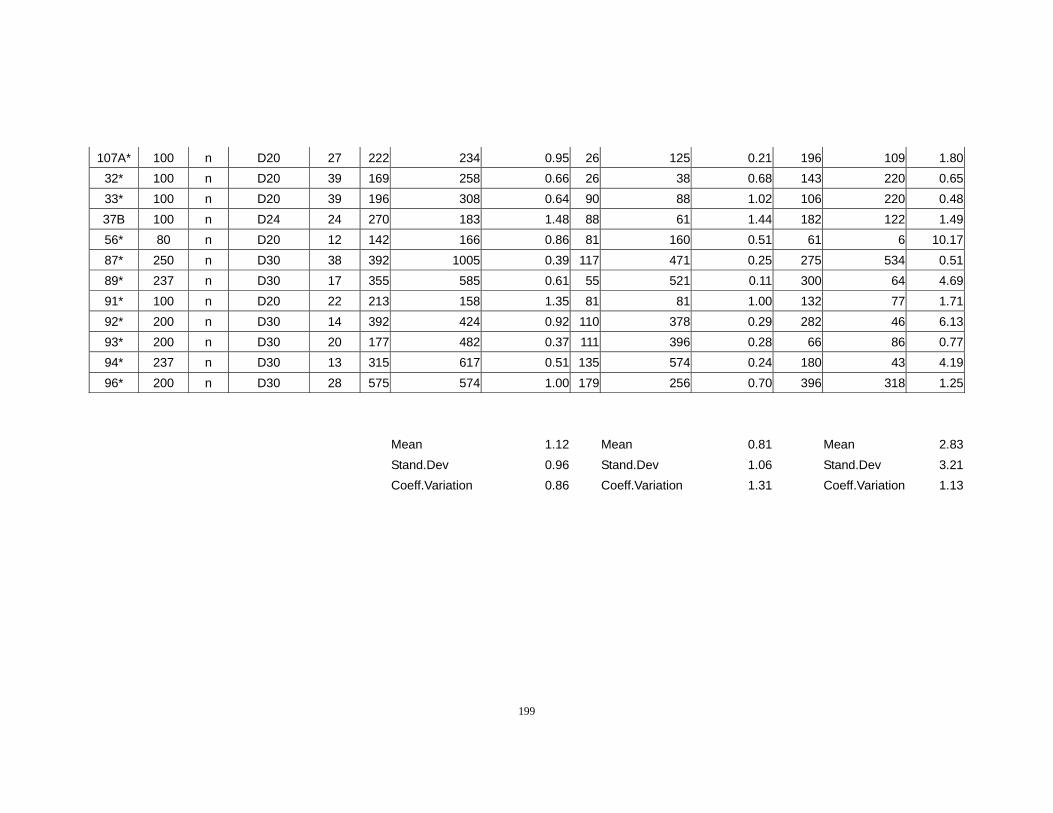
199
107A* 100 n D20 27 222 234 0.95 26 125 0.21 196 109 1.8032* 100 n D20 39 169 258 0.66 26 38 0.68 143 220 0.6533* 100 n D20 39 196 308 0.64 90 88 1.02 106 220 0.4837B 100 n D24 24 270 183 1.48 88 61 1.44 182 122 1.4956* 80 n D20 12 142 166 0.86 81 160 0.51 61 6 10.1787* 250 n D30 38 392 1005 0.39 117 471 0.25 275 534 0.5189* 237 n D30 17 355 585 0.61 55 521 0.11 300 64 4.6991* 100 n D20 22 213 158 1.35 81 81 1.00 132 77 1.7192* 200 n D30 14 392 424 0.92 110 378 0.29 282 46 6.1393* 200 n D30 20 177 482 0.37 111 396 0.28 66 86 0.7794* 237 n D30 13 315 617 0.51 135 574 0.24 180 43 4.1996* 200 n D30 28 575 574 1.00 179 256 0.70 396 318 1.25
Mean 1.12 Mean 0.81 Mean 2.83 Stand.Dev 0.96 Stand.Dev 1.06 Stand.Dev 3.21 Coeff.Variation 0.86 Coeff.Variation 1.31 Coeff.Variation 1.13
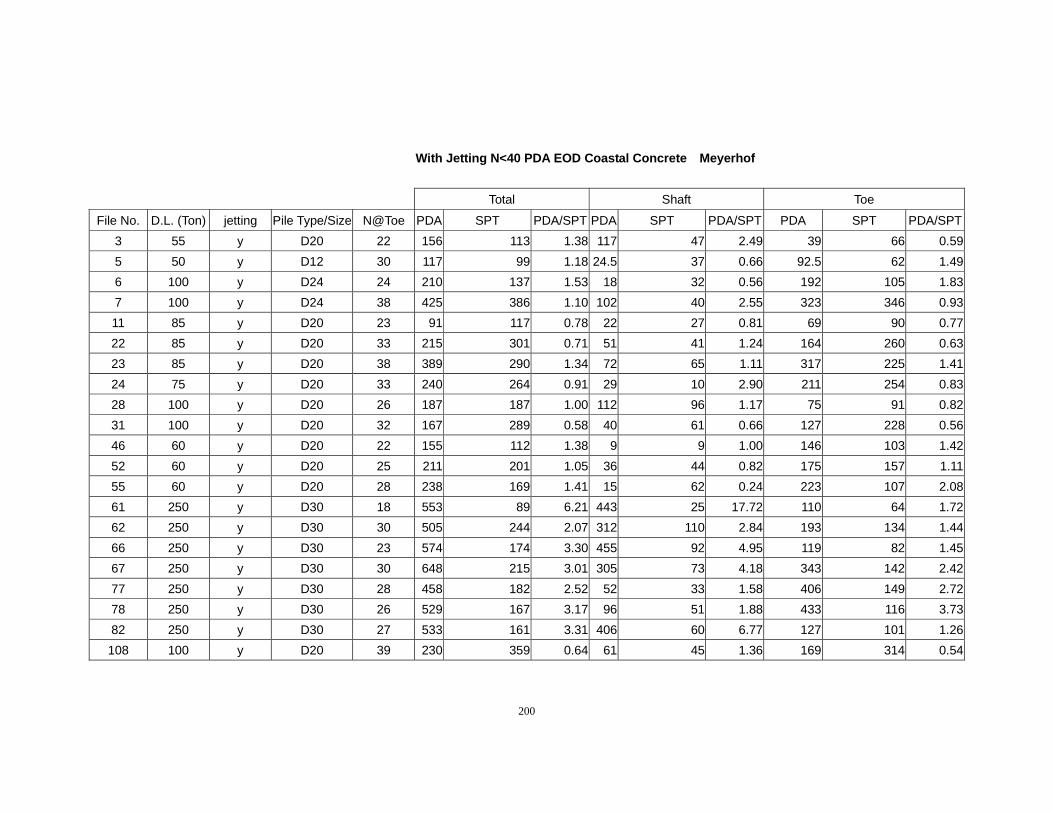
200
With Jetting N<40 PDA EOD Coastal Concrete Meyerhof
Total Shaft Toe
File No. D.L. (Ton) jetting Pile Type/Size N@Toe PDA SPT PDA/SPT PDA SPT PDA/SPT PDA SPT PDA/SPT3 55 y D20 22 156 113 1.38 117 47 2.49 39 66 0.595 50 y D12 30 117 99 1.18 24.5 37 0.66 92.5 62 1.496 100 y D24 24 210 137 1.53 18 32 0.56 192 105 1.837 100 y D24 38 425 386 1.10 102 40 2.55 323 346 0.9311 85 y D20 23 91 117 0.78 22 27 0.81 69 90 0.7722 85 y D20 33 215 301 0.71 51 41 1.24 164 260 0.6323 85 y D20 38 389 290 1.34 72 65 1.11 317 225 1.4124 75 y D20 33 240 264 0.91 29 10 2.90 211 254 0.8328 100 y D20 26 187 187 1.00 112 96 1.17 75 91 0.8231 100 y D20 32 167 289 0.58 40 61 0.66 127 228 0.5646 60 y D20 22 155 112 1.38 9 9 1.00 146 103 1.4252 60 y D20 25 211 201 1.05 36 44 0.82 175 157 1.1155 60 y D20 28 238 169 1.41 15 62 0.24 223 107 2.0861 250 y D30 18 553 89 6.21 443 25 17.72 110 64 1.7262 250 y D30 30 505 244 2.07 312 110 2.84 193 134 1.4466 250 y D30 23 574 174 3.30 455 92 4.95 119 82 1.4567 250 y D30 30 648 215 3.01 305 73 4.18 343 142 2.4277 250 y D30 28 458 182 2.52 52 33 1.58 406 149 2.7278 250 y D30 26 529 167 3.17 96 51 1.88 433 116 3.7382 250 y D30 27 533 161 3.31 406 60 6.77 127 101 1.26108 100 y D20 39 230 359 0.64 61 45 1.36 169 314 0.54
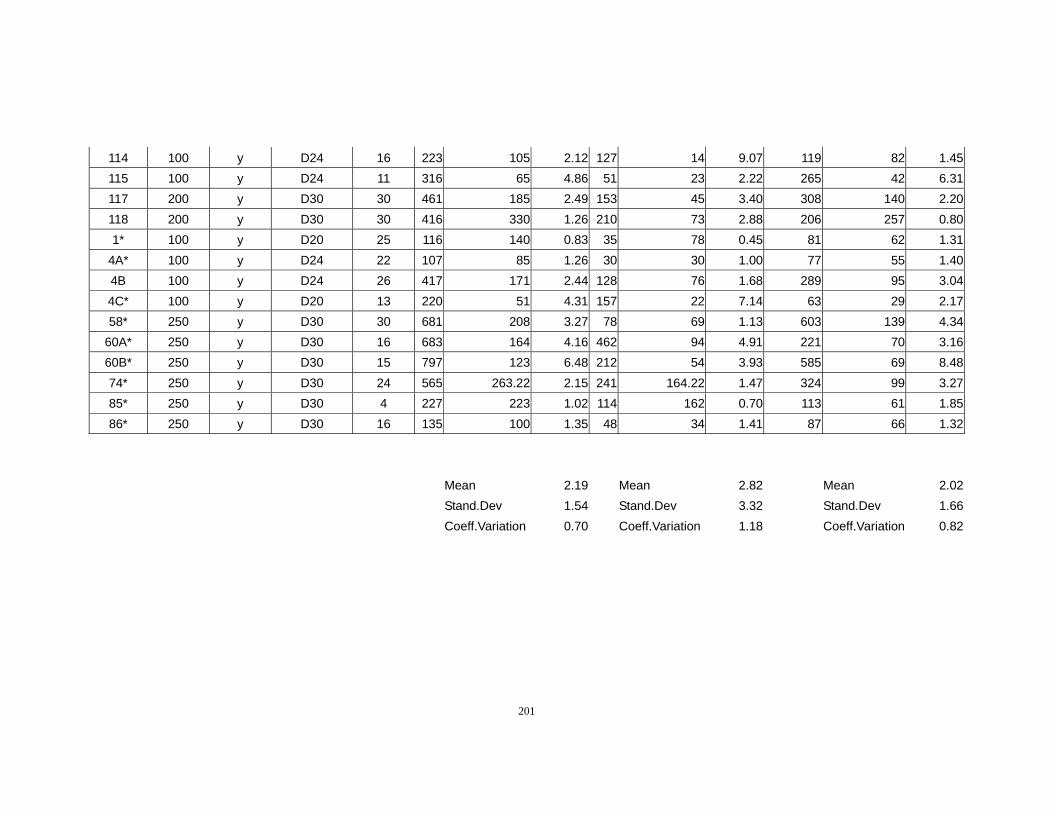
201
114 100 y D24 16 223 105 2.12 127 14 9.07 119 82 1.45115 100 y D24 11 316 65 4.86 51 23 2.22 265 42 6.31117 200 y D30 30 461 185 2.49 153 45 3.40 308 140 2.20118 200 y D30 30 416 330 1.26 210 73 2.88 206 257 0.801* 100 y D20 25 116 140 0.83 35 78 0.45 81 62 1.31
4A* 100 y D24 22 107 85 1.26 30 30 1.00 77 55 1.404B 100 y D24 26 417 171 2.44 128 76 1.68 289 95 3.044C* 100 y D20 13 220 51 4.31 157 22 7.14 63 29 2.1758* 250 y D30 30 681 208 3.27 78 69 1.13 603 139 4.34
60A* 250 y D30 16 683 164 4.16 462 94 4.91 221 70 3.1660B* 250 y D30 15 797 123 6.48 212 54 3.93 585 69 8.4874* 250 y D30 24 565 263.22 2.15 241 164.22 1.47 324 99 3.2785* 250 y D30 4 227 223 1.02 114 162 0.70 113 61 1.8586* 250 y D30 16 135 100 1.35 48 34 1.41 87 66 1.32
Mean 2.19 Mean 2.82 Mean 2.02 Stand.Dev 1.54 Stand.Dev 3.32 Stand.Dev 1.66 Coeff.Variation 0.70 Coeff.Variation 1.18 Coeff.Variation 0.82
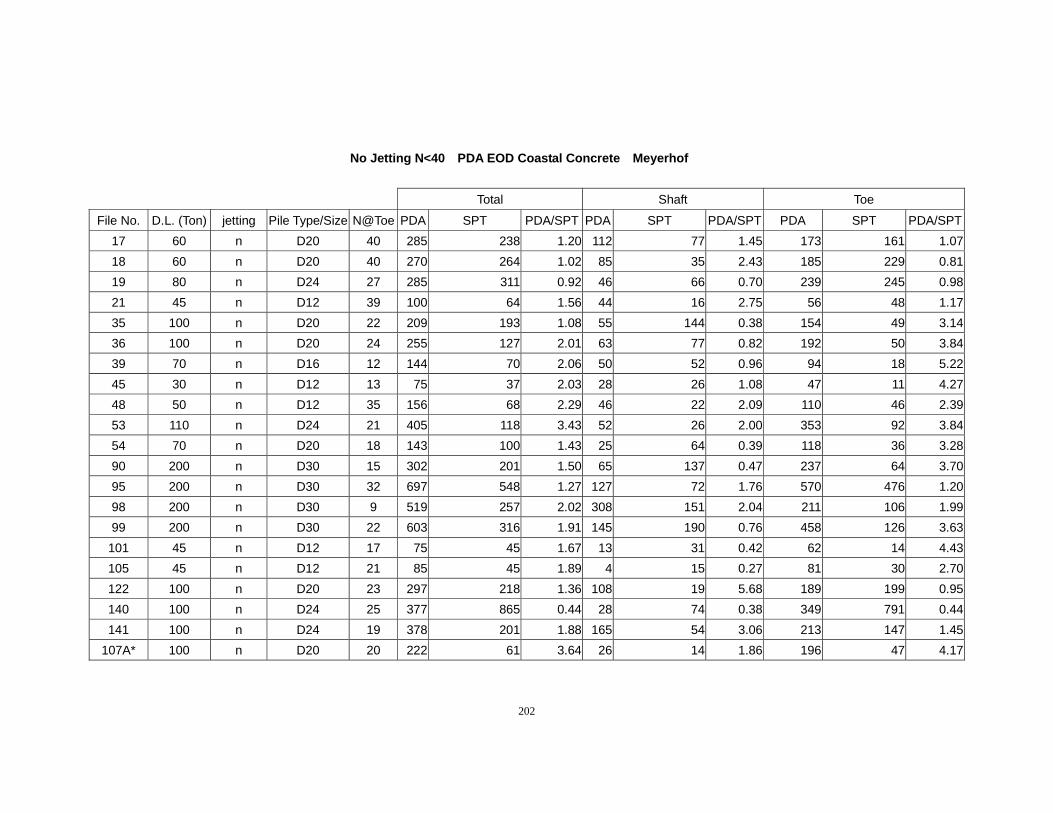
202
No Jetting N<40 PDA EOD Coastal Concrete Meyerhof
Total Shaft Toe
File No. D.L. (Ton) jetting Pile Type/Size N@Toe PDA SPT PDA/SPT PDA SPT PDA/SPT PDA SPT PDA/SPT17 60 n D20 40 285 238 1.20 112 77 1.45 173 161 1.0718 60 n D20 40 270 264 1.02 85 35 2.43 185 229 0.8119 80 n D24 27 285 311 0.92 46 66 0.70 239 245 0.9821 45 n D12 39 100 64 1.56 44 16 2.75 56 48 1.1735 100 n D20 22 209 193 1.08 55 144 0.38 154 49 3.1436 100 n D20 24 255 127 2.01 63 77 0.82 192 50 3.8439 70 n D16 12 144 70 2.06 50 52 0.96 94 18 5.2245 30 n D12 13 75 37 2.03 28 26 1.08 47 11 4.2748 50 n D12 35 156 68 2.29 46 22 2.09 110 46 2.3953 110 n D24 21 405 118 3.43 52 26 2.00 353 92 3.8454 70 n D20 18 143 100 1.43 25 64 0.39 118 36 3.2890 200 n D30 15 302 201 1.50 65 137 0.47 237 64 3.7095 200 n D30 32 697 548 1.27 127 72 1.76 570 476 1.2098 200 n D30 9 519 257 2.02 308 151 2.04 211 106 1.9999 200 n D30 22 603 316 1.91 145 190 0.76 458 126 3.63
101 45 n D12 17 75 45 1.67 13 31 0.42 62 14 4.43105 45 n D12 21 85 45 1.89 4 15 0.27 81 30 2.70122 100 n D20 23 297 218 1.36 108 19 5.68 189 199 0.95140 100 n D24 25 377 865 0.44 28 74 0.38 349 791 0.44141 100 n D24 19 378 201 1.88 165 54 3.06 213 147 1.45
107A* 100 n D20 20 222 61 3.64 26 14 1.86 196 47 4.17
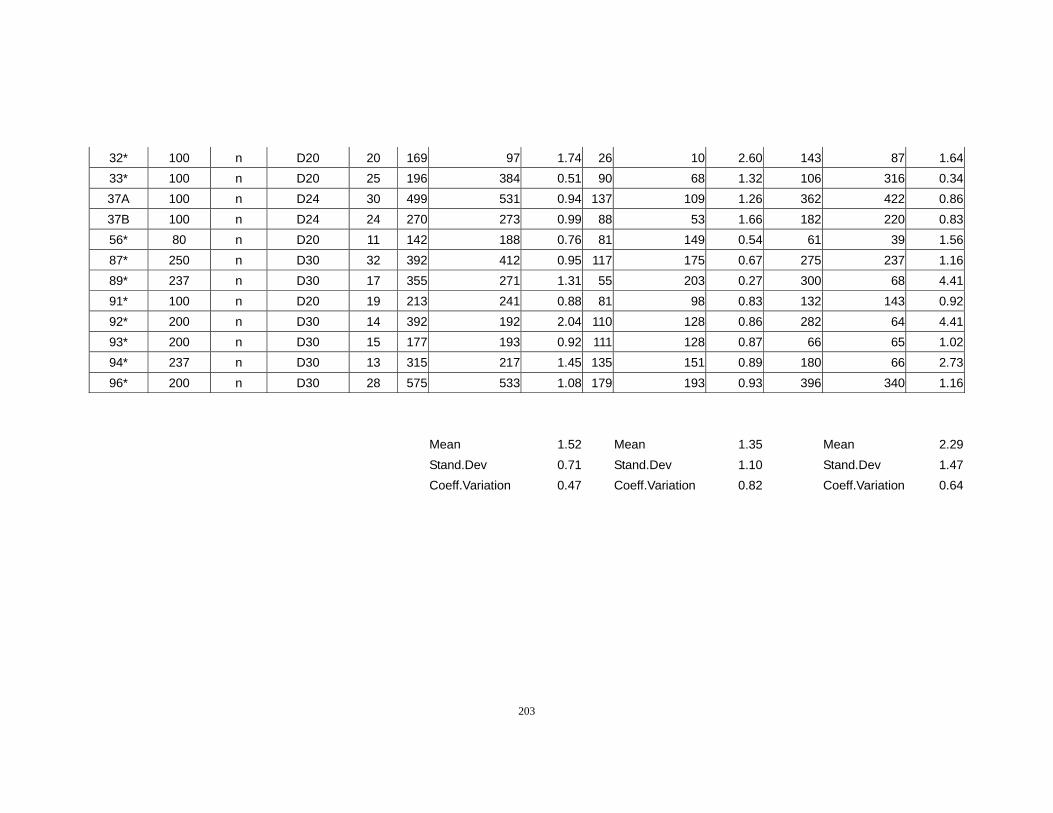
203
32* 100 n D20 20 169 97 1.74 26 10 2.60 143 87 1.6433* 100 n D20 25 196 384 0.51 90 68 1.32 106 316 0.3437A 100 n D24 30 499 531 0.94 137 109 1.26 362 422 0.8637B 100 n D24 24 270 273 0.99 88 53 1.66 182 220 0.8356* 80 n D20 11 142 188 0.76 81 149 0.54 61 39 1.5687* 250 n D30 32 392 412 0.95 117 175 0.67 275 237 1.1689* 237 n D30 17 355 271 1.31 55 203 0.27 300 68 4.4191* 100 n D20 19 213 241 0.88 81 98 0.83 132 143 0.9292* 200 n D30 14 392 192 2.04 110 128 0.86 282 64 4.4193* 200 n D30 15 177 193 0.92 111 128 0.87 66 65 1.0294* 237 n D30 13 315 217 1.45 135 151 0.89 180 66 2.7396* 200 n D30 28 575 533 1.08 179 193 0.93 396 340 1.16
Mean 1.52 Mean 1.35 Mean 2.29 Stand.Dev 0.71 Stand.Dev 1.10 Stand.Dev 1.47 Coeff.Variation 0.47 Coeff.Variation 0.82 Coeff.Variation 0.64
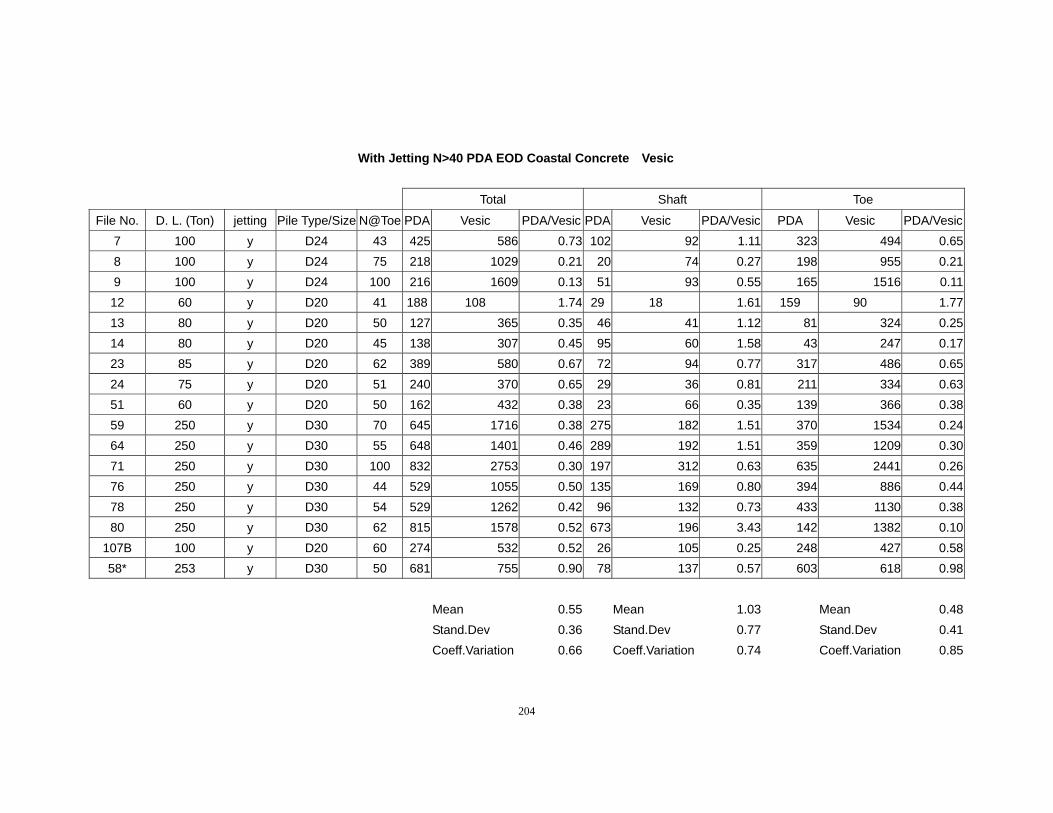
204
With Jetting N>40 PDA EOD Coastal Concrete Vesic
Total Shaft Toe
File No. D. L. (Ton) jetting Pile Type/Size N@Toe PDA Vesic PDA/Vesic PDA Vesic PDA/Vesic PDA Vesic PDA/Vesic7 100 y D24 43 425 586 0.73 102 92 1.11 323 494 0.658 100 y D24 75 218 1029 0.21 20 74 0.27 198 955 0.219 100 y D24 100 216 1609 0.13 51 93 0.55 165 1516 0.1112 60 y D20 41 188 108 1.74 29 18 1.61 159 90 1.7713 80 y D20 50 127 365 0.35 46 41 1.12 81 324 0.2514 80 y D20 45 138 307 0.45 95 60 1.58 43 247 0.1723 85 y D20 62 389 580 0.67 72 94 0.77 317 486 0.6524 75 y D20 51 240 370 0.65 29 36 0.81 211 334 0.6351 60 y D20 50 162 432 0.38 23 66 0.35 139 366 0.3859 250 y D30 70 645 1716 0.38 275 182 1.51 370 1534 0.2464 250 y D30 55 648 1401 0.46 289 192 1.51 359 1209 0.3071 250 y D30 100 832 2753 0.30 197 312 0.63 635 2441 0.2676 250 y D30 44 529 1055 0.50 135 169 0.80 394 886 0.4478 250 y D30 54 529 1262 0.42 96 132 0.73 433 1130 0.3880 250 y D30 62 815 1578 0.52 673 196 3.43 142 1382 0.10
107B 100 y D20 60 274 532 0.52 26 105 0.25 248 427 0.5858* 253 y D30 50 681 755 0.90 78 137 0.57 603 618 0.98
Mean 0.55 Mean 1.03 Mean 0.48 Stand.Dev 0.36 Stand.Dev 0.77 Stand.Dev 0.41 Coeff.Variation 0.66 Coeff.Variation 0.74 Coeff.Variation 0.85
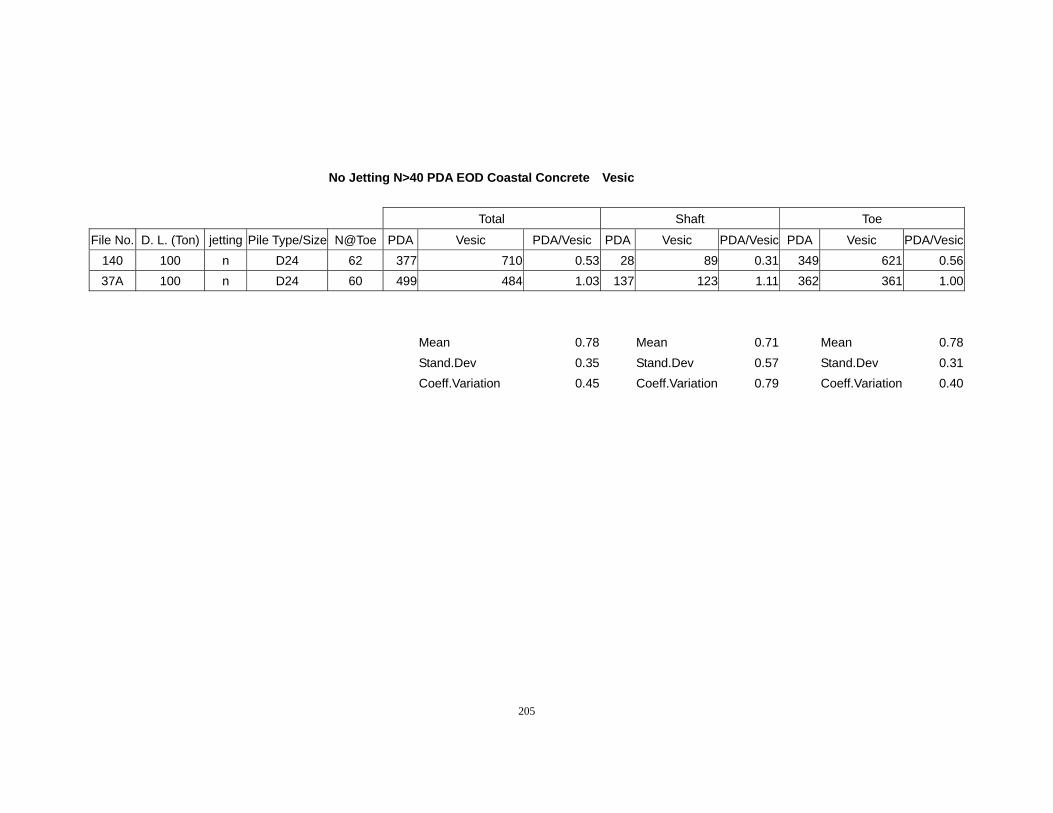
205
No Jetting N>40 PDA EOD Coastal Concrete Vesic
Total Shaft Toe
File No. D. L. (Ton) jetting Pile Type/Size N@Toe PDA Vesic PDA/Vesic PDA Vesic PDA/Vesic PDA Vesic PDA/Vesic140 100 n D24 62 377 710 0.53 28 89 0.31 349 621 0.5637A 100 n D24 60 499 484 1.03 137 123 1.11 362 361 1.00
Mean 0.78 Mean 0.71 Mean 0.78 Stand.Dev 0.35 Stand.Dev 0.57 Stand.Dev 0.31 Coeff.Variation 0.45 Coeff.Variation 0.79 Coeff.Variation 0.40
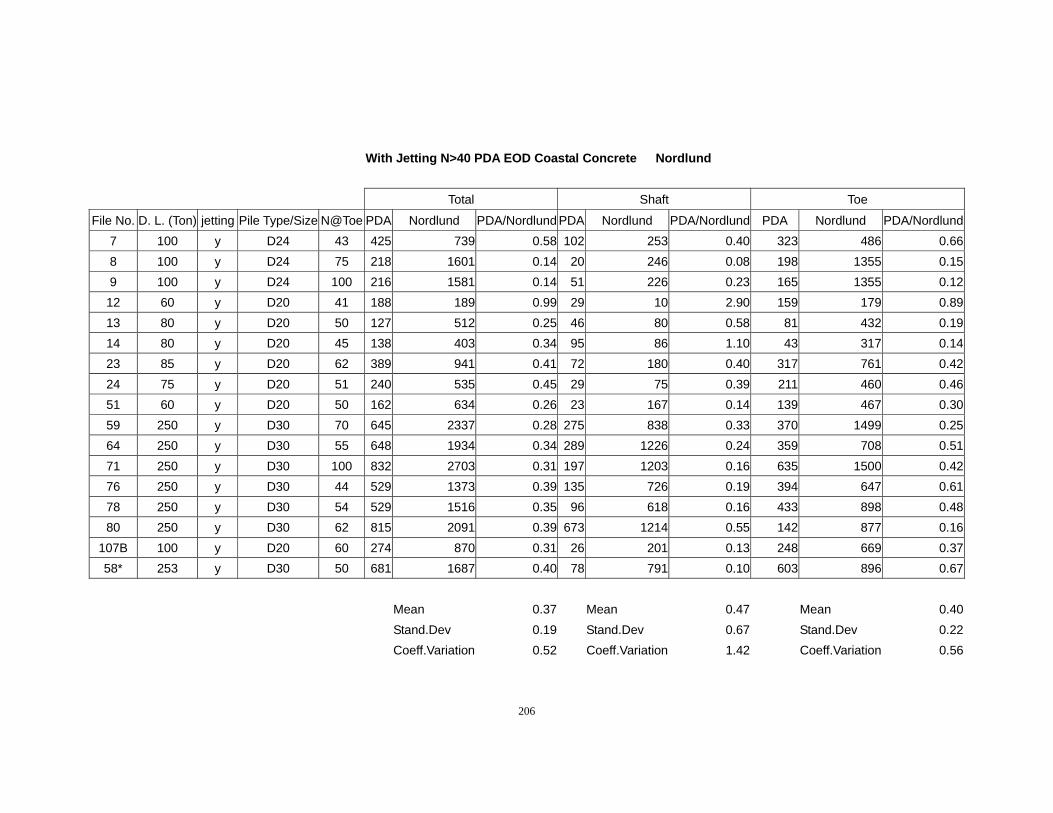
206
With Jetting N>40 PDA EOD Coastal Concrete Nordlund
Total Shaft Toe
File No. D. L. (Ton) jetting Pile Type/Size N@Toe PDA Nordlund PDA/Nordlund PDA Nordlund PDA/Nordlund PDA Nordlund PDA/Nordlund7 100 y D24 43 425 739 0.58 102 253 0.40 323 486 0.668 100 y D24 75 218 1601 0.14 20 246 0.08 198 1355 0.159 100 y D24 100 216 1581 0.14 51 226 0.23 165 1355 0.12
12 60 y D20 41 188 189 0.99 29 10 2.90 159 179 0.8913 80 y D20 50 127 512 0.25 46 80 0.58 81 432 0.1914 80 y D20 45 138 403 0.34 95 86 1.10 43 317 0.1423 85 y D20 62 389 941 0.41 72 180 0.40 317 761 0.4224 75 y D20 51 240 535 0.45 29 75 0.39 211 460 0.4651 60 y D20 50 162 634 0.26 23 167 0.14 139 467 0.3059 250 y D30 70 645 2337 0.28 275 838 0.33 370 1499 0.2564 250 y D30 55 648 1934 0.34 289 1226 0.24 359 708 0.5171 250 y D30 100 832 2703 0.31 197 1203 0.16 635 1500 0.4276 250 y D30 44 529 1373 0.39 135 726 0.19 394 647 0.6178 250 y D30 54 529 1516 0.35 96 618 0.16 433 898 0.4880 250 y D30 62 815 2091 0.39 673 1214 0.55 142 877 0.16
107B 100 y D20 60 274 870 0.31 26 201 0.13 248 669 0.3758* 253 y D30 50 681 1687 0.40 78 791 0.10 603 896 0.67
Mean 0.37 Mean 0.47 Mean 0.40 Stand.Dev 0.19 Stand.Dev 0.67 Stand.Dev 0.22 Coeff.Variation 0.52 Coeff.Variation 1.42 Coeff.Variation 0.56
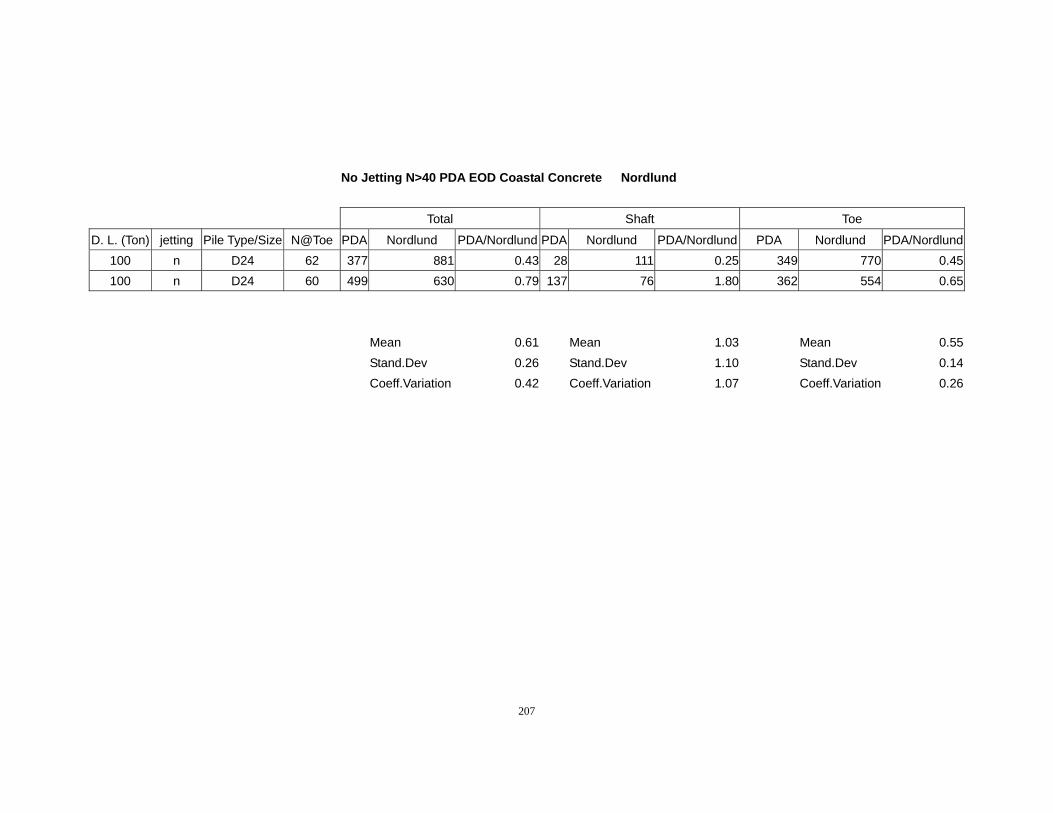
207
No Jetting N>40 PDA EOD Coastal Concrete Nordlund
Total Shaft Toe
D. L. (Ton) jetting Pile Type/Size N@Toe PDA Nordlund PDA/Nordlund PDA Nordlund PDA/Nordlund PDA Nordlund PDA/Nordlund100 n D24 62 377 881 0.43 28 111 0.25 349 770 0.45100 n D24 60 499 630 0.79 137 76 1.80 362 554 0.65
Mean 0.61 Mean 1.03 Mean 0.55 Stand.Dev 0.26 Stand.Dev 1.10 Stand.Dev 0.14 Coeff.Variation 0.42 Coeff.Variation 1.07 Coeff.Variation 0.26
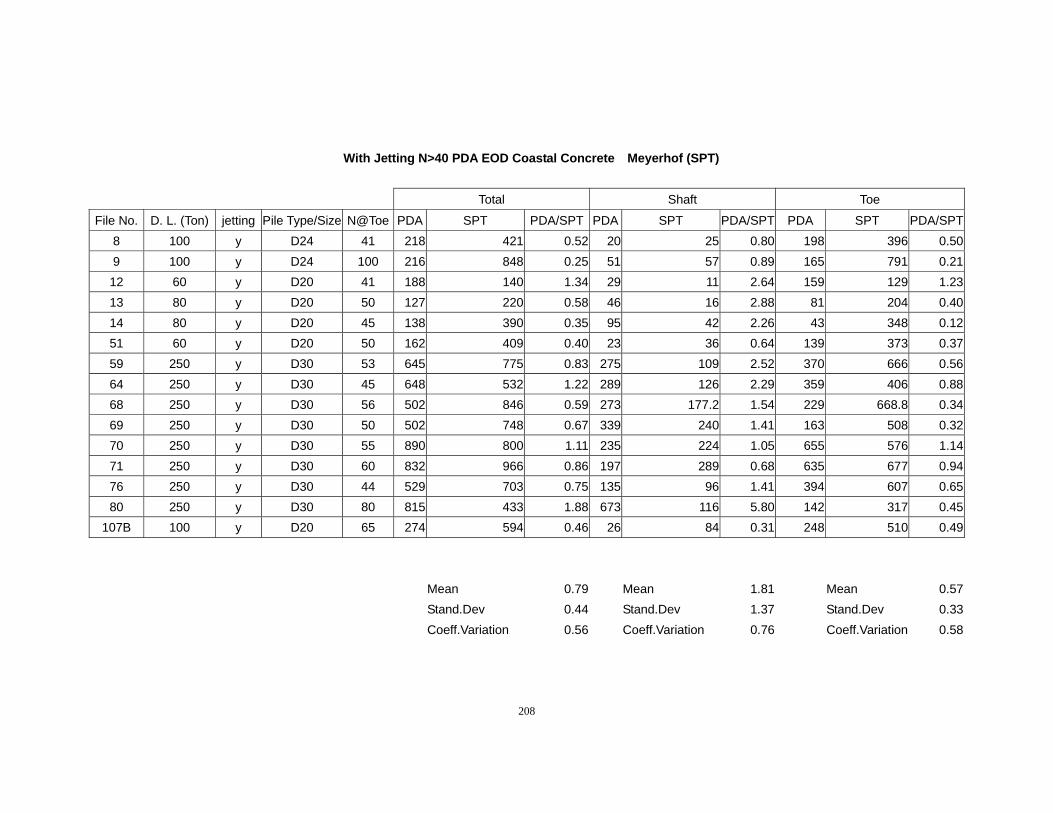
208
With Jetting N>40 PDA EOD Coastal Concrete Meyerhof (SPT)
Total Shaft Toe
File No. D. L. (Ton) jetting Pile Type/Size N@Toe PDA SPT PDA/SPT PDA SPT PDA/SPT PDA SPT PDA/SPT8 100 y D24 41 218 421 0.52 20 25 0.80 198 396 0.509 100 y D24 100 216 848 0.25 51 57 0.89 165 791 0.2112 60 y D20 41 188 140 1.34 29 11 2.64 159 129 1.2313 80 y D20 50 127 220 0.58 46 16 2.88 81 204 0.4014 80 y D20 45 138 390 0.35 95 42 2.26 43 348 0.1251 60 y D20 50 162 409 0.40 23 36 0.64 139 373 0.3759 250 y D30 53 645 775 0.83 275 109 2.52 370 666 0.5664 250 y D30 45 648 532 1.22 289 126 2.29 359 406 0.8868 250 y D30 56 502 846 0.59 273 177.2 1.54 229 668.8 0.3469 250 y D30 50 502 748 0.67 339 240 1.41 163 508 0.3270 250 y D30 55 890 800 1.11 235 224 1.05 655 576 1.1471 250 y D30 60 832 966 0.86 197 289 0.68 635 677 0.9476 250 y D30 44 529 703 0.75 135 96 1.41 394 607 0.6580 250 y D30 80 815 433 1.88 673 116 5.80 142 317 0.45
107B 100 y D20 65 274 594 0.46 26 84 0.31 248 510 0.49 Mean 0.79 Mean 1.81 Mean 0.57 Stand.Dev 0.44 Stand.Dev 1.37 Stand.Dev 0.33 Coeff.Variation 0.56 Coeff.Variation 0.76 Coeff.Variation 0.58
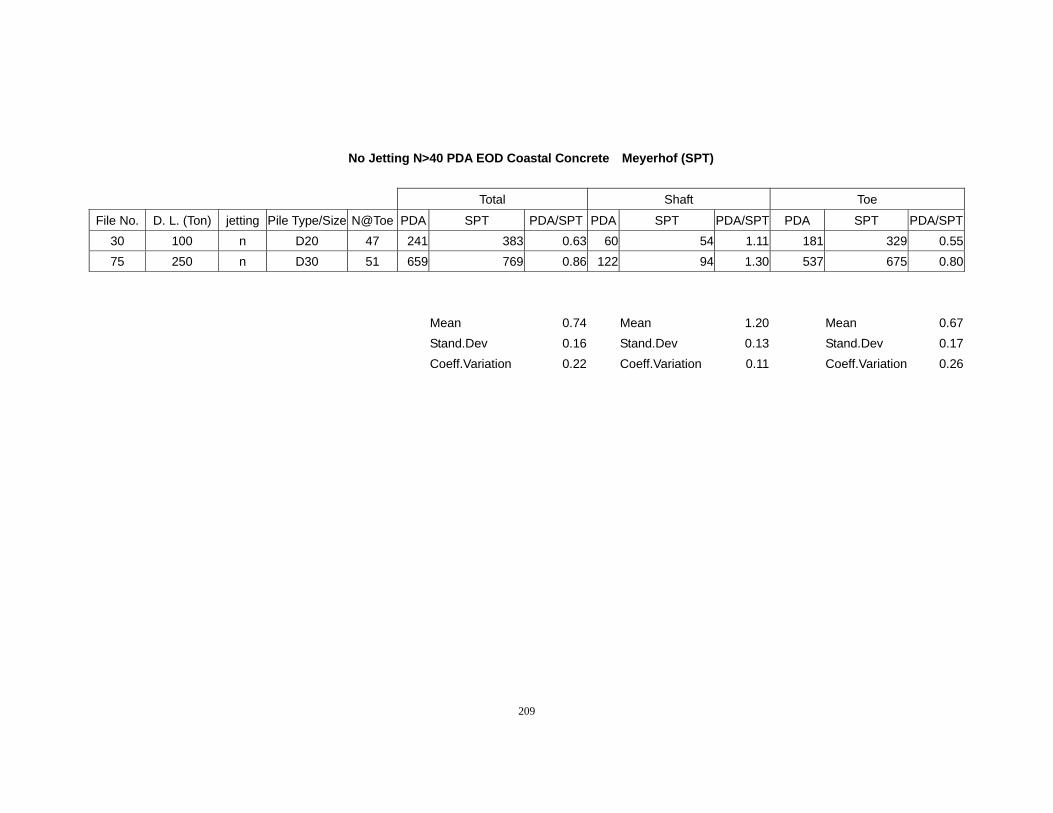
209
No Jetting N>40 PDA EOD Coastal Concrete Meyerhof (SPT)
Total Shaft Toe
File No. D. L. (Ton) jetting Pile Type/Size N@Toe PDA SPT PDA/SPT PDA SPT PDA/SPT PDA SPT PDA/SPT30 100 n D20 47 241 383 0.63 60 54 1.11 181 329 0.5575 250 n D30 51 659 769 0.86 122 94 1.30 537 675 0.80
Mean 0.74 Mean 1.20 Mean 0.67 Stand.Dev 0.16 Stand.Dev 0.13 Stand.Dev 0.17 Coeff.Variation 0.22 Coeff.Variation 0.11 Coeff.Variation 0.26
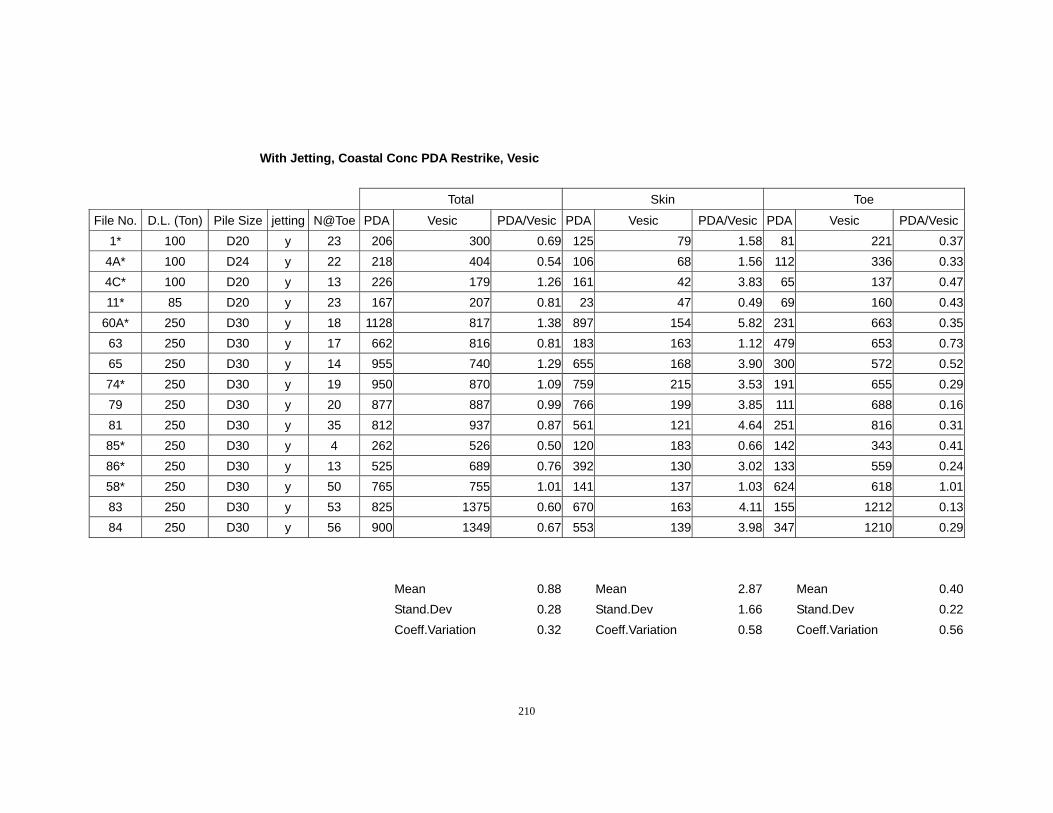
210
With Jetting, Coastal Conc PDA Restrike, Vesic
Total Skin Toe
File No. D.L. (Ton) Pile Size jetting N@Toe PDA Vesic PDA/Vesic PDA Vesic PDA/Vesic PDA Vesic PDA/Vesic1* 100 D20 y 23 206 300 0.69 125 79 1.58 81 221 0.37
4A* 100 D24 y 22 218 404 0.54 106 68 1.56 112 336 0.334C* 100 D20 y 13 226 179 1.26 161 42 3.83 65 137 0.4711* 85 D20 y 23 167 207 0.81 23 47 0.49 69 160 0.43
60A* 250 D30 y 18 1128 817 1.38 897 154 5.82 231 663 0.3563 250 D30 y 17 662 816 0.81 183 163 1.12 479 653 0.7365 250 D30 y 14 955 740 1.29 655 168 3.90 300 572 0.5274* 250 D30 y 19 950 870 1.09 759 215 3.53 191 655 0.2979 250 D30 y 20 877 887 0.99 766 199 3.85 111 688 0.1681 250 D30 y 35 812 937 0.87 561 121 4.64 251 816 0.3185* 250 D30 y 4 262 526 0.50 120 183 0.66 142 343 0.4186* 250 D30 y 13 525 689 0.76 392 130 3.02 133 559 0.2458* 250 D30 y 50 765 755 1.01 141 137 1.03 624 618 1.0183 250 D30 y 53 825 1375 0.60 670 163 4.11 155 1212 0.1384 250 D30 y 56 900 1349 0.67 553 139 3.98 347 1210 0.29
Mean 0.88 Mean 2.87 Mean 0.40 Stand.Dev 0.28 Stand.Dev 1.66 Stand.Dev 0.22 Coeff.Variation 0.32 Coeff.Variation 0.58 Coeff.Variation 0.56
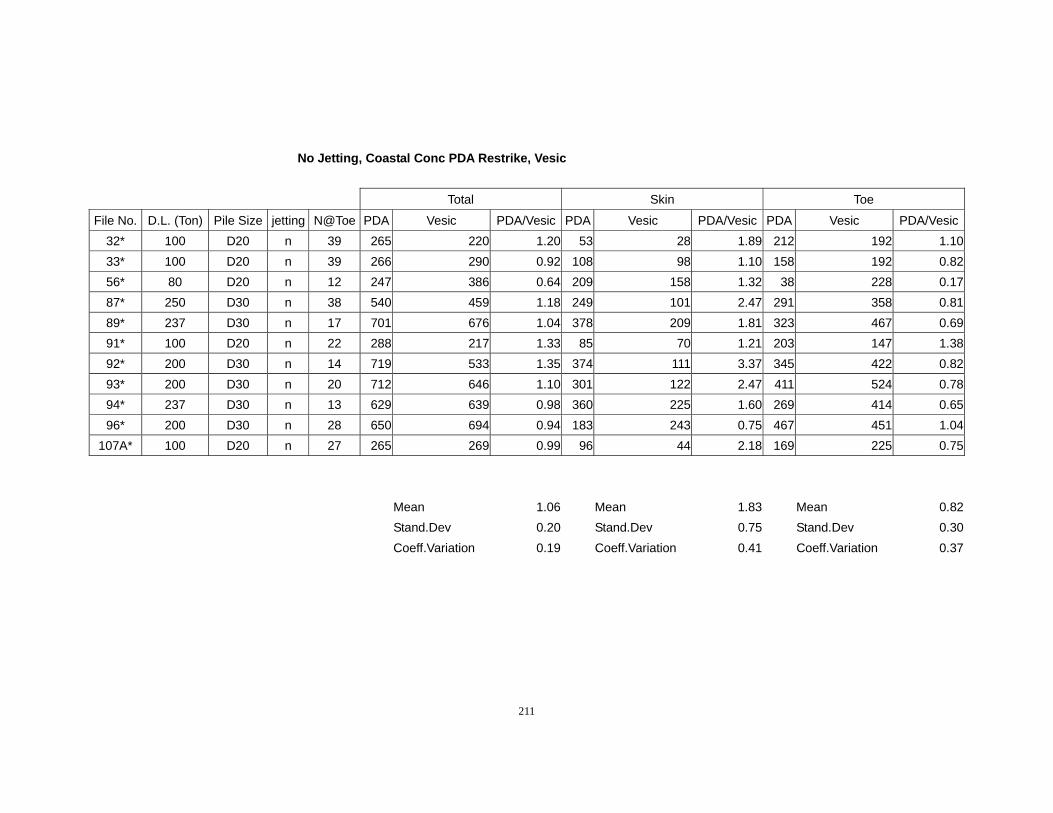
211
No Jetting, Coastal Conc PDA Restrike, Vesic
Total Skin Toe
File No. D.L. (Ton) Pile Size jetting N@Toe PDA Vesic PDA/Vesic PDA Vesic PDA/Vesic PDA Vesic PDA/Vesic32* 100 D20 n 39 265 220 1.20 53 28 1.89 212 192 1.1033* 100 D20 n 39 266 290 0.92 108 98 1.10 158 192 0.8256* 80 D20 n 12 247 386 0.64 209 158 1.32 38 228 0.1787* 250 D30 n 38 540 459 1.18 249 101 2.47 291 358 0.8189* 237 D30 n 17 701 676 1.04 378 209 1.81 323 467 0.6991* 100 D20 n 22 288 217 1.33 85 70 1.21 203 147 1.3892* 200 D30 n 14 719 533 1.35 374 111 3.37 345 422 0.8293* 200 D30 n 20 712 646 1.10 301 122 2.47 411 524 0.7894* 237 D30 n 13 629 639 0.98 360 225 1.60 269 414 0.6596* 200 D30 n 28 650 694 0.94 183 243 0.75 467 451 1.04
107A* 100 D20 n 27 265 269 0.99 96 44 2.18 169 225 0.75 Mean 1.06 Mean 1.83 Mean 0.82 Stand.Dev 0.20 Stand.Dev 0.75 Stand.Dev 0.30 Coeff.Variation 0.19 Coeff.Variation 0.41 Coeff.Variation 0.37
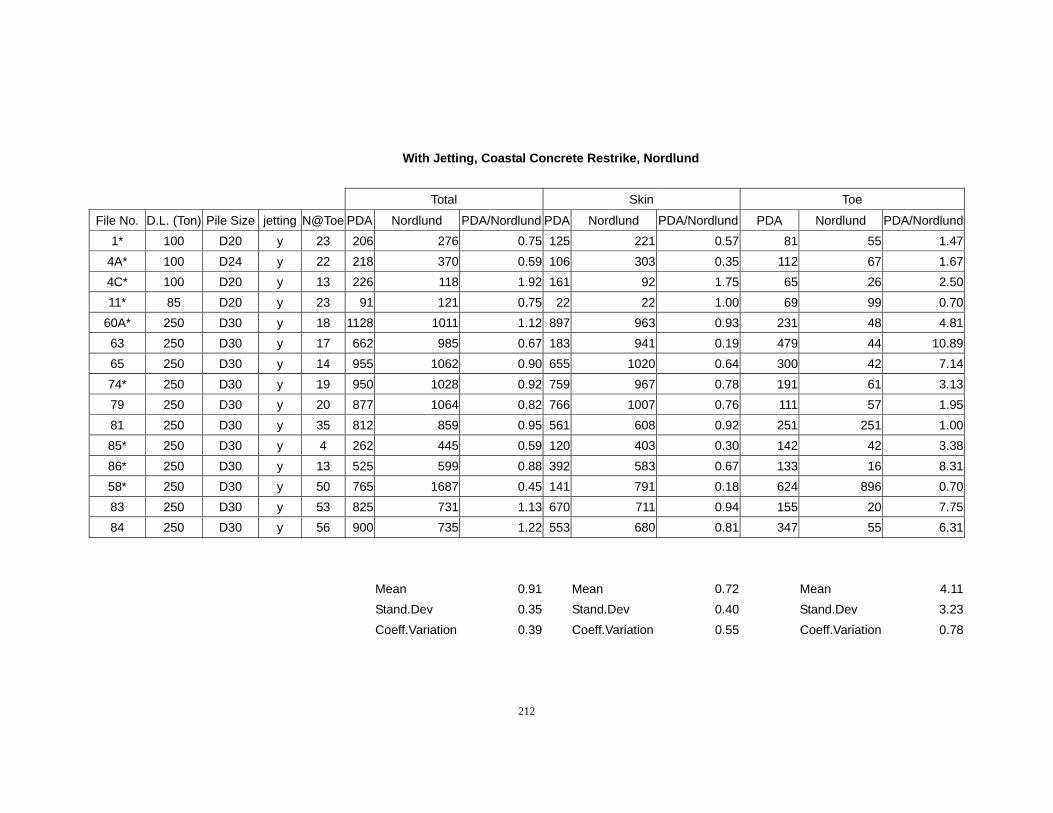
212
With Jetting, Coastal Concrete Restrike, Nordlund
Total Skin Toe
File No. D.L. (Ton) Pile Size jetting N@Toe PDA Nordlund PDA/Nordlund PDA Nordlund PDA/Nordlund PDA Nordlund PDA/Nordlund1* 100 D20 y 23 206 276 0.75 125 221 0.57 81 55 1.47
4A* 100 D24 y 22 218 370 0.59 106 303 0.35 112 67 1.674C* 100 D20 y 13 226 118 1.92 161 92 1.75 65 26 2.5011* 85 D20 y 23 91 121 0.75 22 22 1.00 69 99 0.70
60A* 250 D30 y 18 1128 1011 1.12 897 963 0.93 231 48 4.8163 250 D30 y 17 662 985 0.67 183 941 0.19 479 44 10.8965 250 D30 y 14 955 1062 0.90 655 1020 0.64 300 42 7.1474* 250 D30 y 19 950 1028 0.92 759 967 0.78 191 61 3.1379 250 D30 y 20 877 1064 0.82 766 1007 0.76 111 57 1.9581 250 D30 y 35 812 859 0.95 561 608 0.92 251 251 1.0085* 250 D30 y 4 262 445 0.59 120 403 0.30 142 42 3.3886* 250 D30 y 13 525 599 0.88 392 583 0.67 133 16 8.3158* 250 D30 y 50 765 1687 0.45 141 791 0.18 624 896 0.7083 250 D30 y 53 825 731 1.13 670 711 0.94 155 20 7.7584 250 D30 y 56 900 735 1.22 553 680 0.81 347 55 6.31
Mean 0.91 Mean 0.72 Mean 4.11 Stand.Dev 0.35 Stand.Dev 0.40 Stand.Dev 3.23 Coeff.Variation 0.39 Coeff.Variation 0.55 Coeff.Variation 0.78
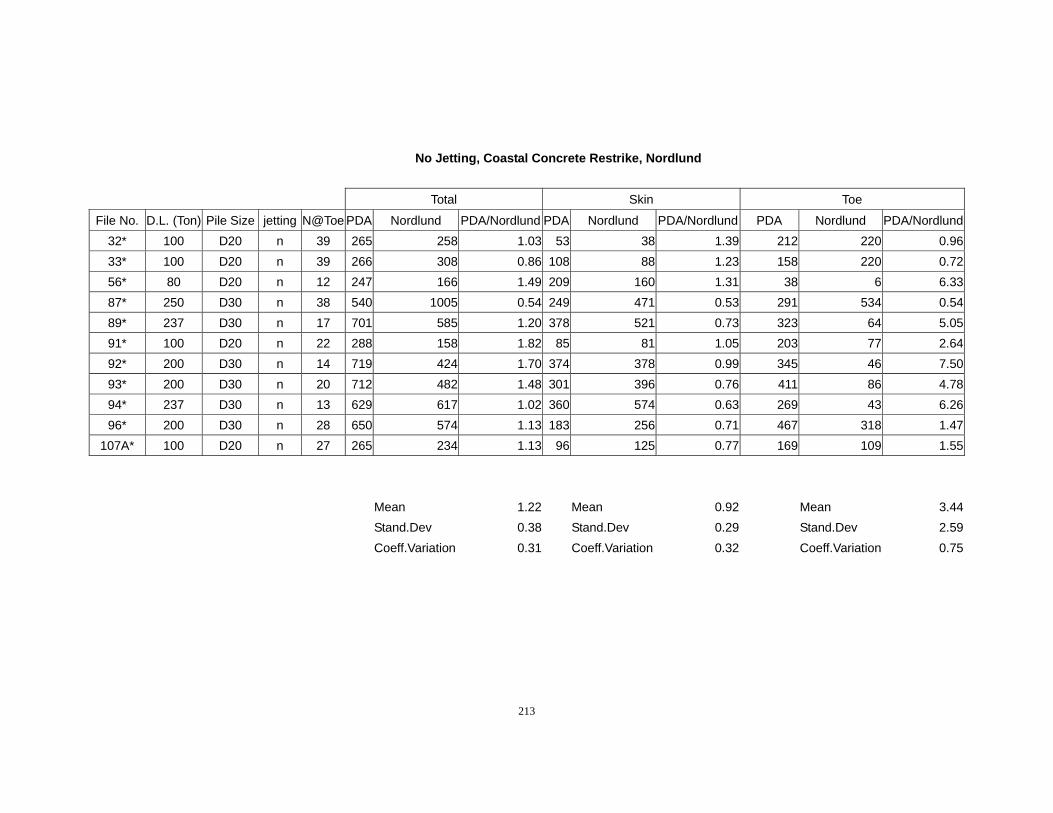
213
No Jetting, Coastal Concrete Restrike, Nordlund
Total Skin Toe
File No. D.L. (Ton) Pile Size jetting N@Toe PDA Nordlund PDA/Nordlund PDA Nordlund PDA/Nordlund PDA Nordlund PDA/Nordlund32* 100 D20 n 39 265 258 1.03 53 38 1.39 212 220 0.9633* 100 D20 n 39 266 308 0.86 108 88 1.23 158 220 0.7256* 80 D20 n 12 247 166 1.49 209 160 1.31 38 6 6.3387* 250 D30 n 38 540 1005 0.54 249 471 0.53 291 534 0.5489* 237 D30 n 17 701 585 1.20 378 521 0.73 323 64 5.0591* 100 D20 n 22 288 158 1.82 85 81 1.05 203 77 2.6492* 200 D30 n 14 719 424 1.70 374 378 0.99 345 46 7.5093* 200 D30 n 20 712 482 1.48 301 396 0.76 411 86 4.7894* 237 D30 n 13 629 617 1.02 360 574 0.63 269 43 6.2696* 200 D30 n 28 650 574 1.13 183 256 0.71 467 318 1.47
107A* 100 D20 n 27 265 234 1.13 96 125 0.77 169 109 1.55 Mean 1.22 Mean 0.92 Mean 3.44 Stand.Dev 0.38 Stand.Dev 0.29 Stand.Dev 2.59 Coeff.Variation 0.31 Coeff.Variation 0.32 Coeff.Variation 0.75
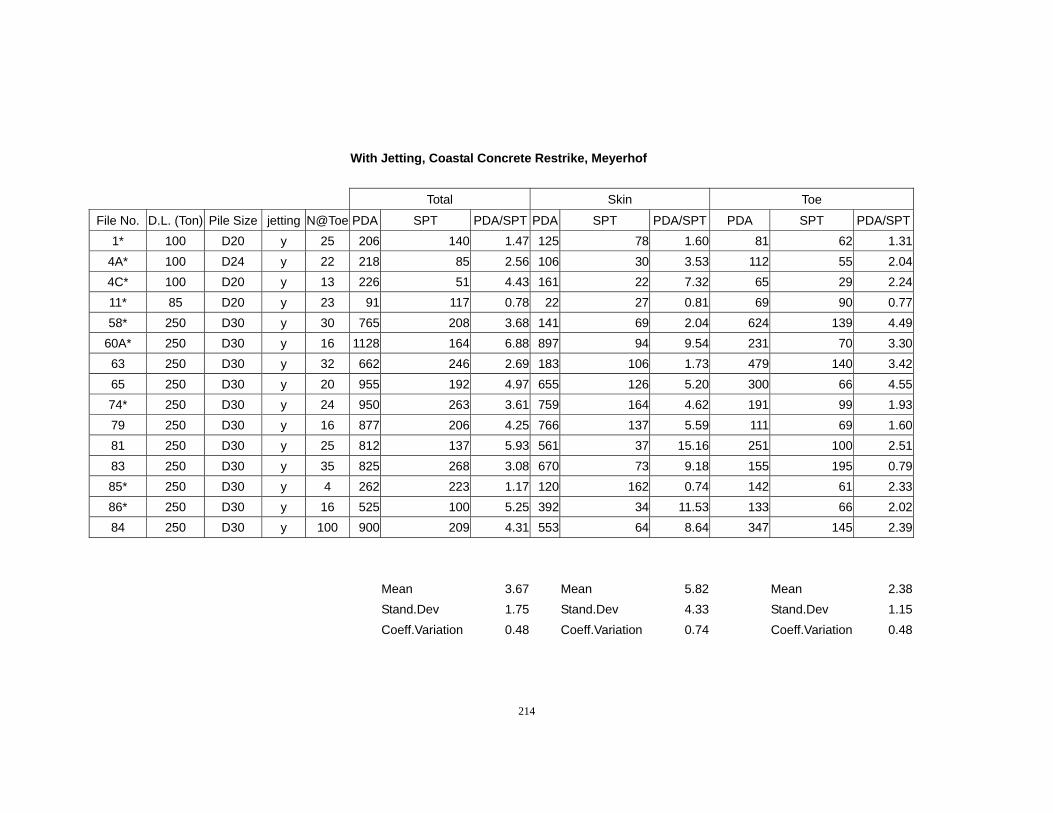
214
With Jetting, Coastal Concrete Restrike, Meyerhof
Total Skin Toe
File No. D.L. (Ton) Pile Size jetting N@Toe PDA SPT PDA/SPT PDA SPT PDA/SPT PDA SPT PDA/SPT1* 100 D20 y 25 206 140 1.47 125 78 1.60 81 62 1.31
4A* 100 D24 y 22 218 85 2.56 106 30 3.53 112 55 2.044C* 100 D20 y 13 226 51 4.43 161 22 7.32 65 29 2.2411* 85 D20 y 23 91 117 0.78 22 27 0.81 69 90 0.7758* 250 D30 y 30 765 208 3.68 141 69 2.04 624 139 4.49
60A* 250 D30 y 16 1128 164 6.88 897 94 9.54 231 70 3.3063 250 D30 y 32 662 246 2.69 183 106 1.73 479 140 3.4265 250 D30 y 20 955 192 4.97 655 126 5.20 300 66 4.5574* 250 D30 y 24 950 263 3.61 759 164 4.62 191 99 1.9379 250 D30 y 16 877 206 4.25 766 137 5.59 111 69 1.6081 250 D30 y 25 812 137 5.93 561 37 15.16 251 100 2.5183 250 D30 y 35 825 268 3.08 670 73 9.18 155 195 0.7985* 250 D30 y 4 262 223 1.17 120 162 0.74 142 61 2.3386* 250 D30 y 16 525 100 5.25 392 34 11.53 133 66 2.0284 250 D30 y 100 900 209 4.31 553 64 8.64 347 145 2.39
Mean 3.67 Mean 5.82 Mean 2.38 Stand.Dev 1.75 Stand.Dev 4.33 Stand.Dev 1.15 Coeff.Variation 0.48 Coeff.Variation 0.74 Coeff.Variation 0.48
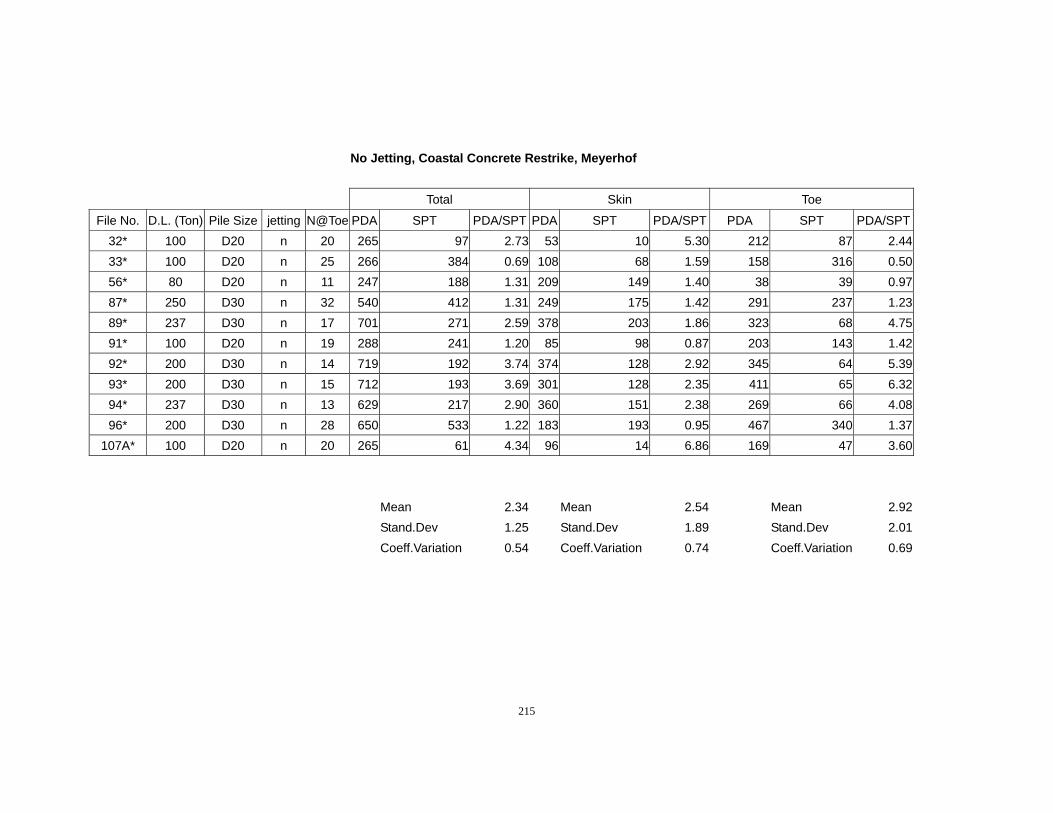
215
No Jetting, Coastal Concrete Restrike, Meyerhof
Total Skin Toe
File No. D.L. (Ton) Pile Size jetting N@Toe PDA SPT PDA/SPT PDA SPT PDA/SPT PDA SPT PDA/SPT32* 100 D20 n 20 265 97 2.73 53 10 5.30 212 87 2.4433* 100 D20 n 25 266 384 0.69 108 68 1.59 158 316 0.5056* 80 D20 n 11 247 188 1.31 209 149 1.40 38 39 0.9787* 250 D30 n 32 540 412 1.31 249 175 1.42 291 237 1.2389* 237 D30 n 17 701 271 2.59 378 203 1.86 323 68 4.7591* 100 D20 n 19 288 241 1.20 85 98 0.87 203 143 1.4292* 200 D30 n 14 719 192 3.74 374 128 2.92 345 64 5.3993* 200 D30 n 15 712 193 3.69 301 128 2.35 411 65 6.3294* 237 D30 n 13 629 217 2.90 360 151 2.38 269 66 4.0896* 200 D30 n 28 650 533 1.22 183 193 0.95 467 340 1.37
107A* 100 D20 n 20 265 61 4.34 96 14 6.86 169 47 3.60 Mean 2.34 Mean 2.54 Mean 2.92 Stand.Dev 1.25 Stand.Dev 1.89 Stand.Dev 2.01 Coeff.Variation 0.54 Coeff.Variation 0.74 Coeff.Variation 0.69
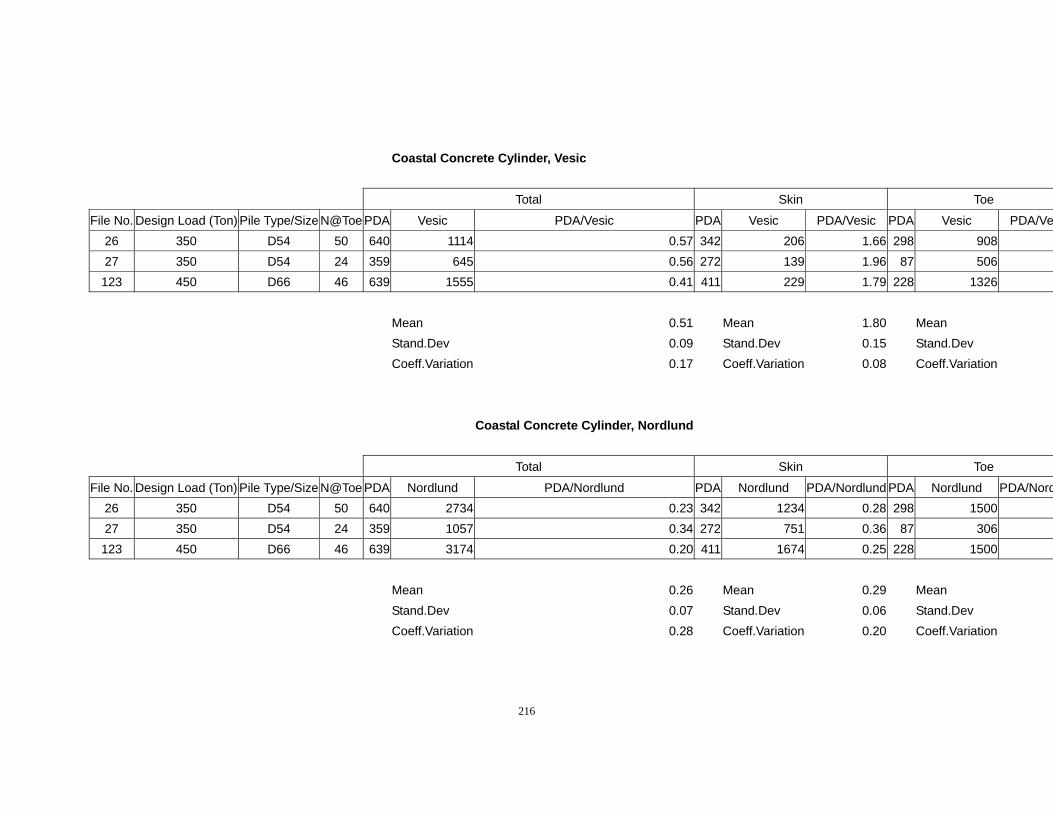
216
Coastal Concrete Cylinder, Vesic
Total Skin Toe
File No. Design Load (Ton) Pile Type/Size N@Toe PDA Vesic PDA/Vesic PDA Vesic PDA/Vesic PDA Vesic PDA/Ve26 350 D54 50 640 1114 0.57 342 206 1.66 298 908 27 350 D54 24 359 645 0.56 272 139 1.96 87 506 123 450 D66 46 639 1555 0.41 411 229 1.79 228 1326
Mean 0.51 Mean 1.80 Mean Stand.Dev 0.09 Stand.Dev 0.15 Stand.Dev Coeff.Variation 0.17 Coeff.Variation 0.08 Coeff.Variation Coastal Concrete Cylinder, Nordlund
Total Skin Toe
File No. Design Load (Ton) Pile Type/Size N@Toe PDA Nordlund PDA/Nordlund PDA Nordlund PDA/Nordlund PDA Nordlund PDA/Nord26 350 D54 50 640 2734 0.23 342 1234 0.28 298 1500 27 350 D54 24 359 1057 0.34 272 751 0.36 87 306 123 450 D66 46 639 3174 0.20 411 1674 0.25 228 1500
Mean 0.26 Mean 0.29 Mean Stand.Dev 0.07 Stand.Dev 0.06 Stand.Dev Coeff.Variation 0.28 Coeff.Variation 0.20 Coeff.Variation
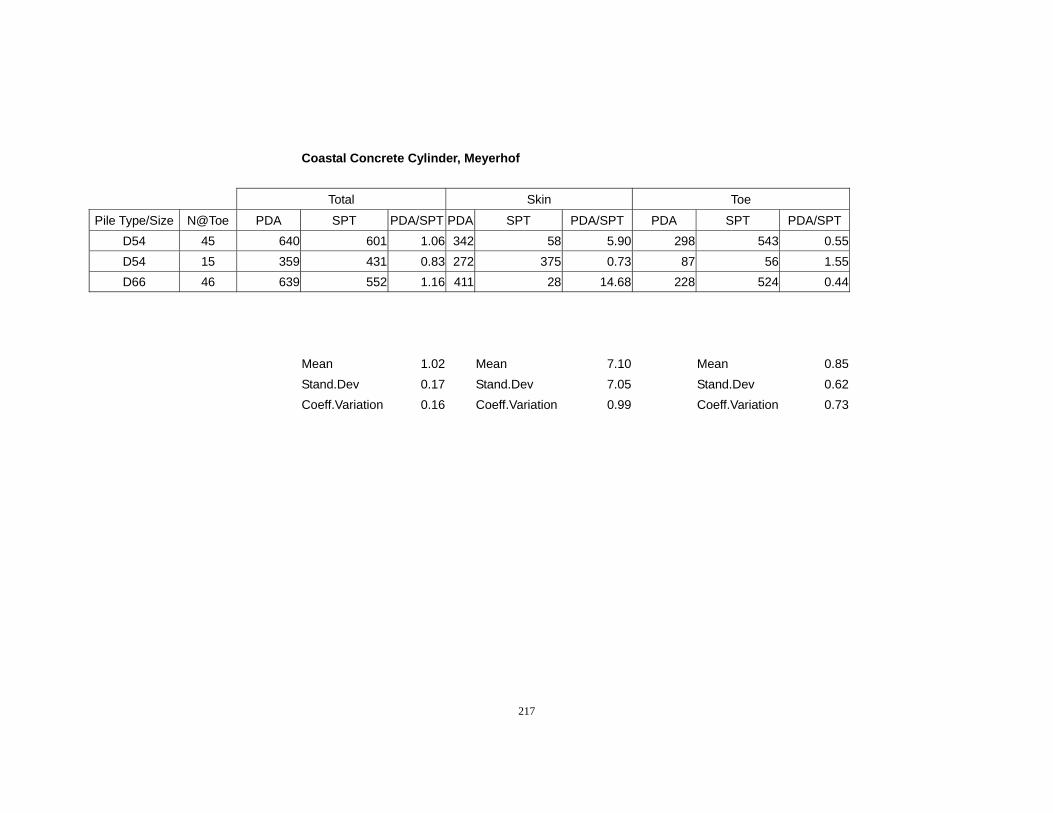
217
Coastal Concrete Cylinder, Meyerhof
Total Skin Toe
Pile Type/Size N@Toe PDA SPT PDA/SPT PDA SPT PDA/SPT PDA SPT PDA/SPT D54 45 640 601 1.06 342 58 5.90 298 543 0.55D54 15 359 431 0.83 272 375 0.73 87 56 1.55D66 46 639 552 1.16 411 28 14.68 228 524 0.44
Mean 1.02 Mean 7.10 Mean 0.85 Stand.Dev 0.17 Stand.Dev 7.05 Stand.Dev 0.62 Coeff.Variation 0.16 Coeff.Variation 0.99 Coeff.Variation 0.73
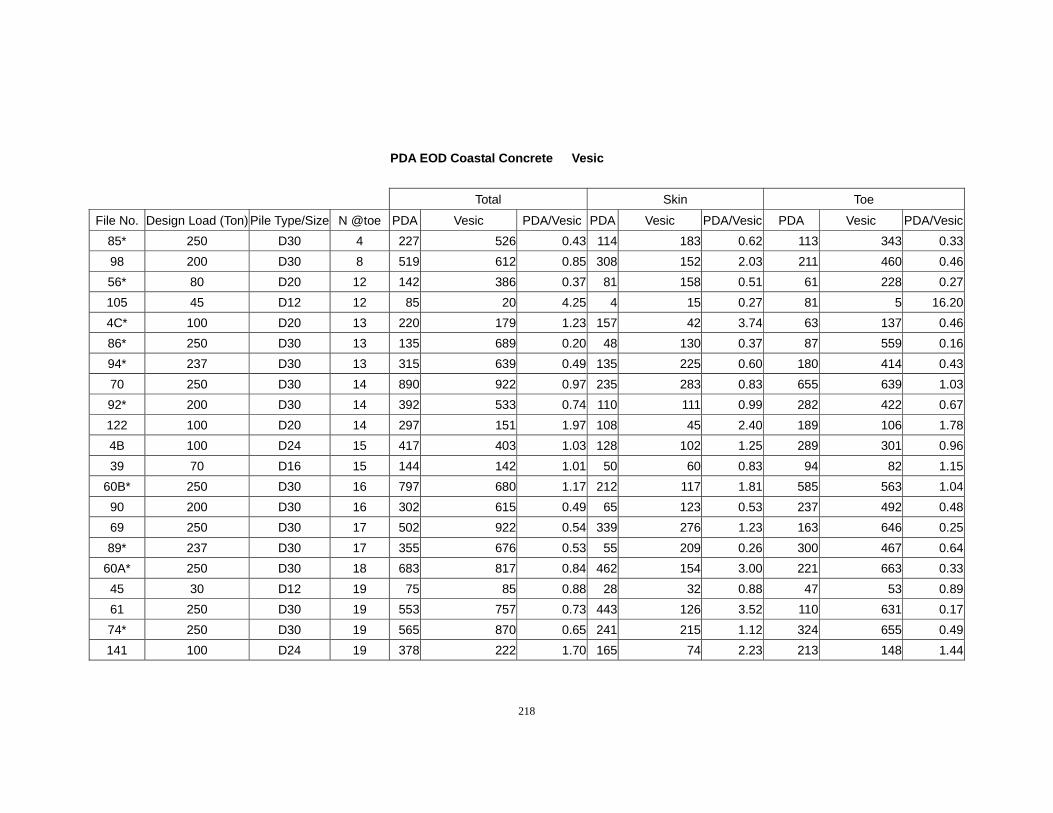
218
PDA EOD Coastal Concrete Vesic
Total Skin Toe
File No. Design Load (Ton) Pile Type/Size N @toe PDA Vesic PDA/Vesic PDA Vesic PDA/Vesic PDA Vesic PDA/Vesic85* 250 D30 4 227 526 0.43 114 183 0.62 113 343 0.3398 200 D30 8 519 612 0.85 308 152 2.03 211 460 0.4656* 80 D20 12 142 386 0.37 81 158 0.51 61 228 0.27105 45 D12 12 85 20 4.25 4 15 0.27 81 5 16.204C* 100 D20 13 220 179 1.23 157 42 3.74 63 137 0.4686* 250 D30 13 135 689 0.20 48 130 0.37 87 559 0.1694* 237 D30 13 315 639 0.49 135 225 0.60 180 414 0.4370 250 D30 14 890 922 0.97 235 283 0.83 655 639 1.0392* 200 D30 14 392 533 0.74 110 111 0.99 282 422 0.67122 100 D20 14 297 151 1.97 108 45 2.40 189 106 1.784B 100 D24 15 417 403 1.03 128 102 1.25 289 301 0.9639 70 D16 15 144 142 1.01 50 60 0.83 94 82 1.15
60B* 250 D30 16 797 680 1.17 212 117 1.81 585 563 1.0490 200 D30 16 302 615 0.49 65 123 0.53 237 492 0.4869 250 D30 17 502 922 0.54 339 276 1.23 163 646 0.2589* 237 D30 17 355 676 0.53 55 209 0.26 300 467 0.64
60A* 250 D30 18 683 817 0.84 462 154 3.00 221 663 0.3345 30 D12 19 75 85 0.88 28 32 0.88 47 53 0.8961 250 D30 19 553 757 0.73 443 126 3.52 110 631 0.1774* 250 D30 19 565 870 0.65 241 215 1.12 324 655 0.49141 100 D24 19 378 222 1.70 165 74 2.23 213 148 1.44
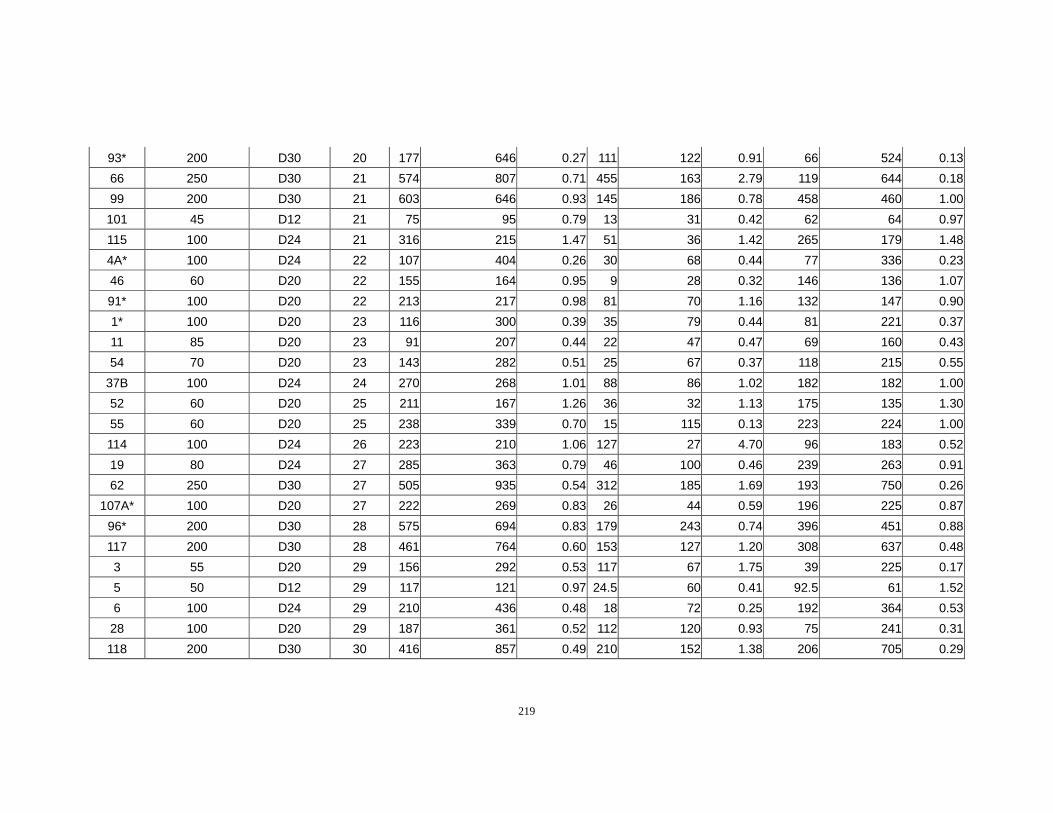
219
93* 200 D30 20 177 646 0.27 111 122 0.91 66 524 0.1366 250 D30 21 574 807 0.71 455 163 2.79 119 644 0.1899 200 D30 21 603 646 0.93 145 186 0.78 458 460 1.00
101 45 D12 21 75 95 0.79 13 31 0.42 62 64 0.97115 100 D24 21 316 215 1.47 51 36 1.42 265 179 1.484A* 100 D24 22 107 404 0.26 30 68 0.44 77 336 0.2346 60 D20 22 155 164 0.95 9 28 0.32 146 136 1.0791* 100 D20 22 213 217 0.98 81 70 1.16 132 147 0.901* 100 D20 23 116 300 0.39 35 79 0.44 81 221 0.3711 85 D20 23 91 207 0.44 22 47 0.47 69 160 0.4354 70 D20 23 143 282 0.51 25 67 0.37 118 215 0.55
37B 100 D24 24 270 268 1.01 88 86 1.02 182 182 1.0052 60 D20 25 211 167 1.26 36 32 1.13 175 135 1.3055 60 D20 25 238 339 0.70 15 115 0.13 223 224 1.00114 100 D24 26 223 210 1.06 127 27 4.70 96 183 0.5219 80 D24 27 285 363 0.79 46 100 0.46 239 263 0.9162 250 D30 27 505 935 0.54 312 185 1.69 193 750 0.26
107A* 100 D20 27 222 269 0.83 26 44 0.59 196 225 0.8796* 200 D30 28 575 694 0.83 179 243 0.74 396 451 0.88117 200 D30 28 461 764 0.60 153 127 1.20 308 637 0.483 55 D20 29 156 292 0.53 117 67 1.75 39 225 0.175 50 D12 29 117 121 0.97 24.5 60 0.41 92.5 61 1.526 100 D24 29 210 436 0.48 18 72 0.25 192 364 0.53
28 100 D20 29 187 361 0.52 112 120 0.93 75 241 0.31118 200 D30 30 416 857 0.49 210 152 1.38 206 705 0.29
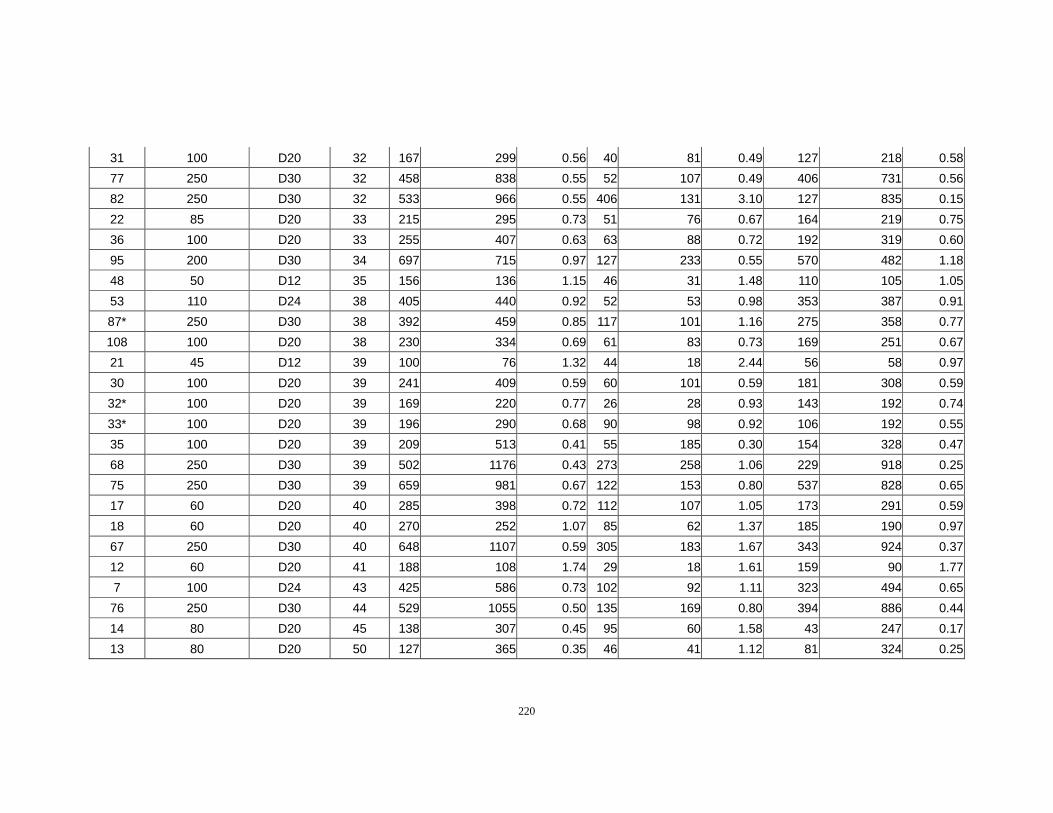
220
31 100 D20 32 167 299 0.56 40 81 0.49 127 218 0.5877 250 D30 32 458 838 0.55 52 107 0.49 406 731 0.5682 250 D30 32 533 966 0.55 406 131 3.10 127 835 0.1522 85 D20 33 215 295 0.73 51 76 0.67 164 219 0.7536 100 D20 33 255 407 0.63 63 88 0.72 192 319 0.6095 200 D30 34 697 715 0.97 127 233 0.55 570 482 1.1848 50 D12 35 156 136 1.15 46 31 1.48 110 105 1.0553 110 D24 38 405 440 0.92 52 53 0.98 353 387 0.9187* 250 D30 38 392 459 0.85 117 101 1.16 275 358 0.77108 100 D20 38 230 334 0.69 61 83 0.73 169 251 0.6721 45 D12 39 100 76 1.32 44 18 2.44 56 58 0.9730 100 D20 39 241 409 0.59 60 101 0.59 181 308 0.5932* 100 D20 39 169 220 0.77 26 28 0.93 143 192 0.7433* 100 D20 39 196 290 0.68 90 98 0.92 106 192 0.5535 100 D20 39 209 513 0.41 55 185 0.30 154 328 0.4768 250 D30 39 502 1176 0.43 273 258 1.06 229 918 0.2575 250 D30 39 659 981 0.67 122 153 0.80 537 828 0.6517 60 D20 40 285 398 0.72 112 107 1.05 173 291 0.5918 60 D20 40 270 252 1.07 85 62 1.37 185 190 0.9767 250 D30 40 648 1107 0.59 305 183 1.67 343 924 0.3712 60 D20 41 188 108 1.74 29 18 1.61 159 90 1.777 100 D24 43 425 586 0.73 102 92 1.11 323 494 0.65
76 250 D30 44 529 1055 0.50 135 169 0.80 394 886 0.4414 80 D20 45 138 307 0.45 95 60 1.58 43 247 0.1713 80 D20 50 127 365 0.35 46 41 1.12 81 324 0.25
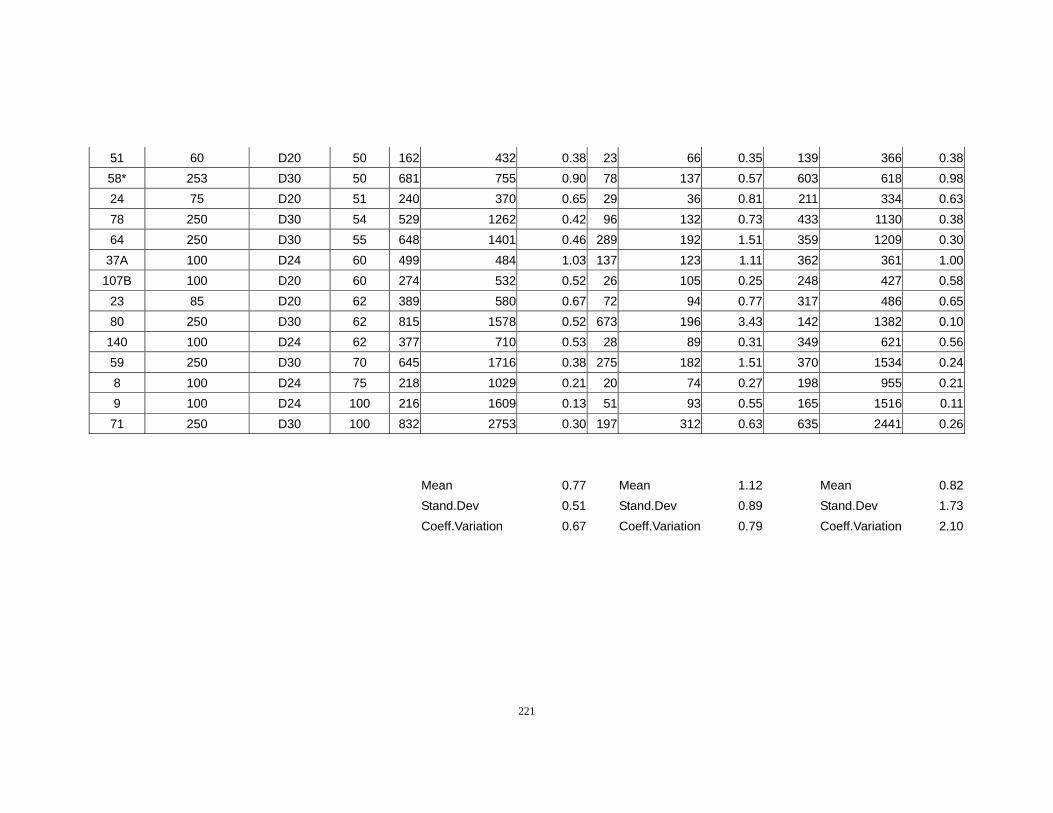
221
51 60 D20 50 162 432 0.38 23 66 0.35 139 366 0.3858* 253 D30 50 681 755 0.90 78 137 0.57 603 618 0.9824 75 D20 51 240 370 0.65 29 36 0.81 211 334 0.6378 250 D30 54 529 1262 0.42 96 132 0.73 433 1130 0.3864 250 D30 55 648 1401 0.46 289 192 1.51 359 1209 0.30
37A 100 D24 60 499 484 1.03 137 123 1.11 362 361 1.00107B 100 D20 60 274 532 0.52 26 105 0.25 248 427 0.58
23 85 D20 62 389 580 0.67 72 94 0.77 317 486 0.6580 250 D30 62 815 1578 0.52 673 196 3.43 142 1382 0.10
140 100 D24 62 377 710 0.53 28 89 0.31 349 621 0.5659 250 D30 70 645 1716 0.38 275 182 1.51 370 1534 0.248 100 D24 75 218 1029 0.21 20 74 0.27 198 955 0.219 100 D24 100 216 1609 0.13 51 93 0.55 165 1516 0.11
71 250 D30 100 832 2753 0.30 197 312 0.63 635 2441 0.26
Mean 0.77 Mean 1.12 Mean 0.82 Stand.Dev 0.51 Stand.Dev 0.89 Stand.Dev 1.73 Coeff.Variation 0.67 Coeff.Variation 0.79 Coeff.Variation 2.10
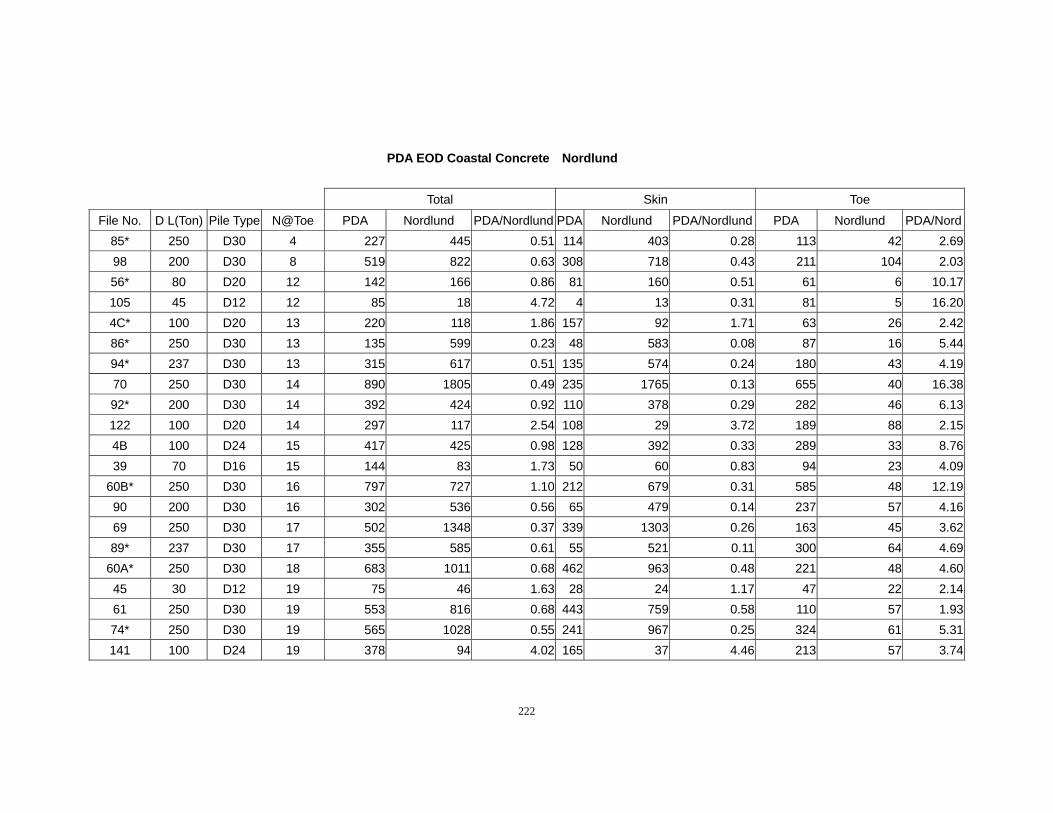
222
PDA EOD Coastal Concrete Nordlund
Total Skin Toe
File No. D L(Ton) Pile Type N@Toe PDA Nordlund PDA/Nordlund PDA Nordlund PDA/Nordlund PDA Nordlund PDA/Nord85* 250 D30 4 227 445 0.51 114 403 0.28 113 42 2.6998 200 D30 8 519 822 0.63 308 718 0.43 211 104 2.0356* 80 D20 12 142 166 0.86 81 160 0.51 61 6 10.17105 45 D12 12 85 18 4.72 4 13 0.31 81 5 16.204C* 100 D20 13 220 118 1.86 157 92 1.71 63 26 2.4286* 250 D30 13 135 599 0.23 48 583 0.08 87 16 5.4494* 237 D30 13 315 617 0.51 135 574 0.24 180 43 4.1970 250 D30 14 890 1805 0.49 235 1765 0.13 655 40 16.3892* 200 D30 14 392 424 0.92 110 378 0.29 282 46 6.13122 100 D20 14 297 117 2.54 108 29 3.72 189 88 2.154B 100 D24 15 417 425 0.98 128 392 0.33 289 33 8.7639 70 D16 15 144 83 1.73 50 60 0.83 94 23 4.09
60B* 250 D30 16 797 727 1.10 212 679 0.31 585 48 12.1990 200 D30 16 302 536 0.56 65 479 0.14 237 57 4.1669 250 D30 17 502 1348 0.37 339 1303 0.26 163 45 3.6289* 237 D30 17 355 585 0.61 55 521 0.11 300 64 4.69
60A* 250 D30 18 683 1011 0.68 462 963 0.48 221 48 4.6045 30 D12 19 75 46 1.63 28 24 1.17 47 22 2.1461 250 D30 19 553 816 0.68 443 759 0.58 110 57 1.9374* 250 D30 19 565 1028 0.55 241 967 0.25 324 61 5.31141 100 D24 19 378 94 4.02 165 37 4.46 213 57 3.74
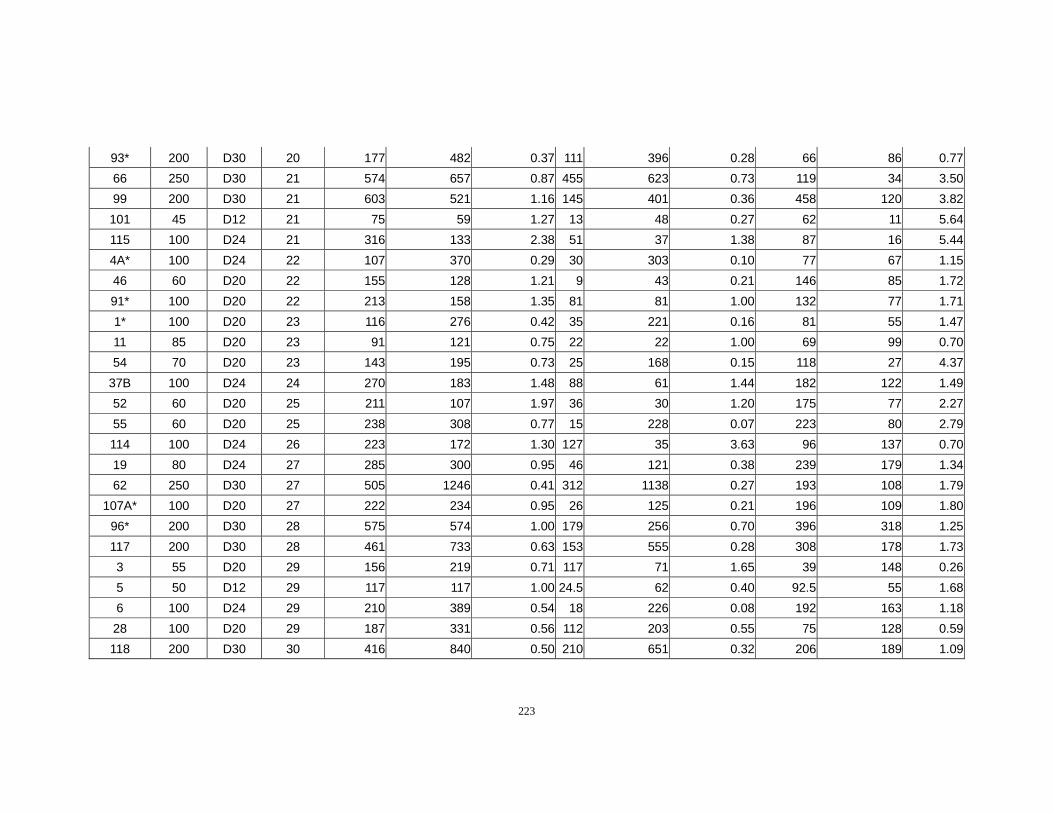
223
93* 200 D30 20 177 482 0.37 111 396 0.28 66 86 0.7766 250 D30 21 574 657 0.87 455 623 0.73 119 34 3.5099 200 D30 21 603 521 1.16 145 401 0.36 458 120 3.82101 45 D12 21 75 59 1.27 13 48 0.27 62 11 5.64115 100 D24 21 316 133 2.38 51 37 1.38 87 16 5.444A* 100 D24 22 107 370 0.29 30 303 0.10 77 67 1.1546 60 D20 22 155 128 1.21 9 43 0.21 146 85 1.7291* 100 D20 22 213 158 1.35 81 81 1.00 132 77 1.711* 100 D20 23 116 276 0.42 35 221 0.16 81 55 1.4711 85 D20 23 91 121 0.75 22 22 1.00 69 99 0.7054 70 D20 23 143 195 0.73 25 168 0.15 118 27 4.37
37B 100 D24 24 270 183 1.48 88 61 1.44 182 122 1.4952 60 D20 25 211 107 1.97 36 30 1.20 175 77 2.2755 60 D20 25 238 308 0.77 15 228 0.07 223 80 2.79114 100 D24 26 223 172 1.30 127 35 3.63 96 137 0.7019 80 D24 27 285 300 0.95 46 121 0.38 239 179 1.3462 250 D30 27 505 1246 0.41 312 1138 0.27 193 108 1.79
107A* 100 D20 27 222 234 0.95 26 125 0.21 196 109 1.8096* 200 D30 28 575 574 1.00 179 256 0.70 396 318 1.25117 200 D30 28 461 733 0.63 153 555 0.28 308 178 1.733 55 D20 29 156 219 0.71 117 71 1.65 39 148 0.265 50 D12 29 117 117 1.00 24.5 62 0.40 92.5 55 1.686 100 D24 29 210 389 0.54 18 226 0.08 192 163 1.1828 100 D20 29 187 331 0.56 112 203 0.55 75 128 0.59118 200 D30 30 416 840 0.50 210 651 0.32 206 189 1.09
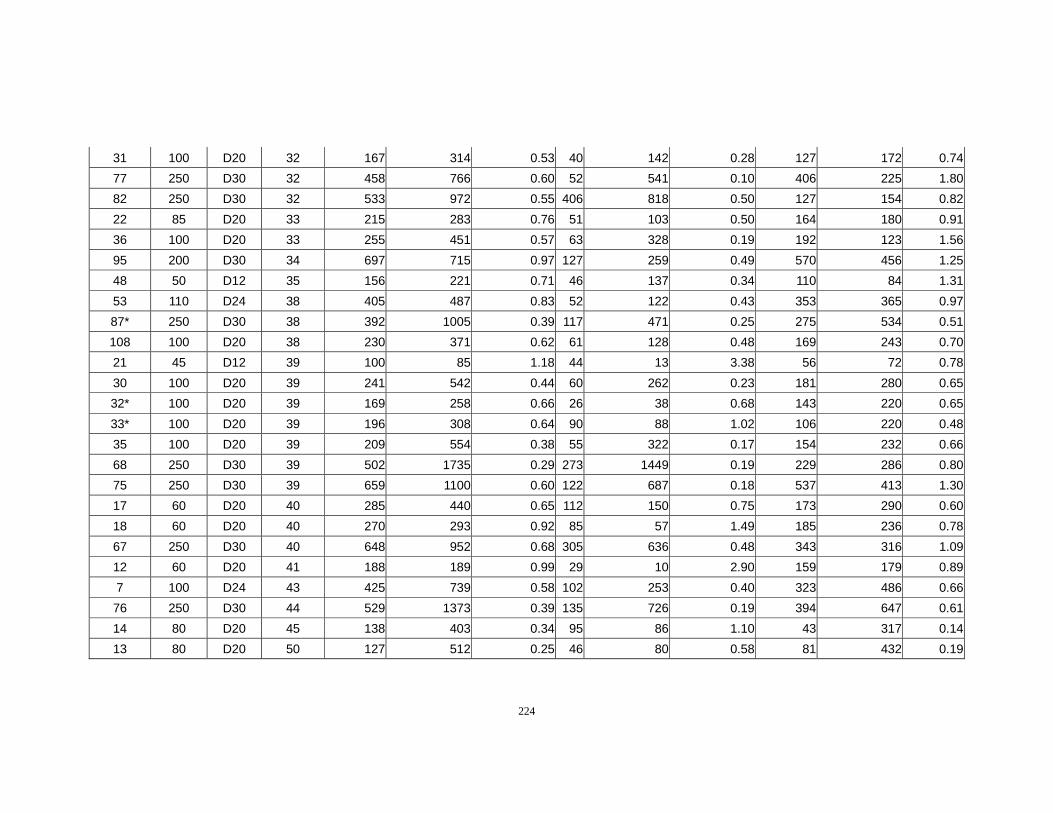
224
31 100 D20 32 167 314 0.53 40 142 0.28 127 172 0.7477 250 D30 32 458 766 0.60 52 541 0.10 406 225 1.8082 250 D30 32 533 972 0.55 406 818 0.50 127 154 0.8222 85 D20 33 215 283 0.76 51 103 0.50 164 180 0.9136 100 D20 33 255 451 0.57 63 328 0.19 192 123 1.5695 200 D30 34 697 715 0.97 127 259 0.49 570 456 1.2548 50 D12 35 156 221 0.71 46 137 0.34 110 84 1.3153 110 D24 38 405 487 0.83 52 122 0.43 353 365 0.9787* 250 D30 38 392 1005 0.39 117 471 0.25 275 534 0.51108 100 D20 38 230 371 0.62 61 128 0.48 169 243 0.7021 45 D12 39 100 85 1.18 44 13 3.38 56 72 0.7830 100 D20 39 241 542 0.44 60 262 0.23 181 280 0.6532* 100 D20 39 169 258 0.66 26 38 0.68 143 220 0.6533* 100 D20 39 196 308 0.64 90 88 1.02 106 220 0.4835 100 D20 39 209 554 0.38 55 322 0.17 154 232 0.6668 250 D30 39 502 1735 0.29 273 1449 0.19 229 286 0.8075 250 D30 39 659 1100 0.60 122 687 0.18 537 413 1.3017 60 D20 40 285 440 0.65 112 150 0.75 173 290 0.6018 60 D20 40 270 293 0.92 85 57 1.49 185 236 0.7867 250 D30 40 648 952 0.68 305 636 0.48 343 316 1.0912 60 D20 41 188 189 0.99 29 10 2.90 159 179 0.897 100 D24 43 425 739 0.58 102 253 0.40 323 486 0.6676 250 D30 44 529 1373 0.39 135 726 0.19 394 647 0.6114 80 D20 45 138 403 0.34 95 86 1.10 43 317 0.1413 80 D20 50 127 512 0.25 46 80 0.58 81 432 0.19
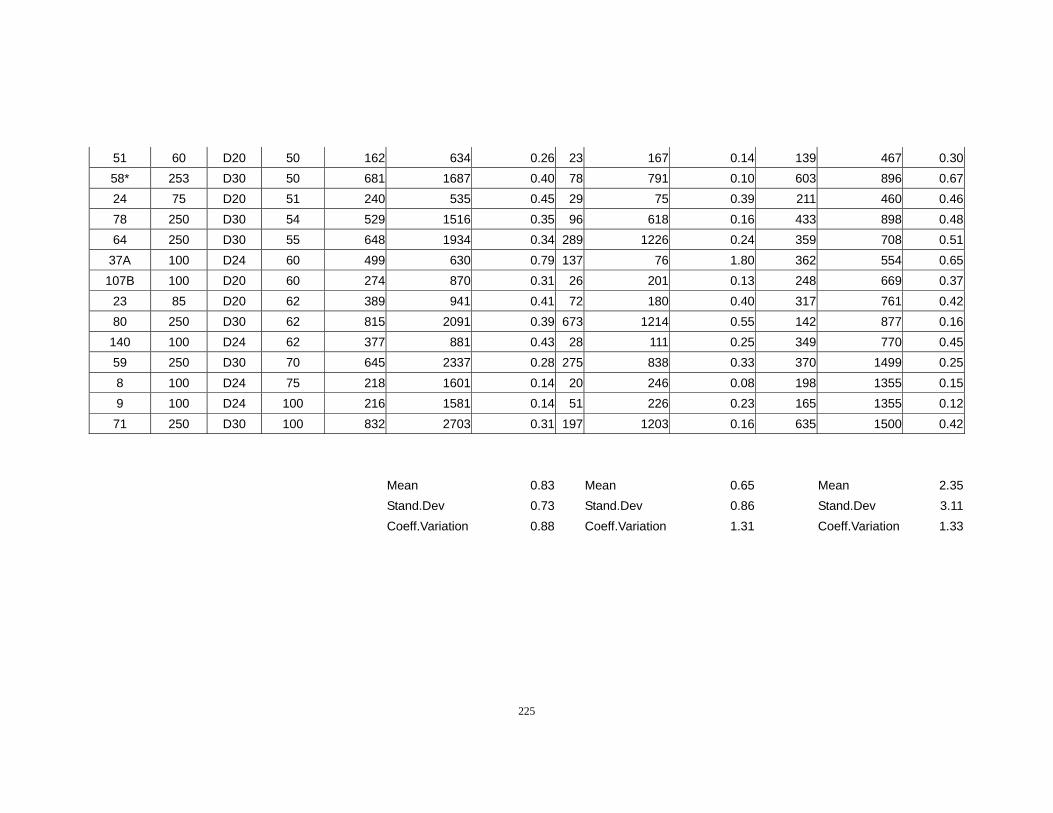
225
51 60 D20 50 162 634 0.26 23 167 0.14 139 467 0.3058* 253 D30 50 681 1687 0.40 78 791 0.10 603 896 0.6724 75 D20 51 240 535 0.45 29 75 0.39 211 460 0.4678 250 D30 54 529 1516 0.35 96 618 0.16 433 898 0.4864 250 D30 55 648 1934 0.34 289 1226 0.24 359 708 0.51
37A 100 D24 60 499 630 0.79 137 76 1.80 362 554 0.65107B 100 D20 60 274 870 0.31 26 201 0.13 248 669 0.37
23 85 D20 62 389 941 0.41 72 180 0.40 317 761 0.4280 250 D30 62 815 2091 0.39 673 1214 0.55 142 877 0.16140 100 D24 62 377 881 0.43 28 111 0.25 349 770 0.4559 250 D30 70 645 2337 0.28 275 838 0.33 370 1499 0.258 100 D24 75 218 1601 0.14 20 246 0.08 198 1355 0.159 100 D24 100 216 1581 0.14 51 226 0.23 165 1355 0.1271 250 D30 100 832 2703 0.31 197 1203 0.16 635 1500 0.42
Mean 0.83 Mean 0.65 Mean 2.35 Stand.Dev 0.73 Stand.Dev 0.86 Stand.Dev 3.11 Coeff.Variation 0.88 Coeff.Variation 1.31 Coeff.Variation 1.33
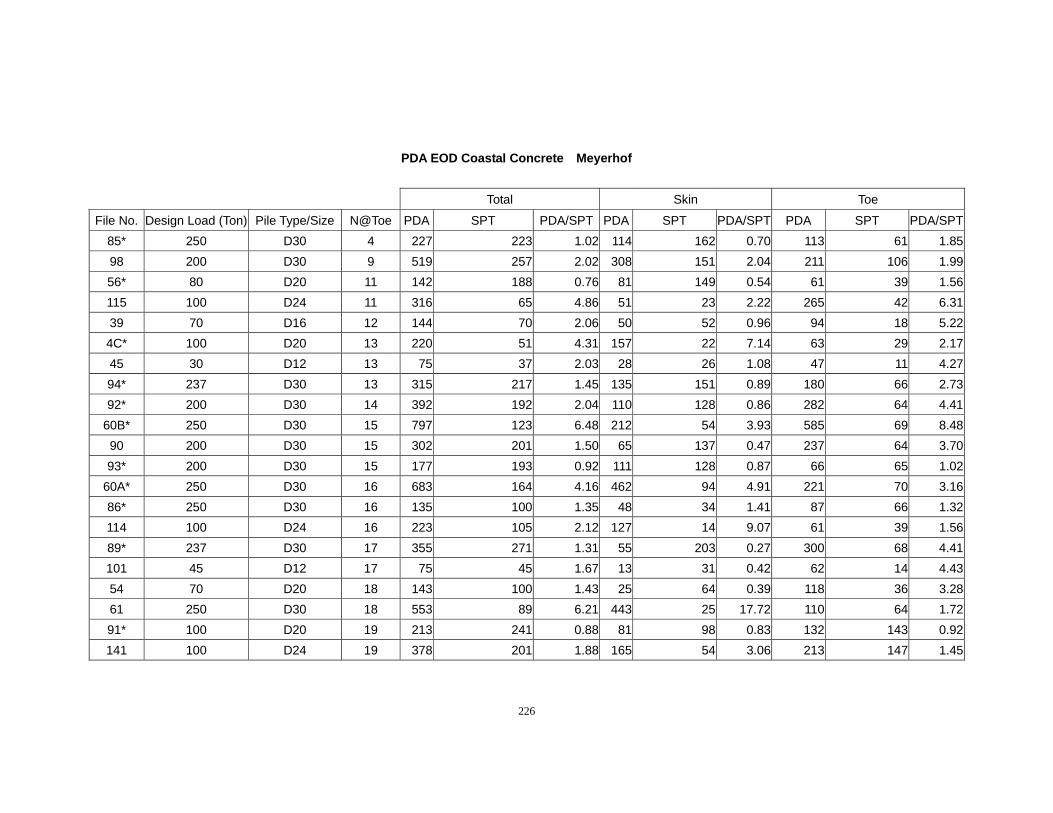
226
PDA EOD Coastal Concrete Meyerhof
Total Skin Toe
File No. Design Load (Ton) Pile Type/Size N@Toe PDA SPT PDA/SPT PDA SPT PDA/SPT PDA SPT PDA/SPT85* 250 D30 4 227 223 1.02 114 162 0.70 113 61 1.8598 200 D30 9 519 257 2.02 308 151 2.04 211 106 1.9956* 80 D20 11 142 188 0.76 81 149 0.54 61 39 1.56115 100 D24 11 316 65 4.86 51 23 2.22 265 42 6.3139 70 D16 12 144 70 2.06 50 52 0.96 94 18 5.22
4C* 100 D20 13 220 51 4.31 157 22 7.14 63 29 2.1745 30 D12 13 75 37 2.03 28 26 1.08 47 11 4.2794* 237 D30 13 315 217 1.45 135 151 0.89 180 66 2.7392* 200 D30 14 392 192 2.04 110 128 0.86 282 64 4.41
60B* 250 D30 15 797 123 6.48 212 54 3.93 585 69 8.4890 200 D30 15 302 201 1.50 65 137 0.47 237 64 3.7093* 200 D30 15 177 193 0.92 111 128 0.87 66 65 1.02
60A* 250 D30 16 683 164 4.16 462 94 4.91 221 70 3.1686* 250 D30 16 135 100 1.35 48 34 1.41 87 66 1.32114 100 D24 16 223 105 2.12 127 14 9.07 61 39 1.5689* 237 D30 17 355 271 1.31 55 203 0.27 300 68 4.41101 45 D12 17 75 45 1.67 13 31 0.42 62 14 4.4354 70 D20 18 143 100 1.43 25 64 0.39 118 36 3.2861 250 D30 18 553 89 6.21 443 25 17.72 110 64 1.7291* 100 D20 19 213 241 0.88 81 98 0.83 132 143 0.92141 100 D24 19 378 201 1.88 165 54 3.06 213 147 1.45
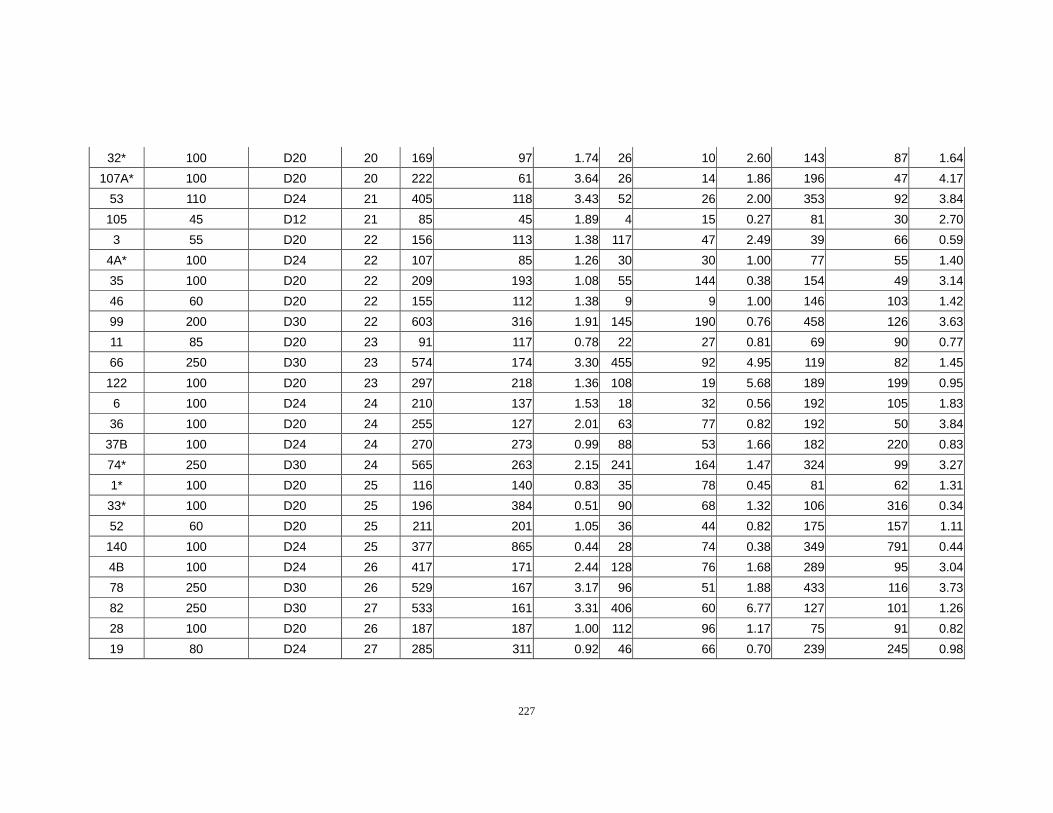
227
32* 100 D20 20 169 97 1.74 26 10 2.60 143 87 1.64107A* 100 D20 20 222 61 3.64 26 14 1.86 196 47 4.17
53 110 D24 21 405 118 3.43 52 26 2.00 353 92 3.84105 45 D12 21 85 45 1.89 4 15 0.27 81 30 2.703 55 D20 22 156 113 1.38 117 47 2.49 39 66 0.59
4A* 100 D24 22 107 85 1.26 30 30 1.00 77 55 1.4035 100 D20 22 209 193 1.08 55 144 0.38 154 49 3.1446 60 D20 22 155 112 1.38 9 9 1.00 146 103 1.4299 200 D30 22 603 316 1.91 145 190 0.76 458 126 3.6311 85 D20 23 91 117 0.78 22 27 0.81 69 90 0.7766 250 D30 23 574 174 3.30 455 92 4.95 119 82 1.45
122 100 D20 23 297 218 1.36 108 19 5.68 189 199 0.956 100 D24 24 210 137 1.53 18 32 0.56 192 105 1.8336 100 D20 24 255 127 2.01 63 77 0.82 192 50 3.84
37B 100 D24 24 270 273 0.99 88 53 1.66 182 220 0.8374* 250 D30 24 565 263 2.15 241 164 1.47 324 99 3.271* 100 D20 25 116 140 0.83 35 78 0.45 81 62 1.31
33* 100 D20 25 196 384 0.51 90 68 1.32 106 316 0.3452 60 D20 25 211 201 1.05 36 44 0.82 175 157 1.11
140 100 D24 25 377 865 0.44 28 74 0.38 349 791 0.444B 100 D24 26 417 171 2.44 128 76 1.68 289 95 3.0478 250 D30 26 529 167 3.17 96 51 1.88 433 116 3.7382 250 D30 27 533 161 3.31 406 60 6.77 127 101 1.2628 100 D20 26 187 187 1.00 112 96 1.17 75 91 0.8219 80 D24 27 285 311 0.92 46 66 0.70 239 245 0.98
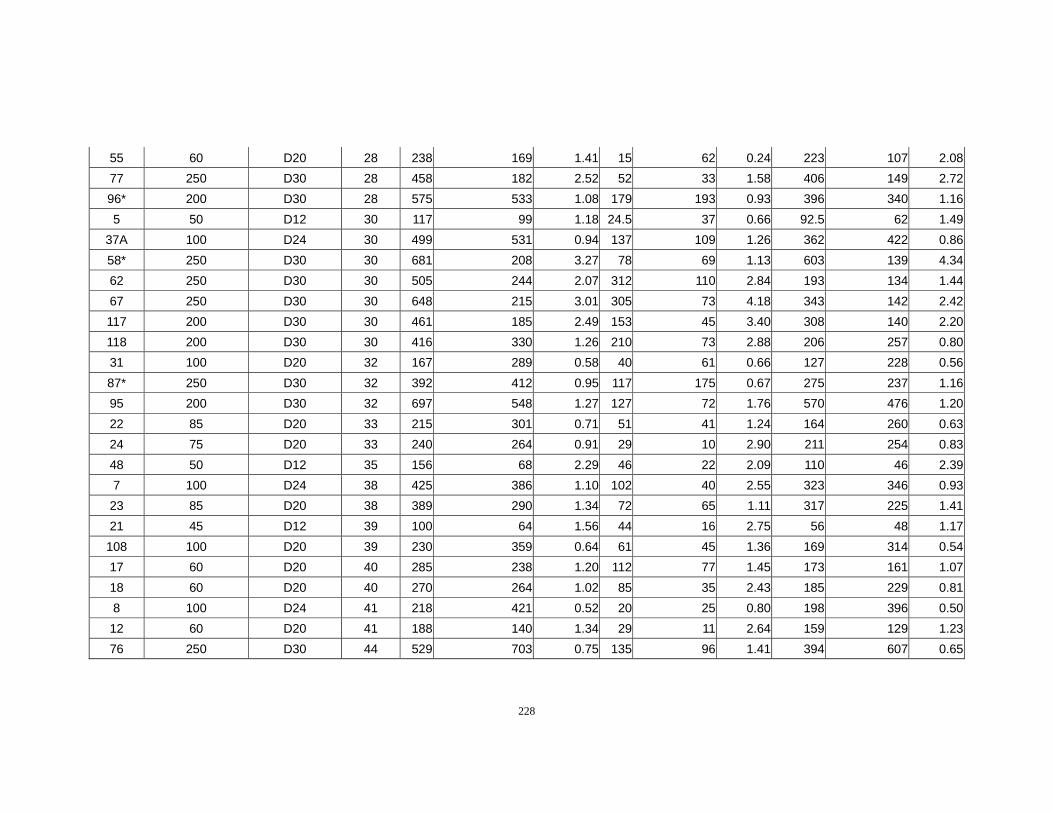
228
55 60 D20 28 238 169 1.41 15 62 0.24 223 107 2.0877 250 D30 28 458 182 2.52 52 33 1.58 406 149 2.7296* 200 D30 28 575 533 1.08 179 193 0.93 396 340 1.165 50 D12 30 117 99 1.18 24.5 37 0.66 92.5 62 1.49
37A 100 D24 30 499 531 0.94 137 109 1.26 362 422 0.8658* 250 D30 30 681 208 3.27 78 69 1.13 603 139 4.3462 250 D30 30 505 244 2.07 312 110 2.84 193 134 1.4467 250 D30 30 648 215 3.01 305 73 4.18 343 142 2.42117 200 D30 30 461 185 2.49 153 45 3.40 308 140 2.20118 200 D30 30 416 330 1.26 210 73 2.88 206 257 0.8031 100 D20 32 167 289 0.58 40 61 0.66 127 228 0.5687* 250 D30 32 392 412 0.95 117 175 0.67 275 237 1.1695 200 D30 32 697 548 1.27 127 72 1.76 570 476 1.2022 85 D20 33 215 301 0.71 51 41 1.24 164 260 0.6324 75 D20 33 240 264 0.91 29 10 2.90 211 254 0.8348 50 D12 35 156 68 2.29 46 22 2.09 110 46 2.397 100 D24 38 425 386 1.10 102 40 2.55 323 346 0.9323 85 D20 38 389 290 1.34 72 65 1.11 317 225 1.4121 45 D12 39 100 64 1.56 44 16 2.75 56 48 1.17
108 100 D20 39 230 359 0.64 61 45 1.36 169 314 0.5417 60 D20 40 285 238 1.20 112 77 1.45 173 161 1.0718 60 D20 40 270 264 1.02 85 35 2.43 185 229 0.818 100 D24 41 218 421 0.52 20 25 0.80 198 396 0.5012 60 D20 41 188 140 1.34 29 11 2.64 159 129 1.2376 250 D30 44 529 703 0.75 135 96 1.41 394 607 0.65
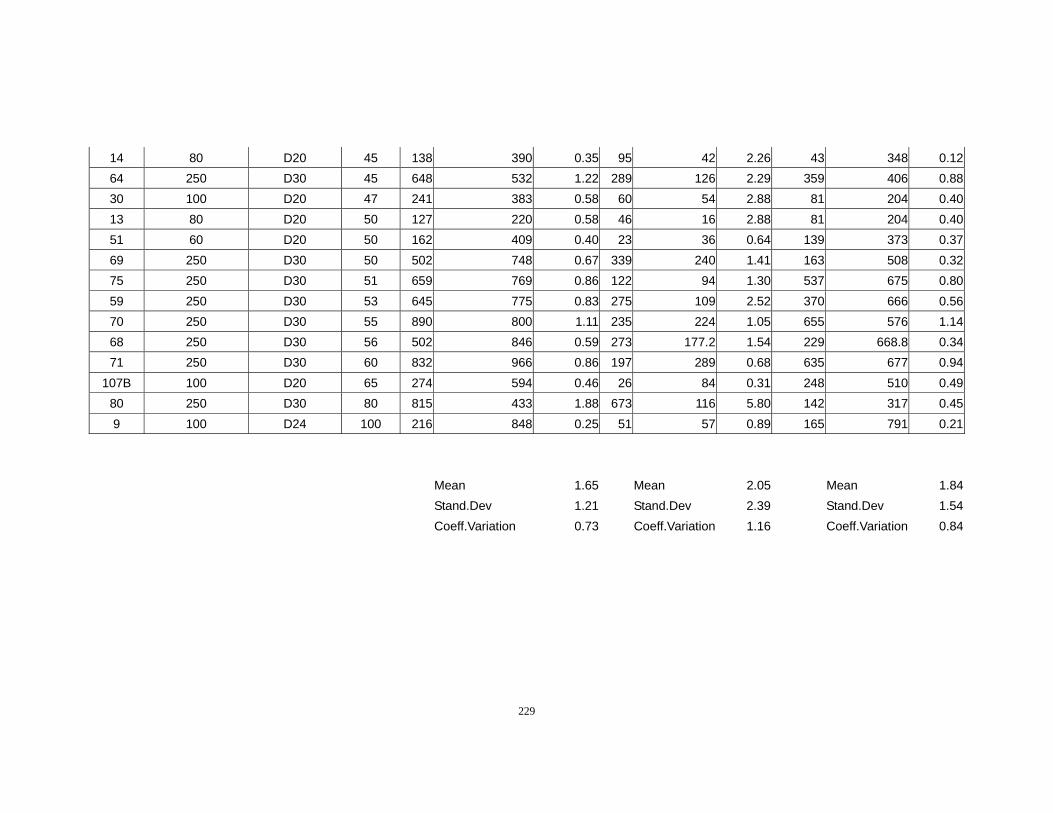
229
14 80 D20 45 138 390 0.35 95 42 2.26 43 348 0.1264 250 D30 45 648 532 1.22 289 126 2.29 359 406 0.8830 100 D20 47 241 383 0.58 60 54 2.88 81 204 0.4013 80 D20 50 127 220 0.58 46 16 2.88 81 204 0.4051 60 D20 50 162 409 0.40 23 36 0.64 139 373 0.3769 250 D30 50 502 748 0.67 339 240 1.41 163 508 0.3275 250 D30 51 659 769 0.86 122 94 1.30 537 675 0.8059 250 D30 53 645 775 0.83 275 109 2.52 370 666 0.5670 250 D30 55 890 800 1.11 235 224 1.05 655 576 1.1468 250 D30 56 502 846 0.59 273 177.2 1.54 229 668.8 0.3471 250 D30 60 832 966 0.86 197 289 0.68 635 677 0.94
107B 100 D20 65 274 594 0.46 26 84 0.31 248 510 0.4980 250 D30 80 815 433 1.88 673 116 5.80 142 317 0.459 100 D24 100 216 848 0.25 51 57 0.89 165 791 0.21
Mean 1.65 Mean 2.05 Mean 1.84 Stand.Dev 1.21 Stand.Dev 2.39 Stand.Dev 1.54 Coeff.Variation 0.73 Coeff.Variation 1.16 Coeff.Variation 0.84
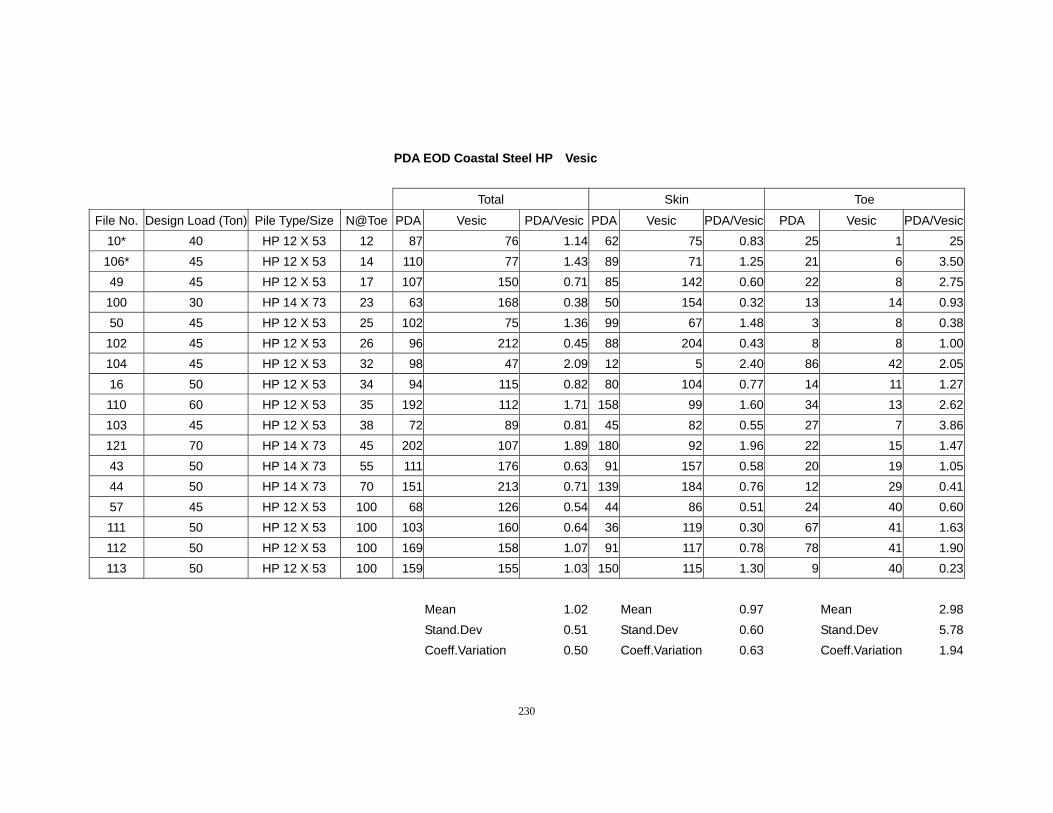
230
PDA EOD Coastal Steel HP Vesic
Total Skin Toe
File No. Design Load (Ton) Pile Type/Size N@Toe PDA Vesic PDA/Vesic PDA Vesic PDA/Vesic PDA Vesic PDA/Vesic10* 40 HP 12 X 53 12 87 76 1.14 62 75 0.83 25 1 25
106* 45 HP 12 X 53 14 110 77 1.43 89 71 1.25 21 6 3.5049 45 HP 12 X 53 17 107 150 0.71 85 142 0.60 22 8 2.75
100 30 HP 14 X 73 23 63 168 0.38 50 154 0.32 13 14 0.9350 45 HP 12 X 53 25 102 75 1.36 99 67 1.48 3 8 0.38
102 45 HP 12 X 53 26 96 212 0.45 88 204 0.43 8 8 1.00104 45 HP 12 X 53 32 98 47 2.09 12 5 2.40 86 42 2.0516 50 HP 12 X 53 34 94 115 0.82 80 104 0.77 14 11 1.27110 60 HP 12 X 53 35 192 112 1.71 158 99 1.60 34 13 2.62103 45 HP 12 X 53 38 72 89 0.81 45 82 0.55 27 7 3.86121 70 HP 14 X 73 45 202 107 1.89 180 92 1.96 22 15 1.4743 50 HP 14 X 73 55 111 176 0.63 91 157 0.58 20 19 1.0544 50 HP 14 X 73 70 151 213 0.71 139 184 0.76 12 29 0.4157 45 HP 12 X 53 100 68 126 0.54 44 86 0.51 24 40 0.60111 50 HP 12 X 53 100 103 160 0.64 36 119 0.30 67 41 1.63112 50 HP 12 X 53 100 169 158 1.07 91 117 0.78 78 41 1.90113 50 HP 12 X 53 100 159 155 1.03 150 115 1.30 9 40 0.23
Mean 1.02 Mean 0.97 Mean 2.98 Stand.Dev 0.51 Stand.Dev 0.60 Stand.Dev 5.78 Coeff.Variation 0.50 Coeff.Variation 0.63 Coeff.Variation 1.94
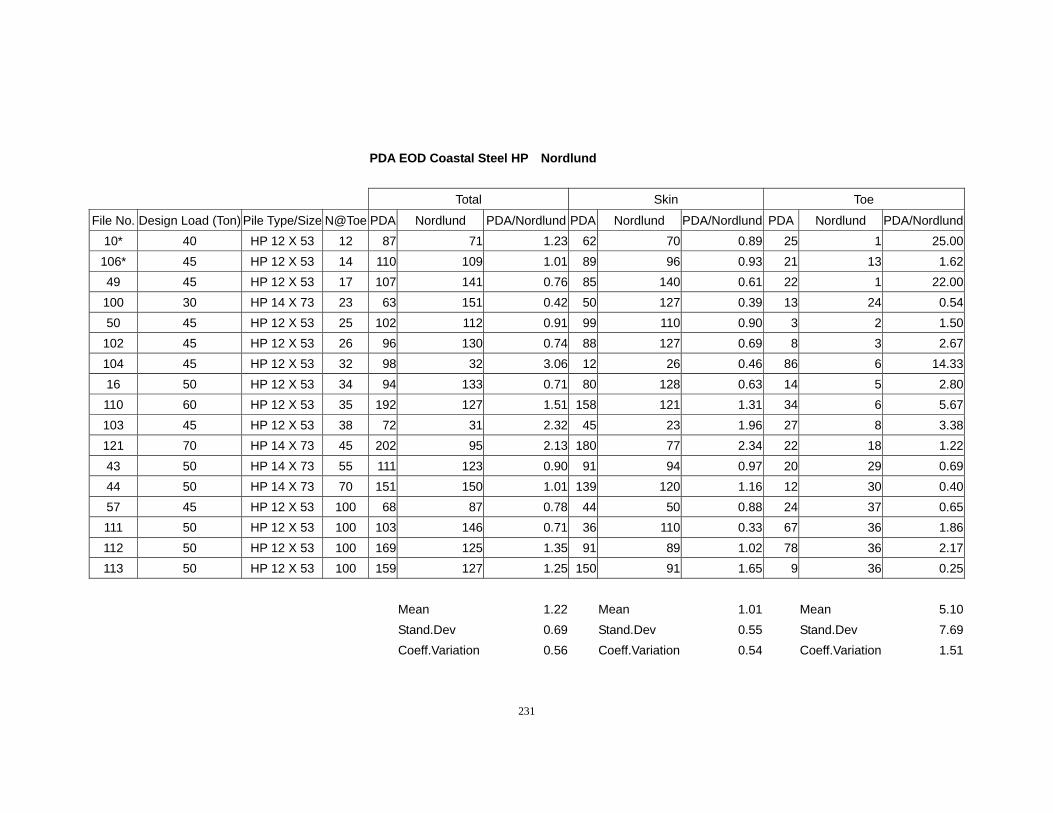
231
PDA EOD Coastal Steel HP Nordlund
Total Skin Toe
File No. Design Load (Ton) Pile Type/Size N@Toe PDA Nordlund PDA/Nordlund PDA Nordlund PDA/Nordlund PDA Nordlund PDA/Nordlund10* 40 HP 12 X 53 12 87 71 1.23 62 70 0.89 25 1 25.00106* 45 HP 12 X 53 14 110 109 1.01 89 96 0.93 21 13 1.6249 45 HP 12 X 53 17 107 141 0.76 85 140 0.61 22 1 22.00
100 30 HP 14 X 73 23 63 151 0.42 50 127 0.39 13 24 0.5450 45 HP 12 X 53 25 102 112 0.91 99 110 0.90 3 2 1.50
102 45 HP 12 X 53 26 96 130 0.74 88 127 0.69 8 3 2.67104 45 HP 12 X 53 32 98 32 3.06 12 26 0.46 86 6 14.3316 50 HP 12 X 53 34 94 133 0.71 80 128 0.63 14 5 2.80110 60 HP 12 X 53 35 192 127 1.51 158 121 1.31 34 6 5.67103 45 HP 12 X 53 38 72 31 2.32 45 23 1.96 27 8 3.38121 70 HP 14 X 73 45 202 95 2.13 180 77 2.34 22 18 1.2243 50 HP 14 X 73 55 111 123 0.90 91 94 0.97 20 29 0.6944 50 HP 14 X 73 70 151 150 1.01 139 120 1.16 12 30 0.4057 45 HP 12 X 53 100 68 87 0.78 44 50 0.88 24 37 0.65111 50 HP 12 X 53 100 103 146 0.71 36 110 0.33 67 36 1.86112 50 HP 12 X 53 100 169 125 1.35 91 89 1.02 78 36 2.17113 50 HP 12 X 53 100 159 127 1.25 150 91 1.65 9 36 0.25
Mean 1.22 Mean 1.01 Mean 5.10 Stand.Dev 0.69 Stand.Dev 0.55 Stand.Dev 7.69 Coeff.Variation 0.56 Coeff.Variation 0.54 Coeff.Variation 1.51
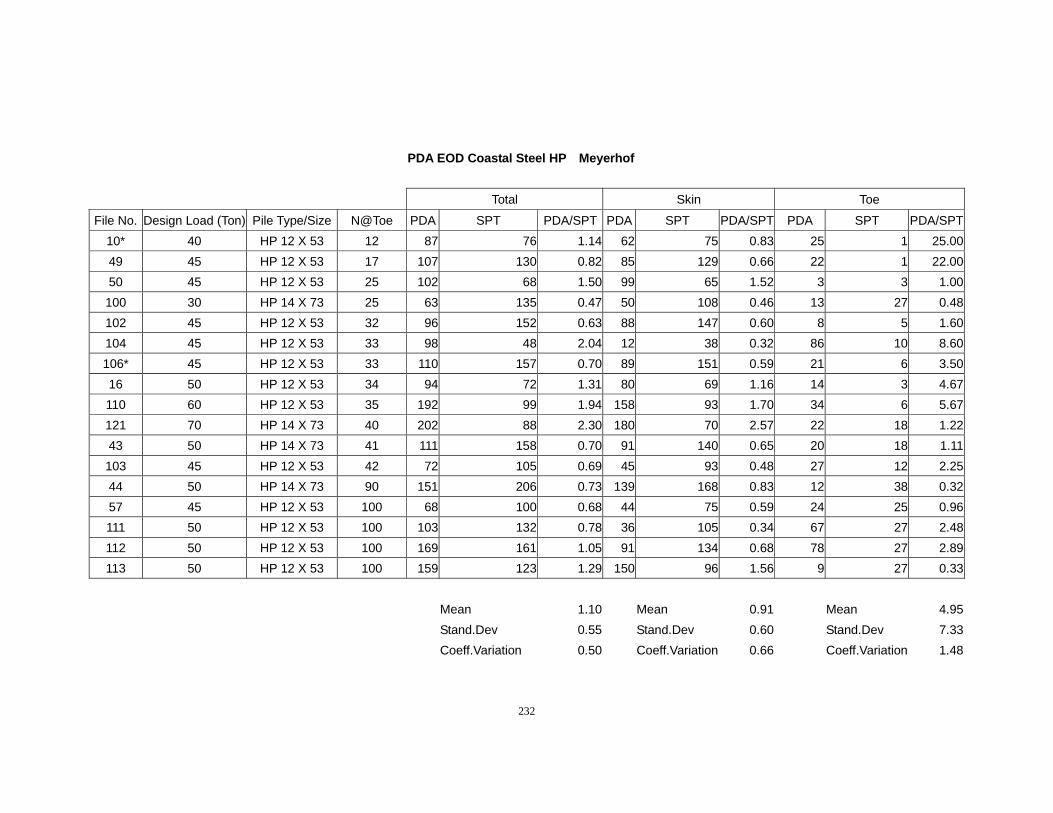
232
PDA EOD Coastal Steel HP Meyerhof
Total Skin Toe
File No. Design Load (Ton) Pile Type/Size N@Toe PDA SPT PDA/SPT PDA SPT PDA/SPT PDA SPT PDA/SPT10* 40 HP 12 X 53 12 87 76 1.14 62 75 0.83 25 1 25.0049 45 HP 12 X 53 17 107 130 0.82 85 129 0.66 22 1 22.0050 45 HP 12 X 53 25 102 68 1.50 99 65 1.52 3 3 1.00100 30 HP 14 X 73 25 63 135 0.47 50 108 0.46 13 27 0.48102 45 HP 12 X 53 32 96 152 0.63 88 147 0.60 8 5 1.60104 45 HP 12 X 53 33 98 48 2.04 12 38 0.32 86 10 8.60106* 45 HP 12 X 53 33 110 157 0.70 89 151 0.59 21 6 3.5016 50 HP 12 X 53 34 94 72 1.31 80 69 1.16 14 3 4.67110 60 HP 12 X 53 35 192 99 1.94 158 93 1.70 34 6 5.67121 70 HP 14 X 73 40 202 88 2.30 180 70 2.57 22 18 1.2243 50 HP 14 X 73 41 111 158 0.70 91 140 0.65 20 18 1.11103 45 HP 12 X 53 42 72 105 0.69 45 93 0.48 27 12 2.2544 50 HP 14 X 73 90 151 206 0.73 139 168 0.83 12 38 0.3257 45 HP 12 X 53 100 68 100 0.68 44 75 0.59 24 25 0.96111 50 HP 12 X 53 100 103 132 0.78 36 105 0.34 67 27 2.48112 50 HP 12 X 53 100 169 161 1.05 91 134 0.68 78 27 2.89113 50 HP 12 X 53 100 159 123 1.29 150 96 1.56 9 27 0.33
Mean 1.10 Mean 0.91 Mean 4.95 Stand.Dev 0.55 Stand.Dev 0.60 Stand.Dev 7.33 Coeff.Variation 0.50 Coeff.Variation 0.66 Coeff.Variation 1.48
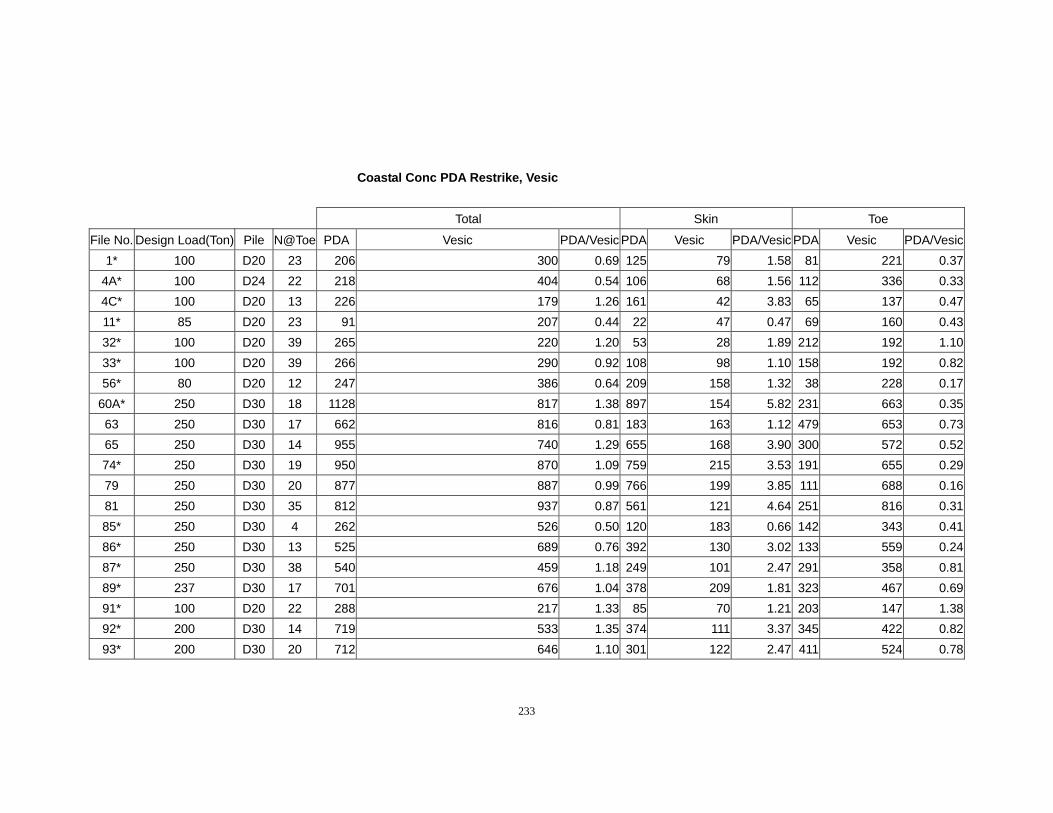
233
Coastal Conc PDA Restrike, Vesic
Total Skin Toe
File No. Design Load(Ton) Pile N@Toe PDA Vesic PDA/Vesic PDA Vesic PDA/Vesic PDA Vesic PDA/Vesic1* 100 D20 23 206 300 0.69 125 79 1.58 81 221 0.37
4A* 100 D24 22 218 404 0.54 106 68 1.56 112 336 0.334C* 100 D20 13 226 179 1.26 161 42 3.83 65 137 0.4711* 85 D20 23 91 207 0.44 22 47 0.47 69 160 0.4332* 100 D20 39 265 220 1.20 53 28 1.89 212 192 1.1033* 100 D20 39 266 290 0.92 108 98 1.10 158 192 0.8256* 80 D20 12 247 386 0.64 209 158 1.32 38 228 0.17
60A* 250 D30 18 1128 817 1.38 897 154 5.82 231 663 0.3563 250 D30 17 662 816 0.81 183 163 1.12 479 653 0.7365 250 D30 14 955 740 1.29 655 168 3.90 300 572 0.5274* 250 D30 19 950 870 1.09 759 215 3.53 191 655 0.2979 250 D30 20 877 887 0.99 766 199 3.85 111 688 0.1681 250 D30 35 812 937 0.87 561 121 4.64 251 816 0.3185* 250 D30 4 262 526 0.50 120 183 0.66 142 343 0.4186* 250 D30 13 525 689 0.76 392 130 3.02 133 559 0.2487* 250 D30 38 540 459 1.18 249 101 2.47 291 358 0.8189* 237 D30 17 701 676 1.04 378 209 1.81 323 467 0.6991* 100 D20 22 288 217 1.33 85 70 1.21 203 147 1.3892* 200 D30 14 719 533 1.35 374 111 3.37 345 422 0.8293* 200 D30 20 712 646 1.10 301 122 2.47 411 524 0.78
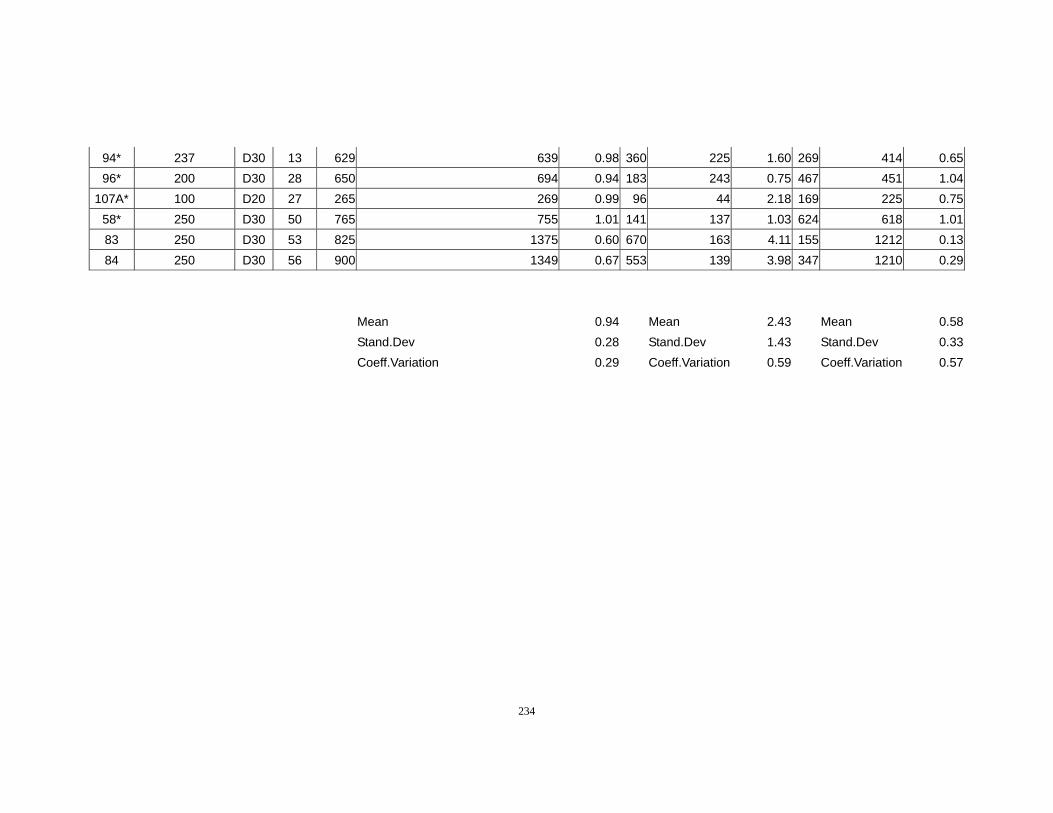
234
94* 237 D30 13 629 639 0.98 360 225 1.60 269 414 0.6596* 200 D30 28 650 694 0.94 183 243 0.75 467 451 1.04
107A* 100 D20 27 265 269 0.99 96 44 2.18 169 225 0.7558* 250 D30 50 765 755 1.01 141 137 1.03 624 618 1.0183 250 D30 53 825 1375 0.60 670 163 4.11 155 1212 0.1384 250 D30 56 900 1349 0.67 553 139 3.98 347 1210 0.29
Mean 0.94 Mean 2.43 Mean 0.58 Stand.Dev 0.28 Stand.Dev 1.43 Stand.Dev 0.33 Coeff.Variation 0.29 Coeff.Variation 0.59 Coeff.Variation 0.57
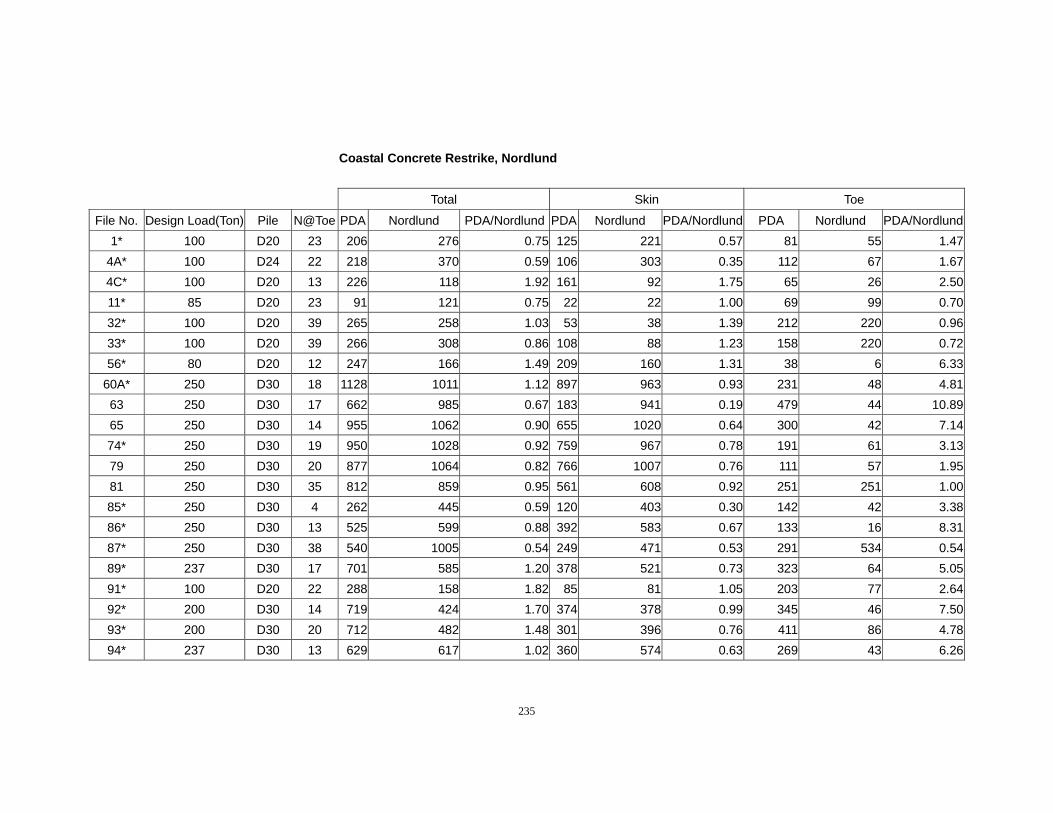
235
Coastal Concrete Restrike, Nordlund
Total Skin Toe
File No. Design Load(Ton) Pile N@Toe PDA Nordlund PDA/Nordlund PDA Nordlund PDA/Nordlund PDA Nordlund PDA/Nordlund1* 100 D20 23 206 276 0.75 125 221 0.57 81 55 1.47
4A* 100 D24 22 218 370 0.59 106 303 0.35 112 67 1.674C* 100 D20 13 226 118 1.92 161 92 1.75 65 26 2.5011* 85 D20 23 91 121 0.75 22 22 1.00 69 99 0.7032* 100 D20 39 265 258 1.03 53 38 1.39 212 220 0.9633* 100 D20 39 266 308 0.86 108 88 1.23 158 220 0.7256* 80 D20 12 247 166 1.49 209 160 1.31 38 6 6.33
60A* 250 D30 18 1128 1011 1.12 897 963 0.93 231 48 4.8163 250 D30 17 662 985 0.67 183 941 0.19 479 44 10.8965 250 D30 14 955 1062 0.90 655 1020 0.64 300 42 7.1474* 250 D30 19 950 1028 0.92 759 967 0.78 191 61 3.1379 250 D30 20 877 1064 0.82 766 1007 0.76 111 57 1.9581 250 D30 35 812 859 0.95 561 608 0.92 251 251 1.0085* 250 D30 4 262 445 0.59 120 403 0.30 142 42 3.3886* 250 D30 13 525 599 0.88 392 583 0.67 133 16 8.3187* 250 D30 38 540 1005 0.54 249 471 0.53 291 534 0.5489* 237 D30 17 701 585 1.20 378 521 0.73 323 64 5.0591* 100 D20 22 288 158 1.82 85 81 1.05 203 77 2.6492* 200 D30 14 719 424 1.70 374 378 0.99 345 46 7.5093* 200 D30 20 712 482 1.48 301 396 0.76 411 86 4.7894* 237 D30 13 629 617 1.02 360 574 0.63 269 43 6.26
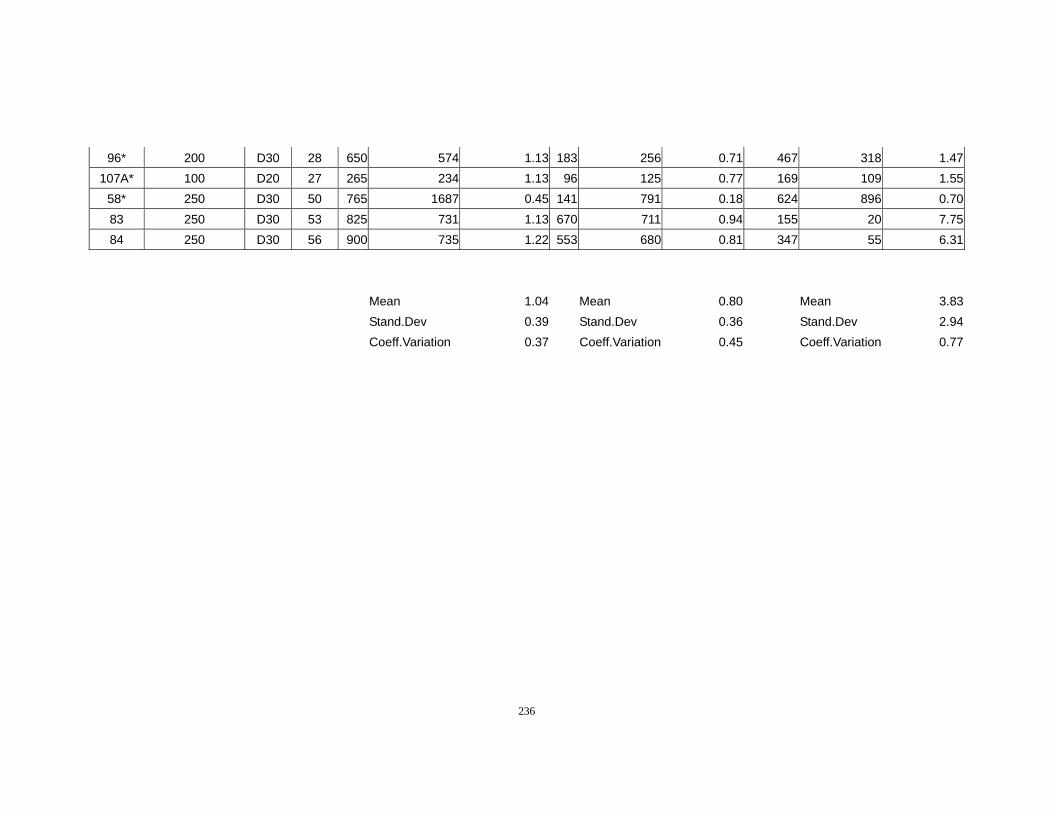
236
96* 200 D30 28 650 574 1.13 183 256 0.71 467 318 1.47107A* 100 D20 27 265 234 1.13 96 125 0.77 169 109 1.55
58* 250 D30 50 765 1687 0.45 141 791 0.18 624 896 0.7083 250 D30 53 825 731 1.13 670 711 0.94 155 20 7.7584 250 D30 56 900 735 1.22 553 680 0.81 347 55 6.31
Mean 1.04 Mean 0.80 Mean 3.83 Stand.Dev 0.39 Stand.Dev 0.36 Stand.Dev 2.94 Coeff.Variation 0.37 Coeff.Variation 0.45 Coeff.Variation 0.77
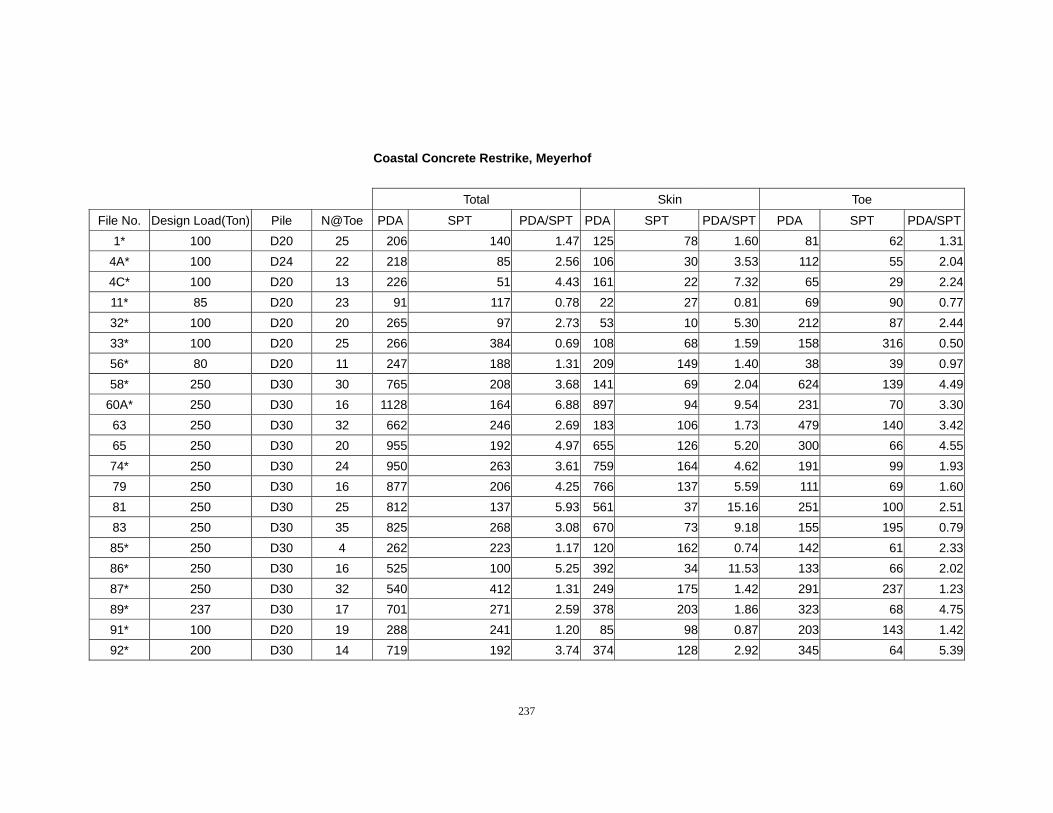
237
Coastal Concrete Restrike, Meyerhof
Total Skin Toe
File No. Design Load(Ton) Pile N@Toe PDA SPT PDA/SPT PDA SPT PDA/SPT PDA SPT PDA/SPT1* 100 D20 25 206 140 1.47 125 78 1.60 81 62 1.31
4A* 100 D24 22 218 85 2.56 106 30 3.53 112 55 2.044C* 100 D20 13 226 51 4.43 161 22 7.32 65 29 2.2411* 85 D20 23 91 117 0.78 22 27 0.81 69 90 0.7732* 100 D20 20 265 97 2.73 53 10 5.30 212 87 2.4433* 100 D20 25 266 384 0.69 108 68 1.59 158 316 0.5056* 80 D20 11 247 188 1.31 209 149 1.40 38 39 0.9758* 250 D30 30 765 208 3.68 141 69 2.04 624 139 4.49
60A* 250 D30 16 1128 164 6.88 897 94 9.54 231 70 3.3063 250 D30 32 662 246 2.69 183 106 1.73 479 140 3.4265 250 D30 20 955 192 4.97 655 126 5.20 300 66 4.5574* 250 D30 24 950 263 3.61 759 164 4.62 191 99 1.9379 250 D30 16 877 206 4.25 766 137 5.59 111 69 1.6081 250 D30 25 812 137 5.93 561 37 15.16 251 100 2.5183 250 D30 35 825 268 3.08 670 73 9.18 155 195 0.7985* 250 D30 4 262 223 1.17 120 162 0.74 142 61 2.3386* 250 D30 16 525 100 5.25 392 34 11.53 133 66 2.0287* 250 D30 32 540 412 1.31 249 175 1.42 291 237 1.2389* 237 D30 17 701 271 2.59 378 203 1.86 323 68 4.7591* 100 D20 19 288 241 1.20 85 98 0.87 203 143 1.4292* 200 D30 14 719 192 3.74 374 128 2.92 345 64 5.39
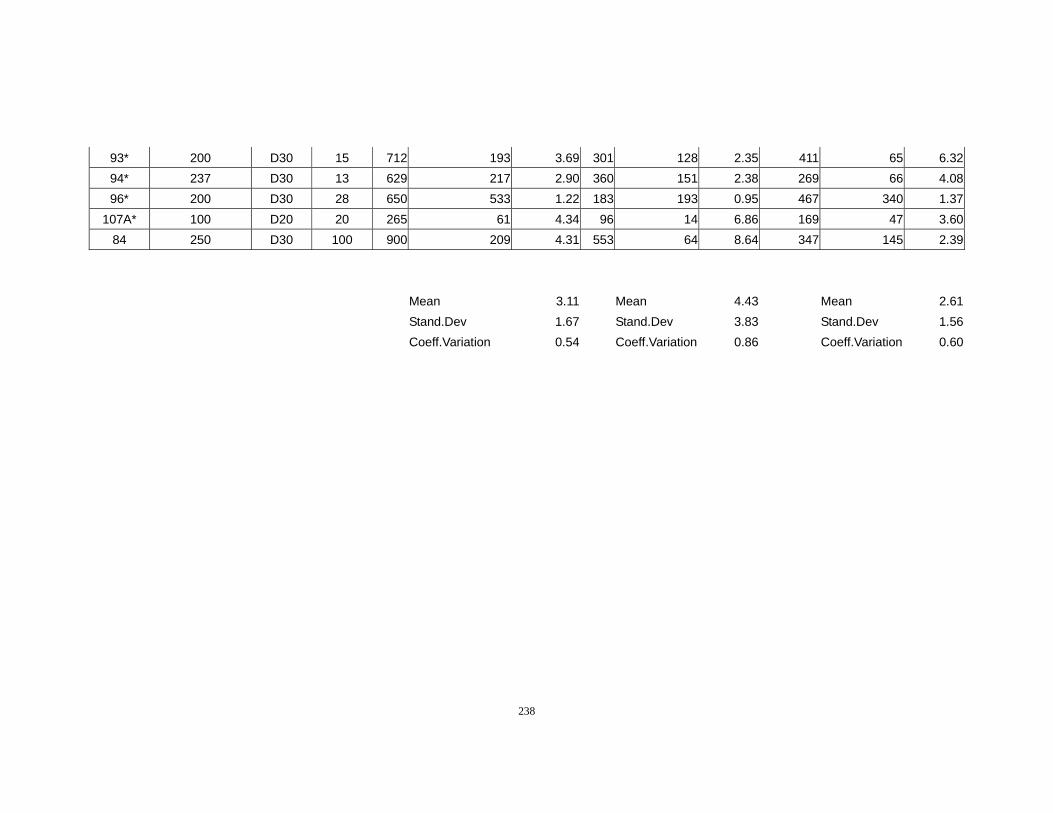
238
93* 200 D30 15 712 193 3.69 301 128 2.35 411 65 6.3294* 237 D30 13 629 217 2.90 360 151 2.38 269 66 4.0896* 200 D30 28 650 533 1.22 183 193 0.95 467 340 1.37
107A* 100 D20 20 265 61 4.34 96 14 6.86 169 47 3.6084 250 D30 100 900 209 4.31 553 64 8.64 347 145 2.39
Mean 3.11 Mean 4.43 Mean 2.61 Stand.Dev 1.67 Stand.Dev 3.83 Stand.Dev 1.56 Coeff.Variation 0.54 Coeff.Variation 0.86 Coeff.Variation 0.60
239
APPENDIX D
Reliability
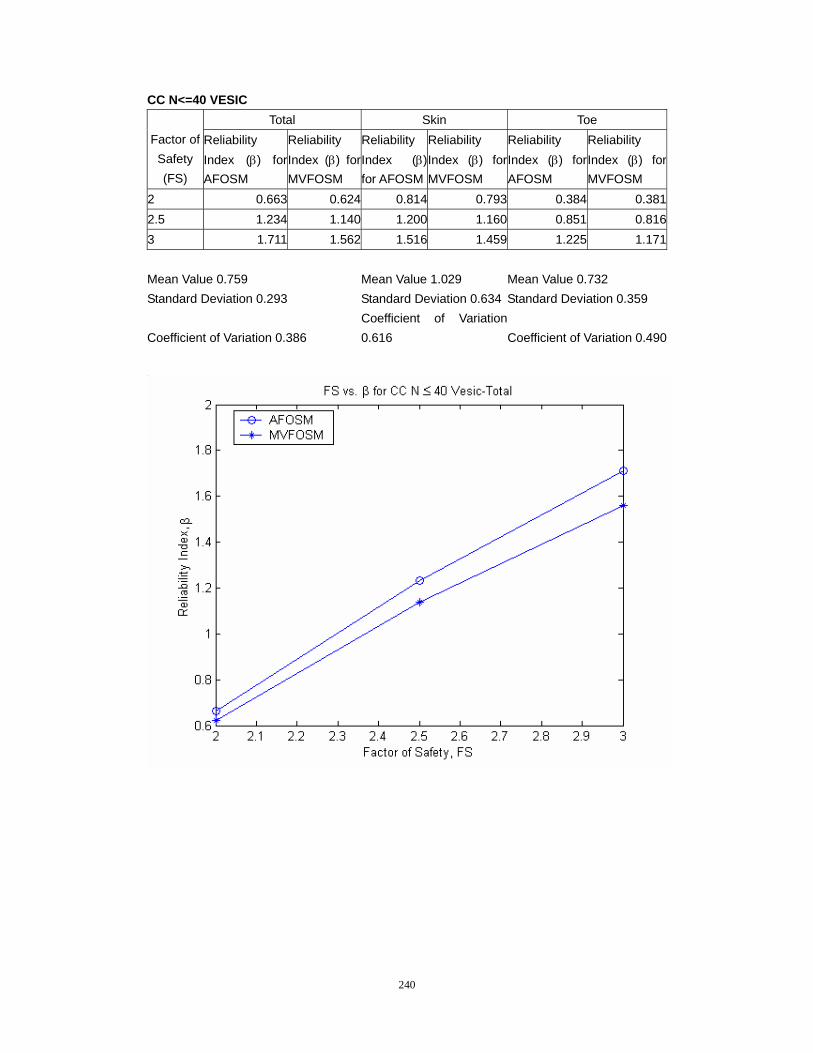
240
CC N<=40 VESIC Total Skin Toe
Factor of Safety (FS)
Reliability Index (β) for AFOSM
Reliability Index (β) for MVFOSM
Reliability Index (β) for AFOSM
Reliability Index (β) for MVFOSM
Reliability Index (β) for AFOSM
Reliability Index (β) for MVFOSM
2 0.663 0.624 0.814 0.793 0.384 0.3812.5 1.234 1.140 1.200 1.160 0.851 0.8163 1.711 1.562 1.516 1.459 1.225 1.171 Mean Value 0.759 Mean Value 1.029 Mean Value 0.732 Standard Deviation 0.293 Standard Deviation 0.634 Standard Deviation 0.359
Coefficient of Variation 0.386 Coefficient of Variation 0.616 Coefficient of Variation 0.490
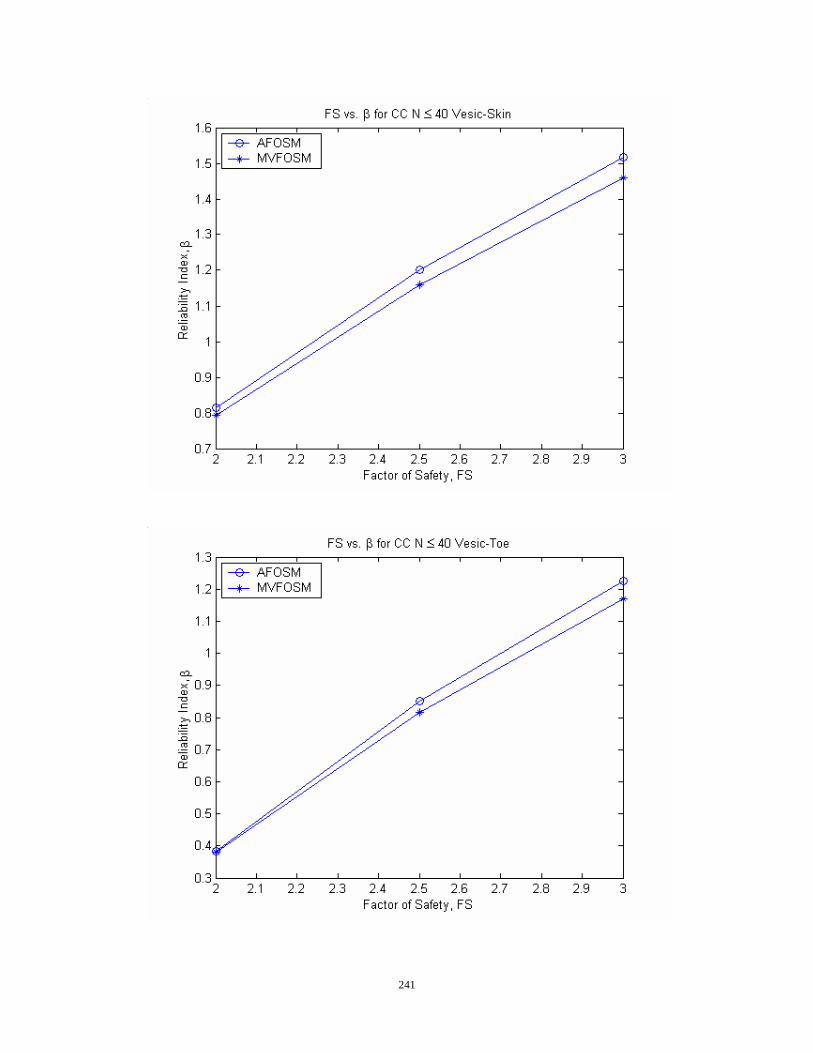
241
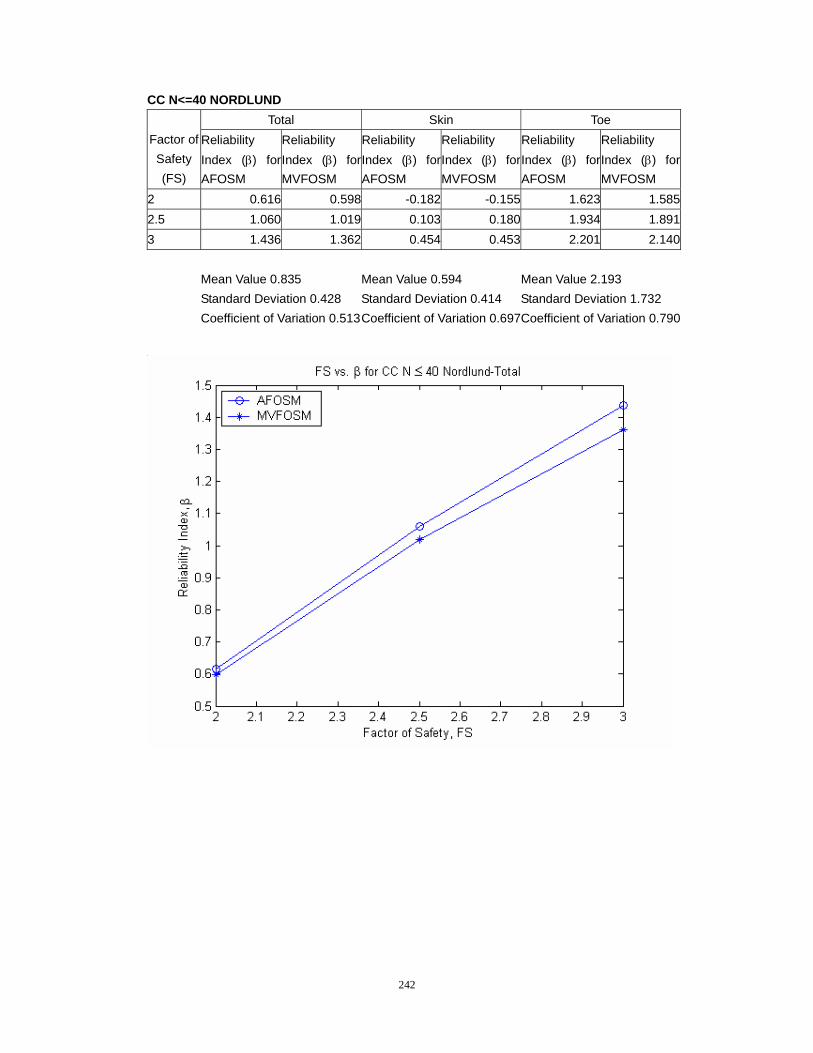
242
CC N<=40 NORDLUND Total Skin Toe
Factor of Safety (FS)
Reliability Index (β) for AFOSM
Reliability Index (β) for MVFOSM
Reliability Index (β) for AFOSM
Reliability Index (β) for MVFOSM
Reliability Index (β) for AFOSM
Reliability Index (β) for MVFOSM
2 0.616 0.598 -0.182 -0.155 1.623 1.5852.5 1.060 1.019 0.103 0.180 1.934 1.8913 1.436 1.362 0.454 0.453 2.201 2.140 Mean Value 0.835 Mean Value 0.594 Mean Value 2.193 Standard Deviation 0.428 Standard Deviation 0.414 Standard Deviation 1.732 Coefficient of Variation 0.513Coefficient of Variation 0.697Coefficient of Variation 0.790
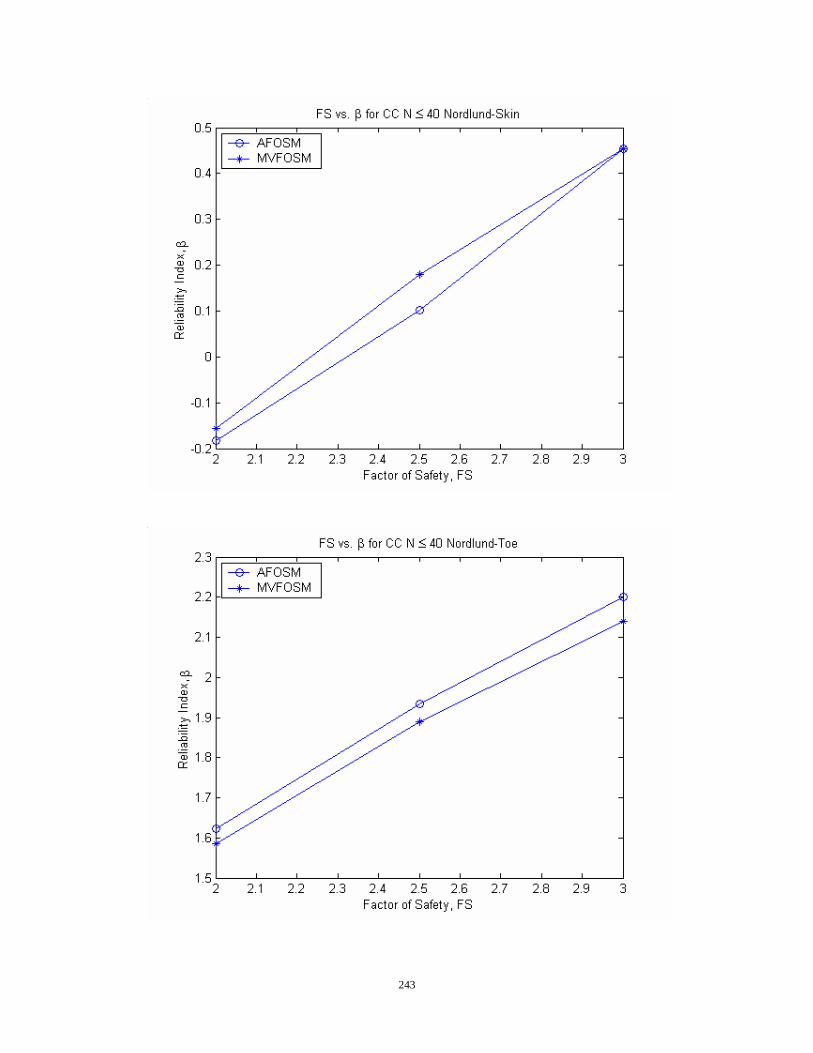
243
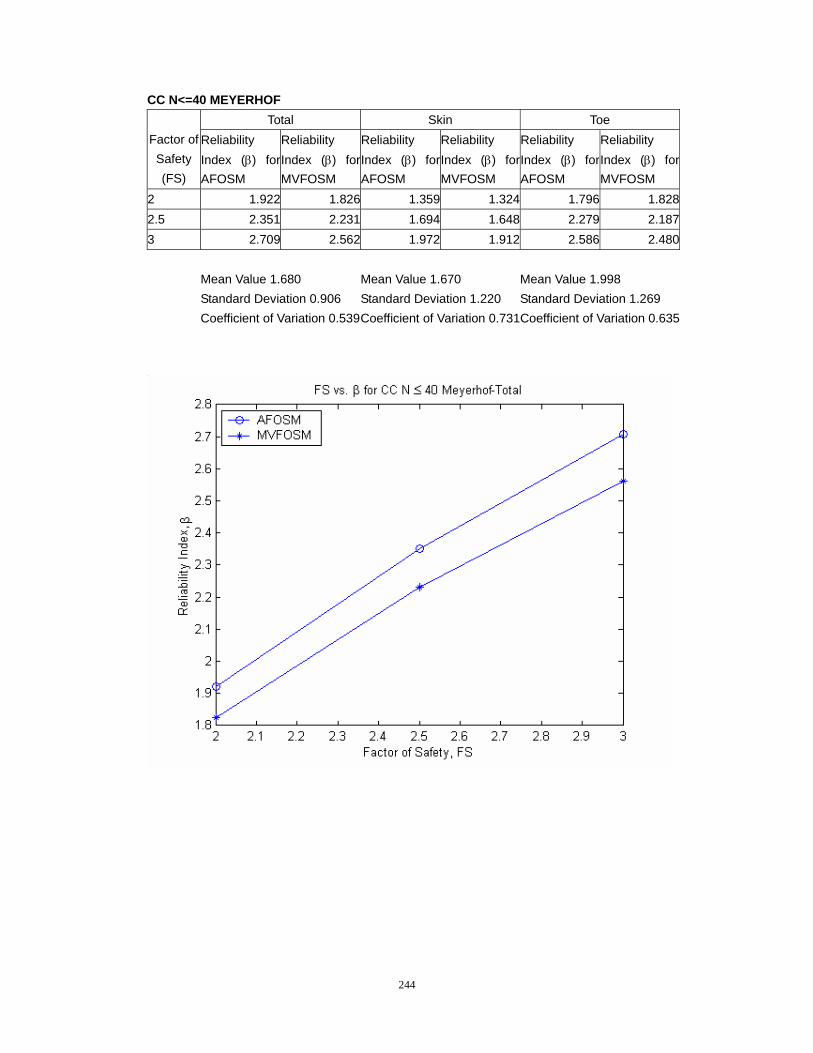
244
CC N<=40 MEYERHOF Total Skin Toe
Factor of Safety (FS)
Reliability Index (β) for AFOSM
Reliability Index (β) for MVFOSM
Reliability Index (β) for AFOSM
Reliability Index (β) for MVFOSM
Reliability Index (β) for AFOSM
Reliability Index (β) for MVFOSM
2 1.922 1.826 1.359 1.324 1.796 1.8282.5 2.351 2.231 1.694 1.648 2.279 2.1873 2.709 2.562 1.972 1.912 2.586 2.480 Mean Value 1.680 Mean Value 1.670 Mean Value 1.998 Standard Deviation 0.906 Standard Deviation 1.220 Standard Deviation 1.269 Coefficient of Variation 0.539Coefficient of Variation 0.731Coefficient of Variation 0.635
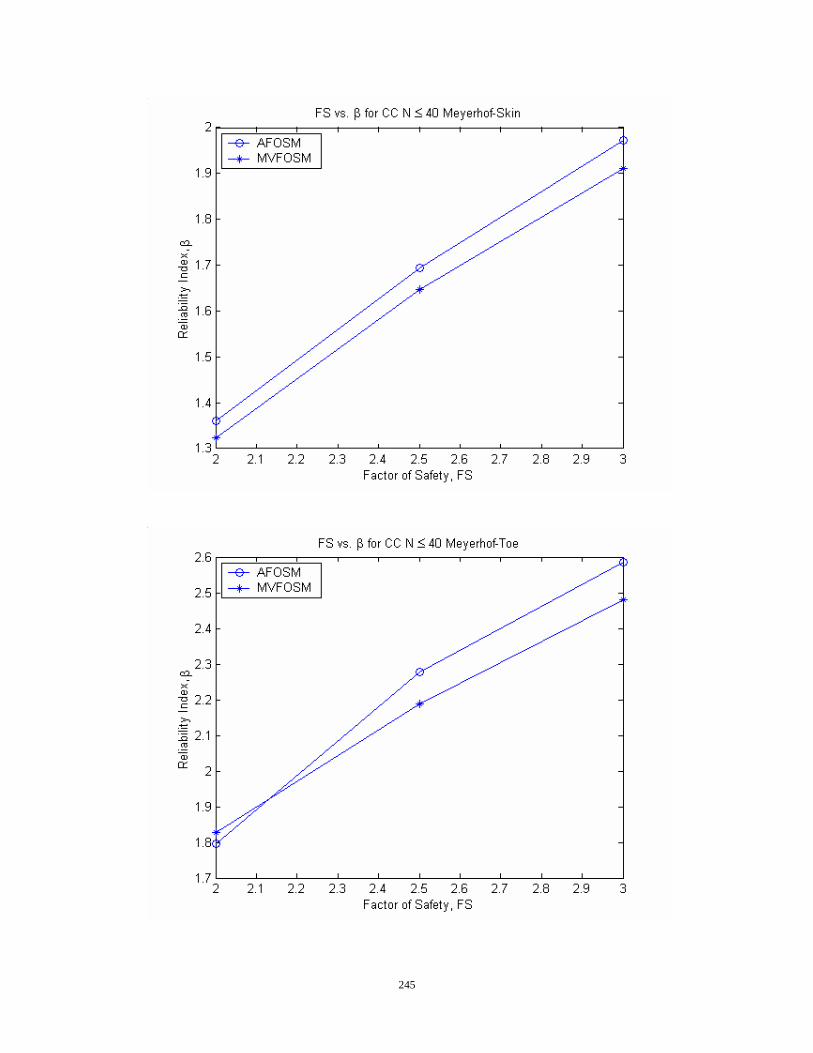
245
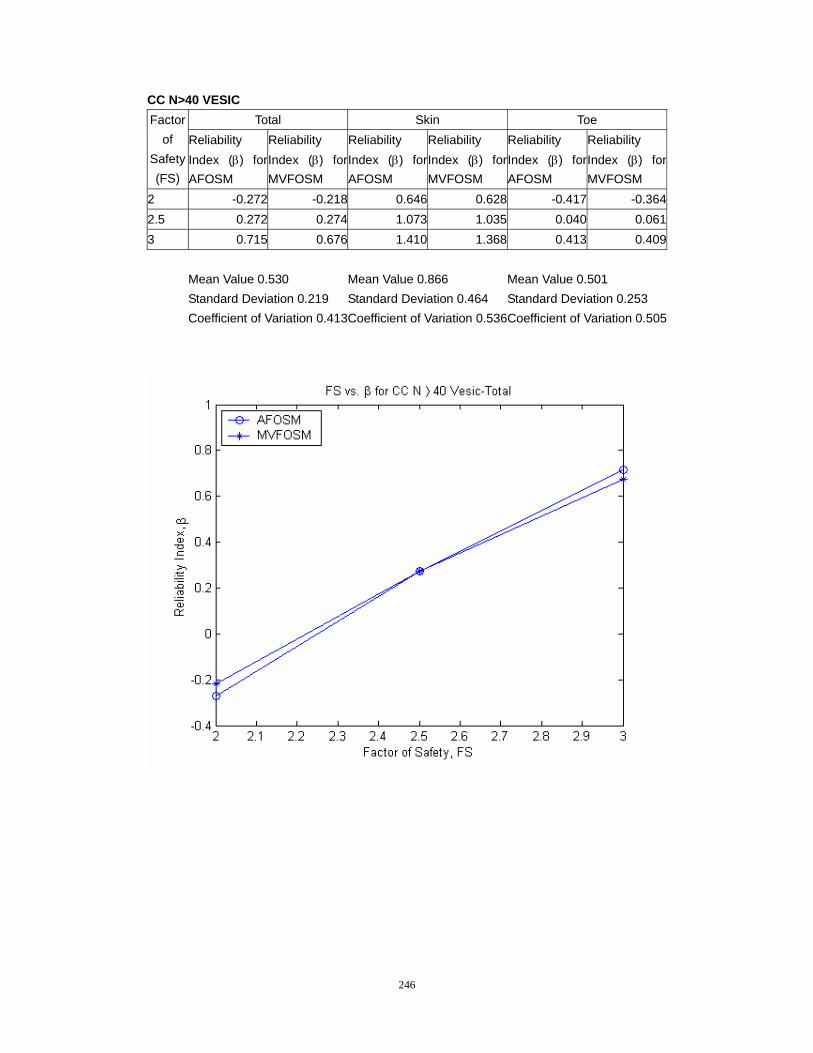
246
CC N>40 VESIC Total Skin Toe Factor
of Safety (FS)
Reliability Index (β) for AFOSM
Reliability Index (β) for MVFOSM
Reliability Index (β) for AFOSM
Reliability Index (β) for MVFOSM
Reliability Index (β) for AFOSM
Reliability Index (β) for MVFOSM
2 -0.272 -0.218 0.646 0.628 -0.417 -0.3642.5 0.272 0.274 1.073 1.035 0.040 0.0613 0.715 0.676 1.410 1.368 0.413 0.409 Mean Value 0.530 Mean Value 0.866 Mean Value 0.501 Standard Deviation 0.219 Standard Deviation 0.464 Standard Deviation 0.253 Coefficient of Variation 0.413Coefficient of Variation 0.536Coefficient of Variation 0.505
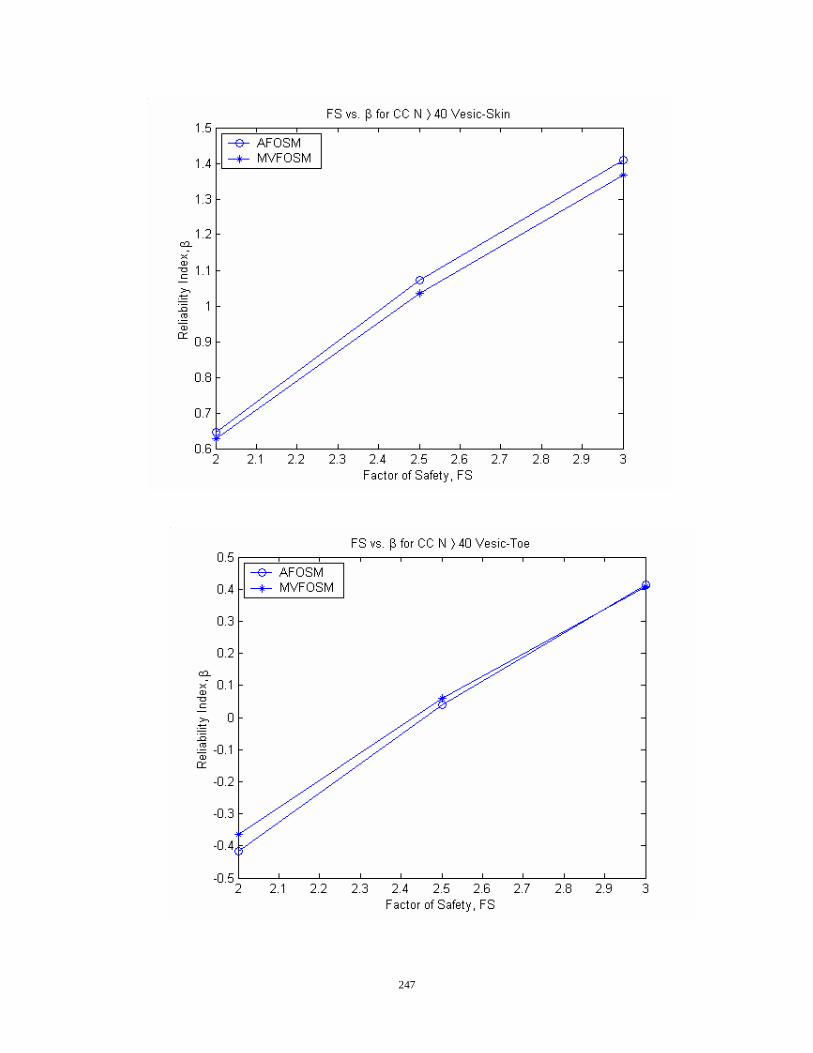
247
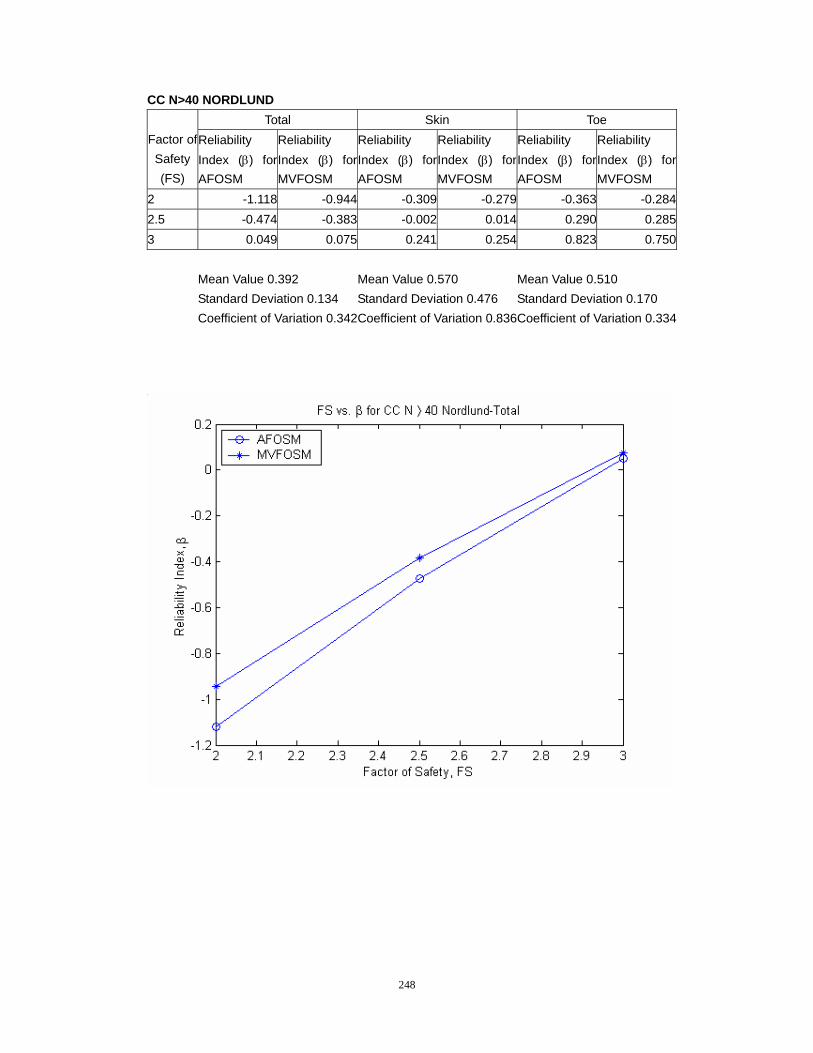
248
CC N>40 NORDLUND Total Skin Toe
Factor of Safety (FS)
Reliability Index (β) for AFOSM
Reliability Index (β) for MVFOSM
Reliability Index (β) for AFOSM
Reliability Index (β) for MVFOSM
Reliability Index (β) for AFOSM
Reliability Index (β) for MVFOSM
2 -1.118 -0.944 -0.309 -0.279 -0.363 -0.2842.5 -0.474 -0.383 -0.002 0.014 0.290 0.2853 0.049 0.075 0.241 0.254 0.823 0.750 Mean Value 0.392 Mean Value 0.570 Mean Value 0.510 Standard Deviation 0.134 Standard Deviation 0.476 Standard Deviation 0.170 Coefficient of Variation 0.342Coefficient of Variation 0.836Coefficient of Variation 0.334
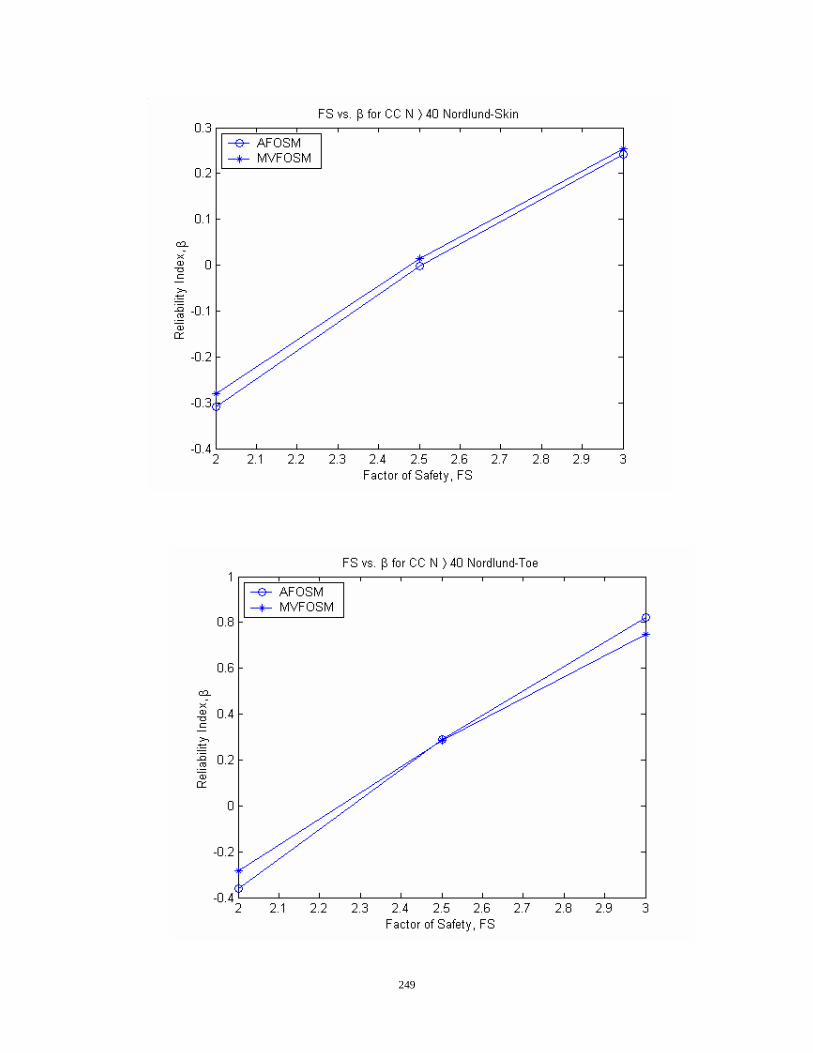
249
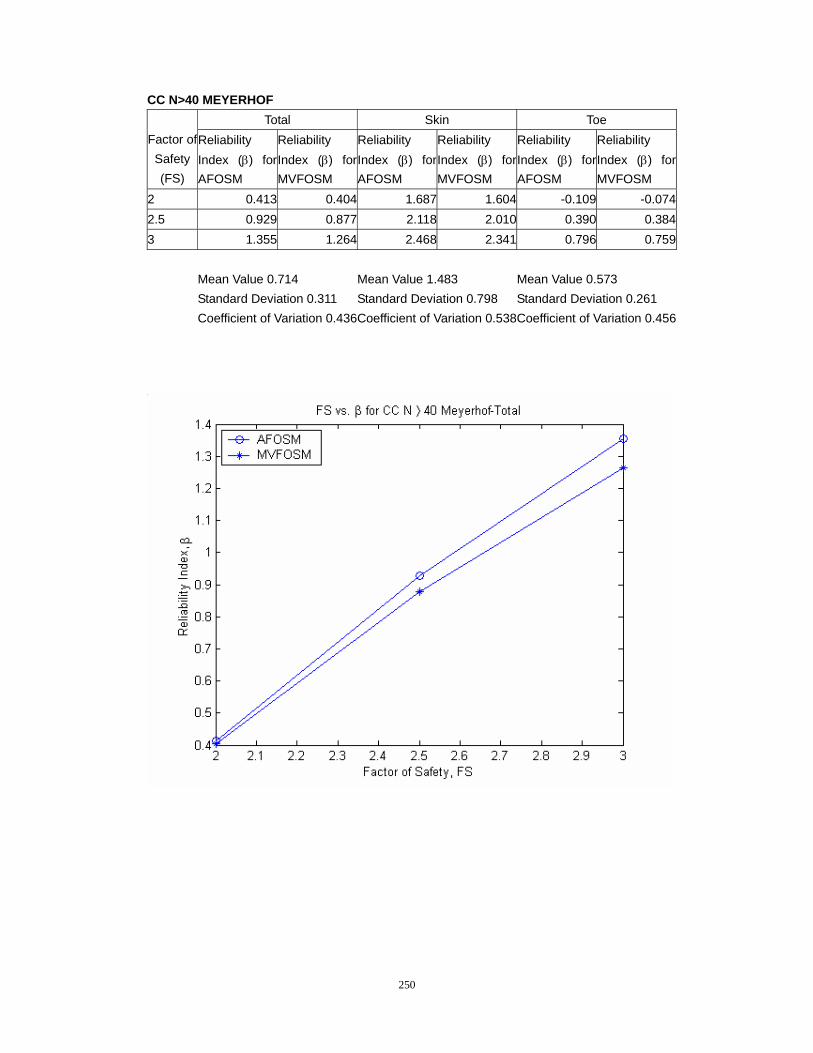
250
CC N>40 MEYERHOF Total Skin Toe
Factor of Safety (FS)
Reliability Index (β) for AFOSM
Reliability Index (β) for MVFOSM
Reliability Index (β) for AFOSM
Reliability Index (β) for MVFOSM
Reliability Index (β) for AFOSM
Reliability Index (β) for MVFOSM
2 0.413 0.404 1.687 1.604 -0.109 -0.0742.5 0.929 0.877 2.118 2.010 0.390 0.3843 1.355 1.264 2.468 2.341 0.796 0.759 Mean Value 0.714 Mean Value 1.483 Mean Value 0.573 Standard Deviation 0.311 Standard Deviation 0.798 Standard Deviation 0.261 Coefficient of Variation 0.436Coefficient of Variation 0.538Coefficient of Variation 0.456
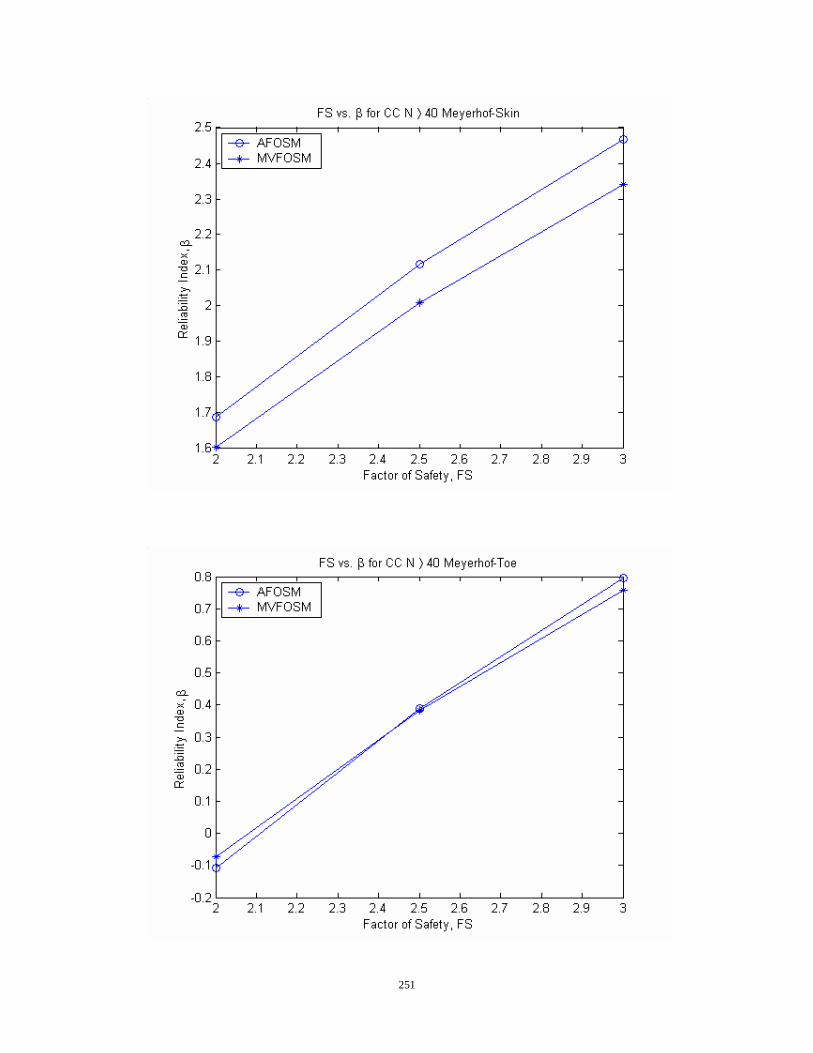
251
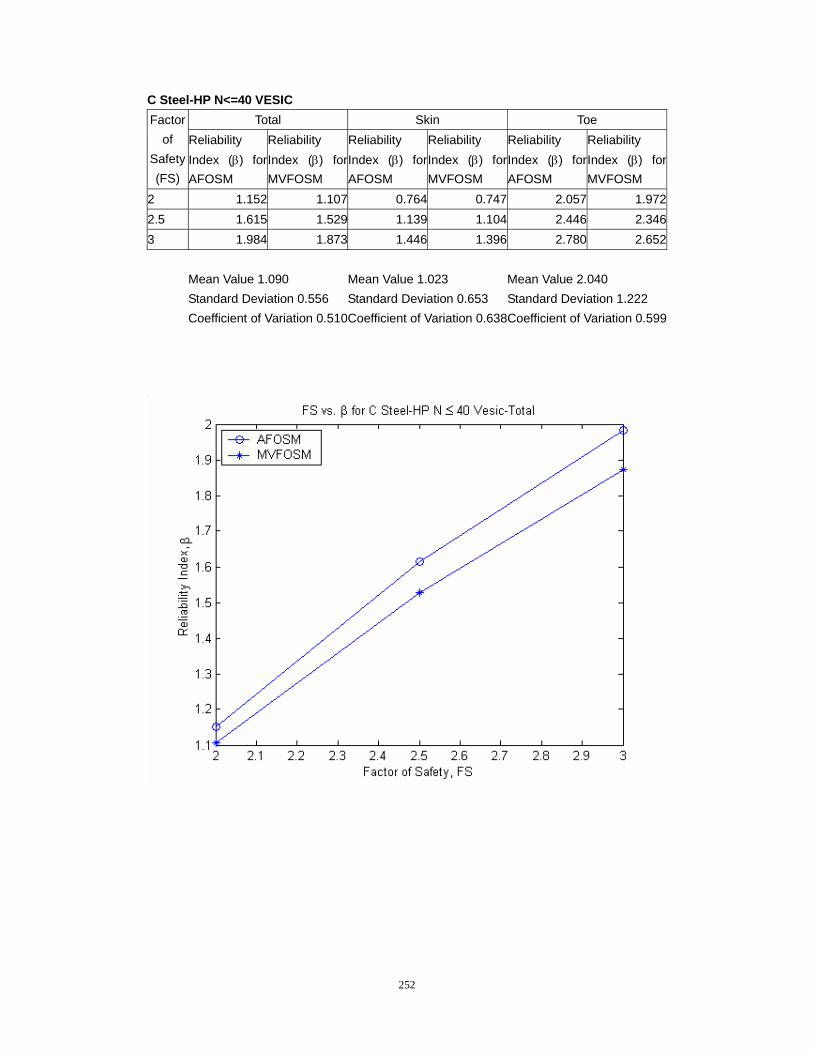
252
C Steel-HP N<=40 VESIC Total Skin Toe Factor
of Safety (FS)
Reliability Index (β) for AFOSM
Reliability Index (β) for MVFOSM
Reliability Index (β) for AFOSM
Reliability Index (β) for MVFOSM
Reliability Index (β) for AFOSM
Reliability Index (β) for MVFOSM
2 1.152 1.107 0.764 0.747 2.057 1.9722.5 1.615 1.529 1.139 1.104 2.446 2.3463 1.984 1.873 1.446 1.396 2.780 2.652 Mean Value 1.090 Mean Value 1.023 Mean Value 2.040 Standard Deviation 0.556 Standard Deviation 0.653 Standard Deviation 1.222 Coefficient of Variation 0.510Coefficient of Variation 0.638Coefficient of Variation 0.599
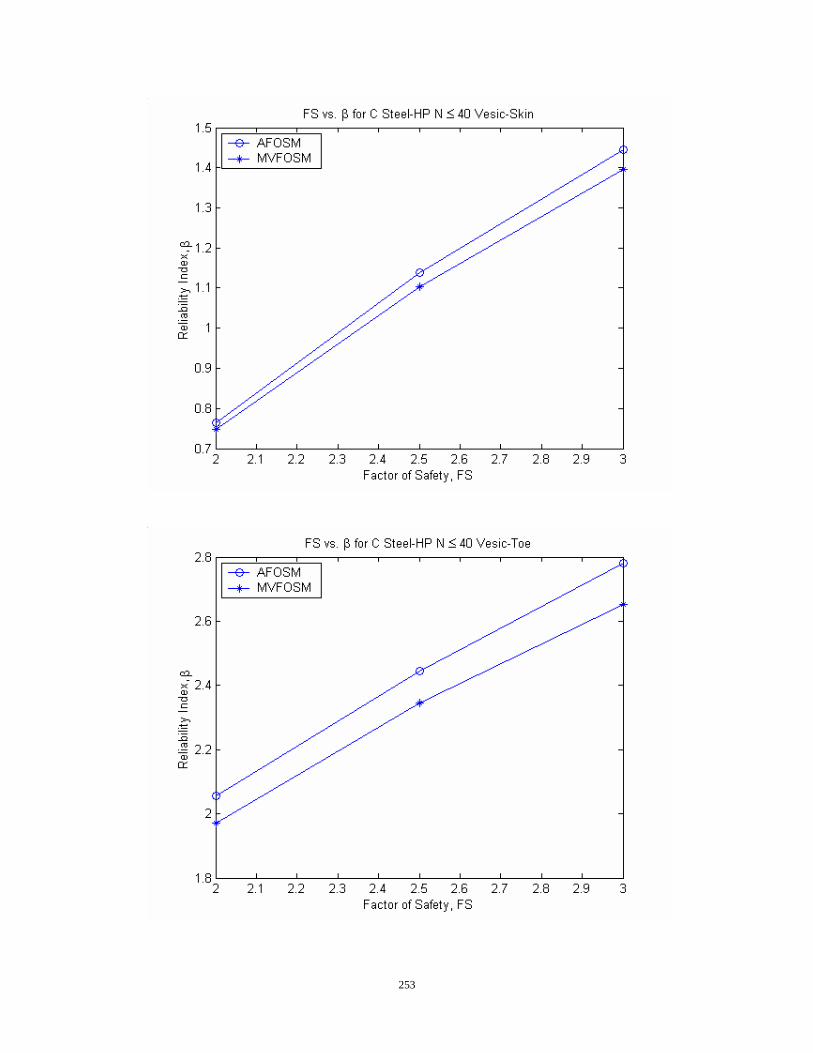
253
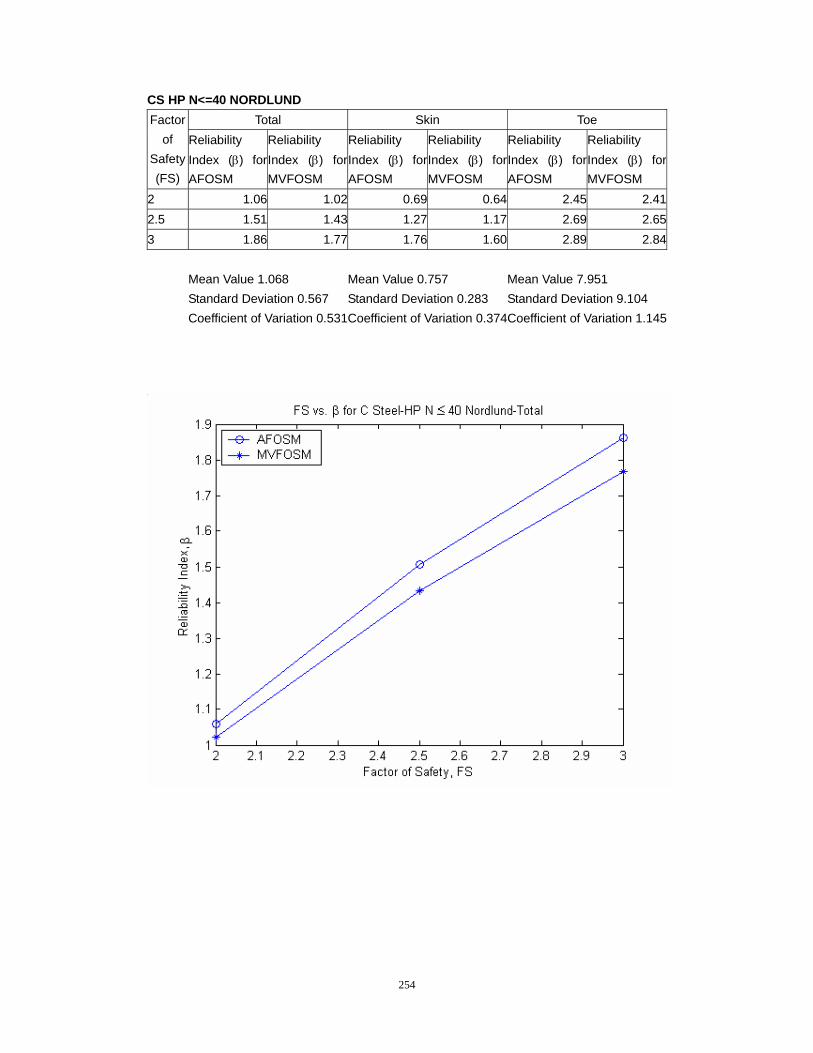
254
CS HP N<=40 NORDLUND Total Skin Toe Factor
of Safety (FS)
Reliability Index (β) for AFOSM
Reliability Index (β) for MVFOSM
Reliability Index (β) for AFOSM
Reliability Index (β) for MVFOSM
Reliability Index (β) for AFOSM
Reliability Index (β) for MVFOSM
2 1.06 1.02 0.69 0.64 2.45 2.412.5 1.51 1.43 1.27 1.17 2.69 2.653 1.86 1.77 1.76 1.60 2.89 2.84 Mean Value 1.068 Mean Value 0.757 Mean Value 7.951 Standard Deviation 0.567 Standard Deviation 0.283 Standard Deviation 9.104 Coefficient of Variation 0.531Coefficient of Variation 0.374Coefficient of Variation 1.145
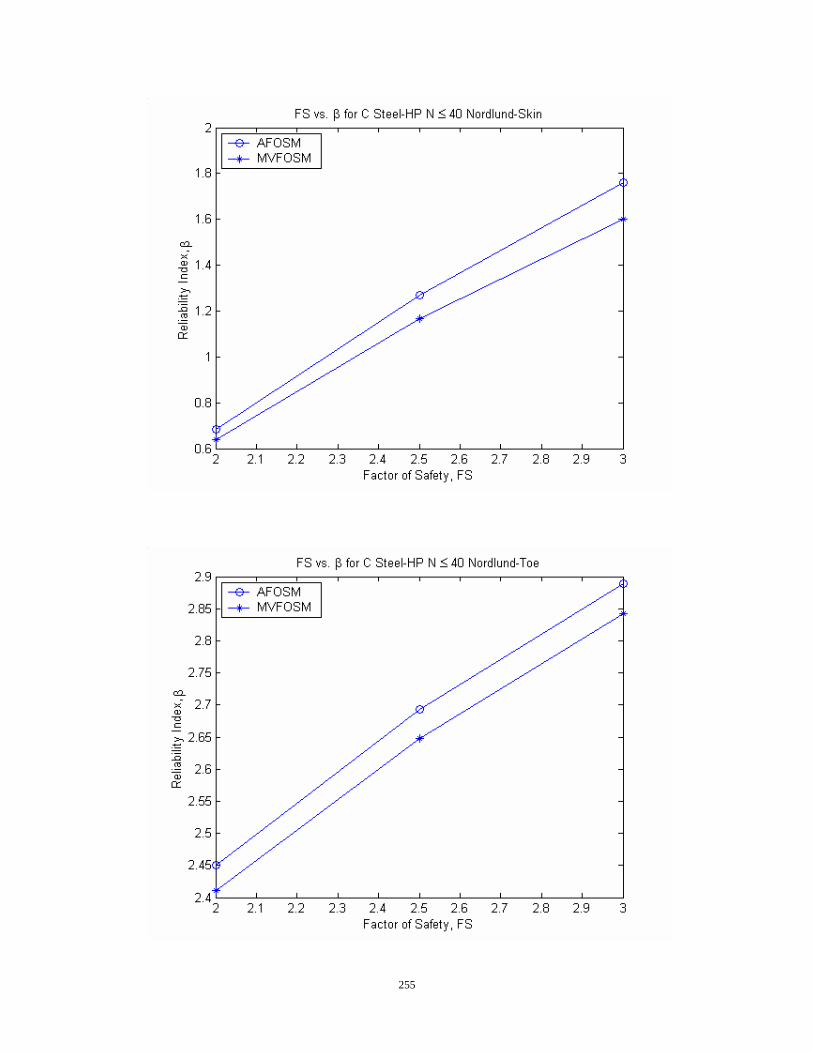
255
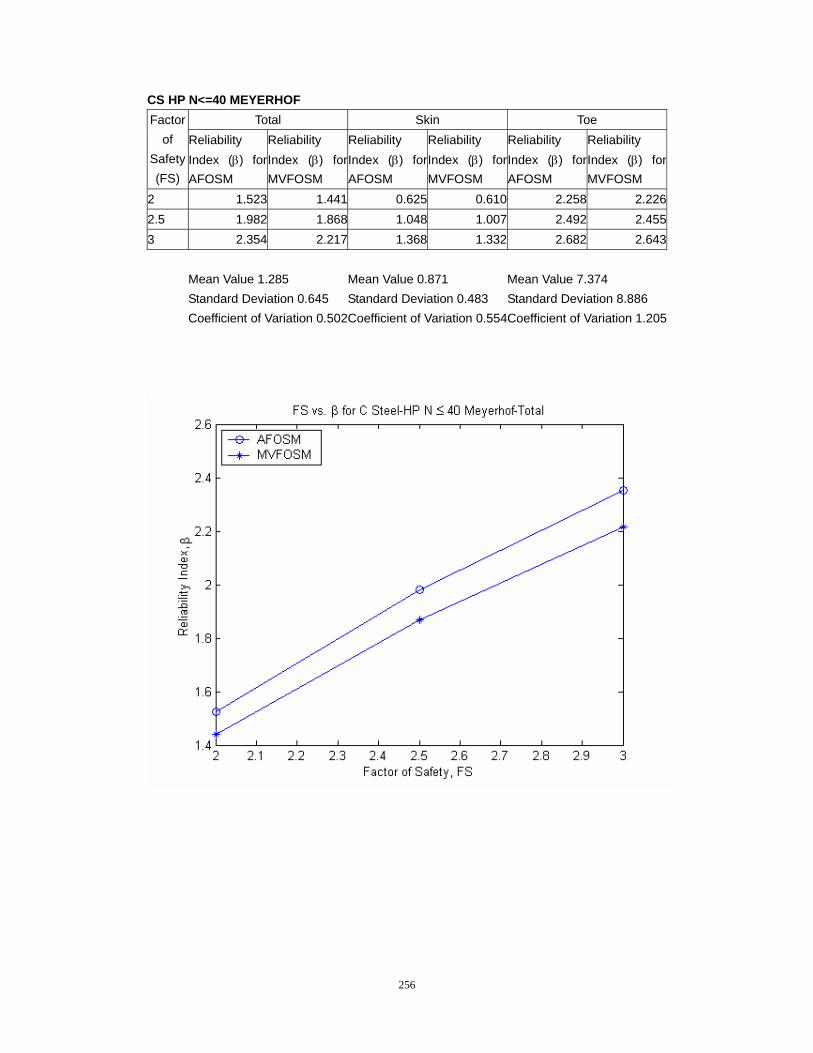
256
CS HP N<=40 MEYERHOF Total Skin Toe Factor
of Safety (FS)
Reliability Index (β) for AFOSM
Reliability Index (β) for MVFOSM
Reliability Index (β) for AFOSM
Reliability Index (β) for MVFOSM
Reliability Index (β) for AFOSM
Reliability Index (β) for MVFOSM
2 1.523 1.441 0.625 0.610 2.258 2.2262.5 1.982 1.868 1.048 1.007 2.492 2.4553 2.354 2.217 1.368 1.332 2.682 2.643 Mean Value 1.285 Mean Value 0.871 Mean Value 7.374 Standard Deviation 0.645 Standard Deviation 0.483 Standard Deviation 8.886 Coefficient of Variation 0.502Coefficient of Variation 0.554Coefficient of Variation 1.205

257
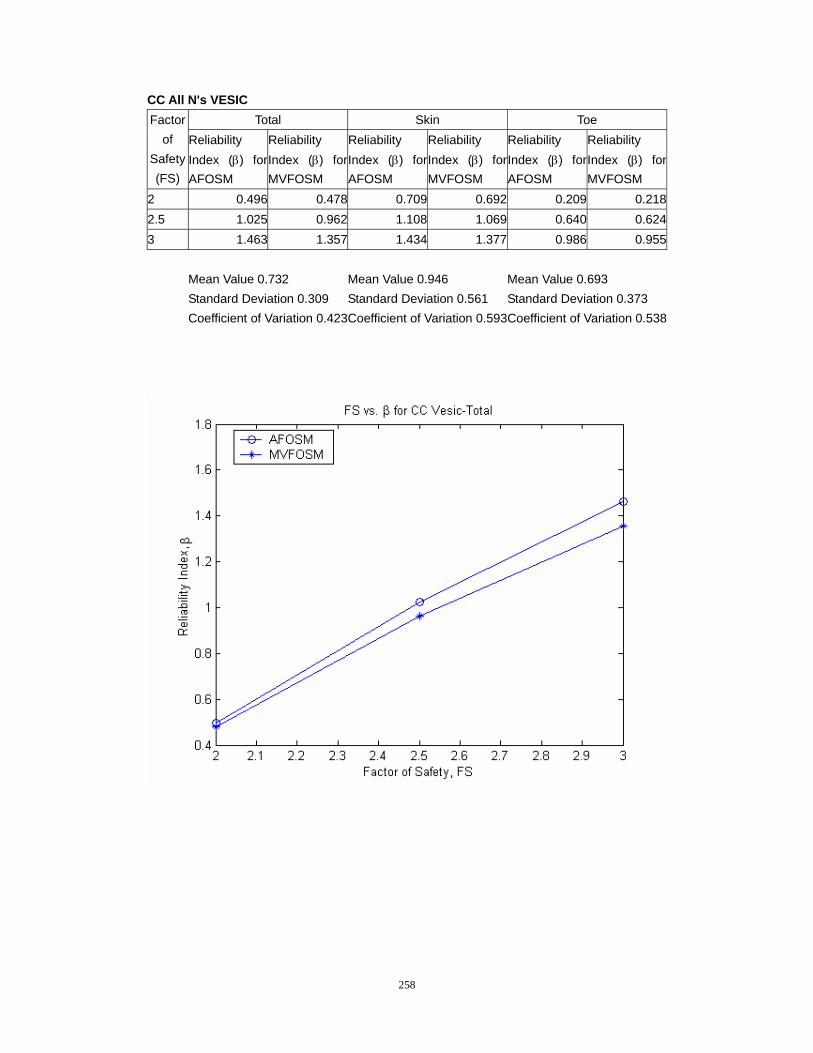
258
CC All N's VESIC Total Skin Toe Factor
of Safety (FS)
Reliability Index (β) for AFOSM
Reliability Index (β) for MVFOSM
Reliability Index (β) for AFOSM
Reliability Index (β) for MVFOSM
Reliability Index (β) for AFOSM
Reliability Index (β) for MVFOSM
2 0.496 0.478 0.709 0.692 0.209 0.2182.5 1.025 0.962 1.108 1.069 0.640 0.6243 1.463 1.357 1.434 1.377 0.986 0.955 Mean Value 0.732 Mean Value 0.946 Mean Value 0.693 Standard Deviation 0.309 Standard Deviation 0.561 Standard Deviation 0.373 Coefficient of Variation 0.423Coefficient of Variation 0.593Coefficient of Variation 0.538
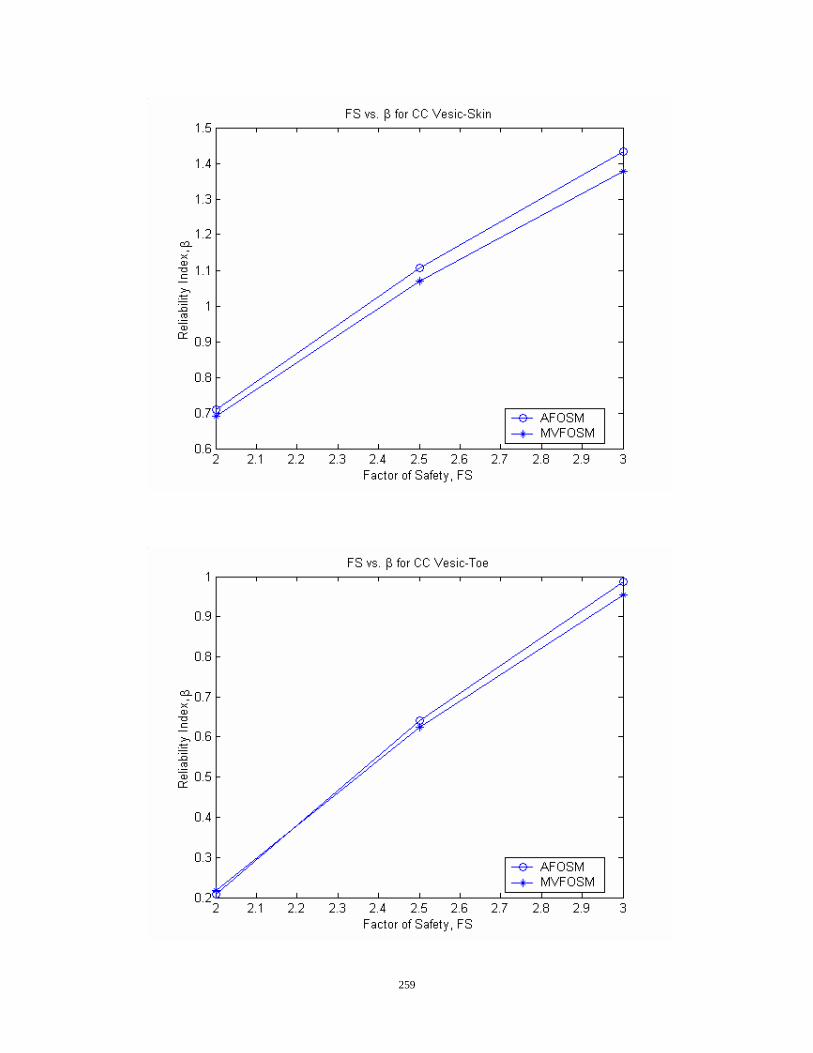
259
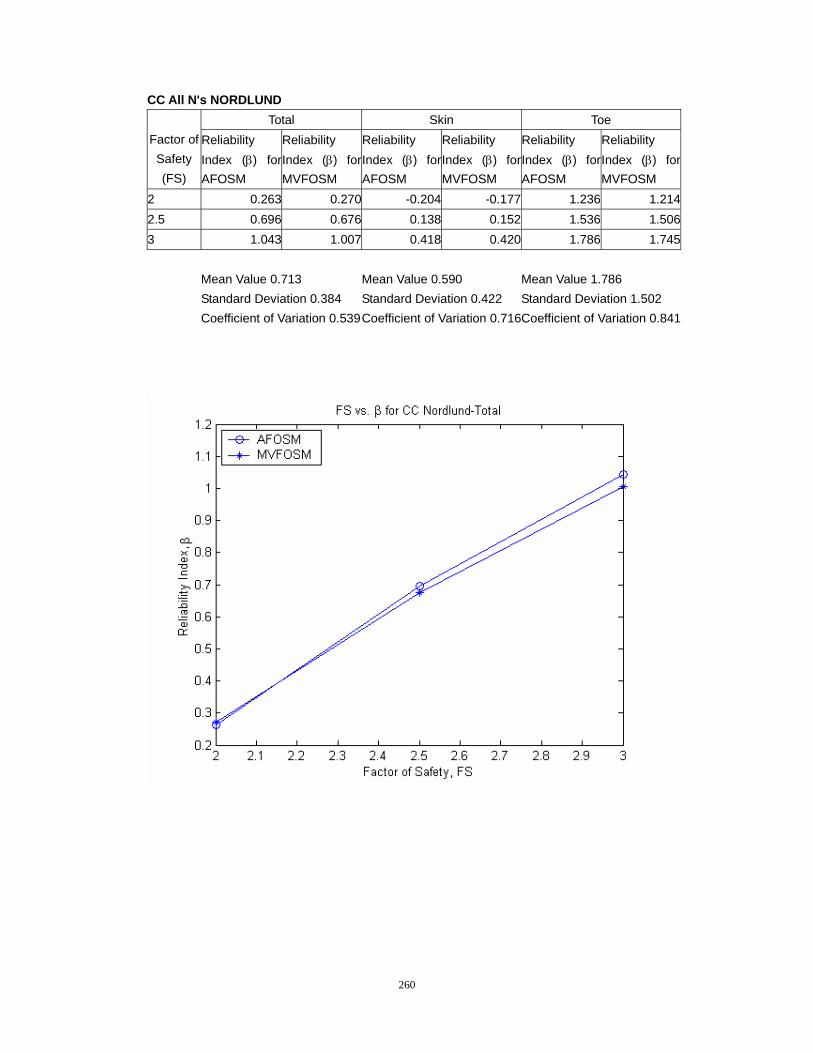
260
CC All N's NORDLUND Total Skin Toe
Factor of Safety (FS)
Reliability Index (β) for AFOSM
Reliability Index (β) for MVFOSM
Reliability Index (β) for AFOSM
Reliability Index (β) for MVFOSM
Reliability Index (β) for AFOSM
Reliability Index (β) for MVFOSM
2 0.263 0.270 -0.204 -0.177 1.236 1.2142.5 0.696 0.676 0.138 0.152 1.536 1.5063 1.043 1.007 0.418 0.420 1.786 1.745 Mean Value 0.713 Mean Value 0.590 Mean Value 1.786 Standard Deviation 0.384 Standard Deviation 0.422 Standard Deviation 1.502 Coefficient of Variation 0.539Coefficient of Variation 0.716Coefficient of Variation 0.841
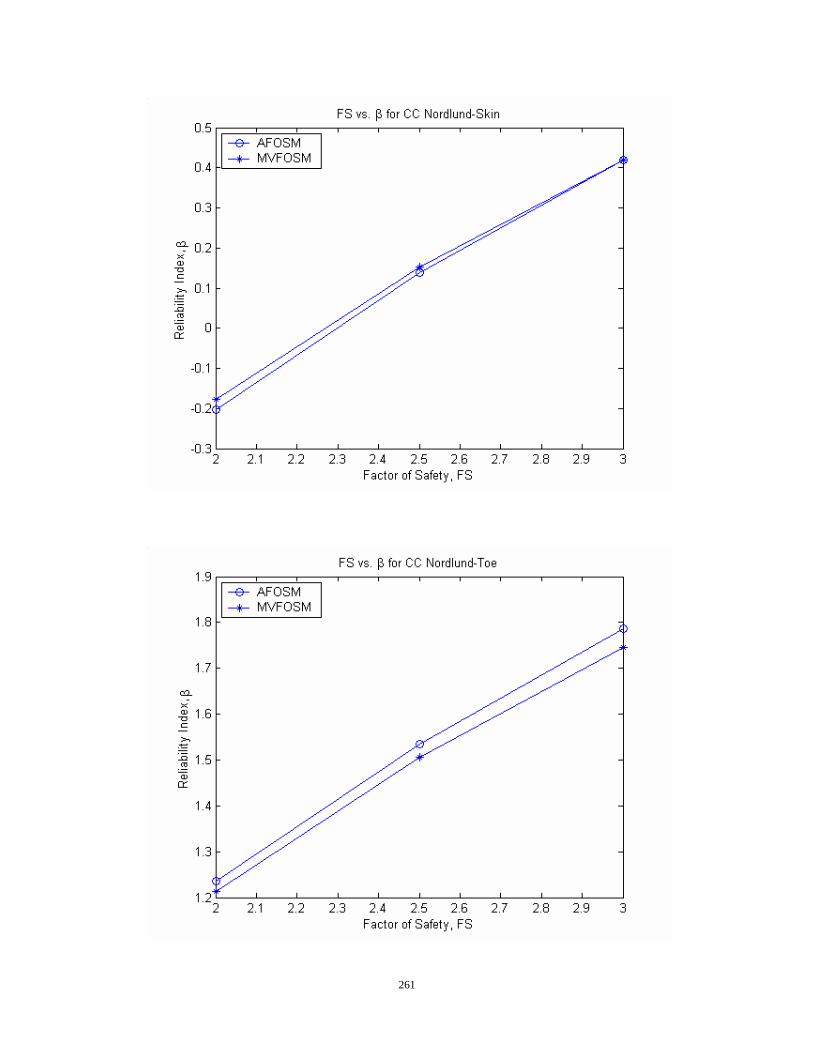
261
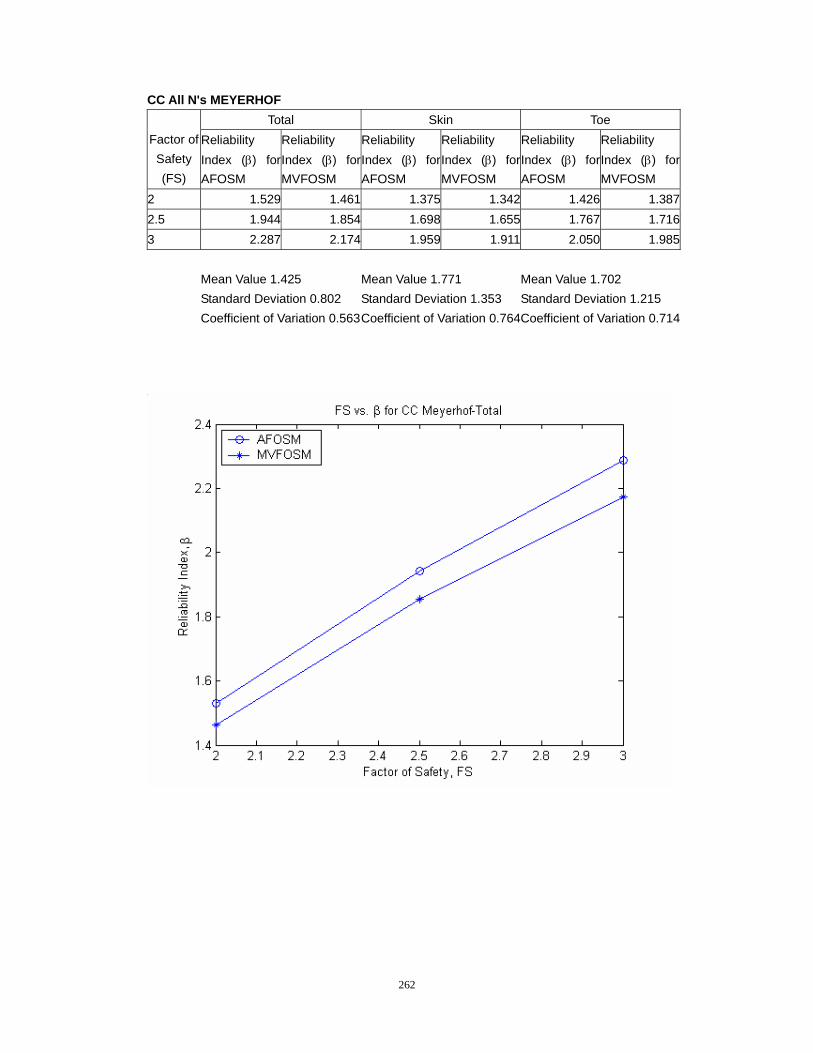
262
CC All N's MEYERHOF Total Skin Toe
Factor of Safety (FS)
Reliability Index (β) for AFOSM
Reliability Index (β) for MVFOSM
Reliability Index (β) for AFOSM
Reliability Index (β) for MVFOSM
Reliability Index (β) for AFOSM
Reliability Index (β) for MVFOSM
2 1.529 1.461 1.375 1.342 1.426 1.3872.5 1.944 1.854 1.698 1.655 1.767 1.7163 2.287 2.174 1.959 1.911 2.050 1.985 Mean Value 1.425 Mean Value 1.771 Mean Value 1.702 Standard Deviation 0.802 Standard Deviation 1.353 Standard Deviation 1.215 Coefficient of Variation 0.563Coefficient of Variation 0.764Coefficient of Variation 0.714
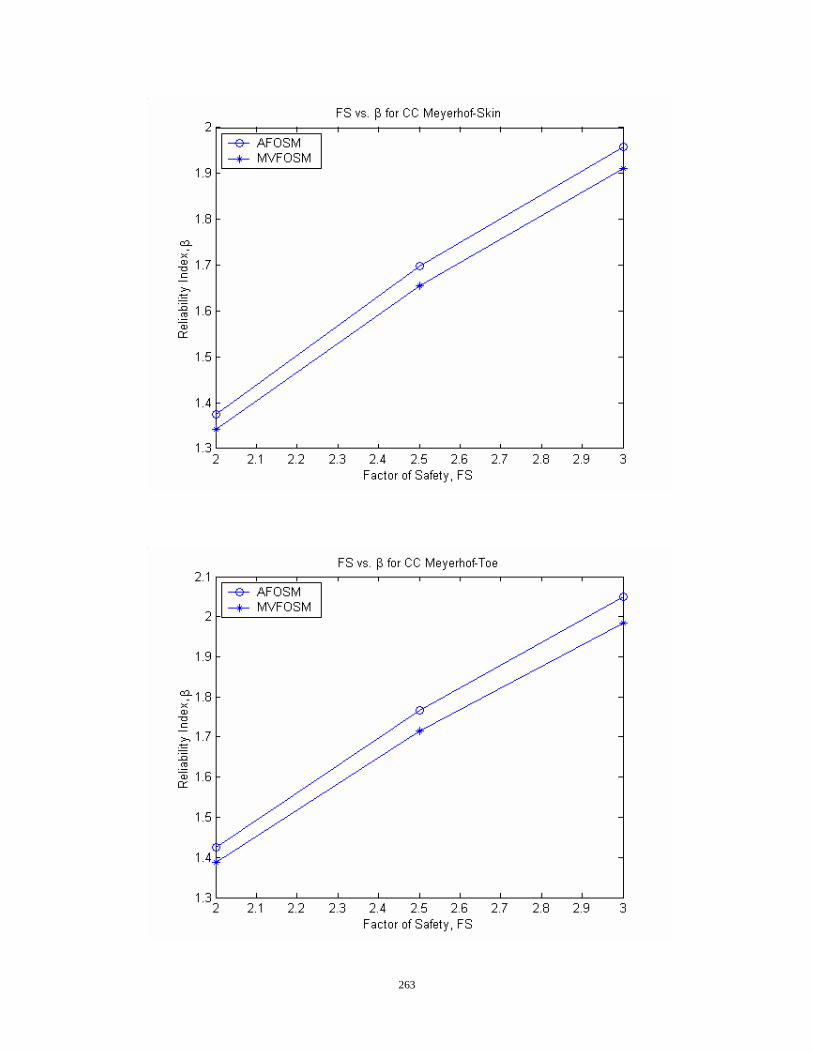
263
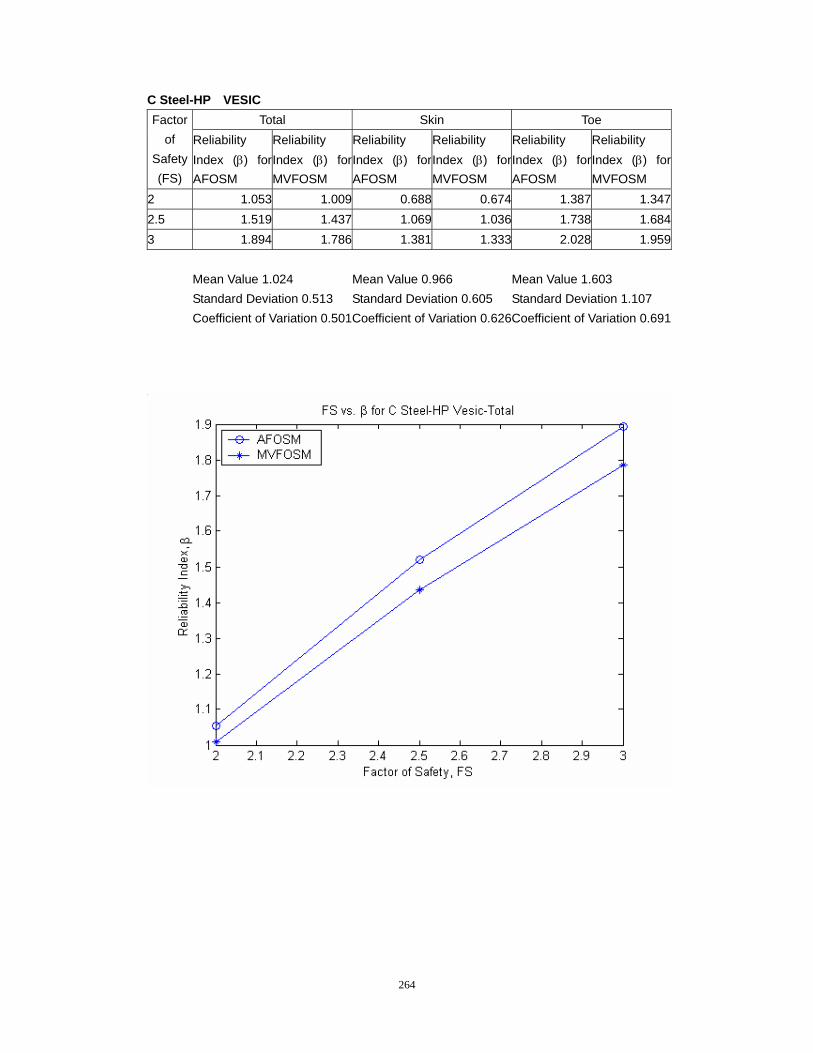
264
C Steel-HP VESIC Total Skin Toe Factor
of Safety (FS)
Reliability Index (β) for AFOSM
Reliability Index (β) for MVFOSM
Reliability Index (β) for AFOSM
Reliability Index (β) for MVFOSM
Reliability Index (β) for AFOSM
Reliability Index (β) for MVFOSM
2 1.053 1.009 0.688 0.674 1.387 1.3472.5 1.519 1.437 1.069 1.036 1.738 1.6843 1.894 1.786 1.381 1.333 2.028 1.959 Mean Value 1.024 Mean Value 0.966 Mean Value 1.603 Standard Deviation 0.513 Standard Deviation 0.605 Standard Deviation 1.107 Coefficient of Variation 0.501Coefficient of Variation 0.626Coefficient of Variation 0.691
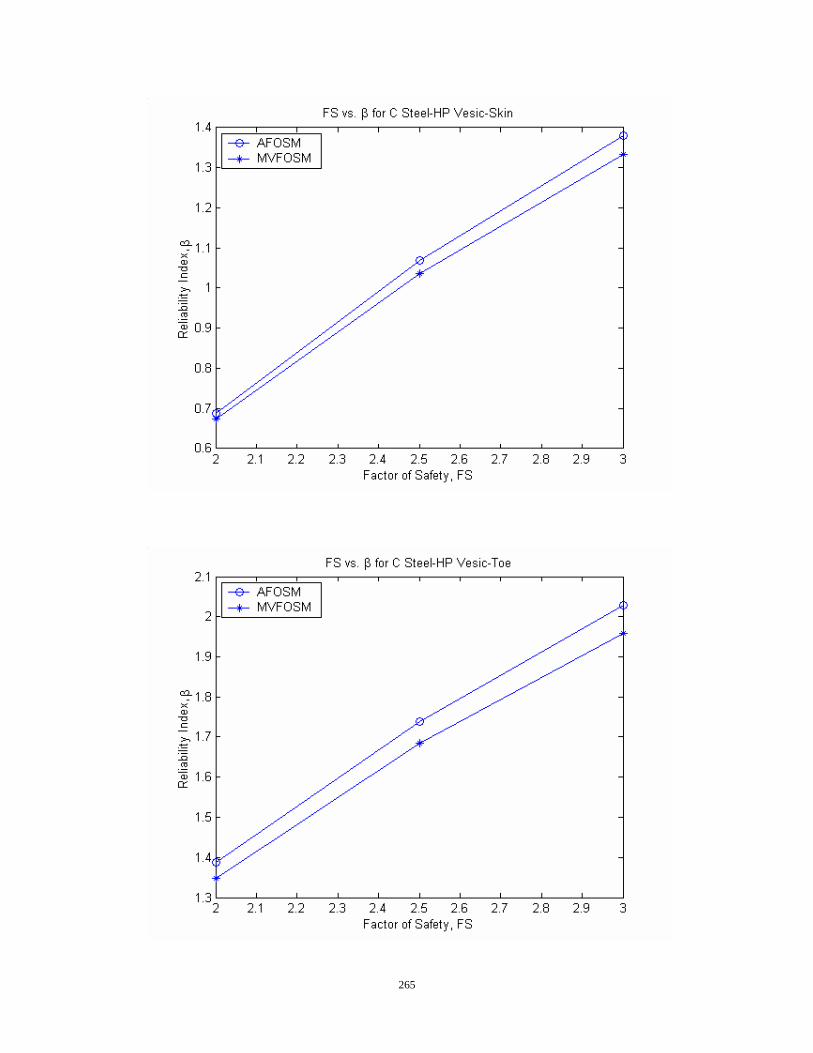
265
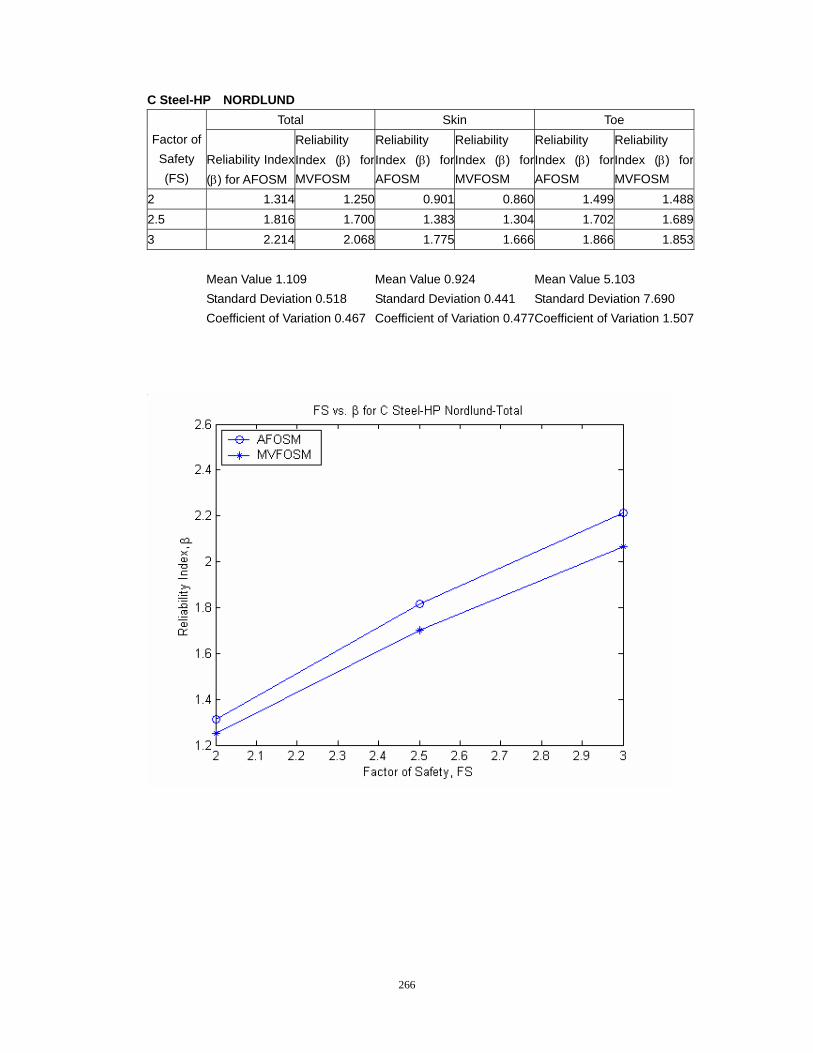
266
C Steel-HP NORDLUND Total Skin Toe
Factor of Safety (FS)
Reliability Index(β) for AFOSM
Reliability Index (β) for MVFOSM
Reliability Index (β) for AFOSM
Reliability Index (β) for MVFOSM
Reliability Index (β) for AFOSM
Reliability Index (β) for MVFOSM
2 1.314 1.250 0.901 0.860 1.499 1.4882.5 1.816 1.700 1.383 1.304 1.702 1.6893 2.214 2.068 1.775 1.666 1.866 1.853 Mean Value 1.109 Mean Value 0.924 Mean Value 5.103 Standard Deviation 0.518 Standard Deviation 0.441 Standard Deviation 7.690 Coefficient of Variation 0.467 Coefficient of Variation 0.477Coefficient of Variation 1.507
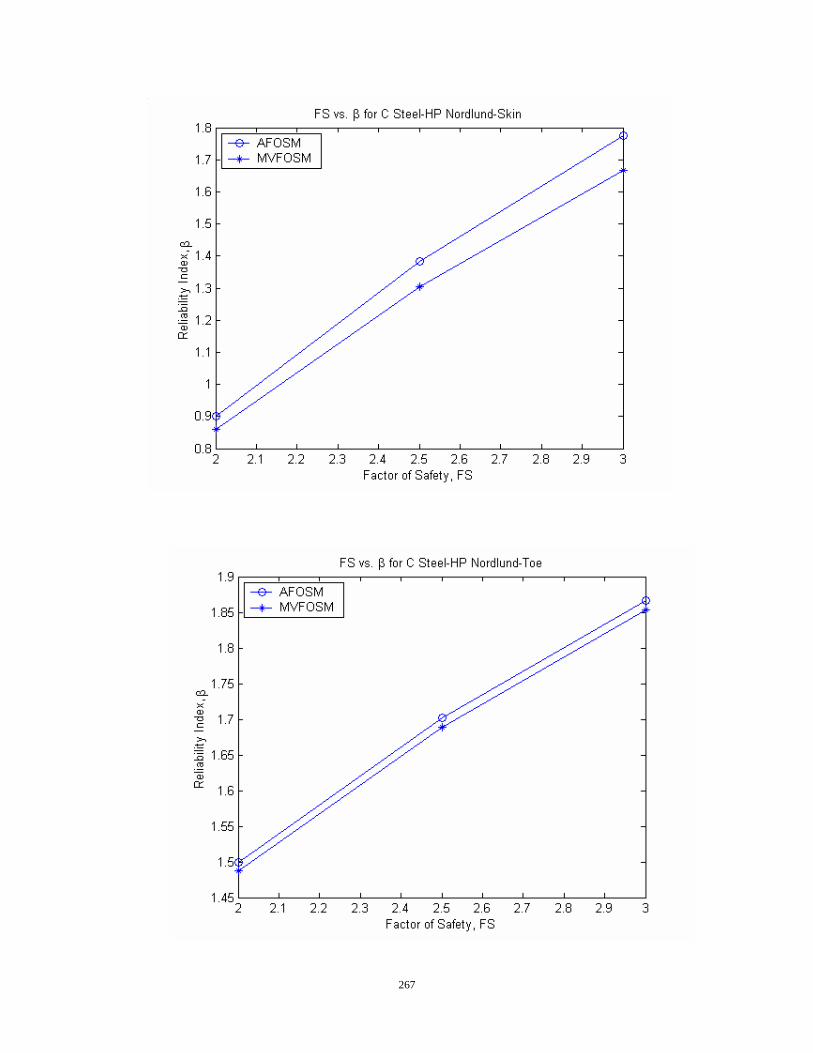
267
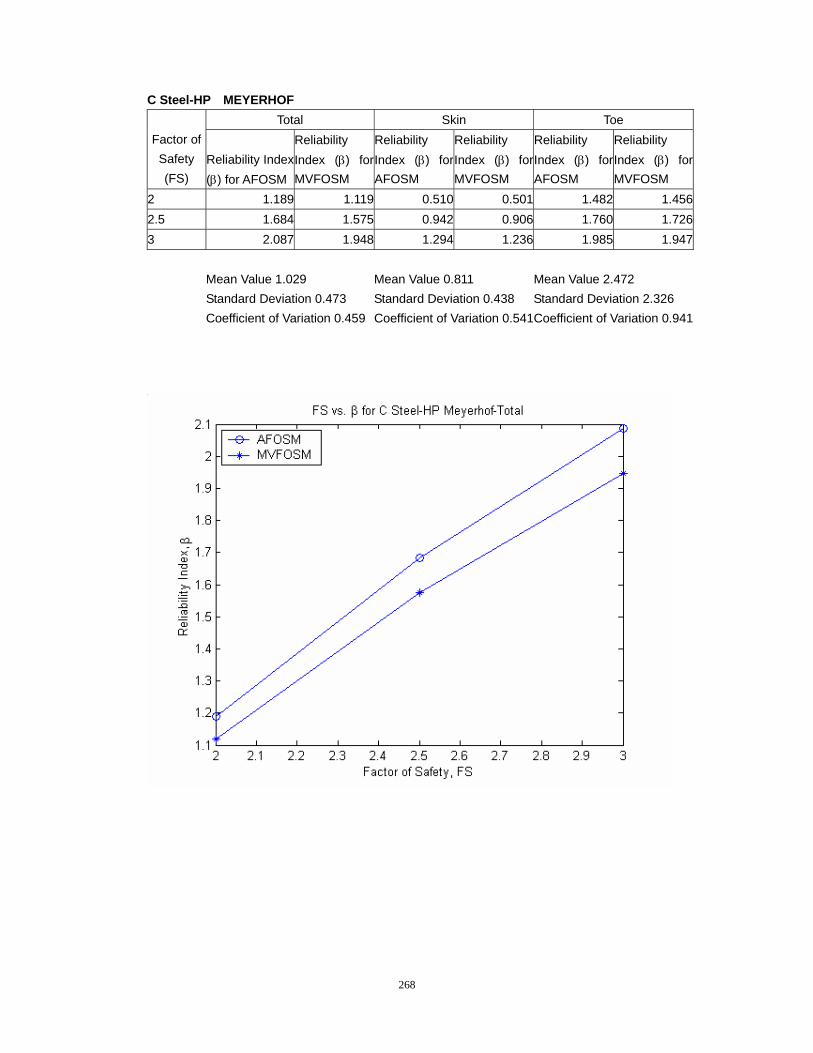
268
C Steel-HP MEYERHOF Total Skin Toe
Factor of Safety (FS)
Reliability Index(β) for AFOSM
Reliability Index (β) for MVFOSM
Reliability Index (β) for AFOSM
Reliability Index (β) for MVFOSM
Reliability Index (β) for AFOSM
Reliability Index (β) for MVFOSM
2 1.189 1.119 0.510 0.501 1.482 1.4562.5 1.684 1.575 0.942 0.906 1.760 1.7263 2.087 1.948 1.294 1.236 1.985 1.947 Mean Value 1.029 Mean Value 0.811 Mean Value 2.472 Standard Deviation 0.473 Standard Deviation 0.438 Standard Deviation 2.326 Coefficient of Variation 0.459 Coefficient of Variation 0.541Coefficient of Variation 0.941
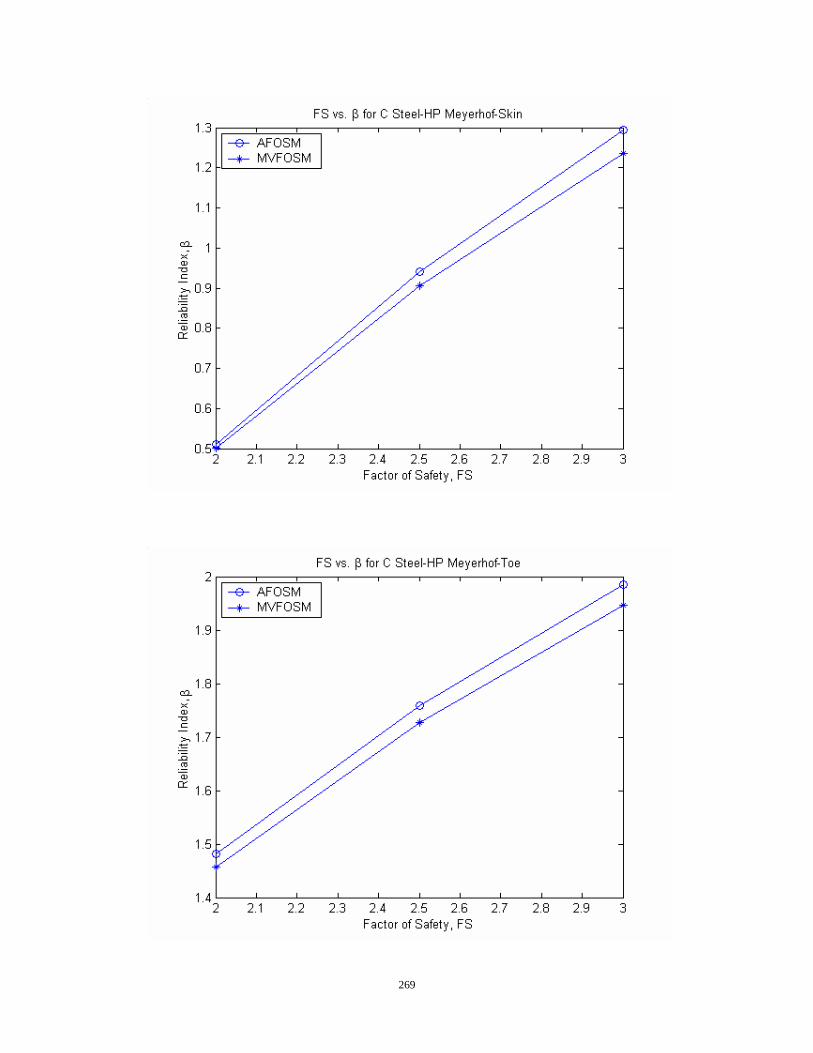
269

270
C Steel-HP N>40 VESIC Total Skin Toe
Factor of Safety (FS)
Reliability Index (β) for AFOSM
Reliability Index (β) for MVFOSM
Reliability Index (β) for AFOSM
Reliability Index (β) for MVFOSM
Reliability Index (β) for AFOSM
Reliability Index (β) for MVFOSM
2 0.987 0.870 0.514 0.510 0.823 0.8022.5 1.722 1.490 0.888 0.866 1.207 1.1673 2.321 1.997 1.194 1.157 1.520 1.464 Mean Value 0.770 Mean Value 0.884 Mean Value 1.041 Standard Deviation 0.224 Standard Deviation 0.567 Standard Deviation 0.648 Coefficient of Variation 0.291 Coefficient of Variation 0.641Coefficient of Variation 0.622
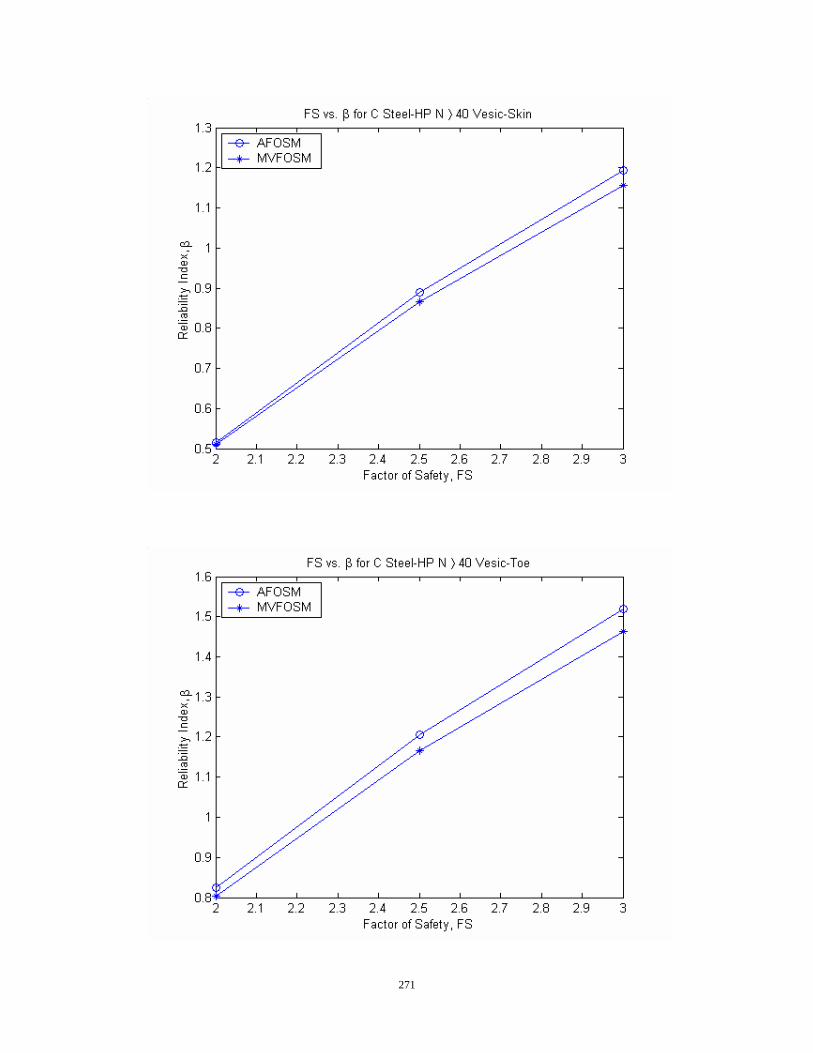
271
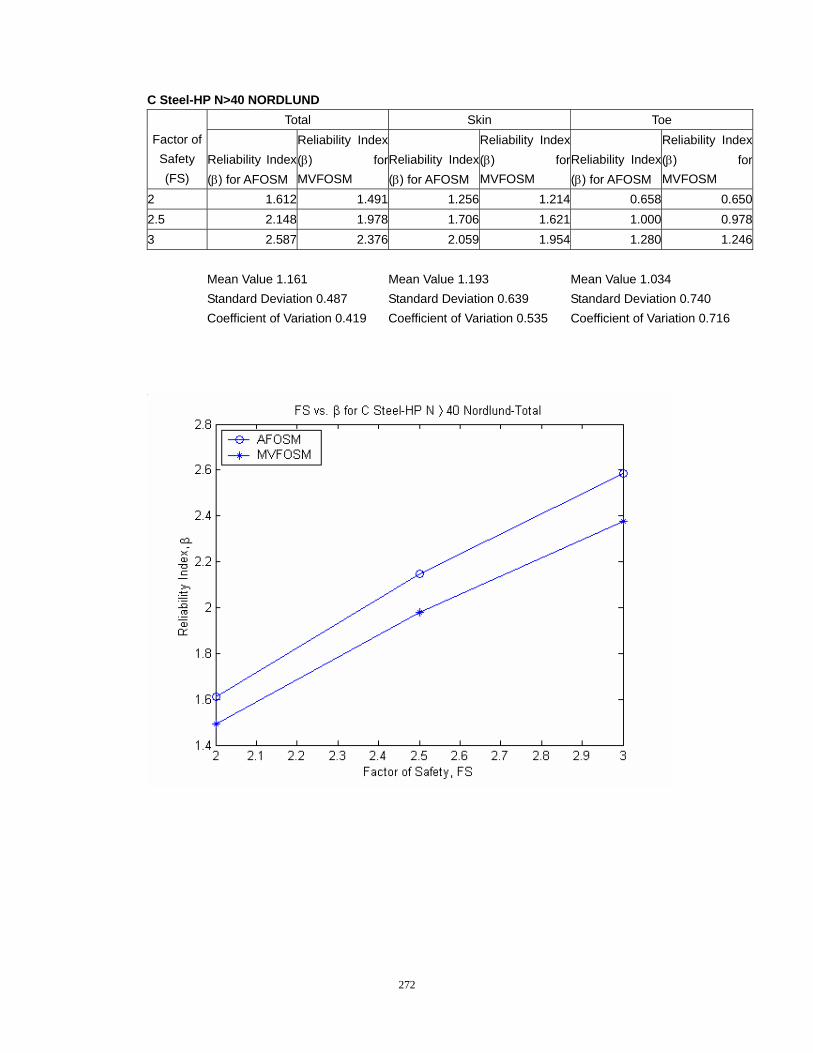
272
C Steel-HP N>40 NORDLUND Total Skin Toe
Factor of Safety (FS)
Reliability Index (β) for AFOSM
Reliability Index(β) forMVFOSM
Reliability Index (β) for AFOSM
Reliability Index (β) for MVFOSM
Reliability Index (β) for AFOSM
Reliability Index (β) for MVFOSM
2 1.612 1.491 1.256 1.214 0.658 0.6502.5 2.148 1.978 1.706 1.621 1.000 0.9783 2.587 2.376 2.059 1.954 1.280 1.246 Mean Value 1.161 Mean Value 1.193 Mean Value 1.034 Standard Deviation 0.487 Standard Deviation 0.639 Standard Deviation 0.740 Coefficient of Variation 0.419 Coefficient of Variation 0.535 Coefficient of Variation 0.716
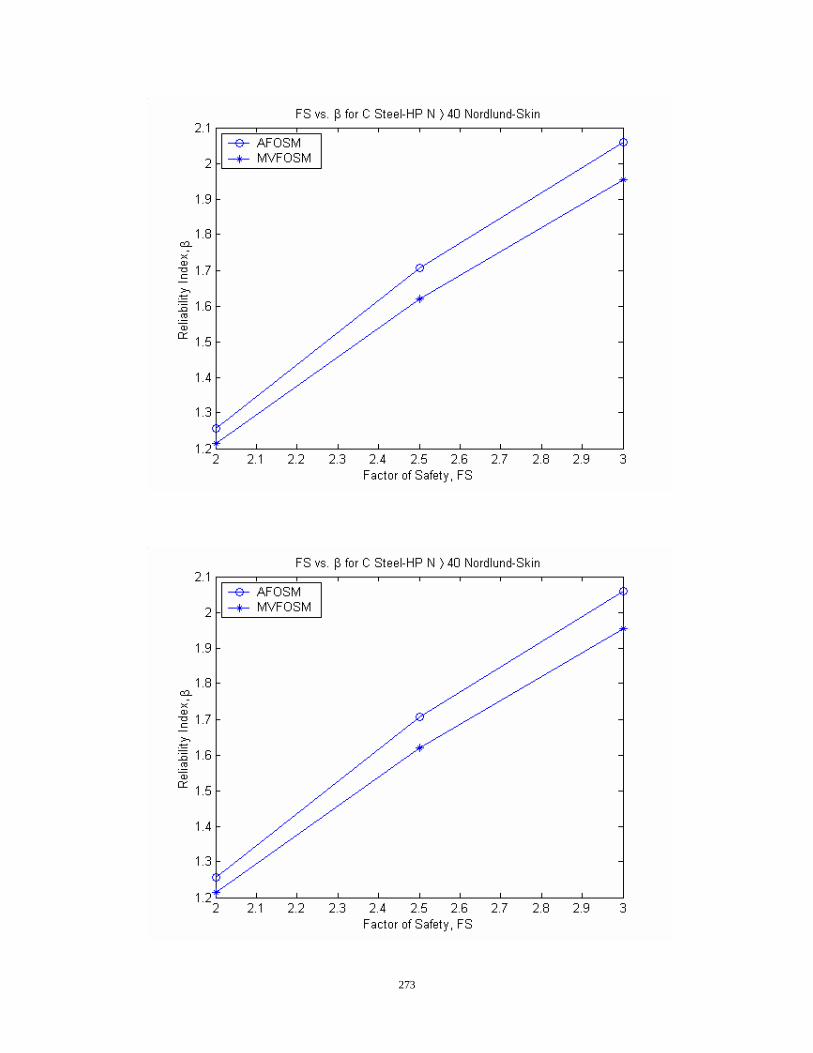
273
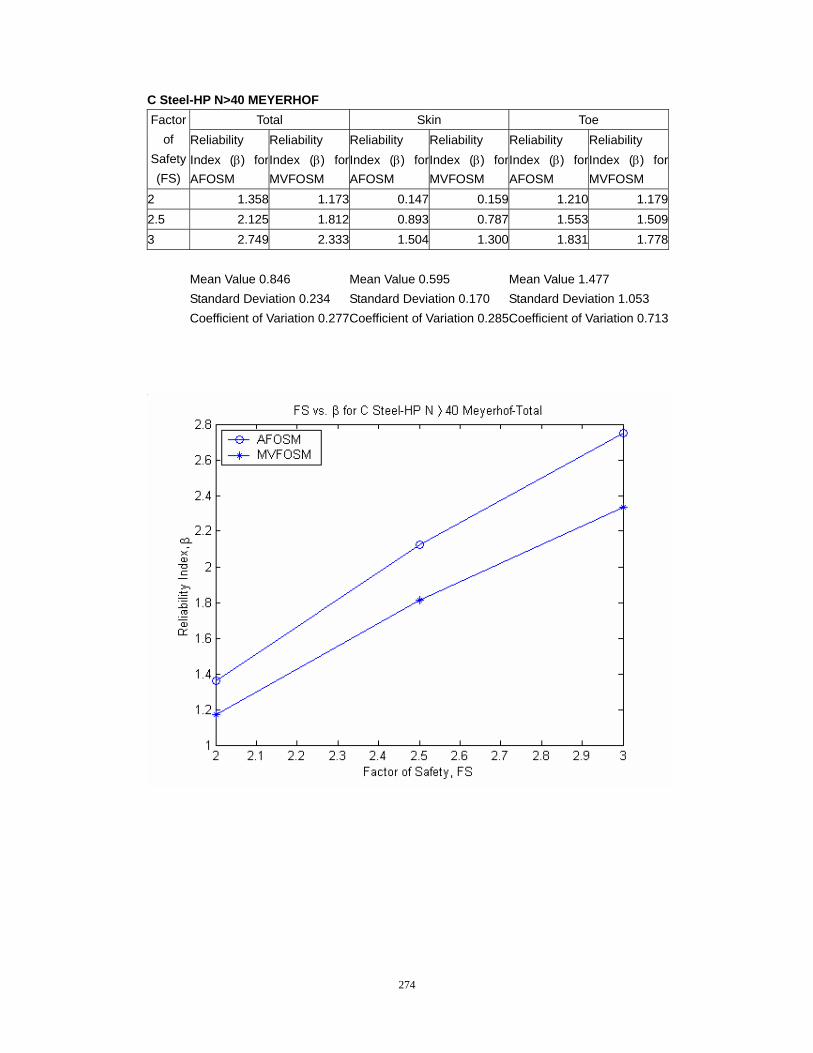
274
C Steel-HP N>40 MEYERHOF Total Skin Toe Factor
of Safety (FS)
Reliability Index (β) forAFOSM
Reliability Index (β) for MVFOSM
Reliability Index (β) for AFOSM
Reliability Index (β) for MVFOSM
Reliability Index (β) for AFOSM
Reliability Index (β) for MVFOSM
2 1.358 1.173 0.147 0.159 1.210 1.1792.5 2.125 1.812 0.893 0.787 1.553 1.5093 2.749 2.333 1.504 1.300 1.831 1.778 Mean Value 0.846 Mean Value 0.595 Mean Value 1.477 Standard Deviation 0.234 Standard Deviation 0.170 Standard Deviation 1.053 Coefficient of Variation 0.277Coefficient of Variation 0.285Coefficient of Variation 0.713
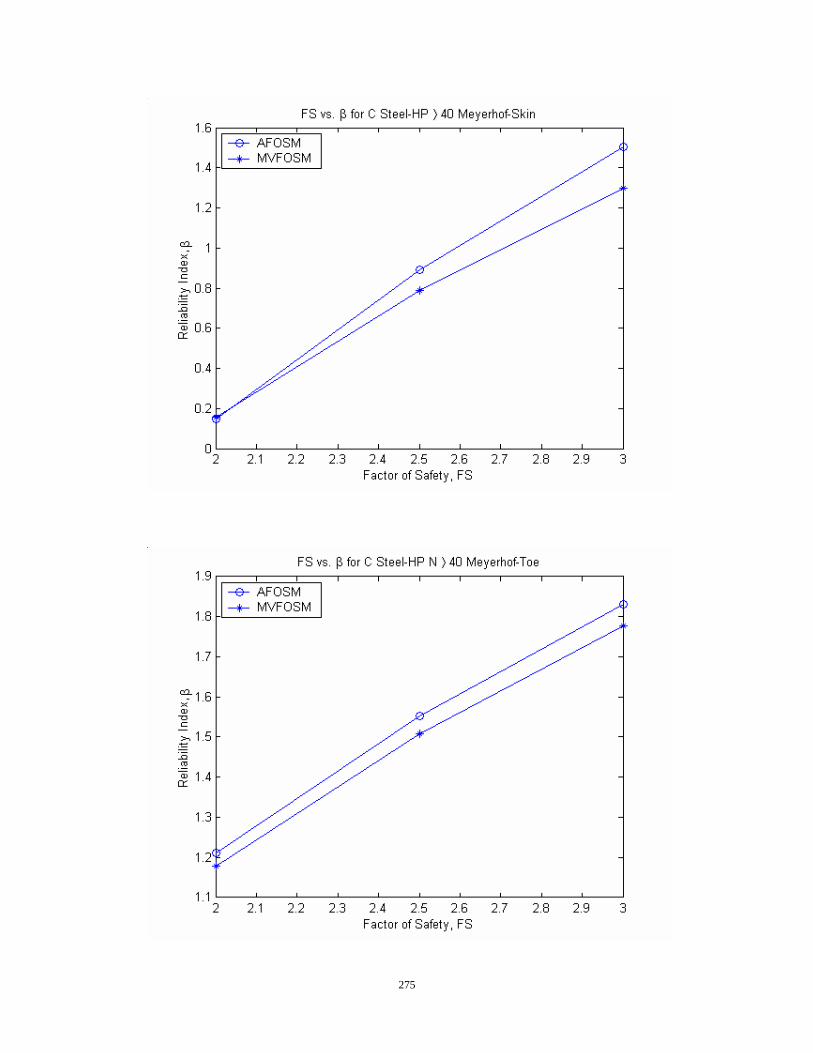
275
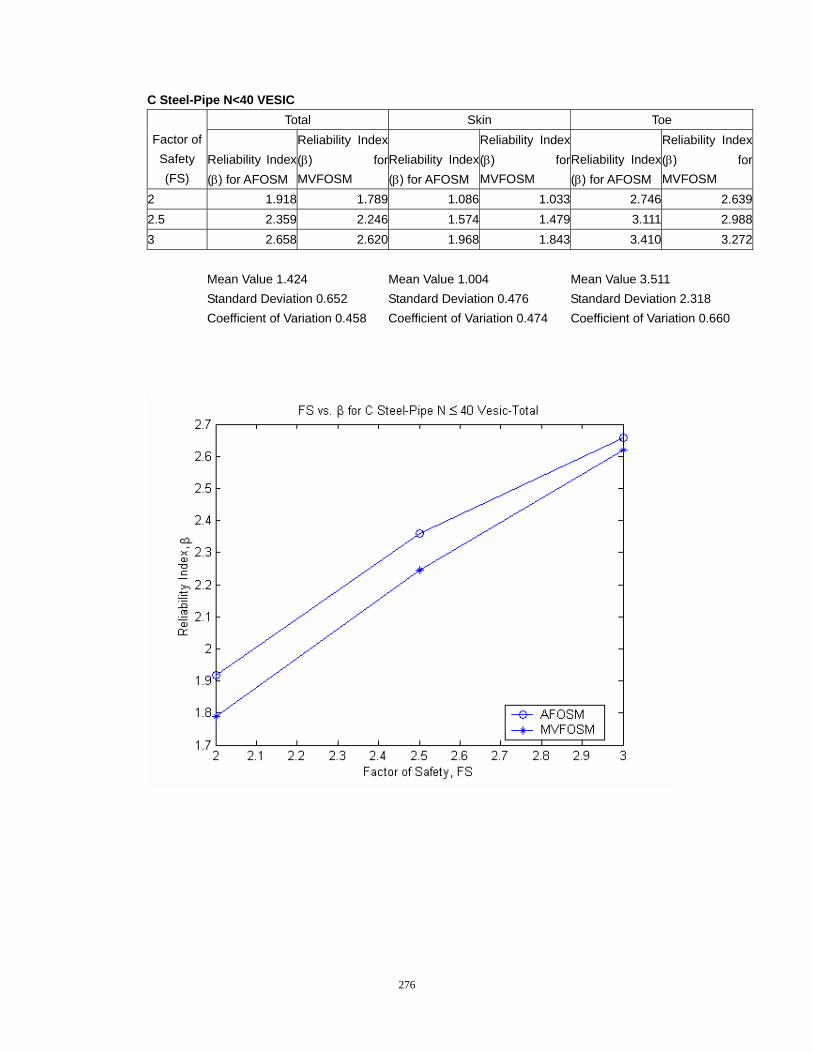
276
C Steel-Pipe N<40 VESIC Total Skin Toe
Factor of Safety (FS)
Reliability Index (β) for AFOSM
Reliability Index(β) forMVFOSM
Reliability Index (β) for AFOSM
Reliability Index (β) for MVFOSM
Reliability Index (β) for AFOSM
Reliability Index (β) for MVFOSM
2 1.918 1.789 1.086 1.033 2.746 2.6392.5 2.359 2.246 1.574 1.479 3.111 2.9883 2.658 2.620 1.968 1.843 3.410 3.272 Mean Value 1.424 Mean Value 1.004 Mean Value 3.511 Standard Deviation 0.652 Standard Deviation 0.476 Standard Deviation 2.318 Coefficient of Variation 0.458 Coefficient of Variation 0.474 Coefficient of Variation 0.660
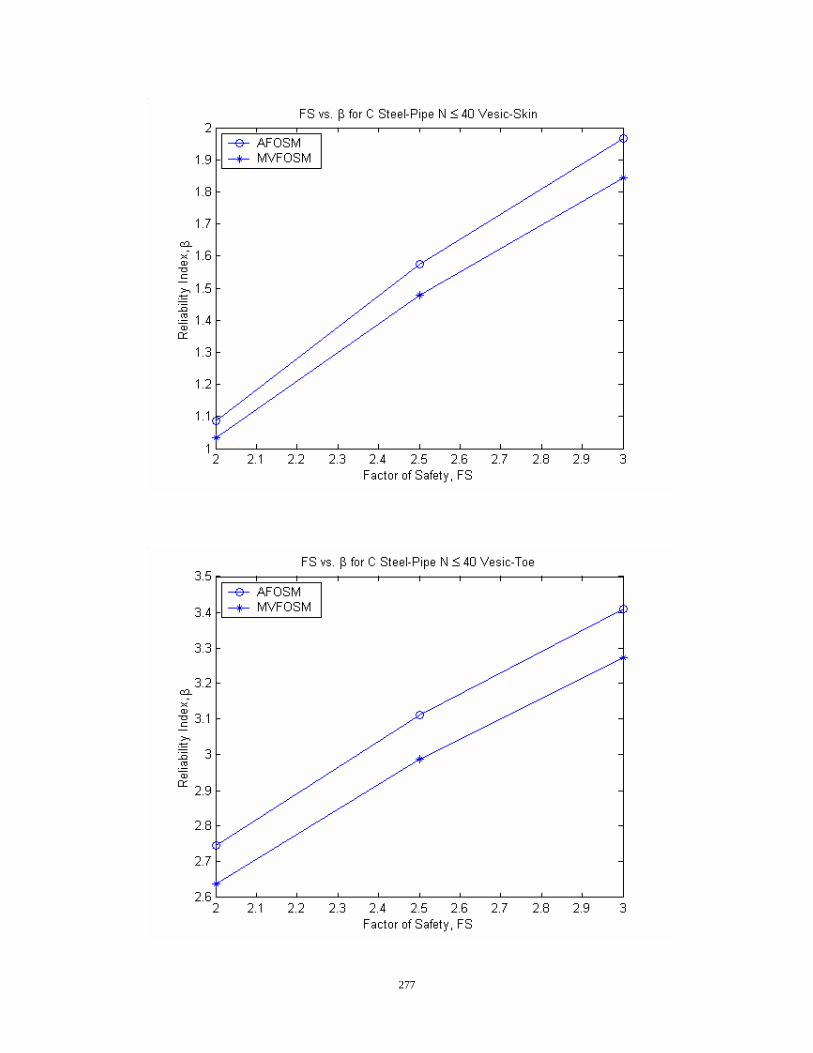
277

278
C Steel-Pipe N<40 NORDLUND Total Skin Toe Factor
of Safety (FS)
Reliability Index (β) for AFOSM
Reliability Index (β) for MVFOSM
Reliability Index (β) for AFOSM
Reliability Index (β) for MVFOSM
Reliability Index (β) for AFOSM
Reliability Index (β) for MVFOSM
2 1.202 1.142 0.618 0.594 1.872 1.8122.5 1.7 1.592 1.114 1.054 2.225 2.1553 2.098 1.961 1.53 1.431 2.529 2.436 Mean Value 1.051 Mean Value 0.791 Mean Value 2.116 Standard Deviation 0.491 Standard Deviation 0.358 Standard Deviation 1.425 Coefficient of Variation 0.467Coefficient of Variation 0.453Coefficient of Variation 0.673
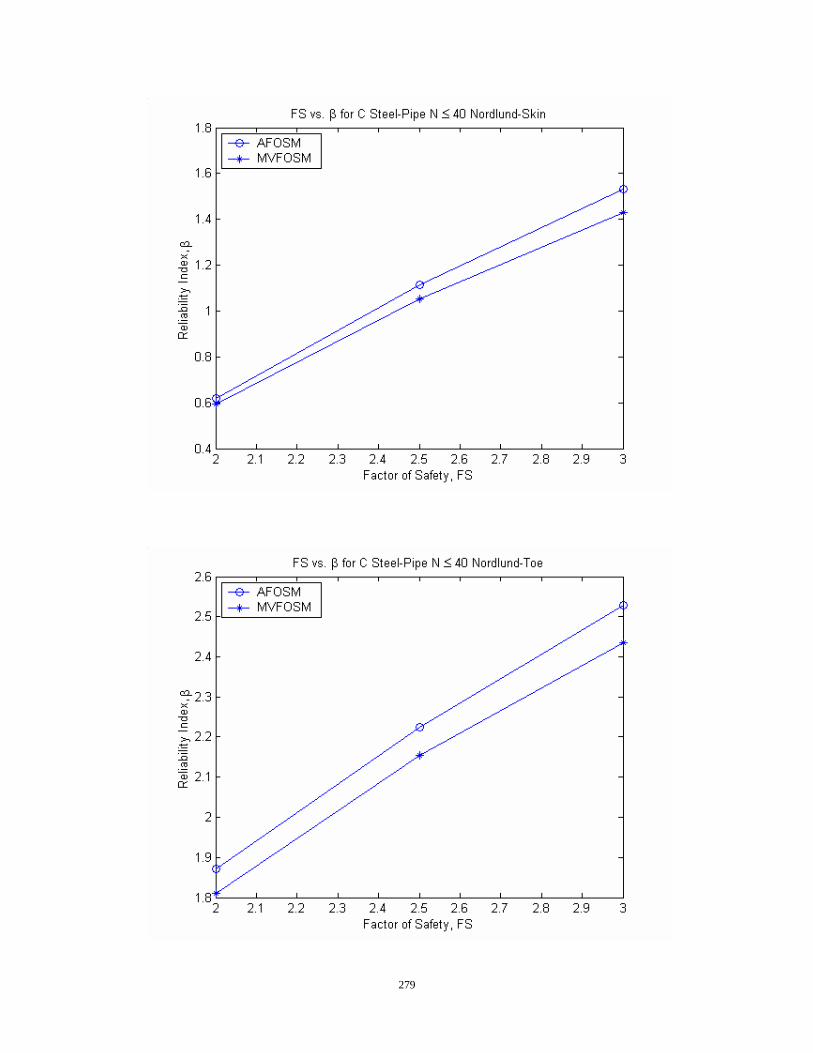
279
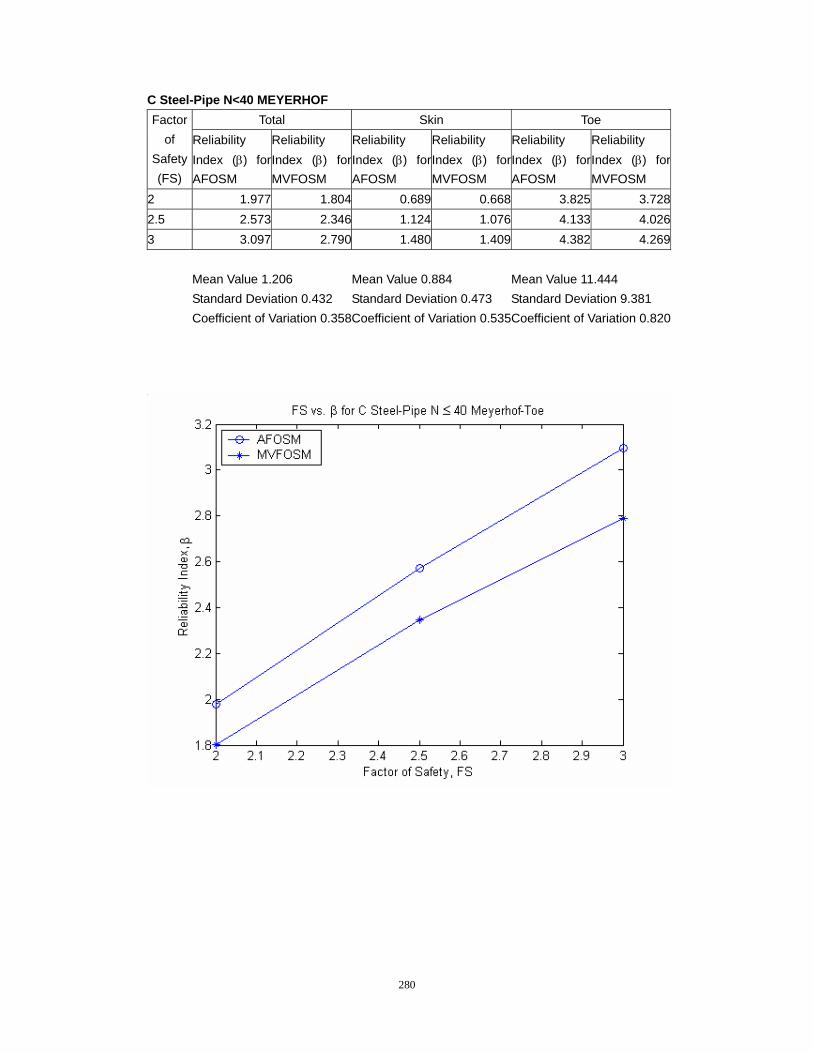
280
C Steel-Pipe N<40 MEYERHOF Total Skin Toe Factor
of Safety (FS)
Reliability Index (β) for AFOSM
Reliability Index (β) for MVFOSM
Reliability Index (β) for AFOSM
Reliability Index (β) for MVFOSM
Reliability Index (β) for AFOSM
Reliability Index (β) for MVFOSM
2 1.977 1.804 0.689 0.668 3.825 3.7282.5 2.573 2.346 1.124 1.076 4.133 4.0263 3.097 2.790 1.480 1.409 4.382 4.269 Mean Value 1.206 Mean Value 0.884 Mean Value 11.444 Standard Deviation 0.432 Standard Deviation 0.473 Standard Deviation 9.381 Coefficient of Variation 0.358Coefficient of Variation 0.535Coefficient of Variation 0.820
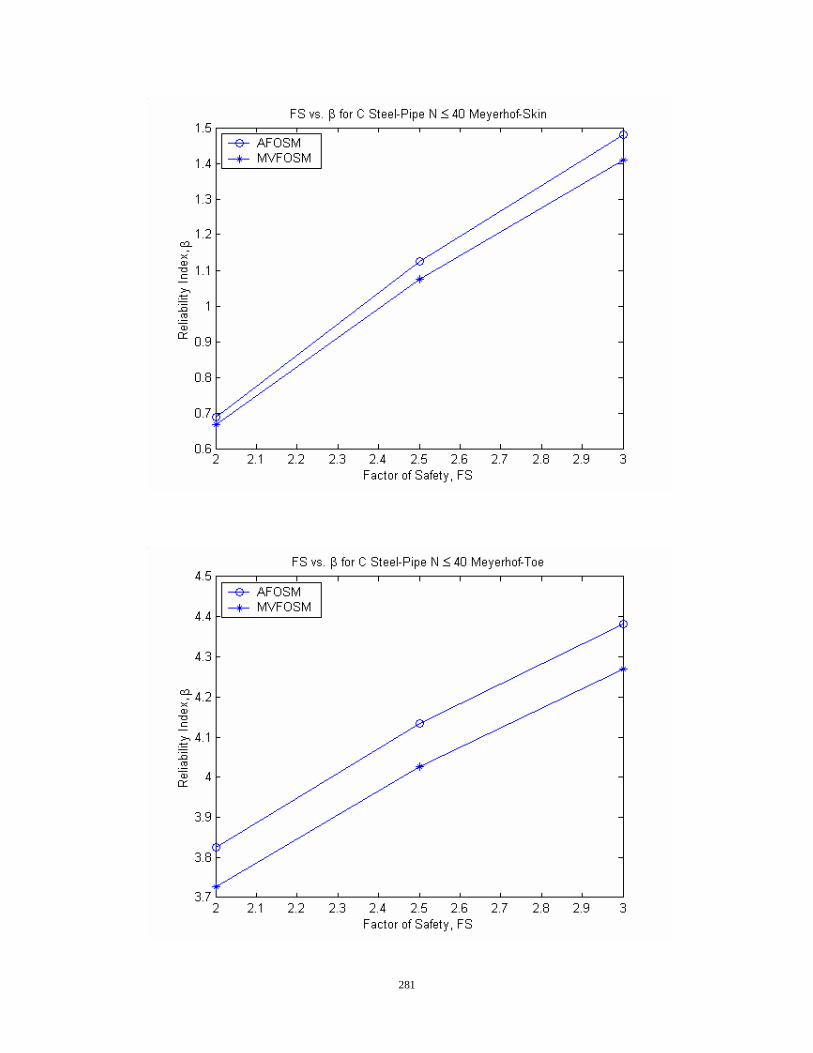
281
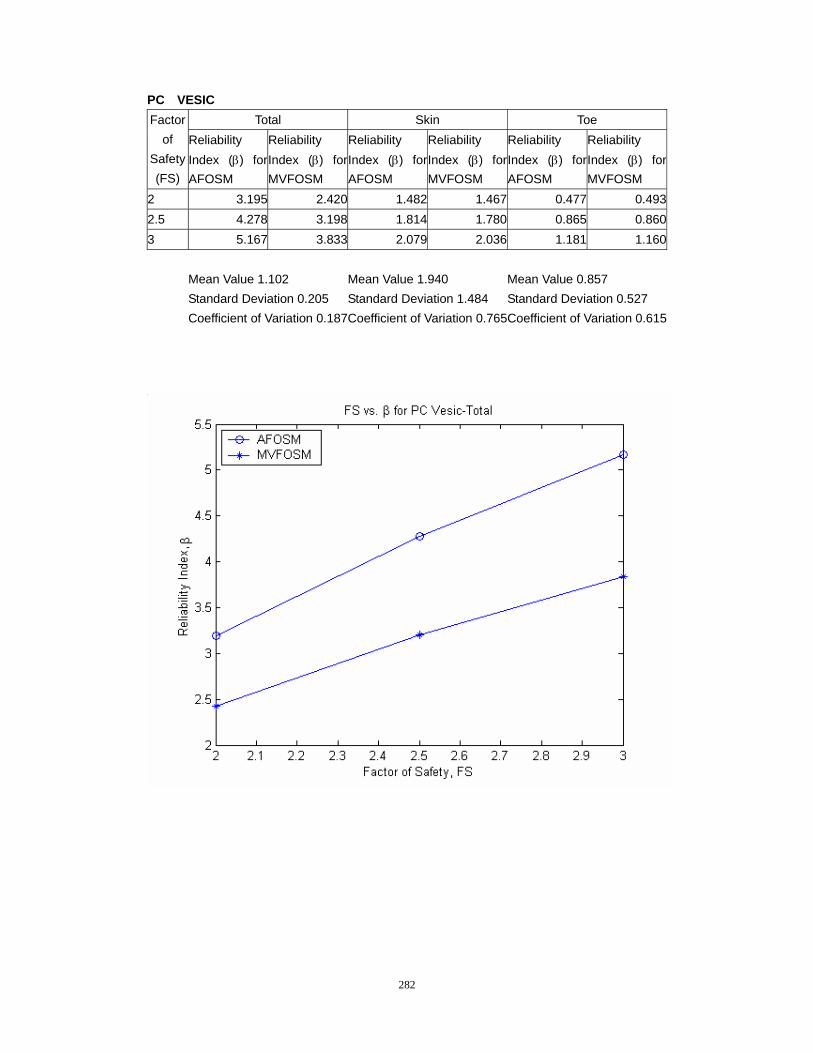
282
PC VESIC Total Skin Toe Factor
of Safety (FS)
Reliability Index (β) for AFOSM
Reliability Index (β) for MVFOSM
Reliability Index (β) for AFOSM
Reliability Index (β) for MVFOSM
Reliability Index (β) for AFOSM
Reliability Index (β) for MVFOSM
2 3.195 2.420 1.482 1.467 0.477 0.4932.5 4.278 3.198 1.814 1.780 0.865 0.8603 5.167 3.833 2.079 2.036 1.181 1.160 Mean Value 1.102 Mean Value 1.940 Mean Value 0.857 Standard Deviation 0.205 Standard Deviation 1.484 Standard Deviation 0.527 Coefficient of Variation 0.187Coefficient of Variation 0.765Coefficient of Variation 0.615
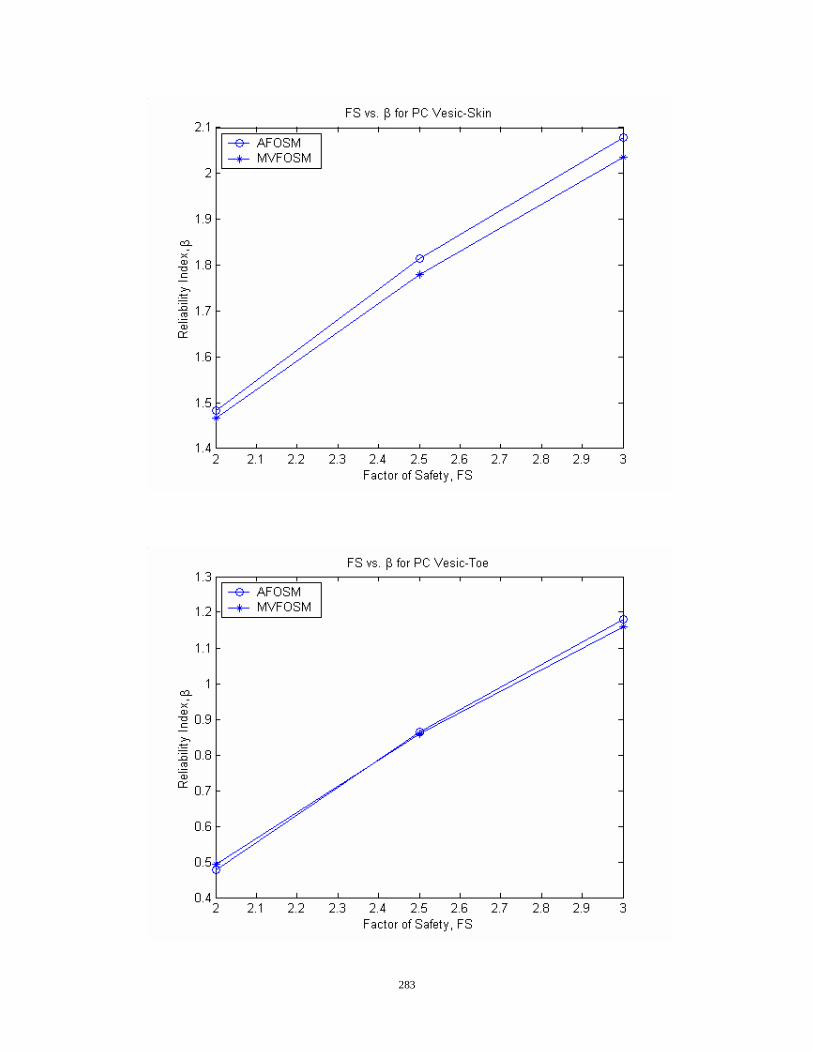
283
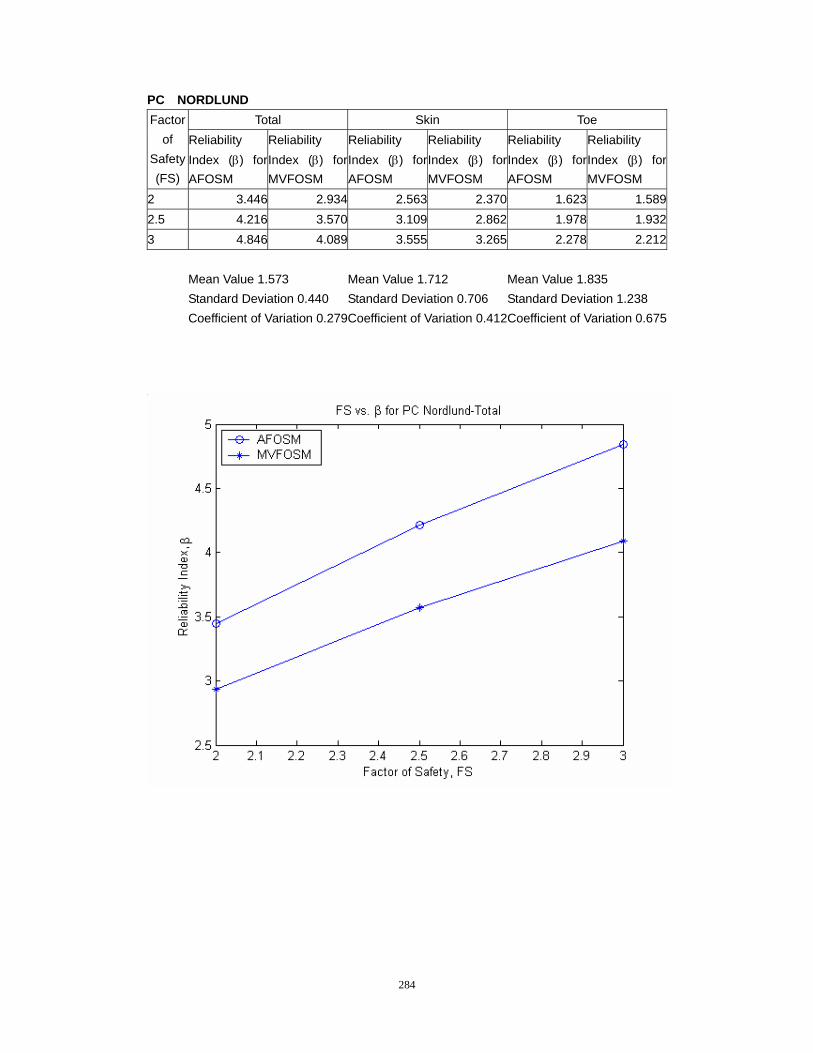
284
PC NORDLUND Total Skin Toe Factor
of Safety (FS)
Reliability Index (β) for AFOSM
Reliability Index (β) for MVFOSM
Reliability Index (β) for AFOSM
Reliability Index (β) for MVFOSM
Reliability Index (β) for AFOSM
Reliability Index (β) for MVFOSM
2 3.446 2.934 2.563 2.370 1.623 1.5892.5 4.216 3.570 3.109 2.862 1.978 1.9323 4.846 4.089 3.555 3.265 2.278 2.212 Mean Value 1.573 Mean Value 1.712 Mean Value 1.835 Standard Deviation 0.440 Standard Deviation 0.706 Standard Deviation 1.238 Coefficient of Variation 0.279Coefficient of Variation 0.412Coefficient of Variation 0.675
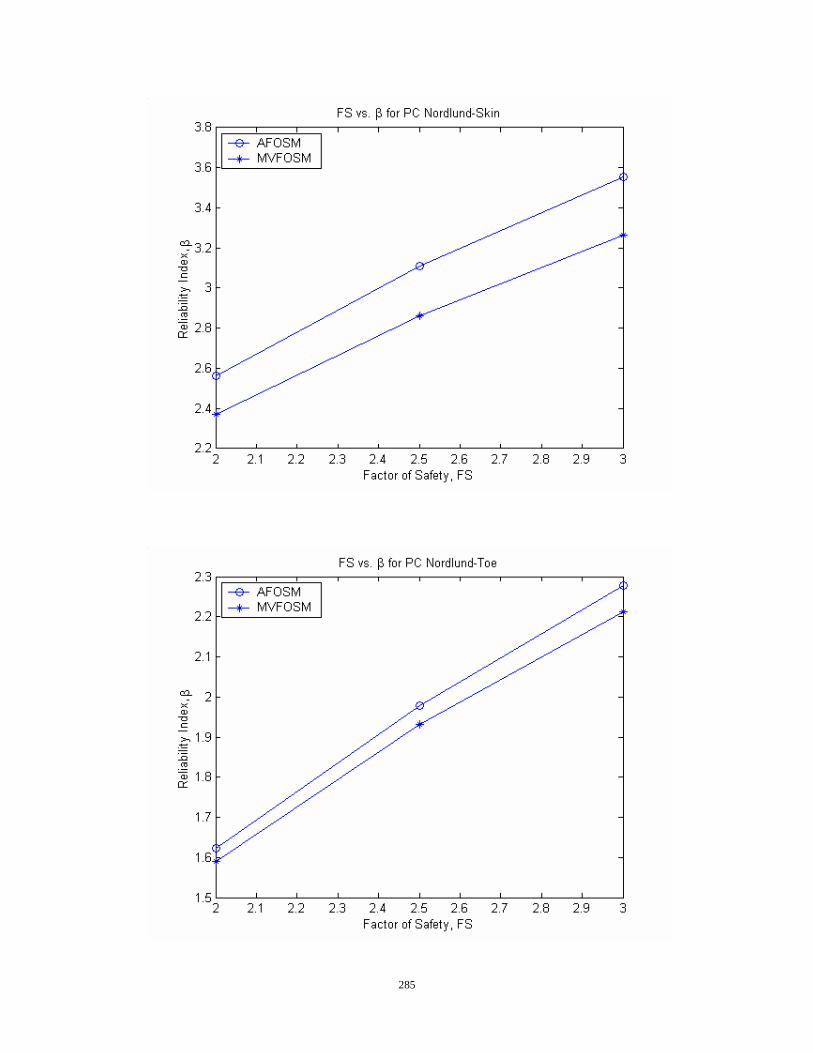
285
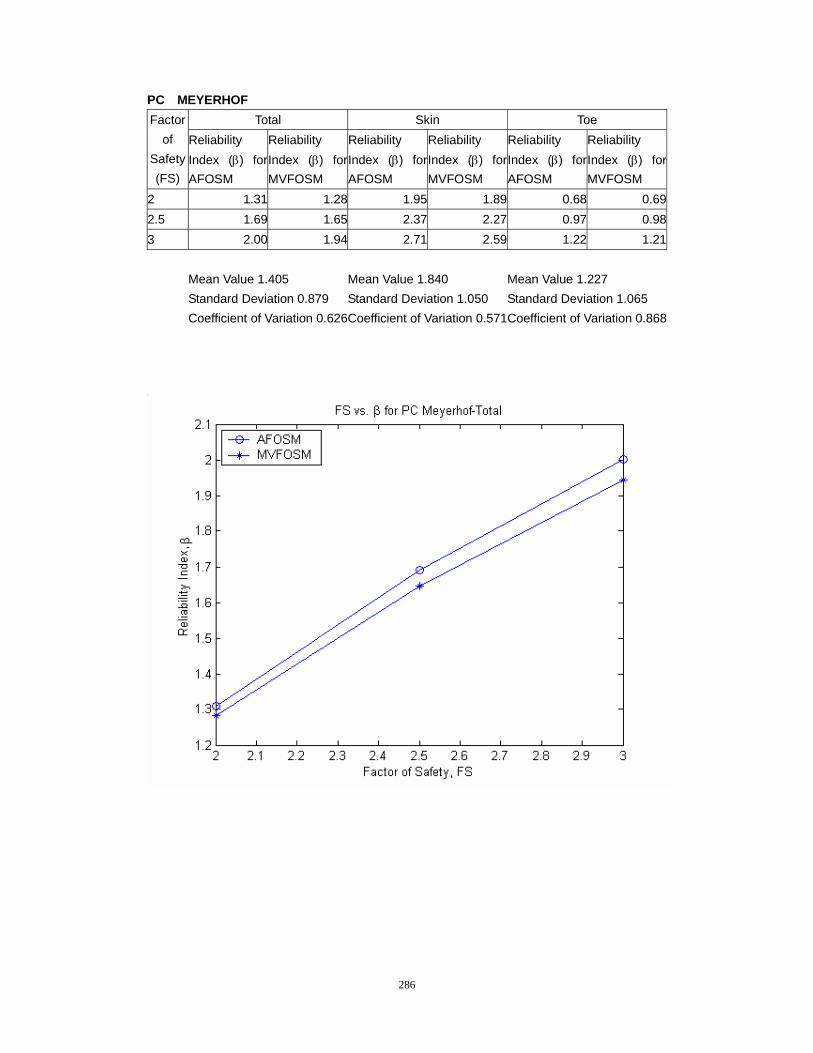
286
PC MEYERHOF Total Skin Toe Factor
of Safety (FS)
Reliability Index (β) for AFOSM
Reliability Index (β) for MVFOSM
Reliability Index (β) for AFOSM
Reliability Index (β) for MVFOSM
Reliability Index (β) for AFOSM
Reliability Index (β) for MVFOSM
2 1.31 1.28 1.95 1.89 0.68 0.692.5 1.69 1.65 2.37 2.27 0.97 0.983 2.00 1.94 2.71 2.59 1.22 1.21 Mean Value 1.405 Mean Value 1.840 Mean Value 1.227 Standard Deviation 0.879 Standard Deviation 1.050 Standard Deviation 1.065 Coefficient of Variation 0.626Coefficient of Variation 0.571Coefficient of Variation 0.868
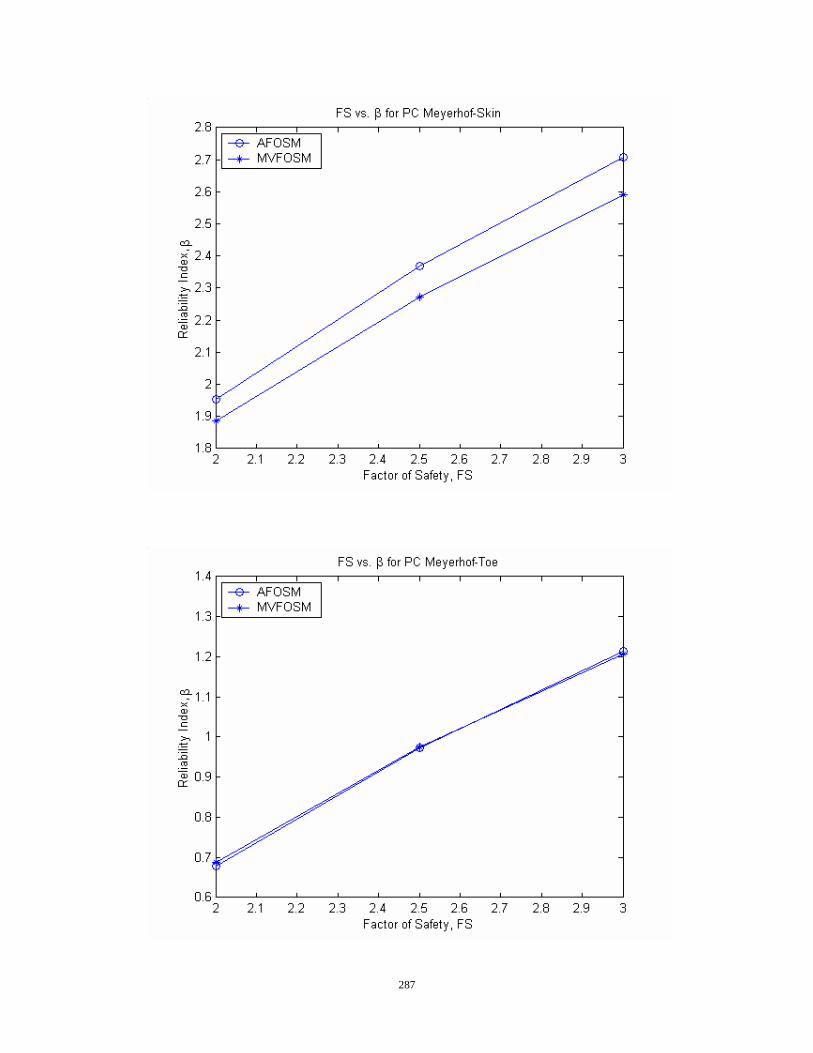
287
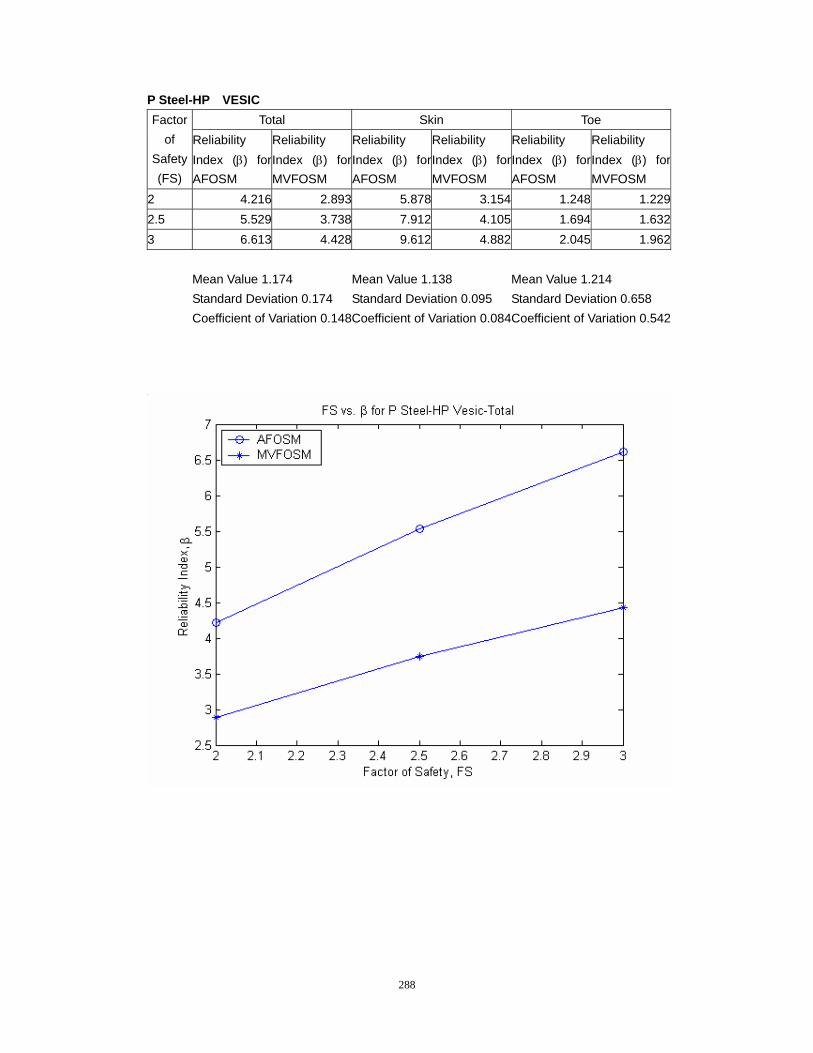
288
P Steel-HP VESIC Total Skin Toe Factor
of Safety (FS)
Reliability Index (β) for AFOSM
Reliability Index (β) for MVFOSM
Reliability Index (β) for AFOSM
Reliability Index (β) for MVFOSM
Reliability Index (β) for AFOSM
Reliability Index (β) for MVFOSM
2 4.216 2.893 5.878 3.154 1.248 1.2292.5 5.529 3.738 7.912 4.105 1.694 1.6323 6.613 4.428 9.612 4.882 2.045 1.962 Mean Value 1.174 Mean Value 1.138 Mean Value 1.214 Standard Deviation 0.174 Standard Deviation 0.095 Standard Deviation 0.658 Coefficient of Variation 0.148Coefficient of Variation 0.084Coefficient of Variation 0.542
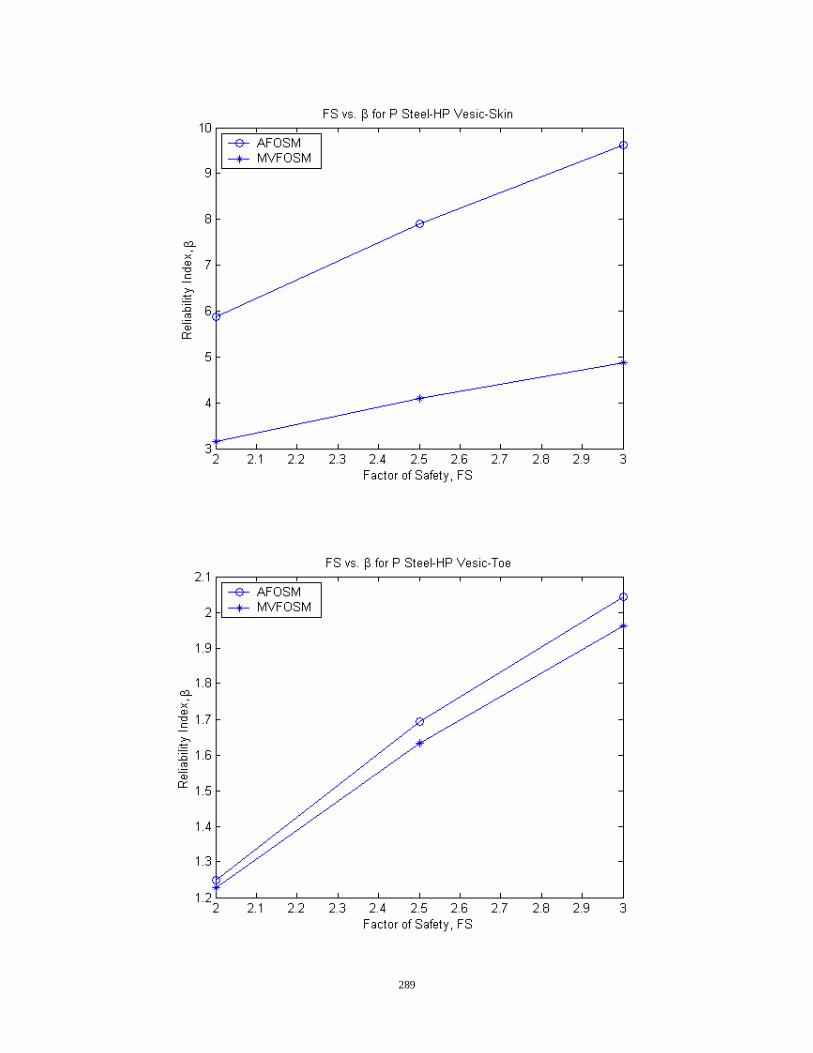
289
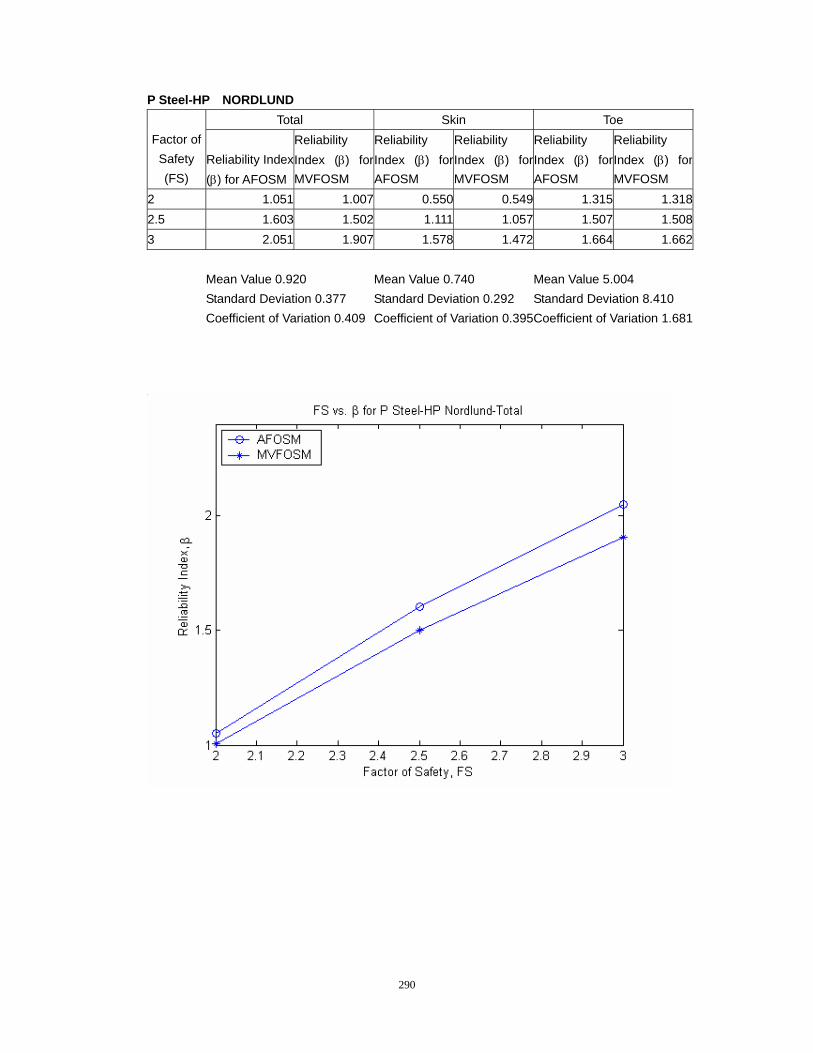
290
P Steel-HP NORDLUND Total Skin Toe
Factor of Safety (FS)
Reliability Index(β) for AFOSM
Reliability Index (β) for MVFOSM
Reliability Index (β) for AFOSM
Reliability Index (β) for MVFOSM
Reliability Index (β) for AFOSM
Reliability Index (β) for MVFOSM
2 1.051 1.007 0.550 0.549 1.315 1.3182.5 1.603 1.502 1.111 1.057 1.507 1.5083 2.051 1.907 1.578 1.472 1.664 1.662 Mean Value 0.920 Mean Value 0.740 Mean Value 5.004 Standard Deviation 0.377 Standard Deviation 0.292 Standard Deviation 8.410 Coefficient of Variation 0.409 Coefficient of Variation 0.395Coefficient of Variation 1.681
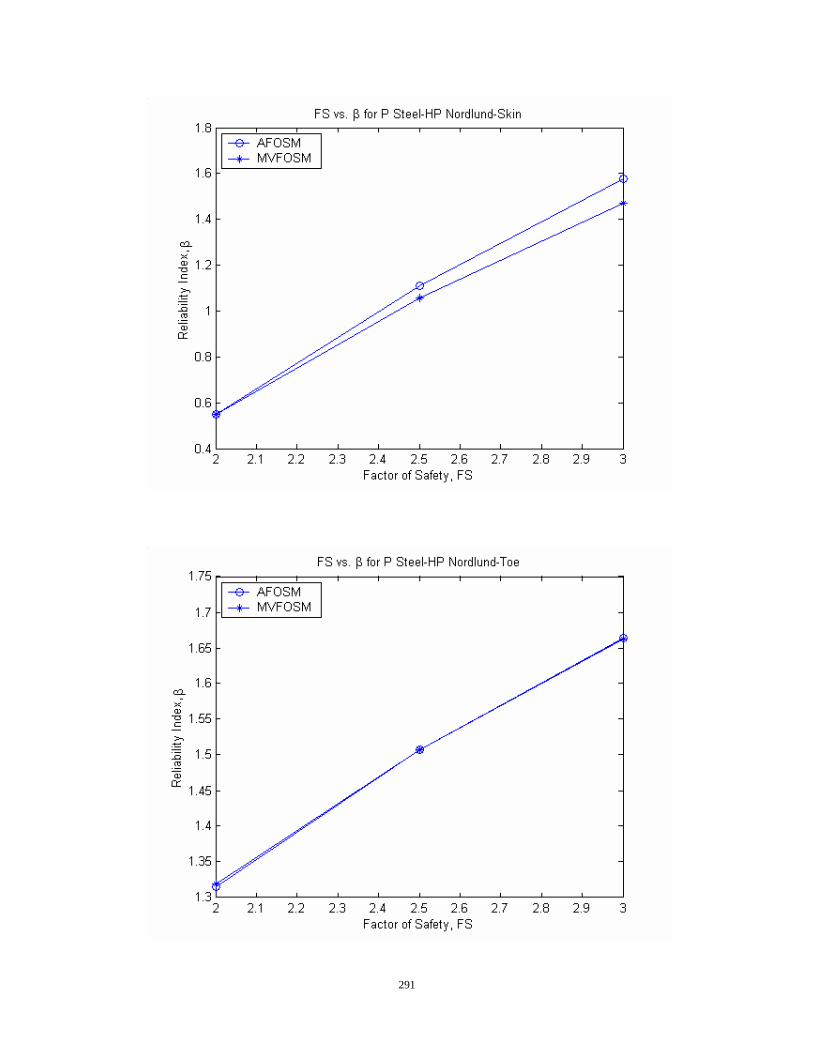
291
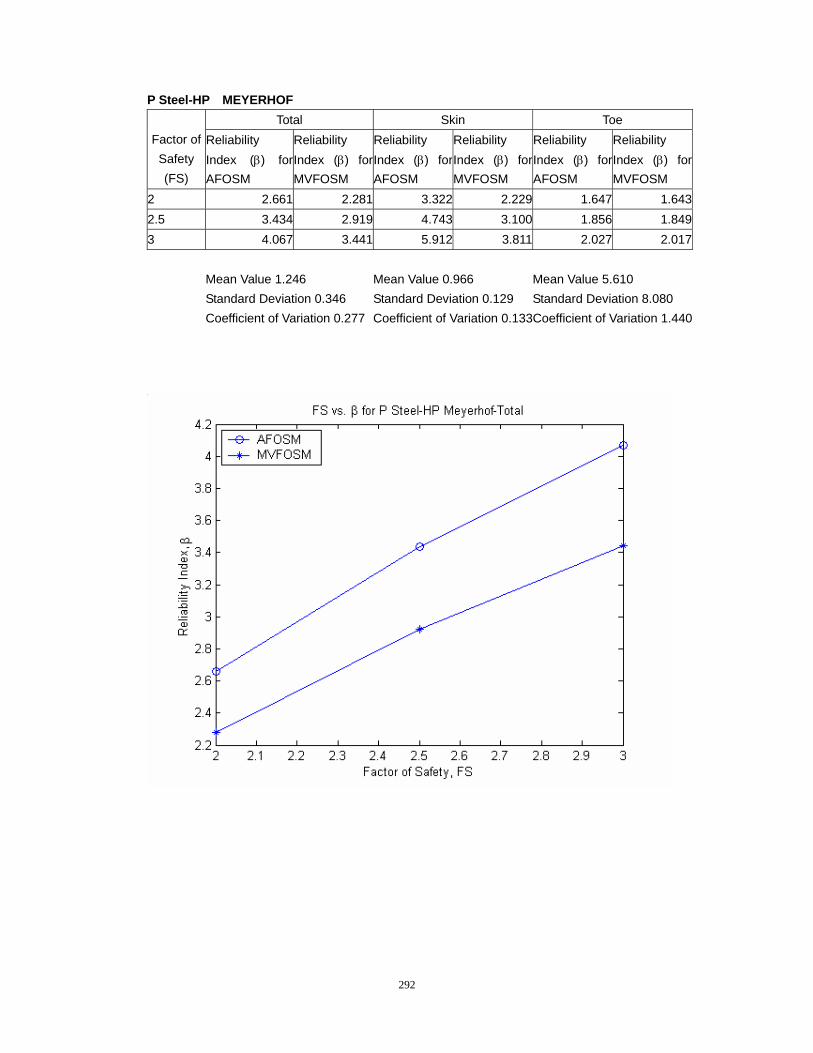
292
P Steel-HP MEYERHOF Total Skin Toe
Factor of Safety (FS)
Reliability Index (β) for AFOSM
Reliability Index (β) for MVFOSM
Reliability Index (β) for AFOSM
Reliability Index (β) for MVFOSM
Reliability Index (β) for AFOSM
Reliability Index (β) for MVFOSM
2 2.661 2.281 3.322 2.229 1.647 1.6432.5 3.434 2.919 4.743 3.100 1.856 1.8493 4.067 3.441 5.912 3.811 2.027 2.017 Mean Value 1.246 Mean Value 0.966 Mean Value 5.610 Standard Deviation 0.346 Standard Deviation 0.129 Standard Deviation 8.080 Coefficient of Variation 0.277 Coefficient of Variation 0.133Coefficient of Variation 1.440
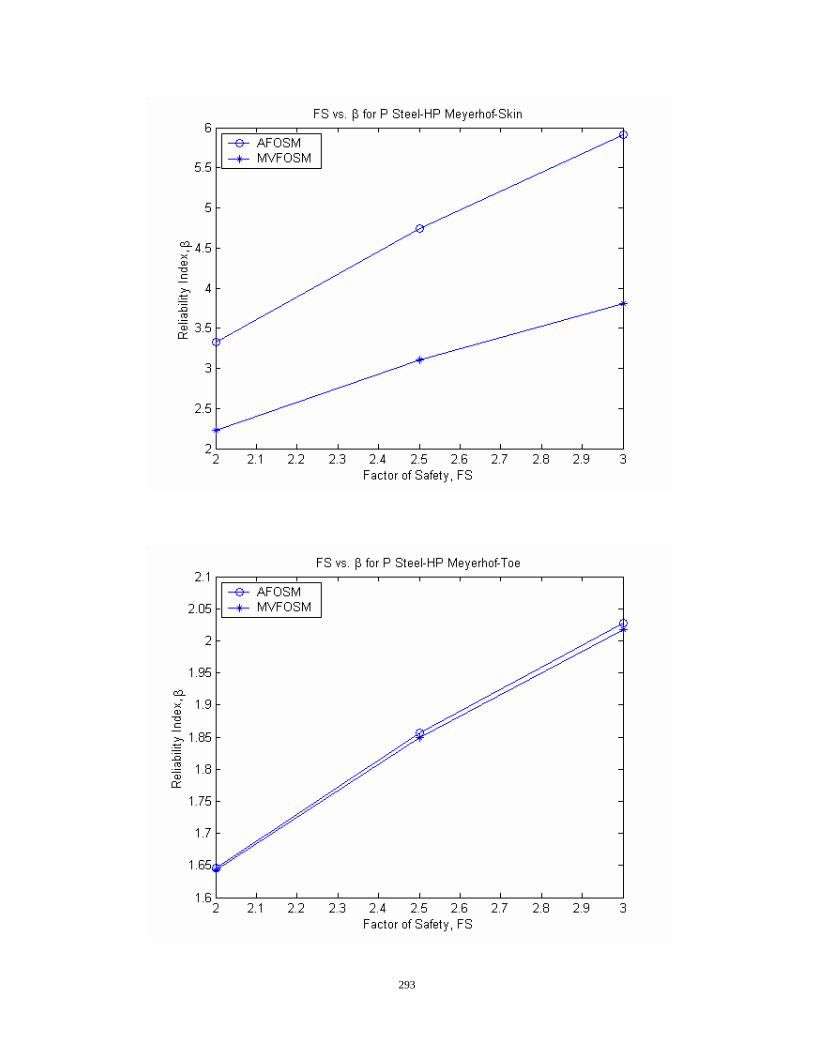
293
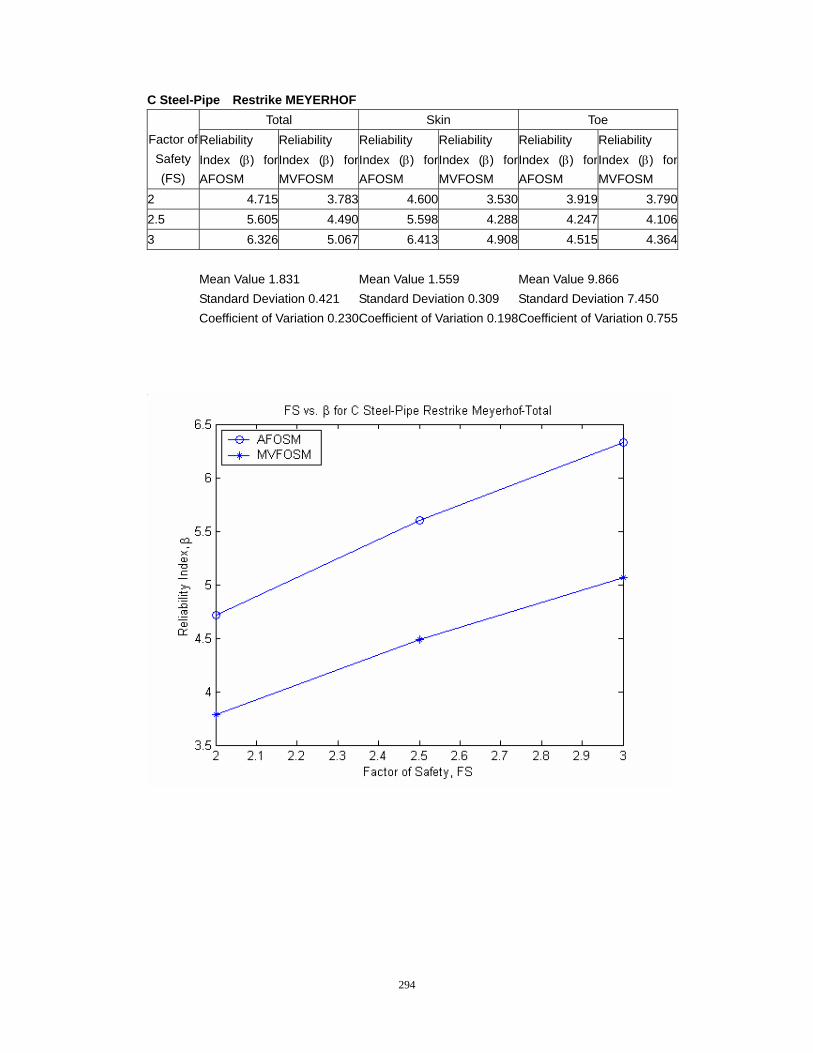
294
C Steel-Pipe Restrike MEYERHOF Total Skin Toe
Factor of Safety (FS)
Reliability Index (β) for AFOSM
Reliability Index (β) for MVFOSM
Reliability Index (β) for AFOSM
Reliability Index (β) for MVFOSM
Reliability Index (β) for AFOSM
Reliability Index (β) for MVFOSM
2 4.715 3.783 4.600 3.530 3.919 3.7902.5 5.605 4.490 5.598 4.288 4.247 4.1063 6.326 5.067 6.413 4.908 4.515 4.364 Mean Value 1.831 Mean Value 1.559 Mean Value 9.866 Standard Deviation 0.421 Standard Deviation 0.309 Standard Deviation 7.450 Coefficient of Variation 0.230Coefficient of Variation 0.198Coefficient of Variation 0.755
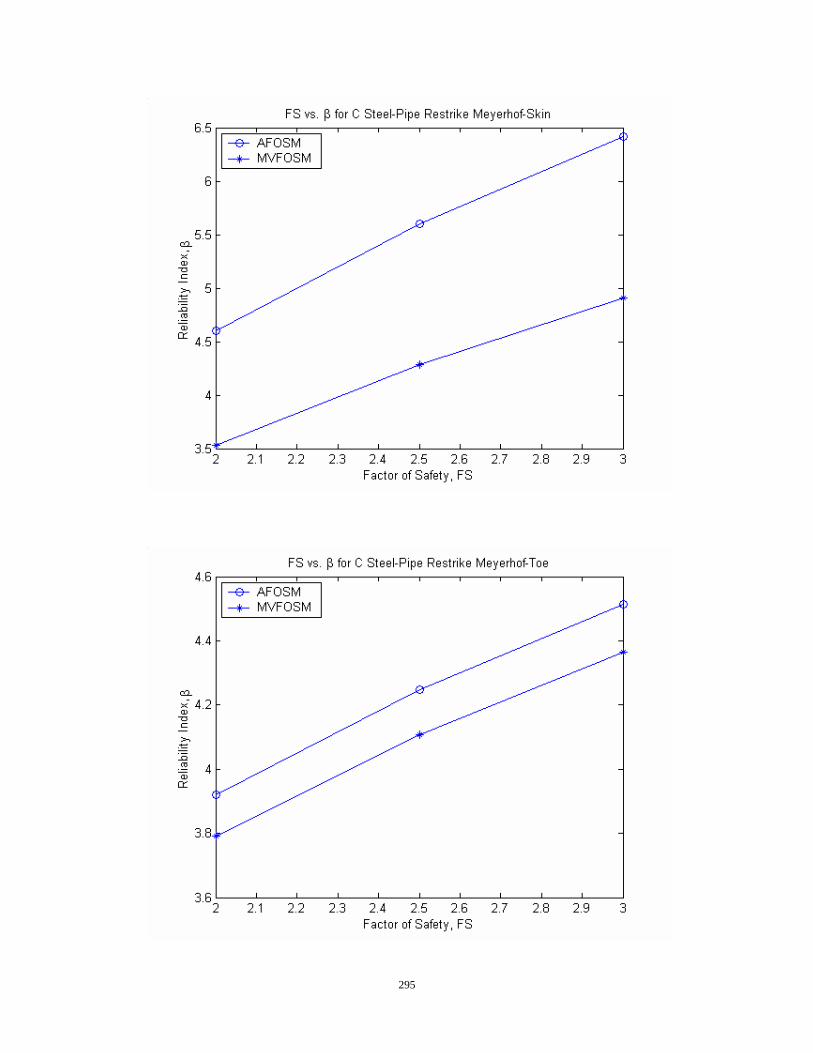
295
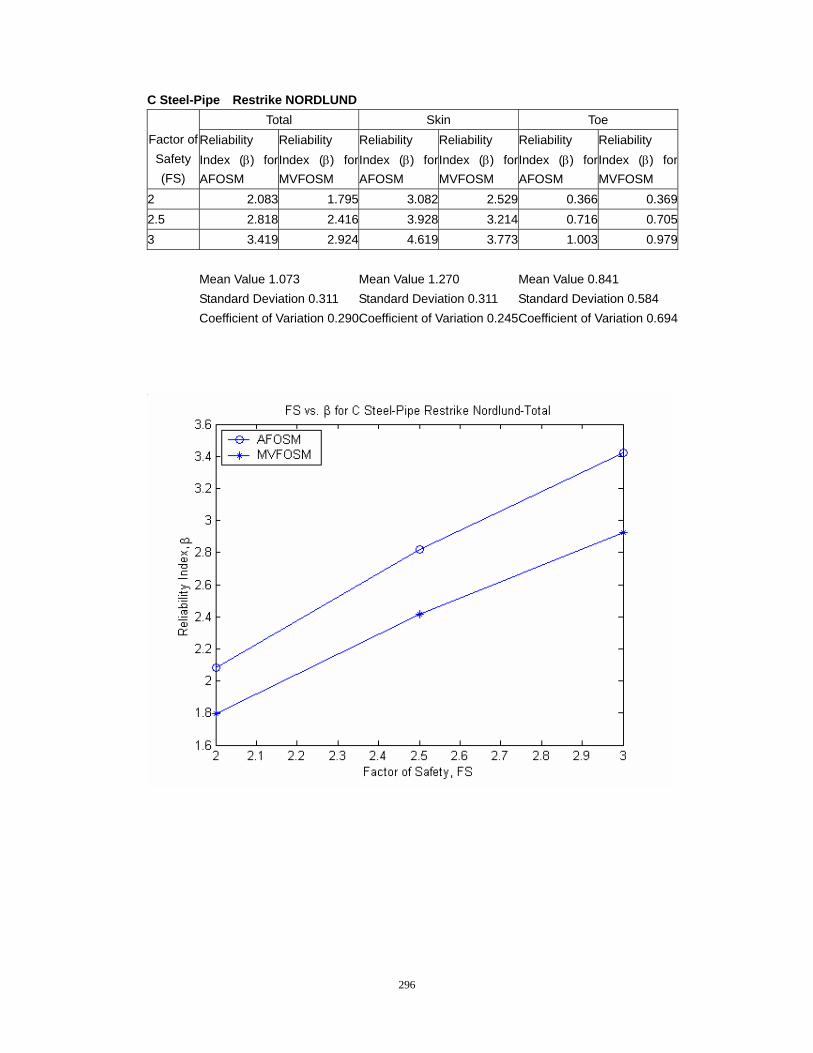
296
C Steel-Pipe Restrike NORDLUND Total Skin Toe
Factor of Safety (FS)
Reliability Index (β) for AFOSM
Reliability Index (β) for MVFOSM
Reliability Index (β) for AFOSM
Reliability Index (β) for MVFOSM
Reliability Index (β) for AFOSM
Reliability Index (β) for MVFOSM
2 2.083 1.795 3.082 2.529 0.366 0.3692.5 2.818 2.416 3.928 3.214 0.716 0.7053 3.419 2.924 4.619 3.773 1.003 0.979 Mean Value 1.073 Mean Value 1.270 Mean Value 0.841 Standard Deviation 0.311 Standard Deviation 0.311 Standard Deviation 0.584 Coefficient of Variation 0.290Coefficient of Variation 0.245Coefficient of Variation 0.694
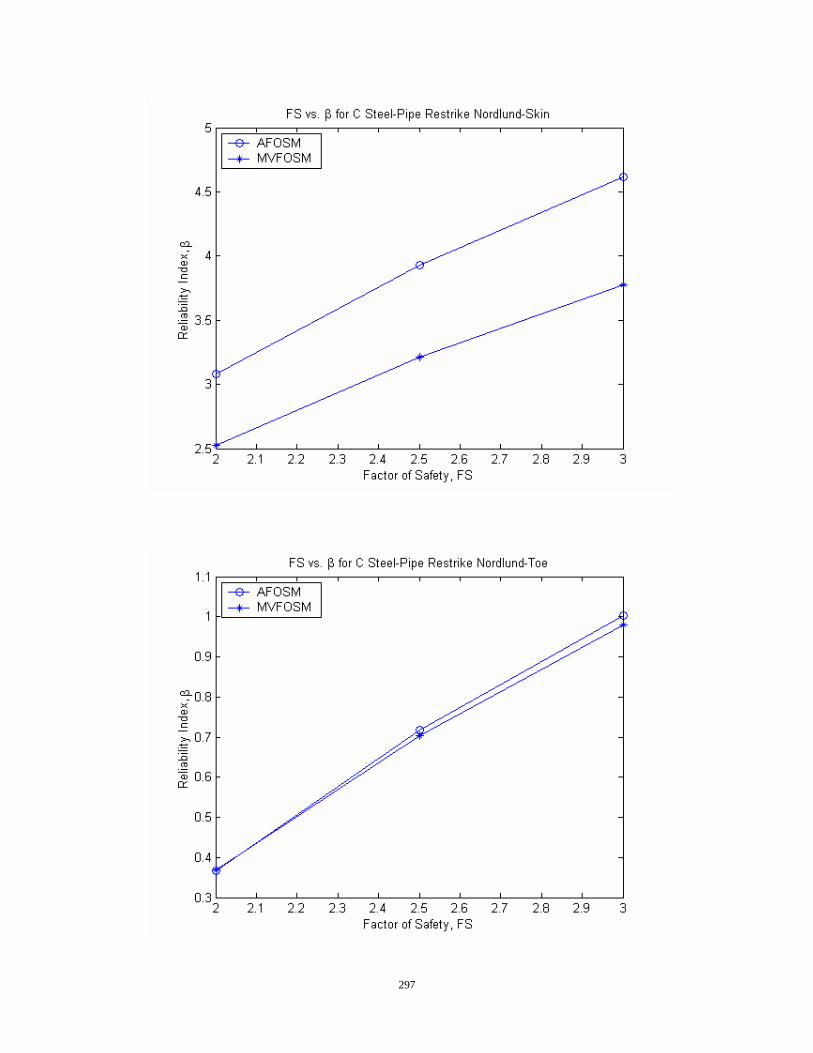
297
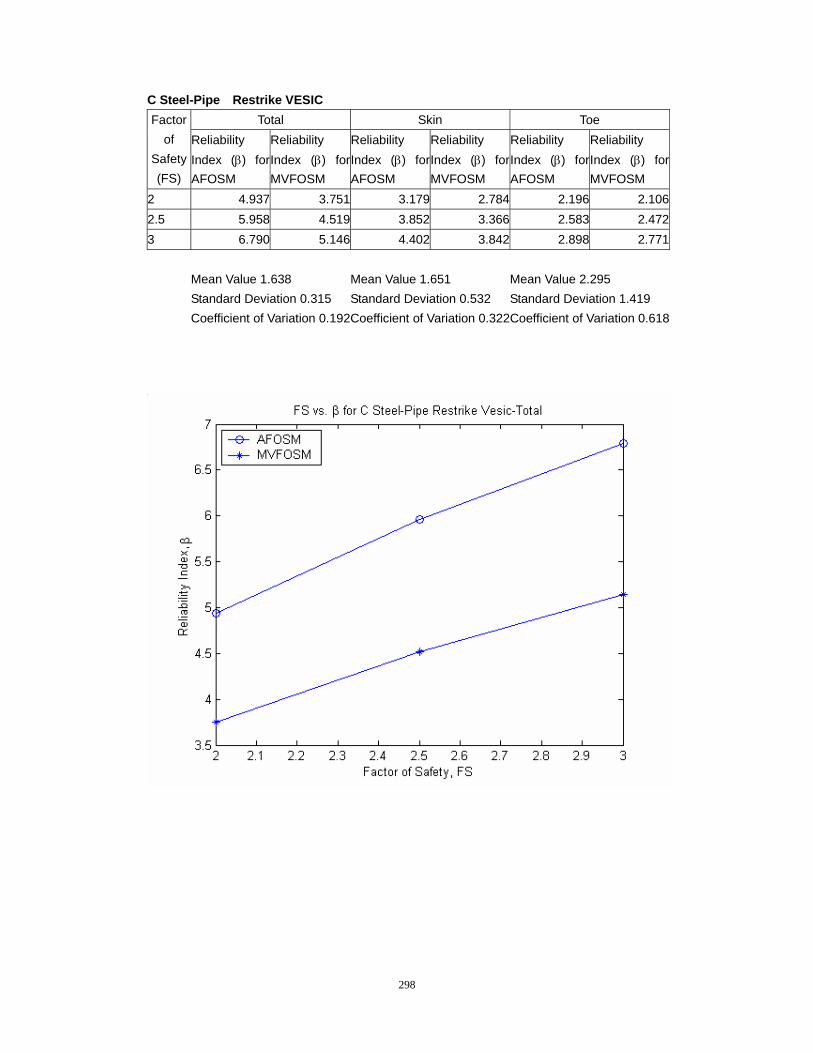
298
C Steel-Pipe Restrike VESIC Total Skin Toe Factor
of Safety (FS)
Reliability Index (β) for AFOSM
Reliability Index (β) for MVFOSM
Reliability Index (β) for AFOSM
Reliability Index (β) for MVFOSM
Reliability Index (β) for AFOSM
Reliability Index (β) for MVFOSM
2 4.937 3.751 3.179 2.784 2.196 2.1062.5 5.958 4.519 3.852 3.366 2.583 2.4723 6.790 5.146 4.402 3.842 2.898 2.771 Mean Value 1.638 Mean Value 1.651 Mean Value 2.295 Standard Deviation 0.315 Standard Deviation 0.532 Standard Deviation 1.419 Coefficient of Variation 0.192Coefficient of Variation 0.322Coefficient of Variation 0.618
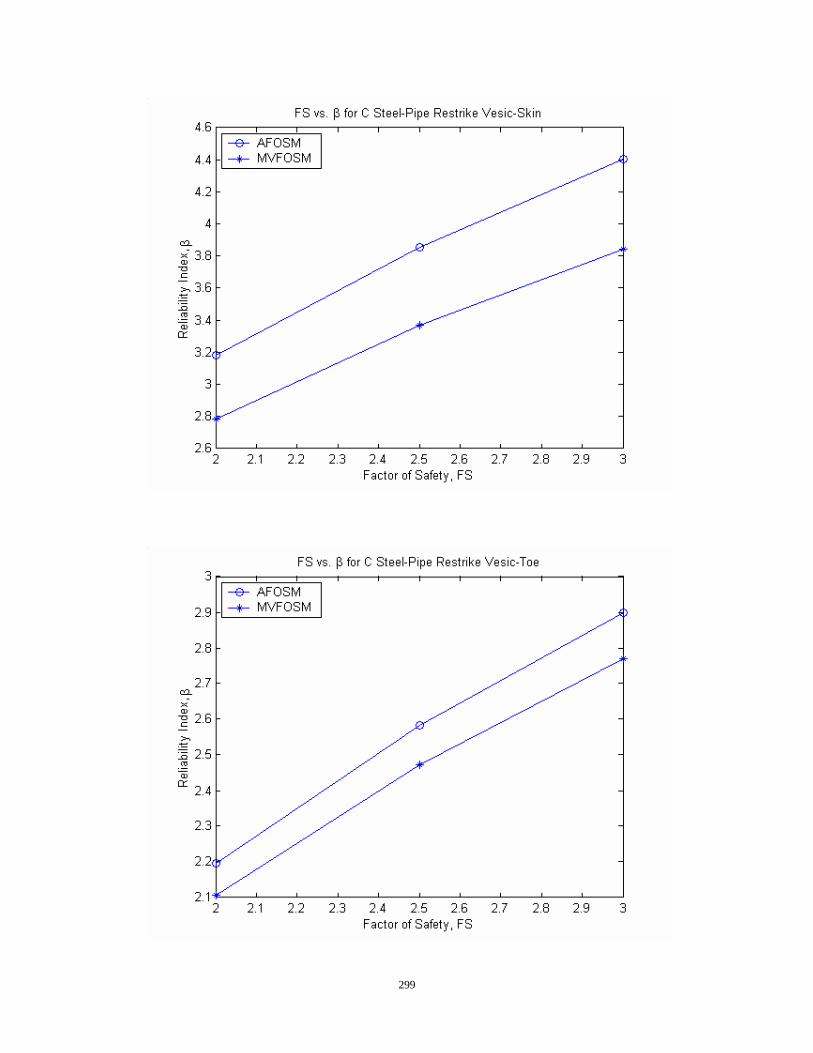
299
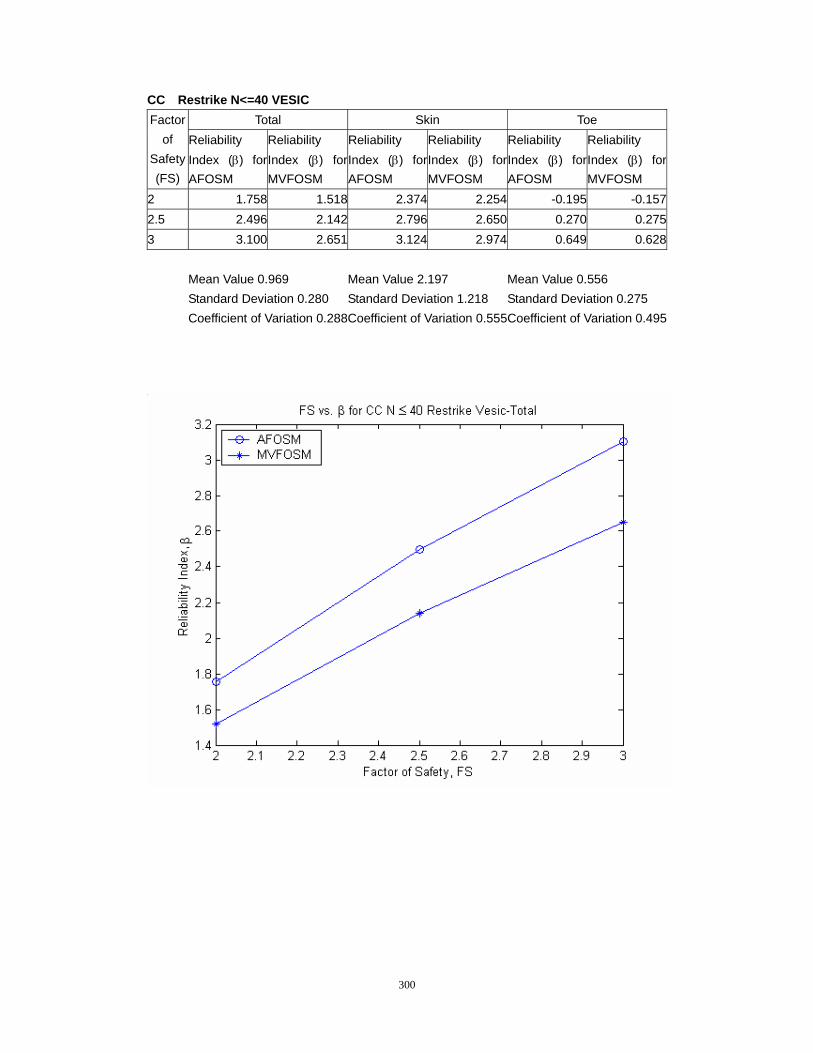
300
CC Restrike N<=40 VESIC Total Skin Toe Factor
of Safety (FS)
Reliability Index (β) for AFOSM
Reliability Index (β) for MVFOSM
Reliability Index (β) for AFOSM
Reliability Index (β) for MVFOSM
Reliability Index (β) for AFOSM
Reliability Index (β) for MVFOSM
2 1.758 1.518 2.374 2.254 -0.195 -0.1572.5 2.496 2.142 2.796 2.650 0.270 0.2753 3.100 2.651 3.124 2.974 0.649 0.628 Mean Value 0.969 Mean Value 2.197 Mean Value 0.556 Standard Deviation 0.280 Standard Deviation 1.218 Standard Deviation 0.275 Coefficient of Variation 0.288Coefficient of Variation 0.555Coefficient of Variation 0.495
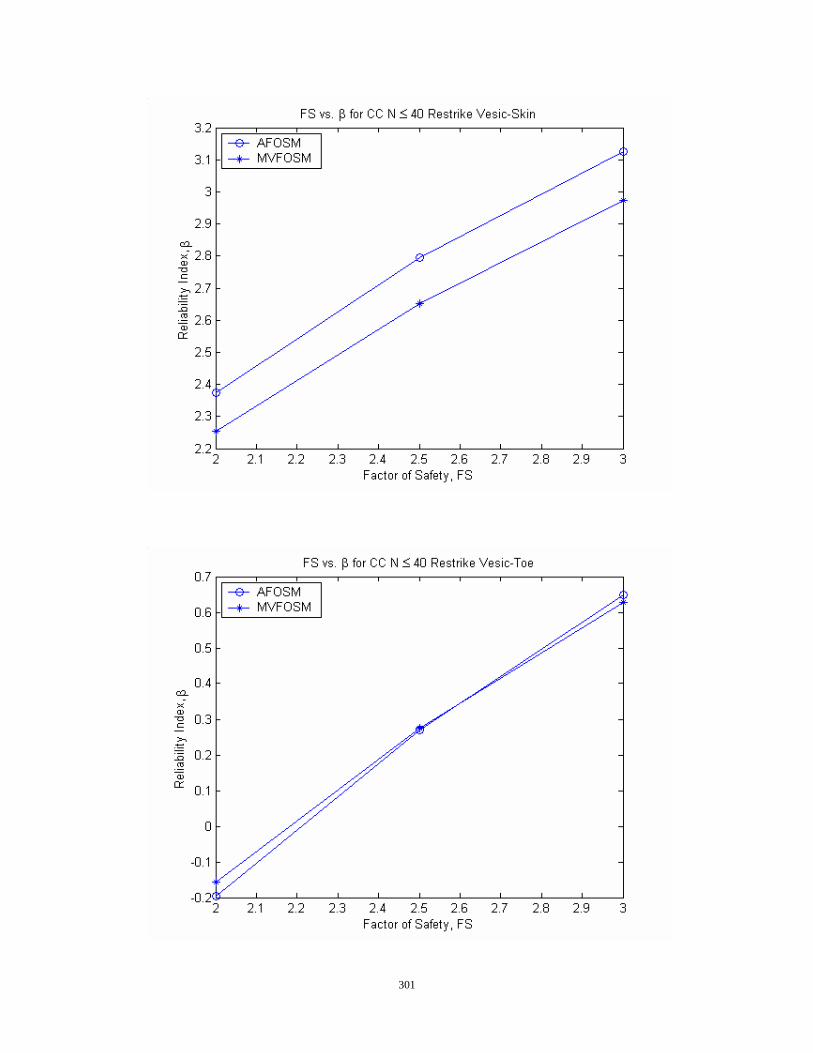
301
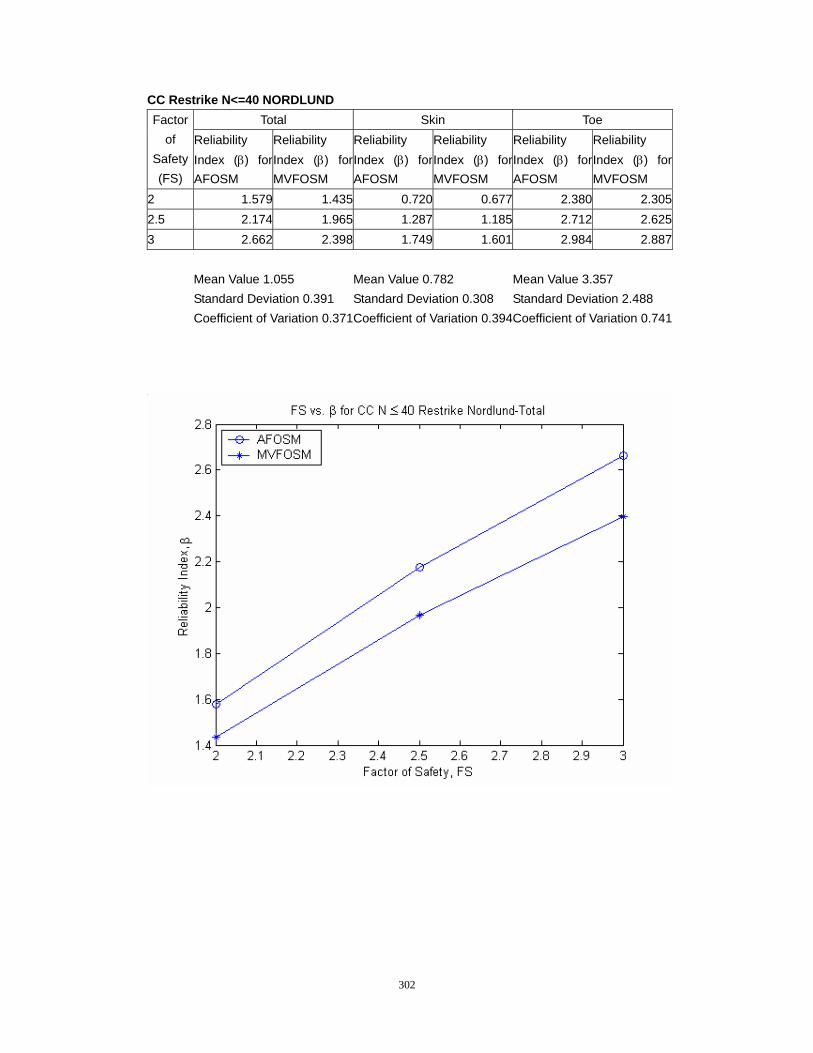
302
CC Restrike N<=40 NORDLUND Total Skin Toe Factor
of Safety (FS)
Reliability Index (β) for AFOSM
Reliability Index (β) for MVFOSM
Reliability Index (β) for AFOSM
Reliability Index (β) for MVFOSM
Reliability Index (β) for AFOSM
Reliability Index (β) for MVFOSM
2 1.579 1.435 0.720 0.677 2.380 2.3052.5 2.174 1.965 1.287 1.185 2.712 2.6253 2.662 2.398 1.749 1.601 2.984 2.887 Mean Value 1.055 Mean Value 0.782 Mean Value 3.357 Standard Deviation 0.391 Standard Deviation 0.308 Standard Deviation 2.488 Coefficient of Variation 0.371Coefficient of Variation 0.394Coefficient of Variation 0.741
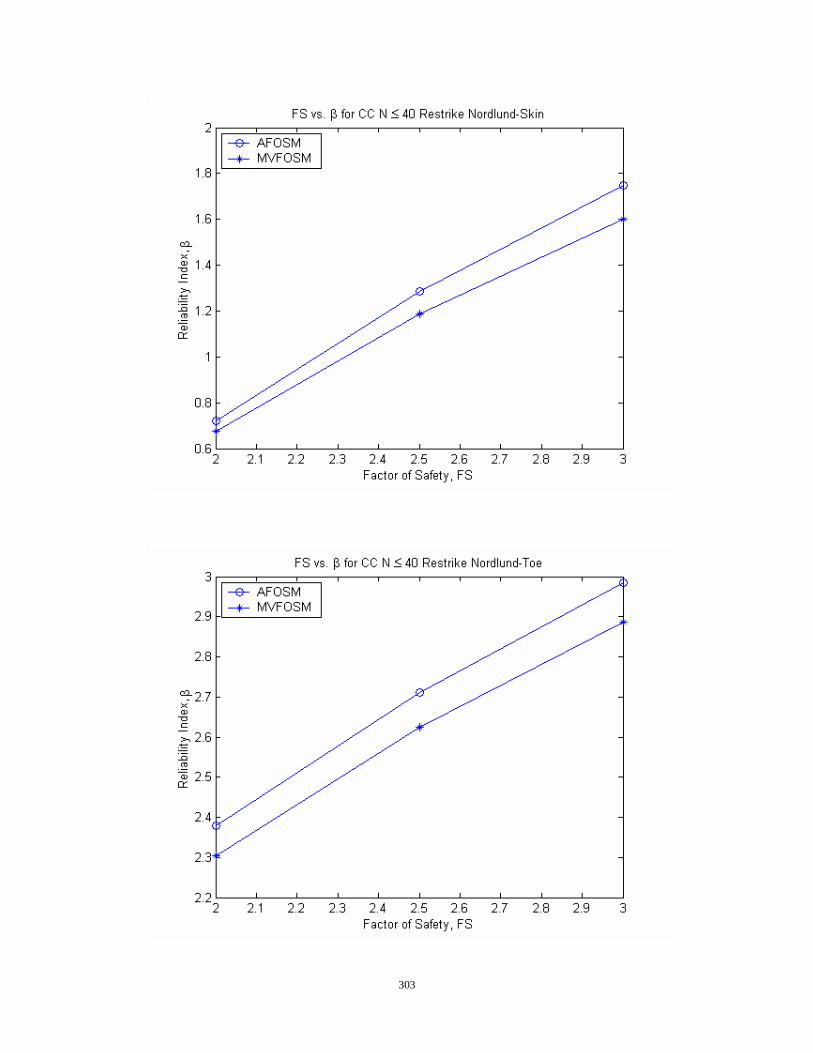
303
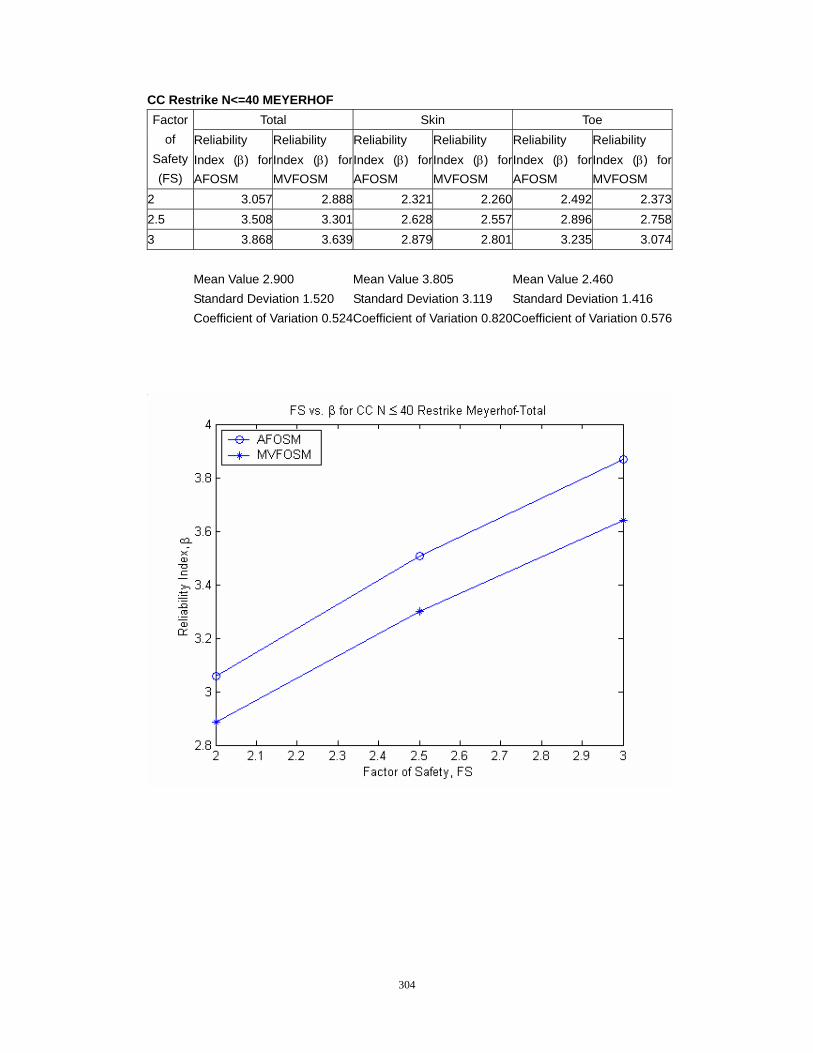
304
CC Restrike N<=40 MEYERHOF Total Skin Toe Factor
of Safety (FS)
Reliability Index (β) for AFOSM
Reliability Index (β) for MVFOSM
Reliability Index (β) for AFOSM
Reliability Index (β) for MVFOSM
Reliability Index (β) for AFOSM
Reliability Index (β) for MVFOSM
2 3.057 2.888 2.321 2.260 2.492 2.3732.5 3.508 3.301 2.628 2.557 2.896 2.7583 3.868 3.639 2.879 2.801 3.235 3.074 Mean Value 2.900 Mean Value 3.805 Mean Value 2.460 Standard Deviation 1.520 Standard Deviation 3.119 Standard Deviation 1.416 Coefficient of Variation 0.524Coefficient of Variation 0.820Coefficient of Variation 0.576
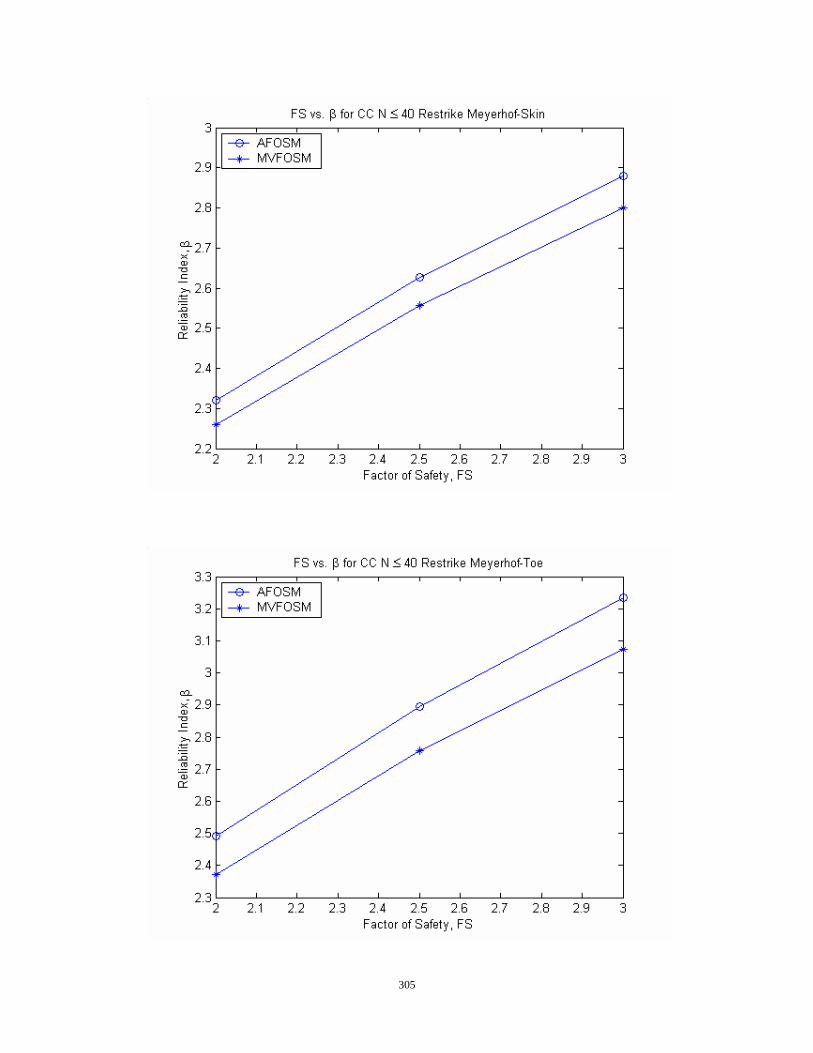
305
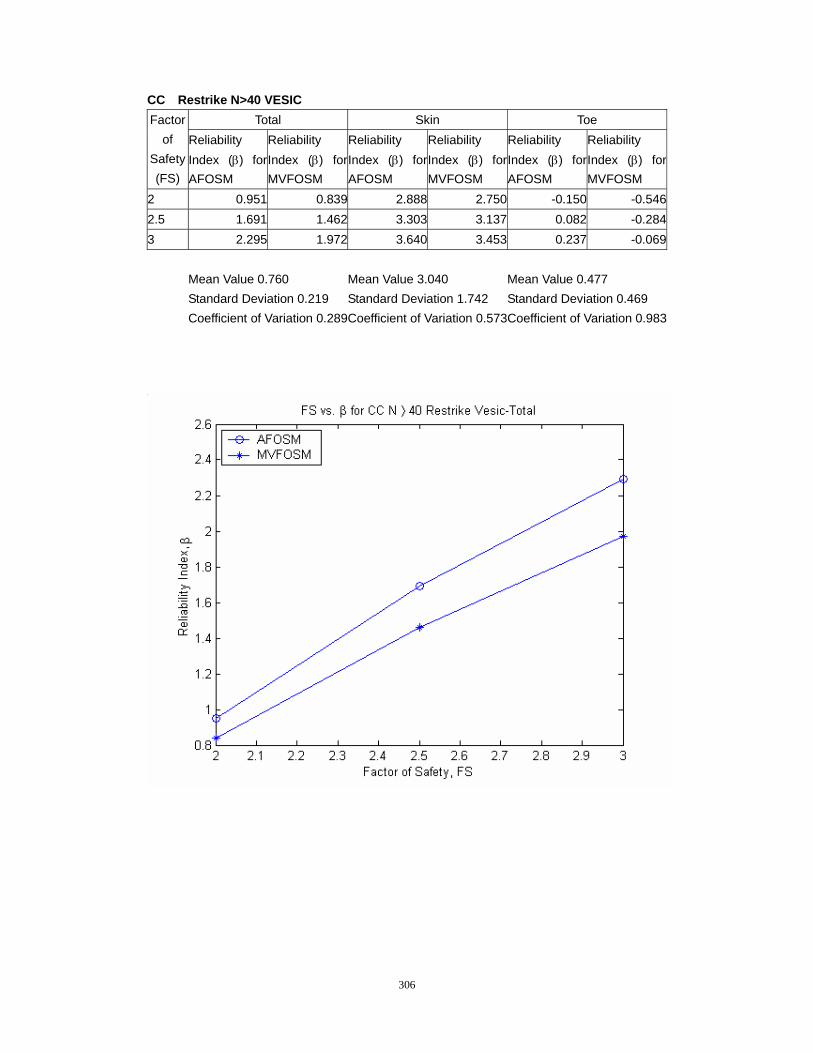
306
CC Restrike N>40 VESIC Total Skin Toe Factor
of Safety (FS)
Reliability Index (β) for AFOSM
Reliability Index (β) for MVFOSM
Reliability Index (β) for AFOSM
Reliability Index (β) for MVFOSM
Reliability Index (β) for AFOSM
Reliability Index (β) for MVFOSM
2 0.951 0.839 2.888 2.750 -0.150 -0.5462.5 1.691 1.462 3.303 3.137 0.082 -0.2843 2.295 1.972 3.640 3.453 0.237 -0.069 Mean Value 0.760 Mean Value 3.040 Mean Value 0.477 Standard Deviation 0.219 Standard Deviation 1.742 Standard Deviation 0.469 Coefficient of Variation 0.289Coefficient of Variation 0.573Coefficient of Variation 0.983
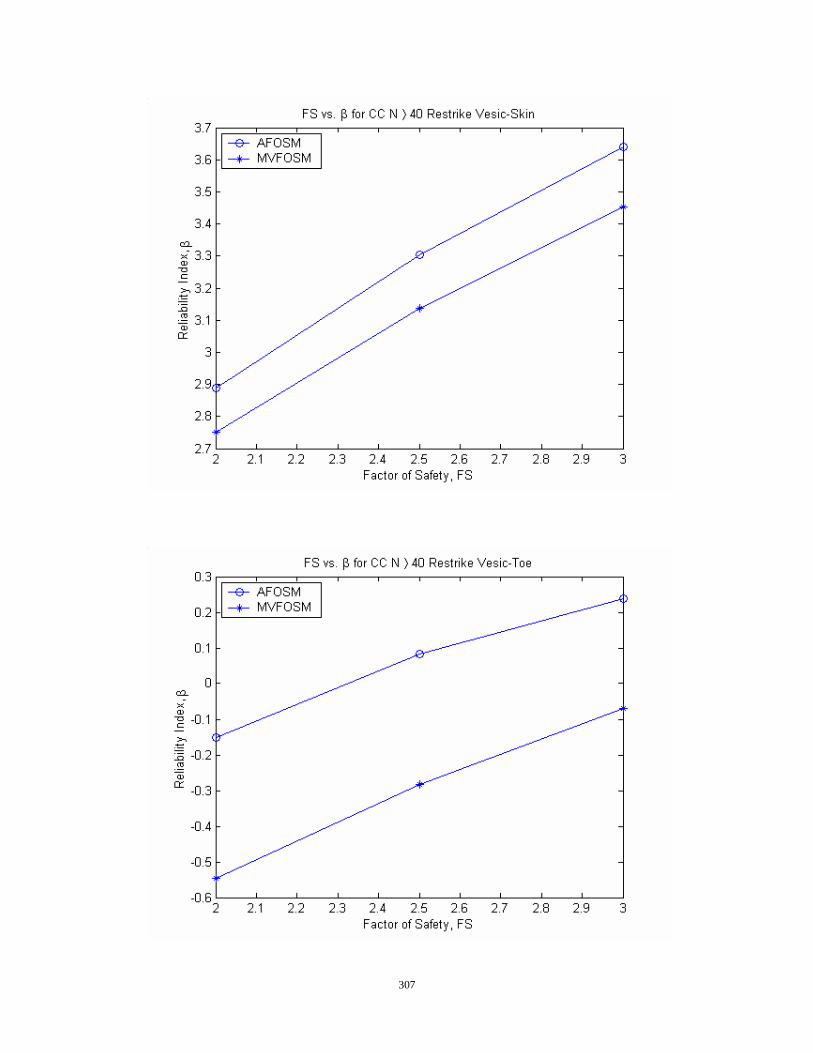
307
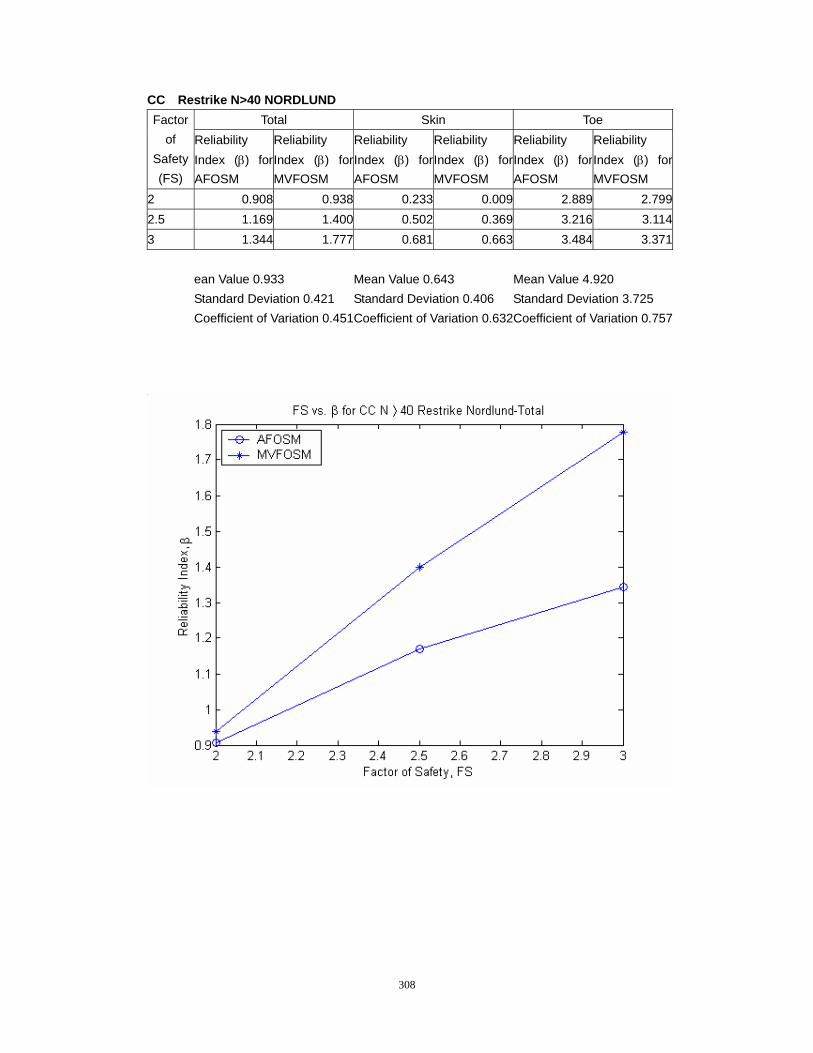
308
CC Restrike N>40 NORDLUND Total Skin Toe Factor
of Safety (FS)
Reliability Index (β) for AFOSM
Reliability Index (β) forMVFOSM
Reliability Index (β) for AFOSM
Reliability Index (β) for MVFOSM
Reliability Index (β) for AFOSM
Reliability Index (β) for MVFOSM
2 0.908 0.938 0.233 0.009 2.889 2.7992.5 1.169 1.400 0.502 0.369 3.216 3.1143 1.344 1.777 0.681 0.663 3.484 3.371 ean Value 0.933 Mean Value 0.643 Mean Value 4.920 Standard Deviation 0.421 Standard Deviation 0.406 Standard Deviation 3.725 Coefficient of Variation 0.451Coefficient of Variation 0.632Coefficient of Variation 0.757
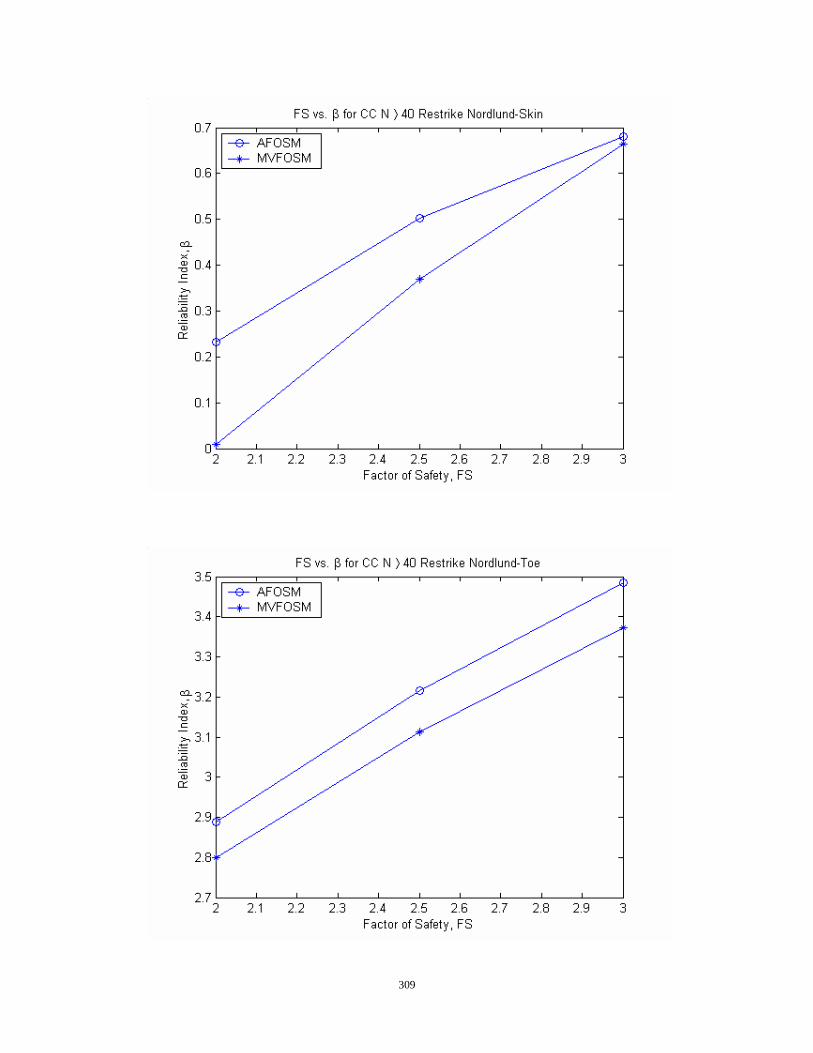
309
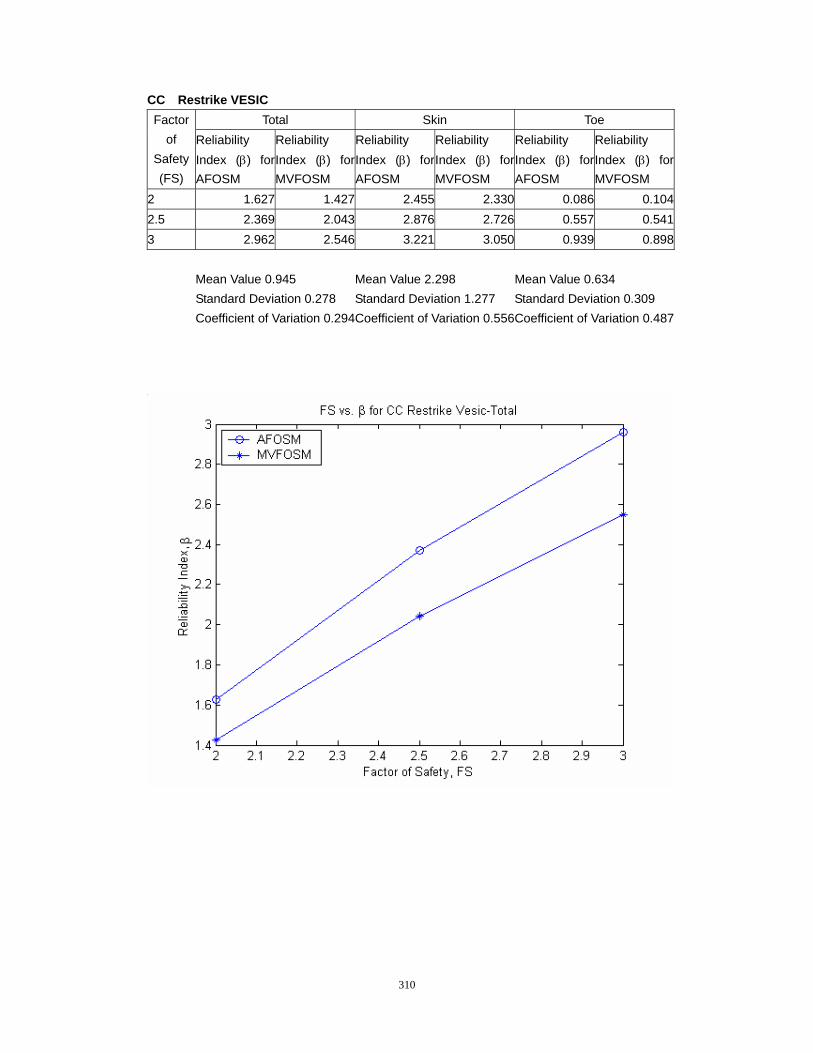
310
CC Restrike VESIC Total Skin Toe Factor
of Safety (FS)
Reliability Index (β) for AFOSM
Reliability Index (β) for MVFOSM
Reliability Index (β) for AFOSM
Reliability Index (β) for MVFOSM
Reliability Index (β) for AFOSM
Reliability Index (β) for MVFOSM
2 1.627 1.427 2.455 2.330 0.086 0.1042.5 2.369 2.043 2.876 2.726 0.557 0.5413 2.962 2.546 3.221 3.050 0.939 0.898 Mean Value 0.945 Mean Value 2.298 Mean Value 0.634 Standard Deviation 0.278 Standard Deviation 1.277 Standard Deviation 0.309 Coefficient of Variation 0.294Coefficient of Variation 0.556Coefficient of Variation 0.487
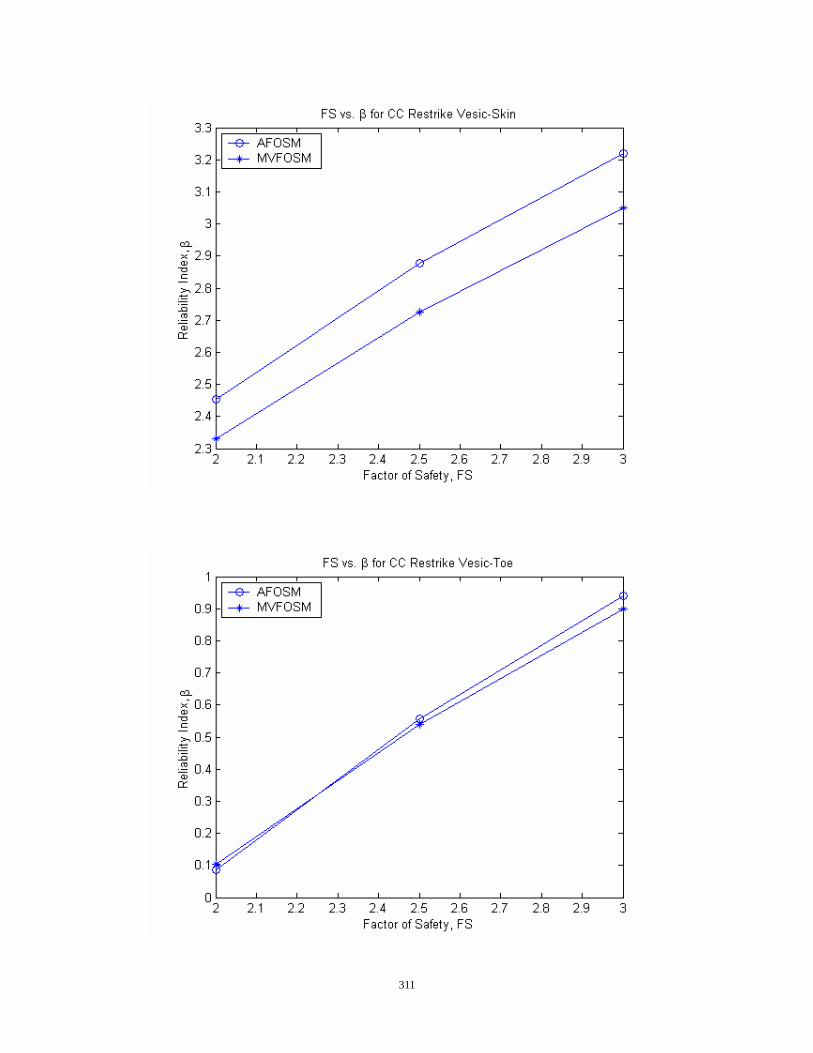
311
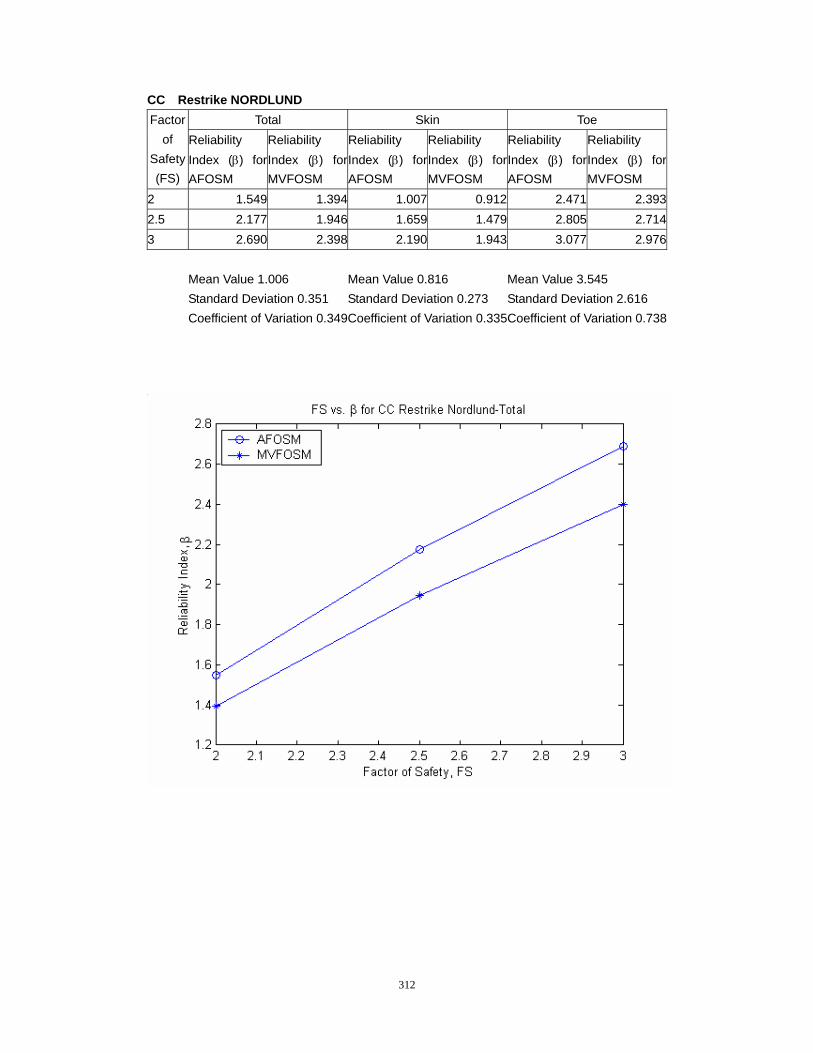
312
CC Restrike NORDLUND Total Skin Toe Factor
of Safety (FS)
Reliability Index (β) for AFOSM
Reliability Index (β) for MVFOSM
Reliability Index (β) for AFOSM
Reliability Index (β) for MVFOSM
Reliability Index (β) for AFOSM
Reliability Index (β) for MVFOSM
2 1.549 1.394 1.007 0.912 2.471 2.3932.5 2.177 1.946 1.659 1.479 2.805 2.7143 2.690 2.398 2.190 1.943 3.077 2.976 Mean Value 1.006 Mean Value 0.816 Mean Value 3.545 Standard Deviation 0.351 Standard Deviation 0.273 Standard Deviation 2.616 Coefficient of Variation 0.349Coefficient of Variation 0.335Coefficient of Variation 0.738
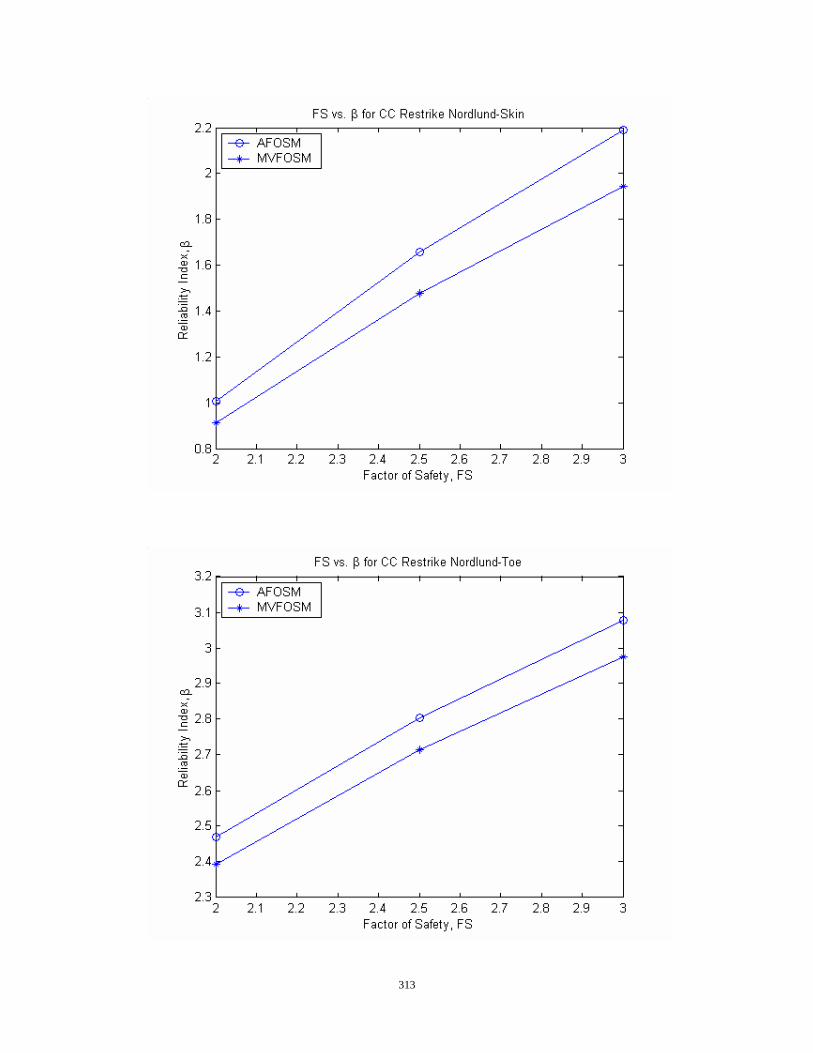
313
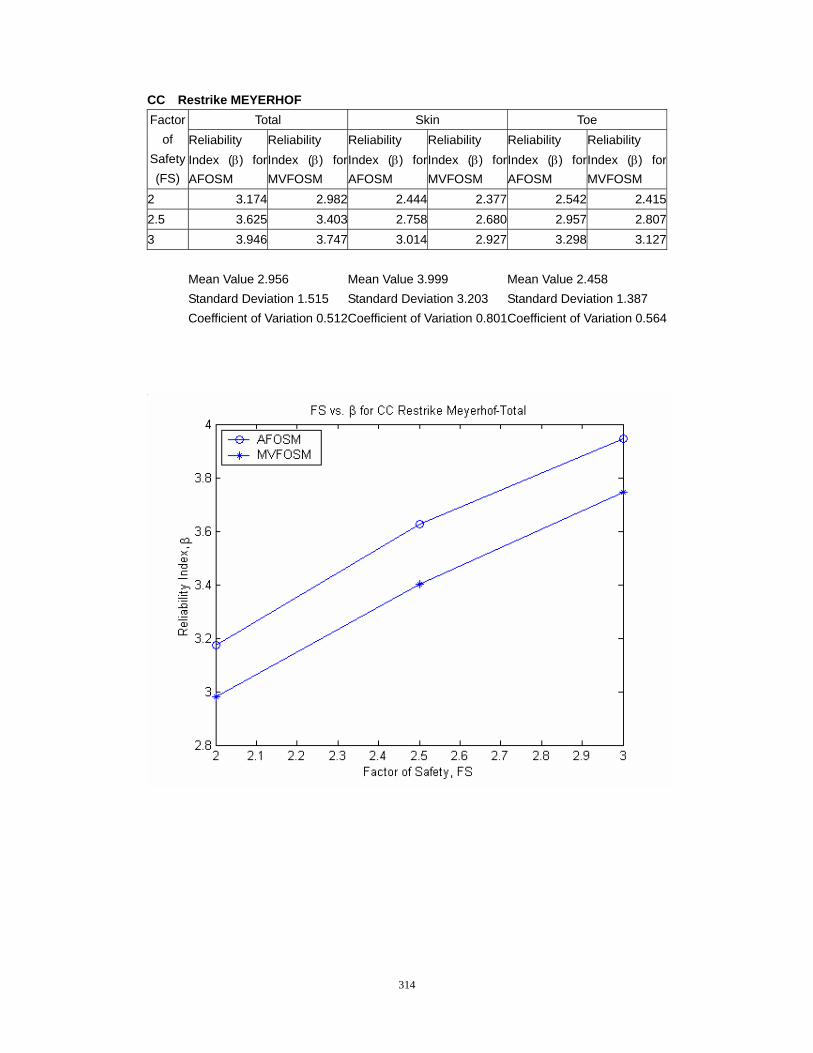
314
CC Restrike MEYERHOF Total Skin Toe Factor
of Safety (FS)
Reliability Index (β) for AFOSM
Reliability Index (β) for MVFOSM
Reliability Index (β) for AFOSM
Reliability Index (β) for MVFOSM
Reliability Index (β) for AFOSM
Reliability Index (β) for MVFOSM
2 3.174 2.982 2.444 2.377 2.542 2.4152.5 3.625 3.403 2.758 2.680 2.957 2.8073 3.946 3.747 3.014 2.927 3.298 3.127 Mean Value 2.956 Mean Value 3.999 Mean Value 2.458 Standard Deviation 1.515 Standard Deviation 3.203 Standard Deviation 1.387 Coefficient of Variation 0.512Coefficient of Variation 0.801Coefficient of Variation 0.564
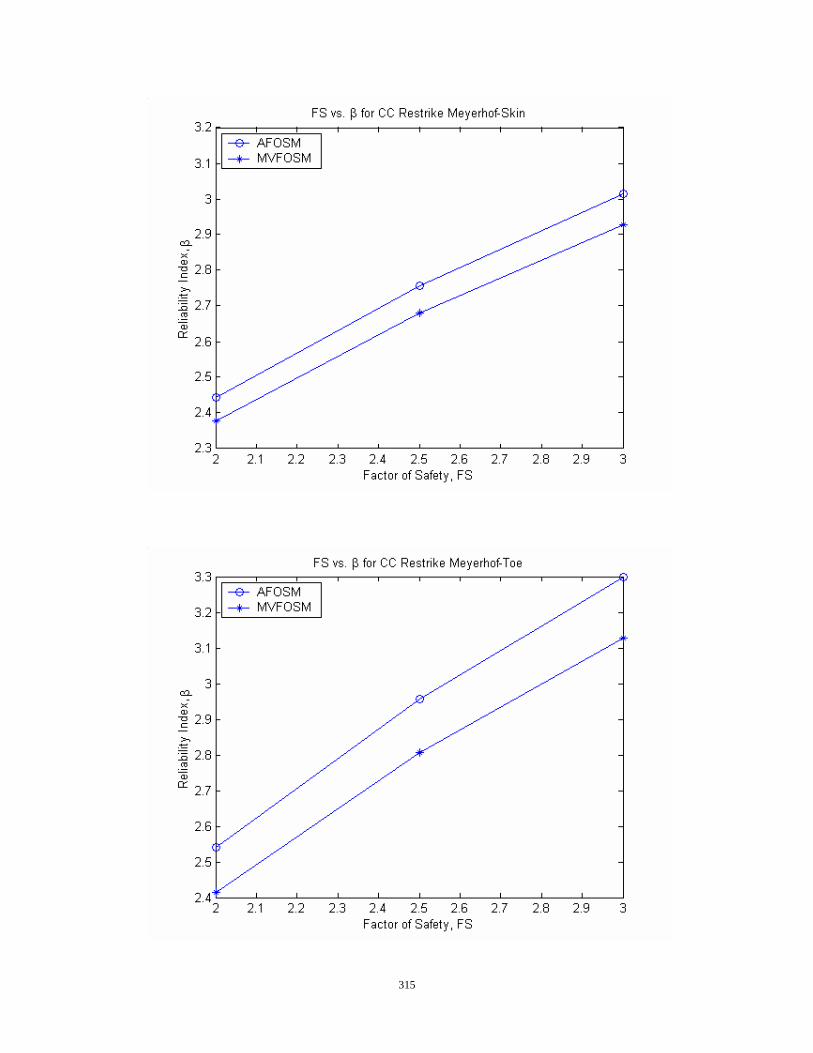
315
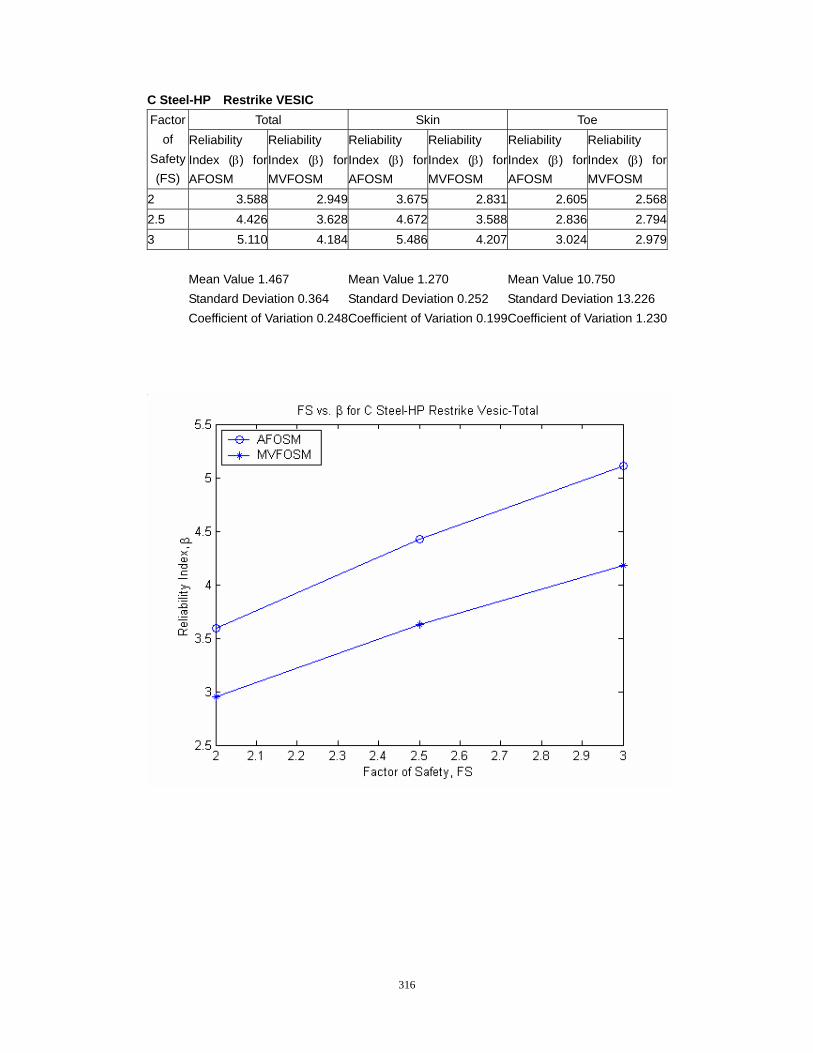
316
C Steel-HP Restrike VESIC Total Skin Toe Factor
of Safety (FS)
Reliability Index (β) forAFOSM
Reliability Index (β) for MVFOSM
Reliability Index (β) for AFOSM
Reliability Index (β) for MVFOSM
Reliability Index (β) for AFOSM
Reliability Index (β) for MVFOSM
2 3.588 2.949 3.675 2.831 2.605 2.5682.5 4.426 3.628 4.672 3.588 2.836 2.7943 5.110 4.184 5.486 4.207 3.024 2.979 Mean Value 1.467 Mean Value 1.270 Mean Value 10.750 Standard Deviation 0.364 Standard Deviation 0.252 Standard Deviation 13.226 Coefficient of Variation 0.248Coefficient of Variation 0.199Coefficient of Variation 1.230
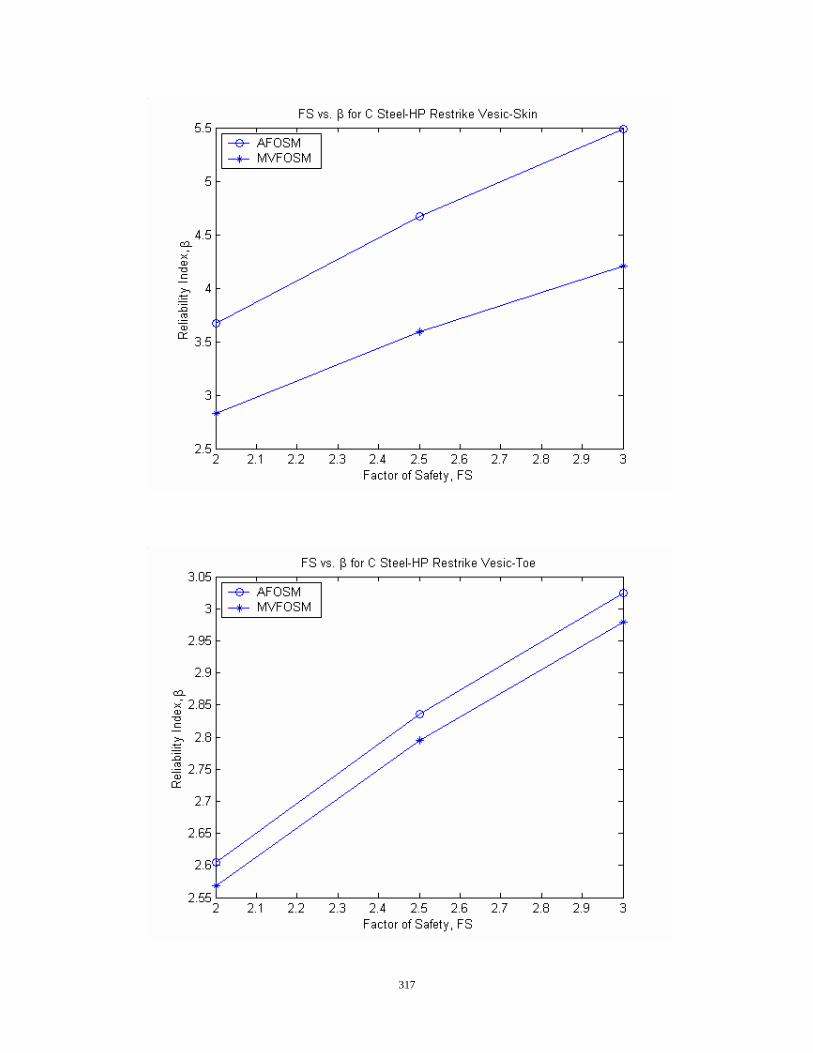
317
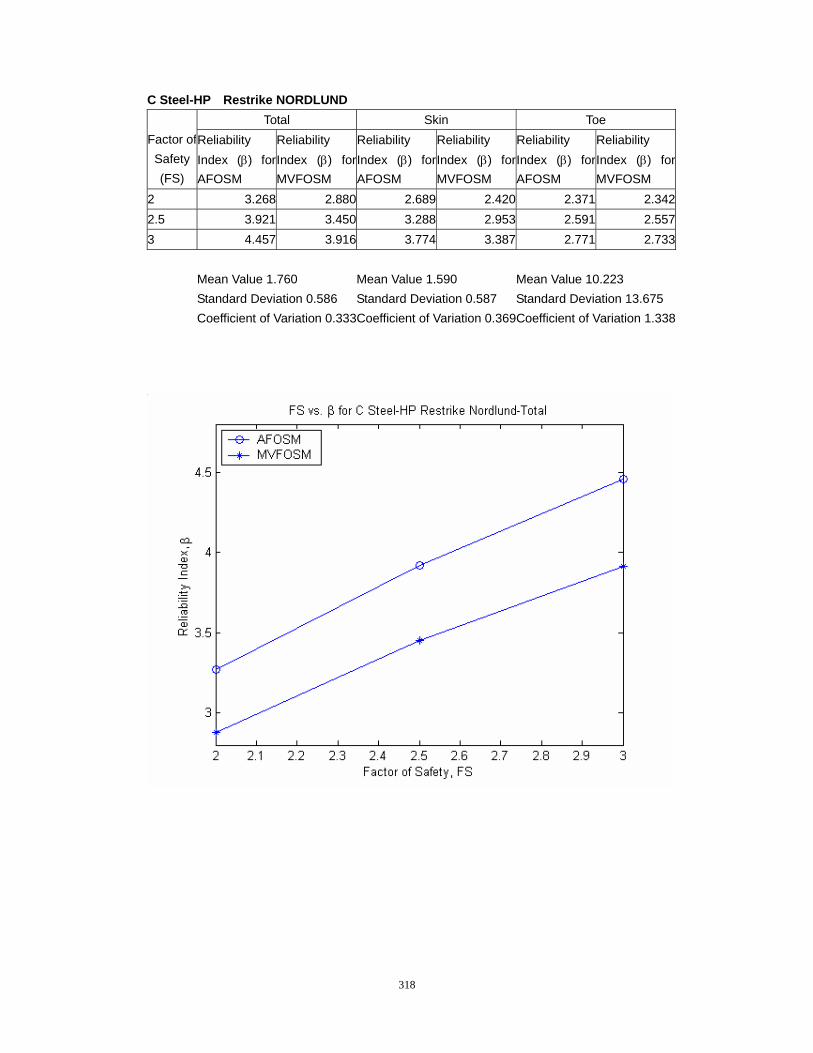
318
C Steel-HP Restrike NORDLUND Total Skin Toe
Factor of Safety (FS)
Reliability Index (β) for AFOSM
Reliability Index (β) for MVFOSM
Reliability Index (β) for AFOSM
Reliability Index (β) for MVFOSM
Reliability Index (β) for AFOSM
Reliability Index (β) for MVFOSM
2 3.268 2.880 2.689 2.420 2.371 2.3422.5 3.921 3.450 3.288 2.953 2.591 2.5573 4.457 3.916 3.774 3.387 2.771 2.733 Mean Value 1.760 Mean Value 1.590 Mean Value 10.223 Standard Deviation 0.586 Standard Deviation 0.587 Standard Deviation 13.675 Coefficient of Variation 0.333Coefficient of Variation 0.369Coefficient of Variation 1.338
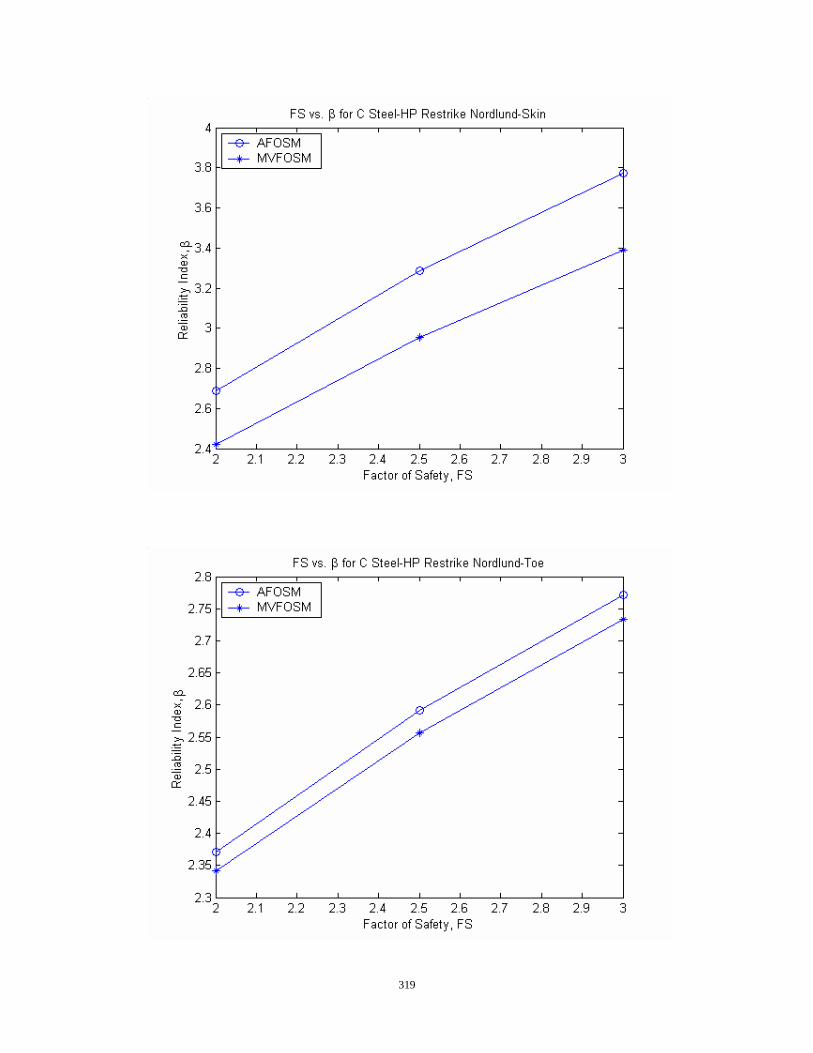
319

320
C Steel-HP Restrike MEYERHOF Total Skin Toe
Factor of Safety (FS)
Reliability Index (β) for AFOSM
Reliability Index (β) for MVFOSM
Reliability Index (β) for AFOSM
Reliability Index (β) for MVFOSM
Reliability Index (β) for AFOSM
Reliability Index (β) for MVFOSM
2 2.071 1.880 1.781 1.611 2.528 2.4932.5 2.654 2.401 2.384 2.146 2.754 2.7163 3.131 2.827 2.878 2.584 2.940 2.898 Mean Value 1.293 Mean Value 1.127 Mean Value 10.587 Standard Deviation 0.492 Standard Deviation 0.412 Standard Deviation 13.382 Coefficient of Variation 0.380Coefficient of Variation 0.366Coefficient of Variation 1.264
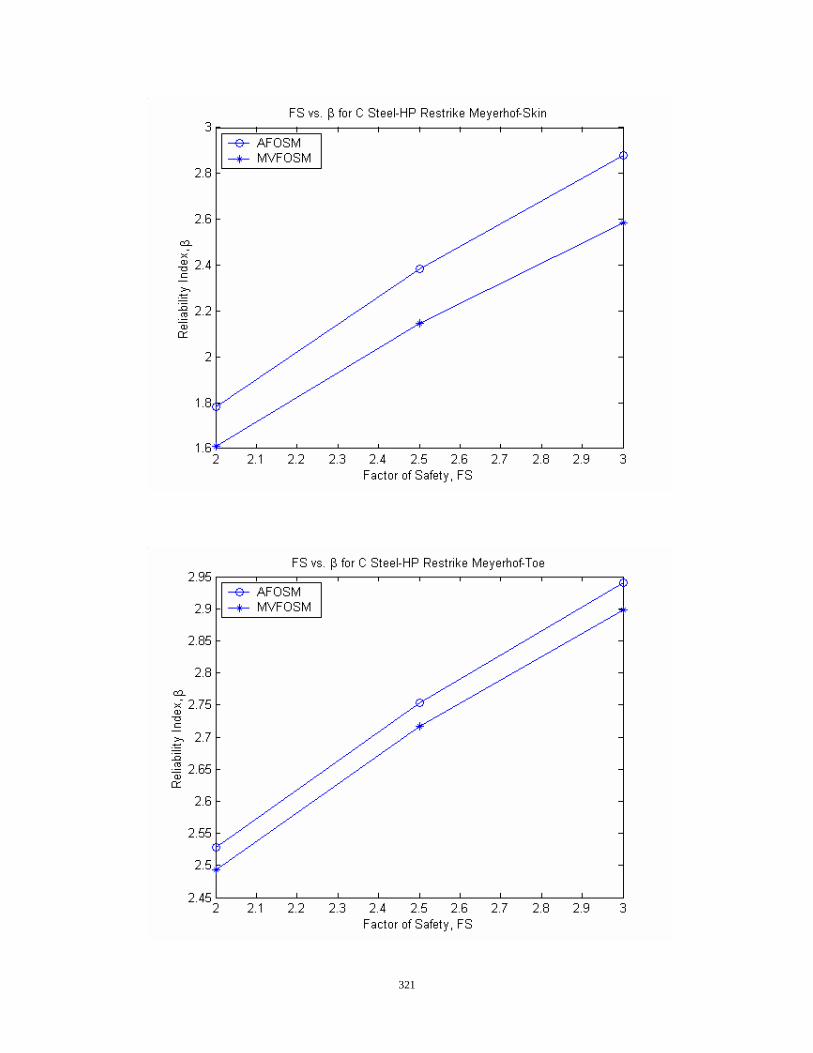
321
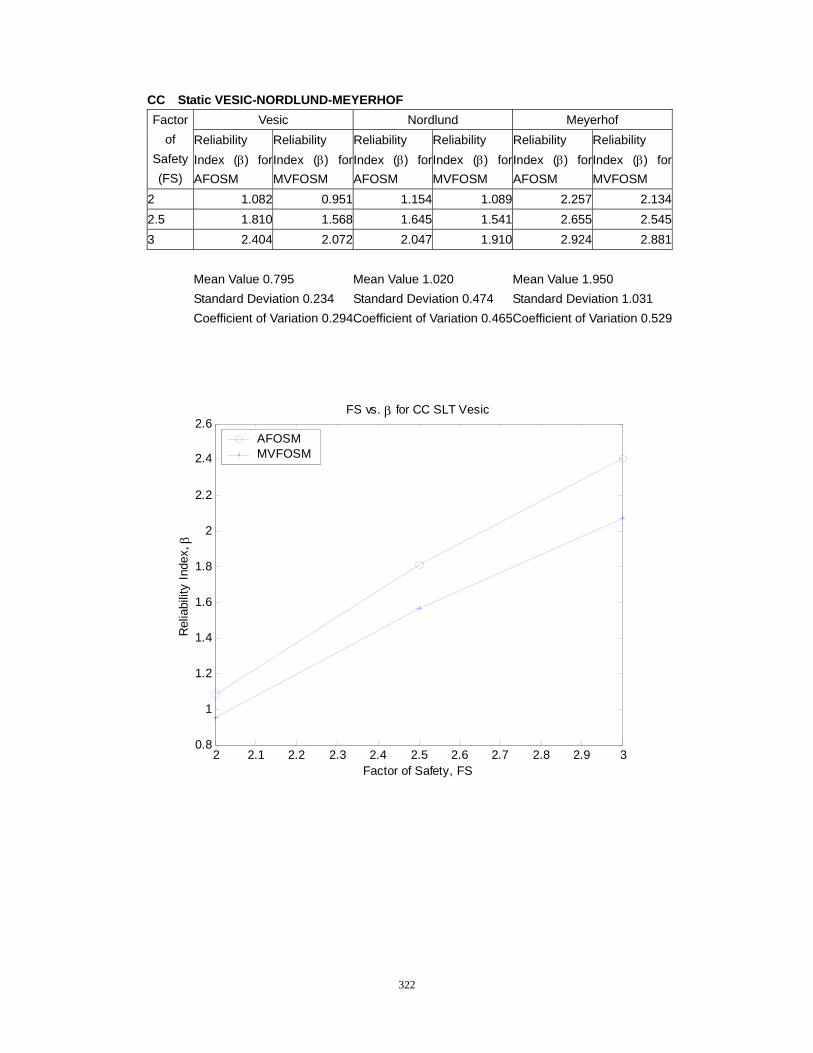
322
CC Static VESIC-NORDLUND-MEYERHOF Vesic Nordlund Meyerhof Factor
of Safety (FS)
Reliability Index (β) for AFOSM
Reliability Index (β) for MVFOSM
Reliability Index (β) for AFOSM
Reliability Index (β) for MVFOSM
Reliability Index (β) for AFOSM
Reliability Index (β) for MVFOSM
2 1.082 0.951 1.154 1.089 2.257 2.1342.5 1.810 1.568 1.645 1.541 2.655 2.5453 2.404 2.072 2.047 1.910 2.924 2.881 Mean Value 0.795 Mean Value 1.020 Mean Value 1.950 Standard Deviation 0.234 Standard Deviation 0.474 Standard Deviation 1.031 Coefficient of Variation 0.294Coefficient of Variation 0.465Coefficient of Variation 0.529
2 2.1 2.2 2.3 2.4 2.5 2.6 2.7 2.8 2.9 30.8
1
1.2
1.4
1.6
1.8
2
2.2
2.4
2.6
Factor of Safety, FS
Rel
iabi
lity
Inde
x, β
FS vs. β for CC SLT Vesic
AFOSMMVFOSM
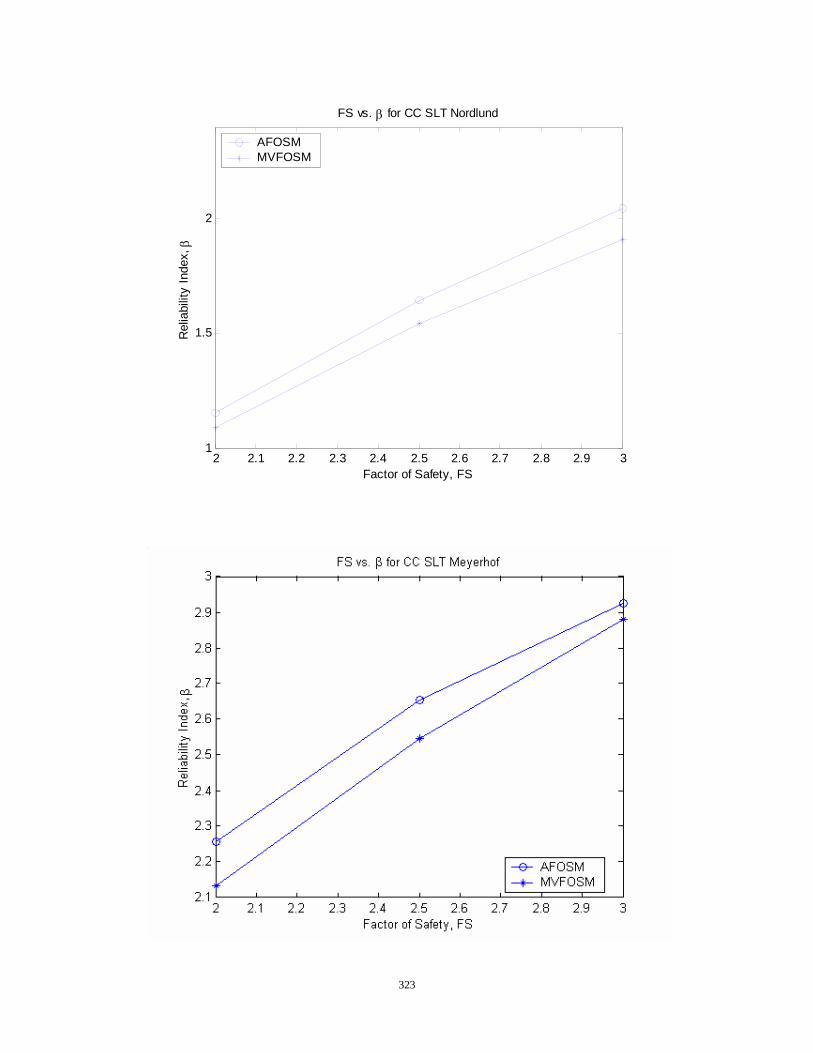
323
2 2.1 2.2 2.3 2.4 2.5 2.6 2.7 2.8 2.9 31
1.5
2
Factor of Safety, FS
Rel
iabi
lity
Inde
x, β
FS vs. β for CC SLT Nordlund
AFOSMMVFOSM
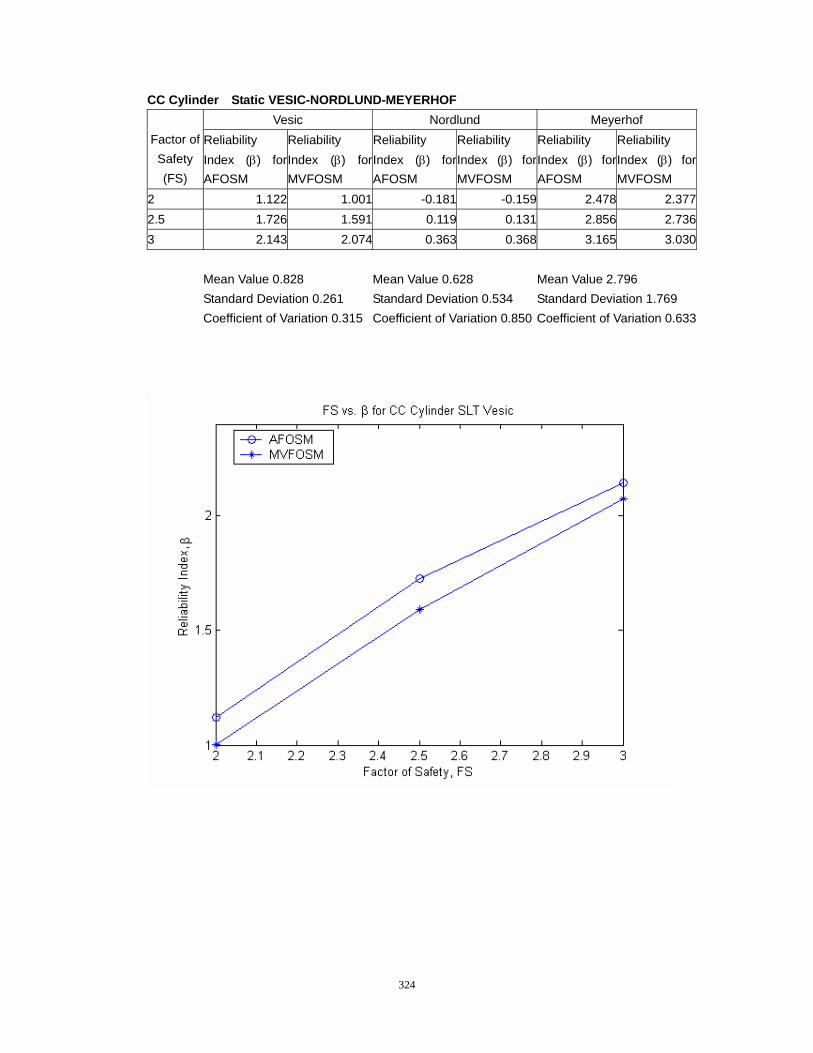
324
CC Cylinder Static VESIC-NORDLUND-MEYERHOF Vesic Nordlund Meyerhof
Factor of Safety (FS)
Reliability Index (β) for AFOSM
Reliability Index (β) for MVFOSM
Reliability Index (β) forAFOSM
Reliability Index (β) for MVFOSM
Reliability Index (β) for AFOSM
Reliability Index (β) for MVFOSM
2 1.122 1.001 -0.181 -0.159 2.478 2.3772.5 1.726 1.591 0.119 0.131 2.856 2.7363 2.143 2.074 0.363 0.368 3.165 3.030 Mean Value 0.828 Mean Value 0.628 Mean Value 2.796 Standard Deviation 0.261 Standard Deviation 0.534 Standard Deviation 1.769 Coefficient of Variation 0.315 Coefficient of Variation 0.850 Coefficient of Variation 0.633
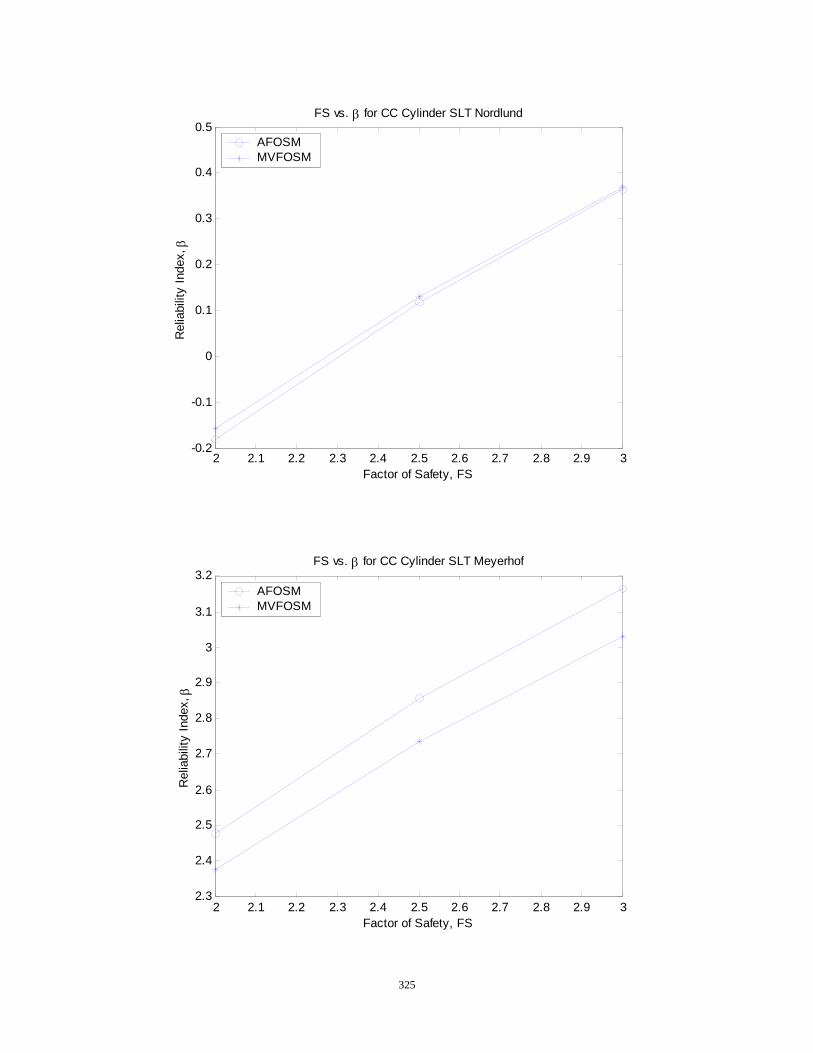
325
2 2.1 2.2 2.3 2.4 2.5 2.6 2.7 2.8 2.9 32.3
2.4
2.5
2.6
2.7
2.8
2.9
3
3.1
3.2
Factor of Safety, FS
Rel
iabi
lity
Inde
x, β
FS vs. β for CC Cylinder SLT Meyerhof
AFOSMMVFOSM
2 2.1 2.2 2.3 2.4 2.5 2.6 2.7 2.8 2.9 3-0.2
-0.1
0
0.1
0.2
0.3
0.4
0.5
Factor of Safety, FS
Rel
iabi
lity
Inde
x, β
FS vs. β for CC Cylinder SLT Nordlund
AFOSMMVFOSM
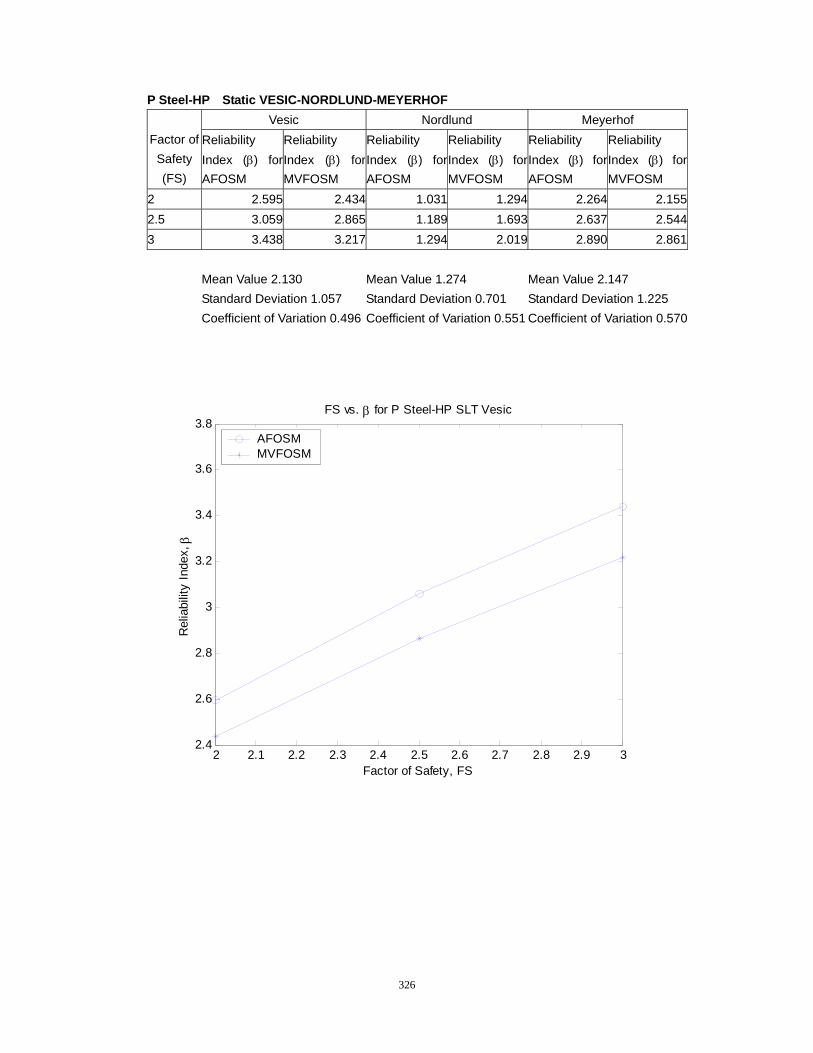
326
P Steel-HP Static VESIC-NORDLUND-MEYERHOF Vesic Nordlund Meyerhof
Factor of Safety (FS)
Reliability Index (β) for AFOSM
Reliability Index (β) for MVFOSM
Reliability Index (β) for AFOSM
Reliability Index (β) for MVFOSM
Reliability Index (β) for AFOSM
Reliability Index (β) for MVFOSM
2 2.595 2.434 1.031 1.294 2.264 2.1552.5 3.059 2.865 1.189 1.693 2.637 2.5443 3.438 3.217 1.294 2.019 2.890 2.861 Mean Value 2.130 Mean Value 1.274 Mean Value 2.147 Standard Deviation 1.057 Standard Deviation 0.701 Standard Deviation 1.225 Coefficient of Variation 0.496 Coefficient of Variation 0.551 Coefficient of Variation 0.570
2 2.1 2.2 2.3 2.4 2.5 2.6 2.7 2.8 2.9 32.4
2.6
2.8
3
3.2
3.4
3.6
3.8
Factor of Safety, FS
Rel
iabi
lity
Inde
x, β
FS vs. β for P Steel-HP SLT Vesic
AFOSMMVFOSM
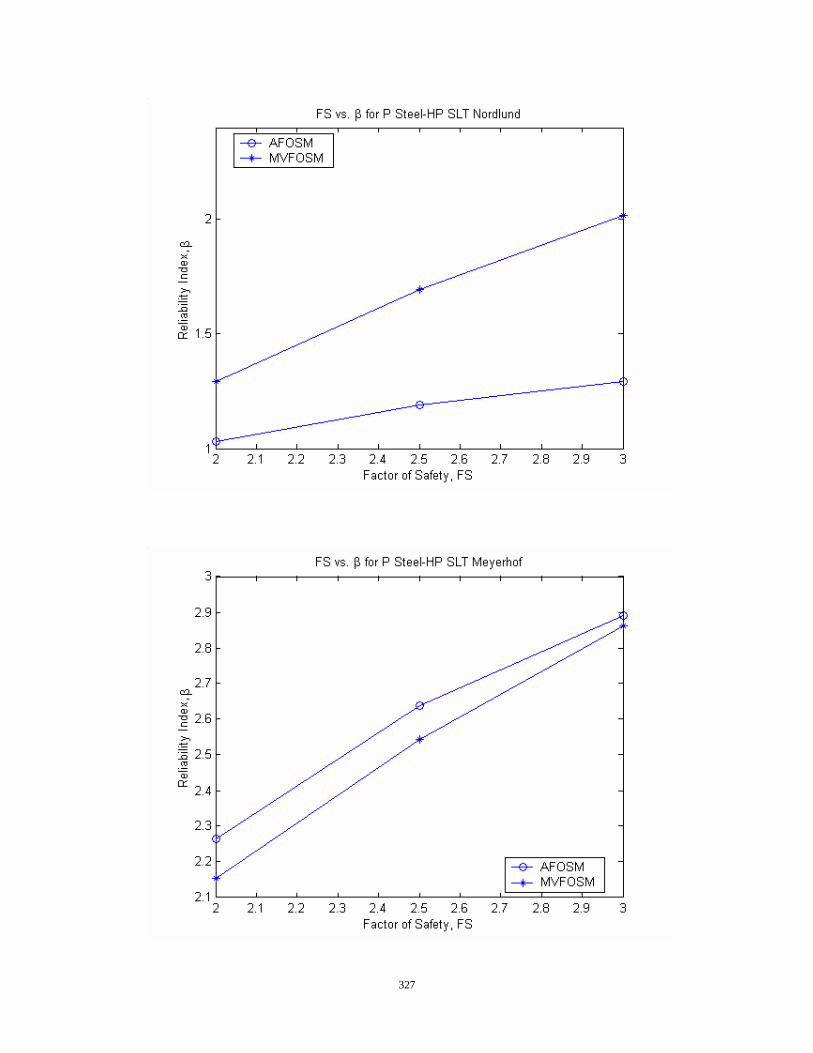
327

328
CCcylinder PDA VESIC Total Skin Toe
Factor of Safety (FS)
Reliability Index (β) for AFOSM
Reliability Index (β) for MVFOSM
Reliability Index (β) for AFOSM
Reliability Index (β) for MVFOSM
Reliability Index (β) for AFOSM
Reliability Index (β) for MVFOSM
2 -0.322 -0.240 7.832 5.127 -3.037 -2.1222.5 0.745 0.558 8.733 6.080 -2.097 -1.6313 1.510 1.210 9.333 6.858 -1.422 -1.229 Mean Value 0.513 Mean Value 1.804 Mean Value 0.223 Standard Deviation 0.090 Standard Deviation 0.149 Standard Deviation 0.092 Coefficient of Variation 0.175 Coefficient of Variation 0.082Coefficient of Variation 0.414
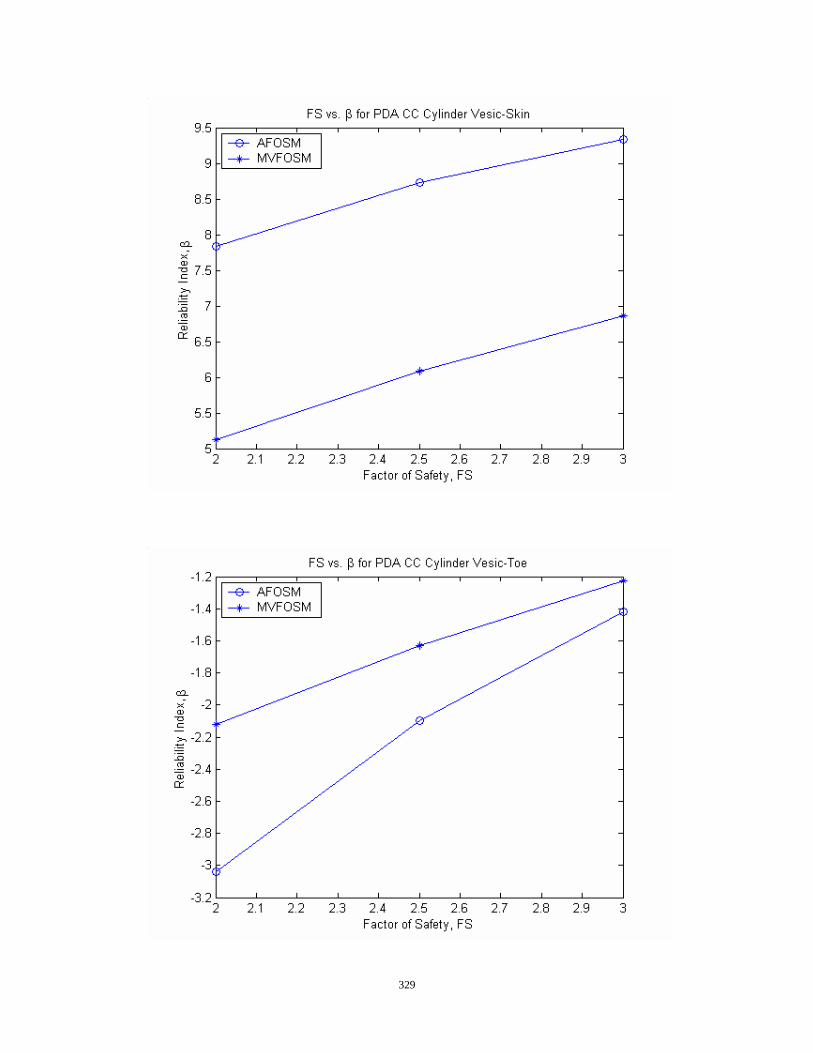
329
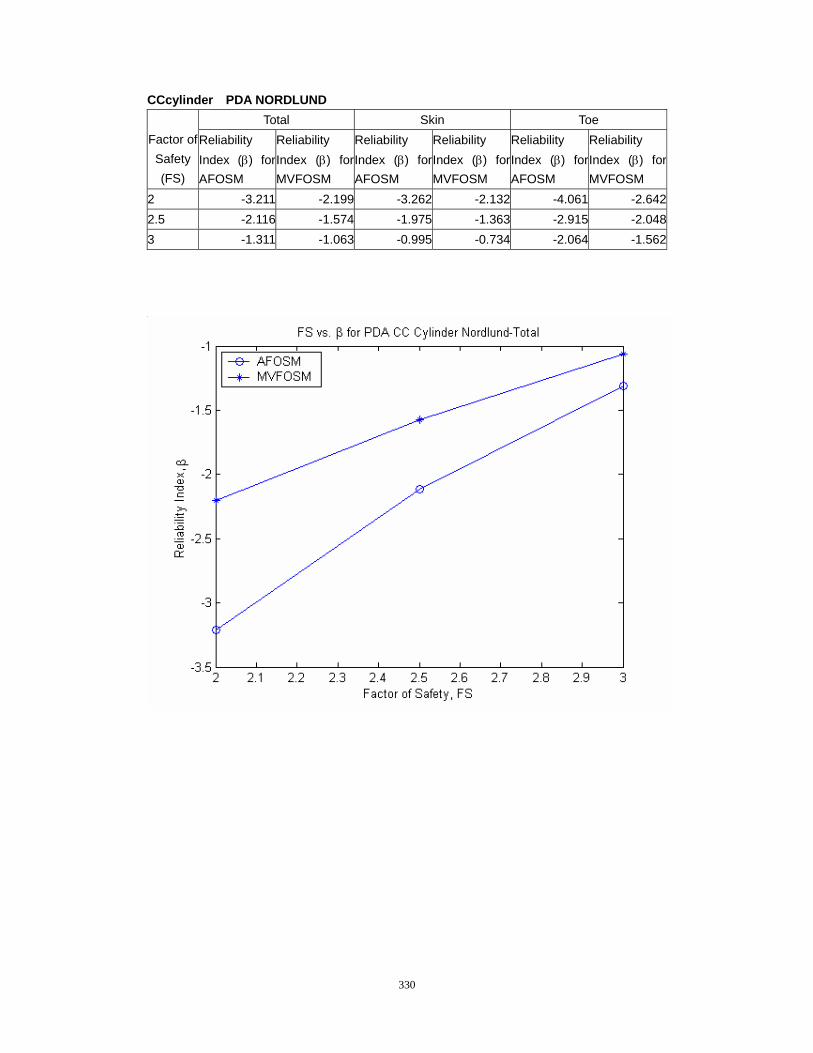
330
CCcylinder PDA NORDLUND Total Skin Toe
Factor of Safety (FS)
Reliability Index (β) for AFOSM
Reliability Index (β) for MVFOSM
Reliability Index (β) for AFOSM
Reliability Index (β) for MVFOSM
Reliability Index (β) for AFOSM
Reliability Index (β) for MVFOSM
2 -3.211 -2.199 -3.262 -2.132 -4.061 -2.6422.5 -2.116 -1.574 -1.975 -1.363 -2.915 -2.0483 -1.311 -1.063 -0.995 -0.734 -2.064 -1.562
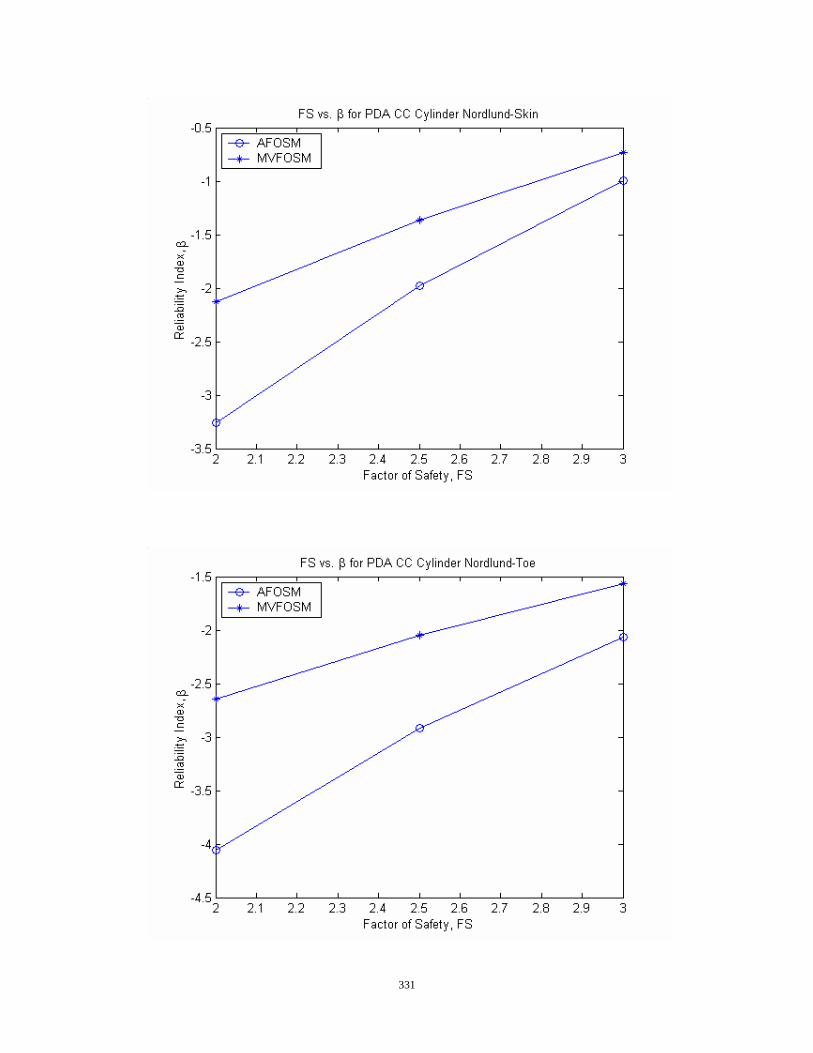
331
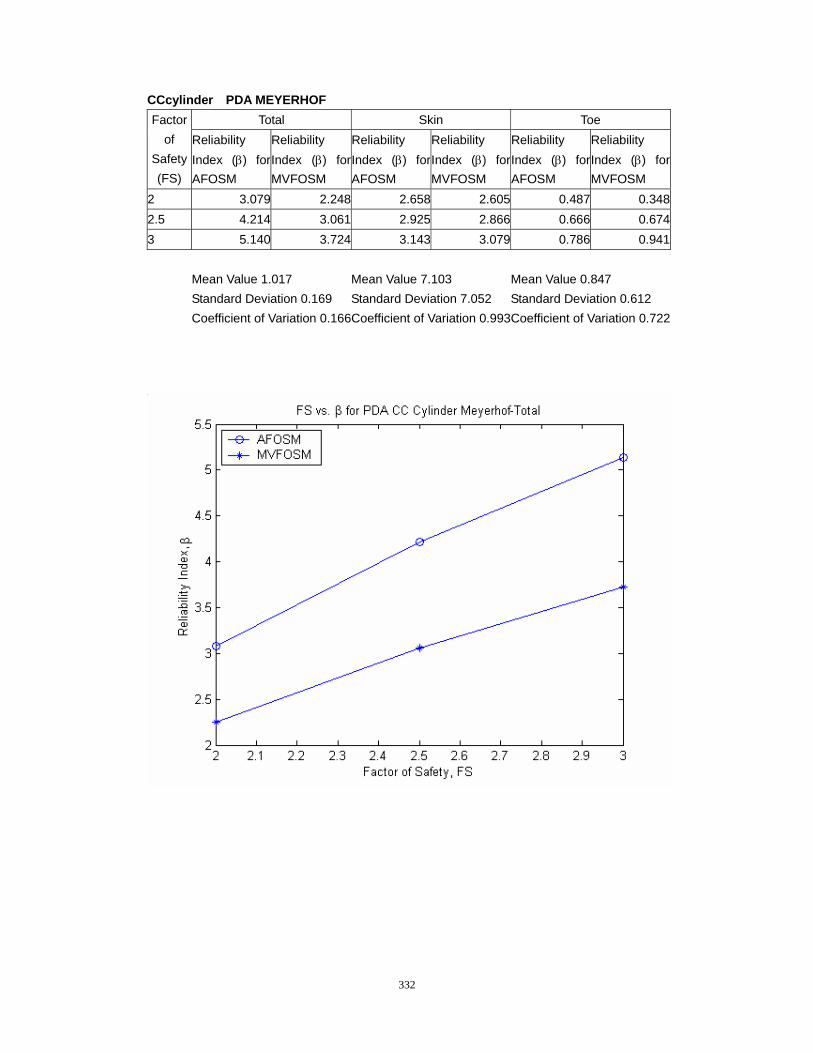
332
CCcylinder PDA MEYERHOF Total Skin Toe Factor
of Safety (FS)
Reliability Index (β) for AFOSM
Reliability Index (β) for MVFOSM
Reliability Index (β) for AFOSM
Reliability Index (β) for MVFOSM
Reliability Index (β) for AFOSM
Reliability Index (β) for MVFOSM
2 3.079 2.248 2.658 2.605 0.487 0.3482.5 4.214 3.061 2.925 2.866 0.666 0.6743 5.140 3.724 3.143 3.079 0.786 0.941 Mean Value 1.017 Mean Value 7.103 Mean Value 0.847 Standard Deviation 0.169 Standard Deviation 7.052 Standard Deviation 0.612 Coefficient of Variation 0.166Coefficient of Variation 0.993Coefficient of Variation 0.722
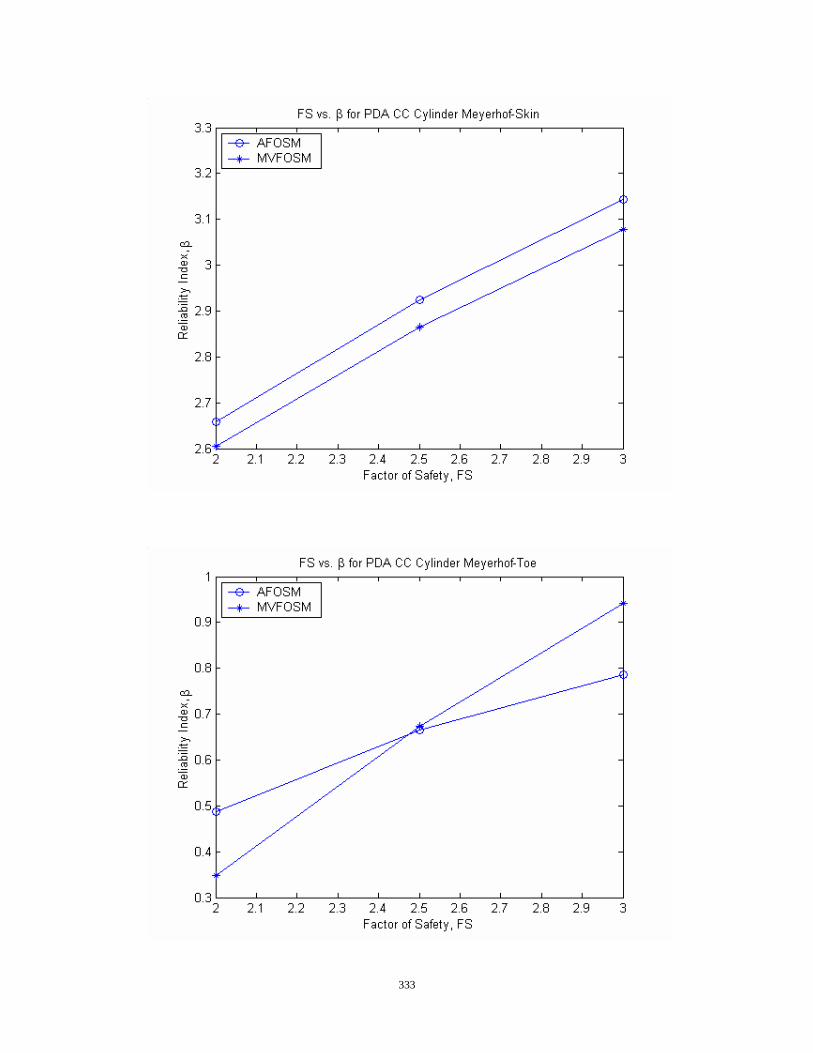
333


![Recent Results from STAR - Physicslisa/CramerSymposium/talks/Dunlop.pdfnation provided in [66] defines the pion mean free path length, λ f, as: λ f = 1 ρ f σ = V f Nσ, (4) where](https://img.pdfslide.net/doc/110x75/5fe75ced0018fb674b445d1e/recent-results-from-star-physics-lisacramersymposiumtalksdunloppdf-nation.jpg)