Embed Size (px)
Citation preview

American Institute of Aeronautics and Astronautics
1
Load Asymmetry Observed During Orion Main Parachute Inflation
Aaron L Morris1 Barrios Technology ESCG, Houston, TX, 77598
Thomas Taylor2, Leah Olson3 Jacobs Technology ESCG, Houston, TX, 77598
The Crew Exploration Vehicle Parachute Assembly System (CPAS) has flight tested the first two generations of the Orion parachute program. Three of the second generation tests instrumented the dispersion bridles of the Main parachute with a Tension Measuring System. The goal of this load measurement was to better understand load asymmetry during the inflation process of a cluster of Main parachutes. The CPAS Main parachutes exhibit inflations that are much less symmetric than current parachute literature and design guides would indicate. This paper will examine loads data gathered on three cluster tests, quantify the degree of asymmetry observed, and contrast the results with published design guides. Additionally, the measured loads data will be correlated with videos of the parachute inflation to make inferences about the shape of the parachute and the relative load asymmetry. The goal of this inquiry and test program is to open a dialogue regarding asymmetrical parachute inflation load factors.
Nomenclature c = line convergence factor CEV = Crew Exploration Vehicle CPAS = Crew Exploration Vehicle Parachute Assembly System DF = Design Factor e = abrasion loss factor ESCG = Engineering and Science Contract Group Gen = Generation k = fatigue degradation factor m = dynamic load factor NASA = National Aeronautics and Space Administration o = degradation factor for environmental conditions such as oil, sunlight, water, vacuum PDR = Preliminary Design Review s = unsymmetrical suspension-line load distribution factor SF = Safety Factor t = temperature degradation factor u = joint loss efficiency factor
1 CPAS Analysis IPT Chair, Aerothermal and Flight Mechanics, 455 E. Medical Center Blvd., Webster, TX, AIAA Senior Member. 2CPAS Instrumentation Engineer, Jacobs Test Engineering, 455 E. Medical Center Blvd., Webster, TX, non-Member. 3CPAS Analysis Engineer, Jacobs Test Engineering, 455 E. Medical Center Blvd., Webster, TX, non-Member.
https://ntrs.nasa.gov/search.jsp?R=20110011588 2018-05-15T18:25:00+00:00Z
American Institute of Aeronautics and Astronautics
2
Table 1: Design factor equation description of inputs.
Input Factor Description DF Design Factor SF Safety Factor m Dynamic Load Factor c Line Convergence Factor s Asymmetrical Suspension-Line
Load Distribution Factor u Joint Loss Efficiency Factor e Abrasion Loss Factor k Fatigue Factor o Environmental Conditions Factor
(oil, sunlight, water, vacuum) t Temperature Degradation Factor a Aging Factor
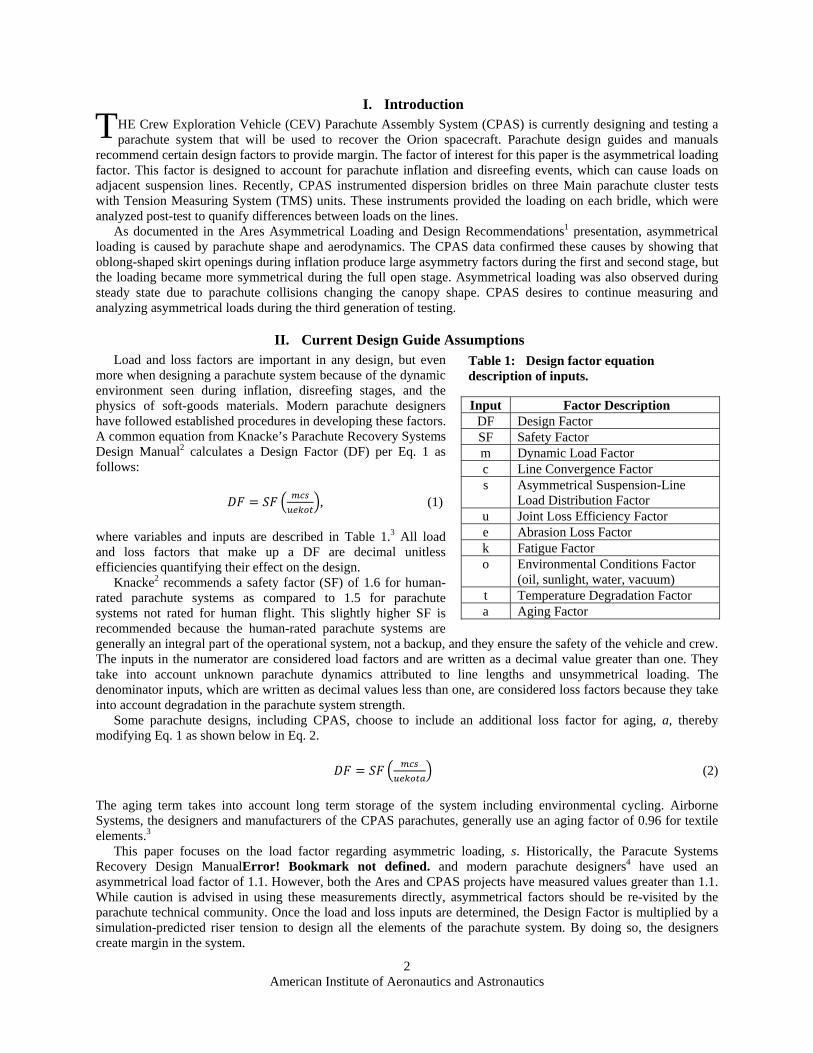
I. Introduction HE Crew Exploration Vehicle (CEV) Parachute Assembly System (CPAS) is currently designing and testing a parachute system that will be used to recover the Orion spacecraft. Parachute design guides and manuals
recommend certain design factors to provide margin. The factor of interest for this paper is the asymmetrical loading factor. This factor is designed to account for parachute inflation and disreefing events, which can cause loads on adjacent suspension lines. Recently, CPAS instrumented dispersion bridles on three Main parachute cluster tests with Tension Measuring System (TMS) units. These instruments provided the loading on each bridle, which were analyzed post-test to quanify differences between loads on the lines.
As documented in the Ares Asymmetrical Loading and Design Recommendations1 presentation, asymmetrical loading is caused by parachute shape and aerodynamics. The CPAS data confirmed these causes by showing that oblong-shaped skirt openings during inflation produce large asymmetry factors during the first and second stage, but the loading became more symmetrical during the full open stage. Asymmetrical loading was also observed during steady state due to parachute collisions changing the canopy shape. CPAS desires to continue measuring and analyzing asymmetrical loads during the third generation of testing.
II. Current Design Guide Assumptions Load and loss factors are important in any design, but even
more when designing a parachute system because of the dynamic environment seen during inflation, disreefing stages, and the physics of soft-goods materials. Modern parachute designers have followed established procedures in developing these factors. A common equation from Knacke’s Parachute Recovery Systems Design Manual2 calculates a Design Factor (DF) per Eq. 1 as follows:
, (1)
where variables and inputs are described in Table 1.3 All load and loss factors that make up a DF are decimal unitless efficiencies quantifying their effect on the design.
Knacke2 recommends a safety factor (SF) of 1.6 for human-rated parachute systems as compared to 1.5 for parachute systems not rated for human flight. This slightly higher SF is recommended because the human-rated parachute systems are generally an integral part of the operational system, not a backup, and they ensure the safety of the vehicle and crew. The inputs in the numerator are considered load factors and are written as a decimal value greater than one. They take into account unknown parachute dynamics attributed to line lengths and unsymmetrical loading. The denominator inputs, which are written as decimal values less than one, are considered loss factors because they take into account degradation in the parachute system strength.
Some parachute designs, including CPAS, choose to include an additional loss factor for aging, a, thereby modifying Eq. 1 as shown below in Eq. 2.
(2)
The aging term takes into account long term storage of the system including environmental cycling. Airborne Systems, the designers and manufacturers of the CPAS parachutes, generally use an aging factor of 0.96 for textile elements.3
This paper focuses on the load factor regarding asymmetric loading, s. Historically, the Paracute Systems Recovery Design ManualError! Bookmark not defined. and modern parachute designers4 have used an asymmetrical load factor of 1.1. However, both the Ares and CPAS projects have measured values greater than 1.1. While caution is advised in using these measurements directly, asymmetrical factors should be re-visited by the parachute technical community. Once the load and loss inputs are determined, the Design Factor is multiplied by a simulation-predicted riser tension to design all the elements of the parachute system. By doing so, the designers create margin in the system.
T
American Institute of Aeronautics and Astronautics
3
a) b) Figure 3. CDT-2-3 parachute disreefing event (a) and collision (b).
Figure 2. Fly-out angles on CDT-2-1.
Figure 4. Location of TMS units on Gen II CPAS Main Parachutes.
Figure 5. TMS unit used to measured parachute loads.
Figure 1. CPAS TMS unit and dispersions bridle.
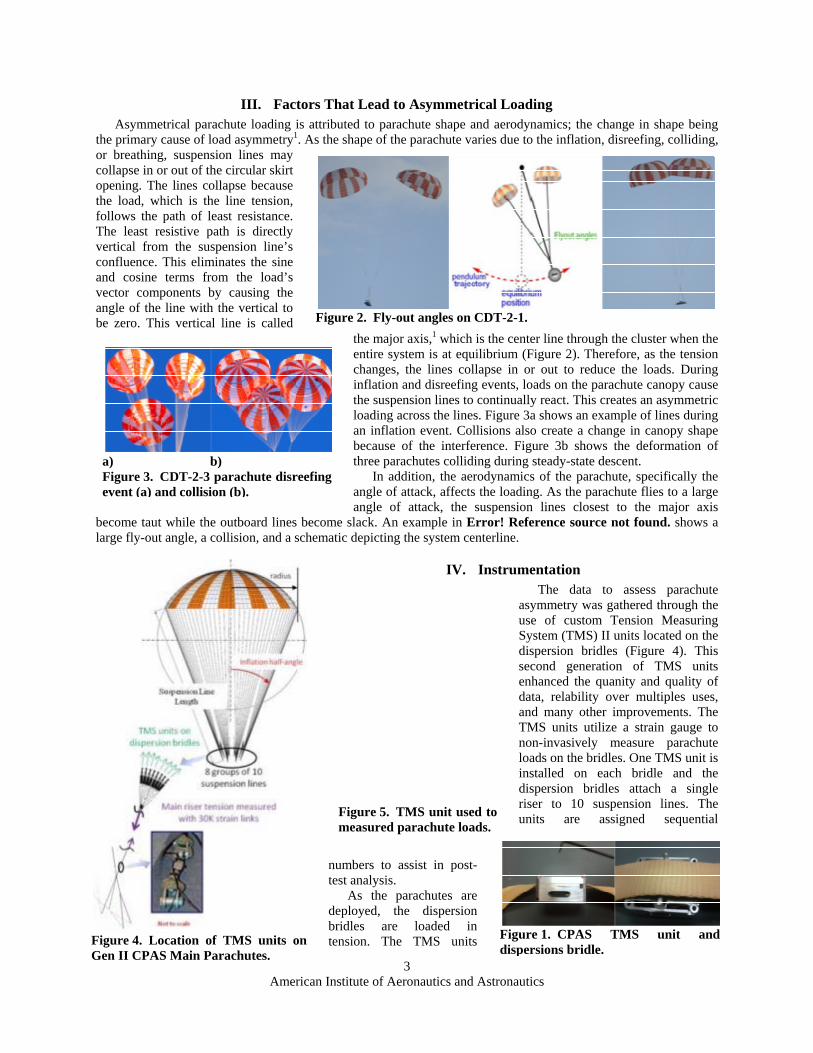
III. Factors That Lead to Asymmetrical Loading Asymmetrical parachute loading is attributed to parachute shape and aerodynamics; the change in shape being
the primary cause of load asymmetry1. As the shape of the parachute varies due to the inflation, disreefing, colliding, or breathing, suspension lines may collapse in or out of the circular skirt opening. The lines collapse because the load, which is the line tension, follows the path of least resistance. The least resistive path is directly vertical from the suspension line’s confluence. This eliminates the sine and cosine terms from the load’s vector components by causing the angle of the line with the vertical to be zero. This vertical line is called
the major axis,1 which is the center line through the cluster when the entire system is at equilibrium (Figure 2). Therefore, as the tension changes, the lines collapse in or out to reduce the loads. During inflation and disreefing events, loads on the parachute canopy cause the suspension lines to continually react. This creates an asymmetric loading across the lines. Figure 3a shows an example of lines during an inflation event. Collisions also create a change in canopy shape because of the interference. Figure 3b shows the deformation of three parachutes colliding during steady-state descent.
In addition, the aerodynamics of the parachute, specifically the angle of attack, affects the loading. As the parachute flies to a large angle of attack, the suspension lines closest to the major axis
become taut while the outboard lines become slack. An example in Error! Reference source not found. shows a large fly-out angle, a collision, and a schematic depicting the system centerline.
IV. Instrumentation The data to assess parachute
asymmetry was gathered through the use of custom Tension Measuring System (TMS) II units located on the dispersion bridles (Figure 4). This second generation of TMS units enhanced the quanity and quality of data, relability over multiples uses, and many other improvements. The TMS units utilize a strain gauge to non-invasively measure parachute loads on the bridles. One TMS unit is installed on each bridle and the dispersion bridles attach a single riser to 10 suspension lines. The units are assigned sequential
numbers to assist in post-test analysis.
As the parachutes are deployed, the dispersion bridles are loaded in tension. The TMS units
American Institute of Aeronautics and Astronautics
4
Figure 7. Total TMS unit load and strain link load for parachute A on CDT-2-1.
Figure 6. TMS voltage versus Static Link load calibration curve.
0 0.025 0.05 0.075 0.1 0.125 0.15 0.175TMS Voltage (volts)
0
2000
4000
6000
8000
Str
ai n
k L
ink
Load
(lb
s)
Strain Link Load vs. TMS Voltage
Calibration Curve (Line of Best Fit)
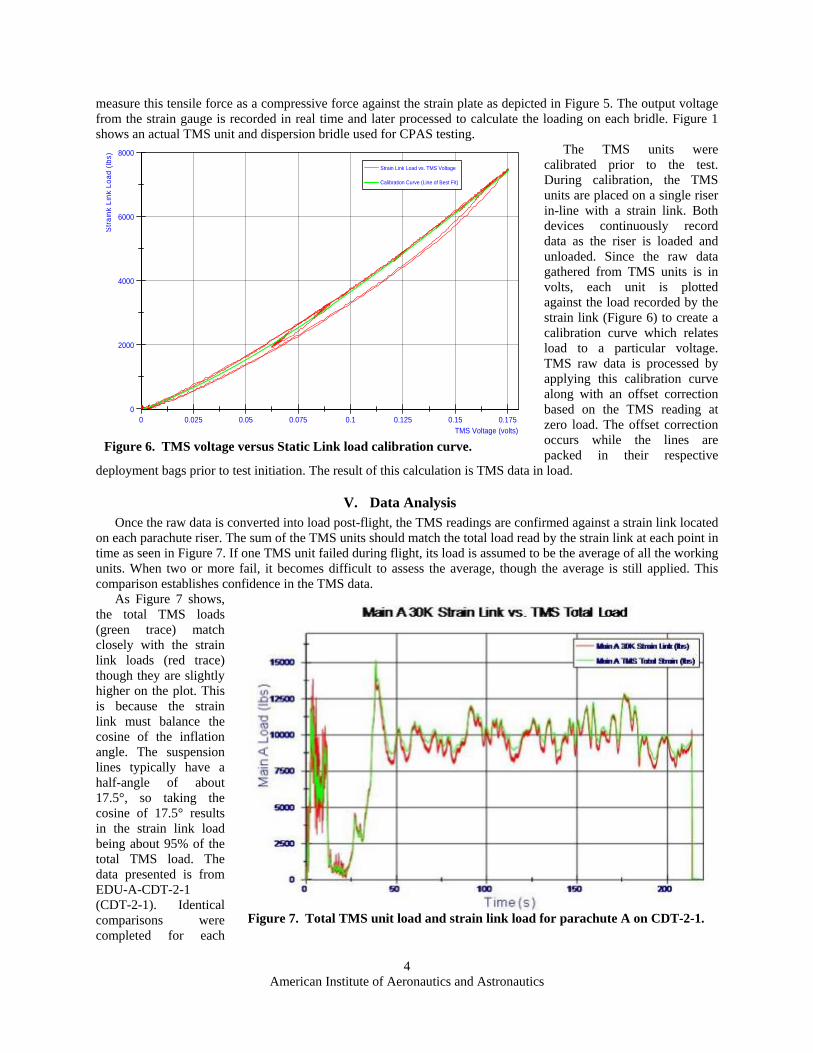
measure this tensile force as a compressive force against the strain plate as depicted in Figure 5. The output voltage from the strain gauge is recorded in real time and later processed to calculate the loading on each bridle. Figure 1 shows an actual TMS unit and dispersion bridle used for CPAS testing.
The TMS units were calibrated prior to the test. During calibration, the TMS units are placed on a single riser in-line with a strain link. Both devices continuously record data as the riser is loaded and unloaded. Since the raw data gathered from TMS units is in volts, each unit is plotted against the load recorded by the strain link (Figure 6) to create a calibration curve which relates load to a particular voltage. TMS raw data is processed by applying this calibration curve along with an offset correction based on the TMS reading at zero load. The offset correction occurs while the lines are packed in their respective
deployment bags prior to test initiation. The result of this calculation is TMS data in load.
V. Data Analysis Once the raw data is converted into load post-flight, the TMS readings are confirmed against a strain link located
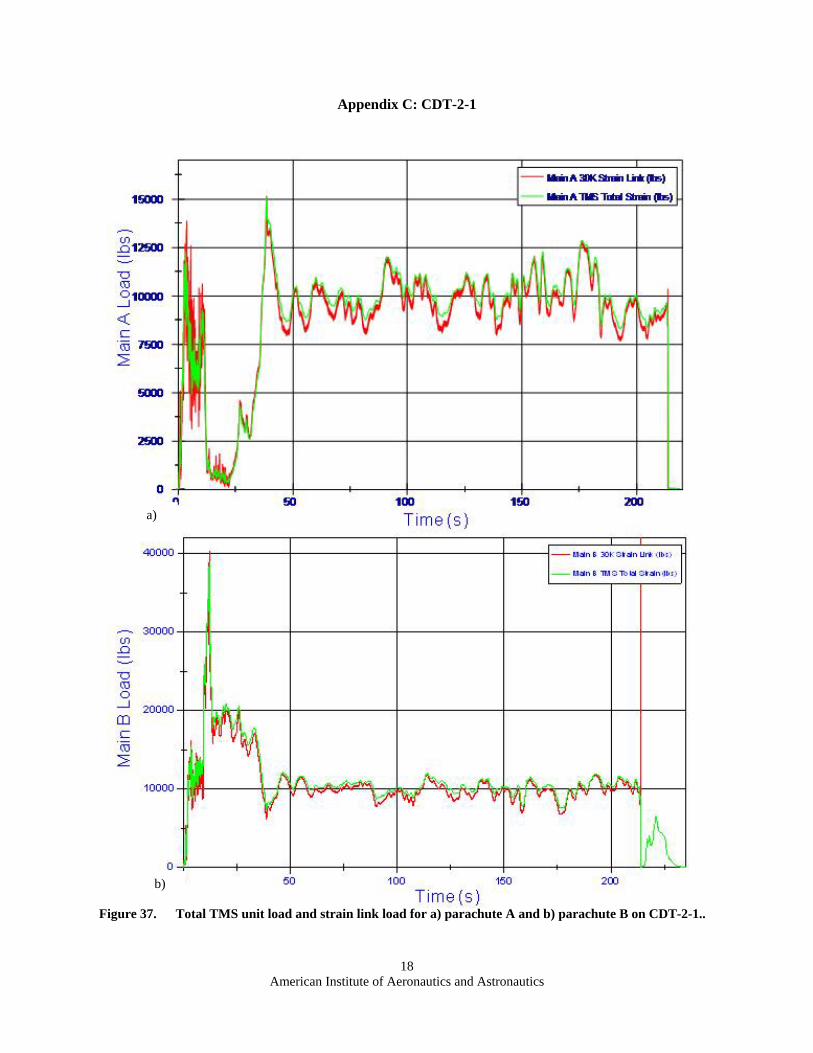
on each parachute riser. The sum of the TMS units should match the total load read by the strain link at each point in time as seen in Figure 7. If one TMS unit failed during flight, its load is assumed to be the average of all the working units. When two or more fail, it becomes difficult to assess the average, though the average is still applied. This comparison establishes confidence in the TMS data.
As Figure 7 shows, the total TMS loads (green trace) match closely with the strain link loads (red trace) though they are slightly higher on the plot. This is because the strain link must balance the cosine of the inflation angle. The suspension lines typically have a half-angle of about 17.5°, so taking the cosine of 17.5° results in the strain link load being about 95% of the total TMS load. The data presented is from EDU-A-CDT-2-1 (CDT-2-1). Identical comparisons were completed for each
American Institute of Aeronautics and Astronautics
5
Figure 8. Polar plot at peak loads of CDT-2-1 in first stage.
‐100%
‐80%
‐60%
‐40%
‐20%
0%
20%
40%
60%
80%
100%
Dispersion Bridle 1
Dispersion Bridle 2
Dispersion Bridle 3
Dispersion Bridle 4
Dispersion Bridle 5
Dispersion Bridle 6
Dispersion Bridle 7
Dispersion Bridle 8
Main A
Main B
Figure 9. CDT-2-2 polar plot at first stage peak load.
‐100%
‐80%
‐60%
‐40%
‐20%
0%
20%
40%
60%
80%
100%
Dispersion Bridle 1
Dispersion Bridle 2
Dispersion Bridle 3
Dispersion Bridle 4
Dispersion Bridle 5
Dispersion Bridle 6
Dispersion Bridle 7
Dispersion Bridle 8
Main A
Main B
Figure 10. CDT-2-2 first stage inflation.
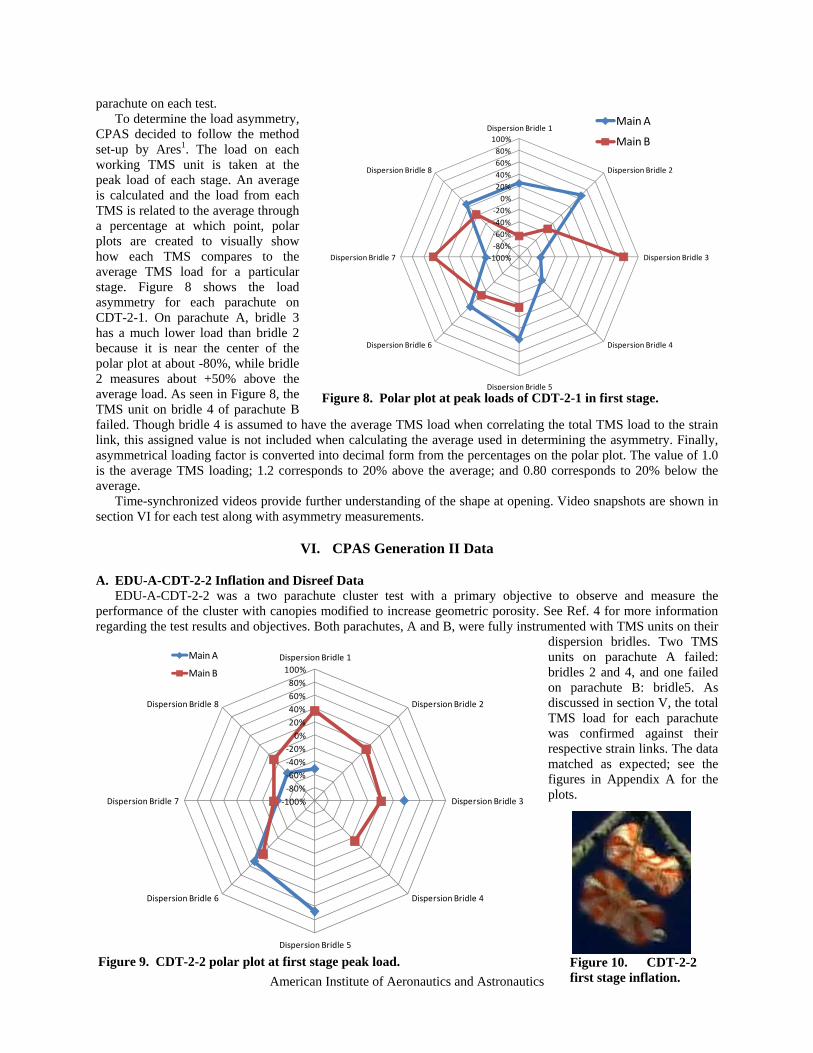
parachute on each test. To determine the load asymmetry,
CPAS decided to follow the method set-up by Ares1. The load on each working TMS unit is taken at the peak load of each stage. An average is calculated and the load from each TMS is related to the average through a percentage at which point, polar plots are created to visually show how each TMS compares to the average TMS load for a particular stage. Figure 8 shows the load asymmetry for each parachute on CDT-2-1. On parachute A, bridle 3 has a much lower load than bridle 2 because it is near the center of the polar plot at about -80%, while bridle 2 measures about +50% above the average load. As seen in Figure 8, the TMS unit on bridle 4 of parachute B failed. Though bridle 4 is assumed to have the average TMS load when correlating the total TMS load to the strain link, this assigned value is not included when calculating the average used in determining the asymmetry. Finally, asymmetrical loading factor is converted into decimal form from the percentages on the polar plot. The value of 1.0 is the average TMS loading; 1.2 corresponds to 20% above the average; and 0.80 corresponds to 20% below the average.
Time-synchronized videos provide further understanding of the shape at opening. Video snapshots are shown in section VI for each test along with asymmetry measurements.
VI. CPAS Generation II Data
A. EDU-A-CDT-2-2 Inflation and Disreef Data EDU-A-CDT-2-2 was a two parachute cluster test with a primary objective to observe and measure the
performance of the cluster with canopies modified to increase geometric porosity. See Ref. 4 for more information regarding the test results and objectives. Both parachutes, A and B, were fully instrumented with TMS units on their
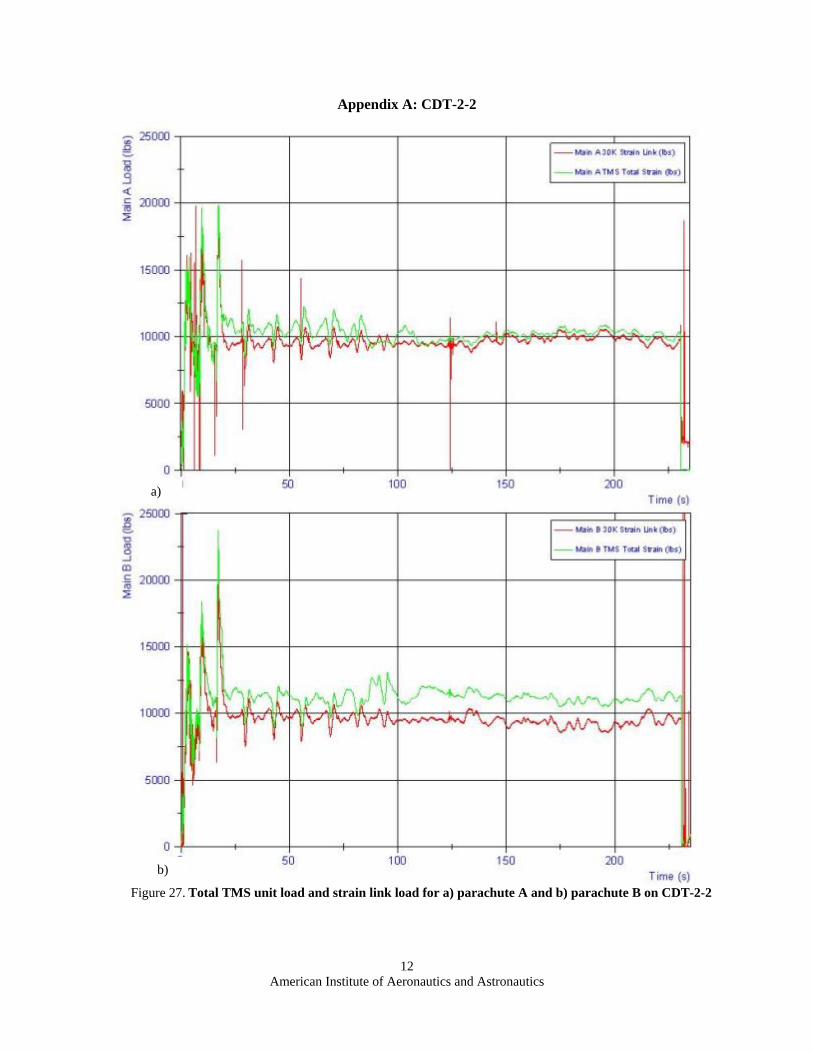
dispersion bridles. Two TMS units on parachute A failed: bridles 2 and 4, and one failed on parachute B: bridle5. As discussed in section V, the total TMS load for each parachute was confirmed against their respective strain links. The data matched as expected; see the figures in Appendix A for the plots.
American Institute of Aeronautics and Astronautics
6
Figure 11. CDT-2-2 first stage asymmetry factors at peak load.
Dispersion Bridle 1
Dispersion Bridle 2
Dispersion Bridle 3
Dispersion Bridle 4
Dispersion Bridle 5
Dispersion Bridle 6
Dispersion Bridle 7
Dispersion Bridle 8
Main A 0.49 1.36 1.67 1.31 0.57 0.59
Main B 1.37 1.10 1.01 0.86 1.13 0.63 0.89
0.40
0.60
0.80
1.00
1.20
1.40
1.60
Dispersion Asymmetry Factor
Figure 12. CDT-2-2 second stage disreef.
Figure 13. CDT-2-2 full open.
Figure 14. CDT-2-3 polar plot of asymmetrical loading during first stage.
‐100%
‐80%
‐60%
‐40%
‐20%
0%
20%
40%
60%
80%
100%
Dispersion Bridle 1
Dispersion Bridle 2
Dispersion Bridle 3
Dispersion Bridle 4
Dispersion Bridle 5
Dispersion Bridle 6
Dispersion Bridle 7
Dispersion Bridle 8
M
M
Main A
Main B
Main B
Main C
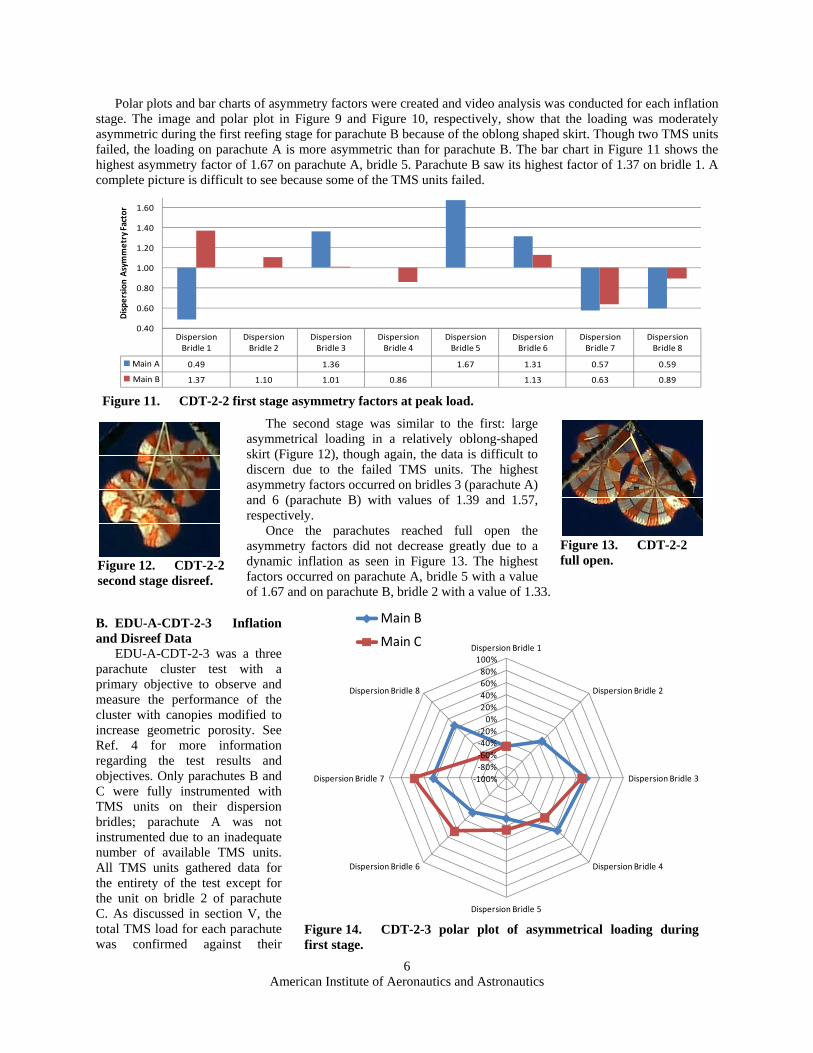
Polar plots and bar charts of asymmetry factors were created and video analysis was conducted for each inflation stage. The image and polar plot in Figure 9 and Figure 10, respectively, show that the loading was moderately asymmetric during the first reefing stage for parachute B because of the oblong shaped skirt. Though two TMS units failed, the loading on parachute A is more asymmetric than for parachute B. The bar chart in Figure 11 shows the highest asymmetry factor of 1.67 on parachute A, bridle 5. Parachute B saw its highest factor of 1.37 on bridle 1. A complete picture is difficult to see because some of the TMS units failed.
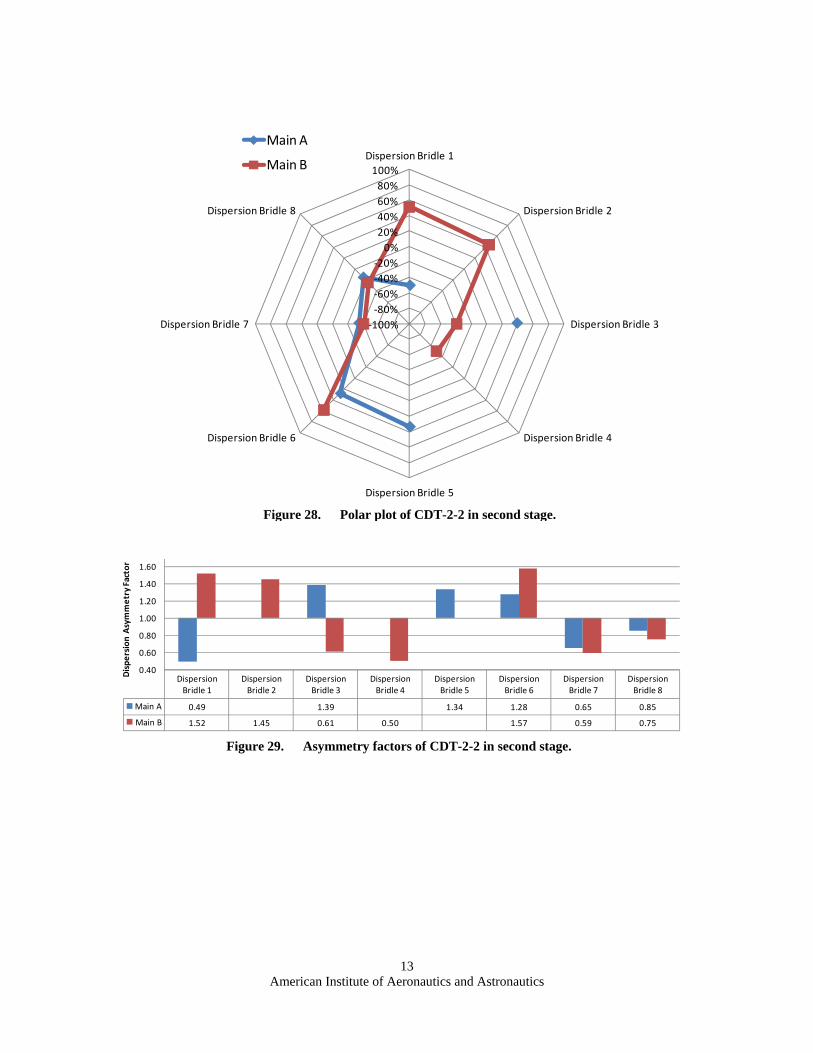
The second stage was similar to the first: large asymmetrical loading in a relatively oblong-shaped skirt (Figure 12), though again, the data is difficult to discern due to the failed TMS units. The highest asymmetry factors occurred on bridles 3 (parachute A) and 6 (parachute B) with values of 1.39 and 1.57, respectively.
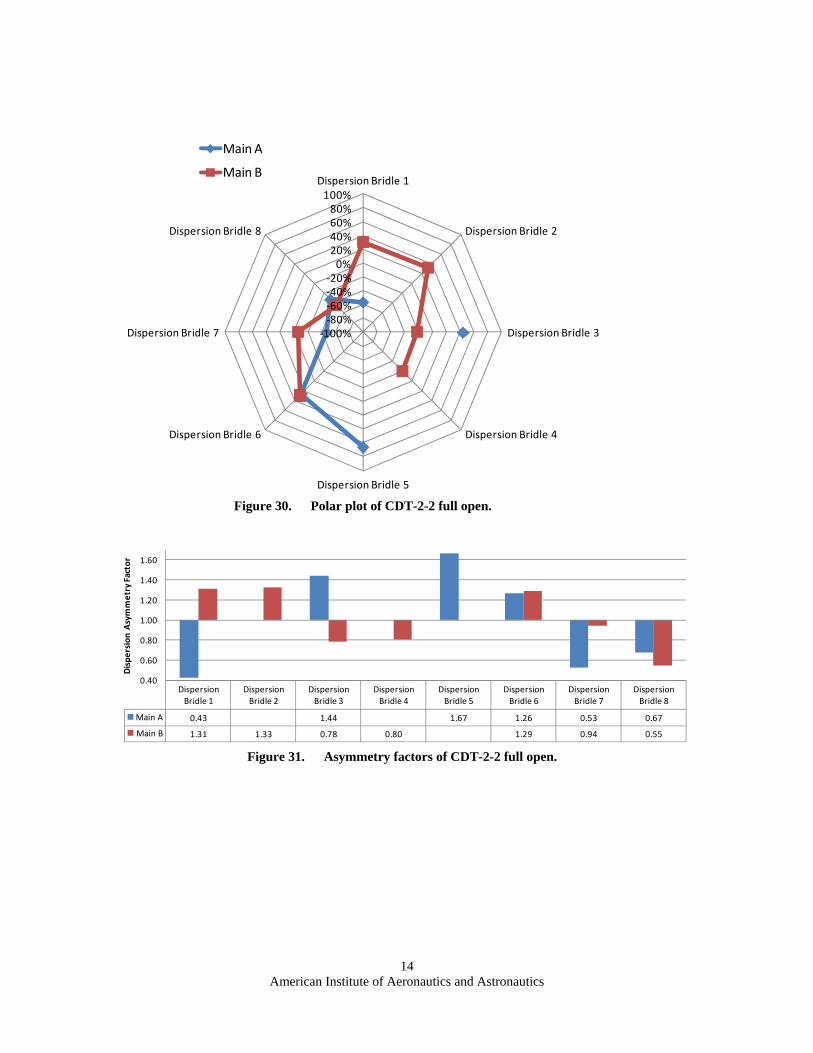
Once the parachutes reached full open the asymmetry factors did not decrease greatly due to a dynamic inflation as seen in Figure 13. The highest factors occurred on parachute A, bridle 5 with a value of 1.67 and on parachute B, bridle 2 with a value of 1.33.
B. EDU-A-CDT-2-3 Inflation and Disreef Data
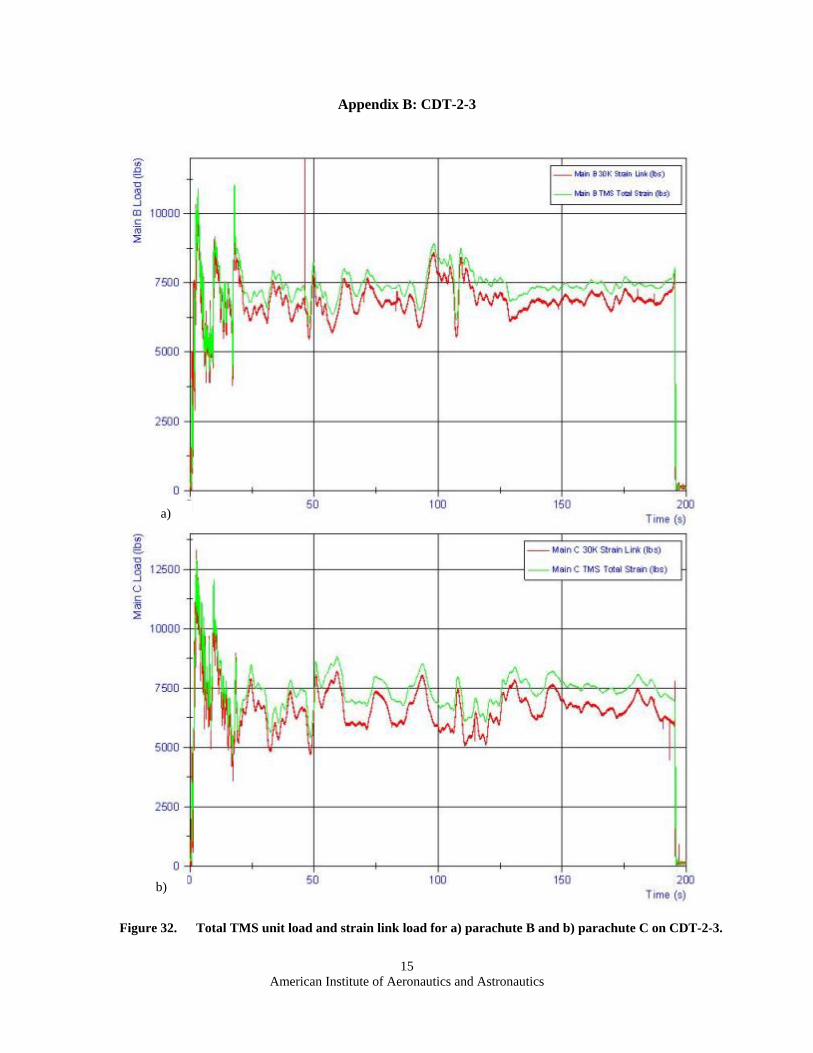
EDU-A-CDT-2-3 was a three parachute cluster test with a primary objective to observe and measure the performance of the cluster with canopies modified to increase geometric porosity. See Ref. 4 for more information regarding the test results and objectives. Only parachutes B and C were fully instrumented with TMS units on their dispersion bridles; parachute A was not instrumented due to an inadequate number of available TMS units. All TMS units gathered data for the entirety of the test except for the unit on bridle 2 of parachute C. As discussed in section V, the total TMS load for each parachute was confirmed against their

American Institute of Aeronautics and Astronautics
7
Figure 15. CDT-2-3 first stage inflation.
Figure 17. CDT-2-3 second stage disreef.
Figure 16. CDT-2-3 first stage asymmetry factors at peak load.
Dispersion Bridle 1
Dispersion Bridle 2
Dispersion Bridle 3
Dispersion Bridle 4
Dispersion Bridle 5
Dispersion Bridle 6
Dispersion Bridle 7
Dispersion Bridle 8
Main B 0.54 0.87 1.36 1.24 0.68 0.81 1.25 1.26
Main C 0.54 1.29 0.93 0.87 1.25 1.58 0.53
0.40
0.60
0.80
1.00
1.20
1.40
1.60
Dispersion Asymmetry Factor
Figure 18. CDT-2-3 full open.
respective strain links. The data matched as expected; see figures in Appendix B for the plots.
The image and polar plot in Figure 14 and Figure 15, respectively, show that the loading was moderately asymmetric during the first reefing stage for both parachutes. The bar chart (Figure 16) shows the highest asymmetry factor occurring on parachute C, bridle 7 with a value of 1.58. Parachute B saw its highest factor of 1.36 on bridle 3.
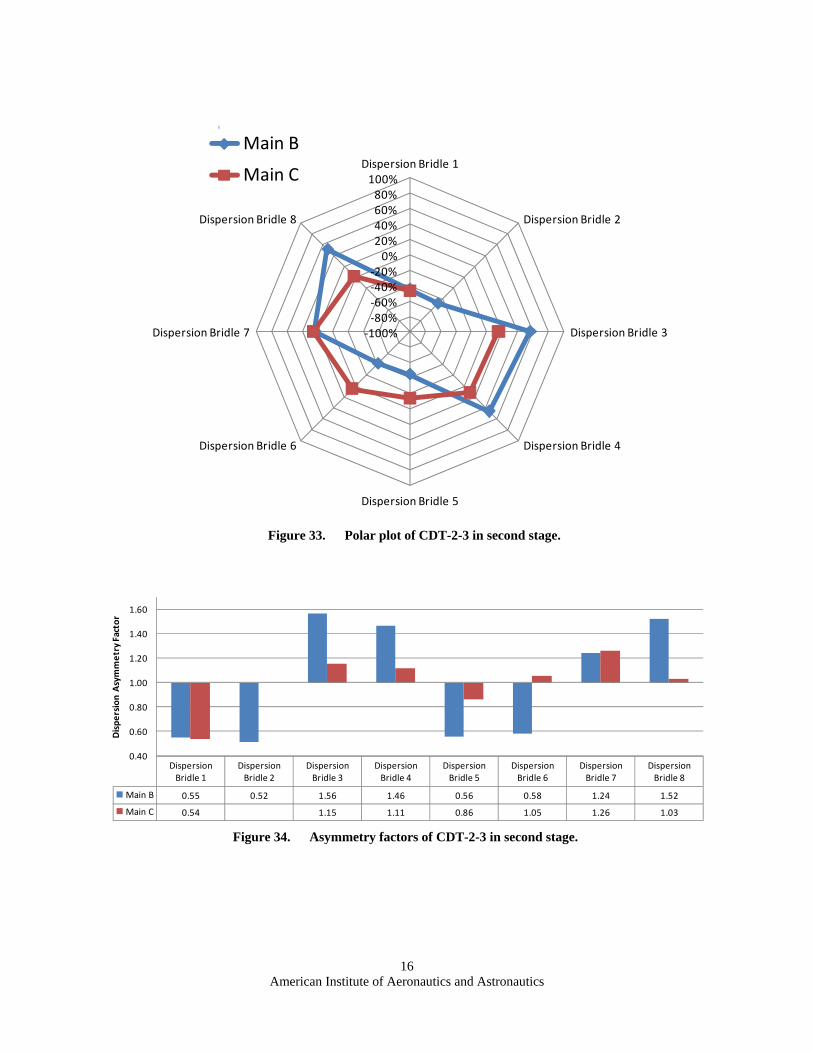
The second stage was similar to the first: large asymmetrical loading in a relatively oblong-shaped skirt (Figure 17). The highest asymmetry factors occurred on parachute B, bridles 3 and 8 with values of 1.56 and 1.52, respectively. Parachute C did not experience asymmetry factors as high as parachute B; the highest was 1.24 on bridle 7.
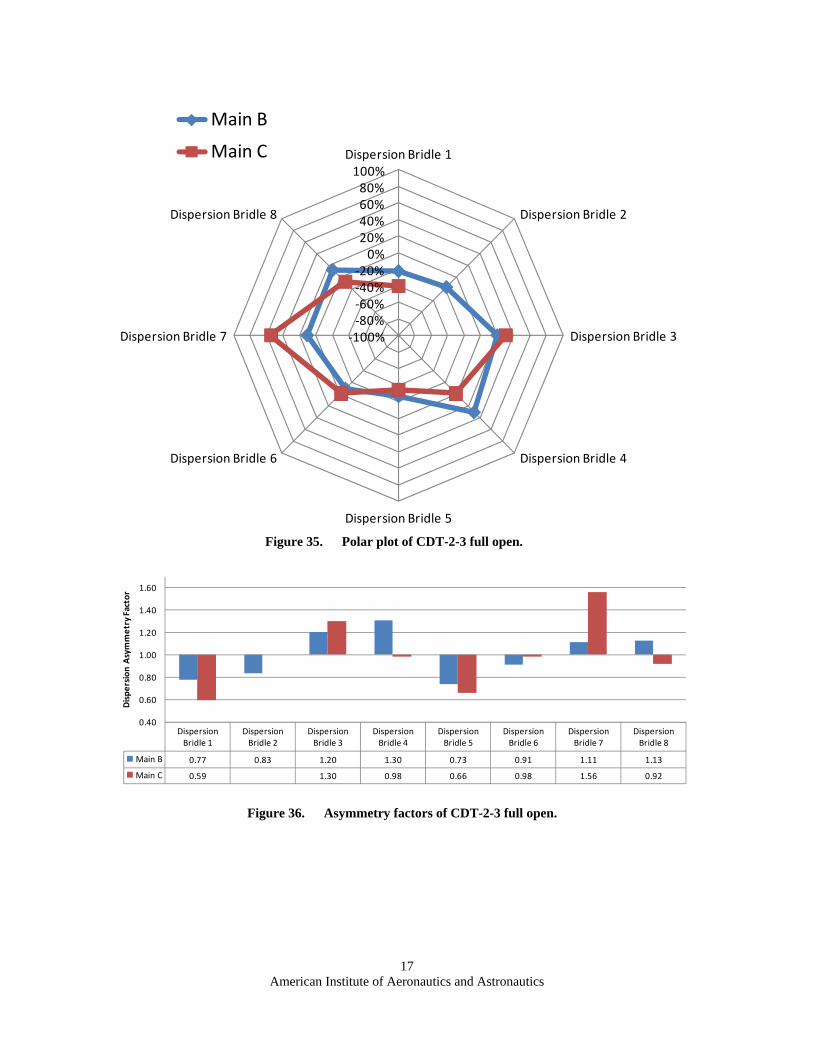
Once the parachutes reached full open, the asymmetry factors decreased slightly as seen in Figure 18 The highest factor occurred on parachute C, bridle 7 with a value of 1.56 and 1.30 on parachute B, bridle 4.
C. EDU-A-CDT-2-1 Inflation and Disreef Data EDU-A-CDT-2-1 was a two parachute cluster test with a primary objective to observe and measure the
performance of the cluster with modified line lengths. See Ref 4 for more information regarding the test results and objectives. This test was an anomalous flight with an unintentional skipped stage and reefing ring failures. Another phenomenon occurred because parachute A had a white colored crown which had a lower permeability than the orange colored crown on parachute B. This led parachute A to have a smaller skirt diameter and lower load than B. See Ref. 5 for further information regarding the parachute permeability difference. Data is presented here for completeness, but should not be used to influence unsymmetrical load factor design discussions.
American Institute of Aeronautics and Astronautics
8
Figure 19. CDT-2-1 polar plot of asymmetrical loading during first stage.
‐100%
‐80%
‐60%
‐40%
‐20%
0%
20%
40%
60%
80%
100%
Dispersion Bridle 1
Dispersion Bridle 2
Dispersion Bridle 3
Dispersion Bridle 4
Dispersion Bridle 5
Dispersion Bridle 6
Dispersion Bridle 7
Dispersion Bridle 8
Main A
Main B
Figure 21. CDT-2-1 first stage asymmetry factors.
Dispersion Bridle 1
Dispersion Bridle 2
Dispersion Bridle 3
Dispersion Bridle 4
Dispersion Bridle 5
Dispersion Bridle 6
Dispersion Bridle 7
Dispersion Bridle 8
Main A 1.25 1.47 0.35 0.54 1.38 1.18 0.56 1.27
Main B 0.36 0.67 1.75 0.84 0.90 1.45 1.02
0.40
0.60
0.80
1.00
1.20
1.40
1.60
Dispe
rsion Asymmetry Factor
Figure 22. CDT-2-1 second stage disreef.
Figure 23. CDT-2-1 full open with a) parachute A crowded out and b) when both parachutes full open.
Figure 20. CDT-2-1 first stage inflation.
Both parachutes, A and B, were fully instrumented with TMS units on their dispersion bridles. The TMS unit located on dispersion bridle 4 on Main parachute B failed and therefore provided no data for the entirety of the flight. The total TMS load for each parachute matched the corresponding strain link load as expected; see the figures in Appendix A for the plots.
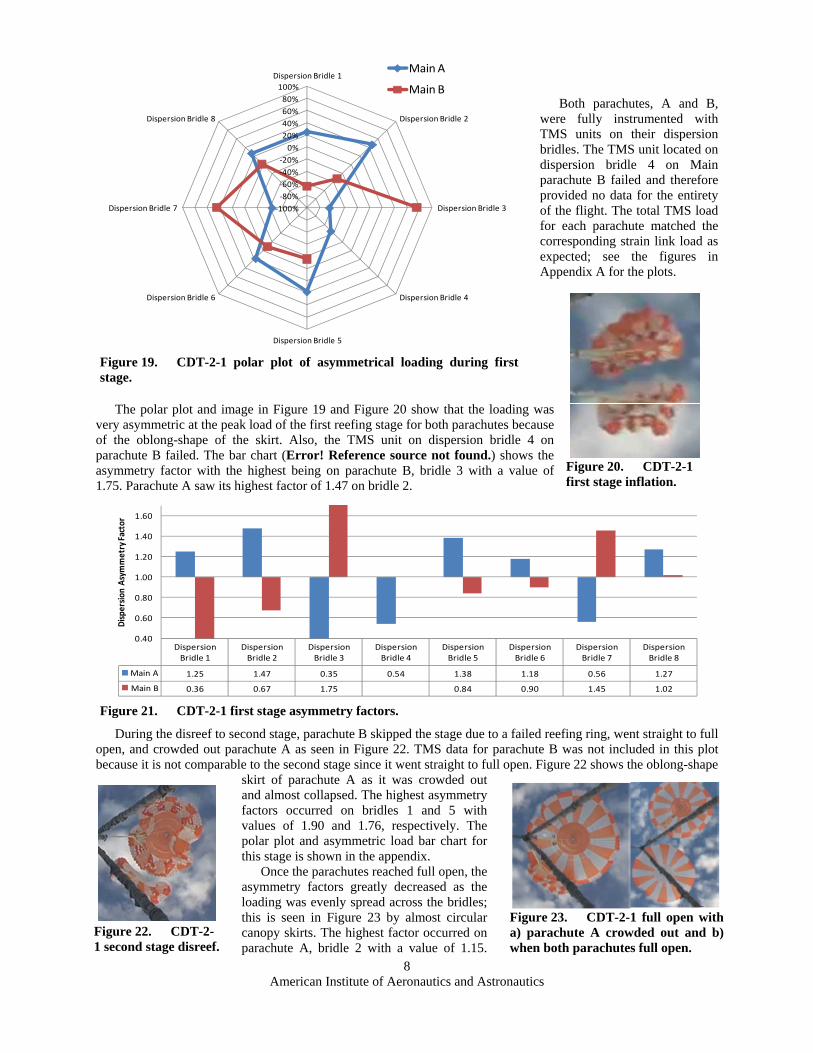
The polar plot and image in Figure 19 and Figure 20 show that the loading was very asymmetric at the peak load of the first reefing stage for both parachutes because of the oblong-shape of the skirt. Also, the TMS unit on dispersion bridle 4 on parachute B failed. The bar chart (Error! Reference source not found.) shows the asymmetry factor with the highest being on parachute B, bridle 3 with a value of 1.75. Parachute A saw its highest factor of 1.47 on bridle 2.
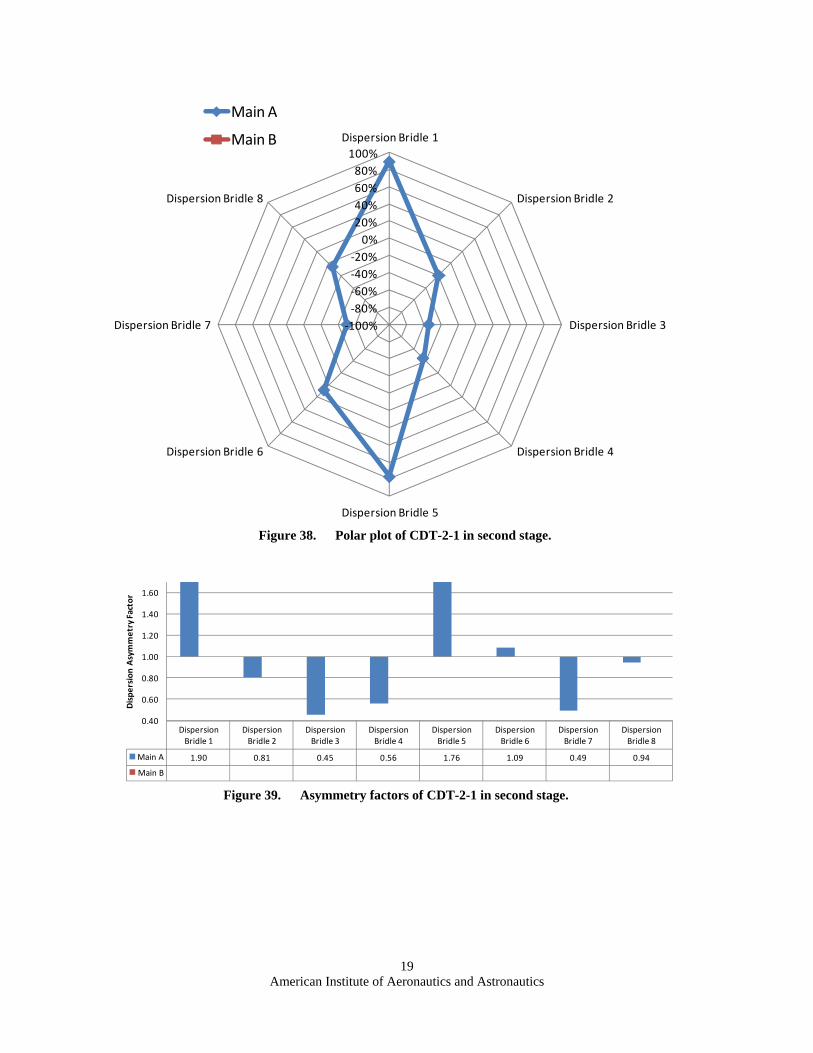
During the disreef to second stage, parachute B skipped the stage due to a failed reefing ring, went straight to full open, and crowded out parachute A as seen in Figure 22. TMS data for parachute B was not included in this plot because it is not comparable to the second stage since it went straight to full open. Figure 22 shows the oblong-shape
skirt of parachute A as it was crowded out and almost collapsed. The highest asymmetry factors occurred on bridles 1 and 5 with values of 1.90 and 1.76, respectively. The polar plot and asymmetric load bar chart for this stage is shown in the appendix.
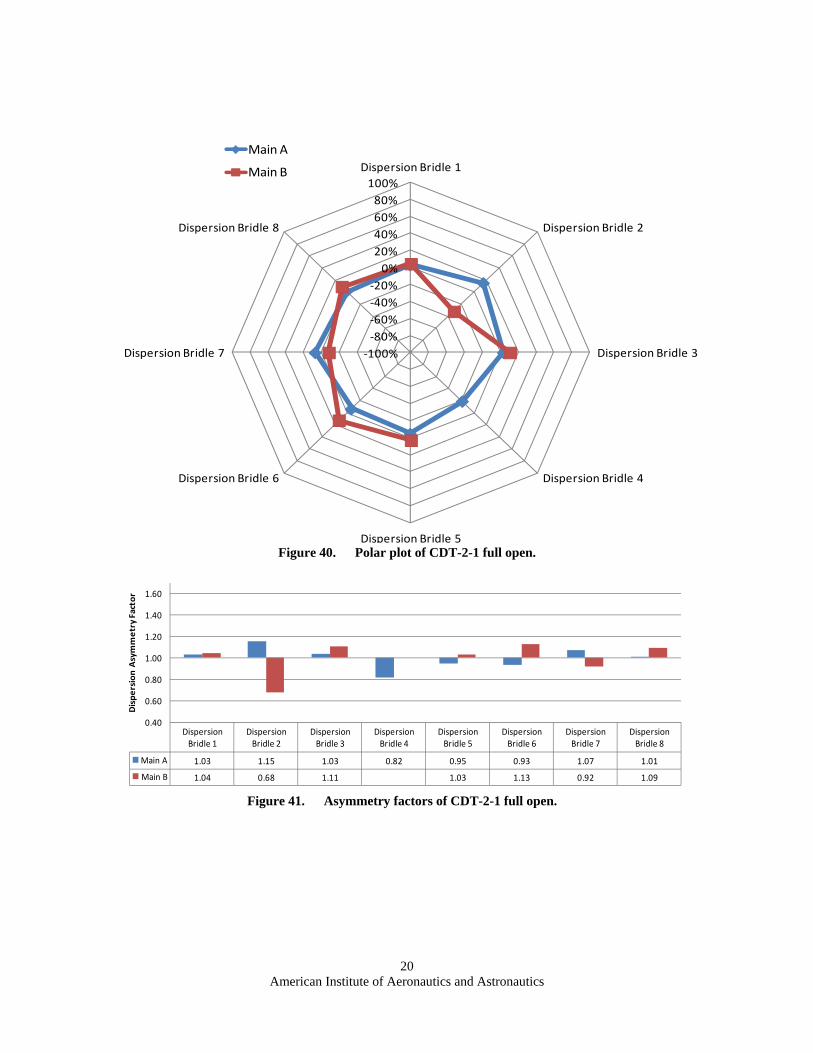
Once the parachutes reached full open, the asymmetry factors greatly decreased as the loading was evenly spread across the bridles; this is seen in Figure 23 by almost circular canopy skirts. The highest factor occurred on parachute A, bridle 2 with a value of 1.15.

American Institute of Aeronautics and Astronautics
9
Figure 24. CDT-2-1 steady state TMS strain and asymmetry for a) parachute A, and b) parachute B.
50 75 100 125 150 175 200Time (s)
-50
-25
0
25
50
Mai
n A
TM
S A
sym
metr
y (%
)
Dispersion 1
Dispersion 2
Dispersion 3
Dispersion 4
Dispersion 5
Dispersion 6
Dispersion 7
Dispersion 8
50 75 100 125 150 175 200Time (s)
0
2500
5000
7500
10000
12500
15000
Mai
n A
TM
S T
ota
l Str
ain
(lb
s )
Main A Steady-State Asymmetry
Parachute Collision
25 50 75 100 125 150 175 200Time (s)
-50
-25
0
25
50
Mai
n B
TM
S A
s ym
metr
y (%
)
Dispersion 1
Dispersion 2
Dispersion 3
Dispersion 5
Dispersion 6
Dispersion 7
Dispersion 8
50 75 100 125 150 175 200Time (s)
6000
7000
8000
9000
10000
11000
12000
13000
Mai
n B
TM
S T
ota
l Str
ain
(lb
s)
Main B Steady-State Asymmetry
Parachute Collision
Interestingly, one bridle on parachute B (bridle 2) saw a much lower load than any other with a factor of 0.68 as compared to the next lowest of 0.82 on parachute A, bridle 4. The polar plot and asymmetric load bar chart for this stage is shown in the figures in Appendix A.
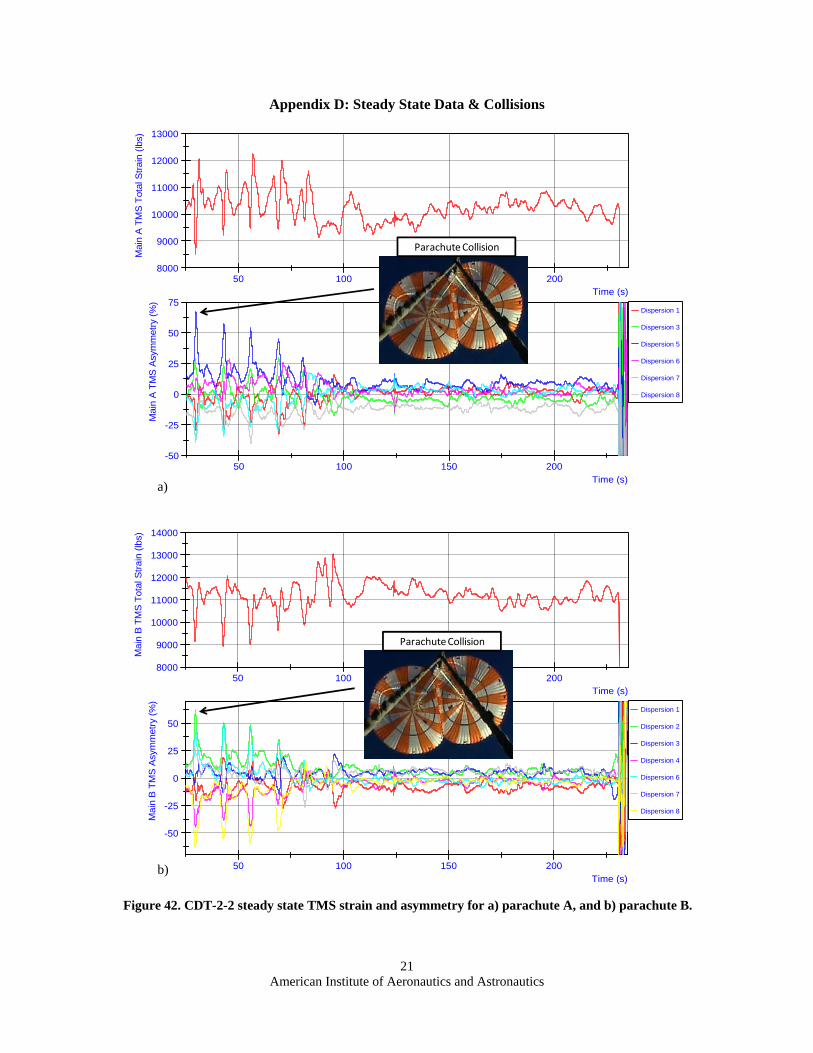
D. Steady State Data & Collisions Sections C through B above covered parachute asymmetry during inflation, but asymmetry also occurs during
steady state conditions due to aerodynamics (angle of attack) and parachute collisions affecting the canopy shape. Figure 24 depicts the total TMS strain for each parachute during CDT-2-1 and the TMS asymmetry. At about 165 seconds from Main deployment, the two parachutes collided as shown in the image. This caused the parachutes to change shape and therefore induced asymmetry by about 35% on parachute A (green trace) and up to 50% on parachute B (pink trace). Furthermore, the plots show that a single dispersion bridle experienced a large asymmetry factor in comparison to the others. During the collision, parachute A encountered a division of loading among the bridles: four experienced higher loading, three experienced lower loading, and one bridle experienced average loading. On the other hand, parachute B experienced one bridle with high loading and one with low loading, with the rest between ±25% of the average loading. Similar plots are in Appendix B and C for the CDT-2-2 and CDT-2-3 tests.
E. CPAS Generation II Data Summary
Comparing data across the three tests, a pattern arises during disreefing events: bridles on opposite sides of the parachute experience a similar load whether high or low. This creates the oblong shape shown in the polar plots and images. For example, the first stage of CDT-2-1, bridles 3 and 7 on parachute B receive the largest load and are directly across from each other while bridles 1 and 5, also across from each other are relatively low compared to
a)
b)
American Institute of Aeronautics and Astronautics
10
Table 2. CPAS Generation II average asymmetry factors.
Stage Highest
Asymmetry Factor Average
1st 1.63 2nd 1.57
Full Open 1.62
Figure 25. CDT-2-3 total TMS strain and asymmetry for a) parachute B and b) parachute C.
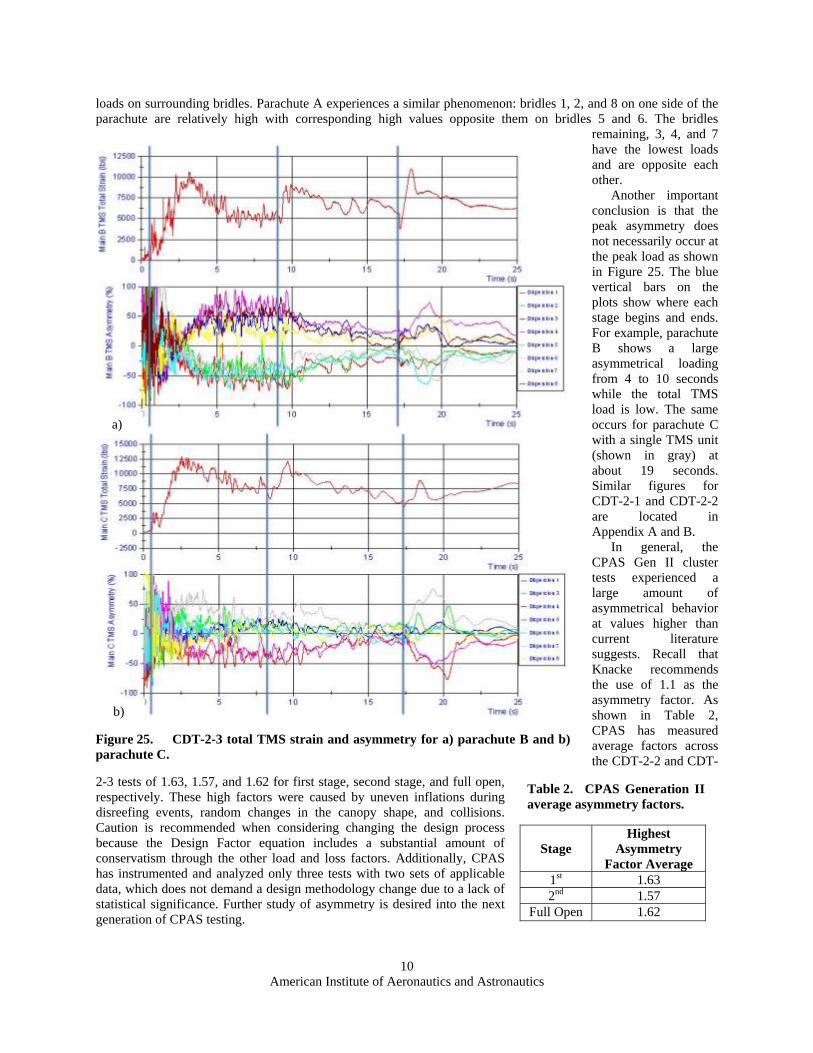
loads on surrounding bridles. Parachute A experiences a similar phenomenon: bridles 1, 2, and 8 on one side of the parachute are relatively high with corresponding high values opposite them on bridles 5 and 6. The bridles
remaining, 3, 4, and 7 have the lowest loads and are opposite each other.
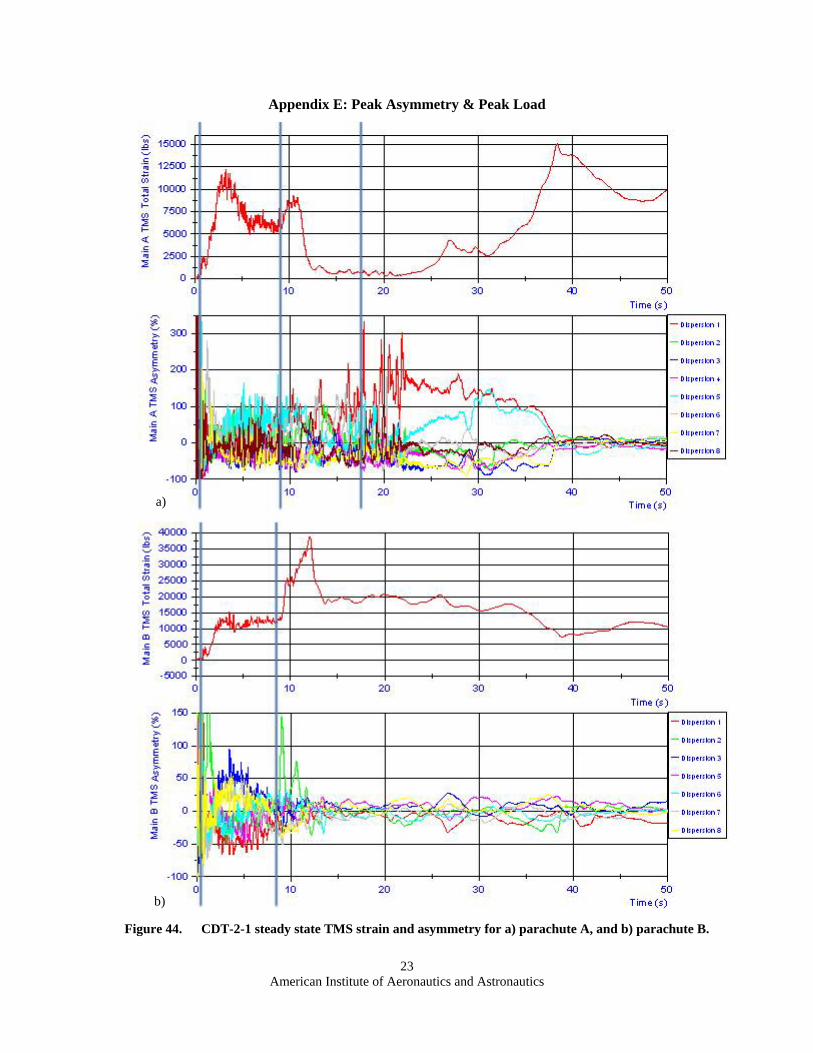
Another important conclusion is that the peak asymmetry does not necessarily occur at the peak load as shown in Figure 25. The blue vertical bars on the plots show where each stage begins and ends. For example, parachute B shows a large asymmetrical loading from 4 to 10 seconds while the total TMS load is low. The same occurs for parachute C with a single TMS unit (shown in gray) at about 19 seconds. Similar figures for CDT-2-1 and CDT-2-2 are located in Appendix A and B. In general, the CPAS Gen II cluster tests experienced a large amount of asymmetrical behavior at values higher than current literature suggests. Recall that Knacke recommends the use of 1.1 as the asymmetry factor. As shown in Table 2, CPAS has measured average factors across the CDT-2-2 and CDT-
2-3 tests of 1.63, 1.57, and 1.62 for first stage, second stage, and full open, respectively. These high factors were caused by uneven inflations during disreefing events, random changes in the canopy shape, and collisions. Caution is recommended when considering changing the design process because the Design Factor equation includes a substantial amount of conservatism through the other load and loss factors. Additionally, CPAS has instrumented and analyzed only three tests with two sets of applicable data, which does not demand a design methodology change due to a lack of statistical significance. Further study of asymmetry is desired into the next generation of CPAS testing.
a)
b)
American Institute of Aeronautics and Astronautics
11
Figure 26. Potential locations of suspension line measurement units.
VII. Recommendations for Future Testing There is a desire to continue studying the effects of asymmetrical loading on parachute suspension lines. Further
analyses, including loads measurements and video analysis, need to occur to compile a complete picture of asymmetrical inflations, disreefs, and steady state events. Instrumentation located on each or every few suspension lines (Figure 26) would provide a higher fidelity loads measurement in comparison to locating instrumentation on dispersion bridles.
CPAS has considered the use of suspension line measurement units for the next generation of testing because more accurate asymmetry loads are gathered when measurements are taken on the suspension lines and the TMS units are too large to be placed on each suspension line. These suspension line measurement units are GPS and/or IRIG-B compatible to sync the loads data with the video and images, measure the line deflection, and are small and lightweight enough
to not interfere with deployment or inflation when placed on the suspension lines. These units are not currently in the CPAS plan for Gen III testing, but are desired for future testing.
The authors also recommend that asymmetry dependent upon time is researched instead of the snapshot in time method presented here. Understanding this may lead to conclusions regarding dampening of asymmetry or provide insight to where peak asymmetric loads occur with respect to the total parachute load.
VIII. Conclusions and Recommendations It is apparent that the asymmetrical load factors exhibited on the CPAS Main parachutes are much greater than
current literature and design guides would indicate. An average load factor of about 1.6 across all stages was determined through two CPAS Gen II cluster tests: CDT-2-2 and CDT-2-3. Similarly, the Ares parachute project saw high asymmetrical load factors on recent tests.1 These values suggest reconsidering the historical asymmetrical load factor of 1.1 commonly quoted in parachute literature.
However, caution is advised in implementing this load factor. Conservatism is included in parachute design techniques as evidenced by the numerous successful parachute designs that have used an asymmetrical load factor of 1.1. These successful designs and conservative load factors do not diminish the fact that multiple flights of CPAS and Ares parachutes indicate that measurements indicate that the factor should be 1.5-1.6 or greater. No conclusions are yet drawn on an asymmetry factor to be used in the design process. The worst case of 1.9 is deemed overly conservative and an average of 1.5-1.6 does not provide enough fidelity. Therefore, parachute asymmetrical loading merits further measurements and discussion by the parachute technical community.
Acknowledgments The authors wish to acknowledge Ron King and the Ares parachute project for sharing reports and information
related to asymmetry data. The methods and techniques used in this paper were influenced heavily by methods developed by Jason Schmidt on the Ares parachute project.
American Institute of Aeronautics and Astronautics
12
Appendix A: CDT-2-2
Figure 27. Total TMS unit load and strain link load for a) parachute A and b) parachute B on CDT-2-2
a)
b)
American Institute of Aeronautics and Astronautics
13
Figure 29. Asymmetry factors of CDT-2-2 in second stage.
Dispersion Bridle 1
Dispersion Bridle 2
Dispersion Bridle 3
Dispersion Bridle 4
Dispersion Bridle 5
Dispersion Bridle 6
Dispersion Bridle 7
Dispersion Bridle 8
Main A 0.49 1.39 1.34 1.28 0.65 0.85
Main B 1.52 1.45 0.61 0.50 1.57 0.59 0.75
0.40
0.60
0.80
1.00
1.20
1.40
1.60
Dispersion Asymmetry Factor
Figure 28. Polar plot of CDT-2-2 in second stage.
‐100%
‐80%
‐60%
‐40%
‐20%
0%
20%
40%
60%
80%
100%
Dispersion Bridle 1
Dispersion Bridle 2
Dispersion Bridle 3
Dispersion Bridle 4
Dispersion Bridle 5
Dispersion Bridle 6
Dispersion Bridle 7
Dispersion Bridle 8
Main A
Main B
American Institute of Aeronautics and Astronautics
14
Figure 31. Asymmetry factors of CDT-2-2 full open.
Dispersion Bridle 1
Dispersion Bridle 2
Dispersion Bridle 3
Dispersion Bridle 4
Dispersion Bridle 5
Dispersion Bridle 6
Dispersion Bridle 7
Dispersion Bridle 8
Main A 0.43 1.44 1.67 1.26 0.53 0.67
Main B 1.31 1.33 0.78 0.80 1.29 0.94 0.55
0.40
0.60
0.80
1.00
1.20
1.40
1.60
Dispersion Asymmetry Factor
Figure 30. Polar plot of CDT-2-2 full open.
‐100%‐80%‐60%‐40%‐20%0%20%40%60%80%
100%Dispersion Bridle 1
Dispersion Bridle 2
Dispersion Bridle 3
Dispersion Bridle 4
Dispersion Bridle 5
Dispersion Bridle 6
Dispersion Bridle 7
Dispersion Bridle 8
Main A
Main B
American Institute of Aeronautics and Astronautics
15
Appendix B: CDT-2-3
Figure 32. Total TMS unit load and strain link load for a) parachute B and b) parachute C on CDT-2-3.
a)
b)
American Institute of Aeronautics and Astronautics
16
Figure 33. Polar plot of CDT-2-3 in second stage.
‐100%‐80%‐60%‐40%‐20%0%
20%40%60%80%100%
Dispersion Bridle 1
Dispersion Bridle 2
Dispersion Bridle 3
Dispersion Bridle 4
Dispersion Bridle 5
Dispersion Bridle 6
Dispersion Bridle 7
Dispersion Bridle 8
Main
Main
Main A
Main BMain B
Main C
Figure 34. Asymmetry factors of CDT-2-3 in second stage.
Dispersion Bridle 1
Dispersion Bridle 2
Dispersion Bridle 3
Dispersion Bridle 4
Dispersion Bridle 5
Dispersion Bridle 6
Dispersion Bridle 7
Dispersion Bridle 8
Main B 0.55 0.52 1.56 1.46 0.56 0.58 1.24 1.52
Main C 0.54 1.15 1.11 0.86 1.05 1.26 1.03
0.40
0.60
0.80
1.00
1.20
1.40
1.60
Dispersion Asymmetry Factor
American Institute of Aeronautics and Astronautics
17
Figure 36. Asymmetry factors of CDT-2-3 full open.
Dispersion Bridle 1
Dispersion Bridle 2
Dispersion Bridle 3
Dispersion Bridle 4
Dispersion Bridle 5
Dispersion Bridle 6
Dispersion Bridle 7
Dispersion Bridle 8
Main B 0.77 0.83 1.20 1.30 0.73 0.91 1.11 1.13
Main C 0.59 1.30 0.98 0.66 0.98 1.56 0.92
0.40
0.60
0.80
1.00
1.20
1.40
1.60
Dispersion Asymmetry Factor
Figure 35. Polar plot of CDT-2-3 full open.
‐100%‐80%‐60%‐40%‐20%0%
20%40%60%80%100%
Dispersion Bridle 1
Dispersion Bridle 2
Dispersion Bridle 3
Dispersion Bridle 4
Dispersion Bridle 5
Dispersion Bridle 6
Dispersion Bridle 7
Dispersion Bridle 8
Main A
Main B
Main B
Main C
American Institute of Aeronautics and Astronautics
18
Appendix C: CDT-2-1
Figure 37. Total TMS unit load and strain link load for a) parachute A and b) parachute B on CDT-2-1..
a)
b)
American Institute of Aeronautics and Astronautics
19
Figure 39. Asymmetry factors of CDT-2-1 in second stage.
Dispersion Bridle 1
Dispersion Bridle 2
Dispersion Bridle 3
Dispersion Bridle 4
Dispersion Bridle 5
Dispersion Bridle 6
Dispersion Bridle 7
Dispersion Bridle 8
Main A 1.90 0.81 0.45 0.56 1.76 1.09 0.49 0.94
Main B
0.40
0.60
0.80
1.00
1.20
1.40
1.60
Dispersion Asymmetry Factor
Figure 38. Polar plot of CDT-2-1 in second stage.
‐100%
‐80%
‐60%
‐40%
‐20%
0%
20%
40%
60%
80%
100%
Dispersion Bridle 1
Dispersion Bridle 2
Dispersion Bridle 3
Dispersion Bridle 4
Dispersion Bridle 5
Dispersion Bridle 6
Dispersion Bridle 7
Dispersion Bridle 8
Main A
Main B
American Institute of Aeronautics and Astronautics
20
Figure 41. Asymmetry factors of CDT-2-1 full open.
Dispersion Bridle 1
Dispersion Bridle 2
Dispersion Bridle 3
Dispersion Bridle 4
Dispersion Bridle 5
Dispersion Bridle 6
Dispersion Bridle 7
Dispersion Bridle 8
Main A 1.03 1.15 1.03 0.82 0.95 0.93 1.07 1.01
Main B 1.04 0.68 1.11 1.03 1.13 0.92 1.09
0.40
0.60
0.80
1.00
1.20
1.40
1.60
Dispersion Asymmetry Factor
Figure 40. Polar plot of CDT-2-1 full open.
‐100%
‐80%
‐60%
‐40%
‐20%
0%
20%
40%
60%
80%
100%
Dispersion Bridle 1
Dispersion Bridle 2
Dispersion Bridle 3
Dispersion Bridle 4
Dispersion Bridle 5
Dispersion Bridle 6
Dispersion Bridle 7
Dispersion Bridle 8
Ma
Ma
Main A
Main B
American Institute of Aeronautics and Astronautics
21
Appendix D: Steady State Data & Collisions
Figure 42. CDT-2-2 steady state TMS strain and asymmetry for a) parachute A, and b) parachute B.
50 100 150 200Time (s)
-50
-25
0
25
50
75
Main
A T
MS
Asy
mm
etr
y (%
)
Dispersion 1
Dispersion 3
Dispersion 5
Dispersion 6
Dispersion 7
Dispersion 8
50 100 150 200Time (s)
8000
9000
10000
11000
12000
13000M
ain
A T
MS
Tota
l Str
ain
(lb
s)
Parachute Collision
50 100 150 200Time (s)
-50
-25
0
25
50
Main
B T
MS
Asy
mm
e try
(%
)
Dispersion 1
Dispersion 2
Dispersion 3
Dispersion 4
Dispersion 6
Dispersion 7
Dispersion 8
50 100 150 200Time (s)
8000
9000
10000
11000
12000
13000
14000
Main
B T
MS
Tota
l Str
ain
(lb
s)
Parachute Collision
a)
b)

American Institute of Aeronautics and Astronautics
22
Figure 43. CDT-2-3 steady state TMS strain and asymmetry for a) parachute B, and b) parachute C.
25 50 75 100 125 150 175 200Time (s)
-50
-25
0
25
50
Mai
n B
TM
S A
s ym
met
ry (
%)
Dispersion 1
Dispersion 2
Dispersion 3
Dispersion 4
Dispersion 5
Dispersion 6
Dispersion 7
Dispersion 8
25 50 75 100 125 150 175 200Time (s)
5000
6000
7000
8000
9000
10000M
ain
B T
MS
Tot
al S
train
(lb
s)
Parachute Collision
25 50 75 100 125 150 175 200Time (s)
-50
-25
0
25
50
Mai
n C
TM
S A
sym
met
ry (
%)
Dispersion 1
Dispersion 3
Dispersion 4
Dispersion 5
Dispersion 6
Dispersion 7
Dispersion 8
25 50 75 100 125 150 175 200Time (s)
4000
5000
6000
7000
8000
9000
10000
Mai
n C
TM
S T
ota
l Str
ain
(lbs )
Parachute Collision
a)
b)
American Institute of Aeronautics and Astronautics
23
Appendix E: Peak Asymmetry & Peak Load
Figure 44. CDT-2-1 steady state TMS strain and asymmetry for a) parachute A, and b) parachute B.
a)
b)

American Institute of Aeronautics and Astronautics
24
Figure 45. CDT-2-2 steady state TMS strain and asymmetry for a) parachute A, and b) parachute B.
a)
b)
American Institute of Aeronautics and Astronautics
25
References 1Schmidt, J., “Ares 1 Main Parachute Cluster Asymmetrical Loading and Design Recommendations,” United Space Alliance, EA-CLV-PRES-00919-2010, Jan. 7, 2010. 2 Knacke, T.W., Parachute Recovery Systems, Para-Publishing, Santa Barbara, CA, 1992. 3“CPAS PDR Parachute Design,” CPAS PDR, Section 6, Houston, Texas, August 2010, pp. 9-19. 4Morris, A.,et al., “Summary of Generation II CPAS Parachute Performance”, 21st AIAA Aerodynamics Decelerator Systems Technology Conference, Dublin, Ireland, May 2011 (submitted for publication). 5Ray, E., “Photogrammetric Analysis of CPAS Main Parachutes,” 21th AIAA Aerodynamic Decelerator Systems Technology Conference and Seminar, Dublin, Ireland, May 2011 (submitted for publication).


![Leptogenesis from Neutralino Decay with … Introduction The creation ofa lepton asymmetry, i.e. leptogenesis [1, 2, 3], which gets converted into the present observed baryon asymmetry](https://img.pdfslide.net/doc/110x75/5b08b1267f8b9abe5d8b896b/leptogenesis-from-neutralino-decay-with-introduction-the-creation-ofa-lepton-asymmetry.jpg)