Embed Size (px)
Citation preview
Journal of Biomechanics 43 (2010) 2164–2173
Contents lists available at ScienceDirect
journal homepage: www.elsevier.com/locate/jbiomech
Journal of Biomechanics
0021-92
doi:10.1
n Corr
E-m
www.JBiomech.com
Loading of the knee joint during activities of daily living measured in vivo infive subjects
I. Kutzner a,n, B. Heinlein a,b, F. Graichen a, A. Bender a,c, A. Rohlmann a, A. Halder d,A. Beier d, G. Bergmann a
a Julius Wolff Institute, Charite – Universitatsmedizin Berlin, Augustenburger Platz 1, 13353 Berlin, Germanyb ZHAW Zurich University of Applied Science, Biomechanical Engineering, Winterthur, Switzerlandc Berlin-Brandenburg Center for Regenerative Therapies, Charite – Universitatsmedizin Berlin, Germanyd Hellmuth-Ulrici-Kliniken, Klinik fur Endoprothetik, Sommerfeld, Germany
a r t i c l e i n f o
Article history:
Accepted 26 March 2010Detailed knowledge about loading of the knee joint is essential for preclinical testing of implants,
validation of musculoskeletal models and biomechanical understanding of the knee joint. The contact
Keywords:
Knee
Forces
Moments
Telemetry
In vivo
Measurements
Load
Implant
90/$ - see front matter & 2010 Elsevier Ltd. A
016/j.jbiomech.2010.03.046
esponding author. Tel.: +49 30 450 559678;
ail address: [email protected] (I. Kutzn
a b s t r a c t
forces and moments acting on the tibial component were therefore measured in 5 subjects in vivo by an
instrumented knee implant during various activities of daily living.
Average peak resultant forces, in percent of body weight, were highest during stair descending
(346% BW), followed by stair ascending (316% BW), level walking (261% BW), one legged stance (259%
BW), knee bending (253% BW), standing up (246% BW), sitting down (225% BW) and two legged stance
(107% BW). Peak shear forces were about 10–20 times smaller than the axial force. Resultant forces
acted almost vertically on the tibial plateau even during high flexion. Highest moments acted in the
frontal plane with a typical peak to peak range �2.91% BWm (adduction moment) to 1.61% BWm
(abduction moment) throughout all activities. Peak flexion/extension moments ranged between
�0.44% BWm (extension moment) and 3.16% BWm (flexion moment). Peak external/internal torques
lay between �1.1% BWm (internal torque) and 0.53% BWm (external torque).
The knee joint is highly loaded during daily life. In general, resultant contact forces during dynamic
activities were lower than the ones predicted by many mathematical models, but lay in a similar range
as measured in vivo by others. Some of the observed load components were much higher than those
currently applied when testing knee implants.
& 2010 Elsevier Ltd. All rights reserved.
1. Introduction
The knee joint is loaded by external forces (ground reactionforce, masses and acceleration forces of foot and shank). Theirsum is counterbalanced by the forces acting across the joint, i.e.the tibio-femoral contact forces, muscle forces and forces in softtissue structures. The ‘net moment’, caused by the external forces,is additionally counterbalanced by the moments exerted bymuscles, soft tissues, contact forces and frictional forces. Muscleand joint contact forces can be analysed using gait data togetherwith musculoskeletal modelling techniques e.g. inverse dynamicsand static optimization. However, large variations of reportedloading exist. Using gait analysis and a mathematical model,Morrison calculated joint forces of 200–400% BW (percent ofbody weight) during level walking (Morrison, 1970). Whilst more
ll rights reserved.
fax: +49 30 450 559980.
er).
recently forces of approximately 310% BW were reported using asimilar computational approach (Taylor et al., 2004), other studiescalculated contact forces of up to 710% BW during level walkingand even 800% BW for downhill walking (Costigan et al., 2002;Kuster et al., 1997; Seireg and Arvikar, 1975).
To overcome uncertainties of mathematical models, teleme-trized implants were developed to measure the joint contactforces in vivo. Taylor and co-workers measured loads in the shaftof a distal femoral replacement (Taylor et al., 1998). The estimatedforces in the knee joint of 220–250% BW during level walkingwere smaller than those determined analytically. Recently, loaddata measured by instrumented total knee replacements duringactivities of daily living in vivo became available (D’Lima et al.,2005, 2006, 2007; Mundermann et al., 2008). One year post-operatively peak tibial forces were 280% BW (level walking), 290%BW (stair ascending), 330% BW (stair descending) and 264% BW(chair rise). Most data is restricted, however, to total compressiveforces measured in one subject. Complete six component loaddata during walking and stair climbing, measured in two subjects

I. Kutzner et al. / Journal of Biomechanics 43 (2010) 2164–2173 2165
in vivo, was only published by Heinlein et al. (Heinlein et al.,2009). Peak axial forces of 208–276% BW (level walking) and327–352% BW (descending stairs) were reported.
The aim of this study was to examine the tibio-femoral contactforces and moments in the knee joint during daily life in vivo
in a more representative cohort of 5 subjects and to examineinter-individual differences. All six load components (3 forces,3 moments) acting on an instrumented tibial tray were measured.
2. Materials and methods
2.1. Instrumented implant
Various forces and moments act across the knee joint, caused by external
forces, active muscles, soft tissue deformations and the contact forces and
moments acting directly between the condyles and the tibial plateau. The
instrumented knee implant measures the 3 contact forces and 3 contact moments,
acting on the tibial component, with a typical error below 2% (Heinlein et al.,
2007). Its design is based on the INNEX FIXUC total knee system (Zimmer GmbH,
Winterthur, Switzerland) with an ultra-congruent tibial insert and a standard
femoral component. From the load-dependent deformations of its stem, which are
measured by 6 semi-conductor strain gages (KSP 1-350-E4, Kyowa), the 6 load
components are calculated. All signals are sensed and transmitted by a custom-
made, inductively powered telemetry circuit (Graichen et al., 2007).
2.1.1. Coordinate system and nomenclature
The centre of the coordinate system is fixed at the right tibial component on
the extended stem axis at the height of the lowest part of the polyethylene insert
(Fig. 1). Forces and moments measured in left knees were transformed to the right
side. Force components +Fx, +Fy and +Fz act in lateral, anterior and superior
direction on the tibial component. Moments +Mx, +My and +Mz act in the sagittal,
frontal and horizontal plane of the tibial component and turn right around their
respective axes. From the components, the resultant forces F and moments M were
calculated.
The moments are termed, according to clinical conventions, after the tibial
rotation they counterbalance. To give an example: if external or muscle forces act
as to abduct the tibia, the moment +My counteracts this rotation. This moment is
termed ‘abduction moment’ (although it tries to adduct the tibia). In this sense all
moments are named: flexion/extension moment¼ +Mx/�Mx, abduction/adduction
moment¼ +My/�My, external/internal rotation moment¼ +Mz/�Mz.
The contact moments can be caused by a distance between the resultant force
and the centre of the coordinate system, by friction between femoral and tibial
component or by both factors and are only a fraction of the total knee moments.
The coordinate system is fixed to the tibial tray and not to the instantaneous
axis of the knee joint. Magnitudes of the flexion/extension moments around the
knee axis, for example, may differ substantially from the ones acting around the
prosthesis’ x-axis (Heinlein et al., 2009).
FxFy
Fz
My
Mx
Mz
Fig. 1. Coordinate system of the instrumented tibial component.
2.2. Subjects
After obtaining approval of the ethics committee and the subjects’ informed
consent to participate in the study and have their images published, the prosthesis
was implanted in 4 male and 1 female subjects with osteoarthritis (Table 1).
A medial parapatellar approach was used; the cruciate ligaments were sacrificed.
Femoral and tibial component were cemented. The mechanical axis angles
between the tibial axis and an axis connection knee and hip joint centers were
determined by radiographs during two legged stance (Specogna et al., 2007;
Colebatch et al., 2009). No subject had further joint replacements except K2L,
whose contralateral knee had been replaced 6 months previously.
2.3. Activities investigated and data evaluation
Eight most frequent and strenuous activities of daily living were investigated
(Table 2, Fig. 2) and are further named by their abbreviations. Every activity was
repeated 5 to 25 times by each subject. Average time courses of resultant forces
from several trials were calculated using a dynamic time warping procedure
(Wang and Gasser, 1997). During 2LegSt, StUp, SitD and KneeB ground reaction
forces were measured to control an even body weight distribution. KneeB was
performed to self-selected flexion angles: K1L (90–1001), K2L (100–1051), K3R
(90–951), K4R (80–851) and K5R (90–951).
Ranges of forces and moments during complete loading cycles are stated by
their maximal (and minimal, if applicable) peak values. In different subjects these
peak values may occur at different time points. Peak forces during walking, for
example, can act either during the instants of contralateral toe off (CTO) or prior to
contralateral heel strike (CHS).
‘Individual’ forces or moments of each subject refer to the average peak values
from all investigated trials. ‘Typical’ forces or moments are the averages of the
individual loads from all five subjects. ‘Absolute’ maxima/minima refer to the
highest/lowest value from all investigated subjects and trials.
In the following, peak forces are stated in percent of the body weight (%BW),
peak moments in percent body weight times meter (%BWm).
3. Results
3.1. Typical peak loads
During most activities (except static positions), shear forces andmoment components changed their sign during a loading cycle.Forces in the transverse plane, for example, changed from alaterally directed force +Fx to a medially directed force �Fx. Thissign inversion becomes obvious in Fig. 3 if all large symbols areabove zero and the small symbols are below zero. In the following,all values refer to typical peak loads if not stated otherwise.
3.1.1. Resultant forces F (Fig. 3A)
Smallest peak resultant forces of 107% BW were measuredduring 2LegSt. During SitD the values were about two times higher(225% BW). StUp, KneeB, 1LegSt and LevWalk caused nearly thesame forces (246–261% BW). The highest forces acted during AscSt
(316% BW) and DesSt (346% BW). The absolute maximum of F
from all subjects and trials was 400% BW, measured in K5R duringDesSt. Peak axial forces �Fz were of similar magnitude as thestated resultant forces F.
3.1.2. Shear forces Fx and Fy (Fig. 3B and C)
Shear forces in the transverse plane were about 10–20 timessmaller than the axial force Fz. In most subjects the largest shearforces Fx and Fy were found during LevWalk, AscSt and DesSt.Medial shear forces (�Fx) ranged between �1% and �18% BW,forces in lateral direction (+Fx) between +1% and +16% BW.Highest medial forces were mainly observed in K4R, highestlateral forces mainly in K2L.
Shear forces �Fy in posterior direction were highest forLevWalk (�26% BW), AscSt (�32% BW) and DesSt (�34% BW).In K4R, however, high flexion activities (SitD, StUp, KneeB) led toindividual posterior forces �Fy of �46% BW. Shear forces inanterior direction (+Fy) typically lay between +2% and +18% BW.During 1LegSt, Fy always acted in the posterior direction.

Table 1Subject data.
Subject K1L K2L K3R K4R K5R
Sex Male Male Male Female Male
Age at implantation (years) 63 71 70 63 60
Body weight (kg) 100 90 92 97 100
Height (cm) 177 171 175 170 175
Time of measurement (months post-operatively) 10 22 16 7 11
Mechanical axis angle (deg.) preoperative 8 varus 8 varus 9 varus 3 varus 11 varus
Mechanical axis angle (deg.) postoperative 3 varus 5 varus 4 varus 5 valgus 1 varus
Table 2Activities investigated.
Activity Abbreviation Trials Conditions
Two legged stance 2LegSt 5 Equal load distribution
Sitting down SitD 5 Seat height 45 cm, no support at armrest
Standing up StUp 5 Seat height 45 cm, no support at armrest
Knee bend KneeB 5 Self-selected flexion angle
One legged stance 1LegSt 5 No or minimal support at fingertip
Level walking LevWalk 25 Self-selected comfortable speed on level ground
Ascending stairs AscSt 10 Stair height 20 cm, no support at handrail
Descending stairs DesSt 10 Stair height 20 cm, no support at handrail
Fig. 2. Subject K5R during the investigated activities. Body positions at peak resultant forces; A: one legged stance, B: standing up/sitting down, C: knee bend, D: level
walking, E: ascending stairs, F: descending stairs
I. Kutzner et al. / Journal of Biomechanics 43 (2010) 2164–21732166
3.1.3. Flexion–extension moments Mx (Fig. 4A)
In the sagittal plane high flexion moments +Mx (+0.53% to+3.16% BWm), but only small extension moments �Mx (�0.14%to �0.44% BWm) acted. Flexion moments +Mx were highestduring DesSt (3.16% BWm), followed by AscSt (2.29% BWm),LevWalk (1.92% BWm) and 1LegSt (1.81% BWm). Slightly lowerflexion moments occurred during high flexion and two-leggedactivities: StUp (1.24% BWm), SitD (1.35% BWm) and KneeB (1.39%BWm). With an absolute maximum of 6.00% BWm the highestflexion moment (+Mx) was seen in K3R during DesSt.
3.1.4. Abduction–adduction moments My (Fig. 4B)
In the frontal plane, abduction moments +My were highest duringKneeB (1.61% BWm) followed by StUp (1.39% BWm), AscSt (1.26%BWm), DesSt (1.04% BWm), SitD (1.14% BWm) and LevWalk (1.0%BWm).
High adduction moments �My were observed duringall activities which include temporary single legged stance.
AscSt/DesSt led to moments of �2.58/�2.57% BWm. During1LegSt/LevWalk slightly higher values of �2.88/�2.91% BWmwere measured. Smaller moments acted during StUp (�0.97%BWm), KneeB (�0.91% BWm) and SitD (�0.77% BWm). With anabsolute maximum of �4.62% BWm, the highest adductionmoment �My was observed in K2L during DesSt. As seen for Fy
the component My did not change its sign during 1LegSt.Throughout all activities, highest adduction moments (�My)were observed in K2L, highest abduction moments (+My) in K4R.
3.1.5. External–internal rotation moment Mz (Fig. 4C)
Highest rotation moments acted during LevWalk. Theytypically changed from +0.53% BWm during the early stancephase to �1.1% BWm at late stance. AscSt also caused highinternal rotation moments �Mz of �0.92% BWm. For all otheractivities internal rotation moments �Mz lay between �0.22%and �0.66% BWm. External rotation moments +Mz were typicallysmaller, and reached values between 0.07% and 0.53% BWm.

Lateral Shear Force +Fx
-50
-40
-30
-20
-10
0
10
20
30
40
Two leggedstance
Sitting down
Standing up
Knee bend One leggedstance
Levelwalking
Ascendingstairs
Descendingstairs
Absolute Max Absolute Min
Average(Max) Average(Min)
Medial Shear Force -Fx
Fx [%
BW]
-70
-60
-50
-40
-30
-20
-10
0
10
20
30
40
50
Two leggedstance
Sitting down
Standing up
Knee bend One leggedstance
Levelwalking
Ascendingstairs
Descendingstairs
Posterior Shear Force -Fy
Anterior Shear Force +Fy
Fy [%
BW]
Resultant Force F
0
50
100
150
200
250
300
350
400
450
Two leggedstance
Sitting down
Standing up
Knee bend One leggedstance
Levelwalking
Ascendingstairs
Descendingstairs
K1L
K2L
K3R
K4R
K5R
Absolute Max
Absolute Min
Average
F [%
BW
]
Fig. 3. Peak forces during investigated activities. Data from 5 subjects. A¼resultant force F, B¼medio-lateral force Fx, C¼antero-posterior force Fy. Large/small
symbols¼average maximum/minimum from several trials of 1 subject (‘individual’ forces). Thin lines¼average values from all subjects and trials (‘typical forces’). Thick
lines¼absolute maximum/minimum values from all subjects and trials. Peak values of component �Fz are nearly identical to those of F.
I. Kutzner et al. / Journal of Biomechanics 43 (2010) 2164–2173 2167

-3
-2
-1
0
1
2
3
4
5
6
7
Two leggedstance
Sitting down
Standing up
Knee bend One leggedstance
Levelwalking
Ascendingstairs
Descendingstairs
K1L K2LK3R K4RK5R Absolute MaxAbsolute Min Average(Max)Average(Min)
Flexion Moment +Mx
Extension Moment -Mx
Mx
[%B
Wm
]
-6
-5
-4
-3
-2
-1
0
1
2
3
4
5
Two leggedstance
Sitting down
Standing up
Knee bend One leggedstance
Levelwalking
Ascendingstairs
Descendingstairs
Abduction Moment +My
Adduction Moment -My
My
[%B
Wm
]
-2.0
-1.5
-1.0
-0.5
0.0
0.5
1.0
1.5
Two leggedstance
Sitting down
Standing up
Knee bend One leggedstance
Levelwalking
Ascendingstairs
Descendingstairs
Internal Torque -Mz
External Torque +Mz
Mz
[%B
Wm
]
Fig. 4. Peak moments during investigated activities. Data from 5 subjects. A¼flexion/extension moment Mx, B¼abduction/adduction moment My, C¼external/internal
rotation moment Mz. Large/small symbols¼average maximum/minimum from several trials of 1 subject (‘individual’ moments). Thin lines¼average values from all
subjects and trials (‘typical’ moments). Thick lines¼absolute maximum/minimum values from all subjects and trials.
I. Kutzner et al. / Journal of Biomechanics 43 (2010) 2164–21732168

300
200
100
200
100
300
200
100
-100
-200
-100
-200
-100
-200
4.0
2.0
0
-2.0
2.0
0
-2.0
2.0
0
-2.00 1 2 3 4 5 0 1 2 3 4 5
0 1 2 3 4 5 6
6 7 8
0
0
0
250200150100
500
-50-100-150-200
2.0
0
-2.0
0 0.2 0.4 0.6 0.8 1 1.2 1.4 1.6
0 0.2 0.4 0.6 0.8 1 1.2 1.4 1.6
400
300
200
100
0
-100
-200
-300
4.0
2.0
0
-2.0
400
300
200
100
0
-100
-200
-300
4.0
2.0
0
-2.0
0 0.25 0.5 0.75 1 1.25 1.5 1.75 2
Forces [%BW]
Forces [%BW]
Forces [%BW] Forces [%BW]
Forces [%BW]
Forces [%BW]
Moments [%BW*m]
Moments [%BW*m]
Moments [%BWm] Moments [%BWm]
Moments [%BW*m]
Moments [%BWm]
Time [s] Time [s]
Time [s]Time [s]
Time [s]
Time [s]
Time [s] Time [s]
Time [s]Time [s]
Time [s]
Time [s]
2 legs
Descending
CTO CSC CTO
CTOHS
CSC
CHS
Ascendingmax.
Flexion
1 leg
Two & one leggedstance
Knee bend
Ascending stairs Descending stairs
Level Walking
Standing up Sitting down2 legs
Mx My Mz M
Mx My Mz M
Mx My Mz M Mx My Mz M
Mx My Mz M
Mx My Mz M
Fx Fy Fz F
Fx Fy Fz F
Fx Fy Fz F Fx Fy Fz F
Fx Fy Fz F
Fx Fy Fz F
Fig. 5. Load patterns during investigated activities. Upper diagrams¼ forces, lower diagrams¼moments. Exemplary trials from K5R. HS: heel strike; CTO: contralateral toe
off; CHS: contralateral heel strike; CSC: contralateral stair contact.
I. Kutzner et al. / Journal of Biomechanics 43 (2010) 2164–2173 2169
I. Kutzner et al. / Journal of Biomechanics 43 (2010) 2164–21732170
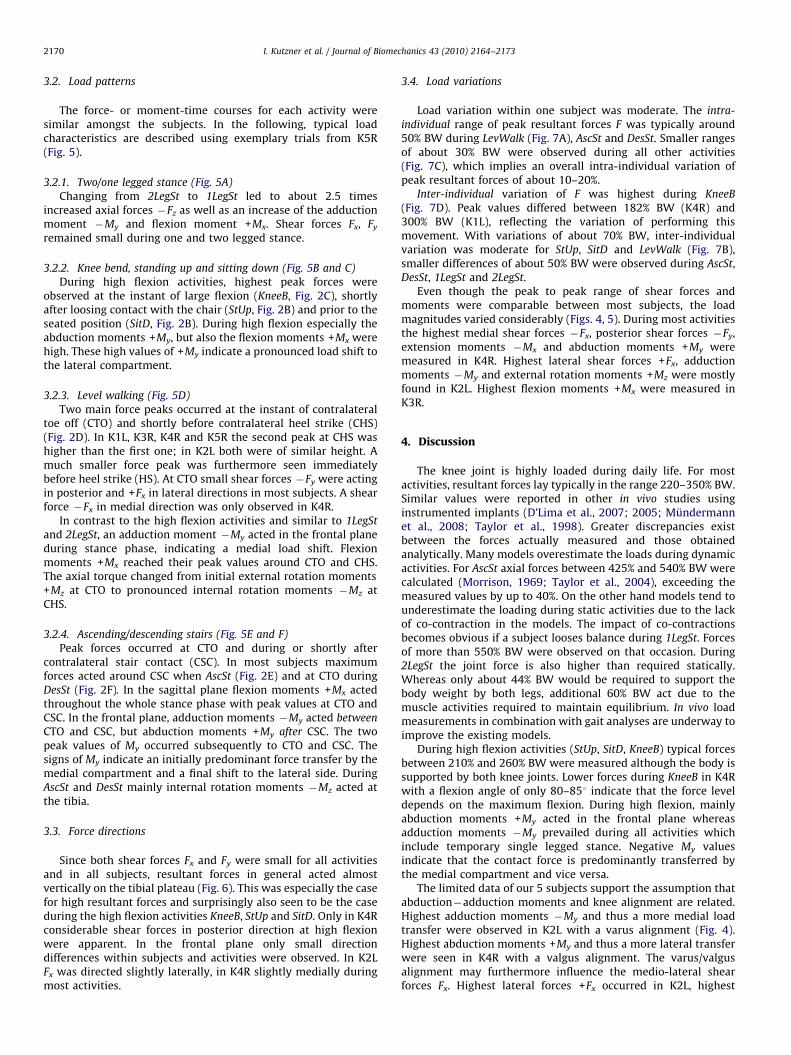
3.2. Load patterns
The force- or moment-time courses for each activity weresimilar amongst the subjects. In the following, typical loadcharacteristics are described using exemplary trials from K5R(Fig. 5).
3.2.1. Two/one legged stance (Fig. 5A)
Changing from 2LegSt to 1LegSt led to about 2.5 timesincreased axial forces �Fz as well as an increase of the adductionmoment �My and flexion moment +Mx. Shear forces Fx, Fy
remained small during one and two legged stance.
3.2.2. Knee bend, standing up and sitting down (Fig. 5B and C)
During high flexion activities, highest peak forces wereobserved at the instant of large flexion (KneeB, Fig. 2C), shortlyafter loosing contact with the chair (StUp, Fig. 2B) and prior to theseated position (SitD, Fig. 2B). During high flexion especially theabduction moments +My, but also the flexion moments +Mx werehigh. These high values of +My indicate a pronounced load shift tothe lateral compartment.
3.2.3. Level walking (Fig. 5D)
Two main force peaks occurred at the instant of contralateraltoe off (CTO) and shortly before contralateral heel strike (CHS)(Fig. 2D). In K1L, K3R, K4R and K5R the second peak at CHS washigher than the first one; in K2L both were of similar height. Amuch smaller force peak was furthermore seen immediatelybefore heel strike (HS). At CTO small shear forces �Fy were actingin posterior and +Fx in lateral directions in most subjects. A shearforce �Fx in medial direction was only observed in K4R.
In contrast to the high flexion activities and similar to 1LegSt
and 2LegSt, an adduction moment �My acted in the frontal planeduring stance phase, indicating a medial load shift. Flexionmoments +Mx reached their peak values around CTO and CHS.The axial torque changed from initial external rotation moments+Mz at CTO to pronounced internal rotation moments �Mz atCHS.
3.2.4. Ascending/descending stairs (Fig. 5E and F)
Peak forces occurred at CTO and during or shortly aftercontralateral stair contact (CSC). In most subjects maximumforces acted around CSC when AscSt (Fig. 2E) and at CTO duringDesSt (Fig. 2F). In the sagittal plane flexion moments +Mx actedthroughout the whole stance phase with peak values at CTO andCSC. In the frontal plane, adduction moments �My acted between
CTO and CSC, but abduction moments +My after CSC. The twopeak values of My occurred subsequently to CTO and CSC. Thesigns of My indicate an initially predominant force transfer by themedial compartment and a final shift to the lateral side. DuringAscSt and DesSt mainly internal rotation moments �Mz acted atthe tibia.
3.3. Force directions
Since both shear forces Fx and Fy were small for all activitiesand in all subjects, resultant forces in general acted almostvertically on the tibial plateau (Fig. 6). This was especially the casefor high resultant forces and surprisingly also seen to be the caseduring the high flexion activities KneeB, StUp and SitD. Only in K4Rconsiderable shear forces in posterior direction at high flexionwere apparent. In the frontal plane only small directiondifferences within subjects and activities were observed. In K2LFx was directed slightly laterally, in K4R slightly medially duringmost activities.
3.4. Load variations
Load variation within one subject was moderate. The intra-
individual range of peak resultant forces F was typically around50% BW during LevWalk (Fig. 7A), AscSt and DesSt. Smaller rangesof about 30% BW were observed during all other activities(Fig. 7C), which implies an overall intra-individual variation ofpeak resultant forces of about 10–20%.
Inter-individual variation of F was highest during KneeB
(Fig. 7D). Peak values differed between 182% BW (K4R) and300% BW (K1L), reflecting the variation of performing thismovement. With variations of about 70% BW, inter-individualvariation was moderate for StUp, SitD and LevWalk (Fig. 7B),smaller differences of about 50% BW were observed during AscSt,DesSt, 1LegSt and 2LegSt.
Even though the peak to peak range of shear forces andmoments were comparable between most subjects, the loadmagnitudes varied considerably (Figs. 4, 5). During most activitiesthe highest medial shear forces �Fx, posterior shear forces �Fy,extension moments �Mx and abduction moments +My weremeasured in K4R. Highest lateral shear forces +Fx, adductionmoments �My and external rotation moments +Mz were mostlyfound in K2L. Highest flexion moments +Mx were measured inK3R.
4. Discussion
The knee joint is highly loaded during daily life. For mostactivities, resultant forces lay typically in the range 220–350% BW.Similar values were reported in other in vivo studies usinginstrumented implants (D’Lima et al., 2007; 2005; Mundermannet al., 2008; Taylor et al., 1998). Greater discrepancies existbetween the forces actually measured and those obtainedanalytically. Many models overestimate the loads during dynamicactivities. For AscSt axial forces between 425% and 540% BW werecalculated (Morrison, 1969; Taylor et al., 2004), exceeding themeasured values by up to 40%. On the other hand models tend tounderestimate the loading during static activities due to the lackof co-contraction in the models. The impact of co-contractionsbecomes obvious if a subject looses balance during 1LegSt. Forcesof more than 550% BW were observed on that occasion. During2LegSt the joint force is also higher than required statically.Whereas only about 44% BW would be required to support thebody weight by both legs, additional 60% BW act due to themuscle activities required to maintain equilibrium. In vivo loadmeasurements in combination with gait analyses are underway toimprove the existing models.
During high flexion activities (StUp, SitD, KneeB) typical forcesbetween 210% and 260% BW were measured although the body issupported by both knee joints. Lower forces during KneeB in K4Rwith a flexion angle of only 80–851 indicate that the force leveldepends on the maximum flexion. During high flexion, mainlyabduction moments +My acted in the frontal plane whereasadduction moments �My prevailed during all activities whichinclude temporary single legged stance. Negative My valuesindicate that the contact force is predominantly transferred bythe medial compartment and vice versa.
The limited data of our 5 subjects support the assumption thatabduction�adduction moments and knee alignment are related.Highest adduction moments �My and thus a more medial loadtransfer were observed in K2L with a varus alignment (Fig. 4).Highest abduction moments +My and thus a more lateral transferwere seen in K4R with a valgus alignment. The varus/valgusalignment may furthermore influence the medio-lateral shearforces Fx. Highest lateral forces +Fx occurred in K2L, highest

One
legg
ed s
tanc
eK
nee
bend
Sta
nd u
p/ s
it do
wn
289%BW
241%BW
261%BW
240%BW
265%BW
299%BW
261%BW
256%BW
185%BW
262%BW
270%BW
229%BW
227%BW
205%BW
247%BW
K1L
Fron
tal P
lane
Sagi
ttal P
lane
Leve
l wal
king
Asc
endi
ng s
tairs
Des
cend
ing
stai
rs
285%BW
223%BW
264%BW
297%BW
236%BW
313%BW
345%BW
298%BW
299%BW
325%BW
359%BW
337%BW
337%BW
323%BW
374%BW
K2L K3R K5RK4R
Fig. 6. Force directions during investigated activities. Selected trials from all 5 subjects. For each activity (lines) and subject (columns) the force vectors are displayed in the
frontal (left) and the sagittal (right) plane. ‘Individual’ peak resultant forces are indicated. Different scales are used.
I. Kutzner et al. / Journal of Biomechanics 43 (2010) 2164–2173 2171

0 20 40 60 80 1000
50
100
150
200
250
300
350
Res
ulta
nt F
orce
[%B
W]
K1LK2LK3RK4RK5R
0 20 40 60 80 1000
50
100
150
200
250
300
Res
ulta
nt F
orce
[%B
W]
0 20 40 60 80 1000
50
100
150
200
250
300
350R
esul
tant
For
ce [%
BW
]
K1L (max. Flexion 90-100°)
K2L (max. Flexion 100-105°)
K3R (max. Flexion 90-95°)
K4R (max. Flexion 80-85°)
K5R (max. Flexion 90-95°)
0 20 40 60 80 1000
50
100
150
200
250
300
350
Res
ulta
nt F
orce
[%B
W]
Level walking (K5R)
Knee bend (K5R)
Level walking (all subjects)
Knee bend (all subjects)
Average force pattern
Normalized time Normalized time
Normalized time Normalized time
Intra-individual range Inter-individual range
Average force pattern
Fig. 7. Variation of resultant force during level walking and knee bending. Left¼ intra-individual variation between several trials of K5R during level walking (A) and knee
bending (C). Thick line¼average from all trials. Right¼ inter-individual variation between average curves of 5 subjects during level walking (B) and knee bending (D). Data
was averaged by time warping.
I. Kutzner et al. / Journal of Biomechanics 43 (2010) 2164–21732172
medial forces �Fx in K4R (Fig. 3). No hint to a correlation betweenthe axis alignment and the axial force Fz, as expected by others(Heller et al., 2003), was found in the present cohort.
The data presented here confirm previous findings (Heinleinet al., 2009) that the international standard protocol for wear testsof tibial inserts underestimates the axial torque Mz. Whereas apeak-to-peak moment of 7 N m is defined in the ISO standard(ISO14243-1, 2002) typical peak-to-peak moments of 15 N mwere now measured, with individual values of up to 19 N m andan absolute range of even 29 N m. The signs of the axial torque andall other load components change within each load cycle duringmost activities. This is detrimental for bone-implant interfacestresses and polyethylene wear and should be considered whentesting knee implants.
The reported data were obtained with a specific implantdesign and cannot be transferred directly to other implants or the
natural knee. The cruciate ligaments were sacrificed andchanged gait patterns are possible. Changes of passive softtissue structures such as the collateral ligaments may alsoinfluence the contact loads. The axial force Fz and the resultantforce F will most likely not be affected much by the type of TKR,however. In vivo load measurements in different, posteriorcruciate retaining TKR, indeed resulted in similar values of F
(D’Lima et al., 2007, 2005; Mundermann et al., 2008). Because ofthe ultra-congruent tibial insert of our implant the largestdifferences were expected for the shear forces Fx and Fy.Surprisingly the anterior shear forces +Fy, which were measuredin the cruciate retaining implant (D’Lima et al., 2007), were also ina similar range as those from our data. This implies that only asmall part of +Fy is transferred trough the remaining cruciateligament. No final conclusions, however, can be drawn due to thelimited number of subjects.

I. Kutzner et al. / Journal of Biomechanics 43 (2010) 2164–2173 2173
The given information is the most comprehensive data set ofin vivo knee joint loading so far. Investigations in more subjectsare currently performed to even broaden this data collection andto deepen the understanding of knee joint biomechanics.
Conflict of interest statement
This study was supported by Zimmer GmbH, Winterthur,Switzerland. Except from funding, the sponsor was not involvedin study design, collection, analysis and interpretation of data, oranything related to this manuscript.
Acknowledgments
The authors gratefully acknowledge the voluntary collabora-tion of all subjects and the technical support of Jorn Dymke. Thisstudy was supported by Zimmer GmbH, Switzerland.
References
Colebatch, A.N., Hart, D.J., Zhai, G., Williams, F.M., Spector, T.D., Arden, N.K., 2009.Effective measurement of knee alignment using AP knee radiographs. TheKnee 16, 42–45.
Costigan, P.A., Deluzio, K.J., Wyss, U.P., 2002. Knee and hip kinetics during normalstair climbing. Gait & Posture 16, 31–37.
D’Lima, D.D., Patil, S., Steklov, N., Chien, S., Colwell Jr., C.W., 2007. In vivo kneemoments and shear after total knee arthroplasty. Journal of Biomechanics 40,S11–S17.
D’Lima, D.D., Patil, S., Steklov, N., Slamin, J.E., Colwell Jr., C.W., 2005. The ChitranjanRanawat Award: in vivo knee forces after total knee arthroplasty. ClinicalOrthopaedics and Related Research 440, 45–49.
D’Lima, D.D., Patil, S., Steklov, N., Slamin, J.E., Colwell Jr., C.W., 2006. Tibial forcesmeasured in vivo after total knee arthroplasty. Journal of Arthroplasty 21,255–262.
Graichen, F., Arnold, R., Rohlmann, A., Bergmann, G., 2007. Implantable 9-channeltelemetry system for in vivo load measurements with orthopedic implants.IEEE Transactions on Biomedical Engineering 54, 253–261.
Heinlein, B., Graichen, F., Bender, A., Rohlmann, A., Bergmann, G., 2007. Design,calibration and pre-clinical testing of an instrumented tibial tray. Journal ofBiomechanics 40, S4–S10.
Heinlein, B., Kutzner, I., Graichen, F., Bender, A., Rohlmann, A., Halder, A.M., Beier, A.,Bergmann, G., 2009. ESB Clinical Biomechanics Award 2008: complete dataof total knee replacement loading for level walking and stair climbingmeasured in vivo with a follow-up of 6–10 months. Clinical Biomechanics 24,315–326.
Heller, M., Taylor, W., Perka, C., Duda, G., 2003. The influence of alignment on themusculo-skeletal loading conditions at the knee. Langenbeck’s Archives ofSurgery 388, 291–297.
ISO14243-1, Implants for surgery—wear of total knee-joint prostheses; Part 1:loading and displacement parameters for wear-testing machines with loadcontrol and corresponding environmental conditions for test, 2002.
Kuster, M.S., Wood, G.A., Stachowiak, G.W., Gachter, A., 1997. Joint loadconsiderations in total knee replacement. Journal of Bone and Joint Surgery79, 109–113.
Morrison, J.B., 1969. Function of the knee joint in various activities. BiomedicalEngineering 4, 573–580.
Morrison, J.B., 1970. The mechanics of the knee joint in relation to normal walking.Journal of Biomechanics 3, 51–61.
Mundermann, A., Dyrby, C.O., D’Lima, Colwell Jr., C.W., Andriacchi, T.P., 2008. Invivo knee loading characteristics during activities of daily living as measuredby an instrumented total knee replacement. Journal of Orthopaedic Research26, 1167–1172.
Seireg, A., Arvikar, 1975. The prediction of muscular load sharing and jointforces in the lower extremities during walking. Journal of Biomechanics 8,89–102.
Specogna, A.V., Birmingham, T.B., Hunt, M.A., Jones, I.C., Jenkyn, T.R.,Fowler, P.J., Giffin, J.R., 2007. Radiographic measures of knee alignment inpatients with varus gonarthrosis. The American Journal of Sports Medicine 35,65–70.
Taylor, S.J., Walker, P.S., Perry, J.S., Cannon, S.R., Woledge, R., 1998. The forces inthe distal femur and the knee during walking and other activities measured bytelemetry. Journal of Arthroplasty 13, 428–437.
Taylor, W.R., Heller, M.O., Bergmann, G., Duda, G.N., 2004. Tibio-femoral loadingduring human gait and stair climbing. Journal of Orthopaedic Research 22,625–632.
Wang, K., Gasser, T., 1997. Alignment of curves by dynamic time warping. TheAnnals of Statistics 25, 168–171.