Embed Size (px)
Citation preview

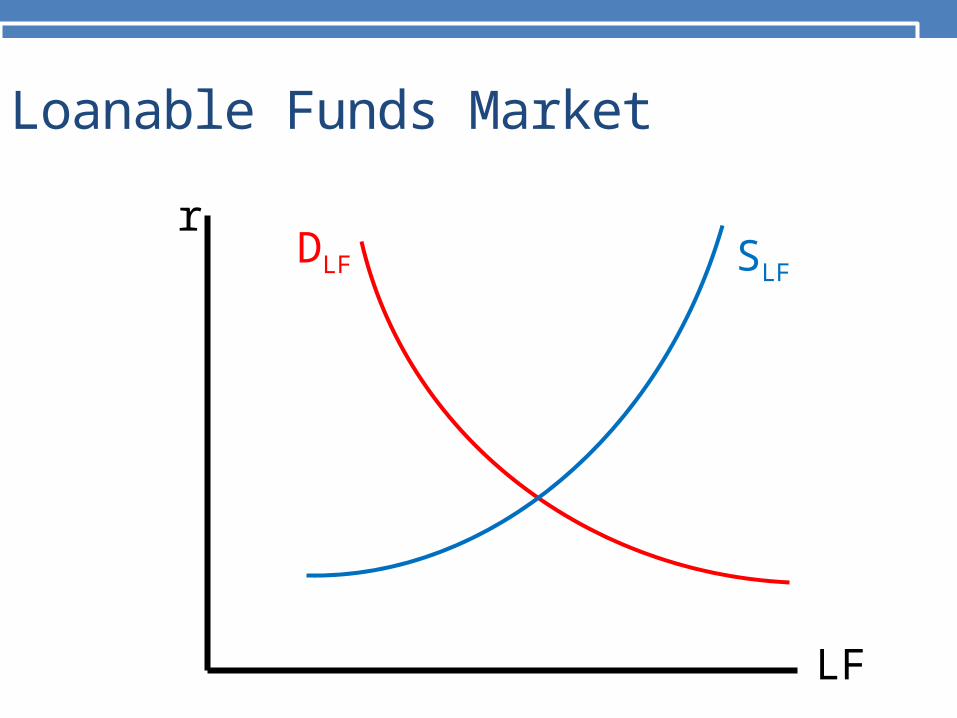
Loanable Funds Market
• Chapter 24

TIPS Bond
• The US Treasury offers bonds whose principal and coupon payments increase with the inflation rate.
• Investors are paid off in terms of real purchasing power.
• Yield is equivalent to a real interest rate.
Additional Information from U.S. Treasury

Falling Yields
1997 1998 1999 2000 2001 2002 37622 37987 38353 38718 39083 39448 39814 40179 40544 40909 41275
-1
0
1
2
3
4
5
10-Year Treasury Inflation-Indexed Security, Constant Ma-turity (DFII10), Percent, Annual, Not Seasonally Adjusted

Loanable Funds Market• Consider the financial market at its broadest and most abstract. • an amalgamation of the bond market and the lending
market (banks, etc.)• Map the relationship between the real interest rate and the quantity of funds that are lent.• Supply curve represents the behavior of savers & lenders• Demand curve represents the behavior of borrowers

Demand Curve: Loanable Funds• Why does the demand curve slope down?• Firms borrow to finance investment projects. If the return on investment falls below the interest rate, the project is not worthwhile. The higher the interest rate, the fewer projects are above the hurdle.
• Households borrow to finance housing. The higher are interest rates, the smaller is the house that the householders can buy with a mortgage payment that they can afford.

Supply Curve: Loanable Funds
•Why does the supply curve slope up?Substitution Effect: When real interest rates offered by banks are high, savers are rewarded with more future consumption and are likely to be induced to save more.
Loanable Funds Market
SLFDLF
LF
r

Closed economy equilibrium
• In closed economy, market forces should cause supply and demand for loanable funds to equilibrate at a real interest rate where supply equals demand.
• Shifts in demand or supply change equilibrium real rate as in standard supply-demand model.
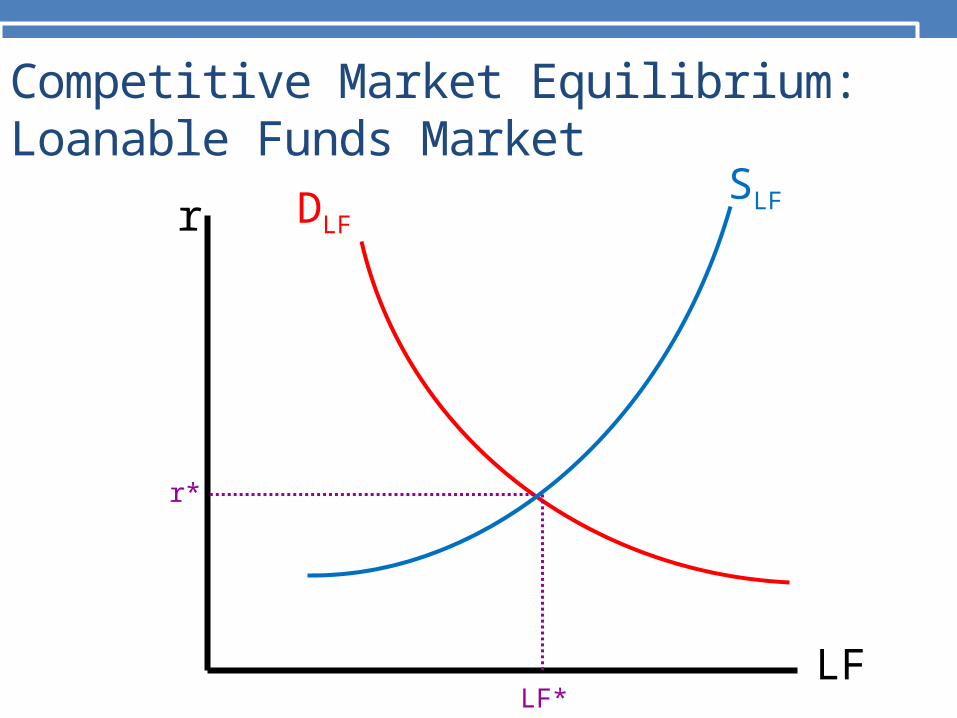
Competitive Market Equilibrium:Loanable Funds Market
SLFDLF
LF
r*
LF*
r
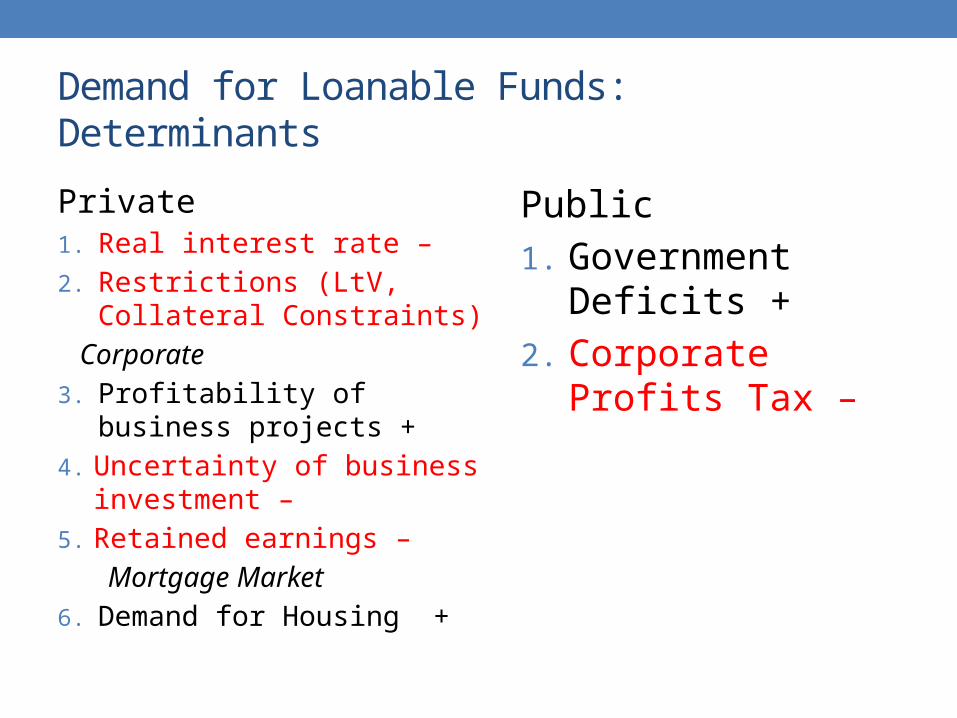
Demand for Loanable Funds: Determinants
Private1. Real interest rate – 2. Restrictions (LtV, Collateral
Constraints) Corporate3. Profitability of business
projects +4. Uncertainty of business
investment – 5. Retained earnings – Mortgage Market6. Demand for Housing +
Public1. Government Deficits + 2. Corporate Profits Tax –
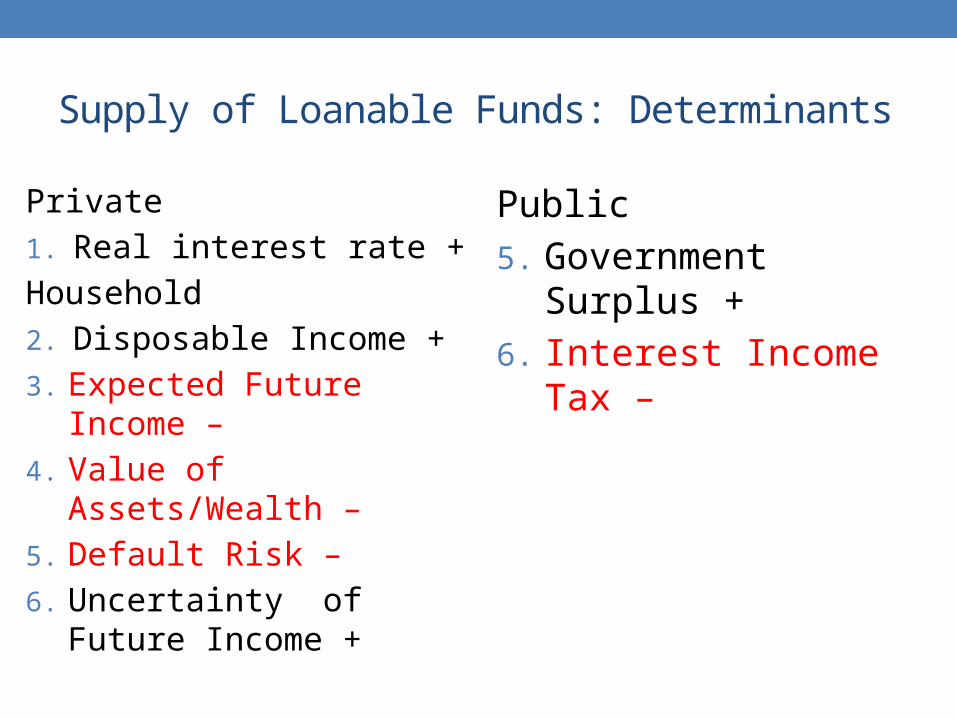
Supply of Loanable Funds: Determinants
Private1. Real interest rate +Household2. Disposable Income +3. Expected Future Income – 4. Value of Assets/Wealth – 5. Default Risk – 6. Uncertainty of Future
Income +
Public5. Government Surplus + 6. Interest Income Tax –

Ex. Uncertainty about Future Capital Infrastructure Investment
SLFDLF
LF
r*
LF*
r
r**
DLF'
LF**
1
2

Consumers become more worried about the future.
DLF
LF
r*
LF*
r
LF**
SLF'
r**
1
2
SLF

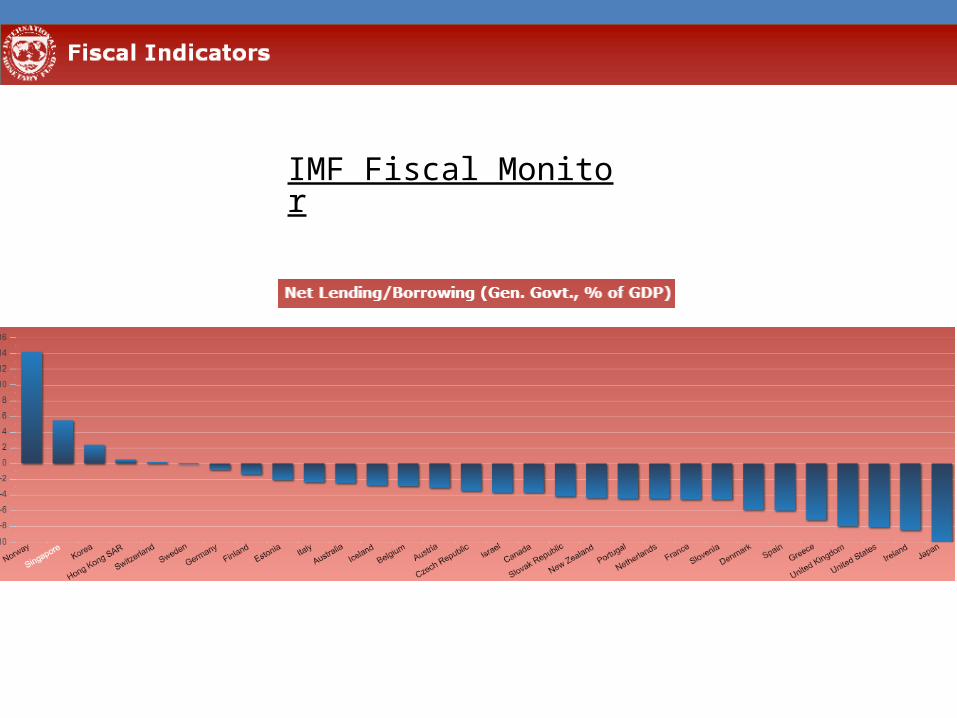
Government Surplus• Government surplus is gap between govt revenue and outlays
and can be positive or negative.• If net positive, it adds to the supply of loanable funds.• If net negative, it adds to the demand for loanable funds.

Example: Swiss Government strikes a deal to raise taxes and cut spending
LF
r**
LF*
r
r*
LF**
1
2
DLF SLFP SLF
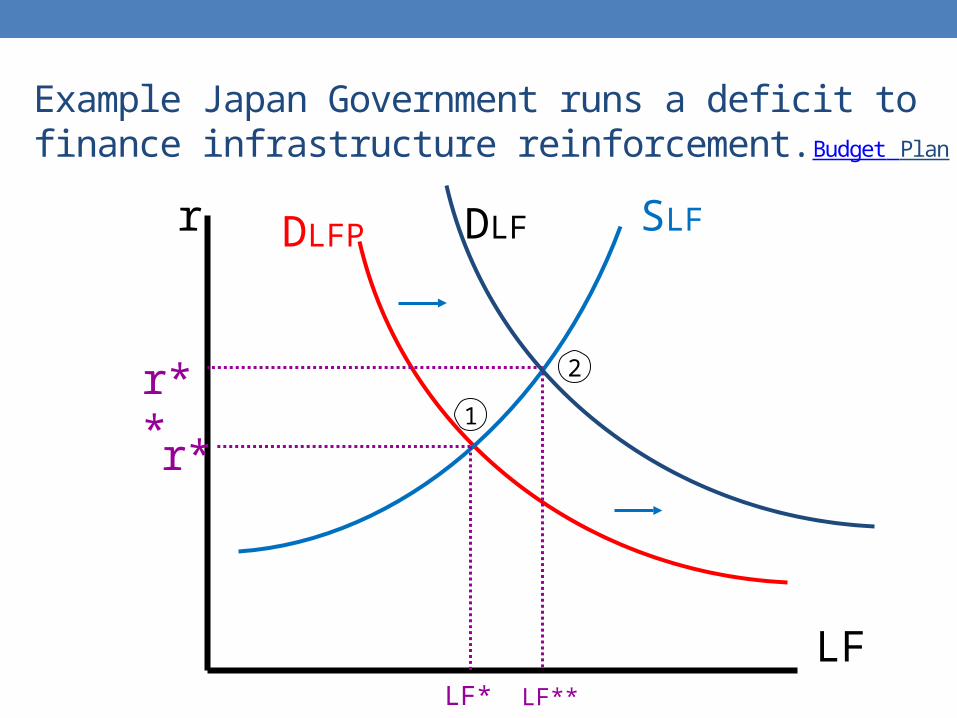
Example Japan Government runs a deficit to finance infrastructure reinforcement.Budget Plan
LF
r*
LF*
r
r**
LF**
1
2
DLFP DLF SLF

Globalization and the Loanable Funds Market
• OUaT, we might have thought of the loanable funds market as being national in nature – especially for large economies. These days it appears that even the USA is part of a single global market. [China possible exception]
• Otherwise take global interest rate as given.

Dec.1977Jun.1980Dec.1982Jun.1985Dec.1987Jun.1990Dec.1992Jun.1995Dec.1997Jun.2000Dec.2002Jun.2005Dec.2007Jun.20100
5000
10000
15000
20000
25000
30000
35000
40000
45000
Summary of International Posi-tions,
Amount Outstanding (In billions of US dollars)
Tota
l Ass
ets
SOURCE: PRELIMINARY REPORT: 27 JULY 2011, BIS REPORTING BANKS HTTP://WWW.BIS.ORG/STATISTICS/BANKSTATS.HTM
Perspectives on Financial Globalization

Mar.1987
Dec.1987
Sep.1988
Jun.1989
Mar.1990
Dec.1990
Sep.1991
Jun.1992
Mar.1993
Dec.1993
Sep.1994
Jun.1995
Mar.1996
Dec.1996
Sep.1997
Jun.1998
Mar.1999
Dec.1999
Sep.2000
Jun.2001
Mar.2002
Dec.2002
Sep.2003
Jun.2004
Mar.2005
Dec.2005
Sep.2006
Jun.2007
Mar.2008
Dec.2008
Sep.2009
Jun.2010
Mar.2011
0
5000
10000
15000
20000
25000
30000
35000
International debt securities - all issuers
(in billions of US dollars)
SOURCE: BIS QUARTERLY REVIEW: 'JUNE 2011TABLE 12A: INTERNATIONAL DEBT SECURITIES - ALL ISSUERSHTTP://WWW.BIS.ORG/STATISTICS/SECSTATS.HTM

21
Growing Exposure of LT interest rates to global economy
“Monetary Policy in Asia and the Pacific in the Post-Post Crisis Era”, Hiro Ito, Portland State, 2013.
Outline

Competitive Market Equilibrium:World Loanable Funds Market
SLFWDLFW
LFLFW
r
rW

National Loanable Funds Markets in a Global World
• How do national economies relate to the global financial market?
1. Countries will face an external interest rate, rW, unaffected by national savings or investment.
2. International lending (borrowing) will make up the gap between savings and investment.

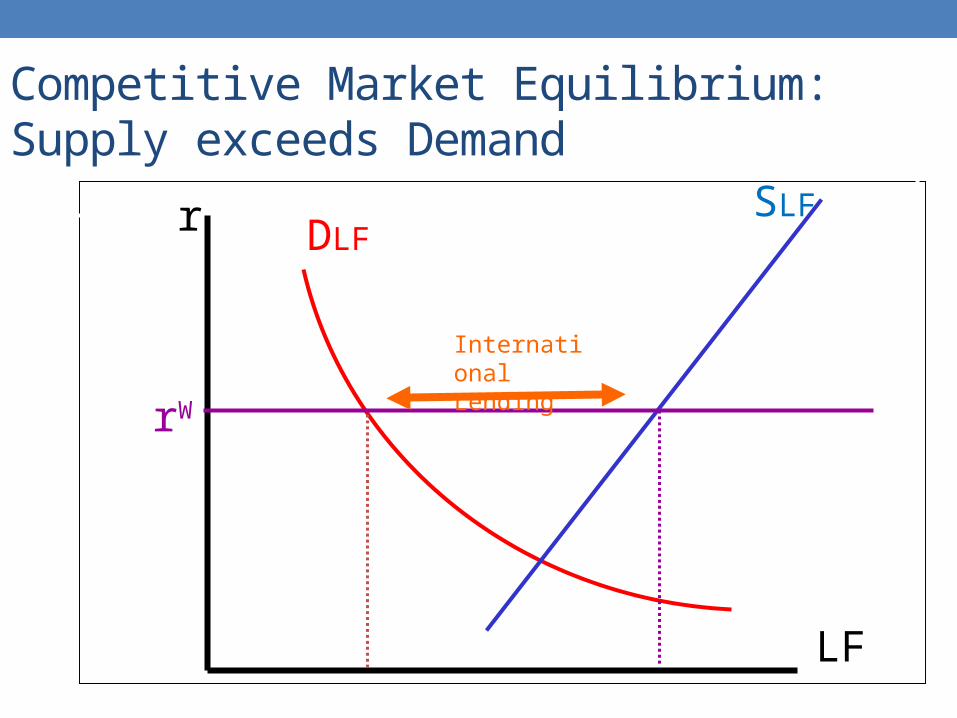
Competitive Market Equilibrium:Demand exceeds Supply
LF
rW
r
International Borrowing
DLF SLF
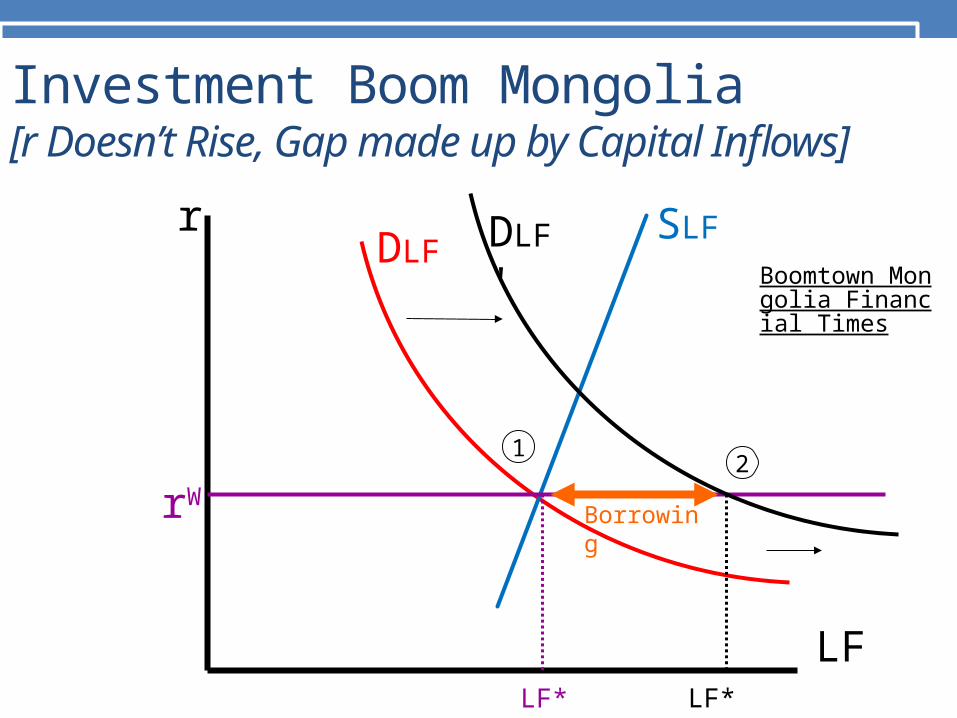
Investment Boom Mongolia[r Doesn’t Rise, Gap made up by Capital Inflows]
LF
rW
LF*
r
LF**
12
Borrowing
DLF DLF' SLF
Boomtown Mongolia Financial Times
Competitive Market Equilibrium:Supply exceeds Demand
LF
rW
r
International Lending
DLFSLF

Oil Fields Running at peak, Norway(r does not fall, gap made up by capital outflows)
LF
rW
r
1
2
DLFSLF
Lending
SLF'
Bloomberg Norway Wealth Fund 40% Bonds

Global LF Market• Only very large changes in large countries or international
trends will have an impact on real interest rates.
Savings Glut• Theory put forth by Fed Chairman explaining the U.S.
trade deficit: Washington Post Article
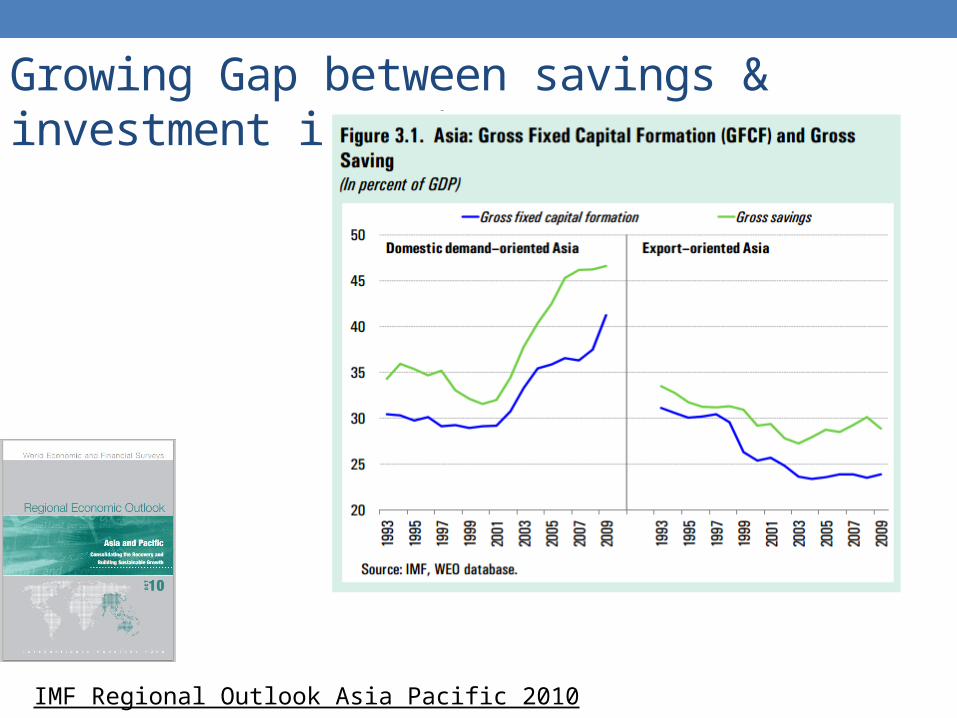
Growing Gap between savings & investment in Asia
IMF Regional Outlook Asia Pacific 2010
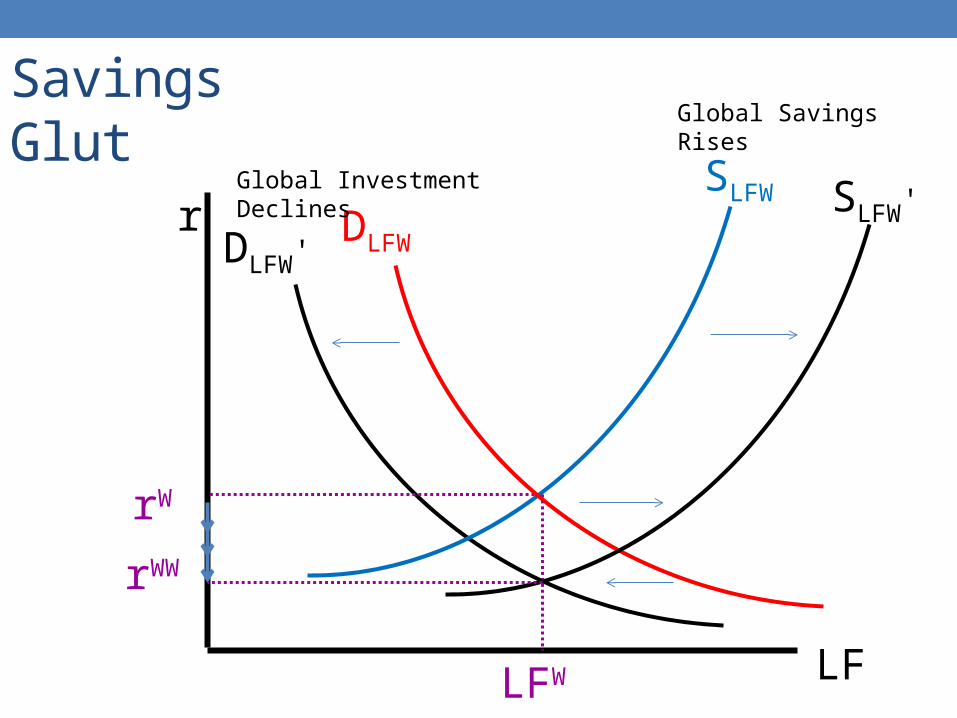
Savings GlutSLFW
DLFW'
LFLFW
r
rW
DLFW
SLFW'
rWW
Global Savings Rises
Global Investment Declines
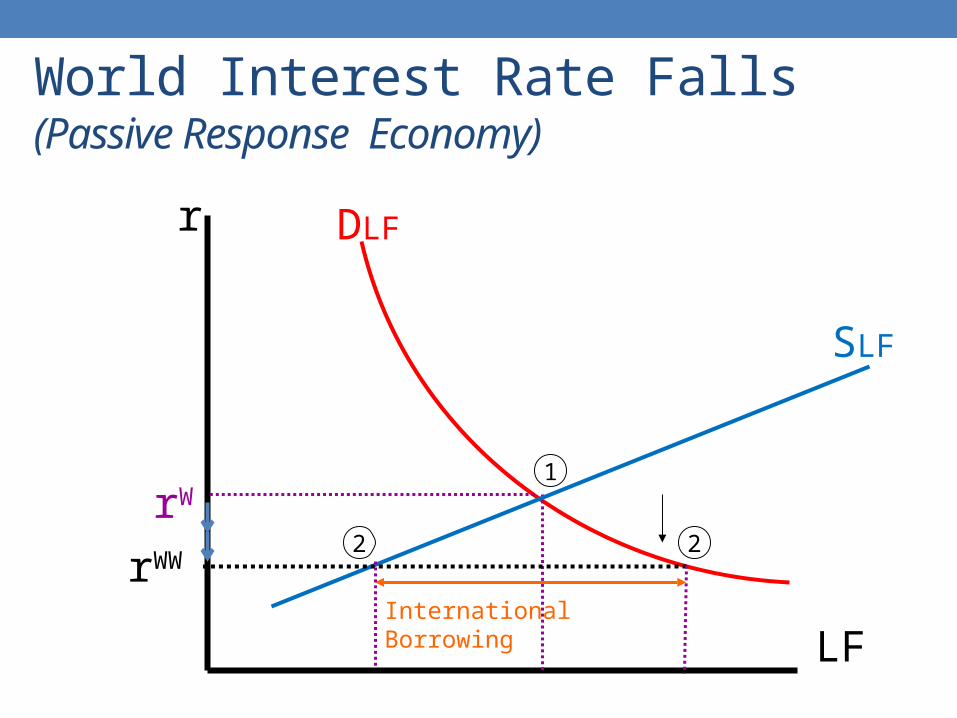
World Interest Rate Falls(Passive Response Economy)
LF
rW
r
1
2rWW
2
DLF
SLF
International Borrowing
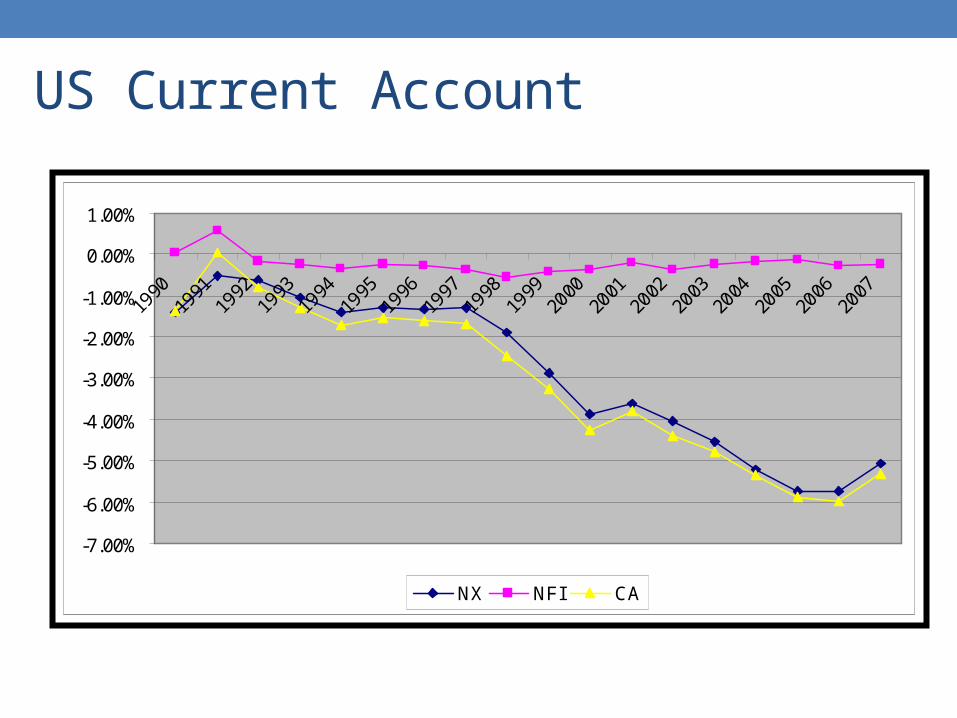
US Current Account
-7.00%
-6.00%
-5.00%
-4.00%
-3.00%
-2.00%
-1.00%
0.00%
1.00%
1990
1991
1992
1993
1994
1995
1996
1997
1998
1999
2000
2001
2002
2003
2004
2005
2006
2007
NX NFI CA

NOMINAL YIELDSOptional

Ex Ante Rate and the Fisher Effect
1EA FORECAST
t t ti r
• Savings and investment decisions must be made before future inflation is known so they must be made on the basis of an ex ante (predicted) real interest rate.
• Fisher Hypothesis: Ex ante real interest rate is determined by forces in the financial market. Money interest rate is just the real ex ante rate plus the market’s consensus forecast of inflation.

Great Inflation of the 1970’s
US Inflation Rates & Interest Rates
0.00
2.00
4.00
6.00
8.00
10.00
12.00
14.00
16.00
18.00
Mar
-55
Mar
-58
Mar
-61
Mar
-64
Mar
-67
Mar
-70
Mar
-73
Mar
-76
Mar
-79
Mar
-82
Mar
-85
Mar
-88
Mar
-91
Mar
-94
Mar
-97
Mar
-00
Mar
-03
%
Interest Rates
Inflation
Source: St. Louis Federal Reserve http://research.stlouisfed.org/fred2/
Great Inflation Download
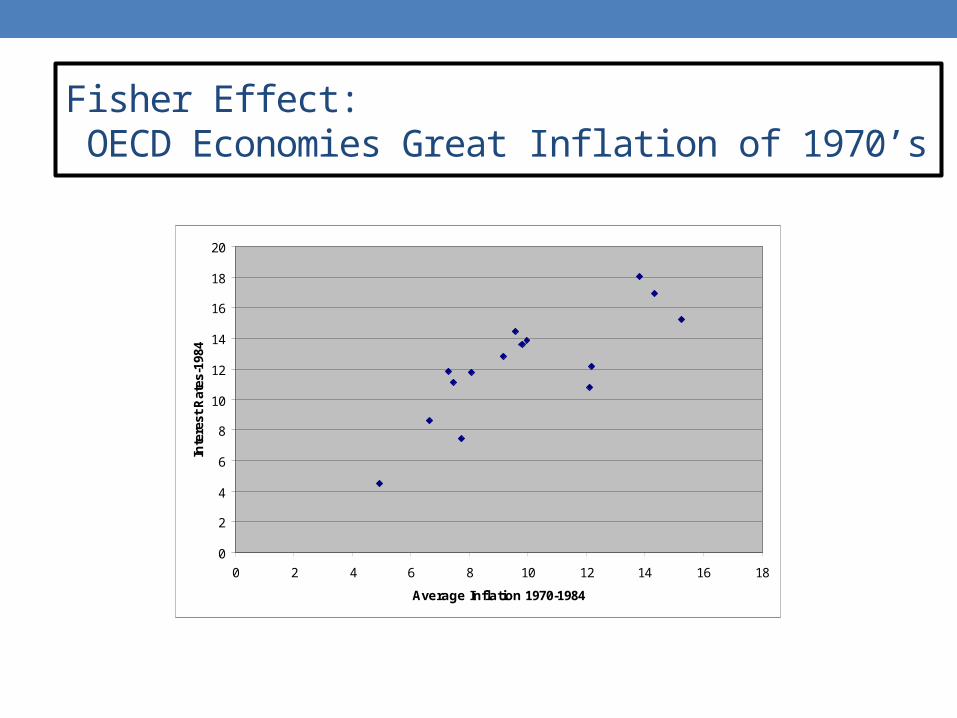
Fisher Effect: OECD Economies Great Inflation of 1970’s
0
2
4
6
8
10
12
14
16
18
20
0 2 4 6 8 10 12 14 16 18
Average Inflation 1970-1984
Inte
rest
Rat
es-1
984

Loanable Funds MarketFisher Effect
LF
r*
LF*
1Et
1Et
i*
DLFSLF
NDLFNSLF

Learning Outcome
• Use the Loanable Funds model to analyze the effects of events on savings, investment, and real interest rates in capital markets.
• Model Global Loanable Funds market and the determinants of current accounts.
• Use expected inflation and the Fisher effect to determine nominal interest rates.