Embed Size (px)
Citation preview
Lobbying Externalities and Competition
Ekaterina Neretina∗
The most recent version: link .
This draft: August 2019
Abstract
I show that lobbying generates negative externalities, which affect non-lobbying companies.When a piece of new legislation passes in Congress, non-lobbying companies in aggregate lose$1.9bn in market value. I obtain this result using a novel dataset combining comprehensiveinformation on corporate lobbying activity with congressional activity on bills. To explainwhy negatively affected companies do not lobby, I identify two frictions that hinder them.First, non-lobbying companies do not represent enough voting power to support politicians inthe elections. Second, trade associations, which could represent their collective interests, arecaptured by companies that lobby individually. I demonstrate this mechanism using uniquehand-collected data on membership in the main trade associations. These findings have impor-tant policy implications: they highlight the economic mechanisms which could be targeted bypolicies regulating corporate lobbying.
JEL codes: D72, P16, L41, G14, G38Keywords: Corporate lobbying, Competition, Economic regulation
∗USC Marshall School of Business; email: [email protected]. I thank my advisor Luc Renneboog,John Matsusaka, and Luigi Zingales for useful comments and discussions. I also thank seminar participantsat the USC Marshall, Chicago Booth, Rochester Simon, Arizona State Carey, Texas A&M Mays, Notre DameMendoza, HEC Paris, Insead, Oxford Saıd, Stockholm School of Economics, Copenhagen Business School,BI Norway, Amsterdam Business School, and participants at the HEC Doctoral Conference. I gratefullyacknowledge financial support from the NWO “Research Talent” Grant #406-15-242. All errors are minealone.
Corporate lobbying is under extensive public scrutiny. It was a key issue in the last two
U.S. presidential campaigns, it is mentioned by the major newspapers more than once a
day on average, and it often features in popular movies and television series.1 This level
of attention has fueled two widespread beliefs: (1) that most corporations lobby, and (2)
that lobbying is expensive. The facts, however, are very different: only 20% of all publicly
listed companies lobby, and lobbying expenses are typically less than $4m per lobbying firm-
Congress. That is peanuts for a publicly listed company, and even more affordable to a group
of companies lobbying together in a trade association such as the National Rifle Association
or the Mortgage Bankers Association.
The fact that relatively few companies lobby raises the question what externalities they
impose on the ones that don’t. After all, lobbying targets regulation, which affects everyone.
Those externalities could be positive if lobbying provides useful information to legislators, or
negative if it persuades them to prioritize the interests of lobbying companies. The fact that
lobbying appears so affordable raises the question why so many companies do not invest in
it. Some frictions must exist, which prevent them from lobbying.
In this paper, I address these questions. I show that non-lobbying companies are nega-
tively affected when a new piece of regulation influenced by lobbying is approved by Congress.
They experience negative stock returns, and the aggregate loss in value per one bill is $1.9bn.
I obtain these results on a comprehensive sample, which I assemble by scraping information
from the websites of the Senate’s Office of Public Records, the Center for Responsive Politics,
and the Library of Congress. My data track lobbying activity and bills targeted by lobbying
across all industries over the period 1999-2016 (106th-114th Congresses), covering 18,564 bills
1Source: Daily newsload is from the Dow Jones Factiva database.
1
out of which 789 become law.
Lobbying externalities are heterogeneous across three dimensions. First, they vary within
industry depending on the degree of competition, measured by product similarity between
lobbying companies and their non-lobbying competitors. The further away competitors are
most negatively affected; and the closest competitors free-ride on lobbying and gain. For
example, lobbying by a petroleum producer is detrimental to “clean energy” companies, but
it is beneficial to other petroleum producers. Similarly, lobbying by internet giants such as
Google, Twitter or Facebook comes with a cost to traditional media companies, but benefits
businesses distributing online content.2 Second, the negative effects are pervasive across
industries, affecting Energy, Finance, Healthcare, and High tech companies the most. Third,
the externalities vary by the nature of the regulated economic activity, which I infer from the
bill text. I group bills into distinctive categories using the Latent Dirichlet Allocation (LDA)
text clustering technique. The largest groups of bills on which the non-lobbying companies
lose in value are related to natural resources, stakeholder protection, and to credit and
financing.
To ensure that my results are not driven by omitted time-varying company characteristics,
I exploit the rich structure of my data. Most lobbying companies in a given Congress lobby
on multiple bills, and their non-lobbying competitors are affected by multiple bills. This
generates within company-Congress variation and allows me to include lobbying company
× Congress fixed effects and non-lobbying company × Congress fixed effects. Those fixed
effects absorb any factors associated with a given company at a given point in time that
2For example, these effects are evident on the American Security and Clean Energy Act, on the StopOnline Piracy Act and the Protect Intellectual Property Act.
2
could drive both returns and lobbying.
I perform additional tests to rule out two alternative explanations to these findings. First,
in a series of checks I show that they are not a product of measurement error. The exter-
nalities for non-lobbying competitor companies are negative under alternative definitions of
lobbying, returns, and industry. They are null for non-competitor companies, which do not
operate in the same industries with the lobbying companies (“placebo group”).
Second, I rule out an alternative explanation that lobbying does not impose externalities,
but merely serves as a regulatory protection. It could be that by lobbying companies obtain
an exemption from restrictive regulation and gain in value, and companies that cannot lobby
lose. If this is the case, any policy aimed at restricting lobbying would not decrease the lobby-
ing externalities, and would only deprive lobbying companies from the regulatory protection.
To rule this out, I develop a test around Barack Obama’s 2009 executive order. The order
prevents politicians formerly employed by the executive agencies and by the executive office
of the President from acting as “revolving door” lobbyists (and vice versa) for two years after
leaving (or before taking) office. The ability to lobby the executive branch affects regulatory
benefits that companies obtain by lobbying as well as the externalities, since this branch
plays an active role in the lawmaking, and it is attracts most lobbying along with the two
Chambers of Congress. I show this in a difference-in-differences-in-differences framework:
after the executive order, non-lobbying competitors to lobbying companies heavily relying
on “revolving door” lobbyists lose in value less around passage of regulation influenced by
lobbying. Since the lobbying restriction associates with lower value losses to the competitors,
the externalities must be imposed by lobbying.
Overall, my first set of findings is consistent with lobbying generating negative external-
3
ities that affect the non-lobbying companies. Given that those companies lose in value, it is
perplexing why they do not lobby. In my second set of results, I present empirical evidence
on two economic frictions that deprive them of access to lobbying. The first friction is that
those companies do not mobilize sufficient voting power to support politicians in the elec-
tions. The second friction is that their collective lobbying via trade associations is captured
by individually-lobbying companies.
Voting power plays an important role, because by lobbying companies hire lobbyists to
convince politicians to alter the regulation, and in return the politicians can rely on votes
mobilized by the companies.3 By altering the regulation in favor of a given company, a
politician can gain electoral support of the company’ employees via at least two channels.
First, employees have a direct incentive to support a politician favoring their employer. Sec-
ond, companies actively encourage their workers to vote for the politician by communicating
information about their preferred candidates (Hertel-Fernandez (2016)).4 These mechanisms
are especially powerful for politically connected companies, because their employees are more
likely to vote in the elections (Babenko et al. (2018)).
If politicians respond to voting power, companies lacking it may not lobby. Consistent
with this argument, I show that within a given electoral area companies with little voting
power are more affected by lobbying externalities. This is especially true where voting power
is more important, i.e. in battleground electoral areas where politicians win or lose with a
small margin of votes, and when bill sponsors seek re-election.
3In comparison, political campaign contributions (PACs) or politically oriented non-profit donations aremade in form of monetary payments.
4“Companies [...] sent letters or information packets to their employees suggesting – and sometimesexplicitly recommending – how they should vote... .” (“Here’s a Memo From the Boss: Vote This Way”,The New York Times, October 26, 2012).
4
When companies cannot lobby individually, they could still combine enough voting power
to lobby together. I show that within electoral areas their aggregate number of employees
typically exceeds the number of employees of their lobbying rival. However, when trying
to coordinate their actions, companies face a moral hazard problem: each of them has an
incentive not to join the collective lobbying effort and free-ride. To avoid this problem, they
can coordinate in a trade association, which lobbies on behalf of all its members.
Setting up and operating the association is costly and again subject to moral hazard.
Thus, it is frequently delegated to large and resource-rich companies with high bargain-
ing power within the association (Wilson (1995)). Those companies often have individual
lobbying access and can choose whether to lobby alone or via the association. When the
regulation affects all the members in a similar way, they have more incentive to lobby via the
association together with other members (Bombardini and Trebbi (2012)). On the contrary,
if the regulation affects them differently, they have more incentive to lobby individually and
also to capture the association to support their interests. As a result, member companies
without individual lobbying access lose the association’s lobbying protection.
To demonstrate this mechanism empirically, I use hand-collected historical company
membership in the 30 largest lobbying trade associations over 1999-2016 from the Internet
Archive: Wayback Machine website. This digital archive stores older versions of the web-
sites of trade associations with historical member lists.5 Using those data, I show that the
association’s members without individual lobbying access gain in value, when most members
lobby together. They lose, when a high fraction of the association’s members lobby alone.
These results support the argument that the organized lobbying is ineffective because the
5The website URL is https://archive.org/web/
5
trade associations are captured by the individually-lobbying companies.
My findings make three contributions. First, I contribute to the literature on corporate
political influence (e.g. Stigler (1971), Shleifer and Vishny (1994), Duchin and Sosyura
(2012), Hill et al. (2013), Faccio and Zingales (2017), Bertrand et al. (2018)). In the context
of lobbying, this literature focuses on characterizing the effects of hiring particular types of
lobbyists (Blanes i Vidal et al. (2012), Bertrand et al. (2014)) and on measuring gains to
the lobbying corporations (Yu and Yu (2011), Borisov et al. (2015), Kang (2015)). Adding
to these studies, my paper is the first to show that lobbying generates externalities, i.e. it
negatively affects non-lobbying competitor companies that face frictions preventing them
from lobbying. The externalities are pervasive across industries and type of regulation.
Second, my results contribute to the public policy debate on regulating corporate political
influence. I show that there are two economic frictions that hinder lobbying and sustain
the negative externalities. The first friction is that the voting power of the non-lobbying
companies is insufficient to reward the politician for making changes to legislation. The
second friction is that the political interests of lobbying trade associations are biased towards
the interest of individually-lobbying companies. These two frictions represent potential areas
that can be targeted by policies designed to decrease the negative effects of lobbying.
Third, my results address the question why observed lobbying expenses are low, and
contribute to the debate on why “there is so little money in politics” (Ansolabehere et al.
(2003), Bertrand et al. (2018)). The frictions restrict political access and grant the ability to
lobby to a relatively small group of companies. As in a simple monopsonostic setting with
only a few buyers, the resulting lobbying expenses are not competitive and low.
The paper is organized as follows. Section 1 describes in detail the data, my measure of
6
lobbying, and presents descriptive statistics on lobbying and congressional activity. Section
2 shows the empirical results on lobbying externalities, documents the heterogeneity in ex-
ternalities based on the degree of competition, industry, and type of regulation, and presents
the robustness tests. Section 3 provides the evidence on the frictions hindering lobbying.
Section 4 concludes.
1. Data and empirical approach
1.1. Data and sample
To measure the externalities from lobbying I need to observe (1) companies and trade asso-
ciation lobbying on regulation and their lobbying expenses, (2) bill characteristics, and (3)
competitor companies. I assemble these data in several steps. First, I obtain names of the
lobbying organizations, including companies and other interest groups, and the lists of bills
they lobby on. This information is publicly available since lobbying activity is reported on
a quarterly basis with the Senate’s Office of Public Records (SOPR) under the Lobbying
Disclosure Act of 1995. For each organization, I first scrape a set of links to SOPR quarterly
reports from the website of a non-profit political watchdog – the Center for Responsive Poli-
tics (CRP). Then, I use those links to gather the information for the sample years 2008-2016.6
To extend the panel, I scrape annual data from the CRP website available back to 1999.7
The resulting dataset contains the names of lobbying organizations, their expenses and all
the bills they lobbied on over the years 1999-2016 (106th - 114th Congresses Congresses).
6The reports for earlier years come in low quality PDF files.7The year 1998, which is also available, mostly omits the bills targeted by lobbying. I repeat my analysis
using yearly data also for 2008-2016, and obtain similar results.
7
Both the lobbying reports and the CRP website provide names of the lobbying organi-
zations, but do not distinguish their type. I identify which names belong to publicly listed
companies by fuzzy-matching them with the firm names in the Center for Research in Se-
curity Prices (CRSP) database. The Appendix A.1 provides the details. The final sample
contains 1,312 publicly listed companies lobbying on 18,564 bills, 789 of which were signed
into law.
Second, I obtain information on the bills targeted by lobbying, by mapping each bill into
the Library of Congress (LOC). I gather the data on the roll call voting, and the bill texts.
To identify the lawmakers who can affect a given bill, I gather the names of bill sponsors
or co-sponsors, who introduce and support the bills, and lists of the committees, who can
amend the bills. I also obtain names of the politicians assigned to the committees from the
website of Professor Charles Stewart III.8
Third, I determine the non-lobbying competitors to the lobbying companies. For each
lobbying company at the start of each Congress, I focus on the competitors that do not
lobby on any bill during the Congress and operate in the same industry as the lobbying
company. I use the industry definition of Hoberg and Phillips (2010, 2016), which is based
on pairwise similarity between companies’ product descriptions in the yearly 10-K reports.9
The advantage of using product similarity is that it identifies competing companies from
different SIC codes, which can also be affected by lobbying. For example, lobbying by oil
and gas producers in SIC 13 (Oil and Gas Extraction) can affect wind power generating
companies in SIC 49 (Electric, Gas and Sanitary Services). Also, the product similarity is
8The website URL is http://web.mit.edu/17.251/www/data_page.html9The measure of product similarity between companies is downloaded from the website of Gerard Hoberg
and Gordon Phillips. The website URL is http://hobergphillips.usc.edu/
8
time-varying and reflects changes in industry competition. For example, an investment in
renewable energy infrastructure by an oil and gas company will be reflected in its 10-K report,
and in the product similarity. In the sample, there are 7,187 non-lobbying competitors.10
Finally, I hand-collect historical membership in the 30 top trade associations over my
sample period. Those associations account for a meaningful part of all the trade associations’
lobbying. Their combined lobbying expenses exceed 30% of lobbying expenses made by all
the associations; and the expenses of the next largest association account for less than 0.1%.
Typically trade associations disclose their current membership lists on their websites, but
they do not provide information on their historical membership. I retrieve older versions of
their websites available on the Digital Internet Archive: Wayback Machine website.11
1.2. Measuring lobbying
My measure of lobbying reflects the aggregate lobbying pressure on the bill. I construct this
measure in two steps. First, I compute how much a given company spends on lobbying a
bill. Second, I aggregate the expenses across all the companies.
To compute how much a company i spends on lobbying a bill b, I first use the information
from the SOPR quarterly lobbying reports for 2008-2016. When a company i in a calendar
quarter q hires lobbyists to target a set of bills B, the lobbyists’ firm files a quarterly
report reflecting this information. For example, in the first quarter of 2016, General Electric
Co. (GE) paid $50,000 to lobbyists of Signal Group (Dollar spendingifq) for lobbying on the
Energy Policy Modernization Act and the North American Energy Security & Infrastructure
10If a given company is a competitor to multiple lobbying companies on the bill, I keep the observationwith the highest product similarity.
11The website URL is https://archive.org/web/
9
Act (set B), or two bills (n(B)). This information is reflected in the Signal Group’s quarterly
report for GE. I approximate the per-bill expenses of GE in the report by dividing the $50,000
by the number of bills, which is two in this case. Then, I compute how much GE spends
lobbying on a particular bill by adding up all GE’s per-bills expenses from all the reports
mentioning the Act (b ∈ B):
Company expensesib =F∑
f=1
8∑q=1
Dollar spendingifq|b∈B
n(B)ifq|b∈B(1)
where F is the total number of the i’s reports. For the years 1999-2007, I compute also
Company expensesib based on the CRP lobbying data, which is less granular.12
To measure the aggregate lobbying pressure on a given bill, I add up the expenses by all
the lobbying companies and take the natural logarithm of the sum:
Lobbyingb = log
(1 +
N∑i=1
Company expensesib
)(2)
1.3. Summary statistics
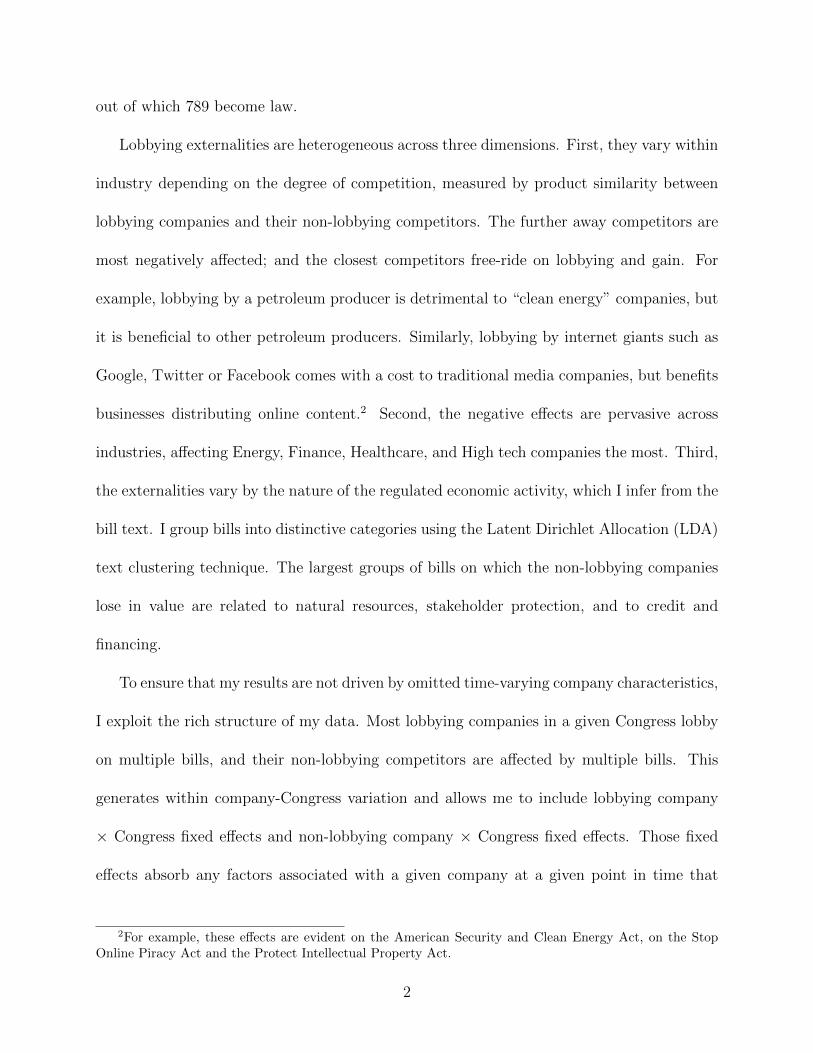
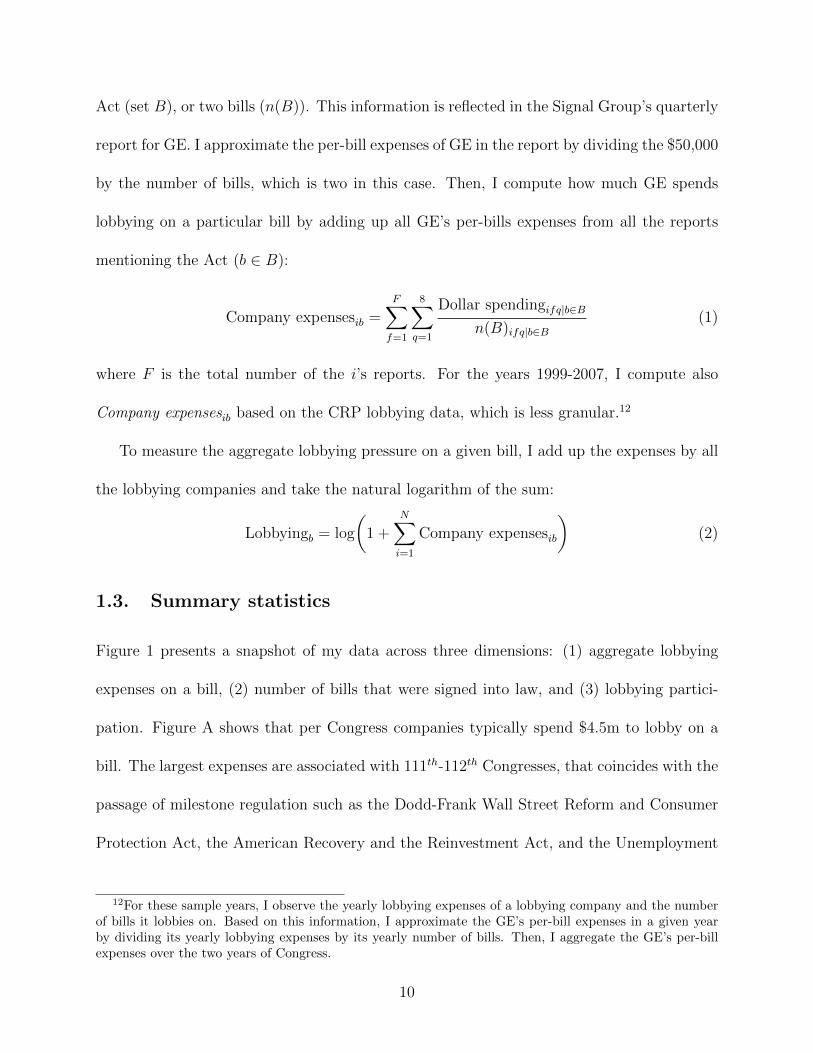
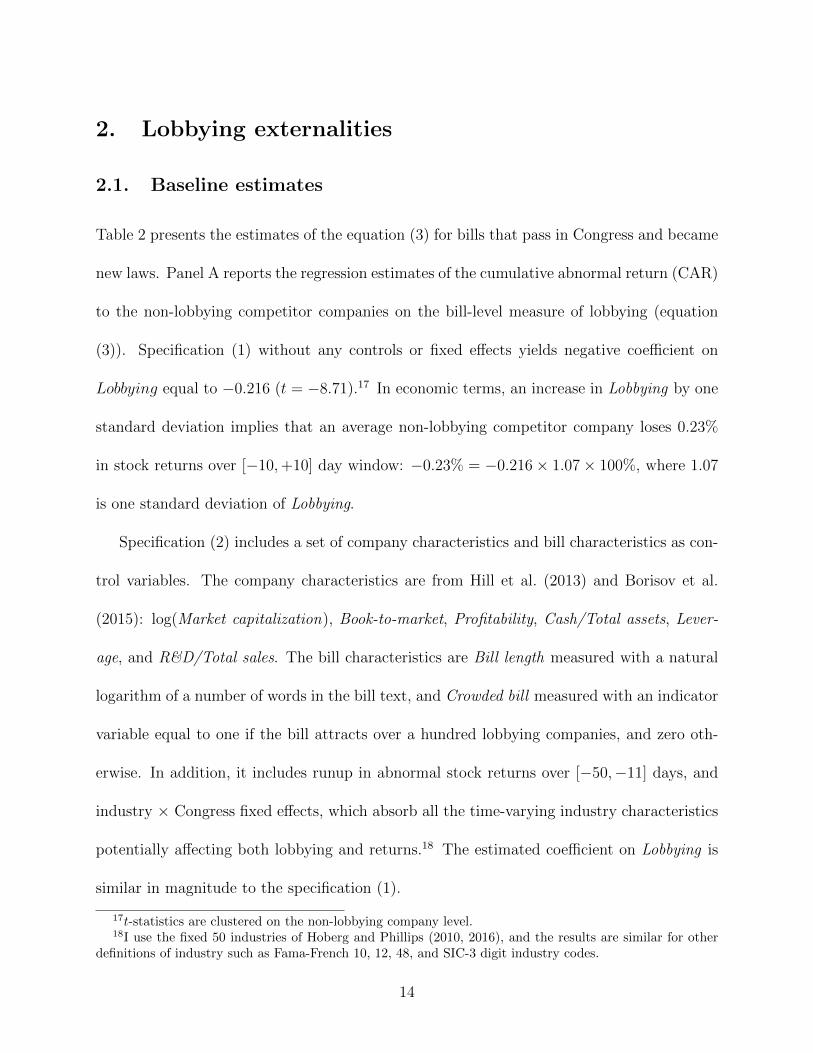
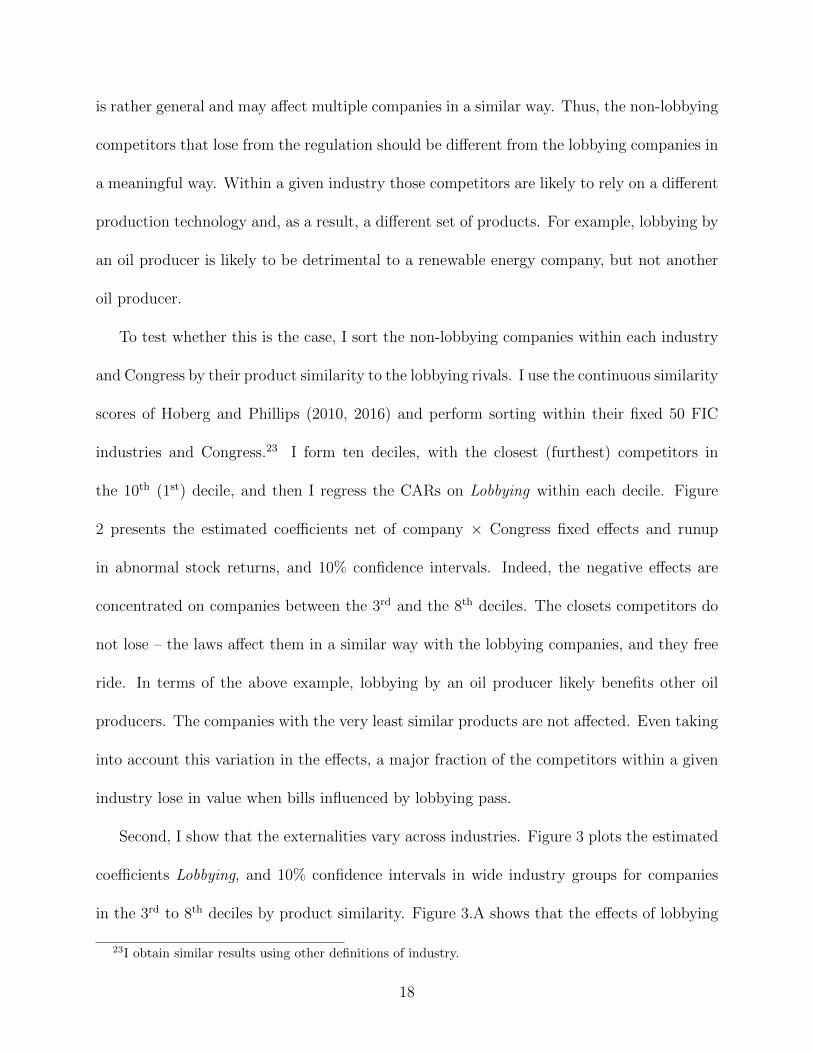
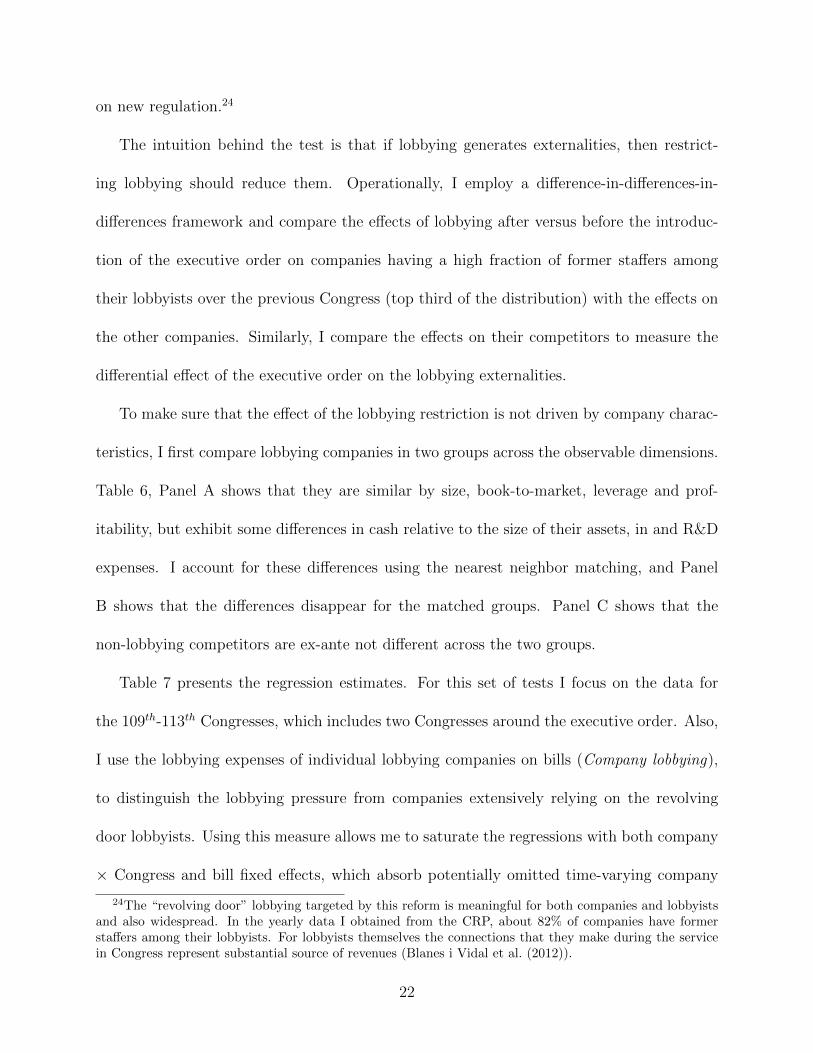
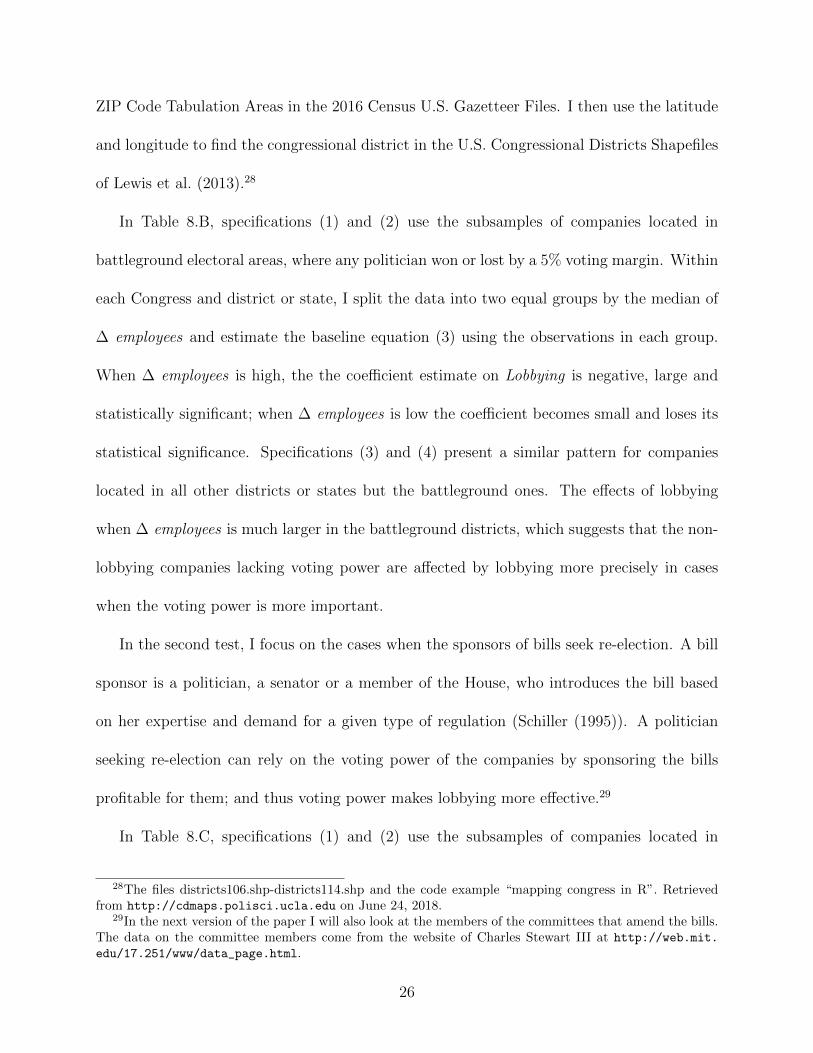
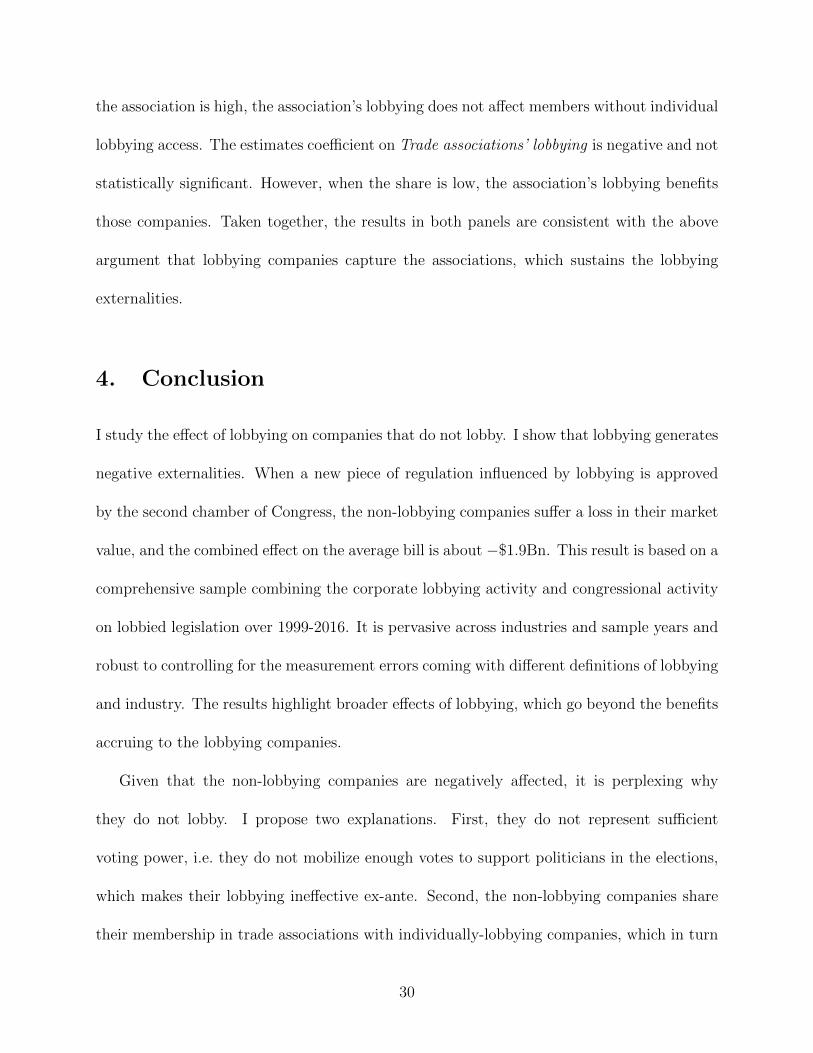
Figure 1 presents a snapshot of my data across three dimensions: (1) aggregate lobbying
expenses on a bill, (2) number of bills that were signed into law, and (3) lobbying partici-
pation. Figure A shows that per Congress companies typically spend $4.5m to lobby on a
bill. The largest expenses are associated with 111th-112th Congresses, that coincides with the
passage of milestone regulation such as the Dodd-Frank Wall Street Reform and Consumer
Protection Act, the American Recovery and the Reinvestment Act, and the Unemployment
12For these sample years, I observe the yearly lobbying expenses of a lobbying company and the numberof bills it lobbies on. Based on this information, I approximate the GE’s per-bill expenses in a given yearby dividing its yearly lobbying expenses by its yearly number of bills. Then, I aggregate the GE’s per-billexpenses over the two years of Congress.
10
Compensation Extension Act. Figure B plots the number of bills passed in each Congress,
and the average number of bills passed per Congress, which is 90. Congresses 109th-111th
are the busiest with 117, 146 and 125 new laws respectively.
Figures C and D show that lobbying expenses on a bill come from only 7% of companies
potentially affected by the bill.13 The other 93% are the non-lobbying competitors that
belong to the same industry with the lobbying company based on the product similarity of
Hoberg and Phillips (2010, 2016). The non-lobbying companies are also a large fraction by
aggregate size – they constitute about 40-50% by market capitalization.
Table 1 presents the data along each dimension in greater detail. Panel A summarizes
lobbying activity. Per two years of Congress, a publicly listed company on average spends
$4m on lobbying, which is about 0.15% of its revenues. The expenses are typically distributed
over about 21 bills.14 Panel B shows that per-bill expenses are $0.20m, and the expenses on
the new laws are slightly higher at $0.22m.15
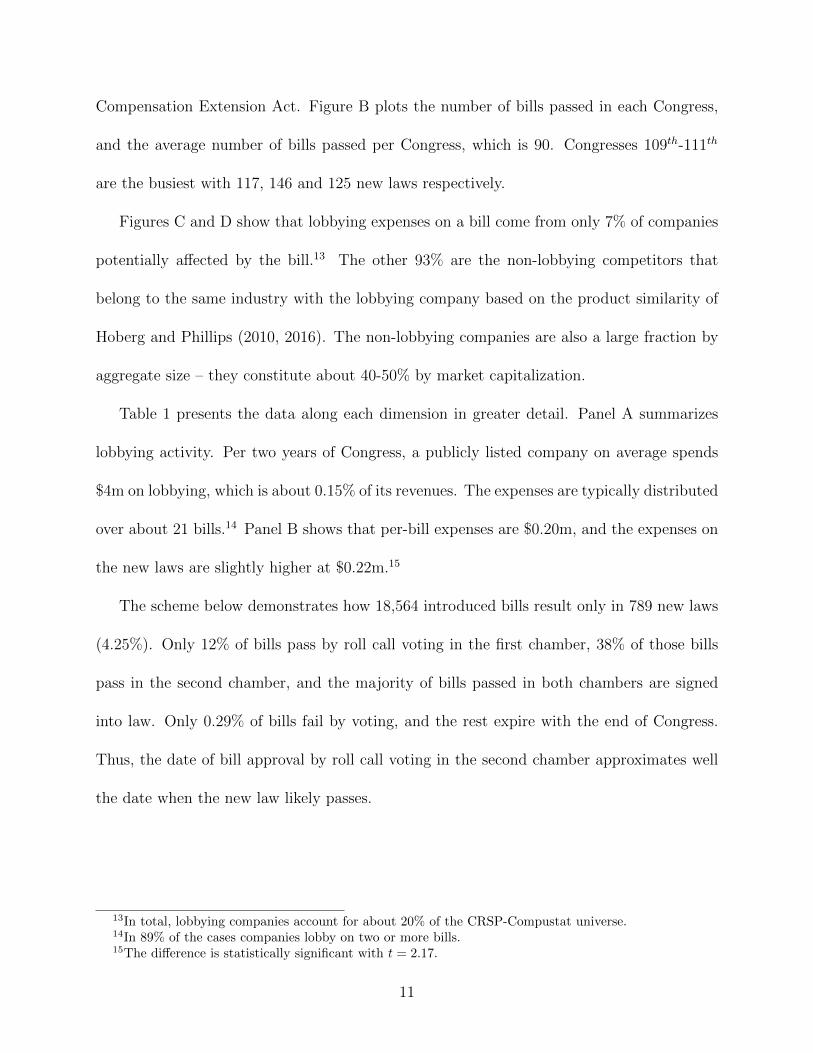
The scheme below demonstrates how 18,564 introduced bills result only in 789 new laws
(4.25%). Only 12% of bills pass by roll call voting in the first chamber, 38% of those bills
pass in the second chamber, and the majority of bills passed in both chambers are signed
into law. Only 0.29% of bills fail by voting, and the rest expire with the end of Congress.
Thus, the date of bill approval by roll call voting in the second chamber approximates well
the date when the new law likely passes.
13In total, lobbying companies account for about 20% of the CRSP-Compustat universe.14In 89% of the cases companies lobby on two or more bills.15The difference is statistically significant with t = 2.17.
11
Bill is introduced: 18,564
Passes 1st chamber: 2,242 (12% of 18,564)
Passes 2nd chamber: 846 (38% of 2,242)
Signed by the President: 789 (93% of 846)
Likely passes
Table 1, Panel B summarizes characteristics of the new laws. The new laws typically
pass with a high percentage of votes in favor (YEAs) at 39.65% in the first chamber and
44.44% in the second chamber. Among those, 71% originate in the House of Representatives,
and the remaining 29% originate in the Senate. The average number of bill sponsors and
co-sponsors – politicians that introduce and promote the bill – is 21, and a typical bill is
lengthy with 21,850 words. The average new law passes in 6.56 months and is amended 23
times. The average bill typically attracts 16 lobbying companies, and 4% bills are crowded
attracting over a hundred lobbying companies. There are typically about 321 non-lobbying
competitors per bill, or 21 competitors per one lobbying company.
Table 1, Panel C compares characteristics of lobbying companies with the characteristics
of their competitors. Consistent with Hill et al. (2013) and Borisov et al. (2015), the lobbying
companies on average have more employees, they have larger market capitalization, lower
book-to-market ratio, they are more profitable and cash rich, more leveraged, and they spend
less on research and development (R&D).
1.4. Empirical approach
To measure the externalities from lobbying to the non-lobbying competitor companies, I rely
on the estimates from the stock market. Following the literature that evaluates the effects
12
of government policies (Bittlingmayer and Hazlett (2000), Veronesi and Zingales (2010)), I
employ an event study approach. I measure the stock returns around the passage of bills,
which are the dates of the roll call voting on the bills in the second chamber, as described
in Section 1.3. Assuming a weak-form efficient financial market, the stock returns in narrow
time intervals around those dates should reflect the expectations of investors about the gains
or losses to companies from the new laws. I estimate the following regression:
CARitb[−10, 10] = αit + βLobbyingb + γ′xb + εitb (3)
where CARitb is the cumulative abnormal stock return to a non-lobbying company i in a
Congress t around passage of a bill b. Abnormal returns are computed relative to the market
model based on the CRSP value-weighted market index, and are cumulated over a [−10, 10]
day window.16 Lobbyingb is the natural logarithm of the combined lobbying expenses on the
bill made by all publicly listed companies (equation (2)). xb are a set of control variables
measured on the bill level, and εitb is the error term.
The rich structure of my data generates a lot of variation. Most companies in a given
Congress lobby on multiple bills and their non-lobbying competitors are affected by multiple
bills. Thus, for a given non-lobbying company the returns vary within a Congress across
bills. I exploit this variation by including non-lobbying company × Congress fixed effects
(αit), which absorb factors associated with a given non-lobbying company at a given point
in time that could affect both lobbying and stock returns. Also, by tracking the pairs of
lobbying and non-lobbying companies on each bill, I include lobbying company × Congress
fixed effects.
16The results are similar when using alternative definitions of returns.
13
2. Lobbying externalities
2.1. Baseline estimates
Table 2 presents the estimates of the equation (3) for bills that pass in Congress and became
new laws. Panel A reports the regression estimates of the cumulative abnormal return (CAR)
to the non-lobbying competitor companies on the bill-level measure of lobbying (equation
(3)). Specification (1) without any controls or fixed effects yields negative coefficient on
Lobbying equal to −0.216 (t = −8.71).17 In economic terms, an increase in Lobbying by one
standard deviation implies that an average non-lobbying competitor company loses 0.23%
in stock returns over [−10,+10] day window: −0.23% = −0.216× 1.07× 100%, where 1.07
is one standard deviation of Lobbying.
Specification (2) includes a set of company characteristics and bill characteristics as con-
trol variables. The company characteristics are from Hill et al. (2013) and Borisov et al.
(2015): log(Market capitalization), Book-to-market, Profitability, Cash/Total assets, Lever-
age, and R&D/Total sales. The bill characteristics are Bill length measured with a natural
logarithm of a number of words in the bill text, and Crowded bill measured with an indicator
variable equal to one if the bill attracts over a hundred lobbying companies, and zero oth-
erwise. In addition, it includes runup in abnormal stock returns over [−50,−11] days, and
industry × Congress fixed effects, which absorb all the time-varying industry characteristics
potentially affecting both lobbying and returns.18 The estimated coefficient on Lobbying is
similar in magnitude to the specification (1).
17t-statistics are clustered on the non-lobbying company level.18I use the fixed 50 industries of Hoberg and Phillips (2010, 2016), and the results are similar for other
definitions of industry such as Fama-French 10, 12, 48, and SIC-3 digit industry codes.
14
Specification (3) includes lobbying company × Congress fixed effects, which account for
all the time-varying characteristics of the lobbying companies. Specification (4) replaces
all the non-lobbying company characteristics with non-lobbying company × Congress fixed
effects, which absorb all the time-varying characteristics of the non-lobbying companies. The
coefficient estimates on Lobbying are again similar to the previous estimates. Based on the
baseline specification (4), when Lobbying increases by one standard deviation, which is about
$2m, the average non-lobbying competitor company loses 0.21% in stock returns, or $3.12m
in market value.19 Given that typically there are 321 non-lobbying competitors per bill, their
total loss is about $1bn.
To show that my empirical strategy produces results consistent with the literature, I
repeat the estimates for companies that lobby on the bills. The results are presented in
the Panel B, specification (1). The coefficient on Lobbying is positive and equals 0.265
(t = 2.17). In economic terms, an increase in Lobbying by one standard deviation implies
that the average lobbying company gains 0.28% in stock returns over the [−10, 10] day
window around the dates of passage of bills. Based on this estimate, the average lobbying
company gains $54.18m in value, and in aggregate the gain per one new law is $0.9bn.20 The
Net Present Value from lobbying for a given company is about 1,100%, which is similar to
the estimate implied from Borisov et al. (2015).21
Specification (2) shows that Lobbying also associates with a higher probability of passage
19−$3.12m = −0.193 × 1.07 × $1, 512m, where 1.07 is a standard deviation of Lobbying and $1, 512m isthe average market capitalization of the non-lobbying company.
20$54.18m = 0.265×1.07×$19, 107m, where $19, 107m is the average market capitalization of the lobbyingcompany. $0.9bn = 54.18× 16/1, 000, where 16 are the average number of companies lobbying on the bill.
21Given that the return company lobbies on 21 bills per Congress, and that 4.25% of all the bills pass,there is 0.88 chance that one bill that a company lobbies on passes. Thus, the NPV = ($54.18 × 0.88 −$3.97)/$3.97× 100% = 1, 100%, where $3.97 are the company’s total lobbying expenses per Congress.
15
of bills, which is consistent with Kang (2015). Additionally, specification (3) shows that
total lobbying expenses made by lobbying companies in a given calendar quarter associate
with higher probability of bill amendment in the subsequent quarter, which suggests that
companies may have an impact on the bill content.
Overall, my findings are consistent with the argument that lobbying generates external-
ities affecting the non-lobbying companies. There could also be a redistribution of value
from the non-lobbying companies to the lobbying companies given a similar magnitude of
the losses and the gains. The value losses also imply that the non-lobbying companies have
little choice of whether to lobby or not. For comparison, the last specification (4) in Panel
B presents the estimates for competitors to lobbying companies that choose to lobby only on
other bills in Congress. Those companies are not affected by the legislation that they decide
not lobby on.
2.2. Size of the economic effects
Because a passage of a bill may not be unexpected to the market, some of the effects might
already be incorporated into the stock prices prior to its passage. This would lead to erro-
neously associating a large amount of lobbying with smaller stock return impact. I address
this problem by focusing on bills that pass with a smaller margin of votes above the required
majority, passage of which is less expected.
Table 3 presents the results. Panel A repeats the baseline estimates for the subsample
of laws that pass with some degree of voting disagreement. Specification (1) presents the
estimate for the subsample of bills that pass with a margin of votes in the bottom 5% of the
16
sample.22 The coefficient estimate is larger than the baseline estimate at −0.815 (t = −3.66).
Specification (2) presents the estimate for the bills that pass with any opposition. The
estimated coefficient is −0.776 (t= 11.18). Specifications (3) and (4) account for a possibility
that larger companies might be less affected by the externalities and weight the observations
by company size. The estimated coefficients are slightly smaller, but are similar in magnitude.
Panel B uses the whole sample and weights the observations by the inverse of the margin
of votes above the requited majority in the first chamber (specification (1)) as well as in
the second chamber (specification (2)). The more conservative estimate in specification (2)
yields the coefficient estimate of −0.548 (t= −10.21), and gives an upper bound for the
losses to the non-lobbying companies per one legislation piece at $2.85bn, and a midrange
of $1.9bn between this upper bound and the baseline estimate. The specifications (3) and
(4) repeat the regressions for the lobbying companies. The estimated coefficients are again
larger than the baseline at 0.300 (t= 2.19), and imply a $1.2bn gain to lobbying companies
per one legislation piece.
2.3. Heterogeneity in externalities
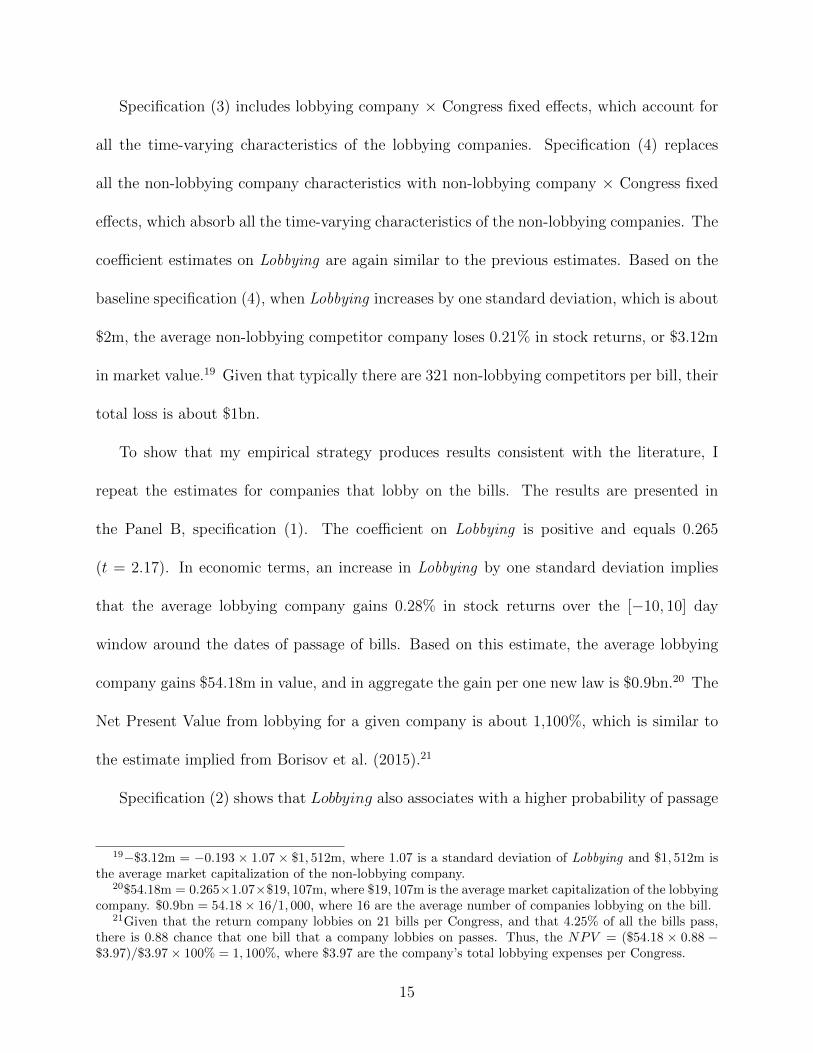
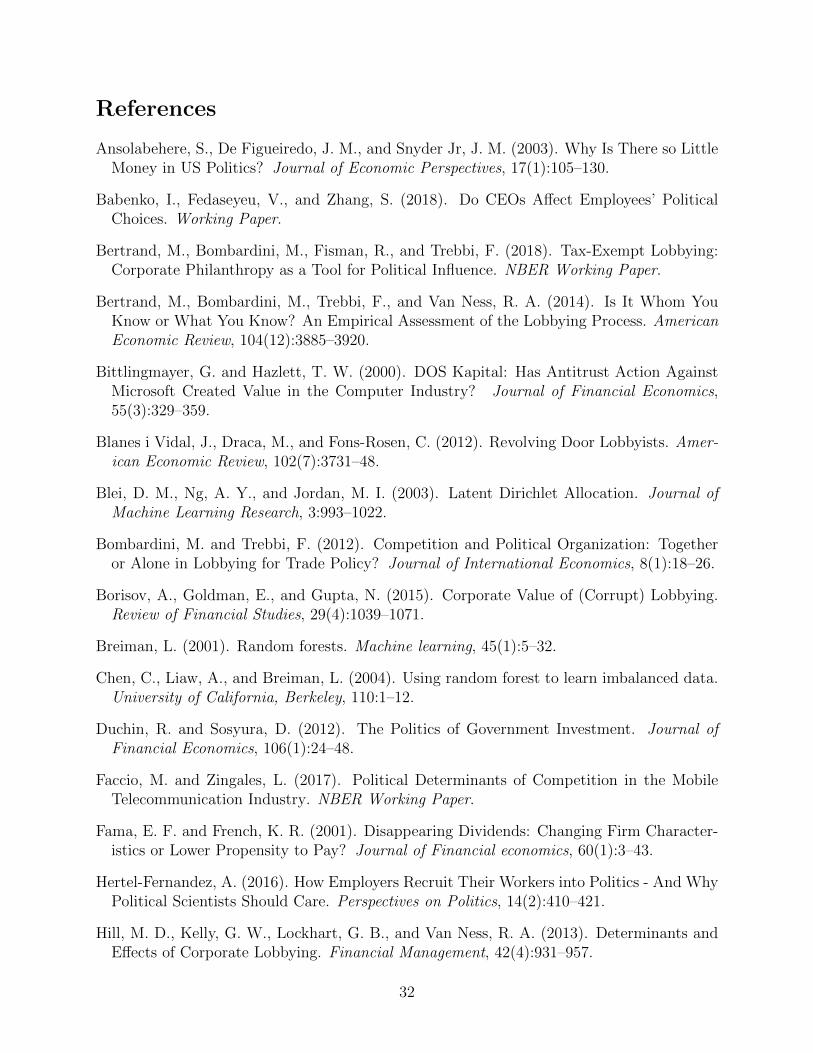
The large number of non-lobbying competitor companies and bills allows me explore the
heterogeneity in lobbying externalities. I show how the effects of lobbying on the non-
lobbying companies vary across three dimensions: (1) by the degree of competition within
an industry, (2) across industries, and (3) across types of regulation.
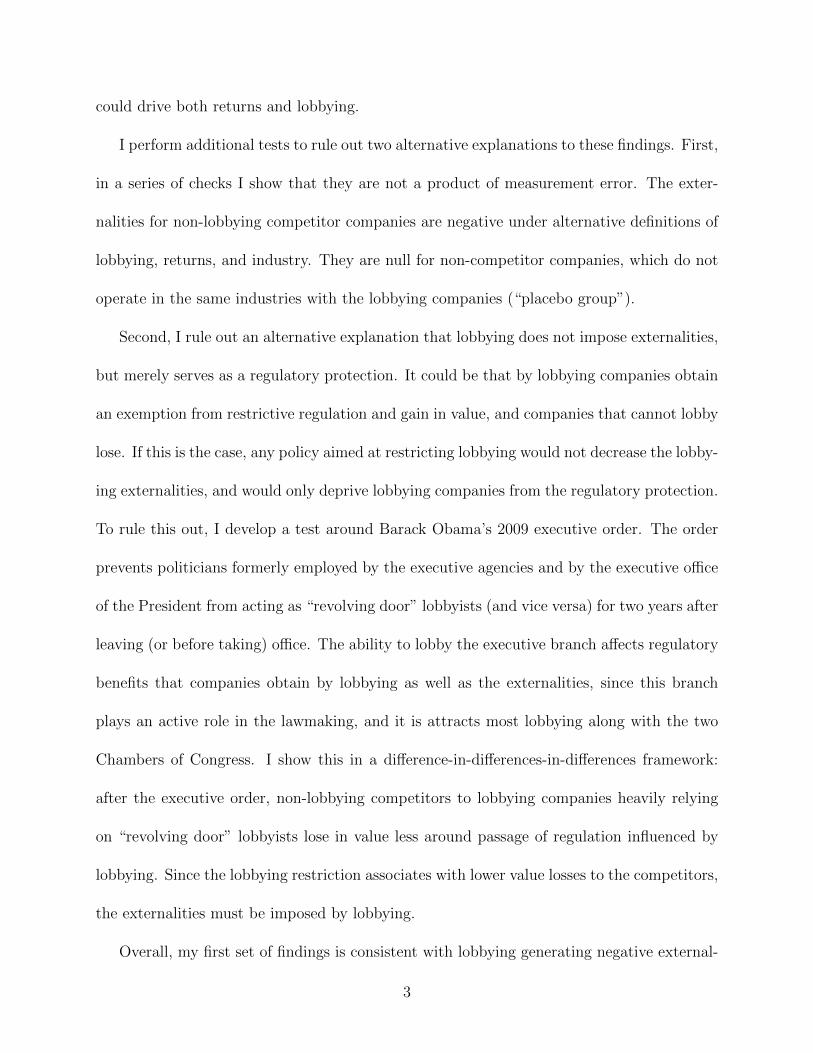
First, the externalities vary depending the degree of competition. The typical regulation
22Not all the introduced bills are voted on, and those that are voted on likely pass. As a result, thepercentage of votes above the required majority is left skewed, and the value of the fifth percentile correspondsto a 13.26% voting margin above the required majority.
17
is rather general and may affect multiple companies in a similar way. Thus, the non-lobbying
competitors that lose from the regulation should be different from the lobbying companies in
a meaningful way. Within a given industry those competitors are likely to rely on a different
production technology and, as a result, a different set of products. For example, lobbying by
an oil producer is likely to be detrimental to a renewable energy company, but not another
oil producer.
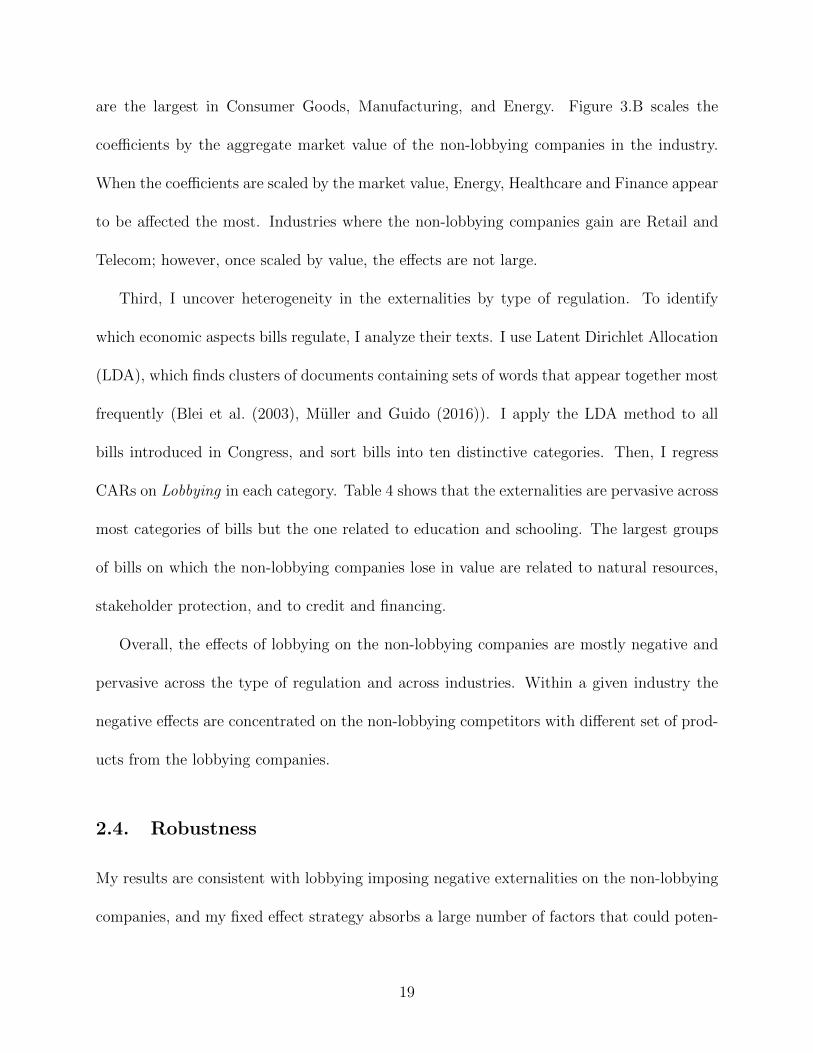
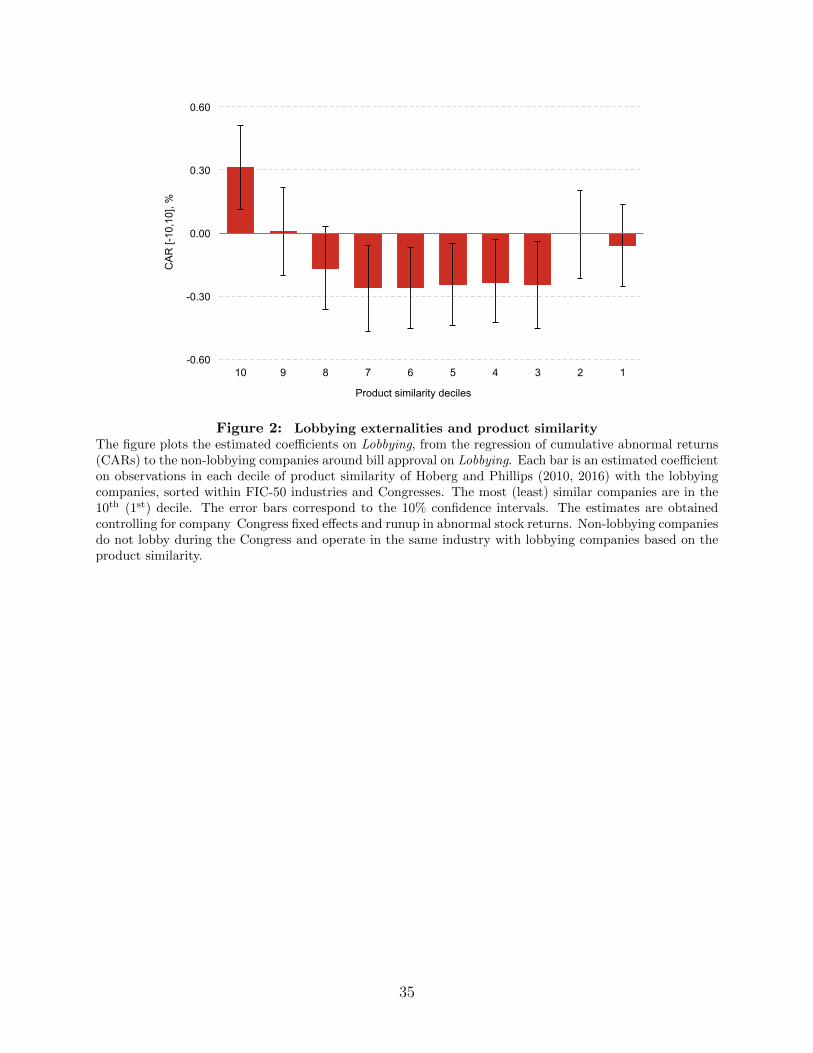
To test whether this is the case, I sort the non-lobbying companies within each industry
and Congress by their product similarity to the lobbying rivals. I use the continuous similarity
scores of Hoberg and Phillips (2010, 2016) and perform sorting within their fixed 50 FIC
industries and Congress.23 I form ten deciles, with the closest (furthest) competitors in
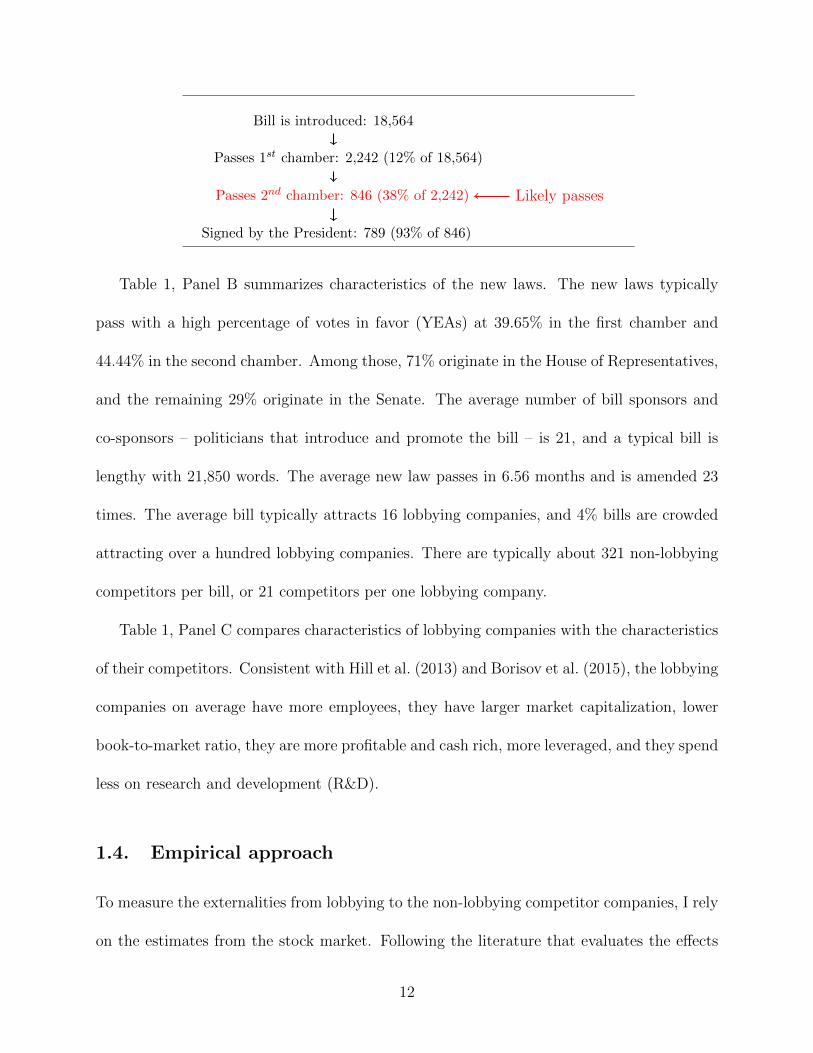
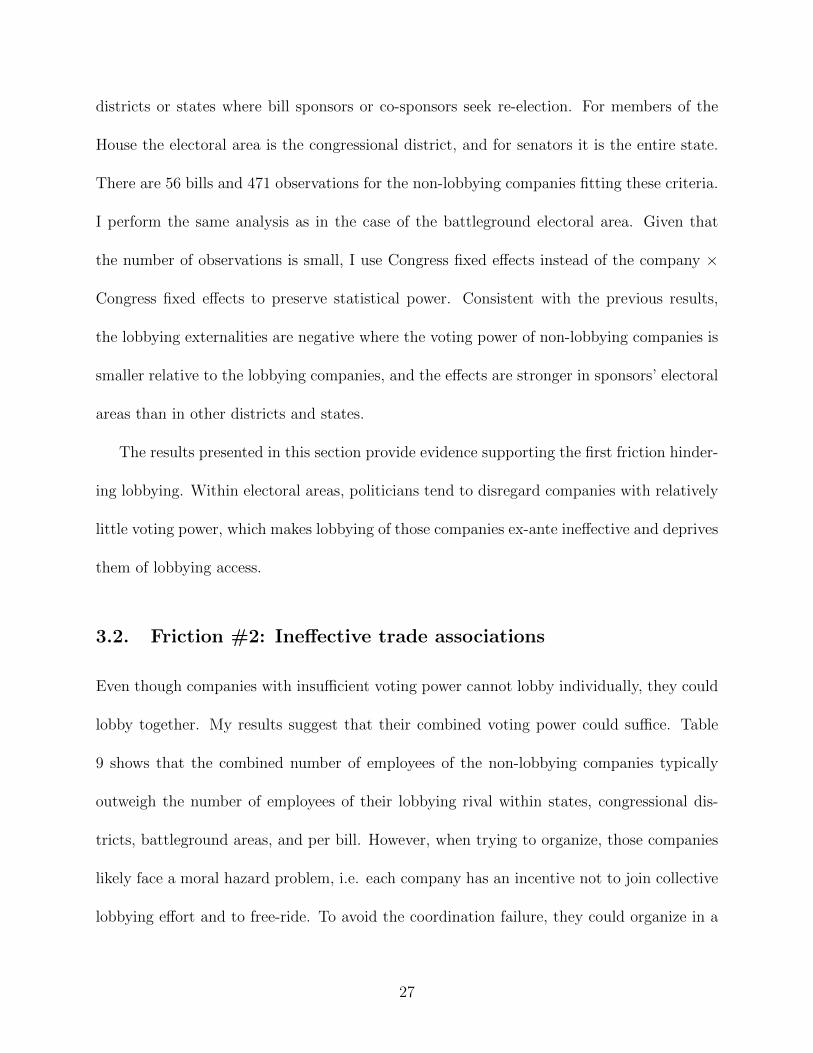
the 10th (1st) decile, and then I regress the CARs on Lobbying within each decile. Figure
2 presents the estimated coefficients net of company × Congress fixed effects and runup
in abnormal stock returns, and 10% confidence intervals. Indeed, the negative effects are
concentrated on companies between the 3rd and the 8th deciles. The closets competitors do
not lose – the laws affect them in a similar way with the lobbying companies, and they free
ride. In terms of the above example, lobbying by an oil producer likely benefits other oil
producers. The companies with the very least similar products are not affected. Even taking
into account this variation in the effects, a major fraction of the competitors within a given
industry lose in value when bills influenced by lobbying pass.
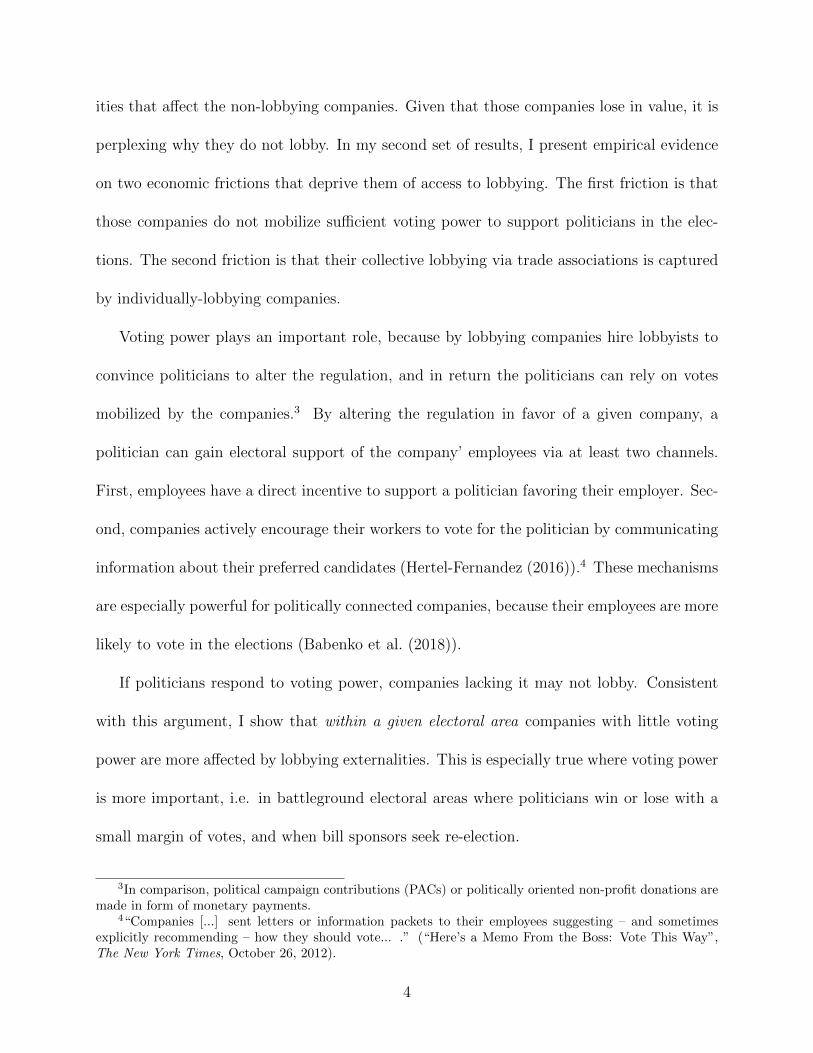
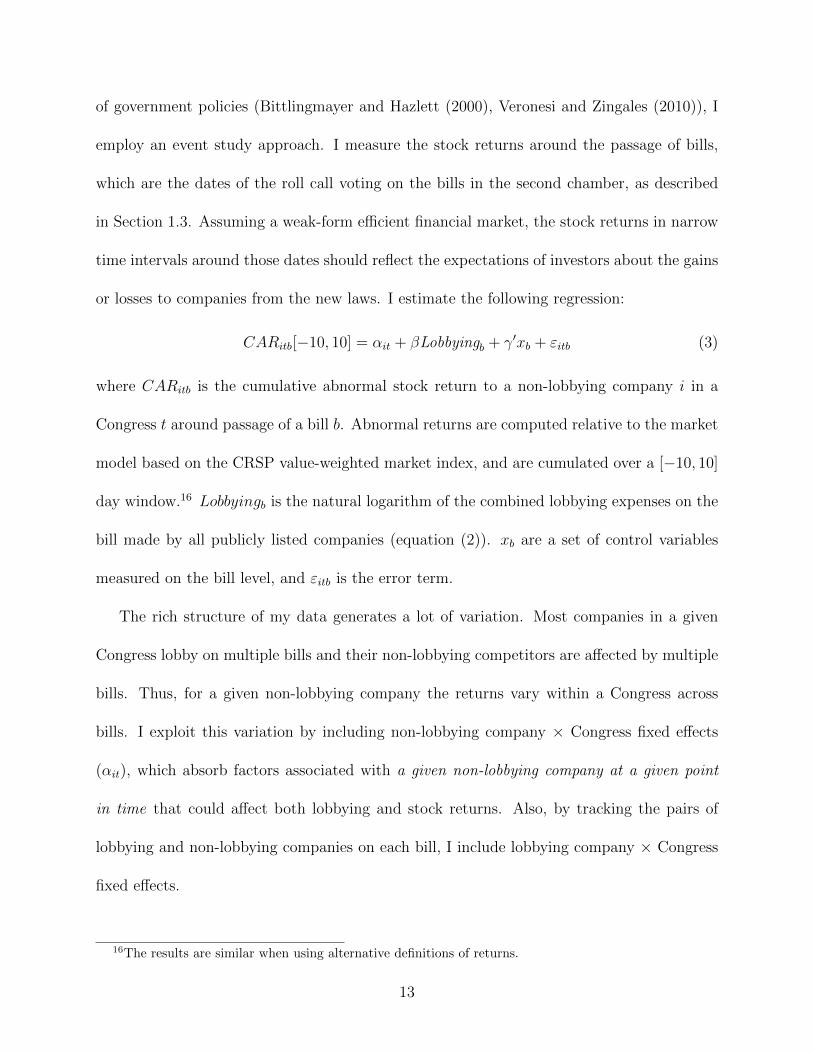
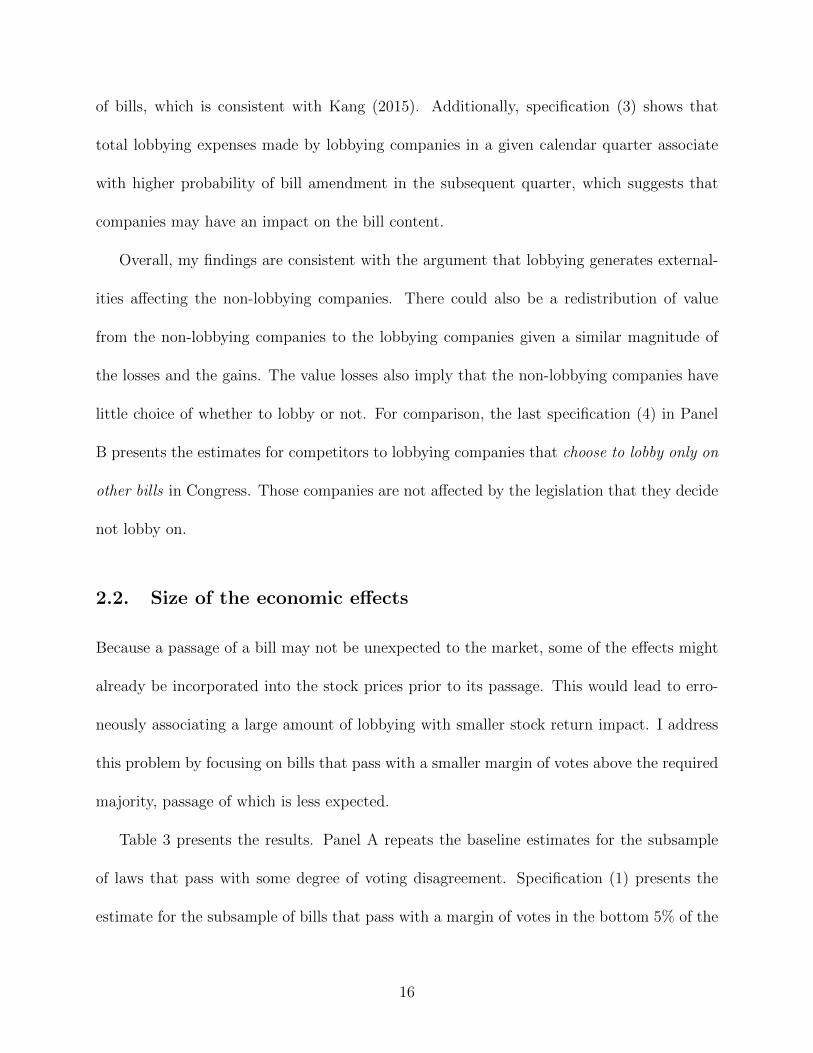
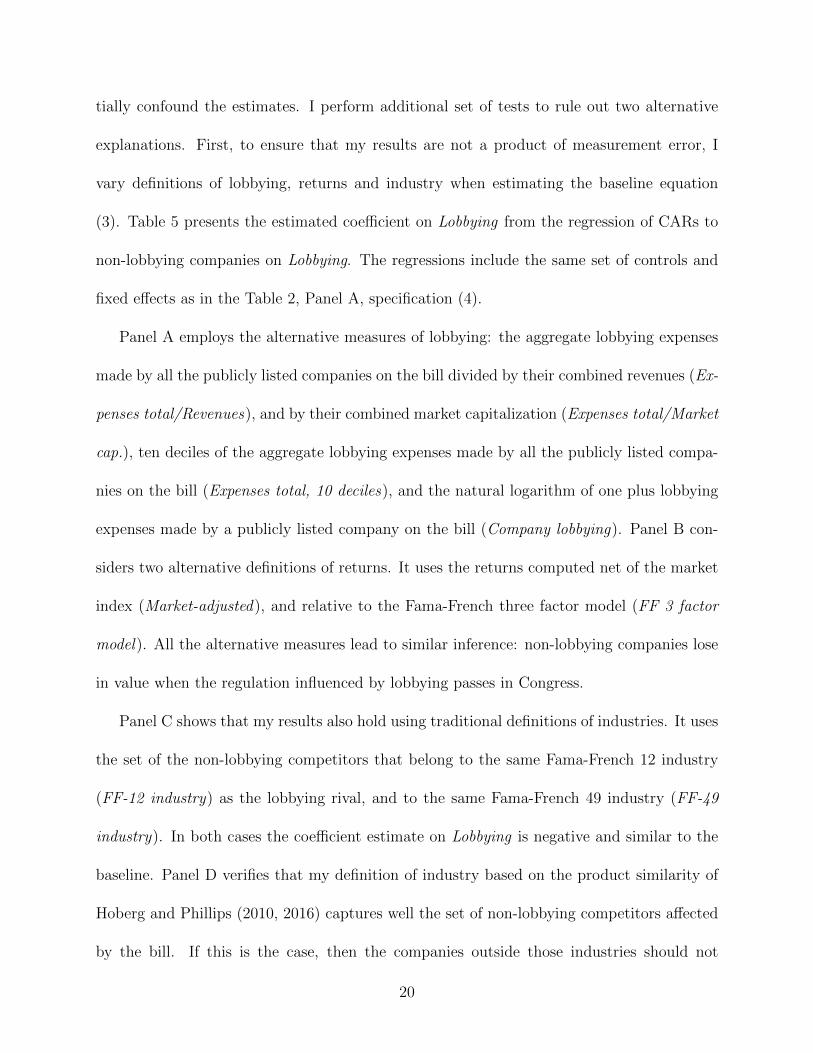
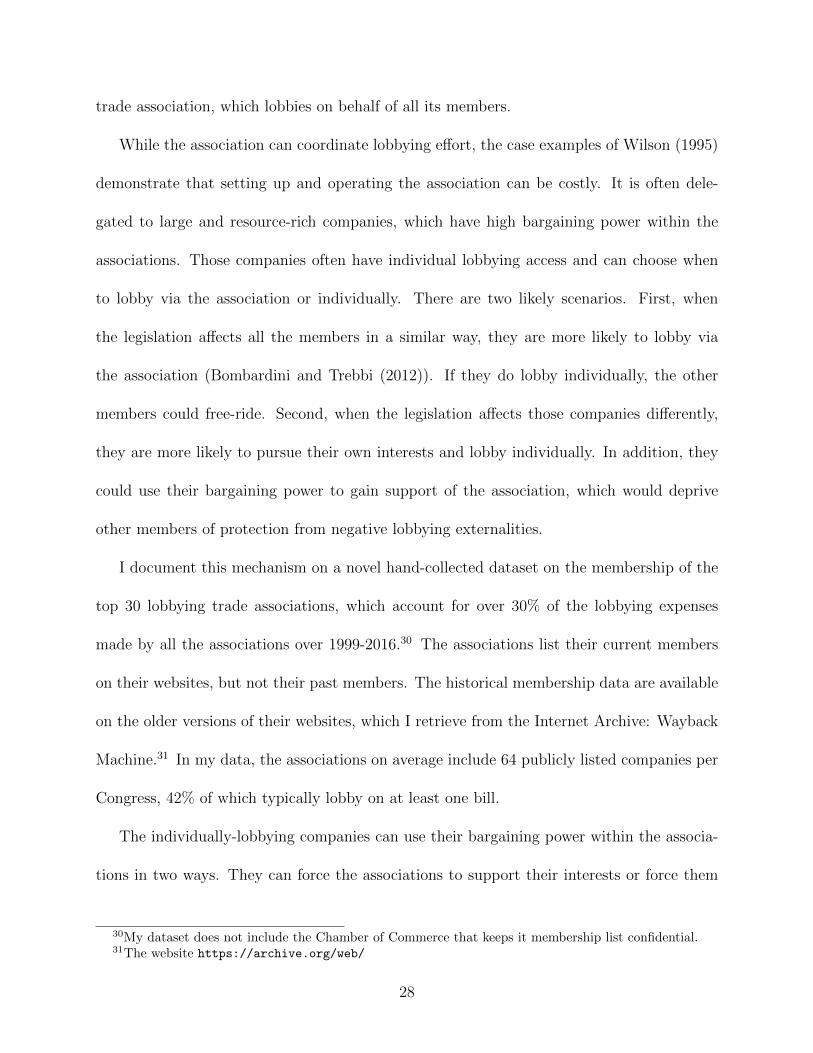
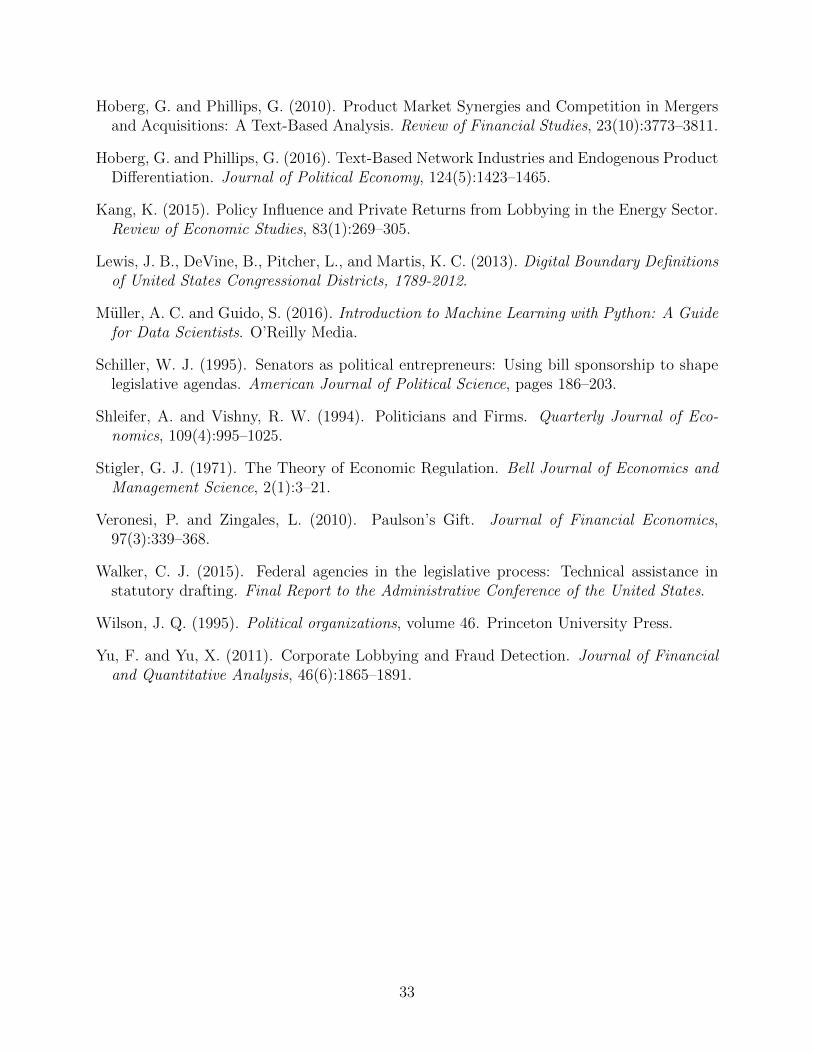
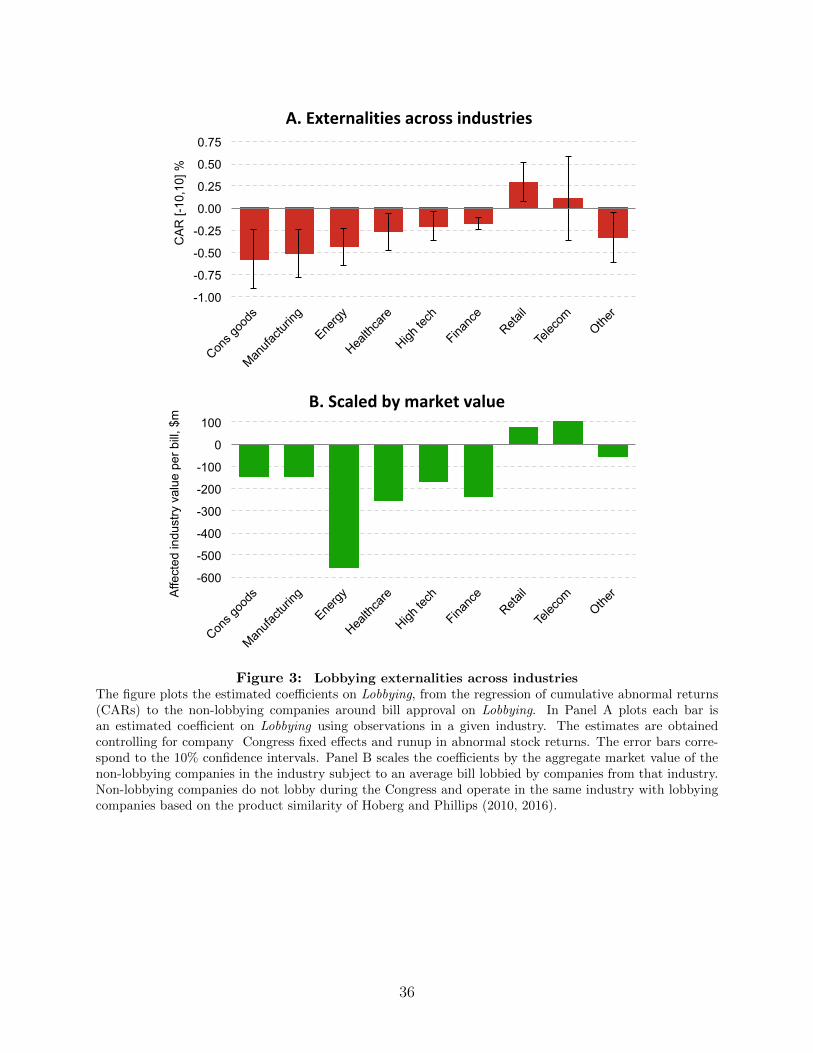
Second, I show that the externalities vary across industries. Figure 3 plots the estimated
coefficients Lobbying, and 10% confidence intervals in wide industry groups for companies
in the 3rd to 8th deciles by product similarity. Figure 3.A shows that the effects of lobbying
23I obtain similar results using other definitions of industry.
18
are the largest in Consumer Goods, Manufacturing, and Energy. Figure 3.B scales the
coefficients by the aggregate market value of the non-lobbying companies in the industry.
When the coefficients are scaled by the market value, Energy, Healthcare and Finance appear
to be affected the most. Industries where the non-lobbying companies gain are Retail and
Telecom; however, once scaled by value, the effects are not large.
Third, I uncover heterogeneity in the externalities by type of regulation. To identify
which economic aspects bills regulate, I analyze their texts. I use Latent Dirichlet Allocation
(LDA), which finds clusters of documents containing sets of words that appear together most
frequently (Blei et al. (2003), Muller and Guido (2016)). I apply the LDA method to all
bills introduced in Congress, and sort bills into ten distinctive categories. Then, I regress
CARs on Lobbying in each category. Table 4 shows that the externalities are pervasive across
most categories of bills but the one related to education and schooling. The largest groups
of bills on which the non-lobbying companies lose in value are related to natural resources,
stakeholder protection, and to credit and financing.
Overall, the effects of lobbying on the non-lobbying companies are mostly negative and
pervasive across the type of regulation and across industries. Within a given industry the
negative effects are concentrated on the non-lobbying competitors with different set of prod-
ucts from the lobbying companies.
2.4. Robustness
My results are consistent with lobbying imposing negative externalities on the non-lobbying
companies, and my fixed effect strategy absorbs a large number of factors that could poten-
19
tially confound the estimates. I perform additional set of tests to rule out two alternative
explanations. First, to ensure that my results are not a product of measurement error, I
vary definitions of lobbying, returns and industry when estimating the baseline equation
(3). Table 5 presents the estimated coefficient on Lobbying from the regression of CARs to
non-lobbying companies on Lobbying. The regressions include the same set of controls and
fixed effects as in the Table 2, Panel A, specification (4).
Panel A employs the alternative measures of lobbying: the aggregate lobbying expenses
made by all the publicly listed companies on the bill divided by their combined revenues (Ex-
penses total/Revenues), and by their combined market capitalization (Expenses total/Market
cap.), ten deciles of the aggregate lobbying expenses made by all the publicly listed compa-
nies on the bill (Expenses total, 10 deciles), and the natural logarithm of one plus lobbying
expenses made by a publicly listed company on the bill (Company lobbying). Panel B con-
siders two alternative definitions of returns. It uses the returns computed net of the market
index (Market-adjusted), and relative to the Fama-French three factor model (FF 3 factor
model). All the alternative measures lead to similar inference: non-lobbying companies lose
in value when the regulation influenced by lobbying passes in Congress.
Panel C shows that my results also hold using traditional definitions of industries. It uses
the set of the non-lobbying competitors that belong to the same Fama-French 12 industry
(FF-12 industry) as the lobbying rival, and to the same Fama-French 49 industry (FF-49
industry). In both cases the coefficient estimate on Lobbying is negative and similar to the
baseline. Panel D verifies that my definition of industry based on the product similarity of
Hoberg and Phillips (2010, 2016) captures well the set of non-lobbying competitors affected
by the bill. If this is the case, then the companies outside those industries should not
20
be affected by lobbying. To confirm this I performs a placebo test on the non-lobbying
companies that do not belong to the same industry with companies lobbying on the bill. On
each bill, I randomly select 100 and 300 such companies and estimate the baseline equation
(3). In both cases the coefficient on Lobbying is not statistically significant. In addition,
Panel E verifies that my results are not specific to either of the two sources of lobbying data
– SOPR quarterly reports or CRP annual data.
Second, I rule out the alternative explanation that lobbying does not generate negative
externalities, but merely serves as a protection against restrictive regulation. It could be
that by lobbying companies can obtain an exemption from the regulation, and companies
without lobbying access cannot do so. Thus, I could still observe losses to the non-lobbying
companies, even if they are not imposed by lobbying.
To rule this out, I develop a test around Barack Obama’s executive order of January 21,
2009, which imposes a restriction on the “revolving door” lobbying of the executive branch
of the government. The order prevents politicians formerly employed by the by executive
agencies and the executive office of the President from lobbying their former employer after
leaving office; and it prevents former lobbyists from joining the executive branch. This
branch of the government, including the agencies, plays an active role in the legislation
making process (Walker (2015)). It is also attracts significant lobbying pressure: e.g. in
2016 the White House along with the executive agencies, such as Office of Management and
Budget (OMB), Department of the Treasury, Department of Energy (DOE), are among the
government entities that are lobbied the most, based on information in the lobbying reports
(Appendix A.2). Thus, the order can decrease the ability of companies to lobby effectively
21
on new regulation.24
The intuition behind the test is that if lobbying generates externalities, then restrict-
ing lobbying should reduce them. Operationally, I employ a difference-in-differences-in-
differences framework and compare the effects of lobbying after versus before the introduc-
tion of the executive order on companies having a high fraction of former staffers among
their lobbyists over the previous Congress (top third of the distribution) with the effects on
the other companies. Similarly, I compare the effects on their competitors to measure the
differential effect of the executive order on the lobbying externalities.
To make sure that the effect of the lobbying restriction is not driven by company charac-
teristics, I first compare lobbying companies in two groups across the observable dimensions.
Table 6, Panel A shows that they are similar by size, book-to-market, leverage and prof-
itability, but exhibit some differences in cash relative to the size of their assets, in and R&D
expenses. I account for these differences using the nearest neighbor matching, and Panel
B shows that the differences disappear for the matched groups. Panel C shows that the
non-lobbying competitors are ex-ante not different across the two groups.
Table 7 presents the regression estimates. For this set of tests I focus on the data for
the 109th-113th Congresses, which includes two Congresses around the executive order. Also,
I use the lobbying expenses of individual lobbying companies on bills (Company lobbying),
to distinguish the lobbying pressure from companies extensively relying on the revolving
door lobbyists. Using this measure allows me to saturate the regressions with both company
× Congress and bill fixed effects, which absorb potentially omitted time-varying company
24The “revolving door” lobbying targeted by this reform is meaningful for both companies and lobbyistsand also widespread. In the yearly data I obtained from the CRP, about 82% of companies have formerstaffers among their lobbyists. For lobbyists themselves the connections that they make during the servicein Congress represent substantial source of revenues (Blanes i Vidal et al. (2012)).
22
characteristics as well as bill characteristics that could drive the results. Specifications (1)
and (2) show that after the restriction, lobbying companies that extensively rely on the
revolving door lobbyists (RV ) gain from lobbying less. Specifications (3) show that, at the
same time, the externalities from lobbying decrease. These findings further suggest that the
non-lobbying companies are negatively affected by the regulation due to lobbying.
3. Lobbying frictions
Section 2 shows that lobbying generates sizable economic externalities. Given that the af-
fected companies do not lobby to eliminate those externalities, they may be affected by
frictions preventing them from lobbying. I propose two such frictions. The first friction is
that the companies do not mobilize sufficient voting power and thus their lobbying is ineffec-
tive ex-ante. The second friction is that a coordination problem prevents those companies
from effectively combining their voting power in trade associations. The reason is that the
associations are captured by individually-lobbying companies. This section describes each
friction in detail and provides empirical evidence.
3.1. Friction #1: Importance of votes
Voting power is important because by altering the regulation in favor of a given company, a
politician can gain electoral support from its employees. There are at least two channels how
the politicians can gain the votes. First, the workers are likely to vote for politicians favoring
their place of employment. Second, the U.S. companies can have a considerable impact on the
political participation of their employees. They extensively utilize their right to educate their
23
workers on political matters via “captive” workplace meetings, and use help of the non-profit
organizations, which aim at facilitating communication of political views between employers
and employees (Hertel-Fernandez (2016)). One such organization, Business-Industry Polit-
ical Action Committee (BIPAC) reports on its website “In Election 2002, more than half
the Fortune 50 used BIPAC tools to educate employees about pro-business candidates and
to get them to the polls.”25 After 2010 Supreme Court’s decision Citizens United v. Fed-
eral Election Commission, the companies are able to directly communicate the names of the
preferred candidates. Hertel-Fernandez (2016) provides survey evidence where the employ-
ees admit such communication. These channels are especially powerful for politically active
companies, since their employees are more active voters (Babenko et al. (2018)). In addition,
voting power is important in the context of lobbying because the politicians do not necessary
receive monetary contributions from the lobbying companies. Instead, the companies pay to
hire lobbyists, who supply politicians with information.26
To show that voting power is a likely friction hindering lobbying, I perform three tests.
In the first test, I show that the non-lobbying companies with little voting power relative
to the lobbying companies are more affected by the externalities. I calculate the difference
between the number of employees of each lobbying company and its non-lobbying competitors
located in the same state. The difference is denoted as ∆ employees. Within each state
and a Congress, I sort non-lobbying companies by ∆ employees into four quartiles. Using
25Source: www.bipac.org, the website version of December 16, 2004, accessed via web.archive.org.26In comparison, the ways of political influence based on monetary donations are Political Campaign
Contributions (PACs), Super PACs, or politically oriented charitable contributions. The lobbying expensesare much larger than these other ways of political influence. Aggregate lobbying spendings per Congress are17 times larger than PACs and over six times larger than super PACs. The estimates are based on datafrom the Center for Responsible Politics (www.opensecrets.org). As estimated by Bertrand et al. (2018),lobbying expenses also exceed politically oriented charitable contributions by 2.5 times.
24
observations in each quartile, I estimate the equation (1), regressing CARs on Lobbying.
The regressions include the same set of controls and fixed effects as in the Table 2, Panel A,
specification (4).
Table 8.A presents the results. The negative lobbying externalities to the non-lobbying
competitors increase monotonically with ∆ employees. In the bottom quartile and in Q2,
the coefficient on Lobbying is statistically not different from zero. It is negative and increases
in magnitude in Q3 and in the top quartile, where it is statistically significant. This suggests
that the lobbying externalities increase when the non-lobbying companies have less voting
power relative lobbying companies.
In two subsequent tests, I focus on cases when the companies’ voting power is likely to
matter more: (1) battleground electoral areas, and (2) upcoming elections of bill sponsors
and co-sponsors. These tests help me make sure that my results reflect companies’ voting
power rather than some omitted factor correlated with the number of employees.
In the first test I focus on battleground electoral areas. These are the congressional
districts and states where a politician wins or loses the elections with a small margin of
votes.27 To identify such areas, I obtain federal elections data for 1999-2016 from the U.S.
Federal Election Commission. I match the elected senators with companies by geographical
state, and elected members of House by state and congressional district. Each Congress
the geographic boundaries of congressional districts change. To identify in which district a
company is located, I proceed as follows. I retrieve the ZIP code in the company’s address
from Compustat, and use it to obtain its corresponding the latitude and longitude from the
27Members of the House of Representatives are elected on the congressional district level, and eachCongress all the 435 members of the House are re-election. Senators are elected on a state level, and eachCongress and 33 of all the 100 Senators are re-elected.
25
ZIP Code Tabulation Areas in the 2016 Census U.S. Gazetteer Files. I then use the latitude
and longitude to find the congressional district in the U.S. Congressional Districts Shapefiles
of Lewis et al. (2013).28
In Table 8.B, specifications (1) and (2) use the subsamples of companies located in
battleground electoral areas, where any politician won or lost by a 5% voting margin. Within
each Congress and district or state, I split the data into two equal groups by the median of
∆ employees and estimate the baseline equation (3) using the observations in each group.
When ∆ employees is high, the the coefficient estimate on Lobbying is negative, large and
statistically significant; when ∆ employees is low the coefficient becomes small and loses its
statistical significance. Specifications (3) and (4) present a similar pattern for companies
located in all other districts or states but the battleground ones. The effects of lobbying
when ∆ employees is much larger in the battleground districts, which suggests that the non-
lobbying companies lacking voting power are affected by lobbying more precisely in cases
when the voting power is more important.
In the second test, I focus on the cases when the sponsors of bills seek re-election. A bill
sponsor is a politician, a senator or a member of the House, who introduces the bill based
on her expertise and demand for a given type of regulation (Schiller (1995)). A politician
seeking re-election can rely on the voting power of the companies by sponsoring the bills
profitable for them; and thus voting power makes lobbying more effective.29
In Table 8.C, specifications (1) and (2) use the subsamples of companies located in
28The files districts106.shp-districts114.shp and the code example “mapping congress in R”. Retrievedfrom http://cdmaps.polisci.ucla.edu on June 24, 2018.
29In the next version of the paper I will also look at the members of the committees that amend the bills.The data on the committee members come from the website of Charles Stewart III at http://web.mit.
edu/17.251/www/data_page.html.
26
districts or states where bill sponsors or co-sponsors seek re-election. For members of the
House the electoral area is the congressional district, and for senators it is the entire state.
There are 56 bills and 471 observations for the non-lobbying companies fitting these criteria.
I perform the same analysis as in the case of the battleground electoral area. Given that
the number of observations is small, I use Congress fixed effects instead of the company ×
Congress fixed effects to preserve statistical power. Consistent with the previous results,
the lobbying externalities are negative where the voting power of non-lobbying companies is
smaller relative to the lobbying companies, and the effects are stronger in sponsors’ electoral
areas than in other districts and states.
The results presented in this section provide evidence supporting the first friction hinder-
ing lobbying. Within electoral areas, politicians tend to disregard companies with relatively
little voting power, which makes lobbying of those companies ex-ante ineffective and deprives
them of lobbying access.
3.2. Friction #2: Ineffective trade associations
Even though companies with insufficient voting power cannot lobby individually, they could
lobby together. My results suggest that their combined voting power could suffice. Table
9 shows that the combined number of employees of the non-lobbying companies typically
outweigh the number of employees of their lobbying rival within states, congressional dis-
tricts, battleground areas, and per bill. However, when trying to organize, those companies
likely face a moral hazard problem, i.e. each company has an incentive not to join collective
lobbying effort and to free-ride. To avoid the coordination failure, they could organize in a
27
trade association, which lobbies on behalf of all its members.
While the association can coordinate lobbying effort, the case examples of Wilson (1995)
demonstrate that setting up and operating the association can be costly. It is often dele-
gated to large and resource-rich companies, which have high bargaining power within the
associations. Those companies often have individual lobbying access and can choose when
to lobby via the association or individually. There are two likely scenarios. First, when
the legislation affects all the members in a similar way, they are more likely to lobby via
the association (Bombardini and Trebbi (2012)). If they do lobby individually, the other
members could free-ride. Second, when the legislation affects those companies differently,
they are more likely to pursue their own interests and lobby individually. In addition, they
could use their bargaining power to gain support of the association, which would deprive
other members of protection from negative lobbying externalities.
I document this mechanism on a novel hand-collected dataset on the membership of the
top 30 lobbying trade associations, which account for over 30% of the lobbying expenses
made by all the associations over 1999-2016.30 The associations list their current members
on their websites, but not their past members. The historical membership data are available
on the older versions of their websites, which I retrieve from the Internet Archive: Wayback
Machine.31 In my data, the associations on average include 64 publicly listed companies per
Congress, 42% of which typically lobby on at least one bill.
The individually-lobbying companies can use their bargaining power within the associa-
tions in two ways. They can force the associations to support their interests or force them
30My dataset does not include the Chamber of Commerce that keeps it membership list confidential.31The website https://archive.org/web/
28
not to lobby at all. To convey this, I find all the associations that lobby on a given bill, or
do not lobby but belong to the same economic sectors as the companies lobbying on the bill.
Then, for each non-lobbying company on the bill I find all such associations it belongs to,
and I measure the presence of the individually-lobbying companies in those associations. I
compute shares of the individually-lobbying members based on companies’ cash flow mea-
sured with EBITDA for the last fiscal year before the start of Congress (% Members lobbying,
Cash flow) and based on their market capitalization at the start of Congress (% Members
lobbying, Market cap.).
In the tests I focus on the subsample of companies with known association membership,
and I split the sample by the median value of each of the two variables reflecting presence
of the lobbying companies. Table 10, Panel A repeats the baseline regressions of CARs on
Lobbing using observations in each quantile. Specifications (1) and (2) present the estimates
for the split by the median of % Members lobbying, Cash flow, which typically is 19.7%.
Specifications (3) and (4) present the estimates for the split by the median of % Members
lobbying, Market cap., which typically is similar at 19.6%. When the share of individually-
lobbying companies in the associations is high, the coefficient estimates on Lobbying are
negative and statistically significant. On the contrary, when their share is low, the coefficient
estimates are positive.
Panel B repeats the regressions, replacing Lobbing with Trade associations’ lobbying
measured with the natural logarithm of the combined lobbying expenses on the bill made
by all the trade associations. I identify trade associations in the lobbying data based on the
CRP industry definition and by machine-searching the names of the lobbying organizations
on the Web. The results show that when the share of the individually-lobbying companies in
29
the association is high, the association’s lobbying does not affect members without individual
lobbying access. The estimates coefficient on Trade associations’ lobbying is negative and not
statistically significant. However, when the share is low, the association’s lobbying benefits
those companies. Taken together, the results in both panels are consistent with the above
argument that lobbying companies capture the associations, which sustains the lobbying
externalities.
4. Conclusion
I study the effect of lobbying on companies that do not lobby. I show that lobbying generates
negative externalities. When a new piece of regulation influenced by lobbying is approved
by the second chamber of Congress, the non-lobbying companies suffer a loss in their market
value, and the combined effect on the average bill is about −$1.9Bn. This result is based on a
comprehensive sample combining the corporate lobbying activity and congressional activity
on lobbied legislation over 1999-2016. It is pervasive across industries and sample years and
robust to controlling for the measurement errors coming with different definitions of lobbying
and industry. The results highlight broader effects of lobbying, which go beyond the benefits
accruing to the lobbying companies.
Given that the non-lobbying companies are negatively affected, it is perplexing why
they do not lobby. I propose two explanations. First, they do not represent sufficient
voting power, i.e. they do not mobilize enough votes to support politicians in the elections,
which makes their lobbying ineffective ex-ante. Second, the non-lobbying companies share
their membership in trade associations with individually-lobbying companies, which in turn
30

force the trade associations to support their interests. Documenting these constrains has
valuable policy implications. It highlights the areas that can be targeted by policies aiming
at eliminating the lobbying externalities.
31
References
Ansolabehere, S., De Figueiredo, J. M., and Snyder Jr, J. M. (2003). Why Is There so LittleMoney in US Politics? Journal of Economic Perspectives, 17(1):105–130.
Babenko, I., Fedaseyeu, V., and Zhang, S. (2018). Do CEOs Affect Employees’ PoliticalChoices. Working Paper.
Bertrand, M., Bombardini, M., Fisman, R., and Trebbi, F. (2018). Tax-Exempt Lobbying:Corporate Philanthropy as a Tool for Political Influence. NBER Working Paper.
Bertrand, M., Bombardini, M., Trebbi, F., and Van Ness, R. A. (2014). Is It Whom YouKnow or What You Know? An Empirical Assessment of the Lobbying Process. AmericanEconomic Review, 104(12):3885–3920.
Bittlingmayer, G. and Hazlett, T. W. (2000). DOS Kapital: Has Antitrust Action AgainstMicrosoft Created Value in the Computer Industry? Journal of Financial Economics,55(3):329–359.
Blanes i Vidal, J., Draca, M., and Fons-Rosen, C. (2012). Revolving Door Lobbyists. Amer-ican Economic Review, 102(7):3731–48.
Blei, D. M., Ng, A. Y., and Jordan, M. I. (2003). Latent Dirichlet Allocation. Journal ofMachine Learning Research, 3:993–1022.
Bombardini, M. and Trebbi, F. (2012). Competition and Political Organization: Togetheror Alone in Lobbying for Trade Policy? Journal of International Economics, 8(1):18–26.
Borisov, A., Goldman, E., and Gupta, N. (2015). Corporate Value of (Corrupt) Lobbying.Review of Financial Studies, 29(4):1039–1071.
Breiman, L. (2001). Random forests. Machine learning, 45(1):5–32.
Chen, C., Liaw, A., and Breiman, L. (2004). Using random forest to learn imbalanced data.University of California, Berkeley, 110:1–12.
Duchin, R. and Sosyura, D. (2012). The Politics of Government Investment. Journal ofFinancial Economics, 106(1):24–48.
Faccio, M. and Zingales, L. (2017). Political Determinants of Competition in the MobileTelecommunication Industry. NBER Working Paper.
Fama, E. F. and French, K. R. (2001). Disappearing Dividends: Changing Firm Character-istics or Lower Propensity to Pay? Journal of Financial economics, 60(1):3–43.
Hertel-Fernandez, A. (2016). How Employers Recruit Their Workers into Politics - And WhyPolitical Scientists Should Care. Perspectives on Politics, 14(2):410–421.
Hill, M. D., Kelly, G. W., Lockhart, G. B., and Van Ness, R. A. (2013). Determinants andEffects of Corporate Lobbying. Financial Management, 42(4):931–957.
32
Hoberg, G. and Phillips, G. (2010). Product Market Synergies and Competition in Mergersand Acquisitions: A Text-Based Analysis. Review of Financial Studies, 23(10):3773–3811.
Hoberg, G. and Phillips, G. (2016). Text-Based Network Industries and Endogenous ProductDifferentiation. Journal of Political Economy, 124(5):1423–1465.
Kang, K. (2015). Policy Influence and Private Returns from Lobbying in the Energy Sector.Review of Economic Studies, 83(1):269–305.
Lewis, J. B., DeVine, B., Pitcher, L., and Martis, K. C. (2013). Digital Boundary Definitionsof United States Congressional Districts, 1789-2012.
Muller, A. C. and Guido, S. (2016). Introduction to Machine Learning with Python: A Guidefor Data Scientists. O’Reilly Media.
Schiller, W. J. (1995). Senators as political entrepreneurs: Using bill sponsorship to shapelegislative agendas. American Journal of Political Science, pages 186–203.
Shleifer, A. and Vishny, R. W. (1994). Politicians and Firms. Quarterly Journal of Eco-nomics, 109(4):995–1025.
Stigler, G. J. (1971). The Theory of Economic Regulation. Bell Journal of Economics andManagement Science, 2(1):3–21.
Veronesi, P. and Zingales, L. (2010). Paulson’s Gift. Journal of Financial Economics,97(3):339–368.
Walker, C. J. (2015). Federal agencies in the legislative process: Technical assistance instatutory drafting. Final Report to the Administrative Conference of the United States.
Wilson, J. Q. (1995). Political organizations, volume 46. Princeton University Press.
Yu, F. and Yu, X. (2011). Corporate Lobbying and Fraud Detection. Journal of Financialand Quantitative Analysis, 46(6):1865–1891.
33
0 2 4 6 8
114 113 112 111 110 109 108 107 106
Average
Expenses total, $m
Con
gres
s A. Lobbying on a bill
0 30 60 90 120 150
114 113 112 111 110 109 108 107 106
Average
Number of approved bills
Con
gres
s
B. New laws per Congress
0% 50% 100%
114 113 112 111 110 109 108 107 106
Average
Con
gres
s
C. Lobbying participation on a bill by number of companies
% Lobbying companies
% Non-lobbying companies
0% 50% 100%
114 113 112 111 110 109 108 107 106
Average C
ongr
ess
D. Lobbying participation on a bill by market capitalization
% Lobbying companies
% Non-lobbying companies
Figure 1: Data summaryFigure A presents aggregate lobbying expenses of companies on a bill, averaged within a Congress. It alsoshows the average across all the Congresses (Average). Figure B presents a number of bills passed in aCongress, and the average across all the Congresses. Figure C and Figure D present percentage of lobbyingcompanies and non-lobbying companies on a bill, averaged within a Congress. Figure C computes percentagesbased on the combined number of companies, and Figure D computes percentages based on their combinedmarket capitalization. Both figures also show the average percentages across all Congresses. Non-lobbyingcompanies do not lobby during the Congress and operate in the same industry with lobbying companiesbased on the product similarity of Hoberg and Phillips (2010, 2016).
34
-0.60
-0.30
0.00
0.30
0.60
10 9 8 7 6 5 4 3 2 1
CA
R [-
10,1
0], %
Product similarity deciles
Figure 2: Lobbying externalities and product similarityThe figure plots the estimated coefficients on Lobbying, from the regression of cumulative abnormal returns(CARs) to the non-lobbying companies around bill approval on Lobbying. Each bar is an estimated coefficienton observations in each decile of product similarity of Hoberg and Phillips (2010, 2016) with the lobbyingcompanies, sorted within FIC-50 industries and Congresses. The most (least) similar companies are in the10th (1st) decile. The error bars correspond to the 10% confidence intervals. The estimates are obtainedcontrolling for company Congress fixed effects and runup in abnormal stock returns. Non-lobbying companiesdo not lobby during the Congress and operate in the same industry with lobbying companies based on theproduct similarity.
35
-1.00
-0.75
-0.50
-0.25
0.00
0.25
0.50
0.75
Cons g
oods
Manufa
cturin
g
Energy
Health
care
High te
ch
Financ
e
Retail
Telec
om
Other
CA
R [-
10,1
0] %
A.Externalitiesacrossindustries
-600
-500
-400
-300
-200
-100
0
100
Cons g
oods
Manufa
cturin
g
Energy
Health
care
High te
ch
Financ
e
Retail
Telec
om
Other A
ffect
ed in
dust
ry v
alue
per
bill
, $m
B.Scaledbymarketvalue
Figure 3: Lobbying externalities across industriesThe figure plots the estimated coefficients on Lobbying, from the regression of cumulative abnormal returns(CARs) to the non-lobbying companies around bill approval on Lobbying. In Panel A plots each bar isan estimated coefficient on Lobbying using observations in a given industry. The estimates are obtainedcontrolling for company Congress fixed effects and runup in abnormal stock returns. The error bars corre-spond to the 10% confidence intervals. Panel B scales the coefficients by the aggregate market value of thenon-lobbying companies in the industry subject to an average bill lobbied by companies from that industry.Non-lobbying companies do not lobby during the Congress and operate in the same industry with lobbyingcompanies based on the product similarity of Hoberg and Phillips (2010, 2016).
36
Table 1: Descriptive statisticsThe table presents descriptive statistics. The data on lobbying activity are from the Senate’s Office of PublicRecords (SOPR) and the Center for Responsible politics (CRP). The data on bill characteristics are fromthe Library of Congress (LOC). The sample period covers 1999-2016 years or 106th-114th Congresses. Thedata on company financial characteristics and number of employees are from CRSP-Compustat, taken at thestart of each Congress. Panel A summarizes lobbying activity of publicly listed companies. One observationon Company-Congress level corresponds to one lobbying company in a Congress; on Company-bill level itcorresponds to one lobbying company on one bill in a Congress; and on New law level it corresponds toone new law, which is a bill that passed in Congress. Panel B summarizes characteristics of the new laws,and one observation corresponds to one new law. Panel C compares characteristics of lobbying companieswith characteristics of their non-lobbying competitor companies, and one observation corresponds to onecompany in a given Congress. Non-lobbying companies do not lobby during the Congress and operate inthe same industry with lobbying companies based on the product similarity of Hoberg and Phillips (2010,2016). t-statistics are clustered by company. The symbols ***,**,* denote statistical significance at 1%, 5%and 10% levels. Table A1 describes all the variables.
Panel A. Lobbying activity Mean St.dev. Min Median Max Obs
Company-Congress levelLobbying per Congress, $m 3.97 8.59 0.00 0.93 58.76 4,207Lobbying per Congress/Rev., % 0.15 0.51 0.00 0.03 4.11 3,648Number of bills 20.07 28.70 1.00 8.00 153.00 4,207
Company-bill levelCompany lobbying, $m 0.20 0.35 0.00 0.08 2.20 87,112Company lobbying on new law, $m 0.22 0.40 0.00 0.08 2.50 12,682
New law levelExpenses total, $m 4.52 9.40 0.00 0.65 53.92 789Lobbying 0.96 1.07 0.00 0.50 4.62 789
Panel B. New laws characteristics Mean St.dev. Min Median Max Obs
Voting margin 1st Chamber, % 39.65 15.63 0.12 49.28 50.00 583Voting margin 2nd Chamber, % 44.44 11.72 0.76 50.00 50.00 616House originated, % 71.23 45.30 0.00 100.00 100.00 789Number of co-sponsors 20.84 44.71 1.00 5.00 275.00 789Number of words, K 21.85 51.74 0.12 2.68 285.26 789Times to passage, months 6.56 6.15 0.03 4.93 22.67 789Number of amendments 22.82 54.50 0.00 2.00 273.00 789Crowded bill, % 3.68 18.83 0.00 0.00 100.00 789Number of lobbying companies 16 31 1 4 186 789Number of non-lobbying companies 321 456 2 109 1,964 789
Panel C. Company characteristicsLobbyingcompanies
Non-lobbyingcompanies (1)-(2) t-stat
Mean (1) Obs Mean (2) Obs
Number of employees, K 34.39 3,019 3.89 20,788 30.49 16.21***Market capitalization, $bn 19.11 3,053 1.51 21,201 17.60 16.63***Book-to-market 0.62 2,661 0.75 19,275 -0.12 -7.36***Gross profitability 0.26 2,661 0.23 19,281 0.03 3.36***Cash, $bn 2.53 3,050 0.21 21,227 2.33 14.30***Cash/Total assets 0.15 3,050 0.20 21,227 -0.06 -9.66***Debt/Total assets 0.24 2,652 0.16 19,227 0.08 12.49***R&D/sales 0.10 2,661 0.41 19,289 -0.32 -11.74***
37
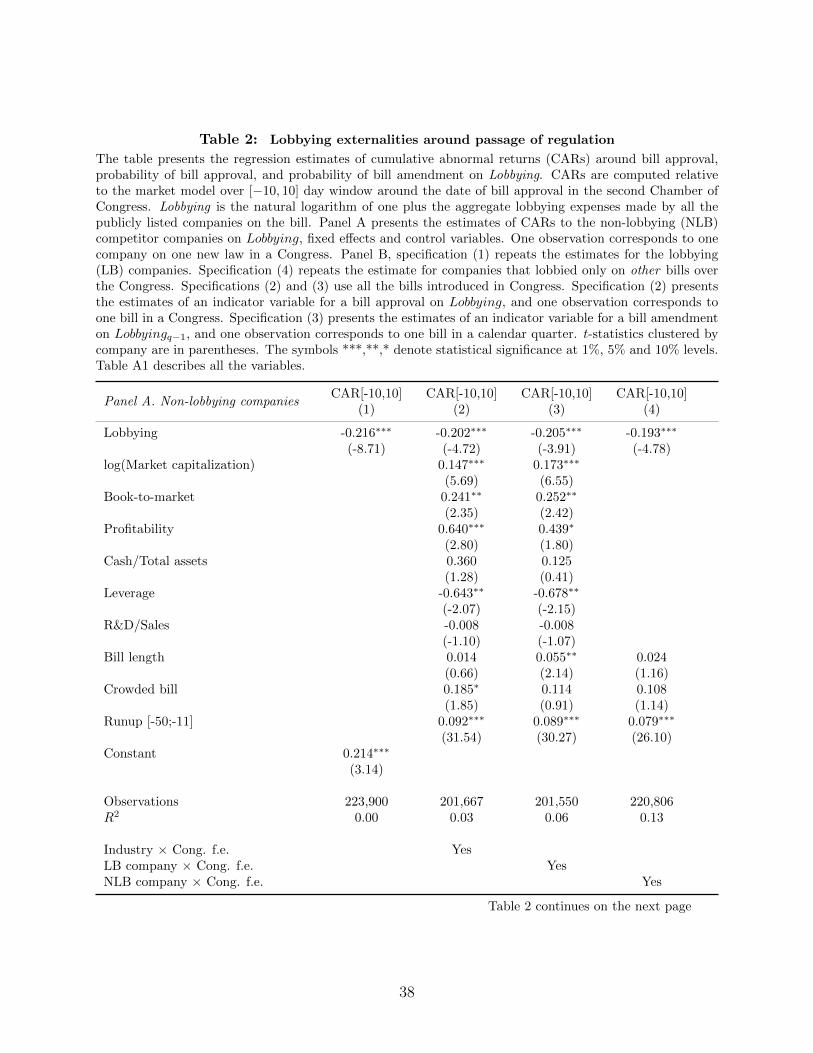
Table 2: Lobbying externalities around passage of regulation
The table presents the regression estimates of cumulative abnormal returns (CARs) around bill approval,probability of bill approval, and probability of bill amendment on Lobbying. CARs are computed relativeto the market model over [−10, 10] day window around the date of bill approval in the second Chamber ofCongress. Lobbying is the natural logarithm of one plus the aggregate lobbying expenses made by all thepublicly listed companies on the bill. Panel A presents the estimates of CARs to the non-lobbying (NLB)competitor companies on Lobbying, fixed effects and control variables. One observation corresponds to onecompany on one new law in a Congress. Panel B, specification (1) repeats the estimates for the lobbying(LB) companies. Specification (4) repeats the estimate for companies that lobbied only on other bills overthe Congress. Specifications (2) and (3) use all the bills introduced in Congress. Specification (2) presentsthe estimates of an indicator variable for a bill approval on Lobbying, and one observation corresponds toone bill in a Congress. Specification (3) presents the estimates of an indicator variable for a bill amendmenton Lobbyingq−1, and one observation corresponds to one bill in a calendar quarter. t-statistics clustered bycompany are in parentheses. The symbols ***,**,* denote statistical significance at 1%, 5% and 10% levels.Table A1 describes all the variables.
Panel A. Non-lobbying companiesCAR[-10,10] CAR[-10,10] CAR[-10,10] CAR[-10,10]
(1) (2) (3) (4)
Lobbying -0.216∗∗∗ -0.202∗∗∗ -0.205∗∗∗ -0.193∗∗∗
(-8.71) (-4.72) (-3.91) (-4.78)log(Market capitalization) 0.147∗∗∗ 0.173∗∗∗
(5.69) (6.55)Book-to-market 0.241∗∗ 0.252∗∗
(2.35) (2.42)Profitability 0.640∗∗∗ 0.439∗
(2.80) (1.80)Cash/Total assets 0.360 0.125
(1.28) (0.41)Leverage -0.643∗∗ -0.678∗∗
(-2.07) (-2.15)R&D/Sales -0.008 -0.008
(-1.10) (-1.07)Bill length 0.014 0.055∗∗ 0.024
(0.66) (2.14) (1.16)Crowded bill 0.185∗ 0.114 0.108
(1.85) (0.91) (1.14)Runup [-50;-11] 0.092∗∗∗ 0.089∗∗∗ 0.079∗∗∗
(31.54) (30.27) (26.10)Constant 0.214∗∗∗
(3.14)
Observations 223,900 201,667 201,550 220,806R2 0.00 0.03 0.06 0.13
Industry × Cong. f.e. YesLB company × Cong. f.e. YesNLB company × Cong. f.e. Yes
Table 2 continues on the next page
38
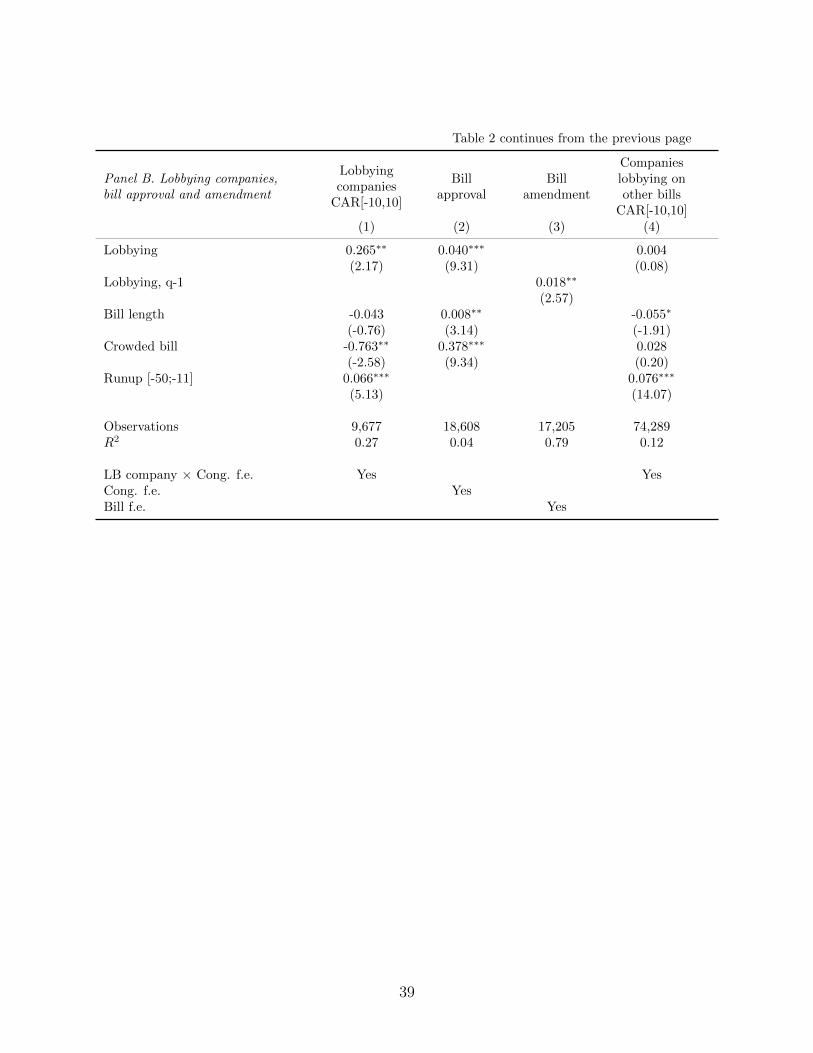
Table 2 continues from the previous page
Panel B. Lobbying companies,bill approval and amendment
Lobbyingcompanies
CAR[-10,10]
Billapproval
Billamendment
Companieslobbying onother bills
CAR[-10,10](1) (2) (3) (4)
Lobbying 0.265∗∗ 0.040∗∗∗ 0.004(2.17) (9.31) (0.08)
Lobbying, q-1 0.018∗∗
(2.57)Bill length -0.043 0.008∗∗ -0.055∗
(-0.76) (3.14) (-1.91)Crowded bill -0.763∗∗ 0.378∗∗∗ 0.028
(-2.58) (9.34) (0.20)Runup [-50;-11] 0.066∗∗∗ 0.076∗∗∗
(5.13) (14.07)
Observations 9,677 18,608 17,205 74,289R2 0.27 0.04 0.79 0.12
LB company × Cong. f.e. Yes YesCong. f.e. YesBill f.e. Yes
39
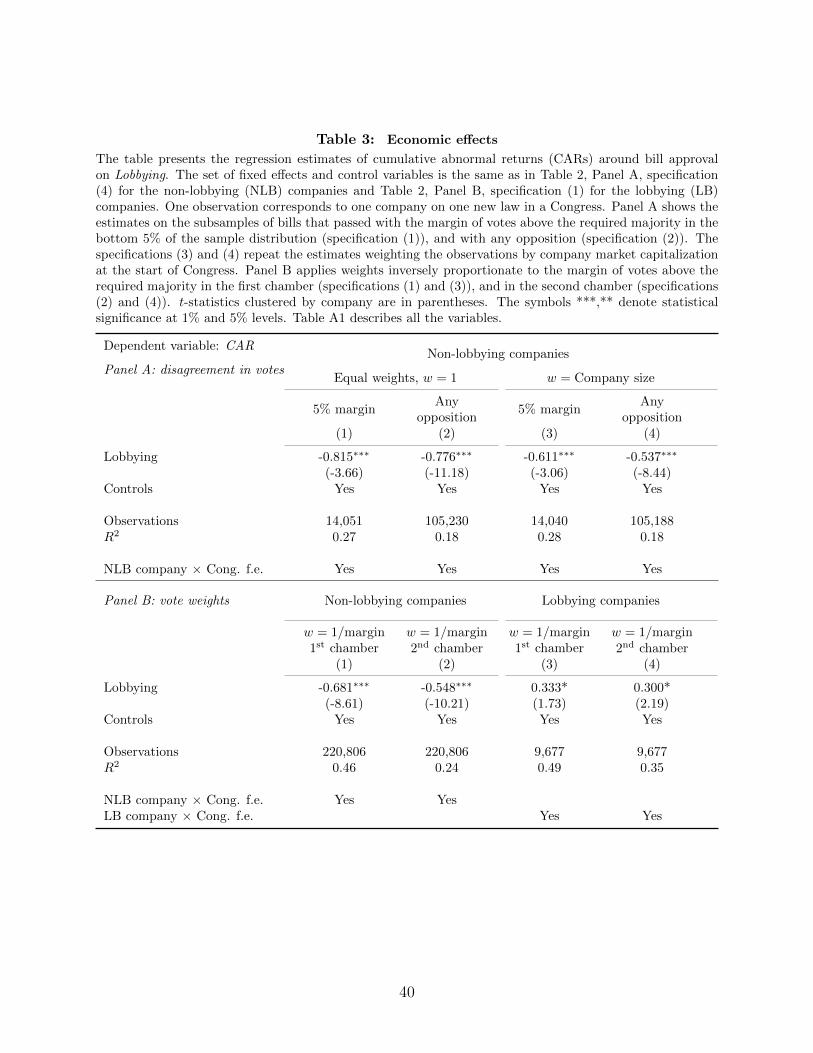
Table 3: Economic effects
The table presents the regression estimates of cumulative abnormal returns (CARs) around bill approvalon Lobbying. The set of fixed effects and control variables is the same as in Table 2, Panel A, specification(4) for the non-lobbying (NLB) companies and Table 2, Panel B, specification (1) for the lobbying (LB)companies. One observation corresponds to one company on one new law in a Congress. Panel A shows theestimates on the subsamples of bills that passed with the margin of votes above the required majority in thebottom 5% of the sample distribution (specification (1)), and with any opposition (specification (2)). Thespecifications (3) and (4) repeat the estimates weighting the observations by company market capitalizationat the start of Congress. Panel B applies weights inversely proportionate to the margin of votes above therequired majority in the first chamber (specifications (1) and (3)), and in the second chamber (specifications(2) and (4)). t-statistics clustered by company are in parentheses. The symbols ***,** denote statisticalsignificance at 1% and 5% levels. Table A1 describes all the variables.
Dependent variable: CARNon-lobbying companies
Panel A: disagreement in votesEqual weights, w = 1 w = Company size
5% marginAny
opposition5% margin
Anyopposition
(1) (2) (3) (4)
Lobbying -0.815∗∗∗ -0.776∗∗∗ -0.611∗∗∗ -0.537∗∗∗
(-3.66) (-11.18) (-3.06) (-8.44)Controls Yes Yes Yes Yes
Observations 14,051 105,230 14,040 105,188R2 0.27 0.18 0.28 0.18
NLB company × Cong. f.e. Yes Yes Yes Yes
Panel B: vote weights Non-lobbying companies Lobbying companies
w = 1/margin1st chamber
w = 1/margin2nd chamber
w = 1/margin1st chamber
w = 1/margin2nd chamber
(1) (2) (3) (4)
Lobbying -0.681∗∗∗ -0.548∗∗∗ 0.333* 0.300*(-8.61) (-10.21) (1.73) (2.19)
Controls Yes Yes Yes Yes
Observations 220,806 220,806 9,677 9,677R2 0.46 0.24 0.49 0.35
NLB company × Cong. f.e. Yes YesLB company × Cong. f.e. Yes Yes
40
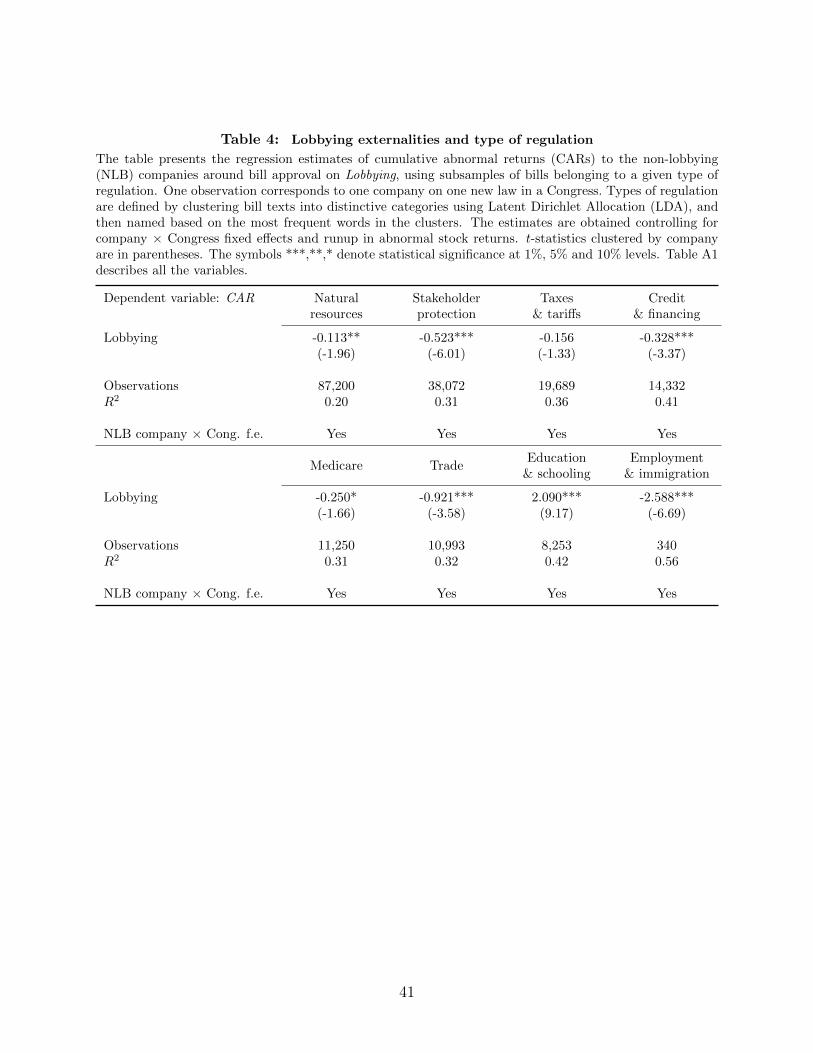
Table 4: Lobbying externalities and type of regulation
The table presents the regression estimates of cumulative abnormal returns (CARs) to the non-lobbying(NLB) companies around bill approval on Lobbying, using subsamples of bills belonging to a given type ofregulation. One observation corresponds to one company on one new law in a Congress. Types of regulationare defined by clustering bill texts into distinctive categories using Latent Dirichlet Allocation (LDA), andthen named based on the most frequent words in the clusters. The estimates are obtained controlling forcompany × Congress fixed effects and runup in abnormal stock returns. t-statistics clustered by companyare in parentheses. The symbols ***,**,* denote statistical significance at 1%, 5% and 10% levels. Table A1describes all the variables.
Dependent variable: CAR Naturalresources
Stakeholderprotection
Taxes& tariffs
Credit& financing
Lobbying -0.113** -0.523*** -0.156 -0.328***(-1.96) (-6.01) (-1.33) (-3.37)
Observations 87,200 38,072 19,689 14,332R2 0.20 0.31 0.36 0.41
NLB company × Cong. f.e. Yes Yes Yes Yes
Medicare TradeEducation
& schoolingEmployment
& immigration
Lobbying -0.250* -0.921*** 2.090*** -2.588***(-1.66) (-3.58) (9.17) (-6.69)
Observations 11,250 10,993 8,253 340R2 0.31 0.32 0.42 0.56
NLB company × Cong. f.e. Yes Yes Yes Yes
41
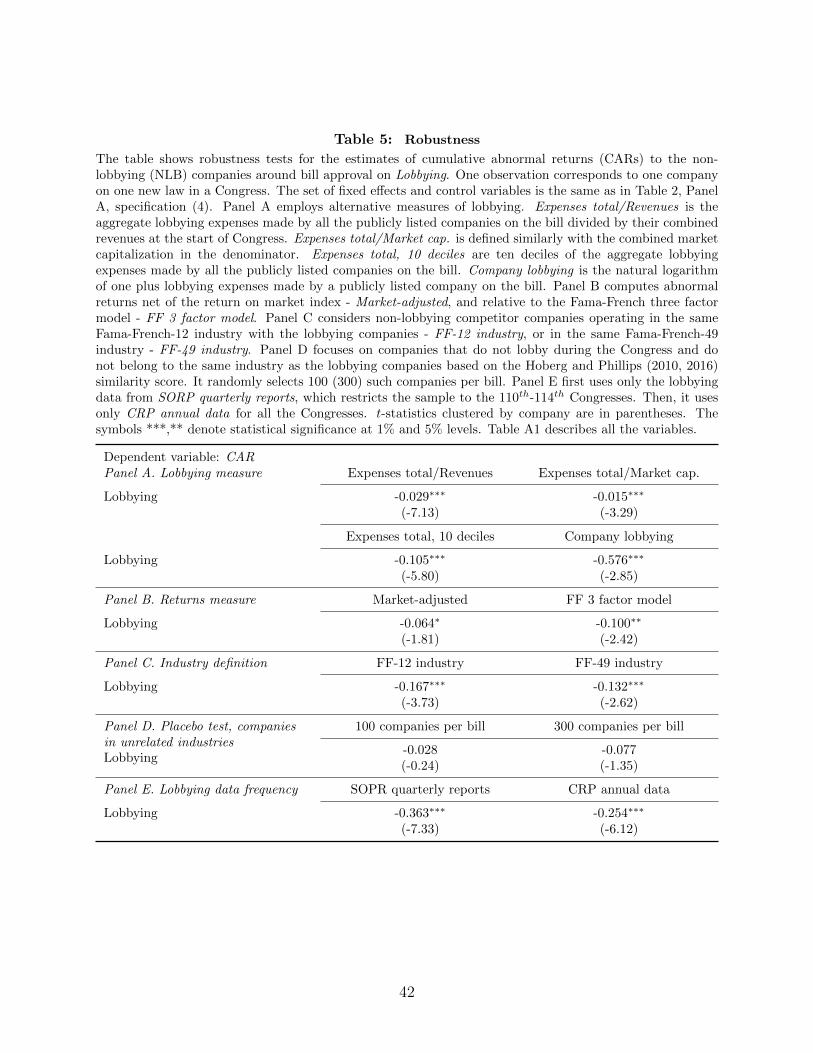
Table 5: Robustness
The table shows robustness tests for the estimates of cumulative abnormal returns (CARs) to the non-lobbying (NLB) companies around bill approval on Lobbying. One observation corresponds to one companyon one new law in a Congress. The set of fixed effects and control variables is the same as in Table 2, PanelA, specification (4). Panel A employs alternative measures of lobbying. Expenses total/Revenues is theaggregate lobbying expenses made by all the publicly listed companies on the bill divided by their combinedrevenues at the start of Congress. Expenses total/Market cap. is defined similarly with the combined marketcapitalization in the denominator. Expenses total, 10 deciles are ten deciles of the aggregate lobbyingexpenses made by all the publicly listed companies on the bill. Company lobbying is the natural logarithmof one plus lobbying expenses made by a publicly listed company on the bill. Panel B computes abnormalreturns net of the return on market index - Market-adjusted, and relative to the Fama-French three factormodel - FF 3 factor model. Panel C considers non-lobbying competitor companies operating in the sameFama-French-12 industry with the lobbying companies - FF-12 industry, or in the same Fama-French-49industry - FF-49 industry. Panel D focuses on companies that do not lobby during the Congress and donot belong to the same industry as the lobbying companies based on the Hoberg and Phillips (2010, 2016)similarity score. It randomly selects 100 (300) such companies per bill. Panel E first uses only the lobbyingdata from SORP quarterly reports, which restricts the sample to the 110th-114th Congresses. Then, it usesonly CRP annual data for all the Congresses. t-statistics clustered by company are in parentheses. Thesymbols ***,** denote statistical significance at 1% and 5% levels. Table A1 describes all the variables.
Dependent variable: CARPanel A. Lobbying measure Expenses total/Revenues Expenses total/Market cap.
Lobbying -0.029∗∗∗ -0.015∗∗∗
(-7.13) (-3.29)
Expenses total, 10 deciles Company lobbying
Lobbying -0.105∗∗∗ -0.576∗∗∗
(-5.80) (-2.85)
Panel B. Returns measure Market-adjusted FF 3 factor model
Lobbying -0.064∗ -0.100∗∗
(-1.81) (-2.42)
Panel C. Industry definition FF-12 industry FF-49 industry
Lobbying -0.167∗∗∗ -0.132∗∗∗
(-3.73) (-2.62)
Panel D. Placebo test, companiesin unrelated industries
100 companies per bill 300 companies per bill
Lobbying-0.028(-0.24)
-0.077(-1.35)
Panel E. Lobbying data frequency SOPR quarterly reports CRP annual data
Lobbying -0.363∗∗∗ -0.254∗∗∗
(-7.33) (-6.12)
42
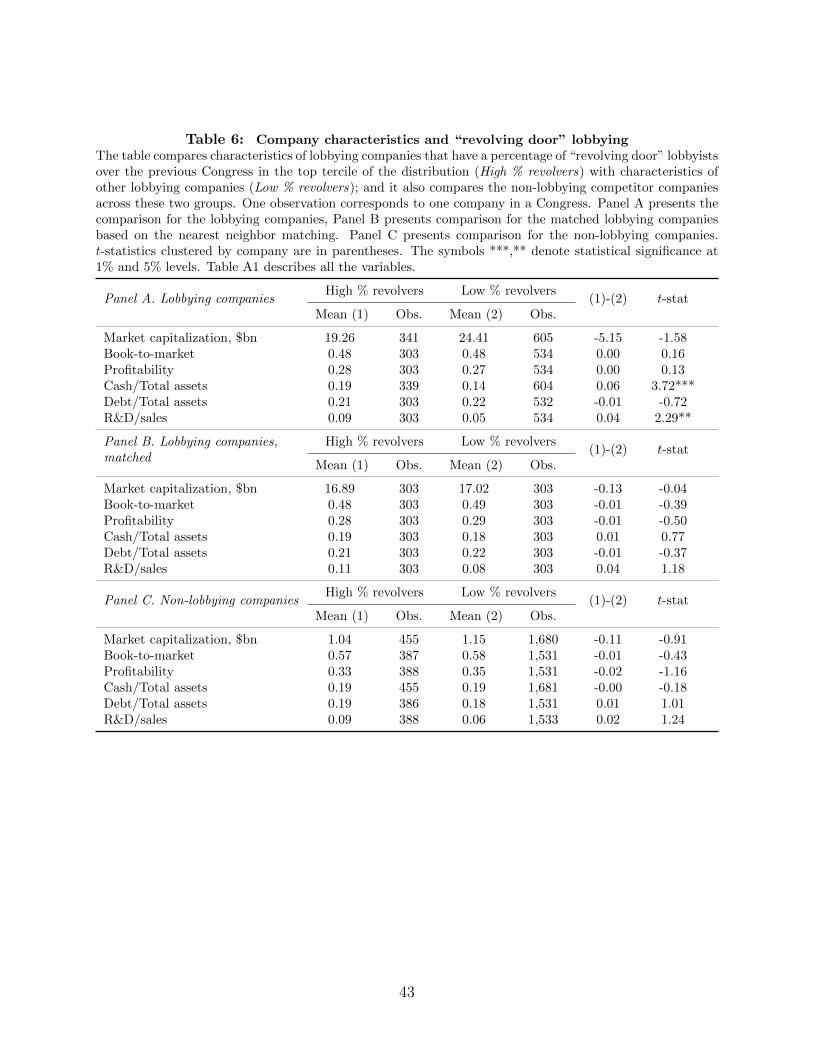
Table 6: Company characteristics and “revolving door” lobbyingThe table compares characteristics of lobbying companies that have a percentage of “revolving door” lobbyistsover the previous Congress in the top tercile of the distribution (High % revolvers) with characteristics ofother lobbying companies (Low % revolvers); and it also compares the non-lobbying competitor companiesacross these two groups. One observation corresponds to one company in a Congress. Panel A presents thecomparison for the lobbying companies, Panel B presents comparison for the matched lobbying companiesbased on the nearest neighbor matching. Panel C presents comparison for the non-lobbying companies.t-statistics clustered by company are in parentheses. The symbols ***,** denote statistical significance at1% and 5% levels. Table A1 describes all the variables.
Panel A. Lobbying companiesHigh % revolvers Low % revolvers
(1)-(2) t-statMean (1) Obs. Mean (2) Obs.
Market capitalization, $bn 19.26 341 24.41 605 -5.15 -1.58Book-to-market 0.48 303 0.48 534 0.00 0.16Profitability 0.28 303 0.27 534 0.00 0.13Cash/Total assets 0.19 339 0.14 604 0.06 3.72***Debt/Total assets 0.21 303 0.22 532 -0.01 -0.72R&D/sales 0.09 303 0.05 534 0.04 2.29**
Panel B. Lobbying companies,matched
High % revolvers Low % revolvers(1)-(2) t-stat
Mean (1) Obs. Mean (2) Obs.
Market capitalization, $bn 16.89 303 17.02 303 -0.13 -0.04Book-to-market 0.48 303 0.49 303 -0.01 -0.39Profitability 0.28 303 0.29 303 -0.01 -0.50Cash/Total assets 0.19 303 0.18 303 0.01 0.77Debt/Total assets 0.21 303 0.22 303 -0.01 -0.37R&D/sales 0.11 303 0.08 303 0.04 1.18
Panel C. Non-lobbying companiesHigh % revolvers Low % revolvers
(1)-(2) t-statMean (1) Obs. Mean (2) Obs.
Market capitalization, $bn 1.04 455 1.15 1,680 -0.11 -0.91Book-to-market 0.57 387 0.58 1,531 -0.01 -0.43Profitability 0.33 388 0.35 1,531 -0.02 -1.16Cash/Total assets 0.19 455 0.19 1,681 -0.00 -0.18Debt/Total assets 0.19 386 0.18 1,531 0.01 1.01R&D/sales 0.09 388 0.06 1,533 0.02 1.24
43
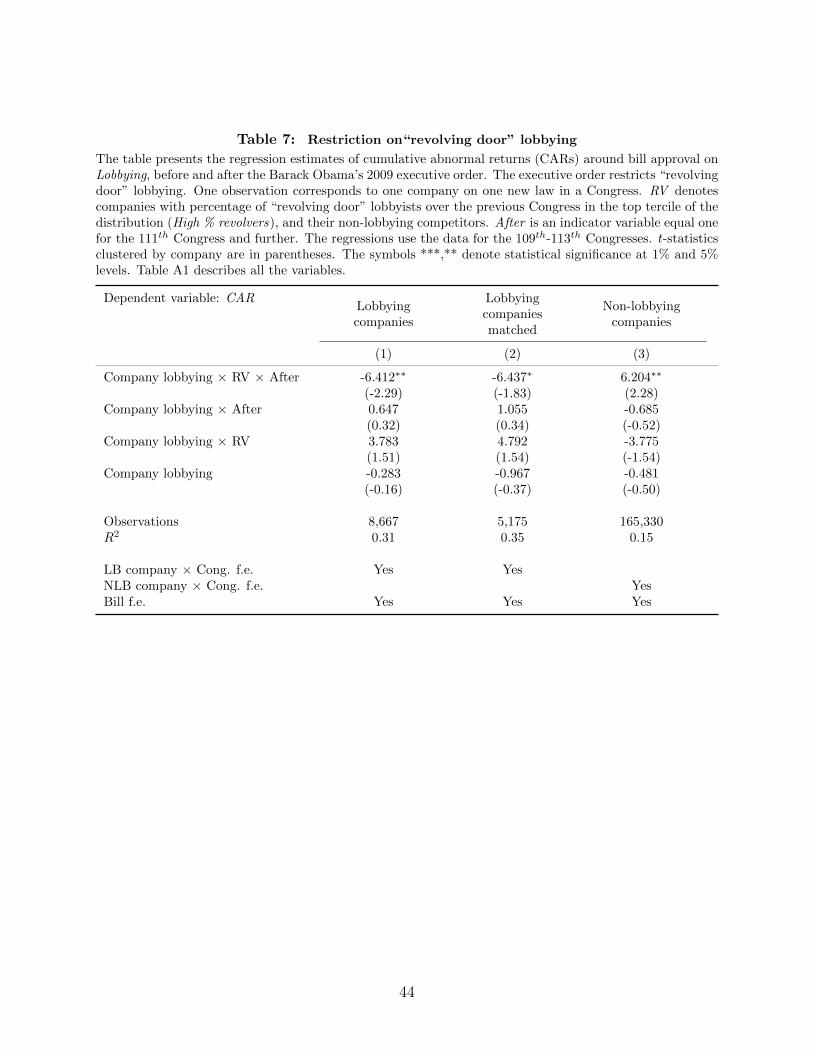
Table 7: Restriction on“revolving door” lobbying
The table presents the regression estimates of cumulative abnormal returns (CARs) around bill approval onLobbying, before and after the Barack Obama’s 2009 executive order. The executive order restricts “revolvingdoor” lobbying. One observation corresponds to one company on one new law in a Congress. RV denotescompanies with percentage of “revolving door” lobbyists over the previous Congress in the top tercile of thedistribution (High % revolvers), and their non-lobbying competitors. After is an indicator variable equal onefor the 111th Congress and further. The regressions use the data for the 109th-113th Congresses. t-statisticsclustered by company are in parentheses. The symbols ***,** denote statistical significance at 1% and 5%levels. Table A1 describes all the variables.
Dependent variable: CARLobbyingcompanies
Lobbyingcompaniesmatched
Non-lobbyingcompanies
(1) (2) (3)
Company lobbying × RV × After -6.412∗∗ -6.437∗ 6.204∗∗
(-2.29) (-1.83) (2.28)Company lobbying × After 0.647 1.055 -0.685
(0.32) (0.34) (-0.52)Company lobbying × RV 3.783 4.792 -3.775
(1.51) (1.54) (-1.54)Company lobbying -0.283 -0.967 -0.481
(-0.16) (-0.37) (-0.50)
Observations 8,667 5,175 165,330R2 0.31 0.35 0.15
LB company × Cong. f.e. Yes YesNLB company × Cong. f.e. YesBill f.e. Yes Yes Yes
44
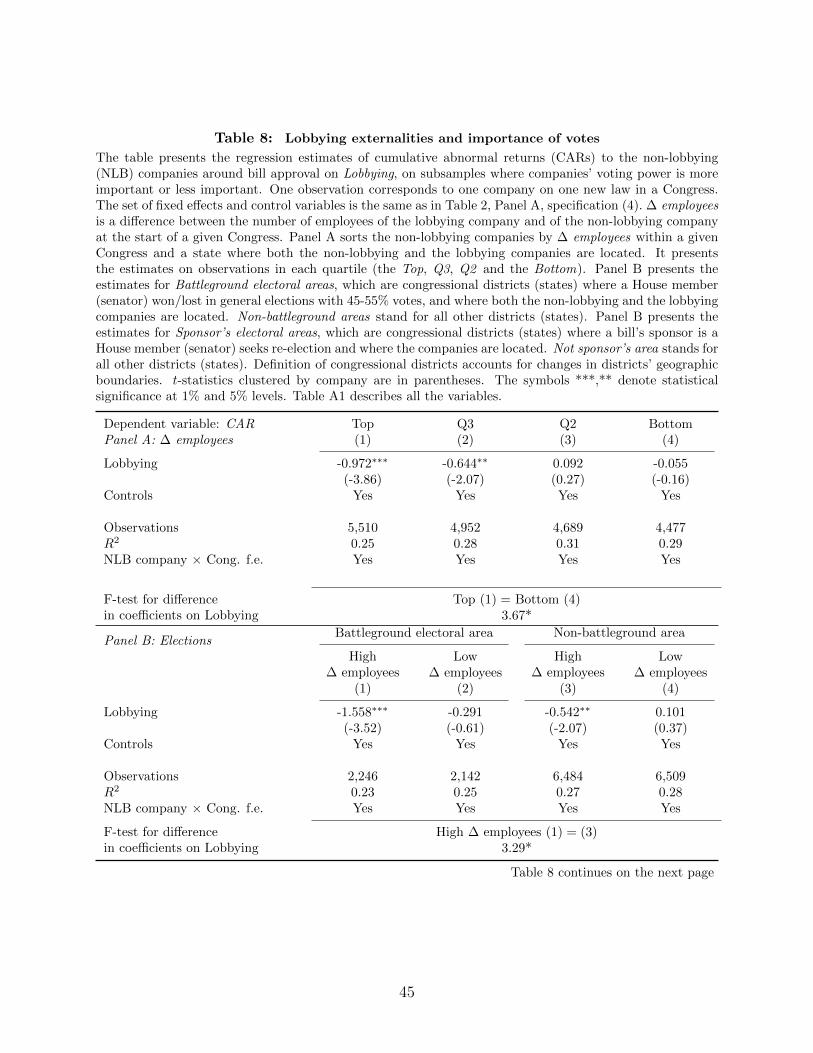
Table 8: Lobbying externalities and importance of votes
The table presents the regression estimates of cumulative abnormal returns (CARs) to the non-lobbying(NLB) companies around bill approval on Lobbying, on subsamples where companies’ voting power is moreimportant or less important. One observation corresponds to one company on one new law in a Congress.The set of fixed effects and control variables is the same as in Table 2, Panel A, specification (4). ∆ employeesis a difference between the number of employees of the lobbying company and of the non-lobbying companyat the start of a given Congress. Panel A sorts the non-lobbying companies by ∆ employees within a givenCongress and a state where both the non-lobbying and the lobbying companies are located. It presentsthe estimates on observations in each quartile (the Top, Q3, Q2 and the Bottom). Panel B presents theestimates for Battleground electoral areas, which are congressional districts (states) where a House member(senator) won/lost in general elections with 45-55% votes, and where both the non-lobbying and the lobbyingcompanies are located. Non-battleground areas stand for all other districts (states). Panel B presents theestimates for Sponsor’s electoral areas, which are congressional districts (states) where a bill’s sponsor is aHouse member (senator) seeks re-election and where the companies are located. Not sponsor’s area stands forall other districts (states). Definition of congressional districts accounts for changes in districts’ geographicboundaries. t-statistics clustered by company are in parentheses. The symbols ***,** denote statisticalsignificance at 1% and 5% levels. Table A1 describes all the variables.
Dependent variable: CAR Top Q3 Q2 BottomPanel A: ∆ employees (1) (2) (3) (4)
Lobbying -0.972∗∗∗ -0.644∗∗ 0.092 -0.055(-3.86) (-2.07) (0.27) (-0.16)
Controls Yes Yes Yes Yes
Observations 5,510 4,952 4,689 4,477R2 0.25 0.28 0.31 0.29NLB company × Cong. f.e. Yes Yes Yes Yes
F-test for differencein coefficients on Lobbying
Top (1) = Bottom (4)3.67*
Panel B: ElectionsBattleground electoral area Non-battleground area
High Low High Low∆ employees ∆ employees ∆ employees ∆ employees
(1) (2) (3) (4)
Lobbying -1.558∗∗∗ -0.291 -0.542∗∗ 0.101(-3.52) (-0.61) (-2.07) (0.37)
Controls Yes Yes Yes Yes
Observations 2,246 2,142 6,484 6,509R2 0.23 0.25 0.27 0.28NLB company × Cong. f.e. Yes Yes Yes Yes
F-test for differencein coefficients on Lobbying
High ∆ employees (1) = (3)3.29*
Table 8 continues on the next page
45
Table 8 continues from the previous page
Panel C: Bill sponsor’s electorateSponsor’s electoral areas Not sponsor’s area
High Low High Low∆ employees ∆ employees ∆ employees ∆ employees
(1) (2) (3) (4)
Lobbying -4.262∗∗ 0.867 -0.444∗ 0.152(-1.98) (0.50) (-1.76) (0.69)
Controls Yes Yes Yes Yes
Observations 235 236 7,492 7,439R2 0.22 0.13 0.03 0.03Cong. f.e. Yes Yes Yes Yes
F-test for differencein coefficients on Lobbying
High ∆ employees (1) = (3)3.40*
46
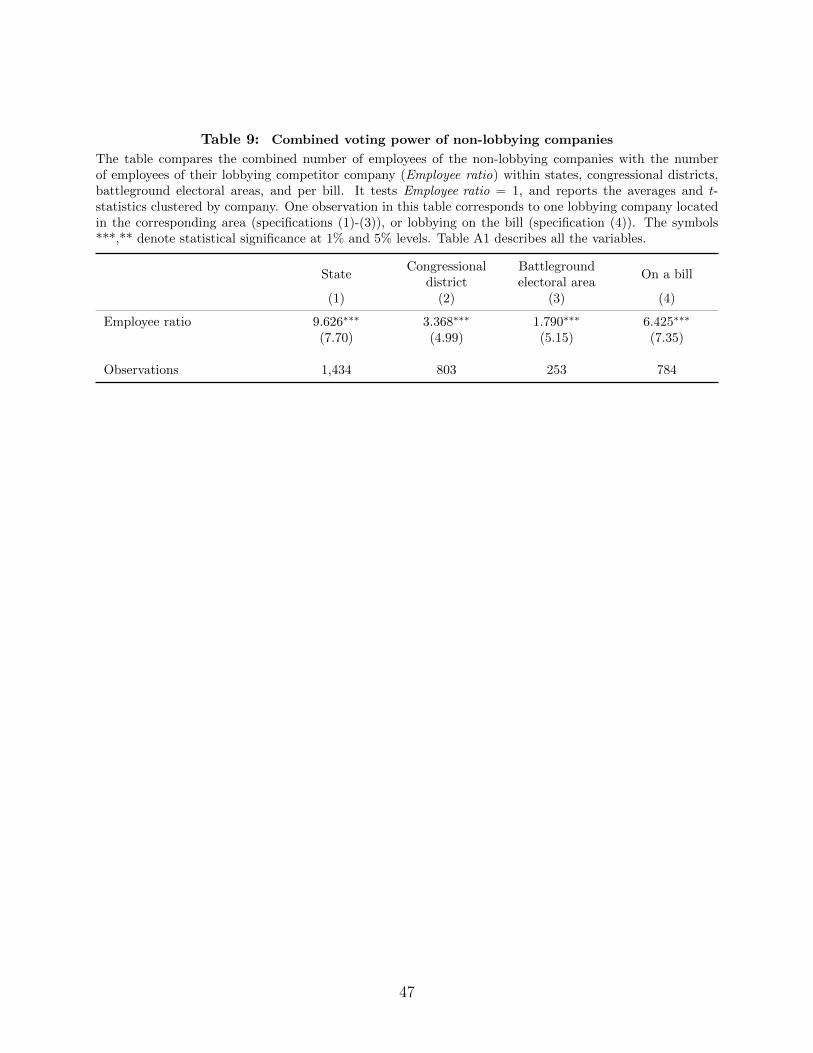
Table 9: Combined voting power of non-lobbying companies
The table compares the combined number of employees of the non-lobbying companies with the numberof employees of their lobbying competitor company (Employee ratio) within states, congressional districts,battleground electoral areas, and per bill. It tests Employee ratio = 1, and reports the averages and t-statistics clustered by company. One observation in this table corresponds to one lobbying company locatedin the corresponding area (specifications (1)-(3)), or lobbying on the bill (specification (4)). The symbols***,** denote statistical significance at 1% and 5% levels. Table A1 describes all the variables.
StateCongressional
districtBattlegroundelectoral area
On a bill
(1) (2) (3) (4)
Employee ratio 9.626∗∗∗ 3.368∗∗∗ 1.790∗∗∗ 6.425∗∗∗
(7.70) (4.99) (5.15) (7.35)
Observations 1,434 803 253 784
47
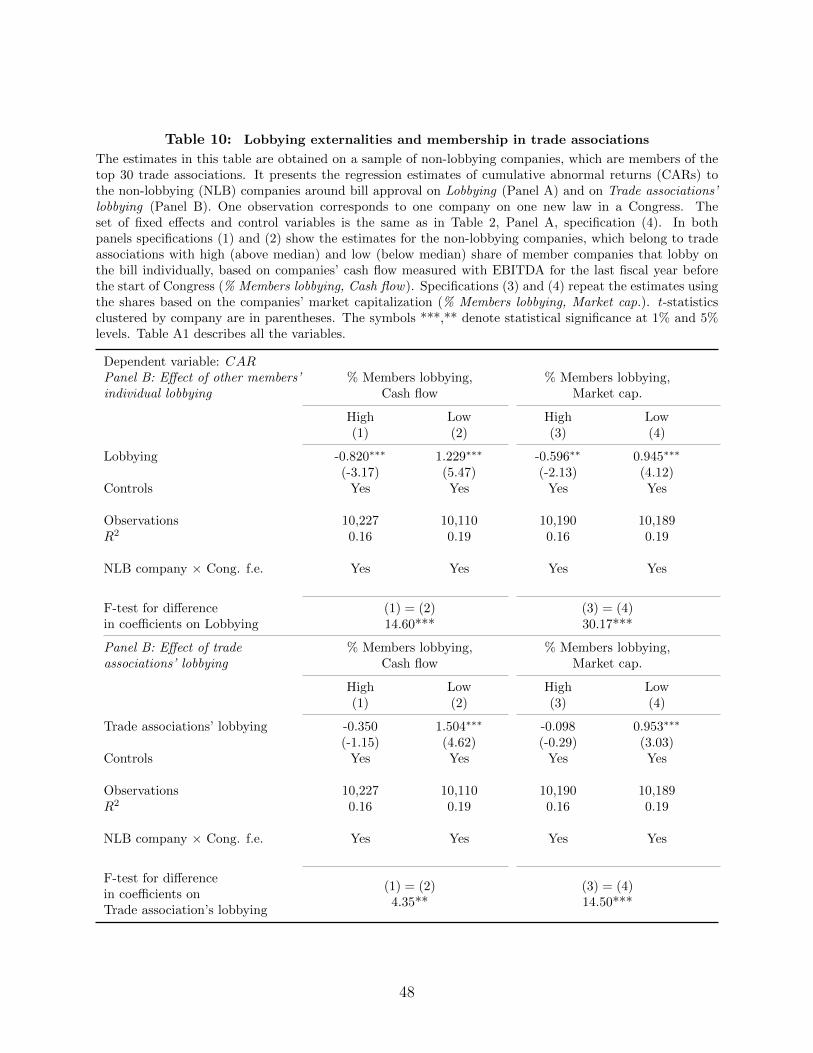
Table 10: Lobbying externalities and membership in trade associations
The estimates in this table are obtained on a sample of non-lobbying companies, which are members of thetop 30 trade associations. It presents the regression estimates of cumulative abnormal returns (CARs) tothe non-lobbying (NLB) companies around bill approval on Lobbying (Panel A) and on Trade associations’lobbying (Panel B). One observation corresponds to one company on one new law in a Congress. Theset of fixed effects and control variables is the same as in Table 2, Panel A, specification (4). In bothpanels specifications (1) and (2) show the estimates for the non-lobbying companies, which belong to tradeassociations with high (above median) and low (below median) share of member companies that lobby onthe bill individually, based on companies’ cash flow measured with EBITDA for the last fiscal year beforethe start of Congress (% Members lobbying, Cash flow). Specifications (3) and (4) repeat the estimates usingthe shares based on the companies’ market capitalization (% Members lobbying, Market cap.). t-statisticsclustered by company are in parentheses. The symbols ***,** denote statistical significance at 1% and 5%levels. Table A1 describes all the variables.
Dependent variable: CARPanel B: Effect of other members’individual lobbying
% Members lobbying,Cash flow
% Members lobbying,Market cap.
High Low High Low(1) (2) (3) (4)
Lobbying -0.820∗∗∗ 1.229∗∗∗ -0.596∗∗ 0.945∗∗∗
(-3.17) (5.47) (-2.13) (4.12)Controls Yes Yes Yes Yes
Observations 10,227 10,110 10,190 10,189R2 0.16 0.19 0.16 0.19
NLB company × Cong. f.e. Yes Yes Yes Yes
F-test for differencein coefficients on Lobbying
(1) = (2) (3) = (4)14.60*** 30.17***
Panel B: Effect of tradeassociations’ lobbying
% Members lobbying,Cash flow
% Members lobbying,Market cap.
High Low High Low(1) (2) (3) (4)
Trade associations’ lobbying -0.350 1.504∗∗∗ -0.098 0.953∗∗∗
(-1.15) (4.62) (-0.29) (3.03)Controls Yes Yes Yes Yes
Observations 10,227 10,110 10,190 10,189R2 0.16 0.19 0.16 0.19
NLB company × Cong. f.e. Yes Yes Yes Yes
F-test for differencein coefficients onTrade association’s lobbying
(1) = (2)4.35**
(3) = (4)14.50***
48
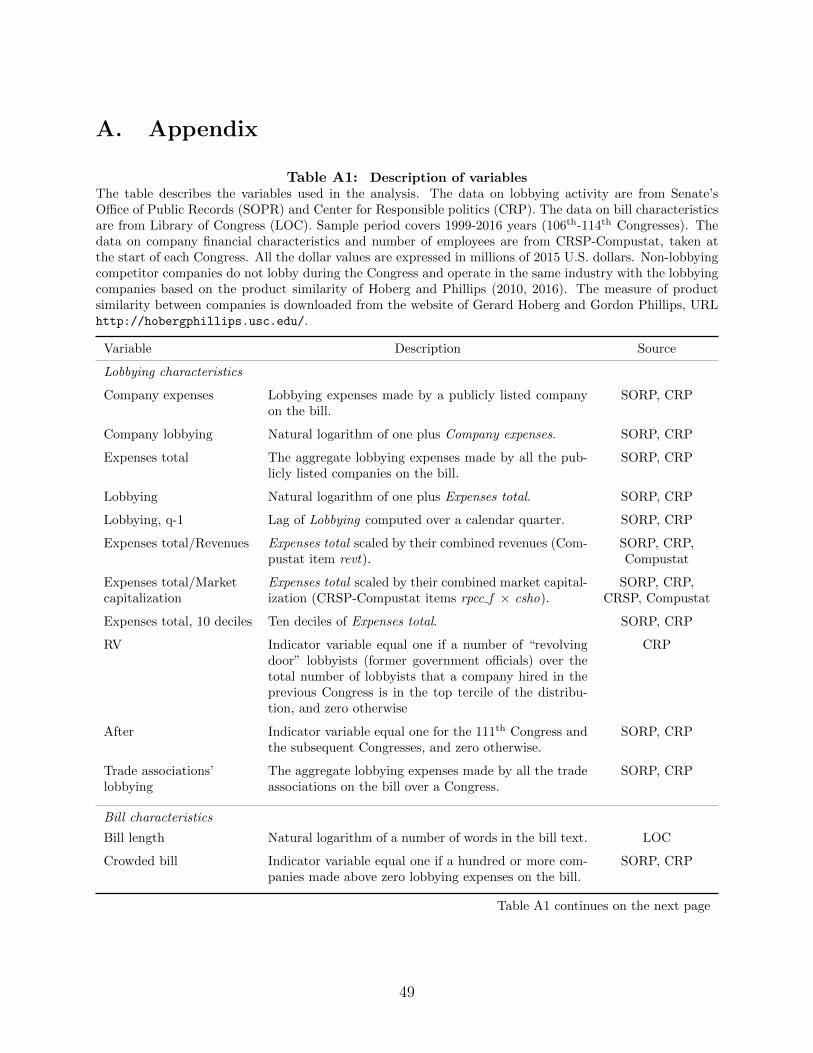
A. Appendix
Table A1: Description of variablesThe table describes the variables used in the analysis. The data on lobbying activity are from Senate’sOffice of Public Records (SOPR) and Center for Responsible politics (CRP). The data on bill characteristicsare from Library of Congress (LOC). Sample period covers 1999-2016 years (106th-114th Congresses). Thedata on company financial characteristics and number of employees are from CRSP-Compustat, taken atthe start of each Congress. All the dollar values are expressed in millions of 2015 U.S. dollars. Non-lobbyingcompetitor companies do not lobby during the Congress and operate in the same industry with the lobbyingcompanies based on the product similarity of Hoberg and Phillips (2010, 2016). The measure of productsimilarity between companies is downloaded from the website of Gerard Hoberg and Gordon Phillips, URLhttp://hobergphillips.usc.edu/.
Variable Description Source
Lobbying characteristics
Company expenses Lobbying expenses made by a publicly listed companyon the bill.
SORP, CRP
Company lobbying Natural logarithm of one plus Company expenses. SORP, CRP
Expenses total The aggregate lobbying expenses made by all the pub-licly listed companies on the bill.
SORP, CRP
Lobbying Natural logarithm of one plus Expenses total. SORP, CRP
Lobbying, q-1 Lag of Lobbying computed over a calendar quarter. SORP, CRP
Expenses total/Revenues Expenses total scaled by their combined revenues (Com-pustat item revt).
SORP, CRP,Compustat
Expenses total/Marketcapitalization
Expenses total scaled by their combined market capital-ization (CRSP-Compustat items rpcc f × csho).
SORP, CRP,CRSP, Compustat
Expenses total, 10 deciles Ten deciles of Expenses total. SORP, CRP
RV Indicator variable equal one if a number of “revolvingdoor” lobbyists (former government officials) over thetotal number of lobbyists that a company hired in theprevious Congress is in the top tercile of the distribu-tion, and zero otherwise
CRP
After Indicator variable equal one for the 111th Congress andthe subsequent Congresses, and zero otherwise.
SORP, CRP
Trade associations’lobbying
The aggregate lobbying expenses made by all the tradeassociations on the bill over a Congress.
SORP, CRP
Bill characteristics
Bill length Natural logarithm of a number of words in the bill text. LOC
Crowded bill Indicator variable equal one if a hundred or more com-panies made above zero lobbying expenses on the bill.
SORP, CRP
Table A1 continues on the next page
49
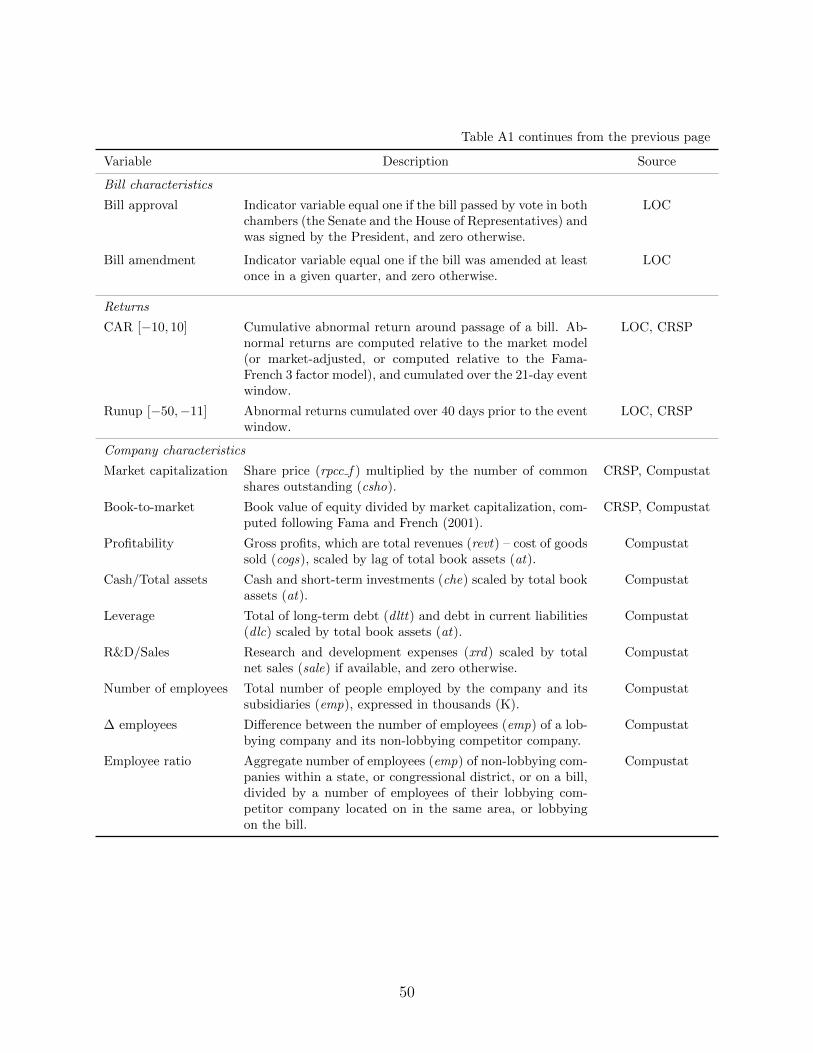
Table A1 continues from the previous page
Variable Description Source
Bill characteristics
Bill approval Indicator variable equal one if the bill passed by vote in bothchambers (the Senate and the House of Representatives) andwas signed by the President, and zero otherwise.
LOC
Bill amendment Indicator variable equal one if the bill was amended at leastonce in a given quarter, and zero otherwise.
LOC
Returns
CAR [−10, 10] Cumulative abnormal return around passage of a bill. Ab-normal returns are computed relative to the market model(or market-adjusted, or computed relative to the Fama-French 3 factor model), and cumulated over the 21-day eventwindow.
LOC, CRSP
Runup [−50,−11] Abnormal returns cumulated over 40 days prior to the eventwindow.
LOC, CRSP
Company characteristics
Market capitalization Share price (rpcc f ) multiplied by the number of commonshares outstanding (csho).
CRSP, Compustat
Book-to-market Book value of equity divided by market capitalization, com-puted following Fama and French (2001).
CRSP, Compustat
Profitability Gross profits, which are total revenues (revt) – cost of goodssold (cogs), scaled by lag of total book assets (at).
Compustat
Cash/Total assets Cash and short-term investments (che) scaled by total bookassets (at).
Compustat
Leverage Total of long-term debt (dltt) and debt in current liabilities(dlc) scaled by total book assets (at).
Compustat
R&D/Sales Research and development expenses (xrd) scaled by totalnet sales (sale) if available, and zero otherwise.
Compustat
Number of employees Total number of people employed by the company and itssubsidiaries (emp), expressed in thousands (K).
Compustat
∆ employees Difference between the number of employees (emp) of a lob-bying company and its non-lobbying competitor company.
Compustat
Employee ratio Aggregate number of employees (emp) of non-lobbying com-panies within a state, or congressional district, or on a bill,divided by a number of employees of their lobbying com-petitor company located on in the same area, or lobbyingon the bill.
Compustat
50
A.1. Matching lobbying data with CRSP
To identify which names of the lobbying organizations in the Senate’s Office of Public Records
(SOPR) and the Center for Responsive Politics (CRP) belong to publicly listed companies, I
match them with the full universe of names of the publicly listed companies in the Center for
Research in Security Prices (CRSP)-Compustat universe. From the CRP-Compustat I use
the full list of names associated with a given permanent company identifier (PERMCO) at
any point in time. This helps me to identify all the names associated with a given company
in the lobbying data. For some companies the CRP omits the information on lobbied bills,
and as a result, those companies are not in my final sample. Also, I use the full list of names
in SOPR and CRP, including the names of the organizations lobbying on bill that did not
pass, or ones with missing bill information in the CRP early sample years. This helps to
decrease a possibility of a type II error of falsely classifying lobbying firms as non-lobbying.
I perform matching in three stages. First, I clear both SOPR and CRP and CRSP
names from entity indicators such as “Inc.”, “Corp.” or “L.L.C”. Second, I find all the exact
matches. Third, I perform fuzzy-match on the remaining manes using the standard SAS
GOMPGED function. The function computes generalized edit distance between two names,
approximating the cost of converting one string into the other by replacing the characters.
I manually check accuracy of the best matches (one with minimum cost of conversion).
51
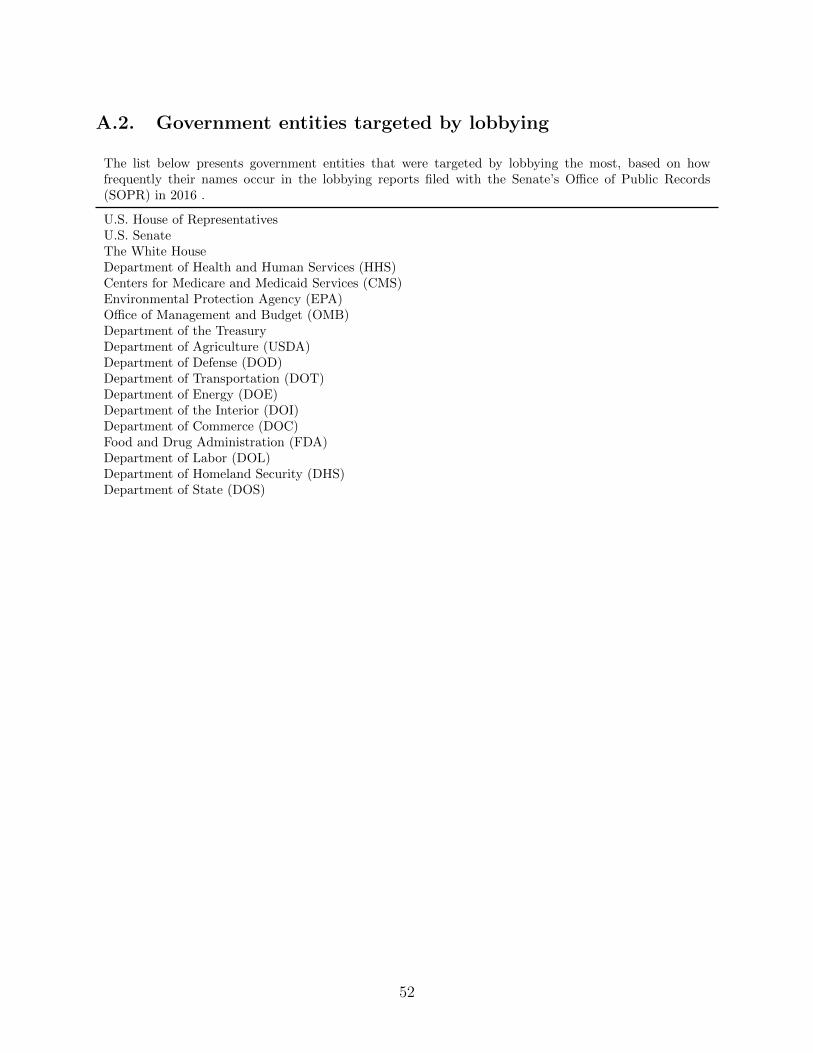
A.2. Government entities targeted by lobbying
The list below presents government entities that were targeted by lobbying the most, based on howfrequently their names occur in the lobbying reports filed with the Senate’s Office of Public Records(SOPR) in 2016 .
U.S. House of RepresentativesU.S. SenateThe White HouseDepartment of Health and Human Services (HHS)Centers for Medicare and Medicaid Services (CMS)Environmental Protection Agency (EPA)Office of Management and Budget (OMB)Department of the TreasuryDepartment of Agriculture (USDA)Department of Defense (DOD)Department of Transportation (DOT)Department of Energy (DOE)Department of the Interior (DOI)Department of Commerce (DOC)Food and Drug Administration (FDA)Department of Labor (DOL)Department of Homeland Security (DHS)Department of State (DOS)
52