Embed Size (px)
Citation preview
L’obésité de l’enfant et de l’adolescent : quels parcours, quels résultats ?
Jean-Claude Carel Hôpital Universitaire Robert-Debré
Paris
Planobésité
20102013
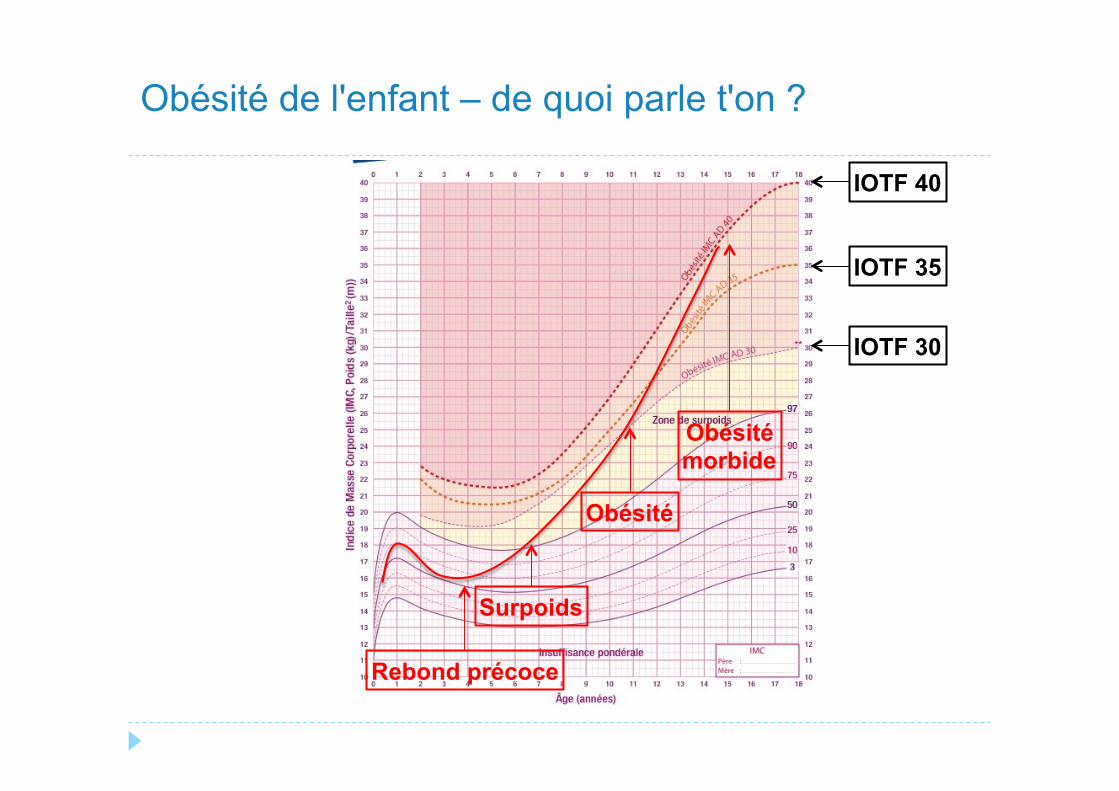
Obésité de l'enfant – de quoi parle t'on ?
Rebond précoce
Surpoids
Obésité
Obésité morbide
IOTF 40
IOTF 30
IOTF 35
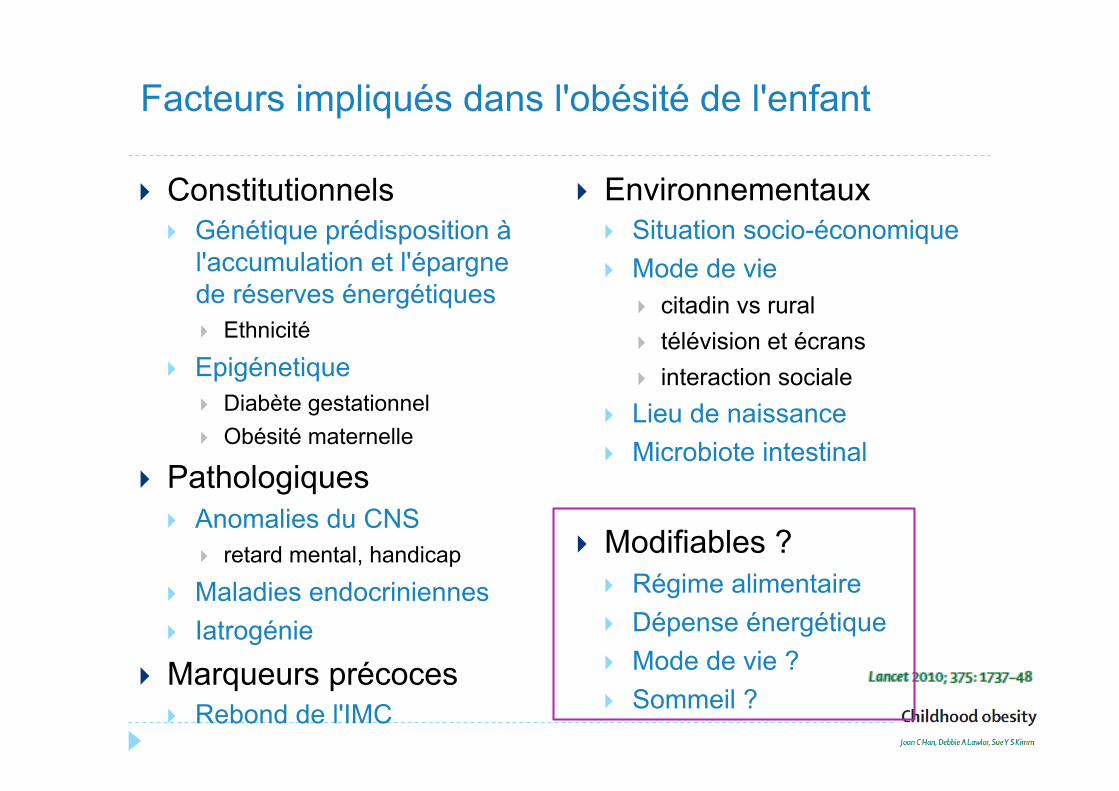
} Constitutionnels } Génétique prédisposition à
l'accumulation et l'épargne de réserves énergétiques } Ethnicité
} Epigénetique } Diabète gestationnel } Obésité maternelle
} Pathologiques } Anomalies du CNS
} retard mental, handicap
} Maladies endocriniennes } Iatrogénie
} Marqueurs précoces } Rebond de l'IMC
} Environnementaux } Situation socio-économique } Mode de vie
} citadin vs rural } télévision et écrans } interaction sociale
} Lieu de naissance } Microbiote intestinal
} Modifiables ? } Régime alimentaire } Dépense énergétique } Mode de vie ? } Sommeil ?
Facteurs impliqués dans l'obésité de l'enfant
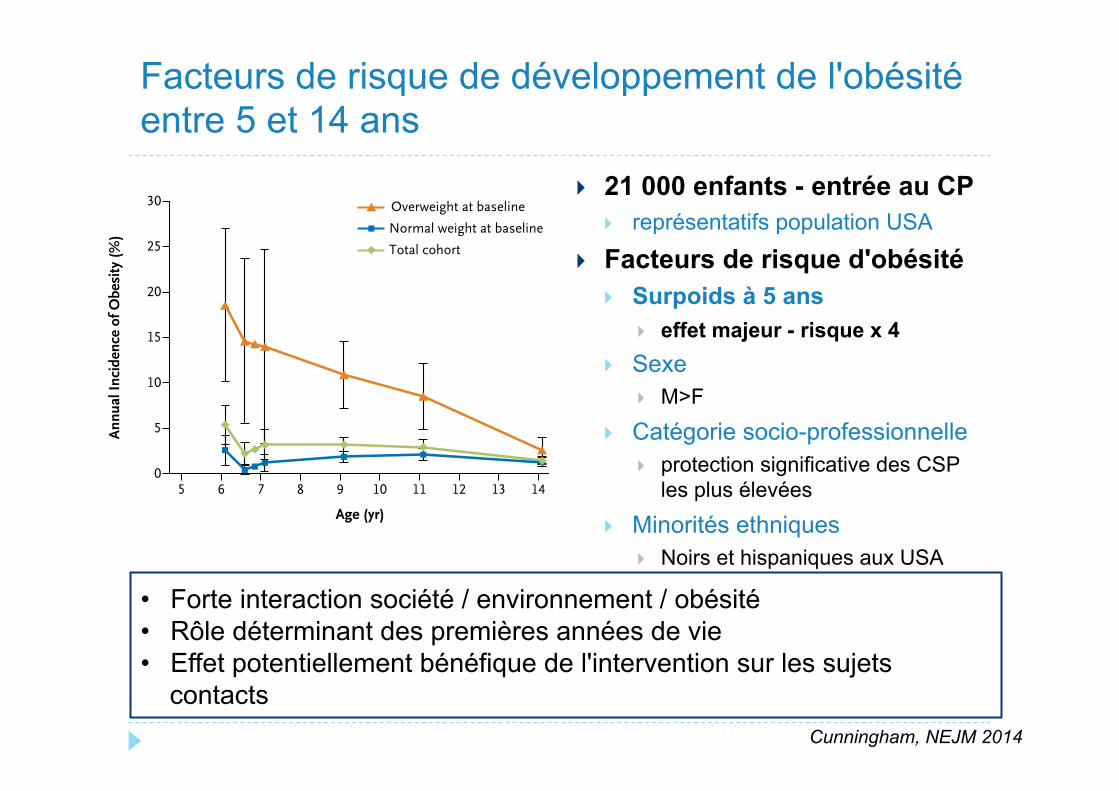
} 21 000 enfants - entrée au CP } représentatifs population USA
} Facteurs de risque d'obésité } Surpoids à 5 ans
} effet majeur - risque x 4 } Sexe
} M>F
} Catégorie socio-professionnelle } protection significative des CSP
les plus élevées
} Minorités ethniques } Noirs et hispaniques aux USA
} Poids de naissance } >4000 g, effet minime
Facteurs de risque de développement de l'obésité entre 5 et 14 ans
Incidence of Childhood Obesity in the United States
n engl j med 370;5 nejm.org january 30, 2014 407
Incidence of Obesity
Although the prevalence of obesity increased with age, incident obesity was highest at the youngest ages and declined through eighth grade. The annual incidence of obesity among kindergartners from fall to spring was 5.4% but fell to 1.9% (among boys) and 1.4% (among girls) per year during the period between fifth grade and eighth grade (Fig. 1A and 1B, right panels, and Table S2 in the Supplementary Appendix).
Between the ages of 5 and 14 years, 11.9% of children became obese (10.1% of girls and 13.7% of boys) (Table 2). By eighth grade, 16.8% of non-Hispanic black children became obese, as did 10.1% of non-Hispanic white children and children
of other races or ethnic groups and 14.3% of His-panic children. The lowest cumulative incidence of obesity according to socioeconomic status was among children from the wealthiest 20% of fami-lies (7.4%), and the highest was among children from the middle socioeconomic quintile (15.4%).
Incidence density rates were consistent with cumulative incidence, with a rate of 26.5 per 1000 person-years between the ages of 5 and 14 years (Table S3 in the Supplementary Appen-dix). The magnitude of differences between groups varied slightly according to the incidence mea-sure used, probably because incidence is not constant through time, as the incidence propor-tion method assumes.
Prev
alen
ce (%
)
30
20
25
15
10
5
05 6 7 8 9 10 11 12 13 14
Age (yr)
A Boys
B Girls
Overweight Obese
Ann
ual I
ncid
ence
of O
besi
ty (%
)
30
20
25
15
10
5
05 6 7 8 9 10 11 12 13 14
Age (yr)
Overweight at baseline
Normal weight at baseline
Total cohort
Overweight at baseline
Normal weight at baseline
Total cohort
Prev
alen
ce (%
)
30
20
25
15
10
5
05 6 7 8 9 10 11 12 13 14
Age (yr)
Overweight Obese
Ann
ual I
ncid
ence
of O
besi
ty (%
)
30
20
25
15
10
5
05 6 7 8 9 10 11 12 13 14
Age (yr)
Figure 1. Prevalence and Incidence of Obesity between Kindergarten and Eighth Grade.
Shown are the age-specific prevalence of overweight and obesity (left graph on each panel) and annual incidence of obesity according to the weight status at baseline (right graph on each panel) among boys (Panel A) and girls (Panel B). The black vertical lines and I bars represent 95% confidence intervals.
The New England Journal of Medicine Downloaded from nejm.org by JULIANE LEGER on February 6, 2014. For personal use only. No other uses without permission.
Copyright © 2014 Massachusetts Medical Society. All rights reserved.
• Forte interaction société / environnement / obésité • Rôle déterminant des premières années de vie • Effet potentiellement bénéfique de l'intervention sur les sujets
contacts Cunningham, NEJM 2014
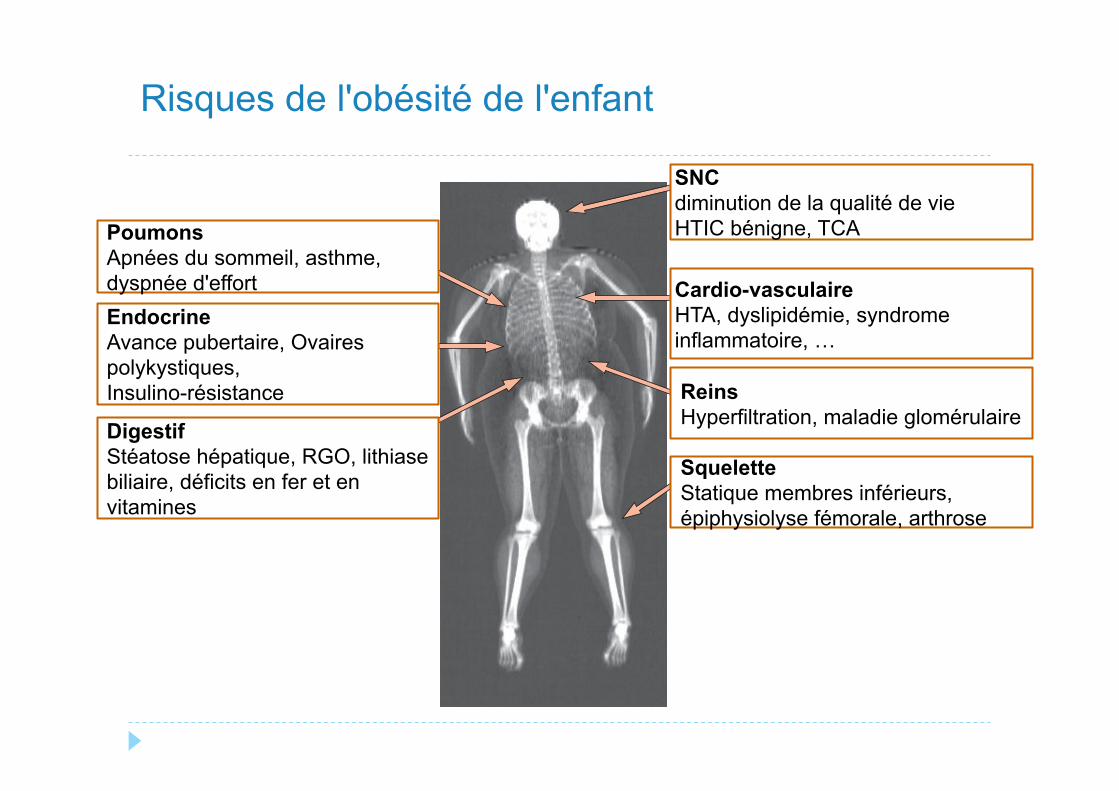
Risques de l'obésité de l'enfant
Seminar
1742 www.thelancet.com Vol 375 May 15, 2010
However, these guidelines might not be useful to ensure energy intakes that are appropriate for contemporary sedentary lifestyles. We are unaware of any randomised controlled trials focusing solely on household or family-based interventions to prevent childhood obesity.
Most randomised prevention trials have taken place in schools since they are viewed as a universal catchment setting for children. The core features of most prevention programmes are to change the caloric content of school meals and encourage physical activity. One policy that is debated in the USA is removal of vending machines from schools to curb availability of energy-dense snack foods. However, a US national survey showed that snack foods from vending machines contributed only 1·3% of total daily calories from snacks, whereas snacks at or from home contributed 69·1%.95 At least nine systematic reviews have examined randomised controlled trials of school-based childhood obesity prevention program-mes87,96 (see also citations of other systematic reviews within these reports). Early reviews noted scarce evidence of eff ectiveness and poor quality of studies, whereas more recent reviews suggested that school-based interventions
might be eff ective. Gonzalez-Suarez and colleagues96 identifi ed 19 high-quality trials of school-based inter-ventions and reported reduced odds of overweight or obesity in intervention compared with control groups (pooled odds ratio 0·74 [95% CI 0·60–0·92]). The key eff ective characteristics of such programmes remain to be established, and, since most studies were done in the USA, whether they are eff ective elsewhere. Although initiatives have also been aimed at children in kindergarten or nurseries,97 the few controlled trials in this setting have not yet been systematically reviewed. One area to be addressed is the built environment of schools or nurseries. Architectural designs of school buildings and their environment can be re-examined for opportunities to impose increased energy expenditure. A multi-storey building with purposefully designed class schedules could lead to substantial stair (or ramp) climbing during the school day.
Prevention in the community includes public policies and mass-media campaigns.98,99 For the past decade, pressure has been increasing for labelling of caloric contents on menus, especially at fast-food restaurants. However, data for the eff ects of such labelling on prevention of childhood obesity are scarce.100 In 2002, the US Centers for Disease Control and Prevention launched a 2-year marketing campaign via media advertisements to promote physical activity in children aged 9–13 years.101 Children’s physical activity (assessed by self-report) increased,98,99 but eff ects on BMI were not assessed. In several countries, governments are being urged to address the toxic environment by levying taxes on sugared beverages and fast foods, though the eff ectiveness of such measures is unknown.102
Popular media in several countries have given much attention to the topic of obesity, but no objective information is available about the eff ect of these messages on the public. Public health surveillance and screening for childhood obesity have been implemented in some communities. In 2003, Arkansas was the fi rst US state to pass legislation for mandatory BMI assessments of children in public schools, with yearly reporting to parents. This approach has since been followed in 13 other states.103,104 In 2005, a National Child Measurement Programme was introduced in the UK for yearly surveillance of two school year groups. In 2007, the British Government introduced legislation to give parents the results of their child’s measurements. Existing evidence is unclear as to whether surveillance or screening of childhood obesity will be valuable for prevention.
Infants and young children are seen frequently in medical settings for well-child and acute care. These visits present an opportunity to detect upward deviations in a child’s growth rate, thus placing the primary-care provider at the strategic fi rst line of defence before BMI exceeds recommended values. However, data for the eff ectiveness of such counselling for obesity prevention
PulmonaryObstructive sleep apnoeaAsthmaExercise intolerance
EndocrineInsulin resistancePCOSPubertal advancement
Gastrointestinal/nutritionFatty liver diseaseGastro-oesophageal refluxCholelithiasisIron deficiencyVitamin D deficiency
OrthopaedicLower-limb malalignmentSCFEOsteoarthritis
RenalHyperfiltrationGlomerulopathy
CardiovascularRaised blood pressureDyslipidaemiaAtherosclerosisChronic inflammationCoagulopathy
CNS/psychosocialPseudotumour cerebriDecreased quality of life
Figure 3: Complications associated with childhood obesityImage obtained by dual energy x-ray absorptiometry from a teenage girl with BMI 38 kg/m². Disorders that are of high prevalence and are well established in their association with childhood obesity are shown in red. PCOS=polycystic ovary syndrome. SCFE=slipped capital femoral epiphysis.
SNC diminution de la qualité de vie HTIC bénigne, TCA
Cardio-vasculaire HTA, dyslipidémie, syndrome inflammatoire, …
Reins Hyperfiltration, maladie glomérulaire
Squelette Statique membres inférieurs, épiphysiolyse fémorale, arthrose
Poumons Apnées du sommeil, asthme, dyspnée d'effort
Digestif Stéatose hépatique, RGO, lithiase biliaire, déficits en fer et en vitamines
Endocrine Avance pubertaire, Ovaires polykystiques, Insulino-résistance
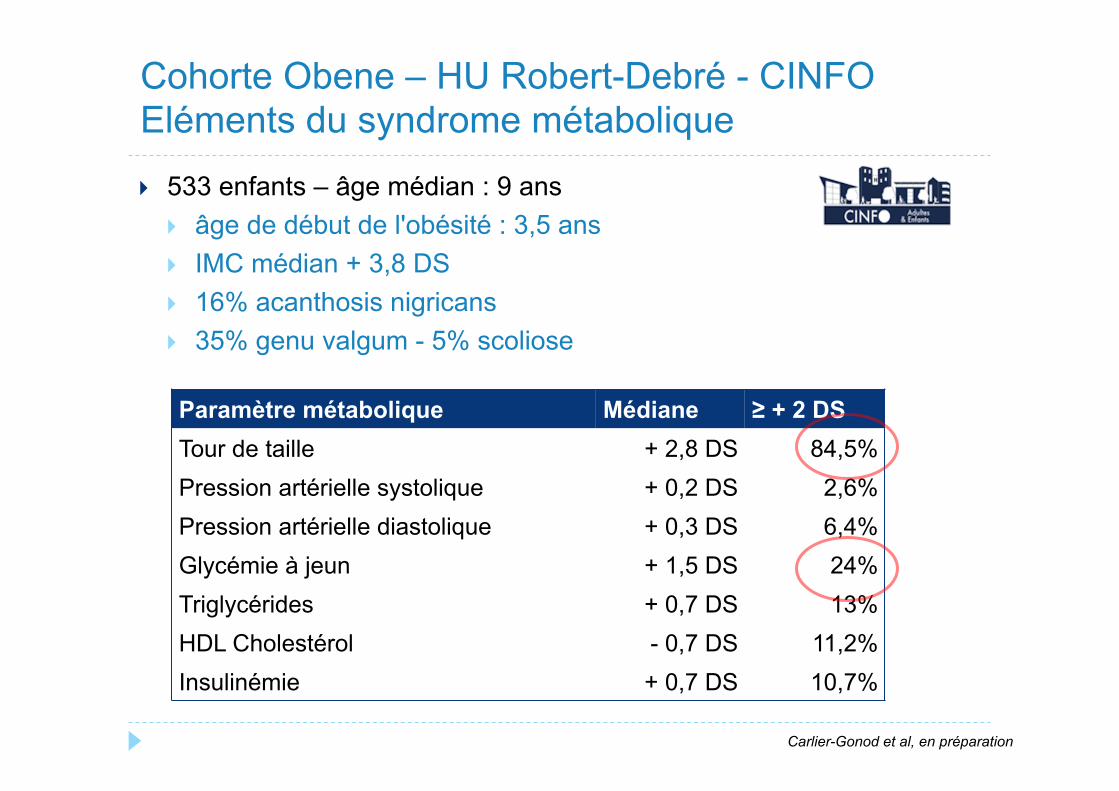
} 533 enfants – âge médian : 9 ans } âge de début de l'obésité : 3,5 ans } IMC médian + 3,8 DS } 16% acanthosis nigricans } 35% genu valgum - 5% scoliose
Cohorte Obene – HU Robert-Debré - CINFO Eléments du syndrome métabolique
Paramètre métabolique Médiane ≥ + 2 DS Tour de taille + 2,8 DS 84,5% Pression artérielle systolique + 0,2 DS 2,6% Pression artérielle diastolique + 0,3 DS 6,4% Glycémie à jeun + 1,5 DS 24% Triglycérides + 0,7 DS 13% HDL Cholestérol - 0,7 DS 11,2% Insulinémie + 0,7 DS 10,7%
Carlier-Gonod et al, en préparation
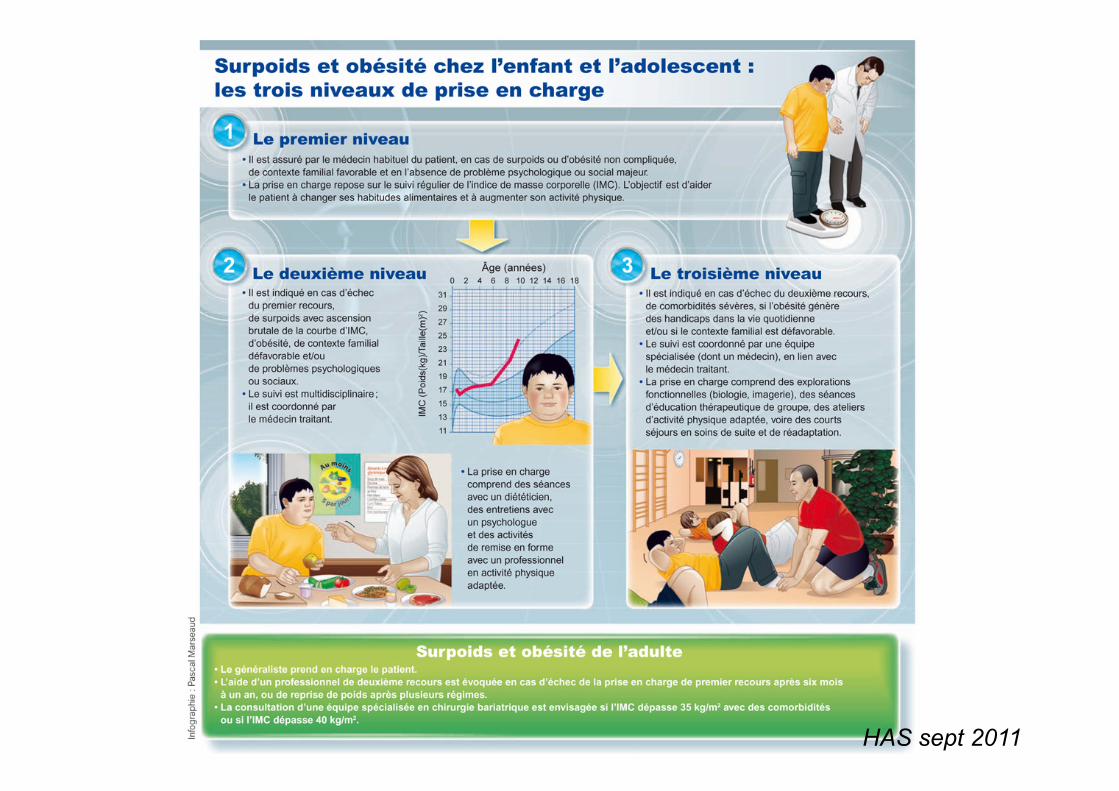
HAS sept 2011

} Prévention et détection des facteurs de risques de persistance ou d'aggravation de l'obésité
} Dépistage et diagnostic } Initié par tous les acteurs de la prise en charge de l'enfant
} Orientation des cas dépistés en fonction de marqueurs de sévérité et d'orientation } Prise en charge ciblée – entourage et enfant
} Prise en charge multidisciplinaire et ETP gradée en fonction de la sévérité } médecin, diététicien, psychologue, travailleur social, éducateur sportif
} programmes labellisés } objectifs : diminution ou stabilisation de la courbe d'IMC – notion
dynamique } Séjours prolongés en SSR
} fréquemment demandés par les familles } résultats spectaculaires à court terme, médiocres à long terme
} situations spécifiques maladies rares (Prader-Willi) } Chirurgie bariatrique
Objectifs de la prise en charge pédiatrique
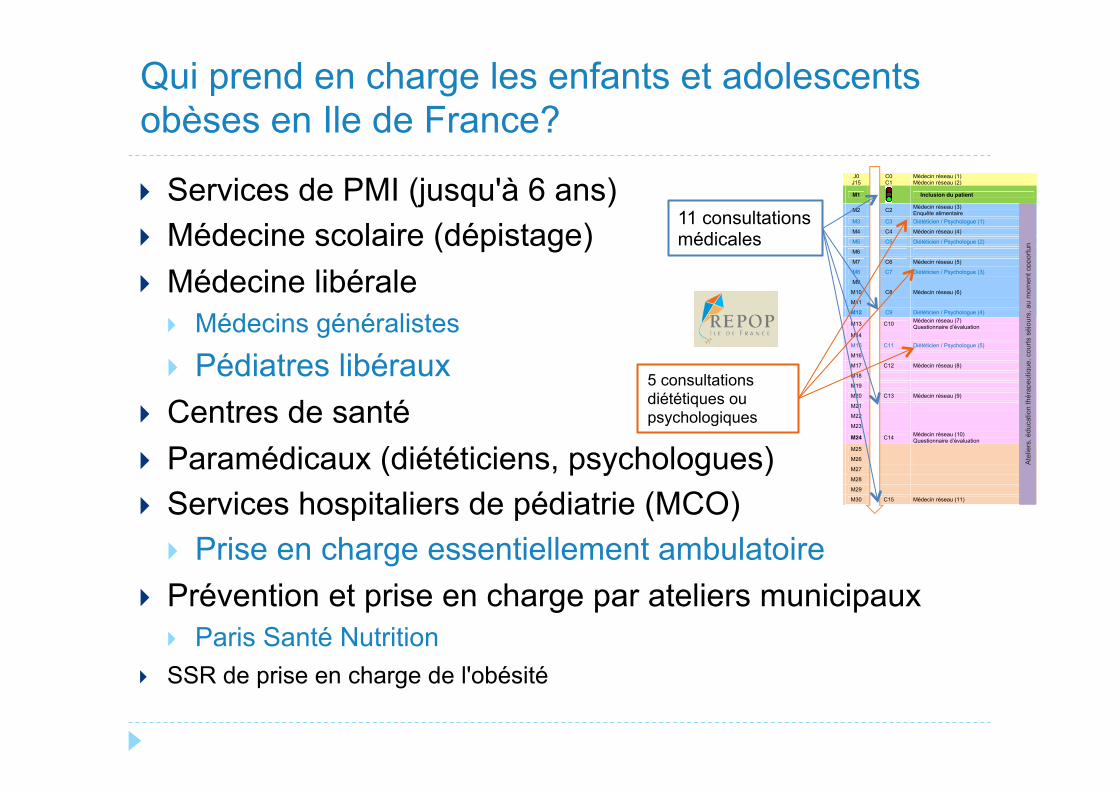
} Services de PMI (jusqu'à 6 ans) } Médecine scolaire (dépistage) } Médecine libérale
} Médecins généralistes } Pédiatres libéraux
} Centres de santé } Paramédicaux (diététiciens, psychologues) } Services hospitaliers de pédiatrie (MCO)
} Prise en charge essentiellement ambulatoire } Prévention et prise en charge par ateliers municipaux
} Paris Santé Nutrition } SSR de prise en charge de l'obésité
Qui prend en charge les enfants et adolescents obèses en Ile de France?
J0 C0 Médecin réseau (1)J15 C1 Médecin réseau (2)
80 € M1 Inclusion du patient
23 € M2 C2 Médecin réseau (3)Enquête alimentaire
40 € M3 C3 Diététicien / Psychologue (1)
23 € M4 C4 Médecin réseau (4)
40 € M5 C5 Diététicien / Psychologue (2)
M6
23 € M7 C6 Médecin réseau (5)
40 € M8 C7 Diététicien / Psychologue (3)
M9
23 € M10 C8 Médecin réseau (6)
M11
40 € M12 C9 Diététicien / Psychologue (4)
23 € M13 C10 Médecin réseau (7)Questionnaire d’évaluation
M14
40 € M15 C11 Diététicien / Psychologue (5)
M16
23 € M17 C12 Médecin réseau (8)
M18
M19
23 € M20 C13 Médecin réseau (9)
M21
M22
M23
23 € M24 C14 Médecin réseau (10)Questionnaire d’évaluation
M25
M26
M27
M28
M29
23 € M30 C15 Médecin réseau (11)
487 €
������ ���������������� �� ������ ��������������
Ate
liers
, édu
catio
n th
érap
eutiq
ue, c
ourts
séjo
urs,
au
mom
ent o
ppor
tun
11 consultations médicales
5 consultations diététiques ou psychologiques
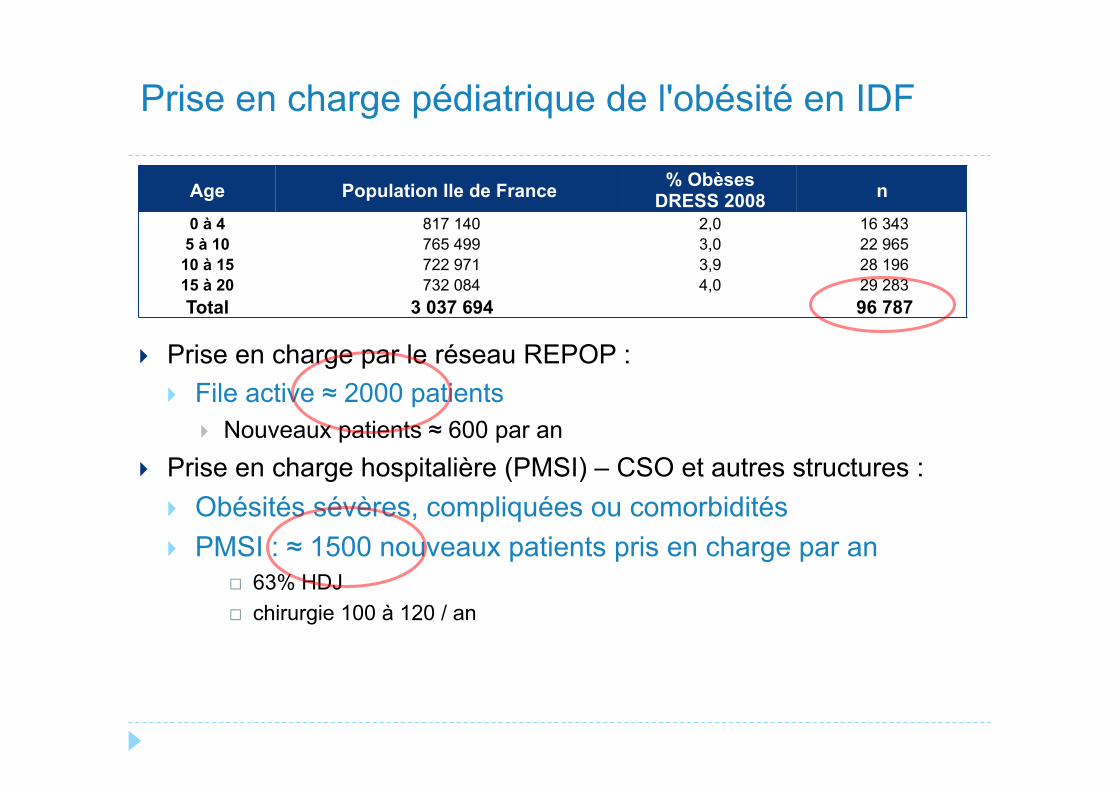
} Prise en charge par le réseau REPOP : } File active ≈ 2000 patients
} Nouveaux patients ≈ 600 par an } Prise en charge hospitalière (PMSI) – CSO et autres structures :
} Obésités sévères, compliquées ou comorbidités } PMSI : ≈ 1500 nouveaux patients pris en charge par an
¨ 63% HDJ ¨ chirurgie 100 à 120 / an
Prise en charge pédiatrique de l'obésité en IDF
Age Population Ile de France % Obèses DRESS 2008 n
0 à 4 817 140 2,0 16 343 5 à 10 765 499 3,0 22 965
10 à 15 722 971 3,9 28 196 15 à 20 732 084 4,0 29 283 Total 3 037 694 96 787
-0,6
-0,4
-0,2
0
∆ IM
C S
D
M6 M12 M24
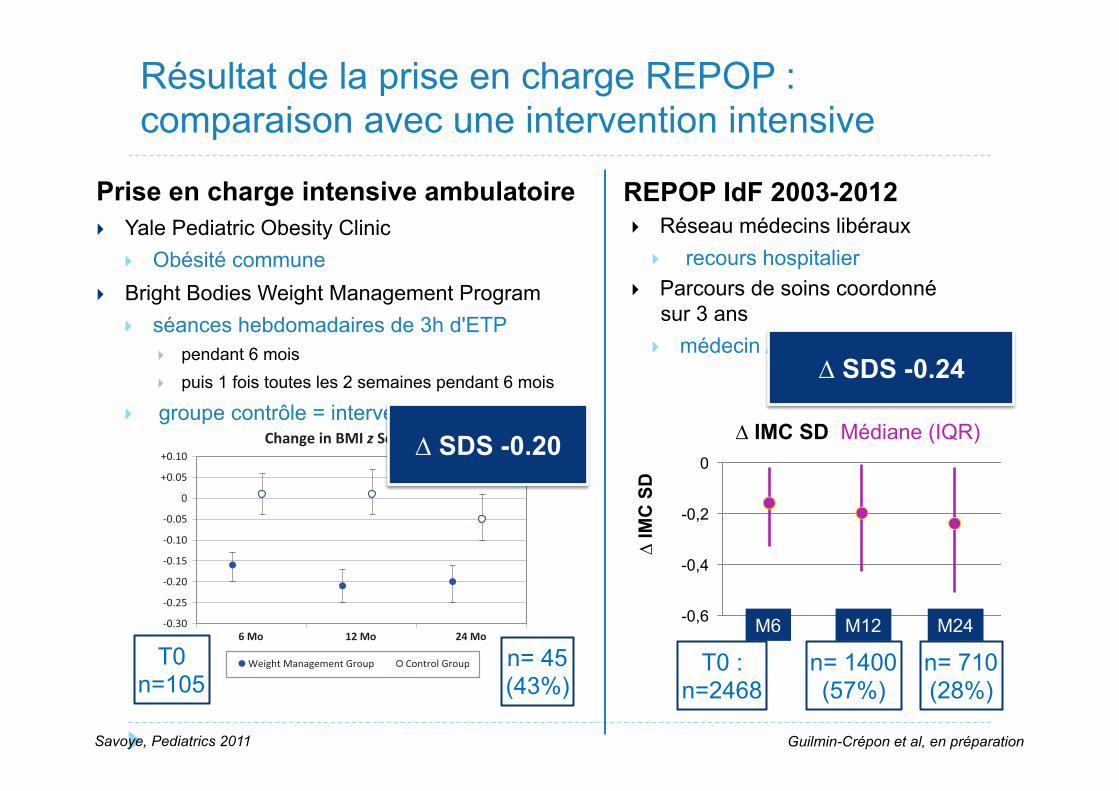
Résultat de la prise en charge REPOP : comparaison avec une intervention intensive
Prise en charge intensive ambulatoire } Yale Pediatric Obesity Clinic
} Obésité commune } Bright Bodies Weight Management Program
} séances hebdomadaires de 3h d'ETP } pendant 6 mois } puis 1 fois toutes les 2 semaines pendant 6 mois
} groupe contrôle = intervention retardée
mellitus, respectively, 10 years later. Inaddition, the Bogalusa Heart Study hasrecently confirmed that adiposity andHOMA-IR are interrelated.21
Programs that include increased activ-ity and behavior modification have tra-ditionally resulted in more improve-ments in childhood obesity.6 Duringthe development of the program, themajor goal was to provide the childand parent with tools to empowerthem to make better decisions thatwould promote a healthier lifestyle.Leaving the families “to their own de-vices” between 12 and 24 months withthe result of a sustained treatment ef-fect highly suggests that the child andparent adopted healthier behaviors.
However, in an attempt to avoid char-acteristics of dieting, we deliberatelyavoided requesting food diaries, whichresulted in a lack of measurement indiet change. Similarly, we lack mea-surement of activity change becausewe did not collect activity recordswhen requesting an additional 3 daysof activity.
The lack of psychosocial measuresshould also be included as a limitationof this study. Lastly, a study of this na-ture would not be complete withoutmention of the cost-effectiveness andcost/benefit of the weight manage-ment program verses clinical treat-ment approach. Such an analysis hasbeen completed on the 12-month data
(Nowicka P, Price G, Vipin S, Shaw M,Mercado J, Tamborlane WV, Savoye M,unpublished data, 2010).
CONCLUSION
The Bright Bodies intensive lifestylemodification program has demon-strated sustained treatment effects upto 24 months when compared with astandard clinical care. Although the at-trition rate was high, this study isunique and, more importantly, unprec-edented in that we targeted ethnicallydiverse children with very high BMIs.This gives us hope that behaviorchange is possible, even in the mostchallenging populations. Althoughglobal focus is shifting to the preven-tion of childhood obesity, it is equallyurgent to pursue treatment modelsthat are effective for those who needimmediate treatment.
ACKNOWLEDGMENTSThis work was supported by a ClinicalTranslation Science Award to Dr Sher-win (UL1-RR024139) from the NationalCenter for Research Resources, a com-ponent of the National Institutes ofHealth (NIH) and NIH roadmap for Med-ical Research; a NIH/National Instituteof Diabetes and Digestive and KidneyDiseases grant to Dr Sherwin (P30-DK-45735); NIH grants to Dr Caprio (R01-HD28016 and R01-HD40787), Yale Uni-versity School of Medicine; anunrestricted gift from the McPheeFoundation (Bristol, CT) awarded toMsSavoye; the Tegger Foundation forfunds granted to Dr Nowicka; andthe Fulbright Commission for fundsgranted to Ms O’Malley.
We thank the families who participatedin this study (all clinic and Bright Bod-ies participants received no compen-sation for their involvement) and theclinical staff of the Yale Pediatric Obe-sity Clinic.
Change in BMI z Score
-0.30
-0.25
-0.20
-0.15
-0.10
-0.05
0
+0.05
+0.10
6 Mo 12 Mo 24 Mo
6 Mo 12 Mo 24 Mo
Change in HOMA-IR (Insulin Sensi!vity)
-1.50-1.00-0.50
0+0.50+1.00+1.50+2.00+2.50+3.00+3.50
Weight Management Group Control Group
FIGURE 2Changes from 6, 12, and 24 months are from baseline. At 6 months (weight management group, n!86; control group, n! 49) P" .0001 for BMI z score, and P! .0001 for HOMA-IR; at 12 months (weightmanagement, n! 75; control group, n! 44) P" .0001 for BMI z score and HOMA-IR; and at 24 months(weight management group, n! 45; control group, n! 31) P" .0001 for BMI z score, and P! .0001for HOMA-IR.
ARTICLES
PEDIATRICS Volume 127, Number 3, March 2011 409. Provided by APHP on March 2, 2011 www.pediatrics.orgDownloaded from
Savoye, Pediatrics 2011
T0 n=105
n= 45 (43%)
T0 : n=2468
n= 710 (28%)
REPOP IdF 2003-2012 } Réseau médecins libéraux
} recours hospitalier } Parcours de soins coordonné
sur 3 ans } médecin / diet / psy
n= 1400 (57%)
∆ IMC SD Médiane (IQR)
∆ SDS -0.24
∆ SDS -0.20
Guilmin-Crépon et al, en préparation
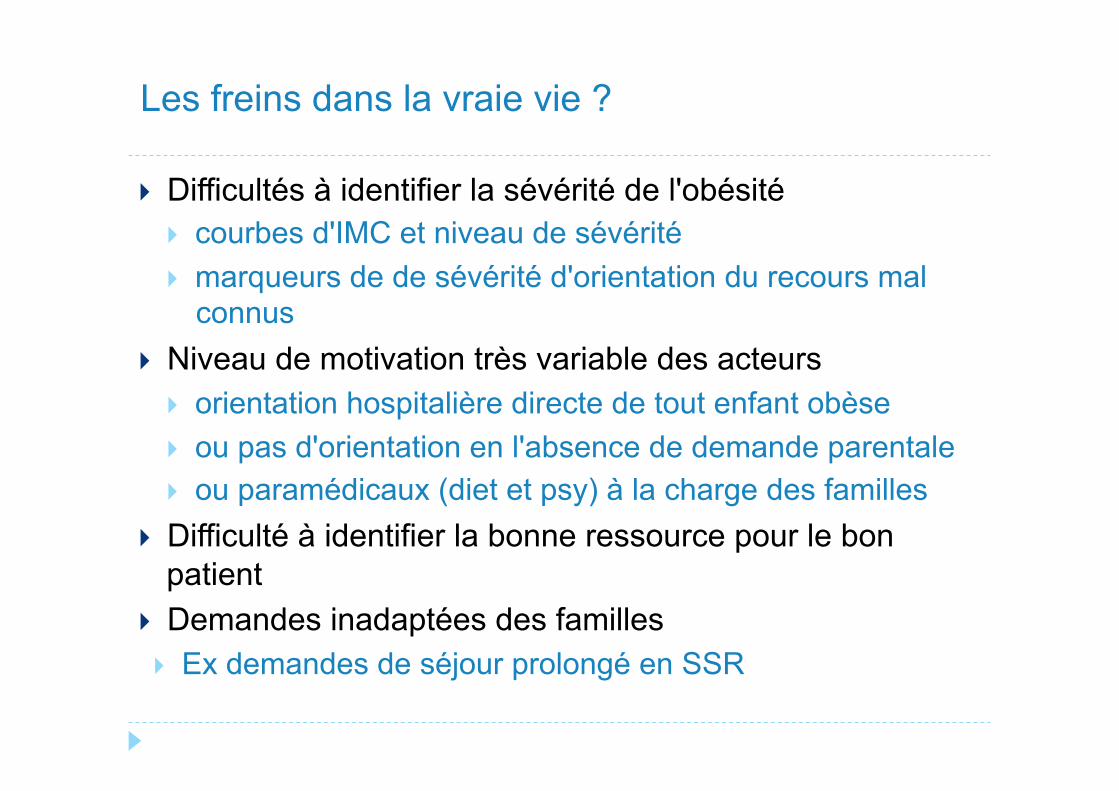
} Difficultés à identifier la sévérité de l'obésité } courbes d'IMC et niveau de sévérité } marqueurs de de sévérité d'orientation du recours mal
connus } Niveau de motivation très variable des acteurs
} orientation hospitalière directe de tout enfant obèse } ou pas d'orientation en l'absence de demande parentale } ou paramédicaux (diet et psy) à la charge des familles
} Difficulté à identifier la bonne ressource pour le bon patient
} Demandes inadaptées des familles } Ex demandes de séjour prolongé en SSR
Les freins dans la vraie vie ?

} Contraste entre fréquence et ressources limitées } Importance de la mobilisation des ressources existantes
} Nécessité d'objectifs diagnostiques et thérapeutiques partagés } Gradation des soins essentielle
} Mise en place de parcours de soins } Critères de définition et d'orientation communs } Expérimentation OBEPEDIA
} Répertoire des ressources et des lieux de prise en charge adaptés à chaque situation } Faire connaître les ressources disponibles dans le territoire } Eviter le recours systématique aux centres de référence } Faire savoir aux différents intervenants
Conclusions
} Acteurs de la prise en charge pédiatrique des CSO IdF
} CINFO } Dr Ahlam Azar } Dr Nathalie Lecomte } Dr Véronique Baltakse } Dr Nadine Lucidarme } Manon Prévot } Céline Rogez } Céline Carlier-Gonod
} REPOP IDF } Amine Arsan } Claire Tetart } Laurence Guery } Sophie Guilmin-Crépon
} Dominique Amar-Sotto } Claire Beltramo } Bertrand Chevallier } Jacques Cheymol } Myriam Dabbas } Marcel Elbaz } Laurent Fidalgo } Patricia Lubelski } Marie-Cardine } Alexis Marion } Patrick Tounian } Rose Wisnewksy } Alain Zaluski
Remerciements