Embed Size (px)
Citation preview

lOBlaw COmPaniES limitEd 2013 annual rEPOrt – FinanCial rEviEw

Financial Highlights(1)
As at or for the periods ended December 28, 2013 and December 29, 2012 2013 2012(2) 2011(3)
(millions of Canadian dollars except where otherwise indicated) (52 weeks) (52 weeks) (52 weeks)Consolidated Results of OperationsRevenue $ 32,371 $ 31,604 $ 31,250Operating income 1,326 1,195 1,384Adjusted operating income(4) 1,325 1,292 1,438Adjusted EBITDA(4) 2,149 2,069 2,137Net interest expense and other financing charges 468 351 327Net earnings 630 634 769Adjusted net earnings(4) 731 710 811Consolidated Financial Position and Cash FlowsAdjusted debt(4) 6,064 4,360 4,341Cash and cash equivalents, short term investments and security deposits 4,251 2,047 1,986Cash flows from operating activities 1,491 1,637 1,814Capital investment 865 1,017 987Free cash flow(4) 489 468 551Consolidated Per Common Share ($)Basic net earnings 2.24 2.25 2.73Adjusted basic net earnings(4) 2.60 2.52 2.88Consolidated Financial Measures and RatiosRevenue growth 2.4% 1.1 % 1.3%Adjusted operating margin(4) 4.1% 4.1 % 4.6%Adjusted EBITDA margin(4) 6.6% 6.5 % 6.8%Interest coverage(4) 2.8x 3.4x 4.2xAdjusted debt(4) to adjusted EBITDA(4) 2.8x 2.1x 2.0xReturn on average net assets(4) 10.7% 10.0 % 12.0%Return on average shareholders’ equity 9.4% 10.2 % 13.2%Retail Results of OperationsSales 31,600 30,960 30,703Gross profit 6,966 6,819 6,820Operating income 1,185 1,100 1,312Adjusted operating income(4) 1,172 1,197 1,366Retail Operating StatisticsSame-store sales growth (decline) 1.1% (0.2)% 0.9%Gross profit percentage 22.0% 22.0 % 22.2%Adjusted operating margin(4) 3.7% 3.9 % 4.4%Adjusted EBITDA margin(4) 6.3% 6.3 % 6.7%Retail square footage (in millions) 51.9 51.5 51.2Number of corporate stores 570 580 584Number of franchise stores 496 473 462Financial Services Results of OperationsRevenue 739 644 547Operating income 142 95 72Earnings before income taxes 93 50 24Financial Services Operating Measures and StatisticsAverage quarterly net credit card receivables 2,345 2,105 1,974Credit card receivables 2,538 2,305 2,101Allowance for credit card receivables 47 43 37Annualized yield on average quarterly gross credit card receivables 13.6% 12.8 % 12.5%Annualized credit loss rate on average quarterly gross credit card receivables 4.2% 4.3 % 4.2%Choice Properties Results of Operations(5)
Revenue 319 — —Operating income 370 — —Adjusted operating income(4) 382 — —Net interest expense and other financing charges 303 — —Choice Properties Operating Measures(5)
Net operating income(4) 222 — —Funds from operations(4) 159 — —Adjusted funds from operations(4) 131 — —Adjusted funds from operations per unit diluted(4) ($) 0.36 — —Adjusted funds from operations payout ratio(4) 88.6% — —
(1) For financial definitions and ratios refer to the Glossary of Terms on page 109.(2) Certain 2012 figures have been restated due to the implementation of revised IAS 19, “Employee Benefits”. See the “Accounting Standards Implemented in 2013” section on page 37.(3) 2011 figures have not been restated for the impact of IAS 19.(4) See Non-GAAP Financial Measures on page 40.(5) Results are for the period ended December 31, 2013, consistent with Choice Properties’ fiscal calendar. Adjustments to December 28, 2013 are included in Consolidation and Eliminations.

2013 Annual Report - Financial Review 1
2013 Annual Report - Financial ReviewManagement’s Discussion and AnalysisFinancial ResultsEarnings Coverage Exhibit to the Consolidated Financial StatementsThree Year SummaryGlossary of Terms
Management’s Discussion and Analysis1. Forward-Looking Statements2. Overview3. Vision and Strategies4. Key Financial Performance Indicators5. Overall Financial Performance
5.1 Significant Accomplishments in 20135.1 Consolidated Results of Operations5.2 Selected Financial Information
6. Reportable Operating Segments Results of Operations6.1 Retail Segment6.2 Financial Services Segment6.3 Choice Properties Segment
7. Other Business Matters8. Liquidity and Capital Resources
8.1 Cash Flows8.2 Liquidity and Capital Structure8.3 Share Capital8.4 Contractual Obligations
9. Financial Derivative Instruments and Off-Balance Sheet Arrangements10. Off-Balance Sheet Arrangements11. Quarterly Results of Operations
11.1 Results by Quarter11.2 Fourth Quarter Results
12. Disclosure Controls and Procedures13. Internal Control over Financial Reporting14. Enterprise Risks and Risk Management
14.1 Operating Risks and Risk Management14.2 Financial Risks and Risk Management
15. Related Party Transactions16. Critical Accounting Estimates and Judgments
16.1 Inventories16.2 Impairment of Non-Financial Assets (Goodwill, Intangible Assets, Fixed Assets and Investment Properties)16.3 Franchise Loans Receivable and Certain Other Financial Assets16.4 Income and Other Taxes16.5 Allowance for Credit Card Receivables
17. Accounting Standards17.1 Accounting Standards Implemented in 201317.2 Future Accounting Standards
18. Outlook19. Non-GAAP Financial Measures20. Additional Information
146
107108109
24467789
111112131415151719202022222223282828293435363637373737373739394045

Management’s Discussion and Analysis
2 2013 Annual Report - Financial Review
The following Management’s Discussion and Analysis (“MD&A”) for Loblaw Companies Limited and its subsidiaries (collectively, the “Company” or “Loblaw”) should be read in conjunction with the annual audited consolidated financial statements and the accompanying notes on pages 46 to 106 of this Annual Report - Financial Review (“Annual Report”). The Company’s annual audited consolidated financial statements and accompanying notes for the year ended December 28, 2013 are prepared in accordance with International Financial Reporting Standards (“IFRS” or “GAAP”) and include the accounts of the Company and other entities that the Company controls and are reported in Canadian dollars, except where otherwise noted.
The information in this MD&A is current to February 19, 2014, unless otherwise noted. A glossary of terms used throughout this Annual Report can be found on page 109.
1. Forward-Looking Statements
This Annual Report, including this MD&A, for Loblaw Companies Limited contains forward-looking statements about the Company’s objectives, plans, goals, aspirations, strategies, financial condition, results of operations, cash flows, performance, prospects and opportunities. Specific forward-looking statements in this Annual Report include, but are not limited to, statements with respect to the Company’s anticipated future results and events, the proposed acquisition of Shoppers Drug Mart Corporation ("Shoppers Drug Mart") and targeted synergies expected following the close of this acquisition, future liquidity, planned capital expenditures, amount of pension plan contributions, status and impact of information technology (“IT”) systems implementation and future plans. These specific forward-looking statements are contained throughout this Annual Report including, without limitation, in the Vision and Strategies section on page 4 and the Outlook section on page 39 of this MD&A. Forward-looking statements are typically identified by words such as “expect”, “anticipate”, “believe”, “foresee”, “could”, “estimate”, “goal”, “intend”, “plan”, “seek”, “strive”, “will”, “may” and “should” and similar expressions, as they relate to the Company and its management.
Forward-looking statements reflect the Company’s current estimates, beliefs and assumptions, which are based on management’s perception of historical trends, current conditions and expected future developments, as well as other factors it believes are appropriate in the circumstances. The Company’s expectation of operating and financial performance in 2014 is based on certain assumptions including assumptions about revenue growth, anticipated cost savings and operating efficiencies, and competitive square footage growth. The Company’s estimates, beliefs and assumptions are inherently subject to significant business, economic, competitive and other uncertainties and contingencies regarding future events and as such, are subject to change. The Company can give no assurance that such estimates, beliefs and assumptions will prove to be correct.
Numerous risks and uncertainties could cause the Company’s actual results to differ materially from those expressed, implied or projected in the forward-looking statements, including those described in the Enterprise Risks and Risk Management section on pages 28 to 35 of this MD&A. Such risks and uncertainties include: • failure by the Company to complete the acquisition of Shoppers Drug Mart or to realize the anticipated strategic benefits or
operational, competitive and cost synergies; • failure to realize benefits from investments in the Company’s IT systems, including the Company’s IT systems implementation, or
unanticipated results from these initiatives; • failure to realize anticipated results, including revenue growth, anticipated cost savings or operating efficiencies from the Company’s
major initiatives, including those from restructuring; • the inability of the Company’s IT infrastructure to support the requirements of the Company’s business; • public health events including those related to food safety; • failure to achieve desired results in labour negotiations, including the terms of future collective bargaining agreements, which could
lead to work stoppages; • heightened competition, whether from current competitors or new entrants to the marketplace; • changes in economic conditions, including the rate of inflation or deflation, changes in interest and currency exchange rates and
derivative and commodity prices; • changes in the Company’s income, capital, commodity, property and other tax and regulatory liabilities including changes in tax laws,
regulations or future assessments; • changes to the regulation of generic prescription drug prices and the reduction of reimbursements under public drug benefit plans and
the elimination or reduction of professional allowances paid by drug manufacturers; • the inability of the Company to manage inventory to minimize the impact of obsolete or excess inventory and to control shrink; • changes in the Company’s estimate of inventory cost as a result of its IT system upgrade; • failure to respond to changes in consumer tastes and buying patterns;

2013 Annual Report - Financial Review 3
• reliance on the performance and retention of third-party service providers, including those associated with the Company’s supply chain and apparel business;
• supply and quality control issues with vendors in both advanced and developing markets; • the impact of potential environmental liabilities; • any requirement of the Company to make contributions to its registered funded defined benefit pension plans or the multi-employer
pension plans in which it participates in excess of those currently contemplated; • the risk that the Company would experience a financial loss if its counterparties fail to meet their obligations in accordance with the
terms and conditions of their contracts with the Company; • the inability of the Company to collect on its credit card receivables; and • failure of Choice Properties Real Estate Investment Trust (“Choice Properties”) to execute its plan and realize its forecasted results.
This is not an exhaustive list of the factors that may affect the Company’s forward-looking statements. Other risks and uncertainties not presently known to the Company or that the Company presently believes are not material could also cause actual results or events to differ materially from those expressed in its forward-looking statements. Additional risks and uncertainties are discussed in the Company’s materials filed with the Canadian securities regulatory authorities from time to time. Readers are cautioned not to place undue reliance on these forward-looking statements, which reflect the Company’s expectations only as of the date of this MD&A. Except as required by law, the Company does not undertake to update or revise any forward-looking statements, whether as a result of new information, future events or otherwise.
Management’s Discussion and Analysis
4 2013 Annual Report - Financial Review
2. Overview
The Company is a subsidiary of George Weston Limited (“Weston”). It is Canada’s largest food retailer, a leading provider of drugstore, general merchandise and financial products and services, and is the majority unitholder of Choice Properties, an owner, manager and developer of commercial real estate across Canada. The Company has three reportable operating segments: Retail, Financial Services and Choice Properties. Loblaw and its franchisees together are among the largest private sector employers in Canada, employing approximately 138,000 full-time and part-time employees across more than 1,000 corporate and franchise stores from coast to coast. Through its portfolio of store formats, Loblaw is committed to providing Canadians with a wide range of products and services to meet everyday household and consumer needs. Loblaw is known for the quality, innovation and value of its food offering. It offers one of Canada’s strongest control brand programs, including the unique President’s Choice, no name and Joe Fresh brands. In addition, through its subsidiaries, the Company makes available to consumers President’s Choice Financial services and offers the PC points and PC Plus loyalty programs.
3. Vision and Strategies
The Company’s mission is to be Canada’s best food, health and home retailer by exceeding customer expectations through innovative products at great prices. As one of the country’s leading retailers, reaching 14 million consumers each week, the Company is uniquely positioned to deliver on its purpose - helping Canadians Live Life Well - and to provide customers with products, services, value and experience to enrich their lives. The Company delivers on this purpose through its strategy of offering the best customer experience in food, health, and beauty while striving for operational excellence and achieving growth through opportunities in emerging and complementary businesses.
In 2013, the Company advanced a number of strategic initiatives that were introduced in 2012. Targeted investments to improve the customer proposition yielded same-store sales growth of 1.1% in a competitive environment characterized by intense competitive square footage growth. Progress was made in the Company’s IT system implementation, and efficiencies were achieved in targeted areas such as shrink, transportation costs, warehousing, supply chain, and labour. Some of Loblaw’s key accomplishments in 2013 include:
• Entered into an arrangement agreement to acquire all of the outstanding common shares of Shoppers Drug Mart, the country’s leading pharmaceutical retailer, and completed all of the financing required to fund the acquisition;
• Completed the $460 million Initial Public Offering (“IPO”) of Choice Properties, including a $60 million over-allotment option, and sold approximately $7 billion in properties and related assets to Choice Properties;
• Expanded the IT system implementation across eight distribution centres and 75 stores, with little to no negative impact on customers;• Achieved improved customer feedback net promoter scores in the conventional division for the third consecutive year by exceeding
customer expectations through the right assortment, improved customer in-store experience and competitive prices;• Led by fresh categories, achieved growth in sales and tonnage in the discount division despite strong competitive square footage
growth;• Ongoing development and implementation of strategic category reviews offered customized assortment, compelling displays and
delivered competitive value across its banners;• Continued to invest to improve standards and in-store experience through renovations at 192 stores and strategically invested in new
square footage, expanding to 51.9 million square feet, a net increase of 0.8% compared to 2012;• Launched over 550 new control brand products and redesigned or improved approximately 640 control brand products;• Reset the general merchandise in 29 stores to offer an enhanced selection in four key areas: Apparel, Beauty, Home, and Kids;• Grew the PC Financial services business, setting a new high with 1.2 million new MasterCard® applications;• Launched a new digital loyalty marketing platform, PC Plus, in 44 Loblaw stores in May 2013 and expanded the program nationally
across the conventional network and Real Canadian Superstore locations in November 2013;• Launched Joe Fresh online in October 2013; and• Effectively managed costs across the business with a focus on improved shrink, lower supply chain costs, labour and administrative
expenses to drive efficient operations.

2013 Annual Report - Financial Review 5
In 2014, the Company expects to advance a number of the strategic initiatives that were underway in 2013. The Company will continue to invest in innovative products, services and channels to maintain its competitive position. The Company expects to advance efficiency initiatives during the year, with a focus on continuing to roll out its IT system implementation and to achieve targeted synergies from the Shoppers Drug Mart acquisition following transaction closing. The Company’s plans for 2014 include:• Completing the acquisition of Shoppers Drug Mart, and post-close, delivering on targeted synergies of approximately $100 million in
the first twelve months and approximately $300 million over three years;• Focusing on cash flow generation and reducing leverage ratios following the close of the Shoppers Drug Mart acquisition; • Maintaining or growing market share in the Company’s core food and drug businesses, which account for over 85% of total revenue;• Continuing to focus on execution and achieving efficiencies;• Exceeding customer expectations and achieving improved customer feedback scores with the right assortment, improved customer
in-store experience, and competitive prices;• Offering customized assortment, compelling displays, and delivering competitive value across banners through ongoing development
and implementation of strategic category reviews;• Leveraging the Company’s control brands to generate growth across food and general merchandise categories;• Expanding the PC Plus digital loyalty program to build customer loyalty by marketing on an individualized basis;• Growing the PC Financial services business, including launching a newly designed in-store customer service pavilion;• Advancing initiatives to support colleague retention, succession planning, recognition and development to drive colleague
engagement; and• Expanding the roll-out of the Company’s IT system to all of its distribution centres and corporate retail stores without negative impact
to customers.

Management’s Discussion and Analysis
6 2013 Annual Report - Financial Review
4. Key Financial Performance Indicators
The Company has identified specific key financial performance indicators to measure the progress of short and long term objectives. Key financial performance indicators are set out below:
As at or for the periods ended December 28, 2013 and December 29, 2012 2013 2012(1)
(millions of Canadian dollars except where otherwise indicated) (52 weeks) (52 weeks)Consolidated:Revenue growth 2.4% 1.1 %Operating income $ 1,326 $ 1,195Adjusted operating income(2) 1,325 1,292Adjusted operating margin(2) 4.1% 4.1 %Adjusted EBITDA(2) 2,149 2,069Adjusted EBITDA margin(2) 6.6% 6.5 %Net earnings 630 634Adjusted net earnings(2) 731 710Basic net earnings per common share ($) 2.24 2.25Adjusted basic net earnings per common share(2) ($) 2.60 2.52Cash and cash equivalents, short term investments and security deposits 4,251 2,047Cash flows from operating activities 1,491 1,637Adjusted debt(2) to adjusted EBITDA(2) 2.8x 2.1xFree cash flow(2) 489 468Interest coverage(2) 2.8x 3.4xReturn on average net assets(2) 10.7% 10.0 %Return on average shareholders’ equity 9.4% 10.2 %Retail Segment:Same-store sales(3) growth (decline) 1.1% (0.2)%Gross profit $ 6,966 $ 6,819Gross profit percentage 22.0% 22.0 %Adjusted operating margin(2) 3.7% 3.9 %Adjusted EBITDA margin(2) 6.3% 6.3 %Financial Services Segment:Earnings before income taxes $ 93 $ 50Annualized yield on average quarterly gross credit card receivables(3) 13.6% 12.8 %Annualized credit loss rate on average quarterly gross credit card receivables(3) 4.2% 4.3 %Choice Properties Segment(4):Net operating income(2) $ 222 $ —Funds from operations(2) 159 —Adjusted funds from operations(2) 131 —Adjusted funds from operations per unit diluted(2) ($) 0.36 —Adjusted funds from operations payout ratio(2) 88.6% — %
(1) Certain 2012 figures have been restated due to the implementation of revised IAS 19, “Employee Benefits”. See the “Accounting Standards Implemented in 2013” section on page 37.
(2) See Non-GAAP Financial Measures on page 40.(3) For financial definitions and ratios refer to the Glossary of Terms on page 109.(4) Results are for the period ended December 31, 2013, consistent with Choice Properties’ fiscal calendar.

2013 Annual Report - Financial Review 7
During 2013, the Company introduced new financial measures: adjusted operating income(1), adjusted operating margin(1), adjusted EBITDA(1), adjusted EBITDA margin(1), adjusted net earnings(1) and adjusted basic net earnings per common share(1), which are all non-GAAP measures. Management uses these and other non-GAAP financial measures to exclude the impact of certain expenses and income that must be recognized under GAAP when analyzing consolidated and segment underlying operating performance, as the excluded items are not necessarily reflective of the Company’s underlying operating performance and make comparisons of underlying financial performance between periods difficult. From time to time, the Company may exclude additional items if it believes doing so would result in a more effective analysis of underlying operating performance. The exclusion of certain items does not imply that they are non-recurring.
With respect to Choice Properties segment results, management also uses net operating income(1), funds from operations(1), adjusted funds from operations(1), adjusted funds from operations per unit diluted(1) and adjusted funds from operations payout ratio(1) to measure Choice Properties’ operations. Management uses these measures to assess the financial performance and financial condition of Choice Properties. See the Non-GAAP Financial Measures section on page 40 of this MD&A for more information on the Company’s non-GAAP financial measures.
5. Overall Financial Performance
5.1 Significant Accomplishments in 2013
Significant accomplishments were achieved in 2013: the agreement to acquire Shoppers Drug Mart and the IPO of Choice Properties.
Agreement to Acquire Shoppers Drug Mart Corporation On July 14, 2013, the Company entered into an arrangement agreement to acquire all of the outstanding common shares of Shoppers Drug Mart for consideration of up to approximately $6.7 billion of cash and the issuance of up to approximately 119.9 million common shares. Based on the Company’s closing common share price on that date, the purchase price would be approximately $12.4 billion.
In 2013, the Company completed the financing required to close the acquisition of all of the outstanding common shares of Shoppers Drug Mart, as described in the Liquidity and Capital Structure section on page 17. As part of the financing of the acquisition, the Company’s controlling shareholder, Weston, has agreed to subscribe for approximately $500 million of additional Loblaw common shares.
On September 12, 2013, Shoppers Drug Mart shareholders voted in favour of the agreement and on September 16, 2013 a final order of the Ontario Superior Court of Justice approving the agreement was obtained. The transaction is subject to various regulatory approvals under the Competition Act (Canada) and by the Toronto Stock Exchange (“TSX”), and the fulfillment of certain other closing conditions customary in transactions of this nature. The process of review under the Competition Act (Canada) is proceeding as expected and the Company anticipates that the transaction will be completed during the first quarter of 2014. Further information on the transaction and its expected effects on the Company can be found in the Information Statement filed by the Company on August 20, 2013, in respect of Shoppers Drug Mart shareholder approval of the transaction. There can be no assurance that all conditions will be met or waived or that the Company will be able to successfully consummate the proposed transaction as currently contemplated or at all.
Choice Properties Real Estate Investment Trust During 2013, in connection with its acquisition of approximately $7 billion of properties and related assets from Loblaw, Choice Properties completed a $460 million IPO of Trust Units (“Units”) including the exercise of a $60 million over-allotment option. In addition, Choice Properties completed a $200 million offering of Units to Weston. Units were issued at a price of $10.00 per Unit and gross proceeds were $660 million. The Company recorded transaction costs of approximately $44 million in net interest expense and other financing charges related to the completion of the IPO.
Concurrent with the offering of Units, Choice Properties completed a public offering of $600 million aggregate principal amount of senior unsecured debentures (“Debentures”). A portion of the debt offering proceeds were used to replenish the cash used to repay the United States dollar (“USD”) $150 million US private placement (“USPP”) note that matured and to early-settle the remaining USD $150 million USPP note, including the associated early-settlement costs of approximately $18 million, which were recorded in net interest expense and other financing charges.
As at December 28, 2013, the Company held an effective ownership in Choice Properties of approximately 82.2% through ownership of 21,500,000 Units and 284,074,754 Class B Limited Partnership units, which are economically equivalent to and exchangeable for Units. Included in the Class B Limited Partnership units are 11,576,883 units issued to the Company, in connection with the acquisition of an additional portfolio of investment properties subsequent to the IPO.
(1) See Non-GAAP Financial Measures on page 40.

Management’s Discussion and Analysis
8 2013 Annual Report - Financial Review
5.2 Consolidated Results of Operations
For the periods ended December 28, 2013 and December 29, 2012 2013 2012(2)
(millions of Canadian dollars except where otherwise indicated) (52 weeks) (52 weeks) $ Change % ChangeRevenue $ 32,371 $ 31,604 $ 767 2.4 %Operating income 1,326 1,195 131 11.0 %Adjusted operating income(1) 1,325 1,292 33 2.6 %Net interest expense and other financing charges 468 351 117 33.3 %Income taxes 228 210 18 8.6 %Net earnings $ 630 $ 634 $ (4) (0.6)%Adjusted net earnings(1) 731 710 21 3.0 %Basic net earnings per common share(3) ($) 2.24 2.25 (0.01) (0.4)%Adjusted basic net earnings per common share(1) ($) 2.60 2.52 0.08 3.2 %Adjusted operating margin(1) 4.1% 4.1%Adjusted EBITDA(1) $ 2,149 $ 2,069 $ 80 3.9 %Adjusted EBITDA margin(1) 6.6% 6.5%
During 2013, the Company announced the reduction of approximately 275 store-support positions, and incurred a charge of $32 million associated with this restructuring. Total restructuring costs for 2013 were approximately $35 million (2012 – $61 million).
Revenue The $767 million increase in revenue compared to 2012 was primarily driven by increases in both the Company’s Retail and Financial Services segments, as described in the Reportable Operating Segments Results of Operations section below.
Operating Income Operating income increased by $131 million compared to 2012 and was positively impacted by the gain related to defined benefit plan amendments recorded in the first quarter of 2013, favourable year-over-year changes in fixed asset and other related impairments, net of recoveries, and lower restructuring costs, partially offset by lower gains on disposal of assets, start-up and general and administrative costs related to Choice Properties, costs related to the acquisition of Shoppers Drug Mart and higher year-over-year equity-based compensation charges. Adjusted operating income(1) increased by $33 million compared to 2012, primarily driven by an increase in the Financial Services segment’s adjusted operating income(1), partially offset by a decline in the Retail segment’s adjusted operating income(1). Adjusted operating margin(1) was 4.1% for 2013, flat compared to 2012.
Net Interest Expense and Other Financing Charges In 2013, net interest expense and other financing charges increased by $117 million compared to 2012. This year-over-year increase was primarily driven by the Choice Properties’ IPO transaction costs of $44 million, an unfavourable $27 million fair value adjustment related to the Trust Unit Liability, reflecting the change in the fair value of Choice Properties’ Units held by unitholders other than the Company, net interest of $25 million relating to indebtedness incurred to finance the proposed acquisition of Shoppers Drug Mart, and early debt settlement costs of $18 million. Excluding these impacts, net interest expense and other financing charges increased by $3 million in 2013 compared to 2012, driven by Unit distributions by Choice Properties, partially offset by higher net interest income related to certain financial derivative instruments and lower net interest on net defined benefit obligations.
Income Taxes Income tax expense for 2013 was $228 million (2012 – $210 million) and the effective income tax rate was 26.6% (2012 – 24.9%). The increase in the effective income tax rate over 2012 was primarily due to an increase in non-deductible amounts (including fair value adjustments on the Trust Unit Liability), partially offset by an increase in income tax recoveries related to prior year matters.
(1) See Non-GAAP Financial Measures on page 40.(2) Certain 2012 figures have been restated due to the implementation of revised IAS 19, “Employee Benefits”. See the “Accounting Standards Implemented in 2013”
section on page 37.(3) For financial definitions and ratios refer to the Glossary of Terms on page 109.

2013 Annual Report - Financial Review 9
Net Earnings Net earnings for 2013 decreased by $4 million compared to 2012, primarily driven by the increase in net interest expense and other financing charges and income tax expense, partially offset by the increase in operating income described above. Adjusted net earnings(1) increased by $21 million compared to 2012, primarily driven by the increase in adjusted operating income(1).
Basic net earnings per common share(2) for 2013 decreased by 0.4% to $2.24, from $2.25 in 2012. Adjusted basic net earnings per common share(1) for 2013 increased by 3.2% to $2.60 from $2.52 in 2012.
5.3 Selected Financial Information
The selected information presented below has been derived from and should be read in conjunction with the annual consolidated financial statements of the Company dated December 28, 2013, and the annual consolidated financial statements of the Company dated December 29, 2012. The analysis of the data contained in the table focuses on the trends and significant events or items affecting the financial condition and results of the Company’s operations over the latest three year period.
For the periods ended December 28, 2013, December 29, 2012 and December 31, 2011 2013 2012(3) 2011(3)
(millions of Canadian dollars except where otherwise indicated) (52 weeks) (52 weeks) (52 weeks)Revenue $ 32,371 $ 31,604 $ 31,250Net earnings 630 634 769Basic net earnings per common share ($) $ 2.24 $ 2.25 $ 2.73Diluted net earnings per common share ($) 2.22 2.23 2.71Dividends declared per common share ($) $ 0.94 $ 0.85 $ 0.84Dividends declared per Second Preferred Share, Series A ($) 1.49 1.49 1.49
As at As at As at(millions of Canadian dollars) December 28, 2013 December 29, 2012 December 31, 2011Total Assets $ 20,759 $ 17,961 $ 17,428
Long term debt $ 7,680 $ 5,669 $ 5,580Capital securities 224 223 222Trust Unit Liability 688 — —Long term financial liabilities $ 8,592 $ 5,892 $ 5,802
Revenue The Company’s retail sales have been under pressure in a competitively intense retail market and uncertain economic environment. In 2013, same-store sales(2) increased by 1.1% compared to a decline of 0.2% in 2012. Average annual national food price inflation as measured by “The Consumer Price Index for Food Purchased from Stores” (“CPI”) was 1.1% in 2013 and 2.3% in 2012. In 2013 and 2012, the Company’s average annual internal retail food price index was lower than CPI. During 2013, the number of corporate and franchise stores increased to 1,066 (2012 – 1,053; 2011 – 1,046). Retail square footage in 2013 increased to 51.9 million (2012 – 51.5 million; 2011 – 51.2 million). In addition, PC Financial revenues have shown strong growth over the past two years, increasing by 14.8% in 2013, and 17.7% in 2012.
(1) See Non-GAAP Financial Measures on page 40.(2) For financial definitions and ratios refer to the Glossary of Terms on page 109.(3) Certain 2012 figures have been restated due to the implementation of revised IAS 19, “Employee Benefits”. See the “Accounting Standards Implemented in 2013”
section on page 37.
Management’s Discussion and Analysis
10 2013 Annual Report - Financial Review
Operating Income Over the last three years, the Company’s consolidated operating income was impacted by the following items:• Choice Properties start-up costs recognized in the third quarter of 2013;• Choice Properties general and administrative costs beginning in 2013; • Costs related to the acquisition of Shoppers Drug Mart beginning in 2013; • Gains related to defined benefit plan amendments recorded in 2013; • Costs related to equity-based compensation net of equity forwards; • Restructuring costs, including the costs associated with reducing head office and administrative positions; • Fixed asset and other related impairments, net of recoveries; • Start-up costs associated with the launch of the Joe Fresh brand in the United States incurred in the fourth quarter of 2011; • Costs related to certain prior years’ commodity tax matters incurred in the second quarter of 2011; • A gain recognized related to the sale of a portion of a property in North Vancouver, British Columbia in the third quarter of 2011;
In addition to the items above, in both 2013 and 2012, the Company made investments in its customer proposition to better position itself in an intensely competitive market. Compared to 2011, the Company’s 2012 operating income was negatively impacted by these investments, which were not covered by operations, as well as incremental IT and supply chain charges and charges associated with transitioning certain Ontario conventional stores to the more cost effective and efficient operating terms of collective agreements ratified in 2010.
Net Earnings In 2013, net earnings and basic net earnings per common share were negatively impacted by an increase in net interest expense and other financing charges, which were primarily driven by the Choice Properties’ IPO transaction costs, the fair value adjustment related to the Trust Unit Liability, net interest related to the indebtedness incurred to finance the proposed acquisition of Shoppers Drug Mart, and early debt settlement costs. In addition, during 2013, net earnings and basic net earnings per common share were negatively impacted by a higher effective income tax rate, partially offset by higher operating income.
During 2012, net earnings and basic net earnings per common share were negatively impacted by lower operating income and higher net interest expense and other financing charges, partially offset by a lower effective income tax rate.
Total Assets and Long Term Financial Liabilities In 2013, total assets and long term financial liabilities increased by 15.6% and 45.8% respectively, compared to 2012. The increases during the year were primarily driven by the Choice Properties and Shoppers Drug Mart transactions as described in Section 5.1, “Significant Accomplishments in 2013” and 8.2, “Liquidity and Capital Structure” of this MD&A. Excluding these impacts, the Company’s total assets and long term financial liabilities have increased marginally over the last three years.

2013 Annual Report - Financial Review 11
6. Reportable Operating Segments Results of Operations
6.1 Retail Segment
For the periods ended December 28, 2013 and December 29, 2012 2013 2012(millions of Canadian dollars where otherwise indicated) (52 weeks) (52 weeks) $ Change % ChangeSales $ 31,600 $ 30,960 $ 640 2.1 %Gross profit 6,966 6,819 147 2.2 %Operating income 1,185 1,100 85 7.7 %Adjusted operating income(1) 1,172 1,197 (25) (2.1)%Adjusted EBITDA(1) 1,981 1,964 17 0.9 %
2013 2012For the periods ended December 28, 2013 and December 29, 2012 (52 weeks) (52 weeks)Same-store sales(2) growth (decline) 1.1% (0.2)%Gross profit percentage 22.0% 22.0 %Adjusted operating margin(1) 3.7% 3.9 %Adjusted EBITDA margin(1) 6.3% 6.3 %
Sales In 2013, the increase in Retail sales of $640 million, or 2.1%, over 2012 was a result of the following factors:
• Same-store sales(2) growth was 1.1% (2012 – decline of 0.2%) and excluding gas bar was 1.0% (2012 – decline of 0.2%);• Sales growth in food was moderate;• Sales in drugstore were flat;• Sales in general merchandise, excluding apparel, declined marginally;• Sales growth in apparel was modest;• Sales growth in gas bar was moderate;• The Company’s average annual internal food price inflation was lower than the average annual national food price inflation of 1.1%
(2012 – 2.3%) as measured by CPI. CPI does not necessarily reflect the effect of inflation on the specific mix of goods sold in Loblaw stores; and
• During 2013, 26 (2012 – 18) corporate and franchise stores were opened and 13 (2012 – 11) corporate and franchise stores were closed, resulting in a net increase of 0.4 million square feet, or 0.8%.
In 2013, the Company launched over 550 new control brand products and redesigned and/or improved the product or packaging of approximately 640 other products. Sales of control brand products in 2013 were $9.6 billion, flat to 2012 on a comparable basis.
Gross Profit In 2013, gross profit percentage was 22.0%, flat compared to 2012 and included the negative impacts of continued investments in food margins, offset by lower transportation costs and margin improvements in general merchandise. Gross profit increased by $147 million compared to 2012, driven by higher sales.
Operating Income Operating income increased by $85 million, and was positively impacted by the gain related to defined benefit plan amendments, favourable year-over-year changes in fixed asset and other related impairments, net of recoveries, and lower restructuring costs, partially offset by lower gains on disposal of assets, and costs related to the acquisition of Shoppers Drug Mart. Adjusted operating income(1) decreased by $25 million compared to 2012, primarily driven by investments in, and changes to the value of the Company’s franchise business, increased other operating costs, including depreciation and amortization, costs related to the growth in certain of the Company’s emerging businesses and foreign exchange losses, partially offset by higher gross profit and supply chain efficiencies. Adjusted operating margin(1) in 2013 was 3.7% compared to 3.9% in 2012.
Adjusted EBITDA(1) increased by $17 million compared to 2012, and adjusted EBITDA margin(1) was 6.3%, flat compared to 2012. Retail segment depreciation and amortization increased by $42 million compared to 2012.
(1) See Non-GAAP Financial Measures on page 40.(2) For financial definitions and ratios refer to the Glossary of Terms on page 109.

Management’s Discussion and Analysis
12 2013 Annual Report - Financial Review
6.2 Financial Services Segment
For the periods ended December 28, 2013 and December 29, 2012 2013 2012(millions of Canadian dollars except where otherwise indicated) (52 weeks) (52 weeks) $ Change % ChangeRevenue $ 739 $ 644 $ 95 14.8%Operating income 142 95 47 49.5%Earnings before income taxes 93 50 43 86.0%
As at As at(millions of Canadian dollars except where otherwise indicated) December 28, 2013 December 29, 2012 $ Change % ChangeAverage quarterly net credit card receivables $ 2,345 $ 2,105 $ 240 11.4%Credit card receivables 2,538 2,305 233 10.1%Allowance for credit card receivables 47 43 4 9.3%Annualized yield on average quarterly gross credit card
receivables(2) 13.6% 12.8%Annualized credit loss rate on average quarterly gross
credit card receivables(2) 4.2% 4.3%
Revenue Revenue in 2013 increased by $95 million, or 14.8%, compared to 2012. The increase was primarily driven by higher interest income, interchange and other service fee related income, driven by higher credit card receivable balances and increased credit card transaction values. Higher PC Telecom revenues resulting from growth in the Mobile Shop business also contributed to the increase.
Operating Income and Earnings Before Income Taxes Operating income and earnings before income taxes increased by $47 million and $43 million, respectively, compared to 2012. These increases were mainly attributable to the higher revenue described above, partially offset by continued investments in marketing, customer acquisitions and the Mobile Shop business.
Credit Card Receivables As at December 28, 2013, credit card receivables were $2,538 million, an increase of $233 million compared to December 29, 2012. This increase was primarily driven by growth in the active customer base as a result of continued investments in customer acquisitions and marketing initiatives. As at December 28, 2013, the allowance for credit card receivables was $47 million, an increase of $4 million compared to December 29, 2012, primarily due to the growth in the credit card receivables portfolio.
(1) See Non-GAAP Financial Measures on page 40.(2) For financial definitions and ratios refer to the Glossary of Terms on page 109.

2013 Annual Report - Financial Review 13
6.3 Choice Properties Segment
For the periods ended December 28, 2013 and December 29, 2012 2013(1) 2012(millions of Canadian dollars) (52 weeks) (52 weeks)
Revenue $ 319 $ —Operating income 370 —Adjusted operating income(2) 382 —Net interest expense and other financing charges 303 —
For the periods ended December 28, 2013 and December 29, 2012 2013(1) 2012(millions of Canadian dollars except where otherwise indicated) (52 weeks) (52 weeks)
Net operating income(2) $ 222 $ —Funds from operations(2) 159 —Adjusted funds from operations(2) 131 —Adjusted funds from operations per unit diluted(2) ($) 0.36 —Adjusted funds from operations payout ratio(2) 88.6% —%
Revenue Revenue in 2013 was $319 million, of which $287 million was received from the Retail segment. Revenue consists of base rent, operating cost and property tax recoveries.
Operating Income Operating income in 2013 was $370 million and included $12 million of start-up and general and administrative costs. Adjusted operating income(2) was $382 million and included a $144 million favourable fair value adjustment on investment properties, which are measured by the Company at cost.
Net Operating Income(2) Net operating income(2) in 2013 was $222 million, which consists of cash rental revenue less property operating costs.
Funds from Operations(2) and Adjusted Funds from Operations(2) Funds from operations(2) and adjusted funds from operations(2) in 2013 were $159 million and $131 million respectively.
Results of Choice Properties operations in 2013 were in line with the financial forecast included in Choice Properties’ equity and debt prospectuses dated June 26, 2013.
Subsequent to the initial transfer of properties, in 2013, Choice Properties acquired 11 investment properties from the Company for an aggregate purchase price of approximately $187 million, which was settled through the issuance of 11,576,883 Class B Limited Partnership units and cash. In addition, Choice Properties acquired a property from a third party for approximately $2 million, which was settled in cash.
Subsequent to the end of the year, Choice Properties completed the issuance of $450 million aggregate principal amount of senior unsecured debentures. See section 8.2 Liquidity and Capital Structure on page 17.
(1) Results are for the period ended December 31, 2013, consistent with Choice Properties’ fiscal calendar. Adjustments to December 28, 2013 are included in Consolidation and Eliminations.
(2) See Non-GAAP Financial Measures on page 40.

Management’s Discussion and Analysis
14 2013 Annual Report - Financial Review
7. Other Business Matters
Information Technology and Other Systems Implementations The Company is undertaking a major upgrade of its IT infrastructure, which began in 2010. This project represents one of the largest technology infrastructure programs ever implemented by the Company and is fundamental to its long term growth strategies. During 2013, the Company continued to make progress with the implementation and to date has successfully implemented the system in eight distribution centres and 75 stores, including 16 Joe Fresh stores, with little to no impact on customers. The Company is focused on optimizing data, systems and processes to continue to build a stable foundation for the roll-out and now expects the system to be implemented in all of its distribution centres and in all of the Company’s corporate retail stores by the end of 2014.
Inventory Valuation The Company values merchandise inventories at the lower of cost and net realizable value and uses the retail method to measure the cost of the majority of its retail store inventories. With the upgrade of its IT infrastructure, the Company expects to complete the conversion of its corporate retail stores to a perpetual inventory management system in 2014. The implementation of a perpetual inventory system combined with visibility to integrated costing information provided by the new IT systems will enable the Company to estimate the cost of inventory using a system-generated weighted average cost. Any changes to inventory cost would be reflected as an adjustment to the Company’s inventory with an offsetting adjustment recorded in gross profit.

2013 Annual Report - Financial Review 15
8. Liquidity and Capital Resources
8.1 Cash Flows
Major Cash Flow Components
For the periods ended December 28, 2013 and December 29, 2012 2013 2012(millions of Canadian dollars except where otherwise indicated) (52 weeks) (52 weeks) $ Change % ChangeCash flows from (used in):
Operating activities $ 1,491 $ 1,637 $ (146) (8.9)%Investing activities (1,839) (989) (850) (85.9)%Financing activities 1,521 (531) 2,052 386.4 %
Cash Flows from Operating Activities Cash flows from operating activities were $1,491 million in 2013, a decrease of $146 million compared to 2012. The decrease was due to higher investments in working capital and credit card receivables, partially offset by proceeds from the settlement of cross currency swaps, higher cash earnings and lower contributions to the Company’s defined benefit plans.
Working capital investments were affected by higher accounts receivable balances as a result of increases in the apparel business and vendor related receivables, the timing of the collection of other tax recoveries, and an increase in accrued liabilities due to costs related to the Shoppers Drug Mart acquisition.
Cash Flows used in Investing Activities Cash flows used in investing activities were $1,839 million in 2013, an increase of $850 million from 2012, primarily due to an increase in cash placed in security deposits, partially offset by a decrease in short term investments and lower fixed asset purchases.
The increase in security deposits in 2013 was primarily due to the funds placed in escrow related to the issuance of $1.6 billion aggregate principal amount of senior unsecured notes, which will be used to partially fund the acquisition of all of the outstanding common shares of Shoppers Drug Mart.
Capital investment(1) in 2013 was $0.9 billion (2012 – $1.0 billion). Approximately 14% (2012 – 15%) of this investment was for new store developments, expansions and land, approximately 45% (2012 – 31%) was for store conversions and renovations, and approximately 41% (2012 – 54%) was for infrastructure investments.
The 2013 corporate and franchise store capital investment program, which included the impact of store openings and closures, resulted in an increase in net retail square footage of 0.8% compared to 2012. During 2013, 26 (2012 – 18) corporate and franchise stores were opened and 13 (2012 – 11) corporate and franchise stores were closed, resulting in a net increase of 0.4 million square feet (2012 – 0.3 million square feet). In 2013, 192 (2012 – 181) corporate and franchise stores were renovated.
The Company expects to invest approximately $1.0 billion in capital expenditures in 2014. Approximately 21% of these funds are expected to be dedicated to investing in the IT and supply chain projects, 63% will be spent on retail operations and 16% on other infrastructure.
(1) For financial definitions and ratios refer to the Glossary of Terms on page 109.

Management’s Discussion and Analysis
16 2013 Annual Report - Financial Review
Capital Investment and Store Activity
2013 2012As at or for the periods ended December 28, 2013 and December 29, 2012 (52 weeks) (52 weeks) % ChangeCapital investment (millions of Canadian dollars) $ 865 $ 1,017 (14.9)%Corporate square footage (in millions) 37.2 37.6 (1.1)%Franchise square footage (in millions) 14.7 13.9 5.8 %Retail square footage (in millions) 51.9 51.5 0.8 %Number of corporate stores 570 580 (1.7)%Number of franchise stores 496 473 4.9 %Percentage of corporate real estate owned 72% 72%Percentage of franchise real estate owned 45% 45%Average store size (square feet)
Corporate 65,300 64,800 0.8 %Franchise 29,600 29,400 0.7 %
Cash Flows from (used in) Financing Activities During 2013, cash flows from financing activities were $1,521 million compared to $531 million used in 2012. The increase of $2,052 million was primarily due to net issuances of long term debt and net proceeds from the offering of Choice Properties’ Units, partially offset by repayment of short term debt and the purchase of common shares under the Company’s Normal Course Issuer Bid (“NCIB”), of which the Company placed $46 million into trusts for future settlement of the Company’s Restricted Share Unit (“RSU”) and Performance Share Unit (“PSU”) obligations.
In 2013, net issuances of long term debt were primarily driven by:• The issuance of $1.6 billion aggregate principal amount of senior unsecured notes issued to partially fund the acquisition of the
outstanding common shares of Shoppers Drug Mart;• Choice Properties’ public offering of $600 million aggregate principal amount of Debentures;• The issuance of $400 million of senior and subordinated term notes by the Independent Securitization Trust, partially offset by the
repayment of its $250 million of senior and subordinated term notes, and• The repayment of the Company’s USD $300 million USPP notes, of which $150 million was paid in advance of the original May 29,
2015 maturity date.• The repayment of the Company’s $200 million, 5.40% medium term note (“MTN”) that matured during 2013.
Free Cash Flow(1)
For the periods ended December 28, 2013 and December 29, 2012 2013 2012(millions of Canadian dollars except where otherwise indicated) (52 weeks) (52 weeks) $ Change % ChangeFree cash flow(1) $ 489 $ 468 $ 21 4.5%
Free Cash Flow(1) In 2013, free cash flow(1) was $489 million compared to $468 million in 2012. The increase in free cash flow(1) was primarily due to a decrease in fixed assets purchases partially offset by lower cash flows from operating activities described above.
Defined Benefit Pension Plan Contributions During 2014, the Company expects to contribute approximately $50 million (2013 – contributed approximately $99 million) to its registered funded defined benefit pension plans. The actual amount paid may vary from the estimate based on actuarial valuations being completed, investment performance, volatility in discount rates, regulatory requirements and other factors. In 2014, the Company also expects to make contributions to its defined contribution plans and multi-employer pension plans in which it participates as well as make benefit payments to the beneficiaries of the supplemental unfunded defined benefit pension plans, other defined benefit plans and other long term employee benefit plans.
(1) See Non-GAAP Financial Measures on page 40.

2013 Annual Report - Financial Review 17
8.2 Liquidity and Capital Structure
The Company holds significant cash and cash equivalents, short term investments and security deposits denominated in Canadian dollars. The funds are invested in highly liquid marketable short term investments consisting primarily of bankers’ acceptances, government treasury bills, corporate commercial paper, bank term deposits and government agency securities. During 2013, cash and cash equivalents, short term investments and security deposits increased by $2,204 million largely driven by key financing activities completed by the Company the financing related to the agreement to acquire Shoppers Drug Mart as described below, and the $660 million and $600 million of proceeds from Choice Properties’ IPO and debt offering, respectively, net of the repayment of USD $300 million of USPP notes and a $200 million MTN that matured in 2013.
Shoppers Drug Mart Financing In 2013, the Company amended its Short Form Base Shelf Prospectus dated December 21, 2012 to increase the amount issuable under the prospectus to $2.5 billion from $1.0 billion. Subsequently, the Company entered into committed bank facilities, consisting of a $3.5 billion term loan facility and a $1.6 billion bridge loan facility. The Company subsequently issued $1.6 billion aggregate principal amount of senior unsecured notes under its Short Form Base Shelf Prospectus and concurrently cancelled the $1.6 billion bridge loan facility. These proceeds will be released from escrow upon satisfaction of the applicable release conditions of the agreement and used to partially fund the acquisition of all of the outstanding common shares of Shoppers Drug Mart.
Choice Properties’ Prospectus In 2013, Choice Properties filed a Short Form Base Shelf Prospectus allowing for the issuance of up to $2 billion Units and/or debt securities over a 25-month period subject to the availability of funding in capital markets. Subsequent to the end of the year, Choice Properties issued $250 million principal amount of Series C senior unsecured debentures with a 7-year term and a coupon rate of 3.498% per annum and $200 million principal amount of Series D senior unsecured debentures with a 10-year term and a coupon rate of 4.293% per annum, under its Short Form Base Shelf Prospectus.
Committed Facilities In 2013, the Company amended its $800 million committed credit facility (“Credit Facility”) to increase the amount to $1 billion, subject to the successful close of the Shoppers Drug Mart transaction, and extended the term to December 31, 2018. In addition, the Company incorporated certain adjustments to exclude the impact of Choice Properties from its covenant calculations. The Company was in compliance with these covenants throughout the year. There were no amounts drawn under the Credit Facility as at December 28, 2013 or December 29, 2012.
In addition, in 2013, Choice Properties entered into an agreement for a $500 million, 5 year senior unsecured committed credit facility provided by a syndicate of lenders. This facility also contains certain financial covenants with which Choice Properties was in compliance throughout 2013. As at December 28, 2013, there were no amounts drawn under this facility.
Liquidity The Company expects that cash and cash equivalents, short term investments, future operating cash flows and the amounts available to be drawn against its committed credit facilities will enable the Company to finance its capital investment program and fund its ongoing business requirements, including working capital, pension plans and financial obligations over the next 12 months. If required, the Company expects it could obtain long term financing through its MTN program. Choice Properties expects to obtain its long term financing primarily through the issuance of equity and unsecured debentures. In addition, the Company expects that it has sufficient financing available to fund the cash portion of the proposed Shoppers Drug Mart purchase price.
Adjusted Debt(1) to Adjusted EBITDA(1)
As at As atDecember 28, 2013 December 29, 2012
Adjusted debt(1) to Adjusted EBITDA(1) 2.8x 2.1x
The Company monitors its Adjusted Debt(1) to Adjusted EBITDA(1) ratio as a measure to ensure it is operating under an efficient capital structure. The ratio increased in 2013, driven primarily by the issuance of long term debt related to Choice Properties and the Shoppers Drug Mart transaction. The ratio is expected to further increase upon closing of the Shoppers Drug Mart acquisition as the Company draws up to $3.5 billion of its committed term loan to partially fund the cash consideration. The Company will continue to target leverage ratios consistent with those of investment grade ratings.
(1) See Non-GAAP Financial Measures on page 40.

Management’s Discussion and Analysis
18 2013 Annual Report - Financial Review
The following are excluded from Adjusted Debt(1):
Independent Funding Trusts Certain independent franchisees of the Company obtain financing through a structure involving independent funding trusts, which were created to provide loans to the independent franchisees to facilitate their purchase of inventory and fixed assets. These independent funding trusts are administered by a major financial institution. As at December 28, 2013, the independent funding trusts had drawn $475 million (December 29, 2012 – $459 million) from the revolving committed credit facility that is the source of funding to the independent funding trusts. The Company intends to renew this committed credit facility, which expires in 2014.
The Company has agreed to provide a credit enhancement of $48 million (2012 – $48 million) in the form of a standby letter of credit for the benefit of the independent funding trusts representing not less than 10% (2012 – 10%) of the principle amount of loans outstanding. As at December 28, 2013, the Company had provided a letter of credit in the amount of $48 million (December 29, 2012 – $48 million). This credit enhancement allows the independent funding trusts to provide financing to the Company’s independent franchisees. As well, each independent franchisee provides security to the independent funding trusts for its obligations by way of a general security agreement. In the event that an independent franchisee defaults on its loan and the Company has not, within a specified time period, assumed the loan, or the default is not otherwise remedied, the independent funding trusts would assign the loan to the Company and draw upon this standby letter of credit. This standby letter of credit has never been drawn upon. The Company has agreed to reimburse the issuing bank for any amount drawn on the standby letter of credit.
Independent Securitization Trusts The Company, through President’s Choice Bank (“PC Bank”), participates in various securitization programs that provide the primary source of funds for the operation of its credit card business. PC Bank sells and repurchases credit card receivables to Independent Securitization Trusts, including Eagle and Other Independent Securitization Trusts, from time to time depending on PC Bank’s financing requirements.
The Company has arranged letters of credit on behalf of PC Bank, representing 9% (December 29, 2012 – 9%) of the outstanding securitized liability for the benefit of the Other Independent Securitization Trusts in the amount of $54 million (December 29, 2012 – $81 million). During 2013, PC Bank repurchased $300 million (2012 – nil) of co-ownership interests in the securitized receivables from Other Independent Securitization Trusts and, as a result, the letters of credit outstanding were reduced to $54 million. In the event of a major decline in the income flow from, or in the value of, the securitized credit card receivables, the Other Independent Securitization Trusts can draw upon these letters of credit to recover up to a maximum of the amount outstanding on the letters of credit. Under its securitization programs, PC Bank is required to maintain at all times a credit card receivable pool balance equal to a minimum of 107% of the outstanding securitized liability and was in compliance with this requirement throughout 2013. During 2013, Eagle filed a Short Form Base Shelf Prospectus which allows for the potential issuance of up to $1.5 billion of notes over a 25-month period. During 2013, PC Bank amended and extended the maturity date for one of its other Independent Securitization Trust agreements from the third quarter of 2014 to the third quarter of 2015, with no material impact to other terms and conditions.
In 2013, Eagle issued $400 million of senior and subordinated term notes with a maturity date of October 17, 2018 at a weighted average interest rate of 2.91%. During 2013, the three-year $250 million senior and subordinated term notes issued by Eagle matured and were repaid.
Subsequent to the end of 2013, PC Bank extended the maturity date for two of its Other Independent Securitization Trust agreements from the second quarter of 2015 to the second quarter of 2016, with all other terms and conditions remaining substantially the same.
Guaranteed Investment Certificates The following table summarizes PC Bank's Guaranteed Investment Certificates (“GICs”) activity, before commissions, for 2013 and 2012:
(millions of Canadian dollars) 2013 2012Balance, beginning of year $ 303 $ 276GICs issued 167 76GICs matured (40) (49)Balance, end of year $ 430 $ 303
As at December 28, 2013, $52 million in GICs were recorded as long term debt due within one year (December 29, 2012 – $36 million).
Credit Ratings Following a review of the implications of the Company’s agreement to acquire Shoppers Drug Mart during the third quarter of 2013, Dominion Bond Rating Service and Standard & Poor’s re-confirmed the Company’s and Choice Properties’ credit ratings of BBB in each case, with a stable trend and outlook, respectively.
(1) See Non-GAAP Financial Measures on page 40.

2013 Annual Report - Financial Review 19
The following table sets out the current credit ratings of the Company:
Dominion Bond Rating Service Standard & Poor’sCredit Ratings (Canadian Standards) Credit Rating Trend Credit Rating OutlookIssuer rating BBB Stable BBB StableMedium term notes BBB Stable BBB n/aOther notes and debentures BBB Stable BBB n/aPreferred shares Pfd-3 Stable P-3 (high) n/a
The following table sets out the current credit ratings of Choice Properties:
Dominion Bond Rating Service Standard & Poor’sCredit Ratings (Canadian Standards) Credit Rating Trend Credit Rating OutlookIssuer rating BBB Stable BBB StableSenior unsecured debentures BBB Stable BBB n/a
8.3 Share Capital
Outstanding Share Capital and Capital Securities The following table details the outstanding common shares and preferred shares as at December 28, 2013:
Authorized OutstandingCommon Shares Unlimited 282,311,573First Preferred Shares 1,000,000 nilSecond Preferred Shares, Series A(i) 12,000,000 9,000,000
(i) The Second Preferred Shares, Series A are presented as Capital Securities on the consolidated balance sheets.
As at December 28, 2013, a total of 10,995,995 stock options were outstanding, representing 4% of the Company’s issued and outstanding common shares. Each stock option is exercisable into one common share of the Company at a price specified in the terms of the option agreement.
Dividends The following table summarizes the Company’s cash dividends declared in 2013 and 2012:
December 28, 2013 December 29, 2012(52 weeks) (52 weeks)
Dividends declared per share(i) ($):Common share $ 0.94 $ 0.85Second Preferred Share, Series A(ii) $ 1.49 $ 1.49
(i) The fourth quarter dividends of $0.24 per share declared on common shares have a payment date of December 30, 2013. The fourth quarter dividends of $0.37 per share declared on Second Preferred Shares, Series A have a payment date of January 31, 2014.
(ii) Dividends on Second Preferred Shares, Series A are presented in net interest and other financing charges on the consolidated statements of earnings.
The declaration and payment of dividends on the Company’s common shares and the amount thereof are at the discretion of the Board of Directors (“Board”), which takes into account the Company’s financial results, capital requirements, available cash flow, future prospects of the Company’s business and other factors considered relevant from time to time. Over time, it is the Company’s intention to increase the amount of the dividend while retaining appropriate free cash flow to reduce debt and finance future growth. During the second quarter of 2013, the Board raised the quarterly dividend by approximately 9.1%, to $0.24 per common share.
Subsequent to year end, the Board declared a quarterly dividend of $0.24 per common share payable April 1, 2014, and declared a quarterly dividend of $0.37 per Second Preferred Share, Series A, payable April 30, 2014. At the time such dividends are declared, the Company identifies on its website (loblaw.ca) the designation of eligible and ineligible dividends in accordance with the administrative position of the Canada Revenue Agency (“CRA”).

Management’s Discussion and Analysis
20 2013 Annual Report - Financial Review
Normal Course Issuer Bid In 2013, the Company purchased for cancellation 1,500,000 (2012 – 423,705) common shares under the NCIB resulting in a charge to retained earnings of $64 million (2012 – $14 million) for the premium on the common shares and a reduction in common share capital of $9 million (2012 – $2 million).
In 2013, the Company renewed its NCIB to purchase on the TSX or enter into equity derivatives to purchase up to 14,103,672 of the Company’s common shares, representing approximately 5% of the common shares outstanding. In accordance with the rules and by-laws of the TSX, the Company may purchase its shares at the then market price of such shares. In 2013, the Company also entered into an automatic share repurchase agreement under its NCIB that permits the Company to buy back its shares during blackout periods in accordance with predetermined instructions. The Company intends to renew its NCIB in 2014.
In 2013, the Company purchased 1,103,500 common shares under its NCIB for cash consideration of $46 million and placed these shares into trusts for future settlement of the Company’s RSU and PSU obligations. During 2013, the activity in these trusts resulted in a net charge to retained earnings of $39 million and a $6 million net reduction in common share capital.
8.4 Contractual Obligations
The following illustrates certain of the Company’s significant contractual obligations and discusses other obligations as at December 28, 2013:
Summary of Contractual Obligations
Payments due by year(millions of Canadian dollars) 2014 2015 2016 2017 2018 Thereafter TotalLong term debt (including fixed interest
payments(i)) $ 1,361 $ 742 $ 756 $ 435 $ 1,317 $ 7,746 $ 12,357Operating leases(ii) 204 186 156 129 106 443 1,224Contracts for purchases of
Investment projects(iii) 53 1 1 — — — 55Purchase obligations(iv) 116 95 61 43 43 — 358Total contractual obligations $ 1,734 $ 1,024 $ 974 $ 607 $ 1,466 $ 8,189 $ 13,994
(i) Fixed interest payments are based on the maturing face values and annual interest for each instrument, including GICs, long term independent securitization trusts and an independent funding trust, as well as annual payment obligations for Consolidated Structured Entities, mortgages and finance lease obligations.
(ii) Represents the minimum or base rents payable. Amounts are not offset by any expected sub-lease income.(iii) These obligations include agreements for the purchase of real property and capital commitments for construction, expansion and renovation of buildings. These
agreements may contain conditions that may or may not be satisfied. If the conditions are not satisfied, it is possible the Company will no longer have the obligation to proceed with the underlying transactions.
(iv) Include contractual obligations to purchase goods or services of a material amount where the contract prescribes fixed or minimum volumes to be purchased or payments to be made within a fixed period of time for a set or variable price. These are only estimates of anticipated financial commitments under these arrangements and the amount of actual payments will vary. These purchase obligations do not include purchase orders issued or agreements made in the ordinary course of business which are solely for goods which are meant for resale, nor do they include any contracts which may be terminated on relatively short notice or with relatively insignificant cost or liability to the Company.
At year end, the Company had additional long term liabilities which included defined benefit plan and other long term employee benefit plan liabilities, deferred vendor allowances, Trust Unit Liability and provisions, including insurance liabilities. These long term liabilities have not been included above as the timing and amount of future payments are uncertain.
In addition, in accordance with the July 14, 2013 arrangement agreement between the Company and Shoppers Drug Mart, the Company is required to pay consideration of up to approximately $6.7 billion in cash and issue up to approximately 119.9 million common shares in exchange for all of the outstanding common shares of Shoppers Drug Mart.
9. Financial Derivative Instruments
Cross Currency Swaps In 2013, Glenhuron Bank Limited (“Glenhuron”) unwound its cross currency swaps and received a net cash settlement of $76 million, representing the cumulative fair value gain on the swaps. The swaps were offset by the effect of translation gains and losses relating to USD cash and cash equivalents, short term investments and security deposits. As at December 29, 2012, a cumulative unrealized foreign currency exchange rate receivable of $20 million was recorded in prepaid expenses and other assets and $93 million was recorded in other assets related to these swaps.

2013 Annual Report - Financial Review 21
The following table summarizes the impact to operating income resulting from changes in fair value of the Glenhuron cross currency swaps and the underlying exposures:
(millions of Canadian dollars) 2013 2012Fair value loss (gain) related to swaps $ 37 $ (25)Translation (gain) loss related to the underlying exposures (33) 27
In 2013, the Company settled its USD $300 million USPP cross currency swaps in conjunction with the settlement of the underlying USD $300 million USPP notes, and received a net cash settlement of $18 million. The USPP cross currency swaps were used to manage the effect of translation (gains) losses on the underlying USD USPP notes in long term debt. As part of the full settlement, the Company settled its USD $150 million USPP cross currency swap, which matured on May 29, 2013. On settlement of the swap, an unrealized fair value gain of $5 million, net of tax of $2 million, which had been deferred in accumulated other comprehensive income was realized in operating income.
As at December 29, 2012, a cumulative unrealized foreign currency exchange rate receivable of $2 million was recorded in prepaid expenses and other assets, and a receivable of $5 million was recorded in other assets, related to the USPP cross currency swaps.
The following table summarizes the impact to operating income resulting from changes in fair value of the USPP cross currency swaps and the underlying exposures:
(millions of Canadian dollars) 2013 2012Fair value (gain) loss related to swaps(i) $ (11) $ 7Translation loss (gain) related to the underlying exposures 14 (6)
(i) Excludes the $7 million gain reclassified from accumulated other comprehensive income in 2013.
Interest Rate Swaps During 2013, the Company settled its notional $150 million in interest rate swaps. As at December 29, 2012, the Company maintained this notional $150 million in interest rate swaps which paid a fixed-rate of interest of 8.38% and had recognized a cumulative loss of $5 million which was recorded in trade payables and other liabilities.
During 2013, the Company recognized a $5 million fair value gain (2012 – $11 million) in operating income related to these swaps.
Equity Forward Contracts During 2013, Glenhuron paid $16 million to settle the remaining equity forwards representing 1,103,500 Loblaw common shares. Glenhuron recognized a nominal loss in operating income (2012 – $5 million gain) related to these forwards. As at December 29, 2012, the cumulative accrued interest and unrealized market loss of $16 million was included in accounts payable and accrued liabilities.
Other Derivatives and Instruments The Company also maintains other financial derivatives including foreign exchange forwards and fuel exchange traded futures and options. During 2013, the Company recognized a $7 million gain (2012 – nominal) in operating income. As at December 28, 2013, a $2 million cumulative unrealized gain was recorded in prepaid expenses and other assets (December 29, 2012 – nominal cumulative unrealized gain).
In connection with the issuance of $1.6 billion of senior unsecured notes in 2013, the Company hedged its exposure to interest rates in advance of the issuance. As this relationship did not qualify for hedge accounting, the resulting $10 million gain on settlement was recorded in operating income.

Management’s Discussion and Analysis
22 2013 Annual Report - Financial Review
10. Off-Balance Sheet Arrangements
In the normal course of business, the Company enters into off-balance sheet arrangements including:
Letters of Credit Standby and documentary letters of credit are used in connection with certain obligations mainly related to real estate transactions, benefit programs, purchase orders and performance guarantees, securitization of PC Bank’s credit card receivables and third party financing made available to the Company’s independent franchisees. The aggregate gross potential liability related to the Company’s letters of credit is approximately $470 million (2012 – $477 million).
As at December 28, 2013, the Company had agreements to cash collateralize certain of these letters of credit up to an amount of $136 million (December 29, 2012 – $133 million), of which $102 million (December 29, 2012 – $97 million) was deposited with major financial institutions and classified as security deposits.
Guarantees In addition to the letters of credit mentioned above, the Company has entered into various guarantee arrangements including obligations to indemnify third parties in connection with leases, business dispositions and other transactions in the normal course of business. Additionally, the Company has provided a guarantee on behalf of PC Bank to MasterCard® International Incorporated for accepting PC Bank as a card member and licensee of MasterCard®. During 2013, the Company decreased its guarantee on behalf of PC Bank to MasterCard® International Incorporated to USD $170 million (2012 – USD $230 million).
11. Quarterly Results of Operations
11.1 Results by Quarter
Under an accounting convention common in the food retail industry, the Company follows a 52-week reporting cycle which periodically necessitates a fiscal year of 53 weeks. 2013 and 2012 are 52-week fiscal years. The 52-week reporting cycle is divided into four quarters of 12 weeks each, except for the third quarter, which is 16 weeks in duration. The following is a summary of selected consolidated financial information derived from the Company’s unaudited interim period condensed consolidated financial statements for each of the eight most recently completed quarters.
Summary of Consolidated Quarterly Results
2013 2012(1)
(millions of Canadian dollarsexcept where otherwiseindicated) (unaudited)
FirstQuarter
(12 weeks)
Second Quarter
(12 weeks)
Third Quarter
(16 weeks)
Fourth Quarter
(12 weeks)
Total(audited)
(52 weeks)
FirstQuarter
(12 weeks)
Second Quarter
(12 weeks)
Third Quarter
(16 weeks)
Fourth Quarter
(12 weeks)
Total (audited)
(52 weeks)
Revenue $ 7,202 $ 7,520 $ 10,009 $ 7,640 $ 32,371 $ 6,937 $ 7,375 $ 9,827 $ 7,465 $ 31,604Net earnings $ 171 $ 178 $ 154 $ 127 $ 630 $ 122 $ 156 $ 217 $ 139 $ 634Net earnings per
common share:Basic ($) $ 0.61 $ 0.63 $ 0.55 $ 0.45 $ 2.24 $ 0.43 $ 0.55 $ 0.77 $ 0.49 $ 2.25Diluted ($) $ 0.60 $ 0.63 $ 0.54 $ 0.45 $ 2.22 $ 0.43 $ 0.55 $ 0.75 $ 0.46 $ 2.23
Average national foodprice inflation (asmeasured by CPI) 1.4% 1.5% 0.9% 0.9% 1.1% 3.7 % 2.5% 1.8 % 1.5% 2.3 %
Retail same-store sales(2) growth (decline) 2.8% 1.1% 0.4% 0.6% 1.1% (0.7)% 0.2% (0.2)% 0.0% (0.2)%
The Company’s average quarterly internal retail food price inflation for 2012 and 2013 remained lower than the average quarterly national food price inflation as measured by CPI. CPI does not necessarily reflect the effect of inflation on the specific mix of goods sold in Loblaw stores.
Over the past eight quarters, net retail square footage increased by 0.7 million square feet to 51.9 million square feet.
(1) Certain 2012 figures have been restated due to the implementation of revised IAS 19, “Employee Benefits”. See the “Accounting Standards Implemented in 2013” section on page 37.
(2) For financial definitions and ratios refer to the Glossary of Terms on page 109.

2013 Annual Report - Financial Review 23
Fluctuations in quarterly net earnings during 2013 reflect the underlying operations of the Company and are impacted by seasonality, which is greatest in the fourth quarter and least in the first quarter, and the timing of holidays and were impacted by the following significant items:• Choice Properties start-up costs and IPO transaction costs incurred in 2013;• Choice Properties general and administrative costs beginning in 2013; • Costs related to the acquisition of Shoppers Drug Mart beginning in 2013; • Gains related to defined benefit plan amendments recorded in 2013; • Early debt settlement costs incurred in 2013;• The fair value adjustment of the Trust Unit Liability beginning in 2013;• Costs related to equity-based compensation net of equity forwards; • Restructuring costs, including the costs associated with reducing head office and administrative positions; • Fixed asset and other related impairments, net of recoveries; • Start-up costs associated with the launch of the Joe Fresh brand in the United States incurred in the fourth quarter of 2011; • Costs related to certain prior years’ commodity tax matters incurred in the second quarter of 2011; and• A gain recognized related to the sale of a portion of a property in North Vancouver, British Columbia in the third quarter of 2011.
11.2 Fourth Quarter Results
The following is a summary of selected consolidated unaudited financial information for the fourth quarter of 2013.
Selected Consolidated Information for the Fourth Quarter
For the periods ended December 28, 2013 and December 29, 2012 (unaudited) 2013 2012(1)
(millions of Canadian dollars except where otherwise indicated) (12 weeks) (12 weeks) $ Change % ChangeRevenue $ 7,640 $ 7,465 175 2.3 %Operating income 314 261 53 20.3 %Adjusted operating income(2) 322 325 (3) (0.9)%Adjusted operating margin(2) 4.2% 4.4%Adjusted EBITDA(2) $ 518 $ 512 $ 6 1.2 %Adjusted EBITDA margin(2) 6.8% 6.9%Net interest expense and other financing charges $ 141 $ 84 $ 57 67.9 %Income taxes 46 38 8 21.1 %Net earnings 127 139 (12) (8.6)%Basic net earnings per common share(3) ($) $ 0.45 $ 0.49 $ (0.04) (8.2)%Adjusted basic net earnings per common share(2) ($) 0.65 0.66 (0.01) (1.5)%Cash flows from (used in): Operating activities $ 738 $ 605 $ 133 22.0 % Investing activities 471 (223) 694 311.2 % Financing activities (387) (54) (333) (616.7)%Dividends declared per common share ($) $ 0.24 $ 0.22 $ 0.02 9.1 %Dividends declared on Second Preferred Share, Series A ($) 0.37 0.37 — — %
(1) Certain 2012 figures have been restated due to the implementation of revised IAS 19, “Employee Benefits”. See the “Accounting Standards Implemented in 2013” section on page 37.
(2) See Non-GAAP Financial Measures on page 40.(3) For financial definitions and ratios refer to the Glossary of Terms on page 109.

Management’s Discussion and Analysis
24 2013 Annual Report - Financial Review
The $175 million increase in revenue compared to the fourth quarter of 2012 was primarily driven by increases in the Company’s Retail and Financial Services segments.
Operating income increased by $53 million compared to the fourth quarter of 2012. The change in operating income was positively impacted by favourable year-over-year changes in fixed asset and other related impairments, net of recoveries, and lower restructuring costs, partially offset by lower gains on disposal of assets, costs related to the acquisition of Shoppers Drug Mart, higher year-over-year equity-based compensation charges and general and administrative costs related to Choice Properties. Adjusted operating income(1) decreased by $3 million compared to the fourth quarter of 2012, primarily driven by a decrease in the Retail segment’s adjusted operating income(1), partially offset by an increase in the Financial Services segment’s adjusted operating income(1). Adjusted operating margin(1) was 4.2% for the fourth quarter of 2013 compared to 4.4% in the same quarter in 2012.
Net interest and other financing charges increased by $57 million compared to the fourth quarter of 2012. Net interest and other financing charges included an unfavourable $34 million fair value adjustment related to the Trust Unit Liability, for the change in the fair value of Choice Properties Units held by unitholders other than the Company, and net interest of $14 million relating to indebtedness incurred to finance the acquisition of Shoppers Drug Mart. Excluding these impacts, net interest expense and other financing charges increased by $9 million, driven primarily by Unit distributions by Choice Properties.
Income tax expense for the fourth quarter 2013 was $46 million (2012 – $38 million) and the effective income tax rate was 26.6% (2012 – 21.5%). The increase in the effective income tax rate over the fourth quarter of 2012 was primarily due to an increase in non-deductible amounts (including fair value adjustments on the Trust Unit Liability), partially offset by an increase in income tax recoveries related to prior year matters.
Net earnings decreased by $12 million compared to the fourth quarter of 2012, primarily driven by the increase in net interest expense and other financing charges described above, partially offset by the increase in operating income. Adjusted net earnings(1) decreased by $2 million compared to the fourth quarter of 2012, primarily driven by the impact of the increase in net interest expense and other financing charges after excluding Shoppers Drug Mart related costs and the fair value adjustment related to the Trust Unit Liability described above, and the decrease in adjusted operating income(1).
Basic net earnings per common share(2) were $0.45 in the fourth quarter of 2013 compared to $0.49 in the fourth quarter of 2012. Adjusted basic net earnings per common share(1) were $0.65 in the fourth quarter of 2013 compared to $0.66 in the fourth quarter of 2012.
In the fourth quarter of 2013, the Company invested $304 million in capital expenditures.
During the fourth quarter of 2013, the Company announced the reduction of approximately 275 store-support positions, and incurred a charge of $32 million associated with this restructuring (2012 – $61 million).
Cash flows from operating activities for the fourth quarter of 2013 were $738 million, an increase of $133 million compared to $605 million in 2012. The increase in cash flows from operating activities was a result of proceeds from the settlement of cross currency swaps and a more moderate investment in credit card receivables, offset by lower cash earnings and a change in the Company’s investment in working capital.
The decrease in working capital investments in the fourth quarter of 2013 was affected by increases in accounts payable as a result of active vendor management, partially offset by increases in accounts receivable as a result of increases in vendor related receivables and the timing of the collection of other taxes recoverable.
Cash flows from investing activities in the fourth quarter of 2013 were $471 million compared to cash flows used in investing activities of $223 million in the fourth quarter of 2012. The change was primarily driven by a decrease in short term investments and the release of funds from security deposits in the fourth quarter of 2013 for the repayment of Eagle notes.
Cash flows used in financing activities in the fourth quarter of 2013 were $387 million, an increase of $333 million compared to $54 million in the same period in 2012. The increase in cash flows used in financing activities was primarily due to the repayment of short term debt and net repayments of long term debt in the fourth quarter of 2013 compared to the fourth quarter of 2012.
(1) See Non-GAAP Financial Measures on page 40(2) For financial definitions and ratios refer to the Glossary of Terms on page 109.

2013 Annual Report - Financial Review 25
Retail Segment Fourth Quarter Results of Operations
For the periods ended December 28, 2013 and December 29, 2012 2013 2012(millions of Canadian dollars except where otherwise indicated) (unaudited) (12 weeks) (12 weeks) $ Change % ChangeSales $ 7,419 $ 7,289 $ 130 1.8 %Gross profit 1,643 1,575 68 4.3 %Operating income 270 227 43 18.9 %Adjusted operating income 273 291 (18) (6.2)%Adjusted EBITDA 464 476 (12) (2.5)%
2013 2012For the periods ended December 28, 2013 and December 29, 2012 (unaudited) (12 weeks) (12 weeks)Same-store sales(1) growth 0.6% —%Gross profit percentage 22.1% 21.6%Adjusted operating margin(2) 3.7% 4.0%Adjusted EBITDA margin(2) 6.3% 6.5%
In the fourth quarter of 2013, the increase in Retail sales of $130 million, or 1.8%, over the fourth quarter of 2012 was a result of the following factors: • Same-store sales(1) growth was 0.6% (2012 – flat) and excluding gas bar was 0.6% (2012 – decline of 0.1%), positively impacted by
the timing of the Thanksgiving holiday, estimated to be between 0.6% and 0.8%, and negatively impacted by an ice storm in Eastern Canada and a strike in Western Canada which negatively impacted same-store sales(1) growth by approximately 0.2% and 0.1%, respectively. The range of same-store sales(1) growth for the quarter, after the impact of these items, was approximately 0.1% to 0.3%;
• Sales growth in food was moderate; • Sales in drugstore declined marginally; • Sales in general merchandise, excluding apparel, declined marginally; • Sales growth in apparel was modest; • Sales growth in gas bar was modest;• The Company's average annual internal food price inflation during fourth quarter of 2013 was lower than the average quarterly national
food price inflation of 0.9% (2012 – 1.5%) as measured by CPI. CPI does not necessarily reflect the effect of inflation on the specific mix of goods sold in Loblaw stores; and
• 26 corporate and franchise stores were opened and 13 corporate and franchise stores were closed in the last 12 months, resulting in a net increase of 0.4 million square feet, or 0.8%.
In the fourth quarter of 2013, gross profit increased by $68 million compared to the fourth quarter of 2012. Gross profit percentage in the fourth quarter of 2013 was 22.1%, up 50 basis points compared to the fourth quarter of 2012. The improvements in gross profit and gross profit percentage were primarily driven by improved shrink and transportation costs, and margin improvements in general merchandise, partially offset by the negative impact of continued investments in food margins.
Operating income increased by $43 million compared to the fourth quarter of 2012, primarily driven by favourable year-over-year changes in fixed asset and other related impairments, net of recoveries and lower restructuring costs, partially offset by lower gains on disposal of assets, and costs related to the acquisition of Shoppers Drug Mart. Adjusted operating income(2) decreased by $18 million compared to the fourth quarter of 2012, primarily driven by investments in, and changes to the value of the Company's franchise business, costs related to the growth in certain of the Company's emerging businesses and higher other operating costs, including depreciation and amortization, partially offset by higher gross profit and labour efficiencies. For the fourth quarter of 2013, adjusted operating margin(2) was 3.7% compared to 4.0% in the same period in 2012.
Adjusted EBITDA(2) decreased by $12 million compared to the fourth quarter of 2012. For the fourth quarter of 2013, adjusted EBITDA(2) margin was 6.3% compared to 6.5% in the same period in 2012. Retail segment depreciation and amortization increased by $6 million compared to the fourth quarter of 2012. (1) For financial definitions and ratios refer to the Glossary of Terms on page 109. (2) See Non-GAAP Financial Measures on page 40.

Management’s Discussion and Analysis
26 2013 Annual Report - Financial Review
Financial Services Segment Fourth Quarter Results of Operations
For the periods ended December 28, 2013 and December 29, 2012 2013 2012(millions of Canadian dollars except where otherwise indicated) (unaudited) (12 weeks) (12 weeks) $ Change % ChangeRevenue $ 204 $ 176 $ 28 15.9%Operating income 43 34 9 26.5%Earnings before income taxes 29 23 6 26.1%
As at As at(millions of Canadian dollars except where otherwise indicated) December 28, 2013 December 29, 2012 $ Change % ChangeAverage quarterly net credit card receivables $ 2,345 $ 2,105 $ 240 11.4%Credit card receivables 2,538 2,305 233 10.1%Allowance for credit card receivables 47 43 4 9.3%Annualized yield on average quarterly gross credit card
receivables(1) 13.6% 12.8%Annualized credit loss rate on average quarterly gross credit
card receivables(1) 4.2% 4.3%
Revenue for the fourth quarter of 2013 increased by 15.9% compared to the fourth quarter of 2012. This increase was primarily driven by higher interest income from higher credit card receivable balances. Higher PC Telecom revenues resulting from growth in the Mobile Shop business also contributed to the increase.
Operating income and earnings before income taxes increased by $9 million and $6 million, respectively, compared to the fourth quarter of 2012. These increases were mainly attributable to the higher revenue described above, partially offset by higher operating costs and continued investments in marketing and customer acquisitions.
As at December 28, 2013, credit card receivables were $2,538 million, an increase of $233 million compared to December 29, 2012. This increase was primarily driven by growth in the active customer base as a result of continued investments in customer acquisitions and marketing initiatives. As at December 28, 2013, the allowance for credit card receivables was $47 million, an increase of $4 million compared to December 29, 2012, primarily due to the growth in the credit card receivables portfolio.
(1) For financial definitions and ratios refer to the Glossary of Terms on page 109.
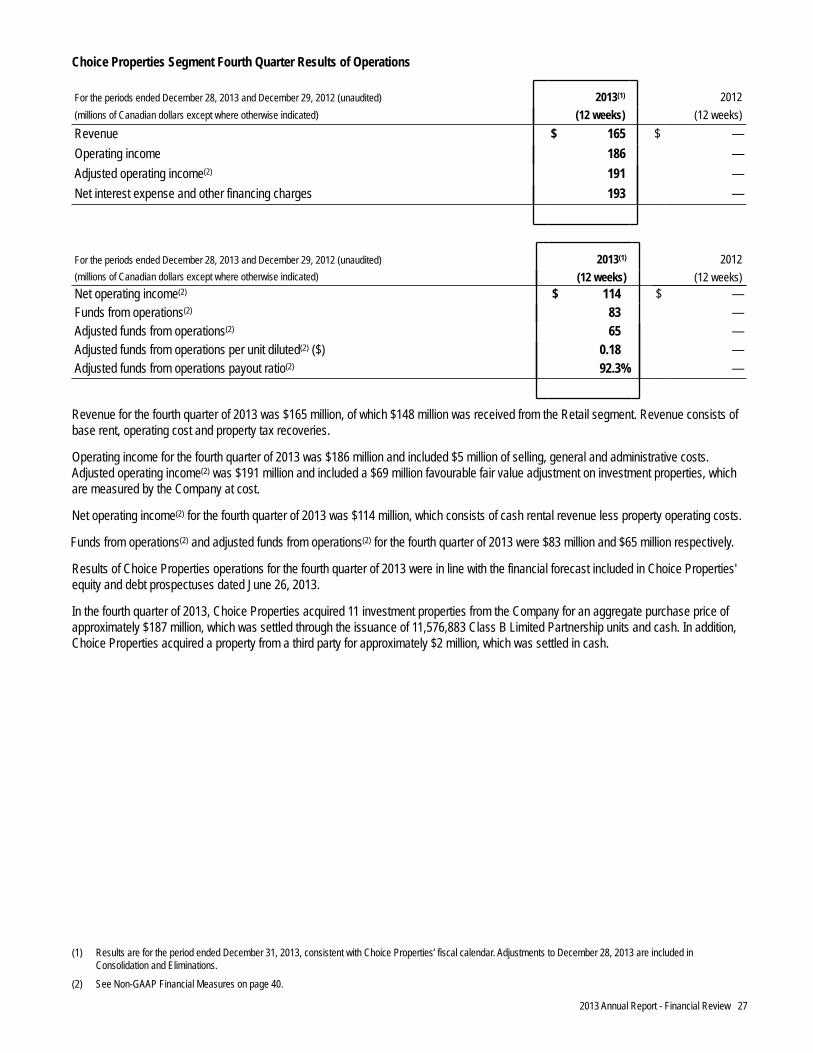
2013 Annual Report - Financial Review 27
Choice Properties Segment Fourth Quarter Results of Operations
For the periods ended December 28, 2013 and December 29, 2012 (unaudited) 2013(1) 2012(millions of Canadian dollars except where otherwise indicated) (12 weeks) (12 weeks)Revenue $ 165 $ —Operating income 186 —Adjusted operating income(2) 191 —Net interest expense and other financing charges 193 —
For the periods ended December 28, 2013 and December 29, 2012 (unaudited) 2013(1) 2012(millions of Canadian dollars except where otherwise indicated) (12 weeks) (12 weeks)Net operating income(2) $ 114 $ —Funds from operations(2) 83 —Adjusted funds from operations(2) 65 —Adjusted funds from operations per unit diluted(2) ($) 0.18 —Adjusted funds from operations payout ratio(2) 92.3% —
Revenue for the fourth quarter of 2013 was $165 million, of which $148 million was received from the Retail segment. Revenue consists of base rent, operating cost and property tax recoveries.
Operating income for the fourth quarter of 2013 was $186 million and included $5 million of selling, general and administrative costs. Adjusted operating income(2) was $191 million and included a $69 million favourable fair value adjustment on investment properties, which are measured by the Company at cost.
Net operating income(2) for the fourth quarter of 2013 was $114 million, which consists of cash rental revenue less property operating costs.
Funds from operations(2) and adjusted funds from operations(2) for the fourth quarter of 2013 were $83 million and $65 million respectively.
Results of Choice Properties operations for the fourth quarter of 2013 were in line with the financial forecast included in Choice Properties' equity and debt prospectuses dated June 26, 2013.
In the fourth quarter of 2013, Choice Properties acquired 11 investment properties from the Company for an aggregate purchase price of approximately $187 million, which was settled through the issuance of 11,576,883 Class B Limited Partnership units and cash. In addition, Choice Properties acquired a property from a third party for approximately $2 million, which was settled in cash.
(1) Results are for the period ended December 31, 2013, consistent with Choice Properties’ fiscal calendar. Adjustments to December 28, 2013 are included in Consolidation and Eliminations.
(2) See Non-GAAP Financial Measures on page 40.

Management’s Discussion and Analysis
28 2013 Annual Report - Financial Review
12. Disclosure Controls and Procedures
Management is responsible for establishing and maintaining a system of disclosure controls and procedures to provide reasonable assurance that all material information relating to the Company and its subsidiaries is gathered and reported to senior management on a timely basis so that appropriate decisions can be made regarding public disclosure.
As required by National Instrument 52-109 (Certification of Disclosure in Issuers’ Annual and Interim Filings), the Executive Chairman, as Chief Executive Officer, and the Chief Financial Officer have caused the effectiveness of the disclosure controls and procedures to be evaluated. Based on that evaluation, they have concluded that the design and operation of the system of disclosure controls and procedures were effective as at December 28, 2013.
13. Internal Control over Financial Reporting
Management is also responsible for establishing and maintaining adequate internal controls over financial reporting to provide reasonable assurance regarding the reliability of financial reporting and the preparation of financial reports for external purposes in accordance with IFRS.
As required by National Instrument 52-109 (Certification of Disclosure in Issuers’ Annual and Interim Filings), the Executive Chairman, as Chief Executive Officer, and the Chief Financial Officer have caused the effectiveness of the internal controls over financial reporting to be evaluated using the framework established in ‘Internal Control - Integrated Framework (COSO Framework)’ published by The Committee of Sponsoring Organizations of the Treadway Commission (COSO), 1992. Based on that evaluation, they have concluded that the design and operation of the Company’s internal controls over financial reporting were effective as at December 28, 2013.
In designing such controls, it should be recognized that due to inherent limitations, any controls, no matter how well designed and operated, can provide only reasonable assurance of achieving the desired control objectives and may not prevent or detect misstatements. Projections of any evaluations of effectiveness to future periods are subject to the risk that controls may become inadequate because of changes in conditions, or that the degree of compliance with the policies or procedures may deteriorate.
Additionally, management is required to use judgment in evaluating controls and procedures.
Changes in Internal Control over Financial Reporting Management has also evaluated whether there were changes in the Company’s internal controls over financial reporting during the period beginning on October 6, 2013 and ending on December 28, 2013, that materially affected, or are reasonably likely to materially affect, the Company’s internal control over financial reporting. Management determined that no material changes occurred during this period.
14. Enterprise Risks and Risk Management
The Company is committed to establishing a framework that ensures risk management is an integral part of its activities. To ensure the continued growth and success of the Company, risks are identified and managed through an Enterprise Risk Management (“ERM”) program. The Board has approved an ERM policy and oversees the ERM program through approval of the Company’s risks and risk prioritization. The ERM program assists all areas of the business in managing appropriate levels of risk tolerance by bringing a systematic approach, methodology and tools for evaluating, measuring and monitoring key risks. The results of the ERM program and other business planning processes are used to identify emerging risks to the Company, prioritize risk management activities and develop a risk-based internal audit plan.
Risks are not eliminated through the ERM program. Risks are identified and managed within understood risk tolerances. The ERM program is designed to:• promote a culture of awareness of risk management and compliance within the Company;• facilitate corporate governance by providing a consolidated view of risks across the Company and insight into the methodologies for
identification, assessment, measurement and monitoring of the risks;• assist in developing consistent risk management methodologies and tools across the organization; and• enable the Company to focus on its key risks in the business planning process and reduce harm to financial performance through
responsible risk management.
2013 Annual Report - Financial Review 29
Risk identification and assessments are important elements of the Company’s ERM framework. An annual ERM assessment is completed to assist in the update and identification of internal and external risks, which are both strategic and operational in nature. Key risks affecting the Company are prioritized under five categories: financial, operational, regulatory, human capital and reputational risks. The annual ERM assessment is carried out through interviews, surveys and facilitated workshops with management and the Board. Risks are assessed and evaluated based on the Company’s vulnerability to the risk and the potential impact that the underlying risks would have on the Company’s ability to execute its strategies and achieve its objectives. Risk owners are assigned relevant risks and key risk indicators are developed. Management provides a semi-annual update to a Committee of the Board on the status of the key risks based on significant changes from the prior update, anticipated impacts in future quarters and significant changes in key risk indicators. In addition, the long term risk level is assessed to monitor potential long term risk impacts, which may assist in risk mitigation planning activities. Accountability for oversight of the management of each risk is allocated by the Board either to the full Board or to a Committee of the Board.
The operating, financial, regulatory, human capital and reputational risks and risk management strategies are discussed below. Any of these risks has the potential to negatively affect the Company and its financial performance. The Company has risk management strategies, including insurance programs. However, there can be no assurance that the associated risks will be mitigated or will not materialize or that events or circumstances will not occur that could negatively affect the Company’s financial condition or performance.
14.1 Operating Risks and Risk Management
The following is a summary of the Company’s operating risks which are discussed in detail below:
Acquisition of Shoppers Drug Mart Corporation MerchandisingSystems Implementations Vendor Management and Third Party Service ProvidersChange Management Colleague Retention and Succession PlanningInformation Integrity and Reliability Distribution and Supply ChainAvailability, Access and Security of Information Technology Disaster Recovery and Business ContinuityFood Safety and Public Health Privacy and Information SecurityLabour Relations Franchisee Independence and RelationshipsCompetitive Environment EnvironmentalEconomic Environment Trademark and Brand ProtectionRegulatory and Tax Defined Benefit Pension Plan ContributionsInventory Management and Valuation Multi-Employer Pension Plans
Discussion of Operating Risks and Risk Management Strategies
Acquisition of Shoppers Drug Mart Corporation On July 14, 2013, the Company entered into an arrangement agreement to acquire all of the outstanding common shares of Shoppers Drug Mart for consideration of up to approximately $6.7 billion of cash and the issuance of up to approximately 119.9 million common shares. The transaction is subject to various regulatory approvals, including approvals under the Competition Act (Canada) and by the TSX, and the fulfillment of certain other closing conditions customary in transactions of this nature. The Company anticipates that the transaction will be completed during the first quarter of 2014.
The process of review under the Competition Act (Canada) is proceeding as expected. There is no certainty as to the outcome of the review on the Company and whether such outcome could affect properties held by either Choice Properties or by Loblaw. At this time, the Company has no reason to believe that any such outcome would be material to the Company.
The successful execution and implementation of the acquisition will require significant effort on the part of management of the Company. Failure to properly execute and implement this transaction or realize the anticipated strategic benefits or operational, competitive and cost synergies could adversely affect the reputation, operations and financial performance of the Company.
Information on risks and uncertainties related to Shoppers Drug Mart are disclosed in the Information Statement filed by the Company on August 20, 2013.

Management’s Discussion and Analysis
30 2013 Annual Report - Financial Review
Systems Implementations The Company continues to undertake a major upgrade of its IT infrastructure. Completing the IT systems deployment will require continued focus and investment. Failure to properly execute and implement these systems, including failure to successfully migrate from legacy systems to the new IT systems or minimize disruption to the Company’s current systems during the implementation of the new systems could result in a lack of accurate data to enable management to effectively manage day-to-day operations of the business causing significant disruptions to the business and potential financial losses. Failure to continue to implement appropriate processes to support the new systems could result in inefficiencies and duplication in processes, which could adversely affect the reputation, operations and financial performance of the Company.
Change Management Significant initiatives within the Company, including the execution of the IT infrastructure plan, and planning for the acquisition of Shoppers Drug Mart, are underway. Ineffective change management could result in disruptions to the operations of the business or negatively affect the ability of the Company to implement and achieve its long term strategic objectives. Failure to properly integrate several large, complex initiatives in a timely manner will adversely impact the operations of the Company. If colleagues are not able to develop and perform new roles, processes and disciplines, the Company may not achieve the expected cost savings and other benefits of its initiatives. Failure to properly execute the various processes will increase the risk of customer dissatisfaction, which in turn could negatively affect the reputation, operations and financial performance of the Company.
Information Integrity and Reliability Management depends on relevant and reliable information for decision making purposes, including key performance indicators and financial reporting. A lack of relevant and reliable information that enables management to effectively manage the business could preclude the Company from optimizing its overall performance. Any significant loss of data or failure to maintain reliable data could negatively affect the reputation, operations and financial performance of the Company.
Availability, Access and Security of Information Technology The Company is reliant on the continuous and uninterrupted operations of its IT systems. Point of sale availability, 24/7 user access and security of all IT systems are critical elements to the operations of the Company. Any IT failure pertaining to availability, access or system security could result in disruption for the customer and could negatively affect the reputation, operations and financial performance of the Company.
Food Safety and Public Health The Company is subject to risks associated with food safety and general merchandise product defects, including the Company’s control brand products. The Company could be adversely affected in the event of a significant outbreak of food-borne illness or other public health concerns related to food or general merchandise products. The occurrence of such events or incidents could result in harm to customers, negative publicity or damage to the Company’s brands and could lead to unforeseen liabilities from legal claims or otherwise. Failure to trace or locate any contaminated or defective products could affect the Company’s ability to be effective in a recall situation. Any of these events, as well as the failure to maintain the cleanliness and health standards at store level, could negatively affect the reputation, operations and financial performance of the Company.
Labour Relations A majority of the Company’s store level and distribution centre workforce is unionized. There can be no assurance as to the outcome of labour negotiations or the timing of their completion. Failure to renegotiate collective agreements could result in work stoppages or slowdowns, and if they occur, they could negatively affect the reputation, operations and financial performance of the Company.
Competitive Environment The retail industry in Canada is highly competitive. If the Company is ineffective in responding to consumer trends or in executing its strategic plans its financial performance could be negatively affected.
The Company’s competitors include traditional supermarket operators, as well as mass merchandisers, warehouse clubs, drugstores, limited assortment stores, discount stores, convenience stores and specialty stores. Many of these competitors now offer a selection of food, drugstore and general merchandise. Others remain focused on supermarket-type merchandise. The Company is subject to competitive pressures from new entrants into the marketplace and from the expansion or renovation of existing competitors, particularly those expanding into the grocery market. The Company’s inability to effectively predict market activity or compete effectively with its current or future competitors could result in, among other things, reduced market share and lower pricing in response to its competitors’ pricing activities. Failure by the Company to sustain its competitive position could negatively affect the financial performance of the Company.
Economic Environment Economic factors that impact consumer spending patterns could deteriorate or remain unpredictable due to global, national or regional economic volatility. These factors could negatively affect the Company’s revenue and margins. Inflationary trends are unpredictable and changes in the rate of inflation or deflation will affect consumer prices, which in turn could negatively affect the financial performance of the Company.

2013 Annual Report - Financial Review 31
Regulatory and Tax Changes to any of the laws, rules, regulations or policies (collectively, “laws”) applicable to the Company’s business, including income, capital, commodity, property and other taxes, and laws affecting the production, processing, preparation, distribution, packaging and labelling of products, could have an adverse impact on the financial or operational performance of the Company. In the course of complying with such changes, the Company could incur significant costs. Changing laws or interpretations of such laws or enhanced enforcement of existing laws could restrict the Company’s operations or profitability and thereby threaten the Company’s competitive position and ability to efficiently conduct business. Failure by the Company to comply with applicable laws and orders in a timely manner could subject the Company to civil or regulatory actions or proceedings, including fines, assessments, injunctions, recalls or seizures, which in turn could negatively affect the reputation, operations and financial performance of the Company.
The Company is subject to tax audits from various government and regulatory agencies on an ongoing basis. As a result, from time to time, taxing authorities may disagree with the positions and conclusions taken by the Company in its tax filings or legislation could be amended or interpretations of current legislation could change, any of which events could lead to reassessments. These reassessments could have a material impact on the Company in future periods. In 2012, the Company received indication from the CRA that the CRA intends to proceed with a reassessment of the tax treatment of the Company’s wholly owned subsidiary, Glenhuron. At this stage, no reassessment has yet been received, and accordingly, it is not possible to quantify the amount of any potential reassessment. While the Company does not expect the ultimate outcome to be material, such matters cannot be predicted with certainty and could result in a material charge for the Company in future periods.
In 2013, all provinces and territories reduced the reimbursement rates for pharmacies on six common generic prescription drugs and certain other provinces implemented further generic prescription drug reimbursement rate reductions. In addition, Ontario eliminated all professional allowances paid by drug manufacturers to pharmacies. These actions, and any potential further announcements, impact pharmacy sales and therefore could have an adverse effect on the financial performance of the Company. The acquisition of Shoppers Drug Mart will increase the Company’s exposure to this risk.
PC Bank operates in a highly regulated environment and a failure by it to comply, understand, acknowledge and effectively respond to applicable regulators could result in monetary penalties, regulatory intervention and reputational damage.
Choice Properties is currently classified as a “unit trust” and a “mutual fund trust” under the Income Tax Act. It also qualifies for the Real Estate Investment Trust (“REIT”) Exception under the Income Tax Act and as such is not subject to specified investment flow-through rules (“SIFT Rules”). Should Choice Properties cease to qualify for these classifications and exceptions, the taxation of Choice Properties and unitholders, including Loblaw, could be materially adversely different in certain respects, and therefore could have a material adverse effect on the trading price of the Units.
Inventory Management and Valuation Inappropriate inventory management could lead to excess inventory or a shortage of inventory, which may impact customer satisfaction and the overall financial performance of the Company. The Company may hold excess inventory that cannot be sold profitably or which could increase levels of inventory shrink. Failure to manage inventory properly could negatively affect the operations and financial performance of the Company.
With the upgrade of its IT infrastructure, the Company expects to complete the conversion of its corporate retail stores to a perpetual inventory management system during 2014. The Company currently does not have sufficient information to determine whether there will be any changes to its estimate of average cost of its inventory. Any such difference could be material and therefore could negatively affect both the carrying amount of the Company’s inventory and the financial results of the Company.
Merchandising The Company could have goods and services that customers do not want or need, are not reflective of current trends in customers’ tastes, habits, or regional preferences, are priced at a level customers are not willing to pay, are late in reaching the market or do not have optimal commercial product placement on store shelves. Innovation is critical if the Company is to respond to customer demands and stay competitive in the marketplace. If merchandising efforts are not effective or are unresponsive to customer demands, the operations and financial performance of the Company will be negatively affected.

Management’s Discussion and Analysis
32 2013 Annual Report - Financial Review
Vendor Management and Third Party Service Providers The Company relies on vendors, including offshore vendors in both mature and developing markets, to provide the Company with goods and services. Offshore sourcing increases certain risks to the Company, including risks associated with food safety and general merchandise product defects, non-compliance with ethical business practices and inadequate supply of products. Although contractual arrangements, sourcing guidelines, supplier audits and Corporate Social Responsibility guidelines are in place, the Company has no direct influence over how vendors are managed. Negative events affecting vendors or inefficient, ineffective or incomplete vendor management strategies, policies and/or procedures could adversely impact the Company’s reputation and impair the Company’s ability to meet customer needs or control costs and quality, which could negatively affect the reputation, operations and financial performance of the Company.
The Company also uses third party suppliers, carriers, logistic service providers and operators of warehouses and distribution facilities, including for product development, design and sourcing of the Company’s control brand apparel products. Ineffective selection, contract terms or relationship management could impact the Company’s ability to source control brand products, to have products available for customers, to market to customers or to operate efficiently and effectively. Disruption in services from third party suppliers could interrupt the delivery of merchandise to stores, thereby negatively affecting the operations and financial performance of the Company.
President’s Choice Financial banking services are provided by a major Canadian chartered bank. PC Bank uses third party service providers to process credit card transactions, operate call centres and operationalize certain risk management strategies for the President’s Choice Financial MasterCard®. PC Bank and the Company actively manage and monitor their relationships with all third party service providers and PC Bank has an outsourcing risk policy and a vendor governance team that provides regular reports on vendor governance and annual vendor risk assessments. Despite these activities, a significant disruption in the services provided by the chartered bank or by third party service providers would negatively affect the financial performance of PC Bank and the Company.
The Company relies on third parties for investment management, custody and other services for its cash equivalents, short term investments, security deposits and pension assets. Any disruption in the services provided by these suppliers could adversely affect the return on these assets or liquidity of the Company.
Colleague Retention and Succession Planning Effective succession planning for senior management and colleague retention are essential to sustaining the growth and success of the Company. In addition, loss of talent to the competition can be a significant risk to the Company’s business strategy. If the Company is not effective in establishing appropriate succession planning processes and retention strategies, it could lead to a lack of requisite knowledge, skills and experience on the part of management. This, in turn, could adversely affect the Company’s ability to execute its strategies, and could negatively affect its reputation, operations and financial performance.
Distribution and Supply Chain Failure to continue to improve the Company’s supply chain could adversely affect the Company’s capacity to effectively and efficiently attract and retain current and potential customers. Any delay or disruption in the flow of goods to stores, could negatively affect the operations and financial performance of the Company.
Disaster Recovery and Business Continuity The Company’s ability to continue critical operations and processes could be negatively impacted by adverse events resulting from various incidents, including severe weather, work stoppages, prolonged IT systems failure, power failures, border closures or a pandemic or other national or international catastrophe. Business interruptions, crises or potential disasters could negatively affect the reputation, operations and financial performance of the Company.
Privacy and Information Security The Company is subject to various laws regarding the protection of personal information of its customers, cardholders and colleagues and has adopted a Privacy Policy setting out guidelines for the handling of personal information. The Company’s IT systems contain personal information of customers, cardholders and colleagues. Any failures or vulnerabilities in these systems or non-compliance with laws or regulations, including those in relation to personal information belonging to the Company’s customers and colleagues, could negatively affect the reputation, operations and financial performance of the Company.
Franchisee Independence and Relationships A substantial portion of the Company’s revenues and earnings comes from amounts paid by franchisees. Franchisees are independent businesses and, as a result, their operations may be negatively affected by factors beyond the Company’s control, which in turn could negatively affect the Company’s reputation, operations and financial performance. Revenues and earnings could also be negatively affected, and the Company’s reputation could be harmed, if a significant number of franchisees were to experience operational failures, health and safety exposures or were unable to pay the Company for products, rent or fees. The Company’s franchise system is also subject to franchise legislation enacted by a number of provinces. Any new legislation or failure to comply with existing legislation could negatively affect operations and could add administrative costs and burdens, any of which could affect the Company’s relationship with its franchisees. The Company provides various services to the franchisees to assist with management of store operations and dedicated personnel manage the Company’s obligations to its franchisees. Despite these efforts, relationships with franchisees could pose significant risks if they are disrupted, which could negatively affect the reputation, operations and financial performance of the Company. Supply chain or system changes by the Company could cause or be perceived to cause disruptions to franchise operations and could result in negative effects on franchisee financial performance. Reputational damage or adverse consequences for the Company, including litigation and disruption to revenue from franchise stores could result.

2013 Annual Report - Financial Review 33
Environmental The Company, in conjunction with Choice Properties, maintains a large portfolio of real estate and other facilities and is subject to environmental risks associated with the contamination of such properties and facilities, whether by previous owners or occupants, neighbouring properties or by the Company itself. In particular, the Company has a number of underground storage tanks, the majority of which are used for the retailing of automotive fuel or for its supply chain transport fleets. Contamination resulting from leaks from these tanks is possible. The Company also operates refrigeration equipment in its stores and distribution centres to preserve perishable products as it passes through the supply chain and ultimately to consumers. These systems contain refrigerant gases which could be released if equipment fails or leaks. A release of these gases could have adverse effects on the environment. Failure to properly manage any of these environmental risks could negatively affect the reputation, operations and financial performance of the Company.
The Company is subject to legislation that imposes liabilities on retailers, brand owners and importers for costs associated with recycling and disposal of consumer goods packaging and printed materials distributed to consumers. There is a risk that the Company will be subject to increased costs associated with these laws. In addition, the Company could be subject to increased or unexpected costs associated with environmental incidents and the related remediation activities, including litigation and regulatory related costs, all of which could negatively affect the reputation and financial performance of the Company.
Trademark and Brand Protection A decrease in value of the Company’s trademarks, banners or control brands as a result of adverse events, including third party infringement, changes to the branding strategies or otherwise, could negatively affect the reputation, operations and financial performance of the Company.
Defined Benefit Pension Plan Contributions The Company manages the assets in its registered defined benefit pension plans by engaging professional investment managers who operate under prescribed investment policies and procedures in respect of permitted investments and asset allocations. Future contributions to the Company’s registered defined benefit pension plans are impacted by a number of variables, including the investment performance of the plans’ assets and the discount rate used to value the liabilities of the plans. The Company regularly monitors and assesses plan performance and the impact of changes in participant demographics, changes in capital markets and other economic factors that may impact funding requirements, net defined benefit costs and actuarial assumptions. If capital market returns are below assumed levels, or if discount rates decrease, the Company could be required to make contributions to its registered funded defined benefit pension plans in excess of those currently expected, which in turn could negatively affect the financial performance of the Company.
Multi-Employer Pension Plans In addition to the Company-sponsored pension plans, the Company participates in various multi-employer pension plans, providing pension benefits to union employees pursuant to provisions of collective bargaining agreements. Approximately 39% (2012 – 40%) of employees of the Company and of its independent franchisees participate in these plans. These plans are administered by independent boards of trustees generally consisting of an equal number of union and employer representatives. In some circumstances, the Company has a representative on the board of trustees of these plans. The Company’s responsibility to make contributions to these plans is limited by the amounts established pursuant to its collective agreements; however, poor performance of these plans could have an adverse impact on the Company’s employees and former employees who are members of these plans or could result in changes to the terms and conditions of participation in these plans, which in turn could negatively affect the financial performance of the Company.
The Company, together with its independent franchisees, is the largest participating employer in the Canadian Commercial Workers Industry Pension Plan (“CCWIPP”), with approximately 53,000 (2012 – 54,000) employees as members. In 2013, the Company contributed $54 million (2012 – $52 million) to CCWIPP. The CCWIPP has historically been underfunded as the actuarial accrued benefit obligations have exceeded the value of the assets held in trust. Any benefit reductions would negatively affect the retirement benefits of the Company’s employees, which in turn could negatively affect their morale and productivity and, in turn, could negatively affect the Company’s reputation.
Management’s Discussion and Analysis
34 2013 Annual Report - Financial Review
14.2 Financial Risks and Risk Management
The Company is exposed to a number of financial risks, including those associated with financial instruments, which have the potential to affect its operating and financial performance. The Company uses over-the-counter derivative instruments to offset certain of these risks. Policies and guidelines prohibit the use of any derivative instrument for trading or speculative purposes. The fair value of derivative instruments is subject to changing market conditions which could negatively impact the financial performance of the Company.
The following is a summary of the Company’s financial risks which are discussed in detail below:
Level of Indebtedness and Liquidity Risk Foreign Currency Exchange Rate RiskCapital Availability Risk Commodity Price RiskCredit Risk Choice Properties Unit PriceInterest Rate Risk
Discussion of Financial Risks and Risk Management Strategies
Level of Indebtedness and Liquidity Risk To fund the cash portion of the Shoppers Drug Mart acquisition, the Company will utilize excess cash and significantly increase its indebtedness. There can be no assurances that the Company will generate sufficient free cash flow to reduce indebtedness and maintain adequate cash reserves which could result in adverse consequences on its credit ratings and its cost of funding.
Liquidity risk is the risk that the Company cannot meet its demand for cash or fund its obligations as they come due. Liquidity risk also includes the risk of not being able to liquidate assets in a timely manner at a reasonable price. Liquidity risk is mitigated by maintaining appropriate levels of cash and cash equivalents and short term investments, actively monitoring market conditions, and by diversifying sources of funding, including the Company's Credit Facility and maintaining a well-diversified maturity profile of debt and capital obligations. Despite these mitigation strategies, if the Company, PC Bank or Choice Properties' financial performance and condition deteriorate or downgrades in the Company’s or Choice Properties' current credit ratings occur, the Company, PC Bank or Choice Properties' ability to obtain funding from external sources could be restricted.
Capital Availability Risk The real estate industry is highly capital intensive. Choice Properties requires access to capital to maintain its properties, refinance its indebtedness as well as to fund its growth strategy and certain capital expenditures from time to time. Although Choice Properties expects to have access to its credit facility, there can be no assurance that it will otherwise have sufficient capital or access to capital on acceptable terms for future property acquisitions, refinancing indebtedness, financing or refinancing properties, funding operating expenses or for other purposes. Further, in certain circumstances, Choice Properties may not be able to borrow funds due to certain limitations. Failure by Choice Properties to access required capital could have a material adverse effect on the Company's ability to pay its financial or other obligations. An inability to access capital could also impact Choice Properties' ability to make distributions which could have an adverse material effect on the trading price of Units.
Credit Risk The Company is exposed to credit risk resulting from the possibility that counterparties could default on their financial obligations to the Company. Exposure to credit risk relates to derivative instruments, cash and cash equivalents, short term investments, security deposits, PC Bank’s credit card receivables, franchise loans receivable, accounts receivable from franchisees and other receivables from vendors, associated stores and independent accounts and pension assets held in the Company’s defined benefit plans.
The risk related to derivative instruments, cash and cash equivalents, short term investments or security deposits is reduced by policies and guidelines that require that the Company enter into transactions only with counterparties or issuers that have a minimum long term “A-” credit rating from a recognized credit rating agency and place minimum and maximum limits for exposures to specific counterparties and instruments.
Choice Properties mitigates the risk of credit loss relating to rent receivables by evaluating the creditworthiness of new tenants, obtaining security deposits wherever permitted by legislation, ensuring its tenant mix is diversified and by limiting its exposure to any one tenant except Loblaw. Choice Properties establishes an allowance for doubtful accounts that represents the estimated losses with respect to rents receivable. The allowance is determined on a tenant-by-tenant basis based on the specific factors related to the tenant.
PC Bank manages its credit card receivable risk by employing stringent credit scoring techniques and actively monitoring the credit card portfolio, and reviewing techniques and technology that can improve the effectiveness of the collection process. In addition, these receivables are dispersed among a large, diversified group of credit card customers.
Franchise loans receivable, accounts receivable from franchisees and other receivables from vendors, associated stores and independent accounts are actively monitored on an ongoing basis and settled on a frequent basis in accordance with the terms specified in the applicable agreements.

2013 Annual Report - Financial Review 35
Interest Rate Risk The Company is exposed to interest rate risk from fluctuations in interest rates on its floating rate debt and financial instruments, net of cash and cash equivalents, short term investments and security deposits. The Company manages interest rate risk by monitoring its respective mix of fixed and floating rate debt net of cash and cash equivalents, short term investments and security deposits, and by taking action as necessary to maintain an appropriate balance considering current market conditions.
Foreign Currency Exchange Rate Risk The Company is exposed to foreign currency exchange rate variability, primarily on its USD denominated based purchases in trade payables and other liabilities. An appreciating Canadian dollar relative to the USD will positively impact year-over-year changes in reported operating income and net earnings, while a depreciating Canadian dollar relative to the USD will have the opposite impact.
Commodity Price Risk The Company is exposed to increases in the prices of commodities in operating its stores and distribution networks, as well as to the indirect link of commodities to consumer products and prices. To manage a portion of this exposure, the Company uses purchase commitments for a portion of its needs for certain consumer products that are commodities based. The Company enters into exchange traded futures contracts and forward contracts to minimize cost volatility relating to energy. Despite these mitigation strategies, rising commodity prices could negatively affect the Company’s financial performance.
Choice Properties Unit Price The Company is exposed to market price risk as a result of Units that are held by unitholders other than the Company. These Units are presented as a liability on the Company's consolidated balance sheets as they are redeemable for cash at the option of the holder. The liability is recorded at fair value at each reporting period based on the market price of Units. The change in the fair value of the liability negatively impacts net earnings when the Unit price increases and positively impacts net earnings when the Unit price declines.
15. Related Party Transactions
The Company’s parent corporation is Weston, which owns, directly and indirectly, 177,299,889 of the Company’s common shares, representing approximately 63% of the Company’s outstanding common shares. Mr. W. Galen Weston controls Weston, directly and indirectly through private companies which he controls, including Wittington who owns a total of 80,724,599 of Weston’s common shares, representing approximately 63% of Weston’s outstanding common shares. Mr. Weston also beneficially owns 3,753,789 of the Company’s common shares, representing approximately 1% (December 29, 2012 – 1%) of the Company’s outstanding common shares. The Company’s policy is to conduct all transactions and settle all balances with related parties on market terms and conditions.
Transactions with Related Parties
Transaction Value
(millions of Canadian dollars) 2013 2012Cost of Merchandise Inventory Sold
Inventory purchases from a subsidiary of Weston $ 601 $ 627Inventory purchases from a related party(i) 22 18
Operating IncomeCost sharing agreements with Parent(ii) $ 9 $ 12Net administrative services provided by Parent(iii) 13 17Choice Properties distributions to Parent(iv) 6 —Lease of office space from a subsidiary of Wittington 3 3
(i) Associated British Foods plc is a related party by virtue of Mr. W. Galen Weston being a director of such entity’s parent company. Total balance outstanding owing to Associated British Foods plc as at December 28, 2013 was $4 million (December 29, 2012 – $2 million).
(ii) Weston and the Company have each entered into certain contracts with third parties for administrative and corporate services, including telecommunication services and IT related matters on behalf of itself and the related party. Through cost sharing agreements that have been established between the Company and Weston concerning these costs, the Company has agreed to be responsible to Weston for the Company’s proportionate share of the total costs incurred.
(iii) The Company and Weston have entered into an agreement whereby certain administrative services are provided by one party to the other. The services to be provided under this agreement include those related to commodity management, pension and benefits, tax, medical, travel, information system, risk management, treasury and legal. Payments are made quarterly based on the actual costs of providing these services. Where services are provided on a joint basis for the benefit of the Company and Weston together, each party pays the appropriate proportion of the costs. Fees paid under this agreement are reviewed each year by the Audit Committee.
(iv) Concurrent with the Choice Properties IPO, Weston purchased 20,000,000 Units from Choice Properties at $10.00 per Unit for a total subscription price of $200 million. Choice Properties issued an additional 107,810 Units to Weston under a distribution reinvestment plan (“DRIP”) at a price of $10.05 per Unit. In 2013, Choice Properties recorded $6 million in distributions to Weston relating to Units, which have been classified as interest expense in the Consolidated Statement of Earnings.

Management’s Discussion and Analysis
36 2013 Annual Report - Financial Review
Concurrent with the Choice Properties IPO, Weston purchased 20,000,000 Units from Choice Properties at $10.00 per Unit for a total subscription price of $200 million. Choice Properties issued an additional 107,810 Units to Weston under a DRIP at a price of $10.05 per Unit. In 2013, Choice Properties recorded $6 million in distributions to Weston relating to Units, which have been classified as interest expense in the Consolidated Statement of Earnings.
The net balances due to parent are comprised as follows:
As at As At(millions of Canadian dollars) December 28, 2013 December 29, 2012Balance Sheet:Trade payables and other liabilities $ 27 $ 25
Post-Employment Benefit Plans The Company sponsors a number of post-employment plans, which are related parties. Contributions made by the Company to these plans are disclosed in Section 8.1 Cash Flows.
Income Tax Matters From time to time, the Company, Weston and its affiliates may enter into agreements to make elections that are permitted or required under applicable income tax legislation with respect to affiliated corporations. In 2013, these elections and accompanying agreements did not have a material impact on the Company.
Key Management Personnel The Company’s key management personnel are comprised of the Board and certain members of the executive team of the Company, as well as both the Board and certain members of the executive team of Weston and Wittington to the extent that they have the authority and responsibility for planning, directing and controlling the day-to-day activities of the Company.
Compensation of Key Management Personnel Annual compensation of key management personnel that is directly attributable to the Company was as follows:
(millions of Canadian dollars) 2013 2012Salaries, director fees and other short term employee benefits $ 8 $ 7Share-based compensation 6 4Total compensation $ 14 $ 11
16. Critical Accounting Estimates and Judgments
The preparation of the consolidated financial statements requires management to make estimates and judgments in applying the Company’s accounting policies that affect the reported amounts and disclosures made in the consolidated financial statements and accompanying notes.
Within the context of this MD&A, a judgment is a decision made by management in respect of the application of an accounting policy, a recognized or unrecognized financial statement amount and/or note disclosure, following an analysis of relevant information that may include estimates and assumptions. Estimates and assumptions are used mainly in determining the measurement of balances recognized or disclosed in the consolidated financial statements and are based on a set of underlying data that may include management’s historical experience, knowledge of current events and conditions and other factors that are believed to be reasonable under the circumstances. Management continually evaluates the estimates and judgments it uses.
The following are the accounting policies subject to judgments and key sources of estimation uncertainty that the Company believes could have the most significant impact on the amounts recognized in the consolidated financial statements.
16.1 Inventories
Key Sources of Estimation Inventories are carried at the lower of cost and net realizable value, which requires the Company to utilize estimates related to fluctuations in future retail prices, seasonality and costs necessary to sell the inventory.

2013 Annual Report - Financial Review 37
16.2 Impairment of Non-Financial Assets (Goodwill, Intangible Assets, Fixed Assets and Investment Properties)
Judgments Made in Relation to Accounting Policies Applied Management is required to use judgment in determining the grouping of assets to identify their cash generating units (“CGUs”) for the purposes of testing fixed assets for impairment. Judgment is further required to determine appropriate groupings of CGUs, for the level at which goodwill and intangible assets are tested for impairment. The Company has determined that each retail location and each investment property is a separate CGU for purposes of fixed asset impairment testing. For the purpose of goodwill and intangible impairment testing, CGUs are grouped at the lowest level at which goodwill and intangibles are monitored for internal management purposes. In addition, judgment is used to determine whether a triggering event has occurred requiring an impairment test to be completed.
Key Sources of Estimation In determining the recoverable amount of a CGU or a group of CGUs, various estimates are employed. The Company determines fair value less costs to sell using such estimates as market rental rates for comparable properties, recoverable operating costs for leases with tenants, non-recoverable operating costs, discount rates, capitalization rates and terminal capitalization rates. The Company determines value in use by using estimates including projected future revenues, earnings and capital investment consistent with strategic plans presented to the Board. Discount rates are consistent with external industry information reflecting the risk associated with the specific cash flows.
16.3 Franchise Loans Receivable and Certain Other Financial Assets
Judgments Made in Relation to Accounting Policies Applied Management reviews franchise loans receivable, trade receivables and certain other assets relating to their franchise business at each balance sheet date utilizing judgment to determine whether a triggering event has occurred requiring an impairment test to be completed.
Key Sources of Estimation Management determines the initial fair value of its franchise loans and certain other financial assets using discounted cash flow models corroborated by other valuation techniques. The process of determining these fair values requires management to make estimates of a long term nature regarding discount rates, projected revenues, and margins, as applicable, derived from past experience, actual operating results, budgets and the Company’s five year forecast.
16.4 Income and Other Taxes
Judgments Made in Relation to Accounting Policies Applied The calculation of current and deferred income taxes requires management to make certain judgments regarding the tax rules in jurisdictions where the Company performs activities. Application of judgments is required regarding classification of transactions and in assessing probable outcomes of claimed deductions including expectations about future operating results, the timing and reversal of temporary differences and possible audits of income tax and other tax filings by the tax authorities.
16.5 Allowance for Credit Card Receivables
Key Sources of Estimation The allowance for credit card receivables is measured based upon statistical analysis that includes estimates for past and current performance, aging, arrears status, the level of allowance already in place, and management’s interpretation of economic conditions and other trends specific to our customer base, including but not limited to bankruptcies. Changes in circumstances may cause future assessments of credit risk to be materially different from current assessments, which could require an increase or decrease in the allowance for credit receivables.
17. Accounting Standards
17.1 Accounting Standards Implemented in 2013
Fair Value Measurement In 2011, the International Accounting Standards Board (“IASB”) issued IFRS 13, “Fair Value Measurement” (“IFRS 13”), which establishes a single framework for the fair value measurement and disclosure of financial and non-financial assets and liabilities. The new standard unifies the definition of fair value and also introduces new concepts including ‘highest and best use’ and ‘principal markets’ for non-financial assets and liabilities. There are additional disclosure requirements, including increased fair value disclosure for financial instruments for interim and annual financial statements. The Company implemented this standard prospectively in the first quarter of 2013. There were no significant measurement impacts on the Company's consolidated financial statements as a result of the adoption of IFRS 13. The Company has included the additional disclosures required by the standard in the notes to the consolidated financial statements for the year ended 2013.

Management’s Discussion and Analysis
38 2013 Annual Report - Financial Review
Employee Benefits In 2011, the IASB revised International Accounting Standard (“IAS”) 19, “Employee Benefits” (“IAS 19”). The most significant amendments for the Company and its significant accounting policies are the requirement to immediately recognize all unvested past service costs and the replacement of interest cost and expected return on plan assets with a net interest amount that is calculated by applying a prescribed discount rate to the net defined benefit obligation (asset). Under the amendment, the Company continues to recognize actuarial gains and losses on plan assets and obligations through other comprehensive income, but has chosen to reclassify these amounts from accumulated other comprehensive income and record these actuarial gains and losses in retained earnings, consistent with its previous presentation. The Company implemented this standard retrospectively in the first quarter of 2013. The impact arising from the adoption of the amendments to IAS 19 is summarized as follows:
Consolidated Statements of Earnings and Comprehensive IncomeIncrease (Decrease) December 28, 2013 December 29, 2012(millions of Canadian dollars except where otherwise indicated) (52 weeks) (52 weeks)Selling, General and Administrative Expenses $ (20) $ 1Operating Income $ 20 $ (1)Net interest expense and other financing charges 27 20Earnings Before Income Taxes $ (7) $ (21)Income taxes (2) (5)Net Earnings $ (5) $ (16)Other comprehensive income, net of taxes 20 15Total Comprehensive Income $ 15 $ (1)Net Earnings per Common Share ($)
Basic $ (0.02) $ (0.06)Diluted $ (0.02) $ (0.05)
Consolidated Balance SheetsIncrease (Decrease) As at As at As at(millions of Canadian dollars) December 28, 2013 December 29, 2012 January 1, 2012Total liabilities $ (17) $ (2) $ (3)Shareholders’ equity 17 2 3
The amendments also require enhanced annual disclosures for defined benefit plans, including additional information on the characteristics and risks of those plans.
Other Standards In addition to the above standards, the Company implemented the following standards and amendments effective January 1, 2013: IFRS 10, “Consolidated Financial Statements”, IFRS 11, “Joint Arrangements”, IFRS 12 “Disclosure of Interests in Other Entities”, IAS 28, “Investments in Associates” and IAS 1, “Presentation of Financial Statements”. There was no significant impact on the Company’s consolidated financial statements as a result of the implementation of these standards.
In 2013, the IASB issued amendments to IAS 36 “Impairment of Assets” which clarify the disclosure requirements for recoverable amounts of CGUs. These amendments are required to be applied for periods beginning on or after January 1, 2014. The Company has elected to early adopt these amendments during 2013. There was no significant impact on the Company’s consolidated financial statements as a result of these amendments.

2013 Annual Report - Financial Review 39
17.2 Future Accounting Standards
Financial Instruments In 2011, the IASB issued amendments to IFRS 7, “Financial Instruments: Disclosures” and IAS 32, “Financial Instruments: Presentation”. These amendments are required to be applied for periods beginning on or after January 1, 2014. The Company does not expect any significant impacts on its consolidated financial statements as a result of these amendments.
In 2013, the IASB issued amendments to, IFRS 9, “Financial Instruments” (“IFRS 9”), issued in 2010, which will ultimately replace IAS 39, “Financial Instruments: Recognition and Measurement” (“IAS 39”). The replacement of IAS 39 is a three-phase project with the objective of improving and simplifying the reporting for financial instruments. The current issuance of IFRS 9 includes the first and third phases of the project, which provide guidance on the classification and measurement of financial assets and financial liabilities and hedge accounting. The mandatory effective date of the standard has not been determined due to the incomplete status of the second phase of the project, impairment. The effective date of the entire standard will be determined closer to the completion of the remaining phase. The Company continues to assess the impact of the new standard on its consolidated financial statements.
Levies In 2013, the International Financial Reporting Interpretations Committee issued IFRIC 21, “Levies” (“IFRIC 21”). IFRIC 21 addresses accounting for a liability to pay a levy within the scope of IAS 37, “Provisions, contingent liabilities and contingent assets”. A levy is an outflow of resources embodying economic benefits that is imposed by governments on entities in accordance with legislation, other than income taxes within the scope of IAS 12, “Income Taxes” and fines or other penalties imposed for breaches of the legislation. This interpretation becomes effective for annual periods beginning on or after January 1, 2014, and is to be applied retrospectively. The Company is currently assessing the impact of the new interpretation on its consolidated financial statements.
18. Outlook(1)
In a highly competitive market, Loblaw’s strategy of focusing on its customer proposition and generating targeted efficiencies resulted in positive revenue and adjusted operating income growth in fiscal 2013.
The Company will continue to focus on investing in its customer proposition in 2014 in its retail business - value, assortment and service - while focusing on balancing these investments with incremental efficiencies. In the first half of 2014, the environment is expected to remain extremely competitive driven by continued greater than historical square footage expansion, which is expected to moderate in the second half of the year.
(1) See Forward-Looking Statements on page 2.

Management’s Discussion and Analysis
40 2013 Annual Report - Financial Review
19. Non-GAAP Financial Measures
The Company uses the following non-GAAP financial measures: adjusted operating income, adjusted operating margin, adjusted EBITDA, adjusted EBITDA margin, adjusted net earnings, adjusted basic net earnings per common share, interest and interest coverage, free cash flow, net assets, return on average net assets, adjusted debt and adjusted debt to adjusted EBITDA and with respect to Choice Properties, net operating income, funds from operations, adjusted funds from operations, adjusted funds from operations per unit diluted and adjusted funds from operations payout ratio. The Company believes these non-GAAP financial measures provide useful information to both management and investors in measuring the financial performance and financial condition of the Company for the reasons outlined below.
Management uses these and other non-GAAP financial measures to exclude the impact of certain expenses and income that must be recognized under GAAP when analyzing consolidated and segment underlying operating performance, as the excluded items are not necessarily reflective of the Company’s underlying operating performance and make comparisons of underlying financial performance between periods difficult. From time to time, the Company may exclude additional items if it believes doing so would result in a more effective analysis of underlying operating performance. The exclusion of certain items does not imply that they are non-recurring.
These measures do not have a standardized meaning prescribed by GAAP and therefore they may not be comparable to similarly titled measures presented by other publicly traded companies and should not be construed as an alternative to other financial measures determined in accordance with GAAP.
Adjusted Operating Income, Adjusted Operating Margin, Adjusted EBITDA and Adjusted EBITDA Margin The following table reconciles adjusted operating income and adjusted earnings before income taxes, net interest expense and other financing charges and depreciation and amortization (“adjusted EBITDA”) to operating income, which is reconciled to GAAP net earnings measures reported in the consolidated statements of earnings for the 12 and 52 week periods ended December 28, 2013 and December 29, 2012. The Company believes that adjusted operating income is useful in assessing the Company's underlying operating performance and in making decisions regarding the ongoing operations of the business. The Company believes that adjusted EBITDA is also useful in assessing the performance of its ongoing operations and its ability to generate cash flows to fund its cash requirements, including the Company’s capital investment program.
Adjusted operating margin is calculated as adjusted operating income divided by revenue. Adjusted EBITDA margin is calculated as adjusted EBITDA divided by revenue.
2013(12 weeks)
2012(1)
(12 weeks)
(millions of Canadian dollars) (unaudited) RetailFinancialServices
Choice Properties(2)
Consolidationand
Eliminations Consolidated RetailFinancialServices
ChoiceProperties
Consolidationand
Eliminations Consolidated
Net earnings $ 127 $ 139
Add impact of the following:Net interest expense and other
financing charges 141 84Income taxes 46 38
Operating income $ 270 $ 43 $ 186 $ (185) $ 314 $ 227 $ 34 $ — $ — $ 261Add (deduct) impact of the following:
Equity-based compensation, net ofequity forwards 8 — — — 8 2 — — — 2
Fixed asset and other relatedimpairments, net of recoveries (42) — — — (42) 12 — — — 12
Restructuring costs 32 — — — 32 61 — — — 61Choice Properties general and
administrative costs (2) — 5 — 3 — — — — —Shoppers Drug Mart related costs 7 — — — 7 — — — — —
Gain on disposal of assets — — — — — (11) — — — (11)Adjusted operating income $ 273 $ 43 $ 191 $ (185) $ 322 $ 291 $ 34 $ — $ — $ 325Depreciation and amortization 191 2 — 3 196 185 2 — — 187Adjusted EBITDA $ 464 $ 45 $ 191 $ (182) $ 518 $ 476 $ 36 $ — $ — $ 512
(1) Certain 2012 figures have been restated due to the implementation of revised IAS 19, “Employee Benefits”. See the “Accounting Standards Implemented in 2013” section on page 37.
(2) Results are for the period ended December 31, 2013, consistent with Choice Properties’ fiscal calendar. Adjustments to December 28, 2013 are included in Consolidation and Eliminations.

2013 Annual Report - Financial Review 41
2013(52 weeks)
2012(1)
(52. weeks)
(millions of Canadian dollars) RetailFinancialServices
Choice Properties(2)
Consolidationand
Eliminations Consolidated RetailFinancialServices
ChoiceProperties
Consolidationand
Eliminations Consolidated
Net earnings $ 630 $ 634
Add impact of the following:Net interest expense and other
financing charges 468 351
Income taxes 228 210
Operating income $1,185 $ 142 $ 370 $ (371) $ 1,326 $1,100 $ 95 $ — $ — $ 1,195
Add (deduct) impact of the following:Equity-based compensation, net of
equity forwards 32 — — — 32 28 — — — 28Fixed asset and other related
impairments, net of recoveries (32) — — — (32) 19 — — — 19
Restructuring costs 35 — — — 35 61 — — — 61Choice Properties general and
administrative costs (3) — 9 — 6 — — — — —
Choice Properties start-up costs — — 3 — 3 — — — — —
Shoppers Drug Mart related costs 6 — — — 6 — — — — —
Gain on disposal of assets — — — — — (11) — — — (11)
Defined benefit plan amendments (51) — — — (51) — — — — —
Adjusted operating income $1,172 $ 142 $ 382 $ (371) $ 1,325 $1,197 $ 95 $ — $ — $ 1,292
Depreciation and amortization 809 9 — 6 824 767 10 — — 777
Adjusted EBITDA $1,981 $ 151 $ 382 $ (365) $ 2,149 $1,964 $ 105 $ — $ — $ 2,069
Equity-based compensation, net of equity forwards Until the first quarter of 2013, Glenhuron held equity forwards to partially hedge the impact of increases in the value of Loblaw common shares on equity-based compensation costs. The amount of net equity-based compensation costs recorded in operating income has historically been mainly dependent upon changes in the value of Loblaw common shares and the number and vesting of RSUs and PSUs relative to the number of common shares underlying the equity forwards. During 2013, Glenhuron settled its remaining equity forward contracts and the RSU and PSU plans were amended to require settlement in common shares rather than in cash. As a result of the settlements and plan amendments, the components of equity-based compensation and their exposure to changes in the value of Loblaw common shares have changed. In order to assess operating performance on a consistent basis, management excludes the impact of equity-based compensation from operating income. In the fourth quarter of 2013 and year-to-date, a charge of $8 million (2012 – $2 million) and $32 million (2012 – $28 million), respectively, were recorded related to equity-based compensation net of equity forwards.
Fixed asset and other related impairments, net of recoveries At each balance sheet date, the Company assesses and, when required, records impairments and recoveries of previous impairments related to the carrying value of its fixed assets, investment properties and intangible assets. In the fourth quarter of 2013, the Company recorded net recoveries of $42 million (2012 – charge of $12 million) and year-to-date recorded net recoveries of $32 million (2012 – charge of $19 million).
Restructuring costs In the fourth quarter of 2013 and year-to-date, $32 million (2012 – $61 million) and $35 million (2012 – $61 million), respectively, of restructuring costs were recorded in operating income.
Choice Properties general and administrative costs In the fourth quarter of 2013, the Company recorded $3 million and year-to-date $6 million of incremental general and administrative costs relating to Choice Properties in operating income.
Choice Properties start-up costs In connection with the IPO of Choice Properties, the Company incurred certain costs to facilitate the start-up of the new entity. Year-to-date the Company recorded $3 million of Choice Properties start-up costs in operating income.
(1) Certain 2012 figures have been restated due to the implementation of revised IAS 19, “Employee Benefits”. See the “Accounting Standards Implemented in 2013” section on page 37.
(2) Results are for the period ended December 31, 2013, consistent with Choice Properties’ fiscal calendar. Adjustments to December 28, 2013 are included in Consolidation and Eliminations.

Management’s Discussion and Analysis
42 2013 Annual Report - Financial Review
Shoppers Drug Mart related costs In connection with the agreement to acquire all of the outstanding common shares of Shoppers Drug Mart, in the fourth quarter of 2013 the Company incurred $7 million and year-to-date $16 million of acquisition costs, which were recorded in operating income. In addition, in connection with the issuance of $1.6 billion of unsecured notes in 2013, the Company hedged its exposure to interest rates in the period prior to the issuance. As the hedge did not qualify for hedge accounting, the resulting gain on settlement of $10 million year-to-date was recorded in operating income.
Defined benefit plan amendments During 2013, the Company announced amendments to certain of its defined benefit plans impacting certain employees retiring after January 1, 2015. As a result, year-to-date the Company recorded a gain of $51 million in 2013.
Gain on disposal of assets During the fourth quarter of 2012, the Company recognized a gain of $11 million related to the sale of a property. The Company adjusts for gains or losses on disposals of assets only when they are individually material.
Adjusted Net Earnings and Adjusted Basic Net Earnings Per Common Share The Company believes adjusted net earnings and adjusted basic net earnings per common share are useful in assessing the Company’s underlying operating performance and in making decisions regarding the ongoing operations of its business.
The following table reconciles adjusted net earnings and adjusted basic net earnings per common share to GAAP net earnings and basic net earnings per common share reported for the 12 and 52 week periods ended December 28, 2013 and December 29, 2012:
(millions of Canadian dollars/Canadiandollars) (unaudited)
2013(12 weeks)
2012(1)
(12 weeks)2013
(52 weeks)2012(1)
(52 weeks)Net earnings/basic net earnings
per common share $ 127 $ 0.45 $ 139 $ 0.49 $ 630 $ 2.24 $ 634 $ 2.25Add (deduct) impact of the
following:Equity-based compensation,
net of equity forwards 7 0.02 — — 28 0.10 25 0.09Fixed asset and other related
impairments, net ofrecoveries (29) (0.10) 9 0.04 (22) (0.08) 14 0.05
Restructuring costs 24 0.09 45 0.16 26 0.09 45 0.16Choice Properties general and
administrative costs 2 0.01 — — 4 0.01 — —Choice Properties start-up costs
and IPO transaction costs 1 — — — 35 0.12 — —Shoppers Drug Mart related
costs 17 0.06 — — 27 0.10 — —Gain on disposal of assets — — (8) (0.03) — — (8) (0.03)Defined benefit plan
amendments — — — — (37) (0.13) — —Early debt settlement costs — — — — 13 0.05 — —Fair value adjustment of Trust
Unit Liability 34 0.12 — — 27 0.10 — —Adjusted net earnings/adjusted
basic net earnings per commonshare $ 183 $ 0.65 $ 185 $ 0.66 $ 731 $ 2.60 $ 710 $ 2.52
Choice Properties IPO transaction costs In addition to the start-up costs recorded in operating income noted above, in 2013 year-to-date, transaction costs of $44 million on a pre-tax basis were incurred related directly to the Choice Properties IPO. These transaction costs were recorded in net interest and other financing charges.
Shoppers Drug Mart related costs In addition to the related costs recorded in operating income noted above, during the fourth quarter of 2013, $14 million and year-to-date $25 million of additional net interest expense on a pre-tax basis were incurred in connection with the committed financing related to the acquisition. These financing charges were recorded in net interest expense and other financing charges.
(1) Certain 2012 figures have been restated due to the implementation of revised IAS 19, “Employee Benefits”. See the “Accounting Standards Implemented in 2013” section on page 37.

2013 Annual Report - Financial Review 43
Early debt settlement costs During 2013, the Company settled its remaining USD $150 million USPP note in advance of its May 29, 2015 maturity date and related cross currency swap. Year-to-date the Company incurred early-settlement costs related to the prepayment of $18 million on a pre-tax basis, which were recorded in net interest expense and other financing charges.
Fair value adjustment of Trust Unit Liability The Company is exposed to market price fluctuations as a result of the Choice Properties Units held by unitholders other than the Company. These Units are presented as a liability on the Company's consolidated balance sheets as they are redeemable for cash at the option of the holder, subject to certain restrictions. This liability is recorded at fair value at each reporting period based on the market price of Units. In the fourth quarter of 2013 and year-to-date, the Company recorded a loss of $34 million and $27 million, respectively, related to the fair value adjustment of the Trust Unit Liability.
Interest and Interest Coverage The following table reconciles interest expense used in the calculations of the interest coverage ratio to GAAP measures for the 12 and 52 week periods ended December 28, 2013 and December 29, 2012. The Company believes the interest coverage ratio is useful in assessing the Company’s ability to cover its net interest expense with its operating income.
Interest expense is calculated as net interest expense and other financing charges plus interest capitalized on fixed assets. Interest coverage is calculated as operating income divided by interest expense.
2013 2012(1) 2013 2012(1)
(millions of Canadian dollars) (unaudited) (12 weeks) (12 weeks) (52 weeks) (52 weeks)Net interest expense and other financing charges $ 141 $ 84 $ 468 $ 351Add: Interest capitalized to fixed assets 1 — 2 1Interest expense $ 142 $ 84 $ 470 $ 352
Free Cash Flow The following table reconciles free cash flow used in assessing the Company’s financial condition to GAAP measures for the 12 and 52 week periods ended December 28, 2013 and December 29, 2012. In the first quarter of 2013, the Company refined its definition of free cash flow as cash flows from operating activities less the change in credit card receivables, fixed asset purchases and interest paid. The Company believes that this definition of free cash flow is the appropriate measure in assessing the Company’s cash available for additional funding and investing activities.
2013 2012(1) 2013 2012(1)
(millions of Canadian dollars) (unaudited) (12 weeks) (12 weeks) (52 weeks) (52 weeks)Cash flows from operating activities $ 738 $ 605 $ 1,491 $ 1,637Less: Change in credit card receivables (108) (232) (233) (204)
Fixed asset purchases 304 361 865 1,017Interest paid 98 103 370 356
Free cash flow $ 444 $ 373 $ 489 $ 468
(1) Certain 2012 figures have been restated due to the implementation of revised IAS 19, “Employee Benefits”. See the “Accounting Standards Implemented in 2013” section on page 37.

Management’s Discussion and Analysis
44 2013 Annual Report - Financial Review
Net Assets The following table reconciles net assets used in the return on average net assets ratio to GAAP measures reported as at the periods ended as indicated. The Company believes the return on average net assets ratio is useful in assessing the return on operating assets.
Net assets is calculated as total assets less cash and cash equivalents, short term investments, security deposits and trade payables and other liabilities. Return on average net assets is calculated as cumulative operating income for the latest four quarters divided by average net assets.
As at As at(millions of Canadian dollars) December 28, 2013 December 29, 2012Total assets $ 20,759 $ 17,961Less: Cash and cash equivalents 2,260 1,079
Short term investments 290 716Security deposits 1,701 252Trade payables and other liabilities 3,797 3,720
Net assets $ 12,711 $ 12,194
Adjusted Debt The following table reconciles adjusted debt used in the adjusted debt to adjusted EBITDA ratio to GAAP measures reported as at the periods ended as indicated. The Company believes that adjusted debt is relevant in assessing the amount of financial leverage employed.
The Company calculates debt as the sum of short term debt, long term debt, Trust Unit Liability, certain other liabilities and the fair value of related financial derivatives. The Company calculates adjusted debt as debt less Independent Securitization Trusts in short term and long term debt, independent funding trusts, Trust Unit Liability and PC Bank’s GICs. Adjusted debt to adjusted EBITDA is calculated as adjusted debt divided by cumulative adjusted EBITDA for the latest four quarters.
As at As at(millions of Canadian dollars) December 28, 2013 December 29, 2012Short term debt $ 605 $ 905Long term debt due within one year 1,008 672Long term debt 6,672 4,997Trust Unit Liability 688 —Certain other liabilities 39 39Fair value of financial derivatives related to the above — 14Total debt $ 9,012 $ 6,627Less:
Independent Securitization Trusts in short term debt 605 905Independent Securitization Trusts in long term debt 750 600Independent Funding Trusts 475 459Trust Unit Liability 688 —Guaranteed Investment Certificates 430 303
Adjusted debt $ 6,064 $ 4,360
The Second Preferred Shares, Series A classified as capital securities are excluded from the calculations of total debt and adjusted debt.
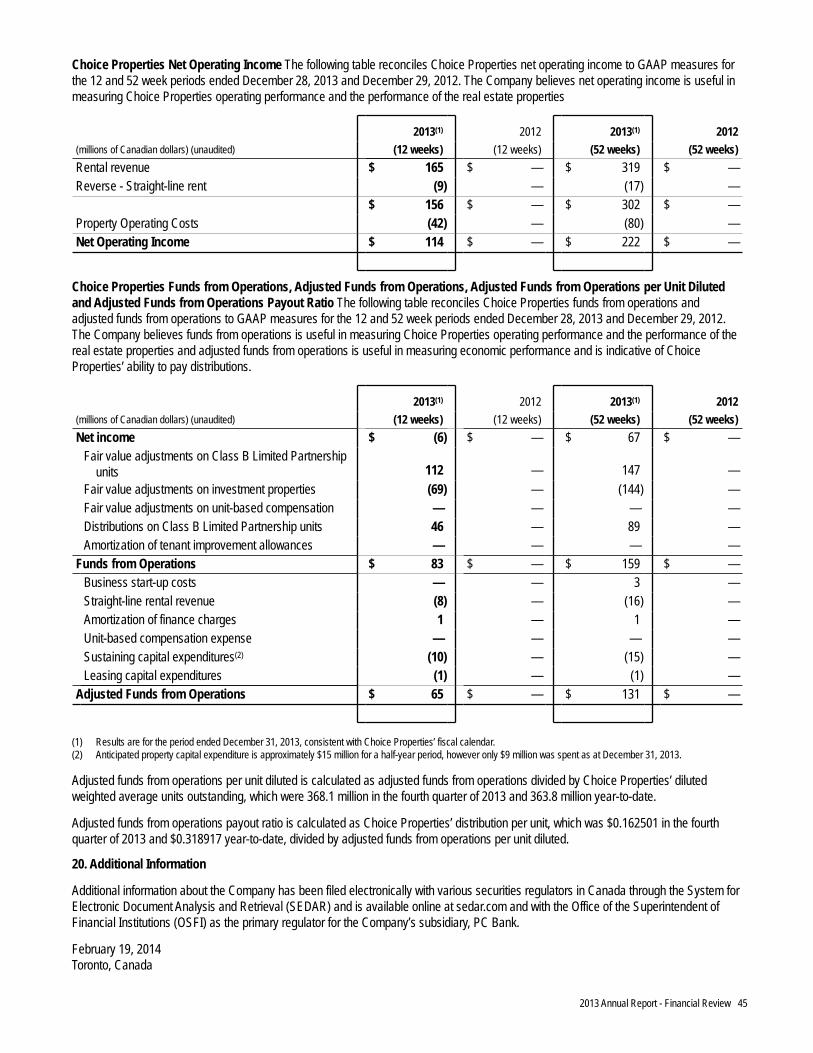
2013 Annual Report - Financial Review 45
Choice Properties Net Operating Income The following table reconciles Choice Properties net operating income to GAAP measures for the 12 and 52 week periods ended December 28, 2013 and December 29, 2012. The Company believes net operating income is useful in measuring Choice Properties operating performance and the performance of the real estate properties
2013(1) 2012 2013(1) 2012(millions of Canadian dollars) (unaudited) (12 weeks) (12 weeks) (52 weeks) (52 weeks)Rental revenue $ 165 $ — $ 319 $ —Reverse - Straight-line rent (9) — (17) —
$ 156 $ — $ 302 $ —Property Operating Costs (42) — (80) —Net Operating Income $ 114 $ — $ 222 $ —
Choice Properties Funds from Operations, Adjusted Funds from Operations, Adjusted Funds from Operations per Unit Diluted and Adjusted Funds from Operations Payout Ratio The following table reconciles Choice Properties funds from operations and adjusted funds from operations to GAAP measures for the 12 and 52 week periods ended December 28, 2013 and December 29, 2012. The Company believes funds from operations is useful in measuring Choice Properties operating performance and the performance of the real estate properties and adjusted funds from operations is useful in measuring economic performance and is indicative of Choice Properties’ ability to pay distributions.
2013(1) 2012 2013(1) 2012(millions of Canadian dollars) (unaudited) (12 weeks) (12 weeks) (52 weeks) (52 weeks)Net income $ (6) $ — $ 67 $ —
Fair value adjustments on Class B Limited Partnershipunits 112 — 147 —
Fair value adjustments on investment properties (69) — (144) —Fair value adjustments on unit-based compensation — — — —Distributions on Class B Limited Partnership units 46 — 89 —Amortization of tenant improvement allowances — — — —
Funds from Operations $ 83 $ — $ 159 $ —Business start-up costs — — 3 —Straight-line rental revenue (8) — (16) —Amortization of finance charges 1 — 1 —Unit-based compensation expense — — — —Sustaining capital expenditures(2) (10) — (15) —Leasing capital expenditures (1) — (1) —
Adjusted Funds from Operations $ 65 $ — $ 131 $ —
(1) Results are for the period ended December 31, 2013, consistent with Choice Properties’ fiscal calendar. (2) Anticipated property capital expenditure is approximately $15 million for a half-year period, however only $9 million was spent as at December 31, 2013.
Adjusted funds from operations per unit diluted is calculated as adjusted funds from operations divided by Choice Properties’ diluted weighted average units outstanding, which were 368.1 million in the fourth quarter of 2013 and 363.8 million year-to-date.
Adjusted funds from operations payout ratio is calculated as Choice Properties’ distribution per unit, which was $0.162501 in the fourth quarter of 2013 and $0.318917 year-to-date, divided by adjusted funds from operations per unit diluted.
20. Additional Information
Additional information about the Company has been filed electronically with various securities regulators in Canada through the System for Electronic Document Analysis and Retrieval (SEDAR) and is available online at sedar.com and with the Office of the Superintendent of Financial Institutions (OSFI) as the primary regulator for the Company’s subsidiary, PC Bank.
February 19, 2014Toronto, Canada

Financial Results
46 2013 Annual Report - Financial Review
Managements Statement of Responsibility for Financial ReportingIndependent Auditors’ ReportConsolidated Financial Statements
Consolidated Statements of EarningsConsolidated Statements of Comprehensive IncomeConsolidated Statements of Changes in Shareholders’ EquityConsolidated Balance SheetsConsolidated Statements of Cash FlowsNotes to the Consolidated Financial Statements
Note 1. Nature and Description of the Reporting EntityNote 2. Significant Accounting PoliciesNote 3. Critical Accounting Estimates and JudgmentsNote 4. Future Accounting StandardsNote 5. Initial Public Offering of Choice Properties Real Estate Investment TrustNote 6. Net Interest Expense and Other Financing ChargesNote 7. Income TaxesNote 8. Basic and Diluted Net Earnings per Common ShareNote 9. Cash and Cash Equivalents, Short Term Investments and Security DepositsNote 10. Accounts ReceivableNote 11. Credit Card ReceivablesNote 12. InventoriesNote 13. Assets Held for SaleNote 14. Fixed AssetsNote 15. Investment PropertiesNote 16. Goodwill and Intangible AssetsNote 17. Interest in Other EntitiesNote 18. Other AssetsNote 19. Short Term DebtNote 20. ProvisionsNote 21. Long Term DebtNote 22. Trust Unit LiabilityNote 23. Other LiabilitiesNote 24. Share CapitalNote 25. Capital ManagementNote 26. Equity-Based CompensationNote 27. Post-Employment and Other Long Term Employee BenefitsNote 28. Employee CostsNote 29. LeasesNote 30. Financial InstrumentsNote 31. Financial Risk ManagementNote 32. Contingent LiabilitiesNote 33. Financial GuaranteesNote 34. Related Party TransactionsNote 35. Agreement to Acquire Shoppers Drug Mart CorporationNote 36. Segment Information
Earning Coverage Exhibit to the Audited Consolidated Financial StatementsThree Year SummaryGlossary of Terms
474849495051525354545464656566676869707071717274757778787879818181838488959597
100102102103104105
107108109

Management's Statement of Responsibility for Financial Reporting
2013 Annual Report - Financial Review 47
The management of Loblaw Companies Limited is responsible for the preparation, presentation and integrity of the accompanying consolidated financial statements, Management’s Discussion and Analysis and all other information in the Annual Report - Financial Review (“Annual Report”). This responsibility includes the selection and consistent application of appropriate accounting principles and methods in addition to making the judgments and estimates necessary to prepare the consolidated financial statements in accordance with International Financial Reporting Standards as issued by the International Accounting Standards Board. It also includes ensuring that the financial information presented elsewhere in the Annual Report is consistent with that in the consolidated financial statements.
Management is also responsible to provide reasonable assurance that assets are safeguarded and that relevant and reliable financial information is produced. Management is required to design a system of internal controls and certify as to the design and operating effectiveness of internal controls over financial reporting. A dedicated control compliance team reviews and evaluates internal controls, the results of which are shared with management on a quarterly basis. KPMG LLP, whose report follows, were appointed as independent auditors by a vote of the Company’s shareholders to audit the consolidated financial statements.
The Board of Directors, acting through an Audit Committee comprised solely of directors who are independent, is responsible for determining that management fulfills its responsibilities in the preparation of the consolidated financial statements and the financial control of operations. The Audit Committee recommends the independent auditors for appointment by the shareholders. The Audit Committee meets regularly with senior and financial management, internal auditors and the independent auditors to discuss internal controls, auditing activities and financial reporting matters. The independent auditors and internal auditors have unrestricted access to the Audit Committee. These consolidated financial statements and Management’s Discussion and Analysis have been approved by the Board of Directors for inclusion in the Annual Report based on the review and recommendation of the Audit Committee.
Toronto, CanadaFebruary 19, 2014
[signed] [signed] [signed]Galen G. Weston Vicente Trius Sarah R. DavisExecutive Chairman President Chief Financial Officer

Independent Auditors' Report
48 2013 Annual Report - Financial Review
To the Shareholders of Loblaw Companies Limited:
We have audited the accompanying consolidated financial statements of Loblaw Companies Limited, which comprise the consolidated balance sheets as at December 28, 2013 and December 29, 2012, the consolidated statements of earnings, comprehensive income, changes in shareholders’ equity and cash flows for the 52 week years then ended, and notes, comprising a summary of significant accounting policies and other explanatory information.
Management's Responsibility for the Consolidated Financial Statements
Management is responsible for the preparation and fair presentation of these consolidated financial statements in accordance with International Financial Reporting Standards, and for such internal control as management determines is necessary to enable the preparation of consolidated financial statements that are free from material misstatement, whether due to fraud or error.
Auditors’ Responsibility
Our responsibility is to express an opinion on these consolidated financial statements based on our audits. We conducted our audits in accordance with Canadian generally accepted auditing standards. Those standards require that we comply with ethical requirements and plan and perform the audit to obtain reasonable assurance about whether the consolidated financial statements are free from material misstatement.
An audit involves performing procedures to obtain audit evidence about the amounts and disclosures in the consolidated financial statements. The procedures selected depend on our judgment, including the assessment of the risks of material misstatement of the consolidated financial statements, whether due to fraud or error. In making those risk assessments, we consider internal control relevant to the entity’s preparation and fair presentation of the consolidated financial statements in order to design audit procedures that are appropriate in the circumstances, but not for the purpose of expressing an opinion on the effectiveness of the entity’s internal control. An audit also includes evaluating the appropriateness of accounting policies used and the reasonableness of accounting estimates made by management, as well as evaluating the overall presentation of the consolidated financial statements.
We believe that the audit evidence we have obtained in our audits is sufficient and appropriate to provide a basis for our audit opinion.
Opinion
In our opinion, the consolidated financial statements present fairly, in all material respects, the consolidated financial position of Loblaw Companies Limited as at December 28, 2013 and December 29, 2012, and its consolidated financial performance and its consolidated cash flows for the 52 week years then ended in accordance with International Financial Reporting Standards.
Toronto, CanadaFebruary 19, 2014
Chartered Professional Accountants, Licensed PublicAccountants

Consolidated Statements of Earnings
2013 Annual Report - Financial Review 49
For the years ended December 28, 2013 and December 29, 2012(millions of Canadian dollars except where otherwise indicated) 2013 2012(1)
Revenue $ 32,371 $ 31,604Cost of Merchandise Inventories Sold (note 12) 24,696 24,185Selling, General and Administrative Expenses 6,349 6,224Operating Income $ 1,326 $ 1,195Net interest expense and other financing charges (note 6) 468 351Earnings Before Income Taxes $ 858 $ 844Income taxes (note 7) 228 210Net Earnings $ 630 $ 634Net Earnings per Common Share ($) (note 8)
Basic $ 2.24 $ 2.25Diluted $ 2.22 $ 2.23
See accompanying notes to the consolidated financial statements.(1) Certain 2012 figures have been restated – see note 2.

Consolidated Statements of Comprehensive Income
50 2013 Annual Report - Financial Review
For the years ended December 28, 2013 and December 29, 2012(millions of Canadian dollars) 2013 2012(1)
Net earnings $ 630 $ 634Other comprehensive income (loss), net of taxesItems reclassified to profit or loss: Gain on derecognized derivative instrument (note 30) $ (5) $ —Items that will not be reclassified to profit or loss: Net defined benefit plan actuarial gain (loss) (note 27) 234 (6)Other comprehensive income (loss) $ 229 $ (6)Total Comprehensive Income $ 859 $ 628
See accompanying notes to the consolidated financial statements.(1) Certain 2012 figures have been restated – see note 2.

Consolidated Statements of Changes in Shareholders’ Equity
2013 Annual Report - Financial Review 51
(millions of Canadian dollars except where otherwise indicated)
CommonShare
CapitalRetained
Earnings(1)Contributed
Surplus
AccumulatedOther
ComprehensiveIncome
Total Shareholders’
Equity(1)
Balance at December 29, 2012 $ 1,567 $ 4,792 $ 55 $ 5 $ 6,419Net earnings $ — $ 630 $ — $ — $ 630Other comprehensive income (loss) — 234 — (5) 229Total Comprehensive Income $ — $ 864 $ — $ (5) $ 859Net effect of equity-based compensation (note 24 and 26) 90 — 32 — 122Net effect of shares held in trust (note 24) (6) (39) — — (45)Common shares purchased for cancellation (note 24) (9) (64) (73)Dividends declared per common share – $0.94 — (264) — — (264)
$ 75 $ 497 $ 32 $ (5) $ 599Balance at December 28, 2013 $ 1,642 $ 5,289 $ 87 $ — $ 7,018
(millions of Canadian dollars except where otherwise indicated)
CommonShare
CapitalRetained
Earnings(1)Contributed
Surplus
AccumulatedOther
ComprehensiveIncome
Total Shareholders’
Equity(1)
Balance at December 31, 2011 $ 1,540 $ 4,417 $ 48 $ 5 $ 6,010Net earnings $ — $ 634 $ — $ — $ 634Other comprehensive loss — (6) — — (6)Total Comprehensive Income $ — $ 628 $ — $ — $ 628Net effect of equity-based compensation (note 24 and 26) 29 — 7 — 36Common shares purchased for cancellation (note 24) (2) (14) — — (16)Dividends declared per common share – $0.85 — (239) — — (239)
$ 27 $ 375 $ 7 $ — $ 409Balance at December 29, 2012 $ 1,567 $ 4,792 $ 55 $ 5 $ 6,419
See accompanying notes to the consolidated financial statements.(1) Certain 2012 figures have been restated – see note 2.

Consolidated Balance Sheets
52 2013 Annual Report - Financial Review
As at As at(millions of Canadian dollars) December 28, 2013 December 29, 2012(1)
AssetsCurrent Assets
Cash and cash equivalents (note 9) $ 2,260 $ 1,079Short term investments (note 9) 290 716Accounts receivable (note 10) 618 456Credit card receivables (note 11) 2,538 2,305Inventories (note 12) 2,084 2,007Prepaid expenses and other assets 75 74Assets Held for Sale (note 13) 22 30
Total Current Assets $ 7,887 $ 6,667Fixed Assets (note 14) 9,105 8,973Investment Properties (note 15) 99 100Goodwill and Intangible Assets (note 16) 1,054 1,057Deferred Income Taxes (note 7) 253 260Security Deposits (note 9) 1,701 252Franchise Loans Receivable (note 30) 375 363Other Assets (note 18) 285 289Total Assets $ 20,759 $ 17,961LiabilitiesCurrent Liabilities
Trade payables and other liabilities $ 3,797 $ 3,720Provisions (note 20) 66 78Income taxes payable 37 21Short term debt (note 19) 605 905Long term debt due within one year (note 21) 1,008 672
Total Current Liabilities $ 5,513 $ 5,396Provisions (note 20) 56 59Long Term Debt (note 21) 6,672 4,997Trust Unit Liability (note 22) 688 —Deferred Income Taxes (note 7) 34 18Capital Securities 224 223Other Liabilities (note 23) 554 849Total Liabilities $ 13,741 $ 11,542Shareholders’ EquityCommon Share Capital (note 24) $ 1,642 $ 1,567Retained Earnings 5,289 4,792Contributed Surplus (note 26) 87 55Accumulated Other Comprehensive Income — 5Total Shareholders’ Equity $ 7,018 $ 6,419Total Liabilities and Shareholders’ Equity $ 20,759 $ 17,961
Contingent liabilities (note 32). Financial guarantees (note 33). Leases (note 29). Subsequent events (notes 19 and 21).See accompanying notes to the consolidated financial statements.(1) Certain 2012 figures have been restated – see note 2.
Approved on behalf of the Board of Directors [signed] [signed]Galen G. Weston Christie J.B. ClarkDirector Director

Consolidated Statements of Cash Flows
2013 Annual Report - Financial Review 53
For the years ended December 28, 2013 and December 29, 2012(millions of Canadian dollars) 2013 2012(1)
Operating ActivitiesNet earnings $ 630 $ 634Income taxes (note 7) 228 210Net interest expense and other financing charges (note 6) 468 351Depreciation and amortization 824 777Income taxes paid (272) (232)Interest received 49 52Settlement of equity forward contracts (note 30) (16) —Settlement of cross currency swaps (note 30) 94 48Change in credit card receivables (note 11) (233) (204)Change in non-cash working capital (229) 55Fixed asset and other related (recoveries) impairments (32) 19Gain on disposal of assets (1) (12)Gain on defined benefit plan amendments (note 27) (51) —Other 32 (61)
Cash Flows from Operating Activities 1,491 1,637Investing Activities
Fixed asset purchases (865) (1,017)Change in short term investments 451 20Proceeds from fixed asset sales 26 62Change in franchise investments and other receivables 5 (22)Change in security deposits (1,444) 11Intangible asset additions (12) (43)
Cash Flows used in Investing Activities (1,839) (989)Financing Activities
Change in short term debt (300) —Long term debt (note 21): Issued 2,770 111 Retired (871) (115)Debt financing costs (21) —Issuance of Trust Units (note 22) 660 —Trust Units issue costs (44) —Interest paid (370) (356)Dividends paid (259) (177)Common shares (note 24):
Issued 75 22 Purchased and held in trust (46) — Purchased for cancellation (73) (16)Cash Flows from (used in) Financing Activities 1,521 (531)Effect of foreign currency exchange rate changes on cash and cash equivalents 8 (4)Change in cash and cash equivalents 1,181 113Cash and cash equivalents, beginning of period 1,079 966Cash and Cash Equivalents, End of Period $ 2,260 $ 1,079
See accompanying notes to the consolidated financial statements.(1) Certain 2012 figures have been restated – see note 2.

Notes to the Consolidated Financial Statements
54 2013 Annual Report - Financial Review
For the years ended December 28, 2013 and December 29, 2012 (millions of Canadian dollars except where otherwise indicated)
Note 1. Nature and Description of the Reporting Entity
Loblaw Companies Limited is a Canadian public company incorporated in 1956 and is Canada’s largest food retailer and a leading provider of drugstore, general merchandise and financial products and services. Its registered office is located at 22 St. Clair Avenue East, Toronto, Canada M4T 2S7. Loblaw Companies Limited and its subsidiaries are together referred to in these consolidated financial statements as the “Company” or “Loblaw”.
The Company’s parent is George Weston Limited (“Weston”) which owns approximately 63% of the Company’s outstanding common shares. The Company’s ultimate parent is Wittington Investments, Limited. The remaining common shares are widely held.
During 2013, Choice Properties Real Estate Investment Trust (“Choice Properties”) completed an Initial Public Offering (“IPO”) (see note 5). As a result, the Company has three reportable operating segments: Retail, Financial Services and Choice Properties (see note 36).
During 2013, the Company entered into a definitive agreement to acquire all of the outstanding common shares of Shoppers Drug Mart Corporation (“Shoppers Drug Mart”) (see note 35). The Company anticipates that the transaction will be completed during the first quarter of 2014, subject to various regulatory approvals, including approvals under the Competition Act (Canada) and by the Toronto Stock Exchange (“TSX”), and the fulfillment of certain other closing conditions customary in transactions of this nature.
Note 2. Significant Accounting Policies
Statement of Compliance The consolidated financial statements have been prepared in accordance with International Financial Reporting Standards (“IFRS” or “GAAP”) as issued by the International Accounting Standards Board (“IASB”) and using the accounting policies described herein.
The consolidated financial statements were authorized for issuance by the Company’s Board of Directors (“Board”) on February 19, 2014.
Basis of Preparation The consolidated financial statements were prepared on a historical cost basis except for the following items that were measured at fair value: • liabilities for equity-settled share-based compensation and cash-settled equity-based compensation arrangements as described in
note 26;• defined benefit plan assets with the obligations related to these pension plans measured at their discounted present value as
described in note 27; and• certain financial instruments as described in note 30.
The significant accounting policies set out below have been applied consistently in the preparation of the consolidated financial statements for all periods presented.
The consolidated financial statements are presented in Canadian dollars.
Basis of Consolidation The consolidated financial statements include the accounts of the Company and other entities that the Company controls. Control exists when the Company has the existing rights that give it the current ability to direct the activities that significantly affect the entities’ returns. The Company reassesses control on an ongoing basis.
Structured entities are entities controlled by the Company which were designed so that voting or similar rights are not the dominant factor in deciding who controls the entity. Structured entities are consolidated if based on an evaluation of the substance of its relationship with the Company, the Company concludes that it controls the structured entity. Structured entities controlled by the Company were established under terms that impose strict limitations on the decision-making powers of the structured entities’ management and that results in the Company receiving the majority of the benefits related to the structured entities’ operations and net assets, being exposed to the majority of risks incident to the structured entities’ activities, and retaining the majority of the residual or ownership risks related to the structured entities or their assets.
Transactions and balances between the Company and its consolidated entities have been eliminated on consolidation.
Fiscal Year The fiscal year of the Company ends on the Saturday closest to December 31. Under an accounting convention common in the food retail industry, the Company follows a 52-week reporting cycle, which periodically necessitates a fiscal year of 53 weeks. The years ended December 28, 2013 and December 29, 2012 both contained 52 weeks. The next 53 week year will occur in fiscal 2014.

2013 Annual Report - Financial Review 55
Business Combinations Business combinations are accounted for using the acquisition method as at the acquisition date (i.e. when control is transferred to the Company). The Company measures goodwill as the excess of the sum of the fair value of the consideration transferred over the net identifiable assets acquired and liabilities assumed, all measured as at the acquisition date. Transactions costs other than those associated with the issue of debt or equity securities, that the Company incurs in connection with a business combination are expensed as incurred.
Net Earnings per Common Share Basic net earnings per common share (“EPS”) is calculated by dividing the net earnings available to common shareholders by the weighted average number of common shares outstanding during the period. Diluted EPS is calculated by adjusting the net earnings available to common shareholders and the weighted average number of common shares outstanding for the effects of all potential dilutive instruments.
Revenue Recognition The Company recognizes revenue when the amount can be reliably measured, when it is probable that future economic benefits will flow to the entity and when specific criteria have been met for each of the Company’s activities as described below.
Retail segment revenue includes sale of goods to customers through corporate stores operated by the Company and sales to franchised stores, associated stores, and independent account customers. Revenue is measured at the fair value of the consideration received or receivable, net of estimated returns and sales incentives. The Company recognizes revenue at the time the sale is made to its customers and at the time of delivery of inventory to its associated and franchise stores. Revenue also includes services fees from franchised stores, associated stores, and independent account customers, which are recognized when services are rendered.
On the initial sale of franchising arrangements, the Company offers products and services as part of a multiple deliverable arrangement, which is recorded using a relative fair value approach.
Financial services segment revenue includes interest income on credit card loans, service fees and other revenue related to financial services. Interest income is recognized using the effective interest method. Service fees are recognized when services are rendered. Other revenue is recognized periodically or according to contractual provisions.
Choice Properties segment revenue includes rental revenue from operating leases where Choice Properties is the lessor. The rental revenue is recognized on a straight-line basis over the terms of the respective leases.
Customer Loyalty Awards Customer loyalty awards are accounted for as a separate component of the sales transaction in which they are granted. A portion of the consideration received in a transaction that includes the issuance of an award is deferred until the awards are ultimately redeemed. The allocation of the consideration to the award is based on an evaluation of the award’s estimated fair value at the date of the transaction using the residual fair value method.
Taxation Current and deferred taxes are recognized in the consolidated statement of earnings, except when it relates to a business combination, or items recognized directly to equity or to other comprehensive income (loss).
Current tax is the expected tax payable or receivable on the taxable income or loss for the period, using tax rates enacted or substantively enacted at the reporting date, and any adjustment to tax payable in respect of previous years.
Deferred tax is recognized using the asset and liability method of accounting on temporary differences arising between the financial statement carrying values of existing assets and liabilities and their respective income tax bases. Deferred tax is measured using enacted or substantively enacted income tax rates expected to apply in the years in which those temporary differences are expected to be recovered or settled. A deferred tax asset is recognized for unused tax losses and credits to the extent that it is probable that future taxable profits will be available against which they can be utilized. Deferred tax assets are reviewed at each reporting date and are reduced to the extent that it is no longer probable that the related tax benefit will be realized.
Deferred tax assets and liabilities are offset if there is a legally enforceable right to offset current tax liabilities and assets and they relate to income taxes levied by the same taxation authority on the same taxable entity, or on different taxable entities, but the Company intends to settle its current tax assets and liabilities on a net basis.
Deferred tax is provided on temporary differences arising on investments in subsidiaries, except where the timing of the reversal of the temporary difference is controlled by the Company and it is probable that the temporary difference will not reverse in the foreseeable future.
Choice Properties qualifies as a “mutual fund trust” under the Income Tax Act (Canada). The Trustees intend to distribute all taxable income directly earned by Choice Properties to Unitholders and to deduct such distributions for income tax purposes.
Legislation relating to the federal income taxation of Specified Investment Flow Through trusts or partnerships ("SIFT") provide that certain distributions from a SIFT will not be deductible in computing the SIFT’s taxable income and that the SIFT will be subject to tax on such distributions at a rate that is substantially equivalent to the general tax rate applicable to Canadian corporations. However, distributions paid by a SIFT as return of capital should generally not be subject to tax.

Notes to the Consolidated Financial Statements
56 2013 Annual Report - Financial Review
Under the SIFT rules, the taxation regime will not apply to a real estate investment trust (“REIT”) that meets prescribed conditions relating to the nature of its assets and revenue (the “REIT Conditions”). Choice Properties has reviewed the SIFT rules and has assessed its interpretation and application to the REIT's assets and revenue. While there are uncertainties in the interpretation and application of the SIFT rules, Choice Properties has determined that it meets the REIT Conditions.
Cash and Cash Equivalents Cash and cash equivalents consist of highly liquid marketable investments with an original maturity date of 90 days or less from the date of acquisition.
Short Term Investments Short term investments consist of marketable investments with an original maturity date greater than 90 days and less than 365 days from the date of acquisition.
Security Deposits Security deposits consist of cash and cash equivalents and short term investments, which primarily include escrow deposits for pending acquisitions. Security deposits also include amounts which are required to be placed with counterparties as collateral to enter into and maintain outstanding letters of credit and financial derivative contracts.
Accounts Receivable Accounts receivable, net of allowances for doubtful accounts, include amounts due from independent franchisees, associated stores, independent accounts and amounts owed from vendors.
Credit Card Receivables The Company, through President’s Choice Bank (“PC Bank”), a wholly owned subsidiary of the Company, has credit card receivables that are stated net of an allowance. Interest income is recorded in revenue and interest expense is recorded in net interest expense and other financing charges using the effective interest method. The effective interest rate is the rate that discounts the estimated future cash receipts through the expected life of the credit card receivable (or, where appropriate, a shorter period) to the carrying amount. When calculating the effective interest rate, the Company estimates future cash flows considering all contractual terms of the financial instrument, but not future credit losses.
The Company periodically transfers credit card receivables by selling them to and repurchasing them from independent securitization trusts. PC Bank is required to absorb a portion of the related credit losses. As a result, the Company has not transferred all of the risks and rewards related to these assets and continues to recognize these assets in credit card receivables. The transferred receivables are accounted for as financing transactions. The Company consolidates Eagle Credit Card Trust® (“Eagle”), one of the independent securitization trusts, as a structured entity. The associated liabilities secured by these assets are included in either short term debt or long term debt based on their characteristics and are carried at amortized cost.
Credit card receivables are considered past due when a cardholder has not made a payment by the contractual due date, taking into account a grace period. The amount of credit card receivables that fall within the grace period is considered current. Credit card receivables past due but not impaired are those receivables that are either less than 90 days past due or whose past due status is reasonably expected to be remedied. Any credit card receivables with a payment that is contractually 180 days in arrears, or where the likelihood of collection is considered remote, is written off.
Franchise Loans Receivable Franchise loans receivable are comprised of amounts due from independent franchisees for loans issued through a consolidated independent funding trust. Each independent franchisee provides security to the independent funding trust for its obligations by way of a general security agreement. In the event that an independent franchisee defaults on its loan and the Company has not, within a specified time period, assumed the loan or the default is not otherwise remedied, the independent funding trust would assign the loan to the Company and draw upon a standby letter of credit. The Company has agreed to reimburse the issuing bank for any amount drawn on the standby letter of credit. The carrying amount of franchise loan receivables approximates fair value.
Inventories The Company values merchandise inventories at the lower of cost and net realizable value. Cost includes the costs of purchases net of vendor allowances plus other costs, such as transportation, that are directly incurred to bring inventories to their present location and condition. Seasonal general merchandise and inventories at distribution centres are measured at weighted average cost. The Company uses the retail method to measure the cost of the majority of retail store inventories. The Company estimates net realizable value as the amount that inventories are expected to be sold taking into consideration fluctuations in retail prices due to seasonality less estimated costs necessary to make the sale. Inventories are written down to net realizable value when the cost of inventories is estimated to be unrecoverable due to obsolescence, damage or declining selling prices. When circumstances that previously caused inventories to be written down below cost no longer exist or when there is clear evidence of an increase in retail selling prices, the amount of the write-down previously recorded is reversed. Storage costs, indirect administrative overhead and certain selling costs related to inventories are expensed in the period that these costs are incurred.

2013 Annual Report - Financial Review 57
Vendor Allowances The Company receives allowances from certain of its vendors whose products it purchases for resale. These allowances are received for a variety of buying and/or merchandising activities, including vendor programs such as volume purchase allowances, purchase discounts, listing fees and exclusivity allowances. Allowances received from a vendor is a reduction in the cost of the vendor’s products and is recognized as a reduction in the cost of merchandise inventories sold and the related inventory when recognized in the consolidated statements of earnings and the consolidated balance sheets, respectively, when it is probable that they will be received and the amount of the allowance can be reliably estimated. Amounts received but not yet earned are presented in other liabilities as deferred vendor allowances.
Certain exceptions apply if the consideration is a payment for assets or services delivered to the vendor or for reimbursement of selling costs incurred to promote the vendor’s products. The consideration is then recognized as a reduction of the cost incurred in the consolidated statements of earnings.
Fixed Assets Fixed assets are recognized and subsequently measured at cost less accumulated depreciation and any accumulated impairment losses. Cost includes expenditures that are directly attributable to the acquisition of the asset, including costs incurred to prepare the asset for its intended use and capitalized borrowing costs. The commencement date for capitalization of costs occurs when the Company first incurs expenditures for the qualifying assets and undertakes the required activities to prepare the assets for their intended use.
Borrowing costs directly attributable to the acquisition, construction or production of fixed assets that necessarily take a substantial period of time to prepare for their intended use and a proportionate share of general borrowings, are capitalized to the cost of those fixed assets, based on a quarterly weighted average cost of borrowing. All other borrowing costs are expensed as incurred and recognized in net interest expense and other financing charges.
The cost of replacing a fixed asset component is recognized in the carrying amount of the item if it is probable that the future economic benefits embodied within the component will flow to the Company and its cost can be measured reliably. The carrying amount of the replaced part is de-recognized. The cost of repairs and maintenance of fixed assets are expensed as incurred and recognized in operating income.
Gains and losses on disposal of fixed assets are determined by comparing the fair value of the proceeds from disposal with the net book value of the assets and are recognized net, in operating income.
Fixed assets are depreciated on a straight-line basis over their estimated useful lives to their estimated residual value when the assets are available for use. When significant parts of a fixed asset have different useful lives, they are accounted for as separate components and depreciated separately. Depreciation methods, useful lives and residual values are reviewed at each financial year end and are adjusted for prospectively, if appropriate. Estimated useful lives are as follows:
Buildings 10 to 40 yearsEquipment and fixtures 2 to 10 yearsBuilding improvements up to 10 yearsLeasehold improvements Lesser of term of the lease and useful life up to 25 yearsAssets held under financing leases Lesser of term of the lease(i) and useful life(ii)
(i) If it is reasonably certain that the Company will obtain ownership by the end of the lease term, assets under finance leases would be depreciated over the life of the asset.
(ii) Same basis as owned assets.
Non-current assets are classified as assets held for sale if their carrying amount will be recovered principally through a sale transaction rather than through continuing use. To qualify as assets held for sale, the sale must be highly probable, assets must be available for immediate sale in their present condition, and management must be committed to a plan to sell assets that should be expected to close within one year from the date of classification. Assets held for sale are recognized at the lower of their carrying amount and fair value less costs to sell and are not depreciated.
Fixed assets are reviewed at each balance sheet date to determine whether there is any indication of impairment. Refer to the Impairment of Non-Financial Assets policy.
Investment Properties Investment properties are properties owned by the Company that are held to either earn rental income, for capital appreciation, or both. The Company’s investment properties include single tenant properties held to earn rental income and certain multiple tenant properties. Land and buildings leased to franchisees are not accounted for as investment properties as these properties are related to the Company’s operating activities.

Notes to the Consolidated Financial Statements
58 2013 Annual Report - Financial Review
Investment property assets are recognized at cost less accumulated depreciation and any accumulated impairment losses. The depreciation policies for investment properties are consistent with those described in the accounting policy for fixed assets.
Investment properties are reviewed at each balance sheet date to determine whether there is any indication of impairment. Refer to the Impairment of Non-Financial Assets policy.
Goodwill Goodwill arising in a business combination is recognized as an asset at the date that control is acquired. Goodwill is subsequently measured at cost less any accumulated impairment losses. Goodwill is not amortized but is tested for impairment on an annual basis or more frequently if there are indicators that goodwill may be impaired as described in the Impairment of Non-Financial Assets policy.
Intangible Assets Intangible assets with finite lives are measured at cost less accumulated amortization and any accumulated impairment losses. These intangible assets are amortized on a straight-line basis over their estimated useful lives, ranging from three to 13 years, and are tested for impairment as described in the Impairment of Non-Financial Assets policy. Useful lives, residual values and amortization methods for intangible assets with finite useful lives are reviewed at least annually.
Indefinite life intangible assets are measured at cost less any accumulated impairment losses. These intangible assets are tested for impairment on an annual basis or more frequently if there are indicators that intangible assets may be impaired as described in the Impairment of Non-Financial Assets policy.
Impairment of Non-Financial Assets At each balance sheet date, the Company reviews the carrying amounts of its non-financial assets, other than inventories and deferred tax assets, to determine whether there is any indication of impairment. If any such indication exists, the asset is then tested for impairment by comparing its recoverable amount to its carrying value. Goodwill and indefinite life intangible assets are tested for impairment at least annually.
For the purpose of impairment testing, assets are grouped together into the smallest group of assets that generate cash inflows from continuing use that are largely independent of cash inflows of other assets or groups of assets. This grouping is referred to as a cash generating unit (“CGU”). The Company has determined that each location is a separate CGU for purposes of impairment testing.
Corporate assets, which include head office facilities and distribution centers, do not generate separate cash inflows. Corporate assets are tested for impairment at the minimum grouping of CGUs to which the corporate assets can be reasonably and consistently allocated. Goodwill arising from a business combination is tested for impairment at the minimum grouping of CGUs that are expected to benefit from the synergies of the combination.
The recoverable amount of a CGU or CGU grouping is the higher of its value in use and its fair value less costs to sell. Value in use is based on the estimated future cash flows from the CGU or CGU grouping, discounted to their present value using a pre-tax discount rate that reflects current market assessments of the time value of money and the risks specific to the CGU or CGU group. The fair value less costs to sell is based on the best information available to reflect the amount that could be obtained from the disposal of the CGU in an arm’s length transaction between knowledgeable and willing parties, net of estimates of the costs of disposal.
An impairment loss is recognized if the carrying amount of a CGU or CGU group exceeds its recoverable amount. For asset impairments other than goodwill, the impairment loss reduces the carrying amounts of the non-financial assets in the CGU on a pro-rata basis. Any loss identified from goodwill impairment testing is first applied to reduce the carrying amount of goodwill allocated to the CGU grouping, and then to reduce the carrying amounts of the other non-financial assets in the CGU or CGU group on a pro-rata basis. Impairment losses are recognized in operating income.
For other assets other than goodwill, an impairment loss is reversed only to the extent that the asset’s carrying amount does not exceed the carrying amount that would have been determined, net of depreciation or amortization, if no impairment loss had been recognized. An impairment loss in respect of goodwill is not reversed.
Provisions Provisions are recognized when there is a present legal or constructive obligation as a result of a past event, it is probable that the Company will be required to settle the obligation and a reliable estimate of the amount of the obligation can be made. The amount recognized as a provision is the present value of the best estimate of the consideration required to settle the present obligation at the end of the reporting period, taking into account the risks and uncertainties specific to the obligation. The unwinding of the discount rate is recognized in net interest expense and other financing charges.

2013 Annual Report - Financial Review 59
Financial Instruments and Derivative Financial Instruments Financial assets and liabilities are recognized when the Company becomes party to the contractual provisions of the financial instrument. Financial instruments, including derivatives and embedded derivatives in certain contracts, upon initial recognition are measured at fair value and classified as either financial assets or financial liabilities at fair value through profit or loss, held-to-maturity investments, loans and receivables or other financial liabilities. Loans and receivables, and other financial liabilities are subsequently measured at cost or amortized cost. Derivatives and non-financial derivatives must be recorded at fair value on the consolidated balance sheets. Fair values are based on quoted market prices where available from active markets, otherwise fair values are estimated using valuation methodologies, primarily discounted cash flows taking into account external market inputs where possible.
Financial derivative instruments in the form of cross currency swaps, interest rate swaps, foreign exchange forwards and equity forwards, as well as non-financial derivatives in the form of futures contracts, options contracts and forward contracts, are recorded at fair value on the consolidated balance sheets. The Company does not use derivative instruments for speculative purposes. Any embedded derivative instruments that may be identified are separated from their host contract and recorded on the consolidated balance sheets at fair value. Derivative instruments are recorded in current or non-current assets and liabilities based on their remaining terms to maturity. All changes in fair values of the derivative instruments are recorded in net earnings unless the derivative qualifies and is effective as a hedging instrument in a designated hedging relationship.
Classification The following table summarizes the classification and measurement of the Company’s financial assets and liabilities:
Asset/Liability Classification MeasurementCash and cash equivalents Fair value through profit and loss Fair valueShort term investments Fair value through profit and loss Fair valueDerivatives included in accounts receivable Fair value through profit and loss Fair valueOther accounts receivables Loans and receivables Amortized costCredit card receivables Loans and receivables Amortized costDerivatives included in prepaid expenses and other assets Fair value through profit and loss Fair valueSecurity deposits Fair value through profit and loss Fair valueFranchise loans receivable Loans and receivables Amortized costDerivatives included in other assets Fair value through profit and loss Fair valueCertain other assets Loans and receivables Amortized costDerivatives included in trade payables and other liabilities Fair value through profit and loss Fair valueTrade payables and other liabilities Other liabilities Amortized costShort term debt Other liabilities Amortized costLong term debt Other liabilities Amortized costTrust Unit Liability Fair value through profit and loss Fair valueCertain other liabilities Other liabilities Amortized costCapital securities Other liabilities Amortized cost
The Company has not classified any financial assets as held-to-maturity.
Fair Value The Company measures financial assets and liabilities under the following fair value hierarchy. The different levels have been defined as follows:• Fair Value Level 1: quoted prices (unadjusted) in active markets for identical assets or liabilities;• Fair Value Level 2: inputs other than quoted prices included within Level 1 that are observable for the asset or liability, either directly
(i.e., as prices) or indirectly (i.e., derived from prices); and• Fair Value Level 3: inputs for the asset or liability that are not based on observable market data (unobservable inputs).
Determination of fair value and the resulting hierarchy requires the use of observable market data whenever available. The classification of a financial instrument in the hierarchy is based upon the lowest level of input that is significant to the measurement of fair value.
Transaction costs other than those related to financial instruments classified as fair value through profit or loss, which are expensed as incurred, are capitalized to the carrying amount of the instrument and amortized using the effective interest method.

Notes to the Consolidated Financial Statements
60 2013 Annual Report - Financial Review
Gains and losses on fair value through profit or loss financial assets and financial liabilities are recognized in earnings before income taxes in the period in which they are incurred. Settlement date accounting is used to account for the purchase and sale of financial assets. Gains or losses between the trade date and settlement date on fair value through profit or loss financial assets are recorded in earnings before income taxes.
Valuation process The determination of the fair value of financial instruments is performed by the Company’s treasury and financial reporting departments on a quarterly basis. There was no change in the valuation techniques applied to financial instruments during 2013. The following table describes the valuation techniques used in the determination of the fair values of financial instruments:
Type Valuation ApproachCash and cash equivalents, short term investments,security deposits, accounts receivable, credit cardreceivables, trade payables and other liabilities andshort term debt
The carrying amount approximates fair value due to the short term maturity ofthese instruments.
Franchise loans receivable The carrying amount approximates fair value due to the minimal fluctuations inthe forward interest rate and the provisions recorded for all impairedreceivables.
Derivative financial instruments Specific valuation techniques used to value derivative financial instrumentsinclude:
Quoted market prices or dealer quotes for similar instruments;The fair value of interest rate swaps is calculated as the present value ofthe estimated future cash flows based on observable yield curves; andThe fair value of cross currency swaps is determined by forward and spotforeign exchange rates. The fair value of certain swaps is determined byan external valuator with experience in the financial markets.
Long term debt, Trust Unit Liability, capital securitiesand other financial instruments
The fair value is based on the present value of contractual cash flows,discounted at the Company’s current incremental borrowing rate for similartypes of borrowing arrangements or, where applicable, quoted market prices.
Financial assets are derecognized when the contractual rights to receive cash flows and benefits from the financial asset expire, or if the Company transfers the control or substantially all the risks and rewards of ownership of the financial asset to another party. The difference between the carrying amount of the financial asset and the sum of the consideration received and receivable is recognized in earnings before income tax.
Financial liabilities are derecognized when obligations under the contract expire, are discharged or cancelled. The difference between the carrying amount of the financial liability derecognized and the consideration paid and payable is recognized in earnings before income tax.
Impairment of Financial Assets An assessment of whether there is objective evidence that a financial asset or a group of financial assets is impaired is performed at each balance sheet date. A financial asset or group of financial assets is considered to be impaired if one or more loss events that have an impact on the estimated future cash flows occur after their initial recognition and the loss can be reliably measured. If such objective evidence has occurred, the loss is based on the difference between the carrying amount of the financial asset, or portfolio of financial assets, and the respective estimated future cash flows discounted at the financial assets’ original effective interest rate. Impairment losses are recorded in the consolidated statement of earnings with the carrying amount of the financial asset or group of financial assets reduced through the use of impairment allowance accounts.
In periods subsequent to the impairment where the impairment loss has decreased, and such decrease can be related objectively to an event occurring after the impairment was initially recognized, the previously recognized impairment loss is reversed through the consolidated statement of earnings. The impairment reversal is limited to the lesser of the decrease in impairment or the extent that the carrying amount of the financial asset at the date the impairment is reversed does not exceed what the amortized cost would have been had the impairment not been recognized, after the reversal.
Foreign Currency Translation The functional currency of the Company is the Canadian dollar. Monetary assets and liabilities denominated in foreign currencies are translated into Canadian dollars at the foreign currency exchange rate in effect at the balance sheet date. Exchange gains or losses arising from the translation of these balances denominated in foreign currencies are recognized in operating income. Revenues and expenses denominated in foreign currencies are translated into Canadian dollars at foreign currency exchange rates that approximate the rates in effect at the dates when such items are transacted.

2013 Annual Report - Financial Review 61
Short term Employee Benefits Short term employee benefits include wages, salaries, compensated absences, profit-sharing and bonuses. Short term employee benefit obligations are measured on an undiscounted basis and are recognized in operating income as the related service is provided or capitalized if the service rendered is in connection with the creation of a tangible or intangible asset. A liability is recognized for the amount expected to be paid under short term cash bonus or profit sharing plans if the Company has a present legal or constructive obligation to pay this amount as a result of past service provided by the employee and the obligation can be estimated reliably.
Defined Benefit Post Employment Plans The Company has a number of contributory and non-contributory defined benefit post employment plans providing pension and other benefits to eligible employees. The defined benefit pension plans provide a pension based on length of service and eligible pay. The other defined benefits include health care, life insurance and dental benefits provided to eligible employees who retire at certain ages having met certain service requirements. The Company’s net defined benefit plan obligations (assets) for each plan are actuarially calculated by a qualified actuary at the end of each annual reporting period using the projected unit credit method pro-rated based on service and management’s best estimate of the discount rate, the rate of compensation increase, retirement rates, termination rates, mortality rates and expected growth rate of health care costs. The discount rate used to value the defined benefit plan obligation for accounting purposes is based on the yield on a portfolio of Corporate AA bonds denominated in the same currency with cash flows that match the terms of the defined benefit plan obligations. Past service costs (credits) arising from plan amendments are recognized in operating income in the year that they arise. The actuarially determined net interest costs on the net defined benefit plan obligation are recognized in net interest expense and other financing charges.
The fair values of plan assets are deducted from the defined benefit plan obligations to arrive at the net defined benefit plan obligations (assets). For plans that result in a net defined benefit asset, the recognized asset is limited to the present value of economic benefits available in the form of future refunds from the plan or reductions in future contributions to the plan (the “asset ceiling”). If it is anticipated that the Company will not be able to recover the value of the net defined benefit asset, after considering minimum funding requirements for future service, the net defined benefit asset is reduced to the amount of the asset ceiling. When the payment in the future of minimum funding requirements related to past service would result in a net defined benefit surplus or an increase in a surplus, the minimum funding requirements are recognized as a liability to the extent that the surplus would not be fully available as a refund or a reduction in future contributions.
Re-measurements including actuarial gains and losses, the effect of the asset ceiling (if applicable) and the impact of any minimum funding requirements are recognized through other comprehensive income and subsequently reclassified from accumulated other comprehensive income to retained earnings.
Other Long Term Employee Benefit Plans The Company offers other long term employee benefits including contributory long term disability benefits and non-contributory continuation of health care and dental benefits to employees who are on long term disability leave. As the amount of the long term disability benefit does not depend on length of service, the obligation is recognized when an event occurs that gives rise to an obligation to make payments. The accounting for other long term employee benefit plans is similar to the method used for defined benefit plans except that all actuarial gains and losses are recognized in operating income.
Defined Contribution Plans The Company maintains a number of defined contribution pension plans for employees in which the Company pays fixed contributions for eligible employees into a registered plan and has no further significant obligation to pay any further amounts. The costs of benefits for defined contribution plans are expensed as employees have rendered service.
Multi-Employer Pension Plans The Company participates in multi-employer pension plans which are accounted for as defined contribution plans. The Company's responsibility to make contributions to these plans is limited by amounts established pursuant to its collective agreements. Defined benefit multi-employer pension plans are accounted for as defined contribution plans as adequate information to account for the Company’s participation in the plans is not available due to the size and number of contributing employers in the plans. The contributions made by the Company to multi-employer plans are expensed as contributions are due.
Termination Benefits Termination benefits are recognized as an expense at the earlier of when the Company can no longer withdraw the offer of those benefits and when the Company recognizes costs for a restructuring. Benefits payable are discounted to their present value when the effect of the time value of money is material.
Equity-Settled Equity-Based Compensation Plans Stock options, Restricted Share Units (“RSUs”), Performance Share Units (“PSUs”), Director Deferred Share Units (“DSUs”) and Executive Deferred Share Units (“EDSUs”) issued by the Company are settled in common shares and are accounted for as equity-settled awards.

Notes to the Consolidated Financial Statements
62 2013 Annual Report - Financial Review
Stock options may have a five to ten year term, vest 20% or 33% cumulatively on each anniversary date of the grant and are exercisable at the designated common share price, which is based on the greater of the volume weighted average trading price of the Company’s common share for either the five trading days prior to the date of grant or the trading day immediately preceding the grant date. The fair value of each tranche of options granted is measured separately at the grant date using a Black-Scholes option pricing model, and includes the following assumptions:• The expected dividend yield is estimated based on the expected annual dividend prior to the option grant date and the closing share
price as at the option grant date;• The expected share price volatility is estimated based on the Company’s historical volatility over a period consistent with the expected
life of the options;• The risk-free interest rate is estimated based on the Government of Canada bond yield in effect at the grant date for a term to maturity
equal to the expected life of the options; and• The effect of expected exercise of options prior to expiry is incorporated into the weighted average expected life of the options, which
is based on historical experience and general option holder behaviour.
RSUs and PSUs vest after the end of a performance period, ranging from three to five years. The number of PSUs that vest is based on the achievement of specified performance measures. The fair value of each RSU and PSU granted is measured separately at the grant date based on the market value of a Loblaw common share less the net present value of the expected dividend stream at the date on which RSUs and PSUs are awarded to each participant.
Members of the Board, who are not management of the Company, may elect to receive a portion of their annual retainers and fees in the form of DSUs. Eligible executives of the Company may elect to defer up to 100% of the Short Term Incentive Plan earned in any year into the EDSU plan. Dividends paid earn fractional DSUs and EDSUs, respectively and are treated as additional awards. DSUs and EDSUs vest upon grant.
The compensation expense for equity-settled plans is prorated over the vesting or performance period, with a corresponding increase to contributed surplus. Forfeitures are estimated at the grant date and are revised to reflect changes in expected or actual forfeitures.
Upon exercise of options, the amount recognized in contributed surplus for the award plus the cash received upon exercise is recognized as an increase in share capital. Upon settlement of RSUs and PSUs, the amount recognized in contributed surplus for the award is reclassified to share capital, with any premium or discount applied to retained earnings.
During 2013, the Company established a trust for each of the RSU and PSU plans to facilitate the purchase of shares for future settlement upon vesting. The trusts are considered structured entities and are consolidated in the Company’s financial statements with the cost of the acquired shares recorded at book value as a reduction to share capital (see note 24). Any premium on the acquisition of the shares above book value is applied to retained earnings until the shares are issued to settle RSU and PSU plan obligations.
Cash-Settled Equity-Based Compensation Unit Options, Restricted Units (“RUs”) and Trustee Deferred Units (“DUs”) issued by Choice Properties are accounted for as cash-settled awards.
Choice Properties’ Unit Options may have a five to ten year term, vest 25% cumulatively on each anniversary date of the grant and are exercisable at the designated Unit price, which is based on the greater of the volume weighted average trading price of a Unit for the five trading days prior to the date of grant or the trading day immediately preceding the grant date. The fair value of each tranche is valued separately using a Black-Scholes option pricing model, and includes the following assumptions:• The expected distribution yield is estimated based on the expected annual distribution prior to the balance sheet date and the closing
share price as at the balance sheet date;• The expected unit price volatility is estimated based on the average volatility of investment grade entities in the Standard & Poor’s/
TSX REIT Index over a period consistent with the expected life of the options;• The risk-free interest rate is estimated based on the Government of Canada bond yield in effect at the balance sheet date for a term
to maturity equal to the expected life of the options; and• The effect of expected exercise of options prior to expiry is incorporated into the weighted average expected life of the options, which
is based on expectations of option holder behaviour.
RUs entitle certain employees to receive the value of the RU award in cash or Units at the end of the applicable vesting period, which is usually three years in length. The RU plan provides for the crediting of additional RUs in respect of distributions paid on Units for the period when an RU is outstanding. The fair value of each RU granted is measured based on the market value of a Unit at the balance sheet date.

2013 Annual Report - Financial Review 63
Members of the Choice Properties’ Board of Trustees, who are not management of Choice Properties, are required to receive a portion of their annual retainer in the form of DUs and may also elect to receive up to 100% of their remaining fees in DUs. Distributions paid earn fractional DUs, which are treated as additional awards. DUs vest upon grant.
The fair value of the amount payable to employees in respect of these cash settled awards plan is re-measured at each balance sheet date, and a compensation expense is recognized in selling, general and administrative expenses over the vesting period for each tranche with a corresponding change in the liability.
Prior to 2013, vested RSUs, vested PSUs, DSUs and EDSUs issued by the Company were settled in cash and were accounted for as cash-settled awards, and entitled the holder to receive a Loblaw common share or the cash equivalent. The cash payment was equal to the weighted average of the trading prices of the Company’s common shares on the TSX for the five trading days prior to the valuation date. Compensation expense was recorded for each award granted equal to the market value of a Loblaw common share at the date on which the awards were granted, with a corresponding liability. For RSUs and PSUs, the net present value of the expected dividend stream was deducted from the market value of the Loblaw common share. Compensation expense was prorated over the vesting period reflecting changes in the market value of a Loblaw common share, and in the case of PSUs, the number of awards expected to vest.
Employee Share Ownership Plan The Company’s contributions to the Employee Share Ownership Plan (“ESOP”) are measured at cost and recorded as compensation expense in operating income when the contribution is made. The ESOP is administered through a trust which purchases the Company’s common shares on the open market on behalf of its employees.
Accounting Standards Implemented in 2013
Fair Value Measurement In 2011, the IASB issued IFRS 13, “Fair Value Measurement” (“IFRS 13”), which establishes a single framework for the fair value measurement and disclosure of financial and non-financial assets and liabilities. The new standard unifies the definition of fair value and also introduces new concepts including ‘highest and best use’ and ‘principal markets’ for non-financial assets and liabilities. There are additional disclosure requirements, including increased fair value disclosure for financial instruments for interim and annual financial statements. The Company implemented this standard prospectively in the first quarter of 2013. There were no significant measurement impacts on the Company's consolidated financial statements as a result of the adoption of IFRS 13. The Company has included the additional disclosures required by the standard in note 30.
Employee Benefits In 2011, the IASB revised International Accounting Standard (“IAS”) 19, “Employee Benefits” (“IAS 19”). The most significant amendments for the Company and its significant accounting policies are the requirement to immediately recognize all unvested past service costs and the replacement of interest cost and expected return on plan assets with a net interest amount that is calculated by applying a prescribed discount rate to the net defined benefit obligation (asset). Under the amendment, the Company continues to recognize actuarial gains and losses on plan assets and obligations through other comprehensive income, but has chosen to reclassify these amounts from accumulated other comprehensive income and record these actuarial gains and losses in retained earnings, consistent with its previous presentation. The Company implemented this standard retrospectively in the first quarter of 2013. The impact arising from the adoption of the amendments to IAS 19 is summarized as follows:
Consolidated Statements of Earnings and Comprehensive IncomeIncrease (Decrease) December 28, 2013 December 29, 2012(millions of Canadian dollars except where otherwise indicated) (52 weeks) (52 weeks)Selling, General and Administrative Expenses $ (20) $ 1Operating Income $ 20 $ (1)Net interest expense and other financing charges 27 20Earnings Before Income Taxes $ (7) $ (21)Income taxes (2) (5)Net Earnings $ (5) $ (16)Other comprehensive income, net of taxes 20 15Total Comprehensive Income $ 15 $ (1)Net Earnings per Common Share ($)
Basic $ (0.02) $ (0.06)Diluted $ (0.02) $ (0.05)

Notes to the Consolidated Financial Statements
64 2013 Annual Report - Financial Review
Consolidated Balance SheetsIncrease (Decrease) As at As at As at(millions of Canadian dollars) December 28, 2013 December 29, 2012 January 1, 2012Total liabilities $ (17) $ (2) $ (3)Shareholders’ equity 17 2 3
The amendments also require enhanced annual disclosures for defined benefit plans, including additional information on the characteristics and risks of those plans.
Other Standards In addition to the above standards, the Company implemented the following standards and amendments effective January 1, 2013: IFRS 10, “Consolidated Financial Statements”, IFRS 11, “Joint Arrangements”, IFRS 12 “Disclosure of Interests in Other Entities”, IAS 28, “Investments in Associates” and IAS 1, “Presentation of Financial Statements”. There was no significant impact on the Company’s consolidated financial statements as a result of the implementation of these standards.
In 2013, the IASB issued amendments to IAS 36 “Impairment of Assets” which clarify the disclosure requirements for recoverable amounts of CGUs. These amendments are required to be applied for periods beginning on or after January 1, 2014. The Company has elected to early adopt these amendments during 2013. There was no significant impact on the Company’s consolidated financial statements as a result of these amendments.
Note 3. Critical Accounting Estimates and Judgments
The preparation of the consolidated financial statements requires management to make estimates and judgments in applying the Company’s accounting policies that affect the reported amounts and disclosures made in the consolidated financial statements and accompanying notes.
Within the context of these consolidated financial statements, a judgment is a decision made by management in respect of the application of an accounting policy, a recognized or unrecognized financial statement amount and/or note disclosure, following an analysis of relevant information that may include estimates and assumptions. Estimates and assumptions are used mainly in determining the measurement of balances recognized or disclosed in the consolidated financial statements and are based on a set of underlying data that may include management’s historical experience, knowledge of current events and conditions and other factors that are believed to be reasonable under the circumstances. Management continually evaluates the estimates and judgments it uses.
The following are the accounting policies subject to judgments and key sources of estimation uncertainty that the Company believes could have the most significant impact on the amounts recognized in the consolidated financial statements. The Company’s significant accounting policies are disclosed in note 2.
Inventories
Key Sources of Estimation Inventories are carried at the lower of cost and net realizable value which requires the Company to utilize estimates related to fluctuations in future retail prices, seasonality and costs necessary to sell the inventory.
Impairment of Non-Financial Assets (Goodwill, Intangible Assets, Fixed Assets and Investment Properties)
Judgments Made in Relation to Accounting Policies Applied Management is required to use judgment in determining the grouping of assets to identify their CGUs for the purposes of testing fixed assets for impairment. Judgment is further required to determine appropriate groupings of CGUs, for the level at which goodwill and intangible assets are tested for impairment. The Company has determined that each location is a separate CGU for purposes of fixed asset impairment testing. For the purpose of goodwill and indefinite life intangible impairment testing, CGUs are grouped at the lowest level at which goodwill and intangibles are monitored for internal management purposes. In addition, judgment is used to determine whether a triggering event has occurred requiring an impairment test to be completed.
Key Sources of Estimation In determining the recoverable amount of a CGU or a group of CGUs, various estimates are employed. The Company determines fair value less costs to sell using such estimates as market rental rates for comparable properties, recoverable operating costs for leases with tenants, non-recoverable operating costs, discount rates, capitalization rates and terminal capitalization rates. The Company determines value in use by using estimates including projected future sales, earnings and capital investment consistent with strategic plans presented to the Board. Discount rates are consistent with external industry information reflecting the risk associated with the specific cash flows.

2013 Annual Report - Financial Review 65
Franchise Loan Receivable and Certain Other Financial Assets
Judgments Made in Relation to Accounting Policies Applied Management reviews franchise loans receivable, trade receivables and certain other assets relating to their franchise business at each balance sheet date utilizing judgment to determine whether a triggering event has occurred requiring an impairment test to be completed.
Key Sources of Estimation Management determines the initial fair value of its franchise loans and certain other financial assets using discounted cash flow models. The process of determining these fair values requires management to make estimates of a long term nature regarding discount rates, projected revenues, and margins, as applicable, derived from past experience, actual operating results, budgets and the Company’s five year forecast.
Income and Other Taxes
Judgments Made in Relation to Accounting Policies Applied The calculation of current and deferred income taxes requires management to make certain judgments regarding the tax rules in jurisdictions where the Company performs activities. Application of judgments is required regarding the classification of transactions and in assessing probable outcomes of claimed deductions including expectations about future operating results, the timing and reversal of temporary differences and possible audits of income tax and other tax filings by the tax authorities.
Allowance for Credit Card Receivables
Key Sources of Estimation The allowance for credit card receivables is measured based upon statistical analysis that includes estimates for past and current performance, aging, arrears status, the level of allowance already in place, and management’s interpretation of economic conditions and other trends specific to our customer base, including but not limited to bankruptcies. Changes in circumstances may cause future assessments of credit risk to be materially different from current assessments, which could require an increase or decrease in the allowance for credit card receivables.
Note 4. Future Accounting Standards
Financial Instruments In 2011, the IASB issued amendments to IFRS 7, “Financial Instruments: Disclosures” and IAS 32, “Financial Instruments: Presentation”. These amendments are required to be applied for periods beginning on or after January 1, 2014. The Company does not expect any significant impacts on its consolidated financial statements as a result of these amendments.
In 2013, the IASB issued amendments to, IFRS 9, “Financial Instruments” (“IFRS 9”), issued in 2010, which will ultimately replace IAS 39, “Financial Instruments: Recognition and Measurement” (“IAS 39”). The replacement of IAS 39 is a three-phase project with the objective of improving and simplifying the reporting for financial instruments. The current issuance of IFRS 9 includes the first and third phases of the project, which provide guidance on the classification and measurement of financial assets and financial liabilities and hedge accounting. The mandatory effective date of the standard has not been determined due to the incomplete status of the second phase of the project, impairment. The effective date of the entire standard will be determined closer to the completion of the remaining phase. The Company continues to assess the impact of the new standard on its consolidated financial statements.
Levies In 2013, the International Financial Reporting Interpretations Committee issued IFRIC 21, “Levies” (“IFRIC 21”). IFRIC 21 addresses accounting for a liability to pay a levy within the scope of IAS 37, “Provisions, contingent liabilities and contingent assets”. A levy is an outflow of resources embodying economic benefits that is imposed by governments on entities in accordance with legislation, other than income taxes within the scope of IAS 12, “Income Taxes” and fines or other penalties imposed for breaches of the legislation. This interpretation becomes effective for annual periods beginning on or after January 1, 2014, and is to be applied retrospectively. The Company is currently assessing the impact of the new interpretation on its consolidated financial statements.
Note 5. Initial Public Offering of Choice Properties Real Estate Investment Trust
On July 5, 2013, in connection with its acquisition of approximately $7 billion of properties and related assets from Loblaw, Choice Properties completed a $460 million IPO of Trust Units (“Units”), including the exercise of a $60 million over-allotment option. In addition, Choice Properties completed a $200 million offering of Units to Weston. Units were issued at a price of $10.00 per Unit and gross proceeds were $660 million. At closing, the Company recorded transaction costs of approximately $44 million in net interest expense and other financing charges (see note 6).
Concurrent with the offering of Units, Choice Properties completed a public offering of $600 million aggregate principal amount of senior unsecured debentures (the "Debentures") (see note 21). A portion of the proceeds were used to replenish the cash used to repay the United States dollar (“USD”) $150 million US private placement (“USPP”) note that matured and to early-settle the remaining USD $150 million USPP note, including the associated early-settlement costs of approximately $18 million, which were recorded in net interest expense and other financing charges.

Notes to the Consolidated Financial Statements
66 2013 Annual Report - Financial Review
As at December 28, 2013, the Company held an effective ownership in Choice Properties of approximately 82.2% through ownership of 21,500,000 Units and 284,074,754 Class B Limited Partnership units, which are economically equivalent to and exchangeable for Units (see note 17). Included in the Class B Limited Partnership units are 11,576,883 units issued to the Company, in connection with the acquisition of an additional portfolio of investment properties subsequent to the IPO.
Note 6. Net Interest Expense and Other Financing Charges
(millions of Canadian dollars) 2013 2012(1)
Interest expense and other financing charges:Long term debt $ 287 $ 285Choice Properties IPO transaction costs (note 5) 44 —Borrowings related to credit card receivables 39 37Shoppers Drug Mart acquisition related costs 30 —Net interest on net defined benefit obligation (note 27) 23 28Trust Unit distributions 21 —Early debt settlement costs (note 21) 18 —Independent funding trusts 15 15Dividends on capital securities (note 24) 14 14
Fair value adjustment of Trust Unit Liability (note 22) 27 —Capitalized interest (capitalization rate 6.4% (2012 – 6.4%)) (note 14) (2) (1)
$ 516 $ 378Interest income:
Accretion income $ (21) $ (18)Short term interest income (11) (8)Derivative financial instruments (10) —Security deposits(i) (6) (1)
$ (48) $ (27)Net interest expense and other financing charges $ 468 $ 351
(i) Includes interest income of $5 million (2012 – nil) related to $1.6 billion of proceeds from the issuance of senior unsecured notes held in escrow (see notes 9 and 21), which will be used to partially fund the acquisition of all of the outstanding common shares of Shoppers Drug Mart.
(1) Certain 2012 figures have been restated – see note 2.

2013 Annual Report - Financial Review 67
Note 7. Income Taxes
Income taxes recognized in the consolidated statements of earnings were as follows:
(millions of Canadian dollars) 2013 2012(1)
Current income taxes:Current period $ 289 $ 257Adjustment in respect of prior periods (1) (19)
$ 288 $ 238Deferred income taxes:
Origination and reversal of temporary differences (50) (36)Adjustment in respect of prior periods (10) 8
(60) (28)Income taxes $ 228 $ 210
Income tax expense (recovery) recognized in other comprehensive income (loss) was as follows:
(millions of Canadian dollars) 2013 2012(1)
Defined benefit plan actuarial income (loss) $ 85 $ (3)Derecognized derivative instrument (2) —Other comprehensive income (loss) $ 83 $ (3)
The effective income tax rate in the consolidated statements of earnings was reported at rates different than the weighted average basic Canadian federal and provincial statutory income tax rates for the following reasons:
2013 2012(1)
Weighted average basic Canadian federal and provincial statutory income tax rate 26.0% 26.0%Net increase (decrease) resulting from:
Effect of tax rate in foreign jurisdictions (0.6) (0.4)Non-deductible (taxable) items 1.8 0.5Impact of fair value adjustments of the Trust Unit Liability 0.8 —Impact of statutory income tax rate changes on deferred income tax balances (0.1) (0.4)Adjustments in respect of prior periods (1.3) (0.8)
Effective income tax rate applicable to earnings before income taxes 26.6% 24.9%
Unrecognized deferred tax assets Deferred income tax assets were not recognized on the consolidated balance sheet in respect of the following items:
(millions of Canadian dollars) 2013 2012Deductible temporary differences $ 12 $ 5Income tax losses 29 22Unrecognized deferred tax assets $ 41 $ 27
The income tax losses expire in the years 2028 to 2033. The deductible temporary differences do not expire under current income tax legislation. Deferred income tax assets were not recognized in respect of these items because it is not probable that future taxable income will be available to the Company to utilize the benefits.
(1) Certain 2012 figures have been restated – see note 2.
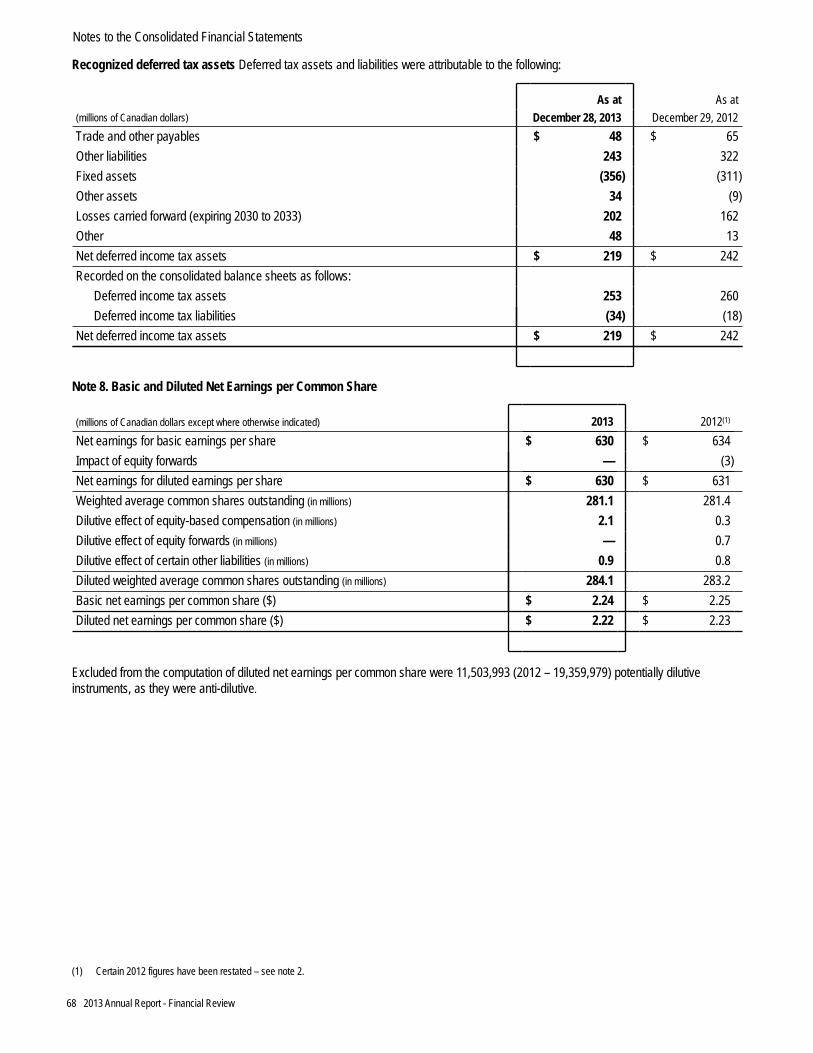
Notes to the Consolidated Financial Statements
68 2013 Annual Report - Financial Review
Recognized deferred tax assets Deferred tax assets and liabilities were attributable to the following:
As at As at(millions of Canadian dollars) December 28, 2013 December 29, 2012Trade and other payables $ 48 $ 65Other liabilities 243 322Fixed assets (356) (311)Other assets 34 (9)Losses carried forward (expiring 2030 to 2033) 202 162Other 48 13Net deferred income tax assets $ 219 $ 242Recorded on the consolidated balance sheets as follows:
Deferred income tax assets 253 260Deferred income tax liabilities (34) (18)
Net deferred income tax assets $ 219 $ 242
Note 8. Basic and Diluted Net Earnings per Common Share
(millions of Canadian dollars except where otherwise indicated) 2013 2012(1)
Net earnings for basic earnings per share $ 630 $ 634Impact of equity forwards — (3)Net earnings for diluted earnings per share $ 630 $ 631Weighted average common shares outstanding (in millions) 281.1 281.4Dilutive effect of equity-based compensation (in millions) 2.1 0.3Dilutive effect of equity forwards (in millions) — 0.7Dilutive effect of certain other liabilities (in millions) 0.9 0.8Diluted weighted average common shares outstanding (in millions) 284.1 283.2Basic net earnings per common share ($) $ 2.24 $ 2.25Diluted net earnings per common share ($) $ 2.22 $ 2.23
Excluded from the computation of diluted net earnings per common share were 11,503,993 (2012 – 19,359,979) potentially dilutive instruments, as they were anti-dilutive.
(1) Certain 2012 figures have been restated – see note 2.
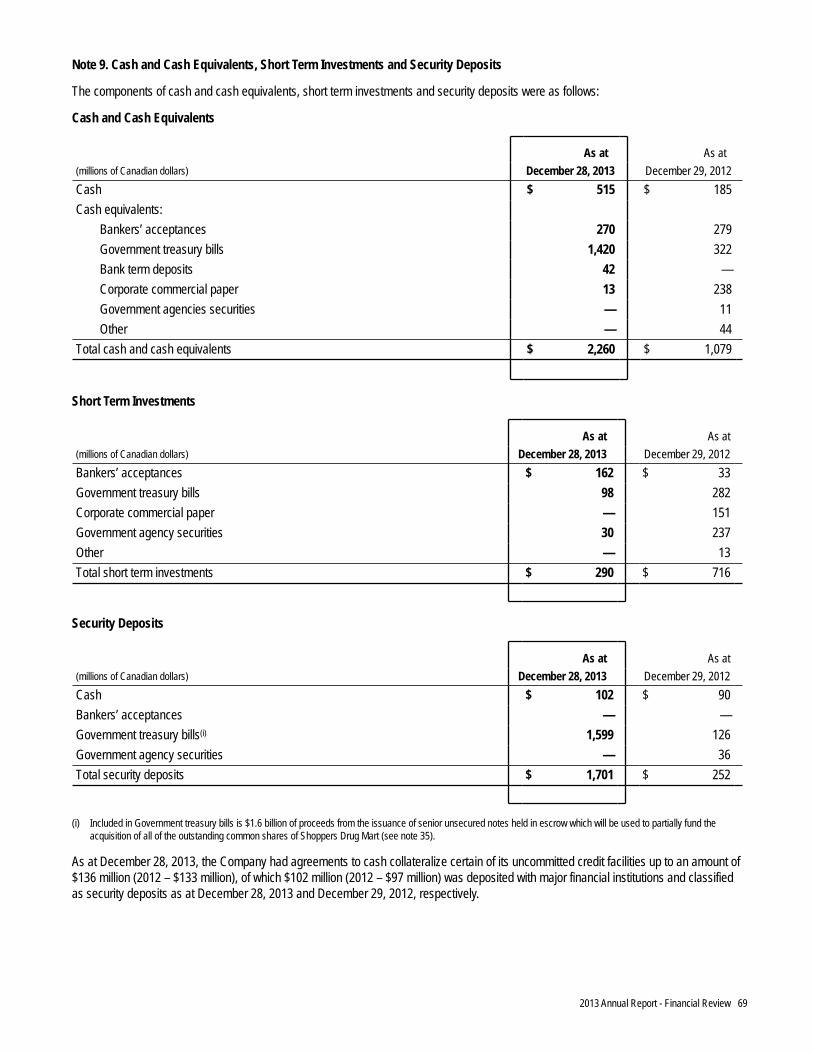
2013 Annual Report - Financial Review 69
Note 9. Cash and Cash Equivalents, Short Term Investments and Security Deposits
The components of cash and cash equivalents, short term investments and security deposits were as follows:
Cash and Cash Equivalents
As at As at(millions of Canadian dollars) December 28, 2013 December 29, 2012Cash $ 515 $ 185Cash equivalents:
Bankers’ acceptances 270 279Government treasury bills 1,420 322Bank term deposits 42 —Corporate commercial paper 13 238Government agencies securities — 11Other — 44
Total cash and cash equivalents $ 2,260 $ 1,079
Short Term Investments
As at As at(millions of Canadian dollars) December 28, 2013 December 29, 2012Bankers’ acceptances $ 162 $ 33Government treasury bills 98 282Corporate commercial paper — 151Government agency securities 30 237Other — 13Total short term investments $ 290 $ 716
Security Deposits
As at As at(millions of Canadian dollars) December 28, 2013 December 29, 2012Cash $ 102 $ 90Bankers’ acceptances — —Government treasury bills(i) 1,599 126Government agency securities — 36Total security deposits $ 1,701 $ 252
(i) Included in Government treasury bills is $1.6 billion of proceeds from the issuance of senior unsecured notes held in escrow which will be used to partially fund the acquisition of all of the outstanding common shares of Shoppers Drug Mart (see note 35).
As at December 28, 2013, the Company had agreements to cash collateralize certain of its uncommitted credit facilities up to an amount of $136 million (2012 – $133 million), of which $102 million (2012 – $97 million) was deposited with major financial institutions and classified as security deposits as at December 28, 2013 and December 29, 2012, respectively.

Notes to the Consolidated Financial Statements
70 2013 Annual Report - Financial Review
Note 10. Accounts Receivable
The following is an aging of the Company’s accounts receivable as at December 28, 2013 and December 29, 2012:
(millions of Canadian dollars) 2013 2012Current > 30 days > 60 days Total Current > 30 days > 60 days Total
Accounts receivable $ 531 $ 42 $ 45 $ 618 $ 403 $ 39 $ 14 $ 456
The following are continuities of the Company’s allowances for uncollectable accounts receivable:
(millions of Canadian dollars) 2013 2012Allowance, beginning of year $ (110) $ (112)Net reversals (additions) (8) 2Allowance, end of year $ (118) $ (110)
Of the balance of accounts receivable that are past due as at December 28, 2013, $24 million (December 29, 2012 – $16 million) were not classified as impaired as their past due status was reasonably expected to be remedied.
Note 11. Credit Card Receivables
The components of credit card receivables were as follows:
As at As at(millions of Canadian dollars) December 28, 2013 December 29, 2012Gross credit card receivables $ 2,585 $ 2,348Allowance for credit card receivables (47) (43)Credit card receivables $ 2,538 $ 2,305Securitized to independent securitization trusts:
Securitized to Eagle Credit Card Trust® 750 600Securitized to Other Independent Securitization Trusts 605 905
The Company, through PC Bank, participates in various securitization programs that provide the primary source of funds for the operation of its credit card business. PC Bank sells and repurchases credit card receivables to Independent Securitization Trusts, including Eagle and Other Independent Securitization Trusts, from time to time depending on PC Bank’s financing requirements.
During 2013, PC Bank securitized to Eagle $400 million (2012 – nil) and repurchased from Eagle $250 million (2012 – nil) of co-ownership interests in the securitized receivables. The associated liability of Eagle is recorded in long term debt (see note 21).
During 2013, PC Bank repurchased $300 million (2012 – nil) of co-ownership interests in the securitized receivables from the Other Independent Securitization Trusts. The associated liabilities related to the credit card receivables securitized to the Other Independent Securitization Trusts are recorded in short term debt (see note 19). The Company has arranged letters of credit on behalf of PC Bank (see note 33). In the event of a major decline in the income flow from, or in the value of, the securitized credit card receivables, the Other Independent Securitization Trusts can draw upon these letters of credit to recover up to a maximum of the amount outstanding on the letters of credit. Under its securitization programs, PC Bank is required to maintain at all times a credit card receivable pool balance equal to a minimum of 107% of the outstanding securitized liability and was in compliance with this requirement throughout the year.

2013 Annual Report - Financial Review 71
The following are continuities of the Company’s allowances for credit card receivables:
(millions of Canadian dollars) 2013 2012Allowances, beginning of year $ (43) $ (37)Provision for losses (105) (98)Recoveries (14) (12)Write-offs 115 104Allowances, end of year $ (47) $ (43)
The allowance for credit card receivables recorded in credit card receivables on the consolidated balance sheets is maintained at a level which is considered adequate to absorb credit related losses on credit card receivables.
The following is an aging of the Company’s gross credit card receivables as at December 28, 2013 and December 29, 2012:
(millions of Canadian dollars) 2013 2012
Current1-90 dayspast due
> 90 dayspast due Total Current
1-90 dayspast due
> 90 dayspast due Total
Gross credit card receivables $ 2,416 $ 142 $ 27 $ 2,585 $ 2,213 $ 113 $ 22 $ 2,348
Note 12. Inventories
For inventories recorded as at December 28, 2013, the Company recorded $16 million (2012 – $14 million) as an expense for the write-down of inventories below cost to net realizable value. The write-down was included in cost of merchandise inventories sold in the consolidated statements of earnings. There were no reversals of previously recorded write-downs of inventories during 2013 and 2012.
Note 13. Assets Held for Sale
The Company holds land and buildings that it intends to dispose of in the next 12 months as assets held for sale. These assets were previously used in the Company’s retail business segment. There were no impairment and other charges recognized on these properties during 2013 (2012 – $1 million). During 2013, the Company recorded a $7 million gain (2012 – $4 million) from the sale of these assets.

Notes to the Consolidated Financial Statements
72 2013 Annual Report - Financial Review
Note 14. Fixed Assets
The following are continuities of the cost and accumulated depreciation of fixed assets for the years ended December 28, 2013 and December 29, 2012:
2013
(millions of Canadian dollars) Land Buildings
Equipment and
FixturesLeasehold
Improvements
Finance Leases - Land,
Buildings, Equipment
and Fixtures
AssetsUnder
Construction TotalCostBalance, beginning of year $ 1,650 $ 6,555 $ 5,950 $ 790 $ 554 $ 664 $ 16,163Additions 1 — 14 9 62 837 923Disposals (2) (4) (57) (7) (53) — (123)Net transfer from assets held for
sale 1 — — — — — 1Net transfer (to)/from investment
properties (2) (1) — — 4 (5) (4)Transfer from assets under
construction 30 299 517 54 — (900) —Balance, end of year $ 1,678 $ 6,849 $ 6,424 $ 846 $ 567 $ 596 $ 16,960Accumulated depreciation and
impairment lossesBalance, beginning of year $ 7 $ 2,298 $ 4,176 $ 433 $ 269 $ 7 $ 7,190Depreciation — 184 532 44 44 — 804Impairment losses — 20 5 24 3 — 52Reversal of impairment losses (4) (71) (2) (3) (3) — (83)Disposals (1) (1) (48) (5) (53) — (108)Net transfer (to)/from investment
properties — (1) — — 1 — —Balance, end of year $ 2 $ 2,429 $ 4,663 $ 493 $ 261 $ 7 $ 7,855
Carrying amount as at: December 28, 2013 $ 1,676 $ 4,420 $ 1,761 $ 353 $ 306 $ 589 $ 9,105

2013 Annual Report - Financial Review 73
2012
(millions of Canadian dollars) Land BuildingsEquipment
and FixturesLeasehold
Improvements
Finance Leases - Land,
Buildings, Equipment
and FixturesAssets UnderConstruction Total
CostBalance, beginning of year $ 1,658 $ 6,308 $ 5,410 $ 723 $ 510 $ 646 $ 15,255Additions — 22 19 22 73 957 1,093Disposals (8) (20) (83) (9) (28) — (148)Net transfer to assets held for
sale (9) (25) — — — — (34)Net transfer to investment
properties (3) 1 — — (1) — (3)Transfer from assets under
construction 12 269 604 54 — (939) —Balance, end of year $ 1,650 $ 6,555 $ 5,950 $ 790 $ 554 $ 664 $ 16,163Accumulated depreciation and
impairment lossesBalance, beginning of year $ 9 $ 2,132 $ 3,745 $ 392 $ 245 $ 7 $ 6,530Depreciation — 177 489 46 43 — 755Impairment losses 2 32 7 4 4 — 49Reversal of impairment losses (3) (25) — — — — (28)Disposals — (7) (65) (9) (24) — (105)Net transfer to assets held for
sale — (15) — — — — (15)Net transfer to/(from) investment
properties (1) 4 — — 1 — 4Balance, end of year $ 7 $ 2,298 $ 4,176 $ 433 $ 269 $ 7 $ 7,190
Carrying amount as at: December 29, 2012 $ 1,643 $ 4,257 $ 1,774 $ 357 $ 285 $ 657 $ 8,973
Assets Held under Finance Leases The Company leases various land and buildings, and equipment and fixtures under a number of finance lease arrangements. As at December 28, 2013, the net carrying amount of leased land and buildings was $274 million (December 29, 2012 – $259 million), and the net carrying amount of leased equipment and fixtures was $32 million (December 29, 2012 – $26 million).
Assets under Construction The cost of additions to properties under construction for the year ended December 28, 2013 was $837 million (December 29, 2012 – $957 million). Included in this amount are capitalized borrowing costs of $2 million (2012 – $1 million), with a weighted average capitalization rate of 6.4% (2012 – 6.4%).
Security and Assets Pledged As at December 28, 2013, fixed assets with a carrying amount of $187 million (December 29, 2012 – $191 million) were encumbered by mortgages of $87 million (December 29, 2012 – $93 million).
Fixed Asset Commitments As at December 28, 2013, the Company had entered into commitments of $55 million (2012 – $60 million) for the construction, expansion and renovation of buildings and the purchase of real property.
Impairment Losses For the year ended December 28, 2013, the Company recorded $52 million (2012 – $49 million) of impairment losses on fixed assets in respect of 21 CGUs (2012 – 17 CGUs) in the retail operating segment. Impairment losses are recorded where the carrying amount of the retail location exceeds its recoverable amount. The recoverable amount was based on the greater of the CGU’s fair value less costs to sell and its value in use. Approximately 10% (2012 – 35%) of impaired CGUs had carrying values which were $6 million (2012 – $26 million) greater than their fair value less costs to sell. The remaining 90% (2012 – 65%) of impaired CGUs had carrying values which were $46 million (2012 – $23 million) greater than their value in use.

Notes to the Consolidated Financial Statements
74 2013 Annual Report - Financial Review
For the year ended December 28, 2013, the Company recorded $83 million (2012 – $28 million) of impairment reversals on fixed assets in respect of 26 CGUs (2012 – 11 CGUs) in the retail operating segment. Impairment reversals are recorded where the recoverable amount of the retail location exceeds its carrying amount. Approximately 92% (2012 – 55%) of CGUs with impairment reversals had fair value less costs to sell which were $75 million (2012 – $15 million) greater than their carrying values. The remaining 8% (2012 – 45%) of CGUs with impairment reversals had value in use which were $8 million (2012 – $13 million) greater than carrying values.
When determining the value in use of a retail location, the Company develops a discounted cash flow model for each CGU. The duration of the cash flow projections for individual CGUs varies based on the remaining useful life of the significant asset within the CGU. Sales forecasts for cash flows are based on actual operating results, operating budgets, and long term growth rates that were consistent with industry averages, all of which is consistent with strategic plans presented to the Company’s Board. The estimate of the value in use of the relevant CGUs was determined using a pre-tax discount rate of 8.0% to 8.5% at December 28, 2013 (December 29, 2012 – 8.0% to 8.5%).
Note 15. Investment Properties
The following are continuities of investment properties:
(millions of Canadian dollars) 2013 2012CostBalance, beginning of year $ 169 $ 158Additions 1 —Disposals (2) —Net transfer from fixed assets 4 3Net transfer from assets held for sale — 8Balance, end of year $ 172 $ 169Accumulated depreciation and impairment lossesBalance, beginning of year $ 69 $ 76Disposals (1) —Depreciation 2 2Impairment losses — 1Reversal of impairment losses (1) (4)Net transfer (to)/from fixed assets — (4)Net transfer to assets held for sale 4 (2)Balance, end of year $ 73 $ 69
(millions of Canadian dollars) 2013 2012Carrying amount $ 99 $ 100Fair value 144 125
During 2013, the Company recognized in operating income $4 million of rental income (2012 – $5 million) and incurred direct operating costs of $3 million (2012 – $3 million) related to its investment properties. In addition, the Company recognized direct operating costs of $1 million (2012 – $1 million) related to its investment properties for which no rental income was earned.
An external, independent valuation company, having appropriate recognized professional qualifications and recent experience in the location and category of property being valued, provided appraisals for certain of the Company’s investment properties. For the other investment properties, the Company determined the fair value by relying on comparable market information and the independent manager of the Company’s investment properties. Where available, the fair values are based on market values, being the estimated amount for which a property could be exchanged on the date of the valuation between a willing buyer and a willing seller in an arm’s length transaction after proper marketing wherein the parties had each acted knowledgeably and willingly. Where market values are not available, valuations are prepared using the income approach by considering the estimated cash flows expected from renting out the property based on existing lease terms and where appropriate, the ability to renegotiate the lease terms once the initial term or option term(s) expire plus the net proceeds from a sale of the property at the end of the investment horizon.

2013 Annual Report - Financial Review 75
The valuations of investment properties using the income approach include assumptions as to market rental rates for properties of similar size and condition located within the same geographical areas, recoverable operating costs for leases with tenants, non-recoverable operating costs, vacancy periods, tenant inducements and capitalization rates for the purposes of determining the estimated net proceeds from the sale of the property. At December 28, 2013, the pre-tax discount rates used in the valuations for investment properties ranged from 6.50% to 9.75% (December 29, 2012 – 6.0% to 9.75%) and the terminal capitalization rates ranged from 5.75% to 8.75% (December 29, 2012 – 5.75% to 8.75%).
For the year ended December 28, 2013, the Company recorded no impairment losses in operating income on investment properties (2012 - $1 million) as the carrying amounts of all impaired properties were lower than their recoverable amounts. The Company also recorded reversals of impairment losses on investment properties of $1 million (2012 – $4 million) in operating income where their fair values less costs to sell were greater than their carrying values.
Note 16. Goodwill and Intangible Assets
The following are continuities of the cost and accumulated amortization of goodwill and intangible assets for the years ended December 28, 2013 and December 29, 2012:
2013Indefinite Life Intangible
Assets and GoodwillDefinite Life
Intangible Assets
(millions of Canadian dollars) Goodwill
OtherIntangible
Assets
InternallyGeneratedIntangible
Assets
Other Intangible
Assets TotalCostBalance, beginning of year $ 1,932 $ 62 $ 20 $ 76 $ 2,090Additions — 9 — 3 12Write off of cost for fully amortized assets — — — (8) (8)Balance, end of year $ 1,932 $ 71 $ 20 $ 71 $ 2,094Accumulated amortization and impairment lossesBalance, beginning of year $ 989 $ — $ 14 $ 30 $ 1,033Amortization — — 5 10 15Write off of amortization for fully amortized assets — — — (8) (8)Balance, end of year $ 989 $ — $ 19 $ 32 $ 1,040Carrying amount as at: December 28, 2013 $ 943 $ 71 $ 1 $ 39 $ 1,054

Notes to the Consolidated Financial Statements
76 2013 Annual Report - Financial Review
2012Indefinite Life Intangible
Assets and GoodwillDefinite Life
Intangible Assets
(millions of Canadian dollars) Goodwill
OtherIntangible
Assets
InternallyGeneratedIntangible
Assets
Other Intangible
Assets TotalCostBalance, beginning of year $ 1,937 $ 51 $ 20 $ 43 $ 2,051Additions — 11 — 32 43Reclassification (5) — — 5 —Write off of cost for fully amortized assets — — — (4) (4)Balance, end of year $ 1,932 $ 62 $ 20 $ 76 $ 2,090Accumulated amortization and impairment lossesBalance, beginning of year $ 989 $ — $ 8 $ 25 $ 1,022Amortization — — 6 9 15Write off of amortization for fully amortized assets — — — (4) (4)Balance, end of year $ 989 $ — $ 14 $ 30 $ 1,033Carrying amount as at: December 29, 2012 $ 943 $ 62 $ 6 $ 46 $ 1,057
During 2013, the Company had $12 million (2012 – $43 million) of goodwill and intangible asset additions. During 2012, $31 million of goodwill and intangible asset additions related to the purchase of prescription files from 106 Zellers Inc. stores, which were classified as definite life intangible assets.
Indefinite Life Intangible Assets and Goodwill The carrying amount of goodwill attributed to each CGU grouping was as follows:
As at As at(millions of Canadian dollars) December 28, 2013 December 29, 2012Quebec region $ 700 $ 700T&T Supermarket Inc. 129 129All other 114 114Carrying amount of goodwill $ 943 $ 943
Indefinite life intangible assets are comprised of trademark, brand names and import purchase quota. The trademark and brand names are a result of the Company’s acquisition of T&T Supermarket Inc. The Company expects to renew the registration of the trademark, brand names and import purchase quota at each expiry date indefinitely, and expects these assets to generate economic benefit to perpetuity. As such, the Company assessed these intangibles to have indefinite useful life.
The Company completed its annual impairment tests for goodwill and indefinite life intangible assets and concluded that there was no impairment.
Key Assumptions The key assumptions used to calculate the fair value less costs to sell are those regarding discount rates, growth rates and expected changes in margins. These assumptions are considered to be Level 3 in the fair value hierarchy.
The weighted average cost of capital was determined to be in the range of 6.5% to 7.0% (December 29, 2012 – 6.5% to 7.0%) and is based on risk-free rate, equity risk premium adjusted for betas of comparable publicly traded companies, an unsystematic risk premium, after-tax cost of debt based on corporate bond yields and capital structure of the Company.
Cash flow projections have been discounted using a range of rates derived from the Company’s after-tax weighted average cost of capital adjusted for specific risks relating to each CGU. At December 28, 2013, the after-tax discount rates used in the recoverable amount calculations were approximately 9.5% (December 29, 2012 – 9.5%). The pre-tax discount rates ranged from 12.8% to 13.0% (December 29, 2012 – 12.8% to 13.0%).

2013 Annual Report - Financial Review 77
The Company included a minimum of five years of cash flows in its discounted cash flow model. The cash flow forecasts were extrapolated beyond the five year period using estimated long term growth rate of 2.0% (December 29, 2012 – 0.9% to 2.0%). The budgeted EBITDA(1) growth is based on the Company’s five year strategic plan approved by the Board.
Note 17. Interest in Other Entities
Subsidiaries
Loblaw Companies Limited is a holding company which carries on its business through its subsidiaries. The subsidiaries of the Company that carry on its principal business are: Loblaw Inc., a retail operations company incorporated in Ontario, President’s Choice Bank, a financial services company incorporated in Canada; Choice Properties, a trust formed in Ontario; and Choice Properties Limited Partnership, a limited partnership formed in Ontario. During 2013 and 2012, the Company owned, either directly or indirectly, 100% of the voting securities of its subsidiaries, other than Choice Properties, of which Loblaw held an 82.2% effective interest, and its subsidiaries, including Choice Properties Limited Partnership.
As at year end 2013, there were no significant restrictions on the ability to access or use assets and settle liabilities of the subsidiaries. In addition, there was no change in control of any subsidiary during 2013 and 2012.
Consolidated Structured Entities
Independent Funding Trusts Certain independent franchisees of the Company obtain financing through a structure involving independent funding trusts, which were created to provide loans to franchisees to facilitate their purchase of inventory and fixed assets, consisting mainly of fixtures and equipment. The Company provides a standby letter of credit for the benefit of the independent funding trust (see note 33).
Eagle Credit Card Trust® The Company, through PC Bank, participates in various securitization programs that provide the primary source of funds for the operation of its credit card business. Under these securitization programs, a portion of the total interest in credit card receivables is sold to third parties pursuant to co-ownership agreements that issue interest bearing securities. PC Bank participates in a single seller revolving co-ownership securitization program with Eagle and continues to service the credit card receivables on behalf of Eagle, but does not receive any fee for its servicing obligations and has a retained interest in the securitized receivables represented by the right to future cash flows after obligations to investors have been met.
Share-Based Compensation Trusts During the year, the Company established trusts to facilitate the purchase of shares for future settlement of each of the RSU and PSU plans upon vesting. The Company is the sponsor of the trust and has assigned Computershare as the trustee. The Company funds the purchase of shares for settlement and earns management fees from the trust.
Unconsolidated Structured Entities
Other Independent Securitization Trusts The Other Independent Securitization Trusts administer multi-seller, multi-asset securitization programs that acquire assets from various participants, including credit card receivables from PC Bank. These trusts are managed by major Canadian chartered banks. PC bank does not control the trusts through voting interests and does not exercise any control over the trusts' management, administration or assets. The activities of these trusts are conducted on behalf of the participants and each trust is a conduit through which funds are raised to purchase assets through the issue of senior and subordinated short term and medium term asset backed notes. The Company arranged standby letters of credit for the benefit of these trusts (see note 33).
(1) See Non-GAAP Financial Measures on page 40 of the Company’s Management’s Discussion & Analysis.

Notes to the Consolidated Financial Statements
78 2013 Annual Report - Financial Review
Note 18. Other Assets
As at As at(millions of Canadian dollars) December 28, 2013 December 29, 2012Fair value of cross currency swaps (note 30) $ — $ 98Sundry investments and other receivables 136 159Accrued benefit plan asset (note 27) 106 —Other 43 32Other assets $ 285 $ 289
Note 19. Short Term Debt
The outstanding short term debt balances relate to credit card receivables securitized to the Other Independent Securitization Trusts, excluding Eagle which is included in long term debt (see note 21). During 2013, PC Bank did not securitize any credit card receivables (2012 – nil).
During 2013, PC Bank repurchased $300 million (2012 – nil) of co-ownership interests in the securitized receivables from the Other Independent Securitization Trusts, and recorded a corresponding decrease to short term debt.
During 2013, PC Bank amended and extended the maturity date for one of its Other Independent Securitization Trust agreements from the third quarter of 2014 to the third quarter of 2015, with no material impact to other terms and conditions.
In addition to PC Bank’s securitized credit card receivables, the Other Independent Securitization Trusts’ recourse is limited to standby letters of credit arranged by the Company (see note 33).
Subsequent to the end of 2013, PC Bank extended the maturity date for two of its Other Independent Securitization Trust agreements from the second quarter of 2015 to the second quarter of 2016, with all other terms and conditions remaining substantially the same.
Note 20. Provisions
Provisions consist primarily of amounts recorded in respect of restructuring, self-insurance, commodity taxes, environmental and decommissioning liabilities and onerous lease arrangements. The following are continuities relating to the Company’s provisions:
(millions of Canadian dollars) 2013 2012Provisions, beginning of year $ 137 $ 85Additions 38 80Payments (43) (20)Reversals (10) (8)Provisions, end of year $ 122 $ 137
(millions of Canadian dollars) 2013 2012Recorded on the consolidated balance sheets as follows:
Current portion of provisions $ 66 $ 78Non-current portion of provisions 56 59
Total provisions $ 122 $ 137
During 2013, the Company announced the reduction of approximately 275 store-support positions. The Company recorded a charge of $32 million in operating income, reflecting the costs of the reductions. During 2012, the Company reduced a number of head office and administrative positions, affecting approximately 700 jobs and recorded a charge of $61 million in operating income to reflect the costs of these reductions, which included $6 million recorded in other liabilities. As at December 28, 2013, $39 million was included in provisions relating to these restructuring initiatives (2012 – $45 million).

2013 Annual Report - Financial Review 79
Note 21. Long Term Debt
As at As at(millions of Canadian dollars) December 28, 2013 December 29, 2012Loblaw Companies Limited Notes (a)5.40%, due 2013 $ — $ 2006.00%, due 2014 100 1004.85%, due 2014 350 3507.10%, due 2016 300 3005.22%, due 2020 350 3506.65%, due 2027 100 1006.45%, due 2028 200 2006.50%, due 2029 175 17511.40%, due 2031 Principal 151 151 Effect of coupon repurchase (67) (76)6.85%, due 2032 200 2006.54%, due 2033 200 2008.75%, due 2033 200 2006.05%, due 2034 200 2006.15%, due 2035 200 2005.90%, due 2036 300 3006.45%, due 2039 200 2007.00%, due 2040 150 1505.86%, due 2043 55 55Senior Unsecured Notes (b) 3.75%, due 2019 800 — 4.86%, due 2023 800 —US Private Placement Notes (c) 6.48%, due 2013 (USD $150 million) — 150 6.86%, due 2015 (USD $150 million) — 150Long Term Debt Secured by Mortgage
5.49%, due 2018 (note 14) 83 86Guaranteed Investment Certificates (d)
Due 2014 - 2018 (0.85% – 3.78%) 430 303Independent Securitization Trusts (e)
Eagle Credit Card Trust®, 2.88%, due 2013 — 250Eagle Credit Card Trust®, 3.58%, due 2015 350 350Eagle Credit Card Trust®, 2.91%, due 2018 400 —
Independent Funding Trusts (f) 475 459Finance Lease Obligations 388 366Choice Properties Series A 3.55%, due 2018 400 — Series B 4.90%, due 2023 200 —Transaction costs and other (10) —Total long term debt $ 7,680 $ 5,669Less amount due within one year 1,008 672Long Term Debt $ 6,672 $ 4,997

Notes to the Consolidated Financial Statements
80 2013 Annual Report - Financial Review
a) Loblaw Companies Limited Notes As at December 28, 2013, the Company recorded $450 million (December 29, 2012 – $200 million) of its Medium Term Notes as long term debt due within one year. During 2013, a $200 million 5.40% medium term note (“MTN”) due November 20, 2013 matured and was repaid.
b) Senior Unsecured Notes During 2013, the Company issued $1.6 billion aggregate principal amount of senior unsecured notes, consisting of $800 million of Senior Unsecured Notes, Series 2019 due March 12, 2019 (the “Series 2019 Notes”) and $800 million of Senior Unsecured Notes, Series 2023, due September 12, 2023 (the “Series 2023 Notes”). The Series 2019 Notes carry a coupon of 3.75% per annum and were issued at par and the Series 2023 Notes carry a coupon of 4.86% per annum and were issued at par. The net proceeds from the offering have been placed in escrow and will be released upon satisfaction of the applicable release conditions in connection with the Company’s agreement to acquire all of the outstanding common shares of Shoppers Drug Mart (see note 35).
c) Private Placement Notes During 2013, the Company settled its USD $300 million USPP notes and related cross currency swaps (see note 30). The Company incurred approximately $18 million of early-settlement costs related to the settlement of the USPP note due on May 29, 2015, which was recorded in net interest expense and other financing charges.
d) Guaranteed Investment Certificates The following table summarizes PC Bank's Guaranteed Investment Certificates (“GICs”) activity, before commissions, for 2013 and 2012:
(millions of Canadian dollars) 2013 2012Balance, beginning of year $ 303 $ 276GICs issued 167 76GICs matured (40) (49)Balance, end of year $ 430 $ 303
As at December 28, 2013, $52 million in GICs were recorded as long term debt due within one year (December 29, 2012 – $36 million).
e) Independent Securitization Trust The notes issued by Eagle are medium term notes, which are collateralized by PC Bank’s credit card receivables (see note 11). In 2013, Eagle issued $400 million of senior and subordinated term notes with a maturity date of October 17, 2018 at a weighted average interest rate of 2.91%, and repaid $250 million of senior and subordinated term notes which matured on December 17, 2013.
f) Independent Funding Trusts As at December 28, 2013, the independent funding trusts had drawn $475 million (December 29, 2012 – $459 million) from the revolving committed credit facility that is the source of funding to the independent funding trusts. The revolving committed credit facility matures on May 6, 2014 and has been recorded as long term debt due within one year.
The Company provides credit enhancement in the form of a standby letter of credit for the benefit of the independent funding trusts representing not less than 10% of the principal amount of the loans outstanding. As at December 28, 2013, the Company had provided a letter of credit in the amount of $48 million (December 29, 2012 – $48 million).
Committed Credit Facilities During 2013, the Company increased the $800 million committed credit facility (“Credit Facility”) amount to $1 billion, subject to the successful close of the Shoppers Drug Mart transaction, and extended the term to December 31, 2018. In connection with the Choice Properties IPO, the Company amended its Credit Facility agreement to include certain adjustments to exclude the impact of Choice Properties from the Company’s covenants (see note 25). As at December 28, 2013 and December 29, 2012, the Company had not drawn on its Credit Facility.
During 2013, Choice Properties entered into an agreement for a $500 million, 5 year senior unsecured committed credit facility (“Choice Properties Credit Facility”) provided by a syndicate of lenders. This facility contains certain financial covenants (see note 25) and accrues interest based on short term floating interest rates. As at December 28, 2013, Choice Properties had not drawn on the Choice Properties Credit Facility.
Subsequent to the end of the year, Choice Properties issued $250 million principal amount of Series C senior unsecured debentures with a 7-year term and a coupon rate of 3.498% per annum and $200 million principal amount of Series D senior unsecured debentures with a 10-year term and a coupon rate of 4.293% per annum, under its Short Form Base Shelf Prospectus.
Schedule of Repayments The schedule of repayment of long term debt, based on maturity is as follows: 2014 – $1,008 million; 2015 – $408 million; 2016 – $442 million; 2017 – $137 million; 2018 – $1,022 million; thereafter – $4,745 million. See note 30 for the fair value of long term debt.

2013 Annual Report - Financial Review 81
Note 22. Trust Unit Liability
As at December 28, 2013, 66,114,229 Choice Properties Units were held by unitholders other than the Company, including 114,229 Units issued during 2013 to eligible unitholders under a distribution reinvestment plan (“DRIP”) at a price of $10.05 per Unit, which resulted in a $1 million increase to the Trust Unit Liability. As at December 28, 2013, the fair value of the Trust Unit Liability of $688 million was recorded on the consolidated balance sheet. During 2013, the Company recorded a fair value loss of $27 million in net interest expense and other financing charges related to these Units (see note 6).
Note 23. Other Liabilities
As at As at(millions of Canadian dollars) December 28, 2013 December 29, 2012(1)
Net defined benefit plan obligation (note 27) $ 238 $ 529Other long term employee benefit obligation 107 116Deferred vendor allowances 16 24Equity-based compensation liability (note 26) 1 20Other 192 160Other liabilities $ 554 $ 849
Note 24. Share Capital
First Preferred Shares (authorized – 1.0 million shares) There were no non-voting First Preferred Shares outstanding at year end.
Second Preferred Shares, Series A (authorized – 12.0 million shares) The Company has outstanding 9.0 million 5.95% non-voting Second Preferred Shares, Series A, with a face value of $225 million, which were issued for net proceeds of $218 million, and entitle the holder to a fixed cumulative preferred cash dividend of $1.4875 per share per annum which, if declared, will be payable quarterly. These preferred shares which are presented as capital securities on the consolidated balance sheets are classified as other financial liabilities, and measured using the effective interest method.
On and after July 31, 2013, 2014 and 2015 the Company may, at its option, redeem for cash, in whole or in part, these outstanding preferred shares for $25.75, $25.50 and $25.00 respectively. On and after July 31, 2013, the Company may, at its option, convert these preferred shares into that number of common shares of the Company determined by dividing the then applicable redemption price, together with all accrued and unpaid dividends to but excluding the date of conversion, by the greater of $2.00 and 95% of the then current market price of the common shares. On and after July 31, 2015, these outstanding preferred shares are convertible, at the option of the holder, into that number of common shares of the Company determined by dividing $25.00, together with accrued and unpaid dividends to but excluding the date of conversion, by the greater of $2.00 and 95% of the then current market price of the common shares. This option is subject to the Company’s right to redeem the preferred shares for cash or arrange for their sale to substitute purchasers.
Common Shares (authorized – unlimited) Common shares issued are fully paid and have no par value. The activity in the common shares issued and outstanding during the year was as follows:
2013 2012Number of
CommonShares
CommonShare
CapitalNumber of
Common Shares
CommonShare
CapitalIssued and outstanding, beginning of period 281,680,157 $ 1,567 281,385,318 $ 1,540
Issued for settlement of stock options 2,131,416 90 718,544 29Purchased for cancellation (1,500,000) (9) (423,705) (2)
Issued and outstanding, end of period 282,311,573 $ 1,648 281,680,157 $ 1,567Shares held in trust (note 26) (1,067,323) $ (6) — $ —Issued and outstanding net of shares held in trust, end of
period 281,244,250 $ 1,642 281,680,157 $ 1,567Weighted average outstanding, net of shares held in trust 281,123,452 281,438,799
(1) Certain 2012 figures have been restated – see note 2.
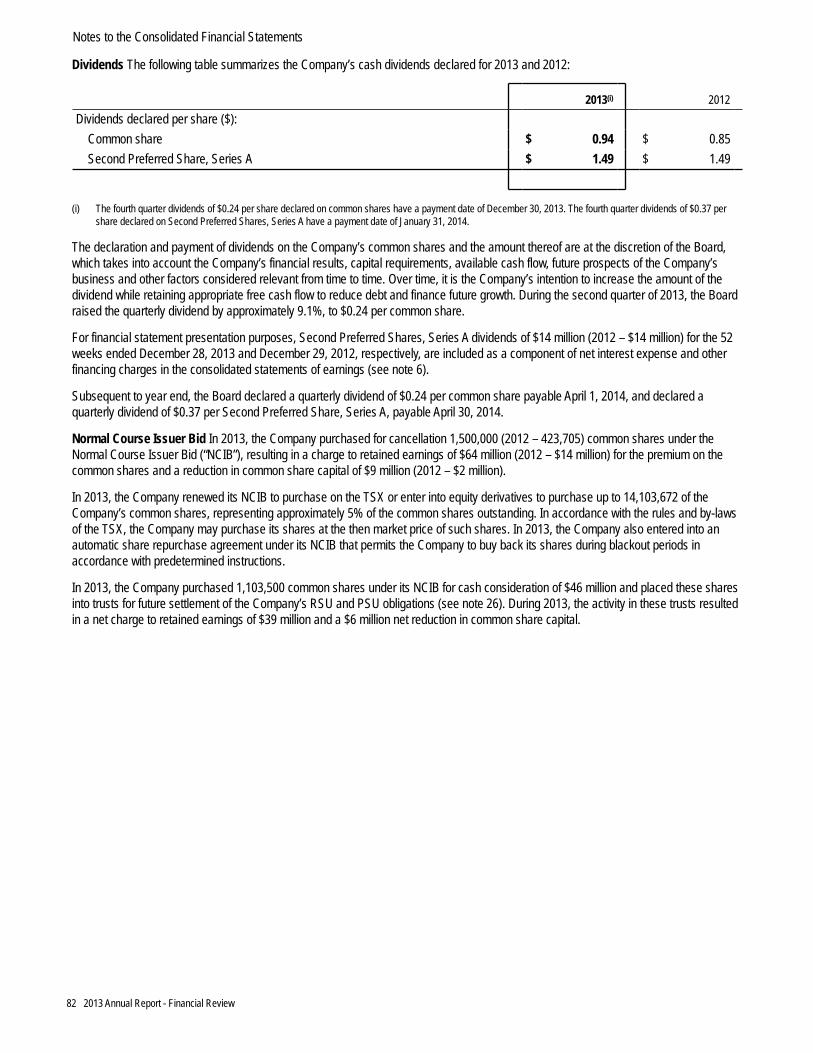
Notes to the Consolidated Financial Statements
82 2013 Annual Report - Financial Review
Dividends The following table summarizes the Company’s cash dividends declared for 2013 and 2012:
2013(i) 2012Dividends declared per share ($):
Common share $ 0.94 $ 0.85Second Preferred Share, Series A $ 1.49 $ 1.49
(i) The fourth quarter dividends of $0.24 per share declared on common shares have a payment date of December 30, 2013. The fourth quarter dividends of $0.37 per share declared on Second Preferred Shares, Series A have a payment date of January 31, 2014.
The declaration and payment of dividends on the Company’s common shares and the amount thereof are at the discretion of the Board, which takes into account the Company’s financial results, capital requirements, available cash flow, future prospects of the Company’s business and other factors considered relevant from time to time. Over time, it is the Company’s intention to increase the amount of the dividend while retaining appropriate free cash flow to reduce debt and finance future growth. During the second quarter of 2013, the Board raised the quarterly dividend by approximately 9.1%, to $0.24 per common share.
For financial statement presentation purposes, Second Preferred Shares, Series A dividends of $14 million (2012 – $14 million) for the 52 weeks ended December 28, 2013 and December 29, 2012, respectively, are included as a component of net interest expense and other financing charges in the consolidated statements of earnings (see note 6).
Subsequent to year end, the Board declared a quarterly dividend of $0.24 per common share payable April 1, 2014, and declared a quarterly dividend of $0.37 per Second Preferred Share, Series A, payable April 30, 2014.
Normal Course Issuer Bid In 2013, the Company purchased for cancellation 1,500,000 (2012 – 423,705) common shares under the Normal Course Issuer Bid (“NCIB”), resulting in a charge to retained earnings of $64 million (2012 – $14 million) for the premium on the common shares and a reduction in common share capital of $9 million (2012 – $2 million).
In 2013, the Company renewed its NCIB to purchase on the TSX or enter into equity derivatives to purchase up to 14,103,672 of the Company’s common shares, representing approximately 5% of the common shares outstanding. In accordance with the rules and by-laws of the TSX, the Company may purchase its shares at the then market price of such shares. In 2013, the Company also entered into an automatic share repurchase agreement under its NCIB that permits the Company to buy back its shares during blackout periods in accordance with predetermined instructions.
In 2013, the Company purchased 1,103,500 common shares under its NCIB for cash consideration of $46 million and placed these shares into trusts for future settlement of the Company’s RSU and PSU obligations (see note 26). During 2013, the activity in these trusts resulted in a net charge to retained earnings of $39 million and a $6 million net reduction in common share capital.

2013 Annual Report - Financial Review 83
Note 25. Capital Management
In order to manage its capital structure, the Company, among other activities, may adjust the amount of dividends paid to shareholders, purchase shares for cancellation pursuant to its NCIB, issue new shares or issue or repay long term debt with the objective of:
• ensuring sufficient liquidity is available to support its financial obligations and to execute its operating and strategic plans;• targeting a reduction in debt following the Shoppers Drug Mart transaction to return to credit rating metrics consistent with those of
investment grade companies; • maintaining financial capacity and flexibility through access to capital to support future development of the business;• minimizing the after-tax cost of its capital while taking into consideration current and future industry, market and economic risks and
conditions; and• utilizing short term funding sources to manage its working capital requirements and long term funding sources to manage the long
term capital expenditures of the business.
The Company has policies in place which govern debt financing plans and risk management strategies for liquidity, interest rates and foreign exchange. These policies outline measures and targets for managing capital, including a range for leverage consistent with the desired credit rating. Management and the Audit Committee regularly review the Company’s compliance with, and performance against, these policies. In addition, Management regularly reviews these policies to ensure they remain consistent with the risk tolerance acceptable to the Company.
As at December 28, 2013 and December 29, 2012, the items that the Company includes in its definition of capital were as follows:
As at As at(millions of Canadian dollars) December 28, 2013 December 29, 2012(1)
Short term debt $ 605 $ 905Long term debt due within one year 1,008 672Long term debt(2) 6,672 4,997Certain other liabilities 39 39Fair value of financial derivatives related to the above — 14Total debt $ 8,324 $ 6,627Capital securities 224 223Equity 7,018 6,419Total capital under management $ 15,566 $ 13,269
(1) Certain 2012 figures have been restated - see note 2.(2) Includes $1.6 billion aggregate principal amount of senior unsecured notes issued under the Company’s $2.5 billion Short Form Base Shelf Prospectus mentioned
below. The net proceeds from the offering were placed in escrow and classified as security deposits in the Company’s consolidated financial statements (see note 9).
During 2013, the Company amended its Short Form Base Shelf Prospectus dated December 21, 2012 to increase the amount to $2.5 billion from $1.0 billion.
During 2013, Eagle filed a Short Form Base Shelf Prospectus which allows for the potential issuance of up to $1.5 billion of notes over a 25-month period.
In addition, during 2013, Choice Properties filed a Short Form Base Shelf Prospectus allowing for the issuance, from time to time, of Units and debt securities having an aggregate offering price of up to $2 billion. This Short Form Base Shelf Prospectus is valid for a 25-month period.
Covenants and Regulatory Requirements The Company is subject to certain key financial and non-financial covenants under its existing Credit Facility, $3.5 billion term loan facility, certain MTNs, and letters of credit. These covenants, which include interest coverage and leverage ratios, as defined in the respective agreements, are measured by the Company on a quarterly basis to ensure compliance with these agreements. During 2013, in connection with the Choice Properties IPO, the Company amended the Credit Facility agreement to incorporate certain adjustments to exclude the impact of Choice Properties from the Company’s covenants. As at December 28, 2013 and throughout the year, the Company was in compliance with each of the covenants under these agreements.

Notes to the Consolidated Financial Statements
84 2013 Annual Report - Financial Review
Choice Properties has certain key financial and non-financial covenants in its Debentures and the Choice Properties Credit Facility. The key financial covenants include debt service ratios and leverage ratios, which are measured by Choice Properties on a quarterly basis to ensure compliance. As at December 28, 2013 and throughout the year, Choice Properties was in compliance with the covenants under these agreements.
The Company is subject to externally imposed capital requirements from the Office of the Superintendent of Financial Institutions (“OSFI”), the primary regulator of PC Bank. PC Bank’s capital management objectives are to maintain a consistently strong capital position while considering the economic risks generated by its credit card receivables portfolio and to meet all regulatory capital requirements as defined by OSFI. PC Bank is subject to the Basel III regulatory capital management framework which includes a common equity Tier 1 capital ratio of 3.5%, a Tier 1 capital ratio of 4.5% and a total capital ratio of 8%. In addition to the regulatory capital ratios requirement, financial institutions are expected to meet an assets to capital multiple test. PC Bank has met all applicable capital requirements and the assets to capital multiple test as at December 28, 2013. During 2012, PC Bank was subject to the Basel II regulatory capital management framework and met all applicable capital requirements as at December 29, 2012.
Note 26. Equity-Based Compensation
The Company’s net equity-based compensation expense recognized in selling, general and administrative expenses related to its stock option, RSU and PSU plans, net of any related equity forwards, and the unit option and restricted unit compensation plans of Choice Properties was:
(millions of Canadian dollars) 2013 2012Stock option plan expense $ 16 $ 18RSU and PSU plan expense 16 15Equity forwards income — (5)Net equity-based compensation expense(i) $ 32 $ 28
(i) The compensation expense related to the Choice Properties’ unit option and restricted unit plans was nominal (2012 – nil).
The carrying amount of the Company’s equity-based compensation arrangements including stock option, RSU, PSU, Director Deferred Share Unit, Executive Deferred Share Unit, and unit-based compensation plans of Choice Properties are recorded on the consolidated balance sheet as follows:
As at As at(millions of Canadian dollars) December 28, 2013 December 29, 2012Trade payables and other liabilities $ — $ 11Other liabilities 1 20Contributed surplus 87 55
The following are details related to the equity-based compensation plans of the Company:
Stock Option Plan The Company maintains a stock option plan for certain employees. Under this plan, the Company may grant options for up to 28.1 million common shares which is the Company’s guideline for the number of stock option grants.
At the Company’s Annual and Special Meeting of Shareholders on May 3, 2012, the shareholders approved an amendment to the Company’s employee stock option plan that increased the total number of common shares authorized for issuance under the plan by 14,428,484 to 28,137,162 common shares. This amendment increased the Company’s number of common shares authorized for issuance under the stock option plan from 5% to 10% of the total issued and outstanding common shares.

2013 Annual Report - Financial Review 85
The following is a summary of the Company’s stock option plan activity:
2013 2012
Options(number of
shares)
WeightedAverage Exercise
Price / Share
Options(number of
shares)
WeightedAverage Exercise
Price / ShareOutstanding options, beginning of year 12,538,928 $ 36.74 10,750,993 $ 38.90Granted 1,484,264 40.62 4,605,970 34.91Exercised (2,131,416) 35.25 (718,544) 31.00Forfeited/cancelled (847,039) 38.03 (1,506,608) 36.74Expired (48,742) 54.71 (592,883) 68.64Outstanding options, end of year 10,995,995 $ 37.37 12,538,928 $ 36.74Options exercisable, end of year 4,200,472 $ 38.04 4,120,017 $ 38.72
2013 Outstanding Options 2013 Exercisable Options
Range of Exercise Prices
Number ofOptions
Outstanding
Weighted Average
Remaining ContractualLife (years)
Weighted Average
ExercisePrice/Share
Number ofExercisable
Options
Weighted AverageExercise
Price/Share$28.95 - $35.55 4,984,391 4 $ 33.63 1,662,506 $ 31.70$35.56 - $39.92 3,475,944 4 $ 38.07 1,387,094 $ 37.80$39.93 - $50.79 2,535,660 3 $ 43.75 1,150,872 $ 47.47
10,995,995 4,200,472
During 2013, the Company issued common shares on the exercise of stock options with a weighted average share price of $46.54 (2012 – $36.90) and received cash consideration of $75 million (2012 – $22 million).
The fair value of stock options granted during 2013 was $11 million (2012 – $27 million). The assumptions used to measure the fair value of options granted during 2013 and 2012 under the Black-Scholes valuation model at the grant date were as follows:
2013 2012Expected dividend yield 2.1% 2.4% – 2.7%Expected share price volatility 19.2% – 23.8% 21.1% – 24.8%Risk-free interest rate 1.2% – 2.0% 1.3% – 1.6%Expected life of options 4.2 – 6.5 years 4.2 – 6.5 years
Estimated forfeiture rates are incorporated into the measurement of stock option plan expense. The forfeiture rate applied as at December 28, 2013 was 12.0% (December 29, 2012 – 15.0%).

Notes to the Consolidated Financial Statements
86 2013 Annual Report - Financial Review
Equity Forward Contracts The following is a summary of the Company’s equity forward contracts:
As at As atDecember 28, 2013 December 29, 2012
Outstanding contracts (in millions) — 1.1Average forward price per share ($) $ — $ 56.59Interest expense per share ($) $ — $ 0.16Unrealized market loss recorded in trade payables and other liabilities (millions of Canadian
dollars) $ — $ 16
During 2013, Glenhuron Bank Limited (“Glenhuron”) paid $16 million to settle its remaining equity forward contract representing 1,103,500 Loblaw common shares.
Restricted Share Unit Plan The following is a summary of the Company’s RSU plan activity:
(Number of Awards) 2013 2012RSUs, beginning of year 1,038,271 1,119,496Granted 379,899 379,746Settled (273,937) (382,871)Forfeited (59,719) (78,100)RSUs, end of year 1,084,514 1,038,271RSUs settled (millions of Canadian dollars) $ 10 $ 13
The fair value of RSUs granted during 2013 was $15 million (2012 – $15 million).
Performance Share Unit Plan The following is a summary of the Company’s PSU plan activity:
(Number of Awards) 2013 2012PSUs, beginning of year 50,818 —Granted 283,569 50,818Settled (2,794) —Forfeited/cancelled (22,483) —PSUs, end of year 309,110 50,818
The fair value of PSUs granted during 2013 was $11 million (2012 – $2 million).
During 2013, the Company established a trust for each of the RSU and PSU plans to facilitate the purchase of shares for future settlement upon vesting. During 2013, the Company settled 276,731 RSUs and PSUs, of which 36,177 units were settled in shares through the trusts, resulting in a nominal increase to share capital and a $1 million increase to retained earnings.
Director Deferred Share Unit Plan The following is a summary of the Company’s DSU plan activity:
(Number of Awards) 2013 2012DSUs outstanding, beginning of year 198,780 158,017Granted 24,582 36,570Reinvested 3,239 4,193DSUs outstanding, end of year 226,601 198,780
A compensation cost of $2 million (2012 – $1 million) related to this plan was recognized in operating income. The fair value of DSU’s granted during 2013 was $1 million (2012 – $1 million).

2013 Annual Report - Financial Review 87
Executive Deferred Share Unit Plan The following is a summary of the Company’s EDSU plan activity:
(Number of Awards) 2013 2012EDSUs outstanding, beginning of year 26,707 43,928Granted 2,606 3,553Reinvested 421 1,007Settled (7,608) (21,781)EDSUs outstanding, end of year 22,126 26,707
A nominal compensation cost (2012 – nominal) related to this plan was recognized in operating income. The fair value of EDSU’s granted during 2013 was nominal (2012 – nominal).
During 2013, the Company’s RSU, PSU, DSU and EDSU plans were amended to require settlement in shares rather than in cash. As a result, $22 million previously recorded at fair value in trade payables and other liabilities was reclassified to contributed surplus.
The following are details related to the unit-based compensation plans of Choice Properties:
Unit Option Plan Choice Properties maintains a Unit Option plan for certain employees. Under this plan, Choice Properties may grant options totaling up to 4,075,000 Units.
The following is a summary of Choice Properties' Unit Option plan activity:
2013(1)
Number of optionsWeighted Average
Exercise Price/UnitOutstanding options, beginning of period — $ —Granted 1,196,866 10.04Outstanding options, end of period 1,196,866 $ 10.04Options exercisable, end of period — $ —
The assumptions used to measure the fair value of the options under the Black-Scholes model at December 28, 2013 were as follows:
2013(1)
Expected average distribution yield 6.2%Expected average unit price volatility 19.0% – 30.2%Average risk-free interest rate 1.6% – 2.0%Expected average life of options 4.0 – 5.5 years
Estimated forfeiture rates are incorporated into the measurement of the unit option expense. The forfeiture rate applied as at December 28, 2013 was nil.
Restricted Unit Plan The following is a summary of Choice Properties' RU plan activity:
(Number of awards) 2013(1)
RUs, beginning of period —Granted 105,948Reinvested 2,798RUs, end of period 108,746
There were no RUs vested as at December 28, 2013.
(1) Results are for the period ended December 31, 2013, consistent with Choice Properties’ fiscal calendar. Adjustments to December 28, 2013 are included in Consolidation and Eliminations.

Notes to the Consolidated Financial Statements
88 2013 Annual Report - Financial Review
Trustee Deferred Unit Plan The following is a summary of Choice Properties’ DU plan activity:
(Number of awards) 2013(1)
DUs outstanding, beginning of period —Granted 31,758Reinvested 178DUs outstanding, end of period 31,936
A nominal compensation cost related to this plan was recognized in operating income. As at December 28, 2013, the intrinsic value of DUs was nominal.
Note 27. Post-Employment and Other Long Term Employee Benefits
The Company sponsors a number of pension plans, including registered defined benefit pension plans, registered defined contribution pension plans and supplemental unfunded arrangements providing pension benefits in excess of statutory limits. Certain obligations of the Company under these supplemental pension arrangements are secured by a standby letter of credit issued by a major Canadian chartered bank.
The Company’s Pension Committee (“The Committee”) oversees the Company’s pension plans. The Committee is responsible for assisting the Board in fulfilling its general oversight responsibilities for the plans. The Committee assists the Board with administration of the plans, pension investment and monitoring responsibilities, and compliance with legal and regulatory requirements.
The Company's defined benefit pension plans are primarily funded by the Company, predominantly non-contributory and the benefits are, in general, based on career average earnings subject to limits. The funding is based on a solvency valuation for which the assumptions may differ from the assumptions used for accounting purposes as detailed in this note.
The Company also offers certain other defined benefit plans other than pension plans. These other defined benefit plans are generally not funded, are mainly non-contributory and include health care, life insurance and dental benefits. Employees eligible for these other defined benefits are those who retire at certain ages having met certain service requirements. The majority of other defined benefit plans for current and future retirees include a limit on the total benefits payable by the Company.
The Company’s defined benefit pension plans and other defined benefit plans expose it to a number of actuarial risks, such as longevity risk, interest rate risk and market risk.
In Canada, the Company also has a national defined contribution plan for salaried employees. All newly hired salaried employees are only eligible to participate in this defined contribution plan.
The Company also contributes to various multi-employer pension plans, which are administered by independent boards of trustees generally consisting of an equal number of union and employer representatives. The Company's responsibility to make contributions to these plans is limited by amounts established pursuant to its collective agreements.
The Company expects to make contributions in 2014 to its defined benefit and defined contribution plans and the multi-employer pension plans in which it participates as well as benefit payments to the beneficiaries of the supplemental unfunded defined benefit pension plans, other defined benefit plans and other long term employee benefit plans.
Other Long Term Employee Benefits
The Company offers other long term employee benefit plans that include long term disability benefits and continuation of health care and dental benefits while on disability.
(1) Results are for the period ended December 31, 2013, consistent with Choice Properties’ fiscal calendar. Adjustments to December 28, 2013 are included in Consolidation and Eliminations.

2013 Annual Report - Financial Review 89
Defined Benefit Pension Plans and Other Defined Benefit Plans
Information on the Company’s defined benefit pension plans and other defined benefit plans, in aggregate, is summarized as follows:
2013 2012(1)
Defined Benefit
Pension Plans
OtherDefined Benefit
Plans
Defined Benefit
Pension Plans
Other Defined Benefit
PlansPresent value of funded obligations $ (1,597) $ — $ (1,736) $ —Fair value of plan assets 1,709 — 1,532 —Status of funded surplus/(obligations) $ 112 $ — $ (204) $ —Present value of unfunded obligations (71) (167) (75) (247)Total funded status of surplus/(obligations) $ 41 $ (167) $ (279) $ (247)Liability arising from minimum funding requirement for past
service (6) — (3) —Total net defined benefit plan surplus/(obligation) $ 35 $ (167) $ (282) $ (247)Recorded on the consolidated balance sheets as follows:
Other assets (note 18) $ 106 $ — $ — $ —Other liabilities (note 23) (71) (167) (282) (247)
(1) Certain 2012 figures have been restated – see note 2.

Notes to the Consolidated Financial Statements
90 2013 Annual Report - Financial Review
The following are the continuities of the fair value of plan assets and the present value of the defined benefit plan obligations:
2013 2012
DefinedBenefit
PensionPlans
Other DefinedBenefit
Plans Total
DefinedBenefit
PensionPlans
Other Defined Benefit
Plans TotalChanges in the fair value of plan assetsFair value, beginning of year $ 1,532 $ — $ 1,532 $ 1,330 $ — $ 1,330Employer contributions 99 — 99 150 — 150Employee contributions 2 — 2 2 — 2Benefits paid (82) — (82) (84) — (84)Interest Income 62 — 62 59 — 59Actuarial gains in other comprehensive income/
(loss) 101 — 101 79 — 79Other (5) — (5) (4) — (4)Fair value, end of year $ 1,709 $ — $ 1,709 $ 1,532 $ — $ 1,532Changes in the present value of the defined
benefit plan obligationsBalance, beginning of year $ 1,811 $ 247 $ 2,058 $ 1,685 $ 221 $ 1,906Current service cost 52 9 61 55 14 69Interest cost 72 9 81 73 10 83Benefits paid (86) (6) (92) (88) (6) (94)Employee contributions 2 — 2 2 — 2Actuarial (gains)/losses in other comprehensive
income/(loss) (159) (62) (221) 77 8 85Plan amendments (28) (23) (51) — — —Contractual termination benefits(i) 2 — 2 4 — 4Special termination benefits(i) — — — 3 — 3Other 2 (7) (5) — — —Balance, end of year $ 1,668 $ 167 $ 1,835 $ 1,811 $ 247 $ 2,058
(i) Contractual and special termination benefits include $2 million (2012 – $6 million) related to the reduction of head office and administrative positions.
For the fiscal year ended 2013, the actual return on plan assets was $163 million (2012 – $138 million).
The net defined benefit obligation can be allocated to the plans’ participants as follows:
• Active plan participants 46% (2012 – 48%)• Deferred plan participants 12% (2012 – 11%)• Retirees 42% (2012 – 41%)
During 2014, the Company expects to contribute approximately $50 million (2013 – contributed $99 million) to its registered defined benefit pension plans. The actual amount paid may vary from the estimate based on actuarial valuations being completed, investment performance, volatility in discount rates, regulatory requirements and other factors.

2013 Annual Report - Financial Review 91
The net cost recognized in net earnings before income taxes for the Company’s defined benefit pension plans and other defined benefit plans was as follows:
2013 2012
DefinedBenefit
PensionPlans
Other DefinedBenefit
Plans Total
DefinedBenefit
PensionPlans
Other Defined Benefit
Plans TotalCurrent service cost $ 52 $ 9 $ 61 $ 55 $ 14 $ 69Interest cost on net defined benefit plan obligations 10 9 19 14 10 24Contractual and special termination benefits(i) 2 — 2 7 — 7Past service cost(ii) (28) (23) (51) — — —Other 7 (3) 4 4 — 4Net post-employment defined benefit cost $ 43 $ (8) $ 35 $ 80 $ 24 $ 104
(i) Includes $2 million (2012 – $6 million) of contractual and special termination benefits related to the reduction in head office and administrative positions (see note 20). (ii) Relates to the announced amendments to certain of the Company’s defined benefit plans impacting certain employees retiring after January 1, 2015.
The actuarial (gains)/losses recognized in other comprehensive income/(loss) net of taxes for defined benefit plans was as follows:
2013 2012
DefinedBenefit
PensionPlans
Other DefinedBenefit
Plans Total
DefinedBenefit
PensionPlans
Other Defined Benefit
Plans TotalReturn on plan assets, excluding amounts included
in net interest expense and other financing $ (101) $ — $ (101) $ (79) $ — $ (79)Experience adjustments (10) (51) (61) 4 (1) 3Actuarial losses from change in demographic
assumptions 70 4 74 — 9 9Actuarial (gains)/losses from change in financial
assumptions (219) (15) (234) 73 — 73Change in liability arising from minimum funding
requirements for past service 3 — 3 3 — 3Total net actuarial (gains)/losses recognized in other
comprehensive income/(loss) before income taxes $ (257) $ (62) $ (319) $ 1 $ 8 $ 9Income tax expenses/(recoveries) on actuarial
(gains)/losses (note 7) 68 17 85 (1) (2) (3)Actuarial (gains)/losses net of income tax recoveries $ (189) $ (45) $ (234) $ — $ 6 $ 6
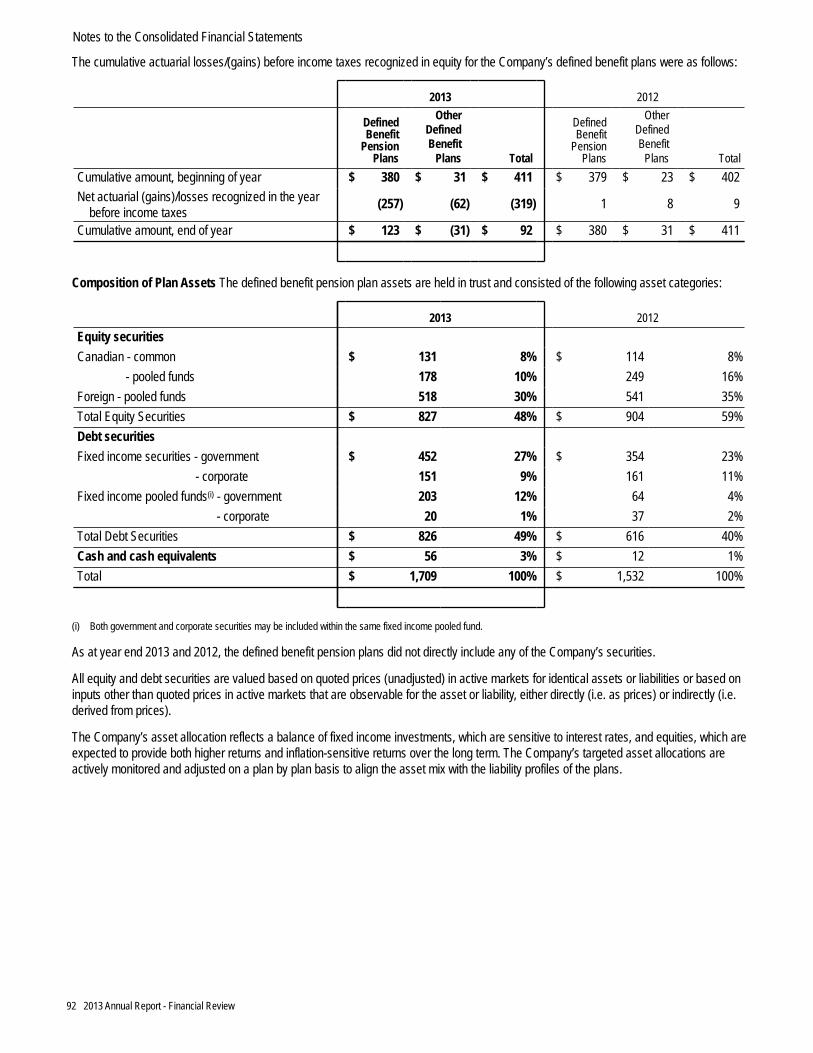
Notes to the Consolidated Financial Statements
92 2013 Annual Report - Financial Review
The cumulative actuarial losses/(gains) before income taxes recognized in equity for the Company’s defined benefit plans were as follows:
2013 2012
DefinedBenefit
PensionPlans
Other DefinedBenefit
Plans Total
DefinedBenefit
PensionPlans
Other Defined Benefit
Plans TotalCumulative amount, beginning of year $ 380 $ 31 $ 411 $ 379 $ 23 $ 402Net actuarial (gains)/losses recognized in the year
before income taxes (257) (62) (319) 1 8 9
Cumulative amount, end of year $ 123 $ (31) $ 92 $ 380 $ 31 $ 411
Composition of Plan Assets The defined benefit pension plan assets are held in trust and consisted of the following asset categories:
2013 2012Equity securitiesCanadian - common $ 131 8% $ 114 8% - pooled funds 178 10% 249 16%Foreign - pooled funds 518 30% 541 35%Total Equity Securities $ 827 48% $ 904 59%Debt securitiesFixed income securities - government $ 452 27% $ 354 23% - corporate 151 9% 161 11%Fixed income pooled funds(i) - government 203 12% 64 4% - corporate 20 1% 37 2%Total Debt Securities $ 826 49% $ 616 40%Cash and cash equivalents $ 56 3% $ 12 1%Total $ 1,709 100% $ 1,532 100%
(i) Both government and corporate securities may be included within the same fixed income pooled fund.
As at year end 2013 and 2012, the defined benefit pension plans did not directly include any of the Company’s securities.
All equity and debt securities are valued based on quoted prices (unadjusted) in active markets for identical assets or liabilities or based on inputs other than quoted prices in active markets that are observable for the asset or liability, either directly (i.e. as prices) or indirectly (i.e. derived from prices).
The Company’s asset allocation reflects a balance of fixed income investments, which are sensitive to interest rates, and equities, which are expected to provide both higher returns and inflation-sensitive returns over the long term. The Company’s targeted asset allocations are actively monitored and adjusted on a plan by plan basis to align the asset mix with the liability profiles of the plans.

2013 Annual Report - Financial Review 93
Principal Actuarial Assumptions The principal actuarial assumptions used in calculating the Company’s defined benefit plan obligations and net defined benefit plan cost for the year were as follows (expressed as weighted averages):
2013 2012
DefinedBenefit
PensionPlans
OtherDefinedBenefit
Plans
DefinedBenefit
PensionPlans
Other DefinedBenefit Plans
Defined Benefit Plan ObligationsDiscount rate 4.75% 4.50% 4.00% 4.00%Rate of compensation increase 3.50% n/a 3.50% n/a
Mortality table
CPM-RPP2014PrivGenerational
CPM-RPP2014PrivGenerational
UP94@FullyGenerational
UP94@FullyGenerational
Net Defined Benefit Plan CostDiscount rate 4.00% 4.00% 4.25% 4.25%Rate of compensation increase 3.50% n/a 3.50% n/a
Mortality tableUP94@Fully
GenerationalUP94@Fully
GenerationalUP94@FullyGenerational
UP94@FullyGenerational
n/a - not applicable
The weighted average duration of the defined benefit obligation at the end of the reporting period is 16.2 years (2012 – 16.2 years).
The growth rate of health care costs, primarily drug and other medical costs, for the other defined benefit plan obligations as at year end 2013 was estimated at 4.00% and is assumed to increase to 4.50% by year-end 2014, remaining at that level thereafter.
Sensitivity of Key Actuarial Assumptions The following table outlines the key assumptions for 2013 (expressed as weighted averages) and the sensitivity of a 1% change in each of these assumptions on the defined benefit plan obligations and the net defined benefit plan cost.
The sensitivity analysis provided in the table is hypothetical and should be used with caution. The sensitivities of each key assumption have been calculated independently of any changes in other key assumptions. Actual experience may result in changes in a number of key assumptions simultaneously. Changes in one factor may result in changes in another, which could amplify or reduce the impact of such assumptions.
Defined Benefit Pension Plans Other Defined Benefit Plans
Increase (Decrease)
DefinedBenefit
Plan Obligations
NetDefinedBenefit
Plan Cost(i)
DefinedBenefit
PlanObligations
Net DefinedBenefit
Plan Cost(i)
Discount rate 4.75% 4.00% 4.50% 4.00%Impact of:1% increase $ (251) $ (22) $ (20) $ (1)1% decrease $ 297 $ 24 $ 25 $ 1Expected growth rate of health care costs 4.00% 5.75%Impact of:1% increase n/a n/a $ 19 $ 21% decrease n/a n/a $ (16) $ (2)
n/a - not applicable(i) Discount rate and expected growth rate of health care costs sensitivity is for current service and interest costs only.

Notes to the Consolidated Financial Statements
94 2013 Annual Report - Financial Review
Multi-Employer Pension Plans
During the year ended December 28, 2013, the Company recognized an expense of $55 million (2012 - $53 million) in operating income, which represents the contributions made in connection with multi-employer pension plans. During 2014, the Company expects to continue to make contributions into these multi-employer pension plans.
The Company, together with its independent franchises, is the largest participating employer in the Canadian Commercial Workers Industry Pension Plan (“CCWIPP”), with approximately 53,000 (2012 – 54,000) employees as members. Included in the 2013 expense described above are contributions of $54 million (2012 – $52 million) to CCWIPP.
Post-Employment and Other Long Term Employee Benefit Costs
The net cost recognized in net earnings before income taxes for the Company’s post-employment and other long term employee benefit plans was as follows:
2013 2012Net post-employment defined benefit cost $ 35 $ 104Defined contribution costs(i) 20 18Multi-employer pension plan costs(ii) 55 53Total net post-employment benefit costs $ 110 $ 175Other long term employee benefit costs(iii) 21 27Net post-employment and other long term employee benefit costs $ 131 $ 202Recorded on the consolidated statements of earnings as follows:Selling, general and administrative expenses $ 108 $ 174Net interest expense and other financing charges 23 28Net post-employment and other long term employee benefit costs $ 131 $ 202
(i) Amounts represent the Company’s contributions made in connection with defined contribution plans. (ii) Amounts represent the Company's contributions made in connection with multi-employer pension plans. (iii) Other long term employee benefit costs include $4 million (2012 – $4 million) of net interest expense and other financing charges.

2013 Annual Report - Financial Review 95
Note 28. Employee Costs
Included in operating income are the following employee costs:
(millions of Canadian dollars) 2013 2012(1)
Wages, salaries and other short term employment benefits $ 3,042 $ 3,002Post-employment benefits 91 151Other long term employee benefits 17 23Share-based compensation 32 33Capitalized to fixed assets (10) (24)Employee costs $ 3,172 $ 3,185
Note 29. Leases
The Company leases certain of its retail stores, distribution centres, corporate offices, and other assets under operating or finance lease arrangements. Substantially all of the retail store leases have renewal options for additional terms. The contingent rents under certain of the retail store leases are based on a percentage of retail sales. The Company also has properties which are subleased to third parties.
Determining whether a lease arrangement is classified as finance or operating requires judgment with respect to the fair value of the leased asset, the economic life of the lease, the discount rate and the allocation of leasehold interests between the land and building elements of property leases.
Operating Leases – As Lessee Future minimum lease payments relating to the Company’s operating leases are as follows:
Payments due by yearAs at As at
December 28, 2013 December 29, 2012(millions of Canadian dollars) 2014 2015 2016 2017 2018 Thereafter Total Total
Operating lease payments $ 204 $ 186 $ 156 $ 129 $ 106 $ 443 $ 1,224 $ 1,231Sub-lease income (48) (35) (24) (16) (10) (33) (166) (145)Net operating lease payments $ 156 $ 151 $ 132 $ 113 $ 96 $ 410 $ 1,058 $ 1,086
During 2013, the Company recorded $206 million (2012 – $197 million) as an expense in operating income in respect of operating leases. During that period, contingent rent recognized as an expense in respect of operating leases totaled $1 million (2012 – $1 million), while sub-lease income earned totaled $50 million (2012 – $48 million) which is recognized in operating income. Contingent rent is based on store performance measured against specified thresholds.
Operating Leases – As Lessor As at December 28, 2013, the Company leased certain owned land and buildings with a cost of $2,076 million (December 29, 2012 – $2,037 million) and related accumulated depreciation of $562 million (December 29, 2012 – $539 million). For the year ended December 28, 2013, rental income was $136 million (2012 – $132 million) and contingent rent was $2 million (2012 – $2 million), both of which were recognized in operating income. Contingent rent is based on store performance measured against specified thresholds.
Payments to be received by yearAs at As at
December 28, 2013 December 29, 2012(millions of Canadian dollars) 2014 2015 2016 2017 2018 Thereafter Total Total
Net operating lease income $ 133 $ 114 $ 92 $ 69 $ 45 $ 106 $ 559 $ 520
(1) Certain 2012 figures have been restated – see note 2.

Notes to the Consolidated Financial Statements
96 2013 Annual Report - Financial Review
Finance Leases – As Lessee Future minimum lease payments relating to the Company’s finance leases are as follows:
Payments due by yearAs at As at
December 28, 2013 December 29, 2012(millions of Canadian dollars) 2014 2015 2016 2017 2018 Thereafter Total Total
Finance lease payments $ 54 $ 52 $ 52 $ 47 $ 40 $ 526 $ 771 $ 755Less future finance charges (27) (26) (24) (23) (21) (262) (383) (389)Present value of minimum
lease payments $ 27 $ 26 $ 28 $ 24 $ 19 $ 264 $ 388 $ 366
During 2013, contingent rent recognized by the Company as an expense in respect of finance leases was $1 million (2012 - $1 million).
Future sub-lease income relating to the Company’s sub-lease agreements are as follows:
Payments to be received by yearAs at As at
December 28, 2013 December 29, 2012(millions of Canadian dollars) 2014 2015 2016 2017 2018 Thereafter Total Total
Sub-lease income $ (14) $ (11) $ (8) $ (6) $ (2) $ (4) $ (45) $ (57)
At December 28, 2013, the sub-lease payments receivable under finance leases was $14 million (December 29, 2012 – $16 million).

2013 Annual Report - Financial Review 97
Note 30. Financial Instruments
The following table provides a comparison of the carrying and fair values for each classification of financial instruments as at December 28, 2013:
As at December 28, 2013
(millions of Canadian dollars)
Financialinstruments
required to beclassified as
fair valuethrough
profit or loss
Financialinstrumentsdesignated
as fair valuethrough
profit or loss
Loans andreceivables(amortized
cost)
Other financialliabilities
(amortized cost)
Total carryingamount
Totalfair value
Cash and cash equivalents $ — $ 2,260 $ — $ — $ 2,260 $ 2,260Short term investments — 290 — — 290 290Security deposits — 1,701 — — 1,701 1,701Accounts receivable — — 618 — 618 618Credit card receivables — — 2,538 — 2,538 2,538Derivatives included in prepaid
expenses and other assets 2 — — — 2 2Franchise Loans Receivable — — 375 — 375 375Certain other assets — — 67 — 67 67Total financial assets $ 2 $ 4,251 $ 3,598 $ — $ 7,851 $ 7,851Trade payables and other liabilities $ — $ — $ — $ 3,793 $ 3,793 $ 3,793Derivatives included in trade payables
and other liabilities 4 — — — 4 4Short term debt — — — 605 605 605Long term debt — — — 7,680 7,680 8,188Trust Unit Liability 688 — — — 688 688Capital Securities — — — 224 224 236Certain other liabilities — — — 40 40 40Total financial liabilities $ 692 $ — $ — $ 12,342 $ 13,034 $ 13,554
The following table presents the fair value hierarchy of financial assets and financial liabilities, excluding those classified as amortized cost that are short term in nature, as at December 28, 2013.
(millions of Canadian dollars) Level 1 Level 2 Level 3 Total fair valueFinancial assets
Classified as fair value through profit or loss $ — $ 2 $ — $ 2Designated as fair value through profit or loss $ 617 $ 3,634 $ — $ 4,251Loans and receivables (amortized cost) — 8 434 442
Financial liabilitiesClassified as fair value through profit or loss $ 688 $ — $ 4 $ 692Other financial liabilities (amortized cost) 236 8,188 40 8,464

Notes to the Consolidated Financial Statements
98 2013 Annual Report - Financial Review
The following table provides a comparison of the carrying and fair values for each classification of financial instruments as at December 29, 2012:
As at December 29, 2012
(millions of Canadian dollars)
Financialinstruments
required to beclassified as
fair valuethrough
profit or loss
Financialinstruments
designated asfair value
through profitor loss
Loans andreceivables(amortized
cost)
Other financialliabilities
(amortized cost)
Total carryingamount
Totalfair value
Cash and cash equivalents $ — $ 1,079 $ — $ — $ 1,079 $ 1,079Short term investments — 716 — — 716 716Security deposits — 252 — — 252 252Accounts receivable — — 456 — 456 456Credit card receivables — — 2,305 — 2,305 2,305Derivatives included in prepaid expenses
and other assets — — — — — —Franchise Loans Receivable — — 363 — 363 363Derivatives included in other assets 120 — — — 120 120Certain other assets — — 75 — 75 75Total financial assets $ 120 $ 2,047 $ 3,199 $ — $ 5,366 $ 5,366Trade payables and other liabilities $ — $ — $ — $ 3,698 $ 3,698 $ 3,698Derivatives included in trade payables and
other liabilities 22 — — — 22 22Short term debt — — — 905 905 905Long term debt — — — 5,669 5,669 6,542Capital Securities — — — 223 223 243Certain other liabilities — — — 44 44 44Total financial liabilities $ 22 $ — $ — $ 10,539 $ 10,561 $ 11,454
The following table presents the fair value hierarchy of financial assets and financial liabilities, excluding those classified as amortized cost that are short term in nature, as at December 29, 2012.
(millions of Canadian dollars) Level 1 Level 2 Level 3 Total fair valueFinancial assets
Classified as fair value through profit or loss $ — $ 120 $ — $ 120Designated as fair value through profit or loss 275 1,772 — 2,047Loans and receivables (amortized cost) — 11 427 438
Financial liabilitiesClassified as fair value through profit or loss $ — $ 21 $ 1 $ 22Other financial liabilities (amortized cost) 243 6,542 44 6,829
There were no transfers between levels of the fair value hierarchy in 2012 or 2013.
The level 3 financial instruments classified as fair value through profit or loss as at December 28, 2013 and December 29, 2012 consist of embedded derivatives on purchase orders placed in neither Canadian dollars, nor the functional currency of the vendor. These derivatives are valued using a market approach based on the differential in exchange rates and timing of settlement. The significant unobservable input used in the fair value measurement is the cost of purchase orders. Significant increases (decreases) in any of the inputs would result in a significantly higher (lower) fair value measurement.
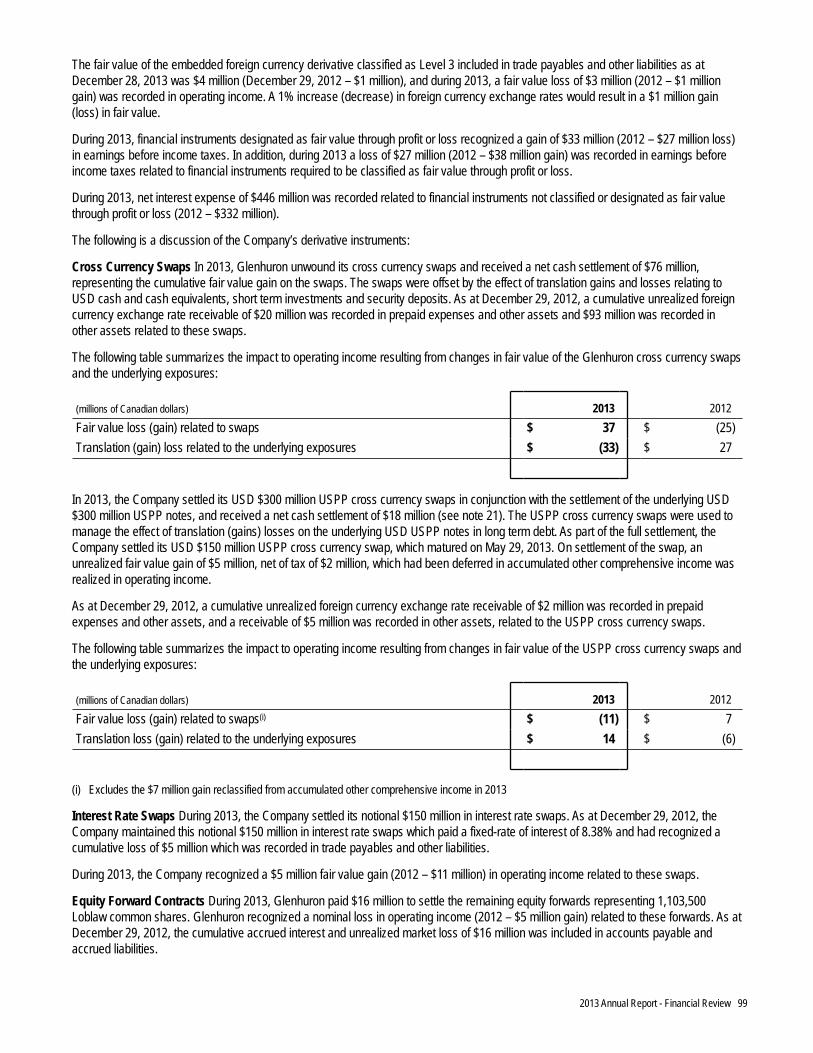
2013 Annual Report - Financial Review 99
The fair value of the embedded foreign currency derivative classified as Level 3 included in trade payables and other liabilities as at December 28, 2013 was $4 million (December 29, 2012 – $1 million), and during 2013, a fair value loss of $3 million (2012 – $1 million gain) was recorded in operating income. A 1% increase (decrease) in foreign currency exchange rates would result in a $1 million gain (loss) in fair value.
During 2013, financial instruments designated as fair value through profit or loss recognized a gain of $33 million (2012 – $27 million loss) in earnings before income taxes. In addition, during 2013 a loss of $27 million (2012 – $38 million gain) was recorded in earnings before income taxes related to financial instruments required to be classified as fair value through profit or loss.
During 2013, net interest expense of $446 million was recorded related to financial instruments not classified or designated as fair value through profit or loss (2012 – $332 million).
The following is a discussion of the Company’s derivative instruments:
Cross Currency Swaps In 2013, Glenhuron unwound its cross currency swaps and received a net cash settlement of $76 million, representing the cumulative fair value gain on the swaps. The swaps were offset by the effect of translation gains and losses relating to USD cash and cash equivalents, short term investments and security deposits. As at December 29, 2012, a cumulative unrealized foreign currency exchange rate receivable of $20 million was recorded in prepaid expenses and other assets and $93 million was recorded in other assets related to these swaps.
The following table summarizes the impact to operating income resulting from changes in fair value of the Glenhuron cross currency swaps and the underlying exposures:
(millions of Canadian dollars) 2013 2012Fair value loss (gain) related to swaps $ 37 $ (25)Translation (gain) loss related to the underlying exposures $ (33) $ 27
In 2013, the Company settled its USD $300 million USPP cross currency swaps in conjunction with the settlement of the underlying USD $300 million USPP notes, and received a net cash settlement of $18 million (see note 21). The USPP cross currency swaps were used to manage the effect of translation (gains) losses on the underlying USD USPP notes in long term debt. As part of the full settlement, the Company settled its USD $150 million USPP cross currency swap, which matured on May 29, 2013. On settlement of the swap, an unrealized fair value gain of $5 million, net of tax of $2 million, which had been deferred in accumulated other comprehensive income was realized in operating income.
As at December 29, 2012, a cumulative unrealized foreign currency exchange rate receivable of $2 million was recorded in prepaid expenses and other assets, and a receivable of $5 million was recorded in other assets, related to the USPP cross currency swaps.
The following table summarizes the impact to operating income resulting from changes in fair value of the USPP cross currency swaps and the underlying exposures:
(millions of Canadian dollars) 2013 2012Fair value loss (gain) related to swaps(i) $ (11) $ 7Translation loss (gain) related to the underlying exposures $ 14 $ (6)
(i) Excludes the $7 million gain reclassified from accumulated other comprehensive income in 2013
Interest Rate Swaps During 2013, the Company settled its notional $150 million in interest rate swaps. As at December 29, 2012, the Company maintained this notional $150 million in interest rate swaps which paid a fixed-rate of interest of 8.38% and had recognized a cumulative loss of $5 million which was recorded in trade payables and other liabilities.
During 2013, the Company recognized a $5 million fair value gain (2012 – $11 million) in operating income related to these swaps.
Equity Forward Contracts During 2013, Glenhuron paid $16 million to settle the remaining equity forwards representing 1,103,500 Loblaw common shares. Glenhuron recognized a nominal loss in operating income (2012 – $5 million gain) related to these forwards. As at December 29, 2012, the cumulative accrued interest and unrealized market loss of $16 million was included in accounts payable and accrued liabilities.

Notes to the Consolidated Financial Statements
100 2013 Annual Report - Financial Review
Other Derivatives and Instruments The Company also maintains other financial derivatives including foreign exchange forwards and fuel exchange traded futures and options. During 2013, the Company recognized a $7 million gain (2012 – nominal) in operating income. As at December 28, 2013, a $2 million cumulative unrealized gain was recorded in prepaid expenses and other assets (December 29, 2012 – nominal cumulative unrealized gain).
In connection with the issuance of $1.6 billion of senior unsecured notes in 2013 (see note 21), the Company hedged its exposure to interest rates in advance of the issuance. As this relationship did not qualify for hedge accounting, the resulting $10 million gain on settlement was recorded in operating income.
Franchise Loans Receivable and Franchise Investments in Other Assets The value of Loblaw franchise loans receivable of $375 million (December 29, 2012 – $363 million) was recorded on the consolidated balance sheets. During 2013, the Company recorded an impairment loss of $14 million (2012 – $12 million) in operating income related to these loans receivable.
The value of Loblaw franchise investments of $58 million (December 29, 2012 – $64 million) was recorded in other assets. During 2013, the Company recorded a $6 million loss (2012 – $7 million loss) in operating income related to these investments.
Note 31. Financial Risk Management
As a result of holding and issuing financial instruments, the Company is exposed to liquidity and capital availability risk, credit risk and market risk. The following is a description of those risks and how the exposures are managed:
Level of Indebtedness and Liquidity Risk To fund the cash portion of the Shoppers Drug Mart acquisition, the Company will utilize excess cash and significantly increase its indebtedness. There can be no assurances that the Company will generate sufficient free cash flow to reduce indebtedness and maintain adequate cash reserves which could result in adverse consequences on its credit ratings and its cost of funding.
Liquidity risk is the risk that the Company cannot meet its demand for cash or fund its obligations as they come due. Liquidity risk also includes the risk of not being able to liquidate assets in a timely manner at a reasonable price. Liquidity risk is mitigated by maintaining appropriate levels of cash and cash equivalents and short term investments, actively monitoring market conditions, and by diversifying sources of funding, including the Company's Credit Facility and maintaining a well-diversified maturity profile of debt and capital obligations. Despite these mitigation strategies, if the Company, PC Bank or Choice Properties' financial performance and condition deteriorate or downgrades in the Company’s or Choice Properties' current credit ratings occur, the Company, PC Bank or Choice Properties' ability to obtain funding from external sources could be restricted.
The following are the undiscounted contractual maturities of significant financial liabilities as at December 28, 2013:
2014 2015 2016 2017 2018 Thereafter Total(i)
Derivative Financial LiabilitiesForeign exchange forward contracts $ 70 $ — $ — $ — $ — $ — $ 70
Non-Derivative Financial LiabilitiesShort term debt(ii) 605 — — — — — 605Long term debt including fixed interest
payments(iii) 1,361 742 756 435 1,317 7,746 12,357Other liabilities(iv) 35 — 4 — — — 39
$ 2,071 $ 742 $ 760 $ 435 $ 1,317 $ 7,746 $ 13,071
(i) Capital securities and their related dividends, and the Trust Unit Liability have been excluded as these liabilities do not have a contractual maturity date. The Company also excluded bank indebtedness, trade payables and other liabilities, which are due within the next 12 months.
(ii) These are obligations owed to independent securitization trusts which are collateralized by the Company’s credit card receivables (see note 11).(iii) Based on the maturing face values and annual interest for each instrument, including GICs, long term independent securitization trusts and an independent funding trust,
as well as annual payment obligations for structured entities, mortgages and finance lease obligations. (iv) Contractual obligation related to certain other liabilities.

2013 Annual Report - Financial Review 101
Capital Availability Risk The real estate industry is highly capital intensive. Choice Properties requires access to capital to maintain its properties, refinance its indebtedness as well as to fund its growth strategy and certain capital expenditures from time to time. Although Choice Properties expects to have access to its credit facility, there can be no assurance that it will otherwise have sufficient capital or access to capital on acceptable terms for future property acquisitions, refinancing indebtedness, financing or refinancing properties, funding operating expenses or for other purposes. Further, in certain circumstances, Choice Properties may not be able to borrow funds due to certain limitations. Failure by Choice Properties to access required capital could have a material adverse effect on the Company's ability to pay its financial or other obligations. An inability to access capital could also impact Choice Properties' ability to make distributions which could have an adverse material effect on the trading price of Units.
Credit Risk The Company is exposed to credit risk resulting from the possibility that counterparties could default on their financial obligations to the Company. Exposure to credit risk relates to derivative instruments, cash and cash equivalents, short term investments, security deposits, PC Bank’s credit card receivables, franchise loans receivable, accounts receivable from franchisees and other receivables from vendors, associated stores and independent accounts and pension assets held in the Company’s defined benefit plans.
The risk related to derivative instruments, cash and cash equivalents, short term investments or security deposits is reduced by policies and guidelines that require that the Company enter into transactions only with counterparties or issuers that have a minimum long term “A-” credit rating from a recognized credit rating agency and place minimum and maximum limits for exposures to specific counterparties and instruments. The Company’s maximum exposure to credit risk as it relates to derivative instruments is approximated by the positive fair value of the derivatives on the balance sheet (see note 30).
Choice Properties mitigates the risk of credit loss relating to rent receivables by evaluating the creditworthiness of new tenants, obtaining security deposits wherever permitted by legislation, ensuring its tenant mix is diversified and by limiting its exposure to any one tenant except Loblaw. Choice Properties establishes an allowance for doubtful accounts that represents the estimated losses with respect to rents receivable. The allowance is determined on a tenant-by-tenant basis based on the specific factors related to the tenant.
PC Bank manages its credit card receivable risk by employing stringent credit scoring techniques and actively monitoring the credit card portfolio, and reviewing techniques and technology that can improve the effectiveness of the collection process. In addition, these receivables are dispersed among a large, diversified group of credit card customers.
Franchise loans receivable, accounts receivable from franchisees and other receivables from vendors, associated stores and independent accounts are actively monitored on an ongoing basis and settled on a frequent basis in accordance with the terms specified in the applicable agreements.
Market Risk Market risk is the loss that may arise from changes in factors such as interest rates, foreign currency exchange rates, commodity prices, common share and Unit price and the impact these factors may have on other counterparties.
Interest Rate Risk The Company is exposed to interest rate risk from fluctuations in interest rates on its floating rate debt and financial instruments, net of cash and cash equivalents, short term investments and security deposits. The Company manages interest rate risk by monitoring its respective mix of fixed and floating rate debt net of cash and cash equivalents, short term investments and security deposits, and by taking action as necessary to maintain an appropriate balance considering current market conditions. The Company estimates that a 100 basis point increase (decrease) in short term interest rates, with all other variables held constant, would result in a decrease (increase) of $32 million to net interest expense and other financing charges.
Foreign Currency Exchange Rate Risk The Company is exposed to foreign currency exchange rate variability, primarily on its USD denominated based purchases in trade payables and other liabilities. An appreciating Canadian dollar relative to the USD will positively impact year-over-year changes in reported operating income and net earnings, while a depreciating Canadian dollar relative to the USD will have the opposite impact.
Commodity Price Risk The Company is exposed to increases in the prices of commodities in operating its stores and distribution networks, as well as to the indirect link of commodities to consumer products and prices. To manage a portion of this exposure, the Company uses purchase commitments for a portion of its needs for certain consumer products that are commodities based. The Company enters into exchange traded futures contracts and forward contracts to minimize cost volatility relating to energy. Despite these mitigation strategies, rising commodity prices could negatively affect the Company’s financial performance. The Company estimates that based on the outstanding derivative contracts held by the Company as at December 28, 2013, a 10% decrease in relevant energy prices, with all other variables held constant, would result in a net loss of $2 million on earnings before income taxes.
Choice Properties Unit Price The Company is exposed to market price risk as a result of Units that are held by unitholders other than the Company. These Units are presented as a liability on the Company's consolidated balance sheets as they are redeemable for cash at the option of the holder. The liability is recorded at fair value at each reporting period based on the market price of Units. The change in the fair value of the liability negatively impacts net earnings when the Unit price increases and positively impacts net earnings when the Unit price declines. A one dollar increase in the market value of Units, with all other variables held constant, would result in a $66 million increase to net interest expense and other financing charges.

Notes to the Consolidated Financial Statements
102 2013 Annual Report - Financial Review
Note 32. Contingent Liabilities
The Company is involved in and potentially subject to various claims by third parties arising out of the normal course and conduct of its business including product liability, labour and employment, regulatory and environmental claims. In addition, the Company is involved in and potentially subject to regular audits from federal and provincial tax authorities relating to income, capital, commodity, property and other taxes and as a result of these audits may receive assessments and reassessments. Although such matters cannot be predicted with certainty, management currently considers the Company’s exposure to such claims and litigation, tax assessments and reassessments, to the extent not covered by the Company’s insurance policies or otherwise provided for, not to be material to the consolidated financial statements, but may have a material impact in future periods.
Legal Proceedings The Company is the subject of various legal proceedings and claims that arise in the ordinary course of business. The outcome of all of these proceedings and claims is uncertain. However, based on information currently available, these proceedings and claims, individually and in the aggregate, are not expected to have a material impact on the Company.
Tax The Company is subject to tax audits from various government and regulatory agencies on an ongoing basis. As a result, from time to time, taxing authorities may disagree with the positions and conclusions taken by the Company in its tax filings or legislation could be amended or interpretations of current legislation could change, any of which events could lead to reassessments. These reassessments could have a material impact on the Company in future periods.
In 2012, the Company received indication from the Canada Revenue Agency (“CRA”) that the CRA intends to proceed with a reassessment of the tax treatment of the Company’s wholly owned subsidiary, Glenhuron. At this stage, no reassessment has yet been received, and accordingly, it is not possible to quantify the amount of any potential reassessment. While the Company does not expect the ultimate outcome to be material, such matters cannot be predicted with certainty and could result in a material charge for the Company in future periods.
Indemnification Provisions The Company from time to time enters into agreements in the normal course of its business, such as service and outsourcing arrangements and leases, in connection with business or asset acquisitions or dispositions. These agreements by their nature may provide for indemnification of counterparties. These indemnification provisions may be in connection with breaches of representation and warranty or with future claims for certain liabilities, including liabilities related to tax and environmental matters. The terms of these indemnification provisions vary in duration and may extend for an unlimited period of time. Given the nature of such indemnification provisions, the Company is unable to reasonably estimate its total maximum potential liability as certain indemnification provisions do not provide for a maximum potential amount and the amounts are dependent on the outcome of future contingent events, the nature and likelihood of which cannot be determined at this time. Historically, the Company has not made any significant payments in connection with these indemnification provisions.
Note 33. Financial Guarantees
The Company has provided to third parties the following significant guarantees:
Independent Funding Trusts The full balance relating to the debt of the independent funding trusts has been consolidated on the balance sheet of the Company as at December 28, 2013 and December 29, 2012. The Company has agreed to provide a credit enhancement of $48 million (2012 – $48 million) in the form of a standby letter of credit for the benefit of the independent funding trusts representing not less than 10% (2012 – 10%) of the principle amount of loans outstanding. This credit enhancement allows the independent funding trusts to provide financing to the Company’s independent franchisees. As well, each independent franchisee provides security to the independent funding trusts for its obligations by way of a general security agreement. In the event that an independent franchisee defaults on its loan and the Company has not, within a specified time period, assumed the loan, or the default is not otherwise remedied, the independent funding trusts would assign the loan to the Company and draw upon this standby letter of credit. This standby letter of credit has never been drawn upon. The Company has agreed to reimburse the issuing bank for any amount drawn on the standby letter of credit.
Other Independent Securitization Trusts Letters of credit for the benefit of Other Independent Securitization Trusts with respect to the securitization programs of PC Bank have been issued by major financial institutions. These standby letters of credit could be drawn upon in the event of a major decline in the income flow from or in the value of the securitized credit card receivables. The Company has agreed to reimburse the issuing banks for any amount drawn on the standby letters of credit. The aggregate gross potential liability under these arrangements, which represents 9% (2012 – 9%) on a portion of the securitized credit card receivables amount, is approximately $54 million (December 29, 2012 – $81 million) (see note 19). The undrawn commitments on the independent securitization trusts as at December 28, 2013 was $120 million (December 29, 2012 – $120 million).
Lease Obligations In connection with historical dispositions of certain of its assets, the Company has assigned leases to third parties. The Company remains contingently liable for these lease obligations in the event any of the assignees are in default of their lease obligations. The estimated amount for minimum rent, which does not include other lease related expenses such as property tax and common area maintenance charges, is in aggregate $14 million (December 29, 2012 – $13 million). Additionally, the Company has guaranteed lease obligations of a third party distributor in the amount of $17 million (December 29, 2012 – $19 million).

2013 Annual Report - Financial Review 103
Choice Properties issues letters of credit to support performance guarantees related to its investment properties including maintenance and development obligations to municipal authorities. As at December 28, 2013, the aggregate gross potential liability related to these letters of credit totaled $20 million.
Choice Properties’ credit facility and Debentures are guaranteed by each of the General Partner, the Partnership and any other person that becomes a subsidiary of Choice Properties (with some exceptions). In the case of default by Choice Properties, the Indenture Trustee will be entitled to seek redress from the Guarantors for the guaranteed obligations in the same manner and upon the same terms that it may seek to enforce the obligations of the Choice Properties. These guarantees are intended to eliminate structural subordination, which would otherwise arise as a consequence of Choice Properties’ assets being primarily held in its various subsidiaries.
President’s Choice Bank The Company has provided a guarantee on behalf of PC Bank to MasterCard® International Incorporated (“MasterCard®”) for accepting PC Bank as a card member and licensee of MasterCard®. During 2013, the Company decreased its guarantee on behalf of PC Bank to MasterCard® to USD $170 million (2012 – USD $230 million).
Other The Company establishes letters of credit used in connection with certain obligations mainly related to real estate transactions, benefit programs, purchase orders and performance guarantees. The aggregate gross potential liability related to these letters of credit, not including the standby letters of credit for the benefit of independent funding trusts and independent securitization trusts, is approximately $348 million (December 29, 2012 - $348 million).
Note 34. Related Party Transactions
The Company’s parent corporation is Weston, which owns, directly and indirectly, 177,299,889 of the Company’s common shares, representing approximately 63% of the Company’s outstanding common shares. Mr. W. Galen Weston controls Weston, directly and indirectly through private companies which he controls, including Wittington who owns a total of 80,724,599 of Weston’s common shares, representing approximately 63% of Weston’s outstanding common shares. Mr. Weston also beneficially owns 3,753,789 of the Company’s common shares, representing approximately 1% (December 29, 2012 – 1%) of the Company’s outstanding common shares. The Company’s policy is to conduct all transactions and settle all balances with related parties on market terms and conditions.
Transactions with Related Parties
Transaction Value
(millions of Canadian dollars) 2013 2012Cost of Merchandise Inventory Sold
Inventory purchases from a subsidiary of Weston $ 601 $ 627Inventory purchases from a related party(i) 22 18
Operating IncomeCost sharing agreements with Parent(ii) $ 9 $ 12Net administrative services provided by Parent(iii) 13 17Choice Properties distributions to Parent(iv) 6 —Lease of office space from a subsidiary of Wittington 3 3
(i) Associated British Foods plc is a related party by virtue of Mr. W. Galen Weston being a director of such entity’s parent company. Total balance outstanding owing to Associated British Foods plc as at December 28, 2013 was $4 million (December 29, 2012 – $2 million).
(ii) Weston and the Company have each entered into certain contracts with third parties for administrative and corporate services, including telecommunication services and information technology related matters on behalf of itself and the related party. Through cost sharing agreements that have been established between the Company and Weston concerning these costs, the Company has agreed to be responsible to Weston for the Company’s proportionate share of the total costs incurred.
(iii) The Company and Weston have entered into an agreement whereby certain administrative services are provided by one party to the other. The services to be provided under this agreement include those related to commodity management, pension and benefits, tax, medical, travel, information system, risk management, treasury and legal. Payments are made quarterly based on the actual costs of providing these services. Where services are provided on a joint basis for the benefit of the Company and Weston together, each party pays the appropriate proportion of the costs. Fees paid under this agreement are reviewed each year by the Audit Committee.
(iv) Concurrent with the Choice Properties IPO, Weston purchased 20,000,000 Units from Choice Properties at $10.00 per Unit for a total subscription price of $200 million. Choice Properties issued an additional 107,810 Units to Weston under a DRIP at a price of $10.05 per Unit. In 2013, Choice Properties recorded $6 million in distributions to Weston relating to Units, which have been classified as interest expense in the Consolidated Statement of Earnings.
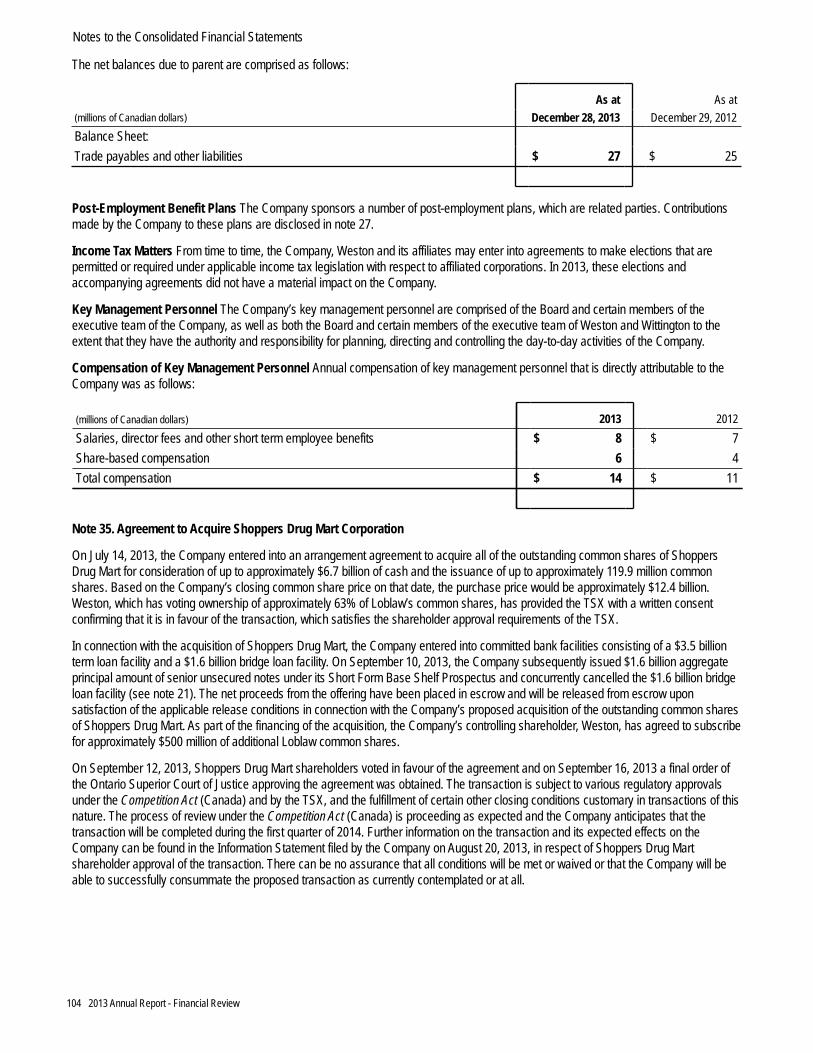
Notes to the Consolidated Financial Statements
104 2013 Annual Report - Financial Review
The net balances due to parent are comprised as follows:
As at As at(millions of Canadian dollars) December 28, 2013 December 29, 2012Balance Sheet:Trade payables and other liabilities $ 27 $ 25
Post-Employment Benefit Plans The Company sponsors a number of post-employment plans, which are related parties. Contributions made by the Company to these plans are disclosed in note 27.
Income Tax Matters From time to time, the Company, Weston and its affiliates may enter into agreements to make elections that are permitted or required under applicable income tax legislation with respect to affiliated corporations. In 2013, these elections and accompanying agreements did not have a material impact on the Company.
Key Management Personnel The Company’s key management personnel are comprised of the Board and certain members of the executive team of the Company, as well as both the Board and certain members of the executive team of Weston and Wittington to the extent that they have the authority and responsibility for planning, directing and controlling the day-to-day activities of the Company.
Compensation of Key Management Personnel Annual compensation of key management personnel that is directly attributable to the Company was as follows:
(millions of Canadian dollars) 2013 2012Salaries, director fees and other short term employee benefits $ 8 $ 7Share-based compensation 6 4Total compensation $ 14 $ 11
Note 35. Agreement to Acquire Shoppers Drug Mart Corporation
On July 14, 2013, the Company entered into an arrangement agreement to acquire all of the outstanding common shares of Shoppers Drug Mart for consideration of up to approximately $6.7 billion of cash and the issuance of up to approximately 119.9 million common shares. Based on the Company’s closing common share price on that date, the purchase price would be approximately $12.4 billion. Weston, which has voting ownership of approximately 63% of Loblaw’s common shares, has provided the TSX with a written consent confirming that it is in favour of the transaction, which satisfies the shareholder approval requirements of the TSX.
In connection with the acquisition of Shoppers Drug Mart, the Company entered into committed bank facilities consisting of a $3.5 billion term loan facility and a $1.6 billion bridge loan facility. On September 10, 2013, the Company subsequently issued $1.6 billion aggregate principal amount of senior unsecured notes under its Short Form Base Shelf Prospectus and concurrently cancelled the $1.6 billion bridge loan facility (see note 21). The net proceeds from the offering have been placed in escrow and will be released from escrow upon satisfaction of the applicable release conditions in connection with the Company’s proposed acquisition of the outstanding common shares of Shoppers Drug Mart. As part of the financing of the acquisition, the Company’s controlling shareholder, Weston, has agreed to subscribe for approximately $500 million of additional Loblaw common shares.
On September 12, 2013, Shoppers Drug Mart shareholders voted in favour of the agreement and on September 16, 2013 a final order of the Ontario Superior Court of Justice approving the agreement was obtained. The transaction is subject to various regulatory approvals under the Competition Act (Canada) and by the TSX, and the fulfillment of certain other closing conditions customary in transactions of this nature. The process of review under the Competition Act (Canada) is proceeding as expected and the Company anticipates that the transaction will be completed during the first quarter of 2014. Further information on the transaction and its expected effects on the Company can be found in the Information Statement filed by the Company on August 20, 2013, in respect of Shoppers Drug Mart shareholder approval of the transaction. There can be no assurance that all conditions will be met or waived or that the Company will be able to successfully consummate the proposed transaction as currently contemplated or at all.

2013 Annual Report - Financial Review 105
Note 36. Segment Information
The Company has three reportable operating segments with all material operations carried out in Canada:
• The Retail segment, which consists primarily of retail food, drugstore, gas bar, apparel and other general merchandise operations; • The Financial Services segment, which provides credit card services, a retail loyalty program, insurance brokerage services, personal
banking services provided by a major Canadian chartered bank, deposit taking services and telecommunication services; and
• The Choice Properties segment, which owns and leases commercial properties. The Choice Properties segment information presented below reflects the accounting policies of Choice Properties, which may differ from those of the consolidated Company. Any differences in policies are eliminated in Consolidation and Eliminations.
The Company’s chief operating decision maker evaluates segment performance on the basis of adjusted operating income(1) and adjusted EBITDA(1), as reported to internal management, on a periodic basis.
Information for each reportable operating segment is included below:
2013 2012
RetailFinancial
Services(i)Choice
Properties(2)
Consolidation and
Eliminations(ii) Total RetailFinancial
Services(i)Choice
Properties
Consolidationand
Eliminations Total(millions of Canadian dollars)
Revenue $ 31,600 $ 739 $ 319 $ (287) $ 32,371 $ 30,960 $ 644 $ — $ — $ 31,604Operating Income $ 1,185 $ 142 $ 370 $ (371) $ 1,326 $ 1,100 $ 95 $ — $ — $ 1,195Adjusting Items(1) (13) — 12 — (1) 97 — — — 97Adjusted Operating Income(1) $ 1,172 $ 142 $ 382 $ (371) $ 1,325 $ 1,197 $ 95 $ — $ — $ 1,292Depreciation and Amortization 809 9 — 6 824 767 10 — — 777Adjusted EBITDA(1) $ 1,981 $ 151 $ 382 $ (365) $ 2,149 $ 1,964 $ 105 $ — $ — $ 2,069Net interest expense and other
financing charges 315 49 303 (199) 468 306 45 — — 351
(i) Included in Financial Services revenue is $325 million (December 29, 2012 – $277 million) of interest income. (ii) Consolidation and Eliminations includes the following items:
• Revenue includes the elimination of $221 million of rental revenue and $66 million of cost recovery recognized by Choice Properties, received from the Retail segment.
• Operating income includes the elimination of the $221 million impact of rental revenue described above; the elimination of a $144 million gain recognized by Choice Properties related to the fair value adjustments on investment properties, which are classified as Fixed Assets or Investment Properties by the Company and measured at cost; and the recognition of $6 million of depreciation expense for certain investment properties recorded by Choice Properties and measured at fair value.
• Net interest expense and other financing charges includes the elimination of $144 million of interest expense included in Choice Properties related to debt owing to the Company; Unit distributions to external unitholders of $21 million, which excludes distributions paid to the Company, and Choice Properties Unit issuance costs of $44 million, which are reflected as a reduction of equity in Choice Properties, and presented as interest expense for the consolidated Company; the elimination of a $147 million fair value loss recognized by Choice Properties on Class B Limited Partnership units held by the Company; and a $27 million fair value loss on the Company’s Trust Unit Liability.
(1) Certain items are excluded from operating income to derive adjusted operating income and adjusted EBITDA, respectively. Adjusted operating income and adjusted EBITDA are used internally by management when analyzing segment underlying performance.
(2) Results are for the period ended December 31, 2013, consistent with Choice Properties’ fiscal calendar. Adjustments to December 28, 2013 are included in Consolidation and Eliminations.

Notes to the Consolidated Financial Statements
106 2013 Annual Report - Financial Review
As at As at(millions of Canadian dollars) December 28, 2013 December 29, 2012Total Assets
Retail $ 17,308 $ 15,474Financial Services 2,801 2,487Choice Properties(1) 7,448 —Consolidation and Eliminations(i) (6,798) —Total $ 20,759 $ 17,961
(i) Consolidation and Eliminations includes the elimination of certain investment properties held by Choice Properties measured at fair value, which are presented in the consolidated results as fixed assets and investment properties measured at cost.
(millions of Canadian dollars) 2013 2012Additions to Fixed Assets and Goodwill and Intangible Assets
Retail $ 835 $ 1,045Financial Services 6 15Choice Properties(1)(i) 7,129 —Consolidation and Eliminations(i) (7,093) —Total $ 877 $ 1,060
(i) Consolidation and Eliminations includes the elimination of $7 billion of investment properties acquired by Choice Properties from the Retail segment.
(1) Results are for the period ended December 31, 2013, consistent with Choice Properties’ fiscal calendar. Adjustments to December 28, 2013 are included in Consolidation and Eliminations.

Earnings Coverage Exhibit to the Audited Consolidated Financial Statements
2013 Annual Report - Financial Review 107
The following is the Company’s updated earnings coverage ratio for the rolling 52-week period ended December 28, 2013 in connection with the Company’s Amended Short Form Base Shelf Prospectus dated August 29, 2013. The following earnings coverage ratio gives effect to the issuance of $450 million in senior unsecured debentures by Choice Properties Real Estate Investment Trust subsequent to December 28, 2013. The following earnings coverage ratio does not (i) give effect to the pro-forma impact of the Acquisition of Shoppers Drug Mart Corporation; and (ii) purport to be indicative of earnings coverage ratios for any future periods.
Earnings coverage on financial liabilities 2.62 times
The earnings coverage ratio on financial liabilities is equal to consolidated net earnings (before interest on short term debt and long term debt, dividends on capital securities, Trust Unit (“Unit”) distributions, fair value adjustment of Trust Unit Liability and income taxes) divided by consolidated interest on short term and long term debt, dividends on capital securities, Unit distributions and the fair value adjustment of Trust Unit Liability. For the purposes of calculating the earnings coverage ratio set forth above, long term debt includes the current portion of long term debt.

Three Year Summary(1)
108 2013 Annual Report - Financial Review
As at or for the periods ended December 29, 2013 and December 28, 2012 2013 2012(2) 2011(3)
(millions of Canadian dollars except where otherwise indicated) (52 weeks) (52 weeks) (52 weeks)Consolidated Results of OperationsRevenue $ 32,371 $ 31,604 $ 31,250Operating income 1,326 1,195 1,384Adjusted operating income(4) 1,325 1,292 1,438Adjusted EBITDA(4) 2,149 2,069 2,137Net interest expense and other financing charges 468 351 327Net earnings 630 634 769Adjusted net earnings(4) 731 710 811Consolidated Financial Position and Cash FlowsAdjusted debt(4) 6,064 4,360 4,341Cash and cash equivalents, short term investments and security deposits 4,251 2,047 1,986Cash flows from operating activities 1,491 1,637 1,814Capital investment 865 1,017 987Free cash flow(4) 489 468 551Consolidated Per Common Share ($)Basic net earnings 2.24 2.25 $ 2.73Adjusted basic net earnings(4) 2.60 2.52 2.88Consolidated Financial Measures and RatiosRevenue growth 2.4% 1.1 % 1.3%Adjusted operating margin(4) 4.1% 4.1 % 4.6%Adjusted EBITDA margin(4) 6.6% 6.5 % 6.8%Interest coverage(4) 2.8x 3.4x 4.2xAdjusted debt(4) to adjusted EBITDA(4) 2.8x 2.1x 2.0xReturn on average net assets(4) 10.7% 10.0 % 12.0%Return on average shareholders’ equity 9.4% 10.2 % 13.2%Retail Results of OperationsSales 31,600 30,960 30,703Gross profit 6,966 6,819 6,820Operating income 1,185 1,100 1,312Adjusted operating income(4) 1,172 1,197 1,366Retail Operating StatisticsSame-store sales growth (decline) 1.1% (0.2)% 0.9%Gross profit percentage 22.0% 22.0 % 22.2%Adjusted operating margin(4) 3.7% 3.9 % 4.4%Adjusted EBITDA margin(4) 6.3% 6.3 % 6.7%Retail square footage (in millions) 51.9 51.5 51.2Number of corporate stores 570 580 584Number of franchise stores 496 473 462Financial Services Results of OperationsRevenue 739 644 547Operating income 142 95 72Earnings before income taxes 93 50 24Financial Services Operating Measures and StatisticsAverage quarterly net credit card receivables 2,345 2,105 1,974Credit card receivables 2,538 2,305 2,101Allowance for credit card receivables 47 43 37Annualized yield on average quarterly gross credit card receivables 13.6% 12.8 % 12.5%Annualized credit loss rate on average quarterly gross credit card receivables 4.2% 4.3 % 4.2%Choice Properties Results of Operations(5)
Revenue 319 — —Operating income 370 — —Adjusted operating income(4) 382 — —Net interest expense and other financing charges 303 — —Choice Properties Operating Measures(5)
Net operating income(4) 222 — —Funds from operations(4) 159 — —Adjusted funds from operations(4) 131 — —Adjusted funds from operations per unit diluted(4) ($) 0.36 — —Adjusted funds from operations payout ratio(4) 88.6% — —
(1) For financial definitions and ratios refer to the Glossary beginning on page 109 of the Company’s 2013 Annual Report.(2) Certain 2012 figures have been restated (see note 2 of the consolidated financial statements).(3) 2011 figures have not been restated for the impact of IAS 19.(4) See Non-GAAP financial measures beginning on page 40 of the Management’s Discussion and Analysis in this report.(5) Results are for the period ended December 31, 2013, consistent with Choice Properties’ fiscal calendar. Adjustments to December 28, 2013 are included in Consolidation and Eliminations.

Glossary of Terms
2013 Annual Report - Financial Review 109
Term Definition Term DefinitionAdjusted basic netearnings percommon share
Basic net earnings available to common shareholders ofthe Company adjusted for items that are not necessarilyreflective of the Company’s underlying operatingperformance divided by the weighted average number ofcommon shares outstanding during the year (see Non-GAAP Financial Measures on page 40 of the Company’sManagement’s Discussion and Analysis).
Choice Propertiesnet operatingincome
Choice Properties’ rental revenue less straight-line rentand property operating costs (see Non-GAAP FinancialMeasures on page 40 of the Company’s Management’sDiscussion and Analysis).
Adjusted debt Bank indebtedness, short term debt, long term debt, TrustUnit Liability, certain other liabilities and the fair value ofcertain financial derivative liabilities less independentsecuritization trusts in short term and long term debt,independent funding trusts and President’s Choice Bank’sguaranteed investment certificates (see Non-GAAPFinancial Measures on page 40 of the Company’sManagement’s Discussion and Analysis).
Capital Investment Fixed asset purchases.
Adjusted debt toadjusted EBITDA
Adjusted debt divided by adjusted EBITDA (see Non-GAAP Financial Measures on page 40 of the Company’sManagement’s Discussion and Analysis).
Control label A brand and associated trademark that is owned by theCompany for use in connection with its own products andservices.
Adjusted EBITDA Adjusted operating income before depreciation andamortization (see Non-GAAP Financial Measures on page40 of the Company’s Management’s Discussion andAnalysis).
Conversion A store that changes from one Company banner toanother Company banner.
Adjusted EBITDAmargin
Adjusted EBITDA divided by sales (see Non-GAAPFinancial Measures on page 40 of the Company’sManagement’s Discussion and Analysis).
Corporate storessales per averagesquare foot
Sales by corporate stores excluding gas bar sales dividedby the average corporate stores’ square footage at yearend.
Adjusted operatingincome
Operating income adjusted for items that are notnecessarily reflective of the Company’s underlyingoperating performance (see Non-GAAP FinancialMeasures on page 40 of the Company’s Management’sDiscussion and Analysis).
Diluted net earningsper common share
Net earnings available to common shareholders of theCompany less the impact of dilutive items divided by theweighted average number of common shares outstandingduring the period adding back the impact of dilutive items.
Adjusted operatingmargin
Adjusted operating income divided by sales (see Non-GAAP Financial Measures on page 40 of the Company’sManagement’s Discussion and Analysis).
Dividend rate percommon share atyear end
Dividend per common share declared in the fourth quartermultiplied by four.
Annualized creditloss rate on averagequarterly grosscredit cardreceivables
Total credit card losses year-to-date divided by the numberof days year-to-date times 365 divided by averagequarterly gross credit card receivables.
EBITDA Operating income before depreciation and amortization(see Non-GAAP Financial Measures on page 40 of theCompany’s Management’s Discussion & Analysis).
Annualized yield onaverage quarterlygross credit cardreceivables
Interest earned on credit card receivables year-to-datedivided by the number of days year-to-date times 365divided by average quarterly gross credit card receivables.
EBITDA margin EBITDA divided by sales (see Non-GAAP FinancialMeasures on page 40 of the Company’s Management’sDiscussion & Analysis).
Basic net earningsper common share
Net earnings available to common shareholders divided bythe weighted average number of common sharesoutstanding during the year.
Free Cash Flow Cash flows (used in) from operating activities excludingthe net change in credit card receivables less fixed assetpurchases and interest paid (see Non-GAAP FinancialMeasures on page 40 of the Company’s Management’sDiscussion and Analysis).
Book value percommon share
Shareholders’ equity divided by the number of commonshares outstanding at year end.
Gross profitpercentage
Sales less cost of sales including inventory shrink dividedby sales.
Choice Propertiesadjusted funds fromoperations
Choice Properties’ funds from operations adjusted foritems that are not necessarily reflective of the REIT’sunderlying operating performance (see Non-GAAPFinancial Measures on page 40 of the Company’sManagement’s Discussion and Analysis).
Interest coverage Operating income divided by net interest expense andother financing charges adding back interest capitalized tofixed assets (see Non-GAAP Financial Measures on page40 of the Company’s Management’s Discussion andAnalysis).
Choice Propertiesadjusted funds fromoperations per unitdiluted
Choice Properties’ adjusted funds from operations dividedby Choice Properties’ diluted weight average Trust Unitsoutstanding (see Non-GAAP Financial Measures on page40 of the Company’s Management’s Discussion andAnalysis).
Major expansion Expansion of a store that results in an increase in squarefootage that is greater than 25% of the square footage ofthe store prior to the expansion.
Choice Propertiesadjusted funds fromoperations payoutratio
Choice Properties’ distribution per Trust Unit, divided byChoice properties adjusted funds from operations perTrust Unit diluted (see Non-GAAP Financial Measures onpage 40 of the Company’s Management’s Discussion andAnalysis).
Minor expansion Expansion of a store that results in an increase in squarefootage that is less than or equal to 25% of the squarefootage of the store prior to the expansion.
Choice Propertiesfunds fromoperations
Choice Properties net income adjusted for fair valueadjustments, distributions on Class B Limited Partnershipunits and amortization of tenant improvement allowances(see Non-GAAP Financial Measures on page 40 of theCompany’s Management’s Discussion and Analysis).
New store A newly constructed store, conversion or major expansion.

Glossary of Terms
110 2013 Annual Report - Financial Review
Term Definition Term Definition
Operating income Earnings before net interest expense and other financingcharges and income taxes.
Return on averagenet assets
Operating income divided by average total assetsexcluding cash and cash equivalents, short terminvestments, security deposits and accounts payable andaccrued liabilities (see Non-GAAP Financial Measures onpage 40 of the Company’s Management’s Discussion andAnalysis).
Operating margin Operating income divided by sales. Return on averageshareholders’ equity
Net earnings available to common shareholders divided byaverage total common shareholders’ equity.
Renovation A capital investment in a store resulting in no significantchange to the store square footage.
Same-store sales Retail sales from the same location for stores in operationin that location in both periods excluding sales from a storethat has undergone a major expansion or contraction inthe period.
Retail sales Combined sales of stores owned by the Company andthose owned by the Company’s independent franchisees.
Weighted averagecommon sharesoutstanding
The number of common shares outstanding determined byrelating the portion of time within the year the commonshares were outstanding to the total time in that year.
Retail squarefootage
Retail square footage includes corporate and independentfranchised stores.
Year The Company’s fiscal year ends on the Saturday closest toDecember 31 and is usually 52 weeks in duration, butincludes 53 weeks every 5 to 6 years. The years endedDecember 28, 2013 and December 29, 2012 bothcontained 52 weeks.

Printing: Transcontinental PLM Ce rapport est disponible en français.
National Head Office and Store Support CentreLoblaw Companies Limited1 President’s Choice CircleBrampton, Canada L6Y 5S5Tel: (905) 459-2500Fax: (905) 861-2206Internet: http://loblaw.ca
Normal Course Issuer BidThe Company has a Normal Course Issuer Bid on the Toronto Stock Exchange.Value of Common SharesFor capital gains purposes, the valuation day (December 22, 1971) cost base for the Company is $0.958 per common share. The value on February 22, 1994 was $7.67 per common share.
Stock Exchange Listing and SymbolThe Company’s common shares and second preferred shares are listed on the Toronto Stock Exchange and trade under the symbols “L” and “L.PR.A.”, respectively.
Investor RelationsShareholders, security analysts and investment professionals should direct their requests to Investor Relations at the Company’s National Head Office or by e-mail at [email protected].
Common SharesW. Galen Weston, directly and indirectly, including through his controlling interest in Weston, owns approximately 63% of the Company’s common shares.
Registrar and Transfer AgentComputershare Investor Services Inc.100 University AvenueToronto, Canada M5J 2Y1
At year-end 2013, there were 282,311,573 common shares issued and outstanding.
The average daily trading volume of the Company’s common shares for 2013 was 727,955.
Toll free: 1-800-564-6253 (Canada and U.S.)Fax (416)263-9394Toll free fax: 1-888-453-0330International direct dial: (514) 982-7555
Preferred SharesAt year-end 2013, there were 9,000,000 second preferred shares issued and outstanding.
To change your address, eliminate multiple mailings or for othershareholder account inquiries, please contact ComputershareInvestor Services Inc.
The average daily trading volume of the Company’s secondpreferred shares for 2013 was 6,115.
Additional financial information has been filed electronically with various securities regulators in Canada through the System for Electronic Document Analysis and Retrieval (SEDAR) and with the Office of the Superintendent of Financial Institutions (OSFI) as the primary regulator for the Company’s subsidiary, President’s Choice Bank.Independent AuditorsKPMG LLPChartered Professional AccountantsToronto, Canada
TrademarksLoblaw Companies Limited and its subsidiaries own a number of trademarks. Several subsidiaries are licensees of additional trademarks. These trademarks are the exclusive property of Loblaw Companies Limited or the licensor and where used in this report, are in italics.
Common Dividend PolicyThe Company’s dividend policy states: the declaration and payment of dividends and the amount thereof on the Company’s common shares are at the discretion of the Board of Directors which takes into account the Company’s financial results, capital requirements, available cash flow, future prospects of the Company’s business and other factors considered relevant from time to time.
Annual General MeetingThe 2014 Annual Meeting of Shareholders of Loblaw Companies Limited will be held on Thursday, May 1, 2014 at 11:00 a.m. (EST), at the Mattamy Athletic Centre, 50 Carlton Street, Toronto, Canada M5B 1J2.The Company holds an analyst call shortly following the release of its quarterly results. These calls are archived in the Investor Centre section of the Company’s website (loblaw.ca).
Common Dividend DatesThe declaration and payment of quarterly dividends are made subject to approval by the Board of Directors. The anticipated record and payments dates for 2014 are:
Preferred Share Dividend DatesThe declaration and payment of quarterly dividends are made subject to approval by the Board. The anticipated payment dates for 2014 are January 31, April 30, July 31 and October 31.
Record Date Payment DateMarch 15June 15September 15December 15
April 1July 1October 1December 30

lOBlaw.Ca PC.Ca JOEFrESH.Ca PCFinanCial.Ca CHOiCErEit.Ca