Embed Size (px)
Citation preview

File pathway: H: Adult Projects/Needs & Intelligence/Local Account//2015-16/Local Account 2015-16 V1
Local Account
2015/16
Derbyshire County Council
Adult Care
This is the Local Account 2015/16 for Adult Care in
Derbyshire. It explains how we are doing, outlines our
current priorities and future plans.

File pathway: H: Adult Projects/Needs & Intelligence/Local Account//2015-16/Local Account 2015-16 V1
Contents
Executive Summary Page 2
Foreword Page 3
Derbyshire’s Social Care Profile Page 4
Acting on what you tell us Page 5
Our Performance – The Local Account for 2015/16 Page 7
The Cost of Care Page 10
Complaints, Comments & Compliments Page 13
Adult Care priorities 2016/17 Page 20
Public Health priorities 2016/17 Page 24
Appendix Page 28
Feedback Page 46
Version History
Version Date Detail Author
1.0 20.10.2016 First draft Becky East
2.0 28.10.2016 Second draft incorporating amends from LMF Becky East
3.0 11.11.2016 Third draft including amends from SDs & GMs Becky East
4.0 17.11.2016 Fourth draft incorporating amends from LMF Becky East
5.0 28.11.2016 Fifth draft incorporating amends from SMT Becky East
6.0 30.11.2016 Sixth draft incorporating amends from Cllr Smith Becky East
7.0 2.12.2016 Final Approved Version Becky East
This document has been prepared using the following ISO27001 standard controls as reference:
ISO Control Description
4.3.2 Control of Documents
4.3.3 Control of Records

PUBLIC
2 | P a g e
Executive Summary
Welcome to the 2015/16 Derbyshire County Council (DCC) Local Account.
We’ve achieved a great deal over the past year but still have to work hard to ensure
that the people of Derbyshire get the care and support they need. Adult Care
continues to operate under huge financial pressures which makes the task of
providing quality care even harder.
That’s why it is extremely encouraging to see that we performed really well when
compared with other similar local authorities; we’ve received some excellent
feedback from clients and their families, and there have also been fewer complaints
this year.
This tells us that, despite the challenges, we’ve still managed to keep standards
high, which is testament both to the hard work of the Adult Care teams delivering
support in our county and the careful use of our funding.
What next for Adult Care? We can certainly expect budgets to get tighter in the
coming year. We are going to carry on focusing our attention on meeting the needs
of the most vulnerable, with the aim of keeping people independent for as long as
possible and helping to maintain individual wellbeing.
This is not going to be an easy task, but we are committed wholeheartedly to doing
the best we can for those who come into contact with Adult Care, using our
resources wisely and fairly, and maintaining high quality care and support for those
that need it most.
Joy Hollister, Strategic Director, Adult Social Care
Derbyshire County Council

PUBLIC
3 | P a g e
Foreword
This Local Account covers the period from 1 April 2015 to 31 March 2016. Like all
local authorities, Derbyshire is operating in an increasingly difficult environment, and
the past 12 months have been no different.
There are currently immense pressures on Adult Care as local authorities around the
country are having to manage their responsibiliites with significantly less funding.
The Chancellor’s Autumn Statement made no reference to social care despite
numerous independent bodies stating that the sector is at a tipping point. To
compound this, the NHS is clearly relying on social care to help manage rising
demand and has called on the Government to increase funding to local
authorities. It is therefore clear that we have to operate under severe financial
constraint for the foreseeable future.
Meeting the new obligations placed on councils under the Care Act, along with the
continued development of personalisation1, means we have to look at new ways of
managing services that keep costs down, while continuing to support the most
vulnerable. Therefore our work in the coming year will focus on key areas of both
preventing need from arising, and managing demand for services.
This Local Account looks at how the budget for Adult Care was spent during
2015/16, plus how our services have performed when compared with other local
authorities. It also shows how we are working with our local communities, and
building on feedback, in order to improve the experience of those who come into
contact with Adult Care. We’re always looking at ways of doing things better. If you
have any comments about this Local Account, or ideas on how we can improve
Adult Care services for the people of Derbyshire, please fill out the feedback form at
the end of this document. We’d like to hear from you.
Cllr Paul Smith, Deputy Council Leader and Cabinet Member, Adult Social Care
Derbyshire County Council
1Personalisation - also known as ‘self-directed support’ - gives people more choice and control over the way their
social care needs are met.

PUBLIC
4 | P a g e
Derbyshire’s Social Care Profile
Nationally, the pressures on care and support are being compounded by the
increasing demand for those services arising from the fact that people are living for
longer whilst also managing increasingly complex health conditions.
Derbyshire has a higher proportion of older people compared with the national
average. Currently around a fifth (21.3%) of the people of Derbyshire are aged over
65 (compared with 17.8% nationally); 2.7% of these individuals are aged over 852
(2.4% nationally). The overall population of older people is projected to increase by
10% nationally by 2021.
Around 70% of Adult Care clients are older people; younger adults make up the
remainder; these are people aged 18-64 with either a physical impairment, a learning
disability or a diagnosed mental health issue.
We also have over 90,000 carers in Derbyshire, individuals that provide informal,
unpaid care to those with a disability or illness; more than 20% provide 50 or more
hours of support per week. Carers perform an invaluable role in helping to support
people’s independence and ability to remain in their own homes for longer.
Although life expectancy in Derbyshire is generally similar to the national average,
residents in the least deprived areas of our county are likely to live around a decade
longer than those in the most deprived areas (many of which are in the north east of
the county). Some Derbyshire residents are also coping with health conditions that
reflect the former industries in our county. Geographically, large areas are also rural,
which makes delivering care in these areas more difficult.
Along with our colleagues in Public Health, we are helping to reduce avoidable
health inequalities by improving health, wellbeing, diet and lifestyle, and reducing
illness arising from excessive alcohol consumption, smoking, obesity and lack of
exercise. Even though our resources are stretched, we are working hard to help the
people of Derbyshire enjoy lives that are healthy and inclusive for as long as
possible.
2 Office for National Statistics (ONS) population projections.

PUBLIC
5 | P a g e
Acting on what you tell us
By consulting with local people, and regularly meeting with different community
groups, stakeholders and voluntary organisations, we can be sure that we take into
account the views of Derbyshire’s communities when planning, shaping and
restructuring our services.
This is particularly important when difficult decisions have to be made around the
future of some of our services. One of the most significant consultations in 2015/16
focused on the future of Derbyshire’s homes for older people.
Taking place over a 12 week period, the consultation encouraged residents at the
homes, their families, staff, local people, various groups and organisations, to give
their views. These comments and concerns helped inform part of the report to the
Council that considered the potential effects of the home closures on residents and
the local community.
In order to address some of the concerns raised in the consultation, DCC signed up
to a series of pledges aimed at the 78 residents whose homes were due to close.
These included treating residents with dignity and respect, consulting closely with
them at every stage, discussing their preferences plus their care and support needs,
and addressing their concerns about moving.
Over the past year we have met with a number of groups which has led to some
positive outcomes for local people.
The Derbyshire Older People’s Advisory Group which meets four times a year set up
a series of initiatives during 2015/16 as part of the ongoing Community Ventures
Project. These include establishing programmes designed to encourage older people
to use technology more, developing an interactive workshop aimed at reducing road
accidents amongst the 70 plus age group, and ensuring older adults were aware of
their rights to social security benefits in order to maximise their income.
Some of these groups are aimed at supporting certain sectors of the community or
specific client groups, and others are more generic in their remit.

PUBLIC
6 | P a g e
For example, the work of the Local Learning Disability Partnership Boards has led to
the co-production of certain services aimed at supporting adults with learning
disabilities. Over the past year this work has helped to raise awareness of paid
employment skills for people with learning disabilities in Derbyshire; it has also led to
the development of a pilot scheme aimed at improving engagement with the learning
disabled community.
The work of the Derbyshire Stakeholder Engagement Board has led to the co-
production of policy, information resources and services across all Adult Care client
groups. Over the past year this work has brought about the development of a web
page for the Discretionary Fund (which aims to address urgent need in times of
crisis). It has also helped to develop a ‘Need a bit of help at home?’ leaflet which
details a range of free and paid-for support available to adults in Derbyshire. This
not only provides useful information in its own right, it helps DCC to fulfil its
obligations under the Care Act by ensuring that the local communities are informed
of the Adult Care services available to them.

PUBLIC
7 | P a g e
Our Performance – The Local Account
for 2015/16
The performance of local authorities that provide for people with social care needs is
measured by what’s known as the Adult Social Care Outcomes Framework
(ASCOF).
This is a nationally recognised tool, devised by the government, that allows different
authorities to be compared in a standardised way. The ASCOF is therefore
considered a good measure of how well care and support services achieve the
outcomes that matter most to service users.
Various data returns3 are used as the basis for the ASCOF measures. The Adult
Social Care Survey (ASCS) also feeds into seven of the ASCOF measures, and
uses survey information completed by the users of Adult Care services themselves
about their experience of social care.
Specifically, this includes indicators relating to quality of life, levels of control and
social contact, ease of finding information, satisfaction levels and how safe the
individual feels4.
Derbyshire’s 2015/16 ASCOF performance has been compared with the national
average, the average for those local authorities in the East Midlands region, the
average of similar ‘matched5’ local authorities, and also our performance last year.
Figure 1 on page 8 highlights how we have performed in relation to those local
authorities we are matched with. We also list the performance indicators we are
doing well in, as well as those we need to improve. Figure 2 on page 9 shows how
our 2015/16 performance compares with the previous year.
3 Short and Long Term Support (SALT) collection, Delayed Transfers of Care (DToC), Hospital Episode Statistics
(HES), Mental Health & Learning Disabilities Dataset (MHLDS), mid-year population estimates, ONS (Office for National Statistics). 4 Local authorities also run a Survey of Adult Carers (SACE) every two years which forms the basis of some
ASCOF measures. However, the most up to date data will not be available until mid-2017, therefore this Local Account does not report on ASCOF data derived from this source. 5 Known as the ‘CIPFA family’, these include 15 other nearest neighbour local authorities that share similar
characteristics to Derbyshire including population size and spread, levels of social deprivation, how rural it is, and so on.

PUBLIC
8 | P a g e
Figure 1 – How Derbyshire’s performance compares 2015/16
In summary, these are the areas we are generally doing well in:
Social care related quality of life
People receiving self-directed support
Adults in contact with mental health services in paid employment
Adults with learning disablities in stable accommodation
Adults in contact with mental health services in stable accommodation
Service users with as much social contact as they would like
Delayed transfers of care attributable to social services
Service users who find it easy to get information
Delayed transfers of care
Client satisfaction with care and support
People who use services and feel safe.
Above average 56%
Below average 39%
On a par 5%
Our Performance 2015/16

PUBLIC
9 | P a g e
These are the areas we need to improve:
Service users with control over their daily life
People receiving Direct Payments
Adults with learning disabilities in employment
Permanent admissions to care homes: people aged 18-64
Permanent admissions to care homes, people aged 65 and over
Older people at home 91 days after leaving hospital into reablement
People who say the services they use make them feel safe and secure.
Although we are aware that there are areas we will need to work on in the coming
year, these performance measures are generally very positive. They indicate that,
despite the challenging financial context in which we must operate, and the difficult
decisions we have had to make as a result, the standard of service to current clients
has not been adversely affected.
Further, levels of satisfaction with care and support services have remained high,
and the hard work of the Adult Care teams continues to be valued by those that
receive support. For more detail on each performance indicator, please turn to the
Appendix at the end of this document.
Figure 2 – Our performance – comparing 2014/15 with 2015/16
50%
44%
6%
56%
39%
5%
0%
10%
20%
30%
40%
50%
60%
Above average Below average On a par
Pe
rce
nta
ge
DCC's ASCOF performance compared with similar 'matched' authorities
Our Performance comparing 2014/15 and 2015/16
2014/15
2015/16

PUBLIC
10 | P a g e
The Cost of Care
Figure 3 – What we spent on Adult Care 2015/16
The chart above shows how the outturn budget was divided amongst the various
areas of Adult Care work during 2015/16. Tables 1 and 2 overleaf show the
breakdown of expenditure in 2015/16 compared with the previous year.
Together, these help to illustrate the fact that our expenditure has been split slightly
differently across the various Adult Care functions in order to accommodate the
constricted funding context and at the same time manage increased demand for
services.
Care Packages, 81.6%
Fieldwork, 6.0%
Prevention, 3.4%
Housing Related Support,
2.8%
Senior Management, 0.3%
Strategy & Commissioning,
1.7%
Business Services, 3.9%
Other, 0.3%
Adult Outturn Budget 2015/16
CONTROLLED
11 | P a g e
Table 1 - 2014/15 Adult Care Net
Expenditure
Service £m %
Care Packages 181.6 77.8
Fieldwork 17.7 7.6
Prevention 11.4 4.9
Housing Related
Support
11 4.7
Senior Management 0.7 0.3
Strategy &
Commissioning
2.0 0.9
Business Services 8.2 3.5
Other 0.8 0.3
Sub-total 233.4
Health Contribution (16.5)
2014/15 Spend 216.9 100%
Table 2 – 2015/16 Adult Care Net
Expenditure
Service £m %
Care Packages 162.2 81.6
Fieldwork 11.9 6
Prevention 6.8 3.4
Housing Related
Support
5.5 2.8
Senior Management 0.6 0.3
Strategy &
Commissioning
3.4 1.7
Business Services 7.8 3.9
Other 0.6 0.3
Sub-total 198.8
Health Contribution 0.0
2015/16 Spend 198.8 100%
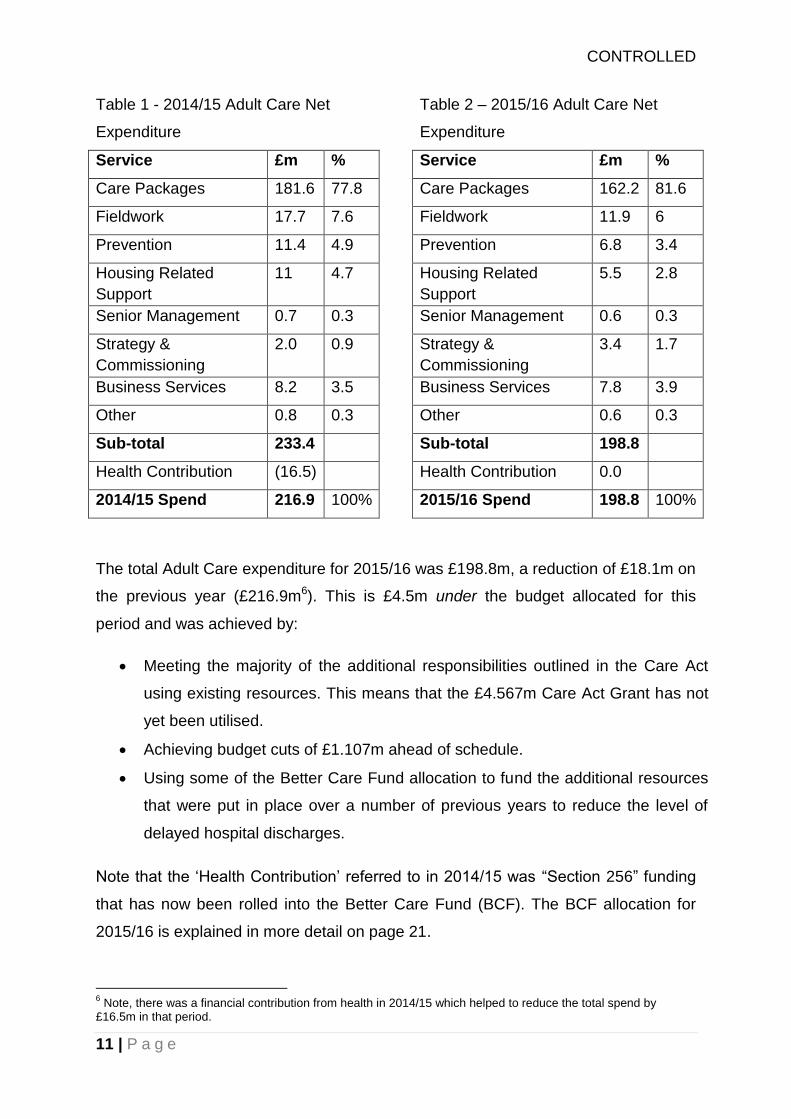
The total Adult Care expenditure for 2015/16 was £198.8m, a reduction of £18.1m on
the previous year (£216.9m6). This is £4.5m under the budget allocated for this
period and was achieved by:
Meeting the majority of the additional responsibilities outlined in the Care Act
using existing resources. This means that the £4.567m Care Act Grant has not
yet been utilised.
Achieving budget cuts of £1.107m ahead of schedule.
Using some of the Better Care Fund allocation to fund the additional resources
that were put in place over a number of previous years to reduce the level of
delayed hospital discharges.
Note that the ‘Health Contribution’ referred to in 2014/15 was “Section 256” funding
that has now been rolled into the Better Care Fund (BCF). The BCF allocation for
2015/16 is explained in more detail on page 21.
6 Note, there was a financial contribution from health in 2014/15 which helped to reduce the total spend by
£16.5m in that period.

PUBLIC
12 | P a g e
As expected, in 2015/16 the largest amount was spent on care packages (the
combination of services put together to meet a person’s assessed needs). Even
though the overall spending reduced, the proportion of the budget itself was around
4% higher, making up 81.6% of the total 2015/16 Adult Care expenditure compared
with 77.8% in 2014/15. Overall expenditure has reduced in all areas, but the
Department has protected statutory services as far as possible. As the spend on
care packages is all statutory, this has led to relatively fewer cuts and therefore an
increase in the overall percentage of spend.
This leaves 18.4% of expenditure; Fieldwork makes up the largest proportion of this
remaining area of cost, amounting to 6% of the overall expenditure compared with
7.6% the previous year. By far the biggest year-on-year reduction in expenditure can
be seen in the areas of Prevention (3.4%) and Housing Related Support (2.8%)
which made up 4.9% and 4.7% respectively of the expenditure for the previous year.
Strategy and Commissioning made up 1.7% of the overall expenditure in 2015/16
compared with 0.9% in 2014/15, with an increase in actual expenditure of £1.4m.
This additional expenditure is the contribution from Adult Care into the Better Care
Fund Pooled Budget (a budget created to assist in joint working between Adult Care
and Health), and represents a direct transfer of spend from the Prevention element
of the budget.
Whilst the amount spent on support services to Adult Care (including business
administration, IT, finance and management information) actually reduced, this made
up an increased proportion of the overall expenditure, from 3.5% to 3.9%.
Derbyshire’s spend on support services is relatively low and this has reduced the
opportunity for making further substantial cuts.
Costs relating to Senior Management and ‘Other’ have remained the same at 3%.
In the coming year we will need to make a number of savings; these will be achieved
through a range of actions including demand management, reduction in Housing
Related Support services and savings on the introduction of the Care Act.

PUBLIC
13 | P a g e
Complaints, Comments & Compliments
This section of the Local Account examines the feedback from clients and their
representatives received by Adult Care throughout 2015/16.
Where concerns are raised, staff at a local level will actively seek to resolve a
problem as soon as possible without the need for the more formal complaints
process to be entered into. However, where a formal complaint is requested, or local
resolution has been unsuccessful, the concerns will be logged and escalated to an
operational manager for action and follow up.7
The complaints process is governed by key areas of legislation and DCC’s own Adult
Care complaints process; in general, this involves working out a plan with the
aggrieved party on how the issue will be managed, agreeing a timescale, and
outlining what potential outcomes are reasonable to expect.
Whatever the issue, all feedback is dealt with in confidence, and, where appropriate,
there is an emphasis within the Department on taking responsibility and learning
from mistakes; similarly, we understand the importance of passing on positive
feedback.
Before considering the amount and type of feedback received, it is worth examining
the ‘bigger picture’ in terms of the volume of work handled within Adult Care. This
helps to place the numbers of complaints in context.
Between 1 April 2015 and 31 March 2016, 35,625 referrals were received from new
clients which resulted in a service (including signposting to other services).
Performance and Personalisation services (what used to be known as Fieldwork)
undertook 6,538 client assessments and 4,283 carers’ assessments. A total of
16,388 reviews were completed; this includes reviews of support plans and personal
service plans for clients receiving home care and day care.
7 Adult Care complaints include those which, according to the NHS and Social Care regulations, relate to social
care within the meaning of Part 1 of the Health and Social Care Act 2008

PUBLIC
14 | P a g e
Within Direct Care 1,746 clients received a home care service, 1,295 received day
care and 1,284 received care in a council run establishment.
WHAT DOES THE FEEDBACK RELATE TO?
Complaints, comments and compliments regarding Direct Care relate to those
services Derbyshire County Council delivers itself; for example, home care using our
own carers, plus council-run residential homes and day centres.
Those in respect of Prevention and Personalisation include those related to
assessment and services provided by third party organisations but contracted
through DCC. Feedback relating to home care fees, billing processes and brokerage
services are dealt with by the Commissioning and Performance division (formerly
Strategy and Commissioning).
Complaints arising from work undertaken by third party providers commissioned
through Adult Care are initially managed by individual providers’ complaints
procedures. Only if the issue remains unresolved are they passed to Adult Care.
Those services involving the most frequent and prolonged client contact inevitably
attract the largest proportion of feedback, namely Prevention and Personalisation,
and Direct Care.
Overall, 15% less feedback was received during 2015/16 compared with the
previous year; there were 391 compliments (467 in 2014/15) and 228 complaints
(260 in 2014/15).
COMPLIMENTS
It is always encouraging to receive positive feedback from clients about the work we
do in Adult Care as it represents formal acknowledgement of the degree to which
the work of our staff is valued.
Table 3 overleaf shows the distribution of compliments received, and split by
division, over the last three years.

PUBLIC
15 | P a g e
Table 3 - Breakdown of compliments received
COMPLIMENTS RECEIVED - BY DIVISION AND YEAR
Division 2013/14 2014/15 2015/16
Direct Care 292 (59%) 289 (62%) 240 (61%)
Prevention and Personalisation 192 (39%) 171 (37%) 143 (37%)
Commissioning and Performance 7 (2%) 7 (1%) 8 (2%)
Total 491 (100%) 467 (100%) 391 (100%)
This shows that, of the 391 compliments received, the majority, 240, were received
by Direct Care, 143 related to Prevention and Personalisation services, and the
remaining eight were received by Commissioning and Performance.
Whilst the overall number of compliments has dropped over the past two years, the
proportions across each division remain very similar, with the largest percentage
relating to Direct Care (59% to 62%), around one third (37% to 39%) directed at
Prevention and Personalisation services, and the remainder (1% to 2%) relating to
Commissioning and Performance.
COMPLAINTS
In terms of complaints, the past year has seen a decrease by about 9% in the
number received, from 260 in 2014/15 to 228 in 2015/16.
Table 4 shows how the complaints received over the past three years have split
according to Adult Care division. Although there was a small increase last year, the
overall number has now dropped to below the level recorded three years ago.

PUBLIC
16 | P a g e
Table 4 – Breakdown of complaints received
COMPLAINTS RECEIVED – BY DIVISION AND YEAR
Division
2013/14
2014/15
2015/16
Direct Care 56 (24%) 39 (15%) 64 (28%)
Prevention and Personalisation 169 (71%) 189 (73%) 143 (63%)
Commissioning and Performance 13 (5%) 32 (12%) 21 (9%)
Total
238 (100%)
260 (100%)
228 (100%)
Looking at the distribution of complaints across the divisions, this appears to have
shifted over this time. Whilst the number of complaints received overall has reduced,
there were more in relation to Direct Care than in the previous two years, and fewer
in respect of Prevention and Personalisation work. Those in relation to the
Commissioning and Performance division have reduced compared to last year,
making up around 9% of the total, but are still higher than the number recorded in
2013/14.
Around a quarter, 26% (60), of these complaints relate to the quality of our work
(issues such as a perceived lack of care provided, a care worker not attending or
arriving late for a meeting); a similar proportion (56) relate to poor communication.
Some of the other issues raised relate to disagreement over decisions made by
Adult Care, problems relating to charges or billing, and eligibility disputes8.
Figure 4 overleaf shows the outcomes of the complaints themselves. Nearly half
(47%) were not upheld; one in five (19%) were partially upheld, and around a quarter
(26%) were upheld. The remaining 8% were either dealt with under other
procedures, withdrawn, unsubstantiated, or had not been concluded by the end of
the relevant financial year.
8 For more detailed information please refer to the Annual Compliments and Complaints Report 2015-16
available on the DCC website.

PUBLIC
17 | P a g e
Figure 4 – Outcomes of the complaints received
HOW THE COMPLAINTS PROCESS WORKS
Over the past three years the Department has become better at acknowledging
complaints within the regulatory three-day timeframe. During 2015/16 this was
achieved in 93% of cases, (compared with 91% in 2014/15 and 87% in 2013/14).
We aim to respond to 80% of complaints within the timescale indicated at the time of
acknowledgement; this should be within ten working days (or 20 for more complex
cases). This is an area that shows marked improvement, in part because more
realistic timescales are now being given to complainants. Overall, 169 complaints
(74%) were responded to within the timescale given at the time of the
acknowledgement; by comparison, the timescale was met in just 53% of cases in
2014/15.
SERVICE ENQUIRIES
This refers to requests for a change or adjustment to a service or for information on
how a decision has been reached. Correspondence from MPs and Elected Members
will usually be categorised under this heading where they are representing a
constituent with a concern.
Upheld 59, 26%
Partially upheld 43, 19%
Not upheld 108, 47%
Other 18, 8%
Complaints outcomes

PUBLIC
18 | P a g e
The number of Service Enquiries dealt with by Adult Care this year was 108. Of
these 72 were from MPs and 22 from County Councillors on behalf of their
constituents, the remaining 14 were from clients or their representatives. The
number of enquiries from MPs shows a decrease from 83 in 2014/15 and 85
enquiries in 2013/14.
CORPORATE COMPLAINTS
A further nine complaints were handled under the DCC corporate complaints
process which deals those that fall outside the legal parameters for Adult Care
complaints. This number is considerably lower than the previous two years (35 in
2014/15 and 27 in 2013/14). Two of the nine complaints were upheld.
LOCAL GOVERNMENT OMBUDSMAN COMPLAINTS AND ENQUIRIES
If a client is not satisfied with the response to a complaint they have raised with Adult
Care, they may ask the Local Government Ombudsman (LGO) to investigate it
further; the LGO will then look into how DCC has handled the complaint and
comment on its findings. 21 complaints were received by the LGO in 2015/16, up
from 11 in the previous year and seven in 2013/14.
Of the 21 received, Adult Care was found not to be at fault in three cases, fault was
found in five cases, and the LGO decided not to investigate a further four. Seven
cases were passed to Adult Care as they had not yet been through our own process;
the outcomes are awaited in the two remaining cases.
IMPROVEMENTS RESULTING FROM COMPLAINTS RECEIVED
Dealing with a complaint successfully is not the end of the process for Adult Care;
we want to learn from feedback which can translate to making changes to working
practices and processes. Here are some examples:
There were comments about difficulties in knowing which staff were
responsible for which role within DCC’s residential care homes. As a result,
different coloured polo shirts were introduced to help differentiate carers, staff

PUBLIC
19 | P a g e
responsible for residents’ activities and those involved in domestic duties.
More prominent name badges were also brought in.
Feedback was received that the standard 10-day period for collecting
equipment following bereavement (such as commodes, ‘grabbers’ and kitchen
aids) was too long. As a result, a new three-day collection was introduced in
December 2015.
Concerns over lack of information have led to the introduction of factsheets for
the general public and updates to staff on specific issues to help build
knowledge.

PUBLIC
20 | P a g e
Adult Care priorities 2016/17
As a result of tremendous financial pressures, Derbyshire, like all local authorities, is
having to come up with new ways of delivering Adult Care services to meet the
needs of the most vulnerable members of our society.
Adult Care has had to make very considerable savings in the last three years and
the need to find further savings will continue for the forseeable future9. At the same
time, eligible need will continue to rise; it will be around 18% higher in 2019/20
(39,000 people) than it was in 2010/11 (33,000), and the projected budget will be
28% less than it was in 2010/11.
This means that we have to manage our finances very carefully when deciding what
our priorities will be for the coming year. First, however, it is first important to
consider the changes to the law, amendments to policy and guidance, which will
impact on what we do and how we do it.
The Care Act 2014 - We have already made great strides in changing our working
practices to ensure that we meet our obligations under the Care Act. However,
bearing in mind the extensive reach of this piece of legislation, and the severe
constraints on funding, we will have to work harder to meet our legal obligations in
the coming year. Here are some of the areas we will be focusing on:
Continuing our programme to strengthen the provision of information, advice
and advocacy.
Improving moves from Children’s Services, to ensure young people are better
supported in their transition to Adult Care.
Shaping and managing local social care provision, by communicating the
nature of need, maintaining positive relationships with stakeholders and
providers, and improving the way we identify and mitigate risk of provider
failure.
Safeguarding the most vulnerable people in our county, by continuing to work
with partners to managing the safety and wellbeing of those most at risk.
9 Adult Care & Public Health Service Plan 2016-17, The Impact of Austerity, pages 15 -16.

PUBLIC
21 | P a g e
Introducing new arrangements to support Derbyshire’s informal carers,
including the development of a revised carers’ strategy.
The Better Care Fund – This is a single pooled budget of existing expenditure
designed to support local joint-working practices between health and social care
services. The total fund for 2016/17 is just under £65m, with £33.9m of this allocated
to Adult Care. However, we have to work hard to fulfil the conditions attached to the
fund which include, for example, taking a joint approach to assessments and care
planning, and working to reduce hospital discharge delays into social care support.
We are also continuing to measure the rate of dementia diagnosis in Derbyshire as
part of our Better Care Fund work.
Integration with health – DCC is strengthening the collaboration between health and
social care in a number of ways. For example, we have already placed registered
social workers with Derbyshire community health colleagues in the same locations to
help manage discharge from hospital better. Other changes may be required to
support the local NHS in the delivery of its Sustainability and Transformation Plan
(STP) which is likely to see further closer working over the next 12 to 24 months.
Supporting people with learning disabilities – both the NHS and local authorities are
required to deliver a new model of care in support of people with learning disabilities
by 2019. A Transforming Care Partnership has therefore been set up to build on
existing work in this area and help make this happen.
How does all this translate to plans for 2016/17? Here are some of the priorities for
the coming year:
Prepare the Adult Care workforce with the skills to manage the complex social
care needs of an ageing population.
Support more people with disabilities and long term health conditions into
work.
Help build resilient communities by implementing Local Area Co-ordination
plans in more areas of Derbyshire.
Help people to get their voices heard by providing sustainable advocacy
services for those that need them.

PUBLIC
22 | P a g e
Develop integrated models of working in partnership with NHS and other
stakeholders that focus on ‘whole person care’.
Work together with health partners to help provide the right care, at the right
time and in the right place, for those with mental health problems.
Increase the number of Safe Places for people with learning disabilities to go
to if they feel scared, threatened or are in trouble (see page 44).
Work with children and adult safeguarding partners to help protect vulnerable
people and reduce inappropriate police detentions.
Provide better access to employment and volunteering opportunities for
people with mental health needs and learning disabilities.
Help people struggling with poverty by providing emergency funding though
the Derbyshire Discretionary Fund.
Increase pensioners’ income through a targeted welfare rights campaign that
ensures they receive all the benefits they are entitled to.
Promote social inclusion and stimulate opportunity for young people moving
into adulthood through joint working initiatives.
Continue to reduce avoidable admissions to hospital and long term residential
and nursing care placements.
Improve outcomes for people with dementia and their families by developing
the Dementia Support Service in partnership with Derby City Council.
Improve quality, accessibility and performance of service providers to help
improve standards and reduce provider failures.
Progress a range of development projects that will provide quality care and
support facilities such as the new Community Care Centre in Darley Dale.
Redesign our day opportunities for older people and those with learning
disabilities in order to provide improved person-centred care and support, and
integrate these with Health where possible.
Establish new information, advice and rehabilitation services for people with
sight impairments.
Introduce carers’ personal budgets linked to identified needs, and ensure that
providers are proactive in their work with carers.
Place dignity and respect at the heart of provider services by encouraging
take up of the Derbyshire Dignity Award.

PUBLIC
23 | P a g e
Continue to promote high standards of social work practice led by the
Principal Social Worker.
Develop appropriate housing options that enable more people with learning
disabilities and/or autism to live in the community.
Expand the Community Connector service so that it helps more people with
learning disabilities increase independence through the development of better
community links.

PUBLIC
24 | P a g e
Public Health priorities 2016/17
In 2016/17 a new organisational arrangement was put in place when Public Health
and Adult Care became one department. This will allow us to work more closely in
managing social care need in Derbyshire, particularly in terms of preventing (and
delaying) that need, and also helping to manage demand for services.
Our aim for 2016/17 is to reduce health inequalities, and support and promote
healthy lifestyles for the people of Derbyshire. Specifically, we are planning to:
Deliver Public Health leadership through the following:
Review all Public Health commissioned physical activity programmes to
ensure value for money and improve access for key groups such as those at
risk of falling.
Support the training and development of public health specialists and
practitioners, including supporting local implementation of the regional Public
Health Practitioner Registration Scheme.
Enhance the skills of the wider public health workforce through delivery of
programmes such as Making Every Contact Count.
Produce a Director of Public Health Annual Report focusing on Healthy
Places.
Continue to play a lead role in developing and advising the Health and
Wellbeing Board to support effective delivery of improved health outcomes
through the Health and Wellbeing Strategy implementation.
Deliver a programme of Public Health Network training events to share good
practice and enhance public health awareness.
Deliver an updated State of Derbyshire report as part of the Joint Strategic
Needs Assessment (JSNA) in order to inform the Health and Wellbeing Board
of the key public health, healthcare and social care priorities in Derbyshire.
Facilitate the assessment of health impacts of major policy and programme
changes as part of the council’s procedures for carrying out Equality Impact
Assessments (EIAs).

PUBLIC
25 | P a g e
Support local planning authorities to achieve a healthy built and natural
environment by promoting health and wellbeing through ‘place-shaping’, for
example better housing and urban design and access to well-designed public
spaces and facilities.
Further develop the locality programme linked to delivery of the prevention
agenda and development of STP ‘places’.
Implement the Derbyshire substance misuse strategic plan.
Improve health and wellbeing through the following:
Engage with more organisations in the Workplace Health programme.
Deliver the Healthy Child Programme to all families in Derbyshire and develop
a Healthy School Community model to build health into all aspects of life at
school and in the community.
Support people at risk of food poverty through initiatives such as Super
Kitchens and the Fareshare hub.
Increase the number of adults aged 40-74 taking up the offer of a NHS Health
Check, targeting specific geographical areas and younger men in the age
criteria.
Support pregnant smokers to quit by providing Babyclear training for
midwives, providing CO monitoring equipment and ensuring that effective
electronic referral systems are in place.
Develop an all-age mental ill-health prevention framework.
Raise awareness of the Live Life Better Derbyshire service and increase the
number of people accessing stop smoking services and successfully quitting
smoking.
Enhance children’s health and emotional wellbeing by ensuring all families
receive support and guidance through the Healthy Child Programme.
PUBLIC
26 | P a g e
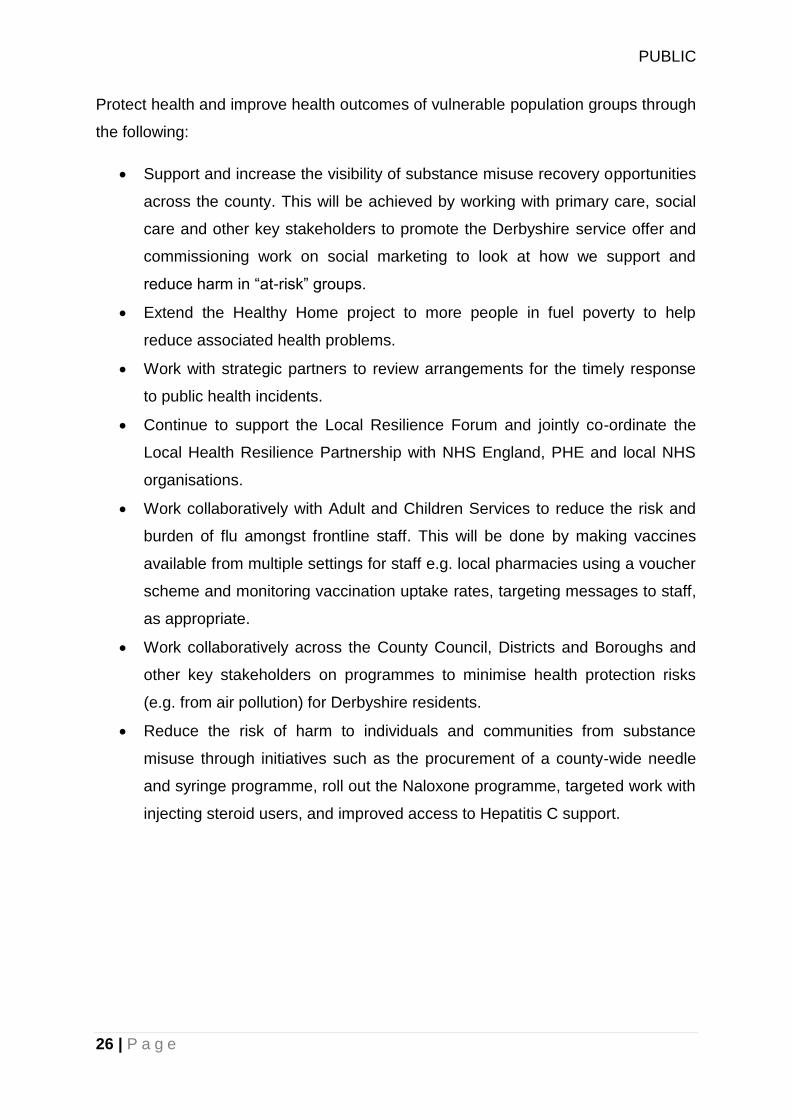
Protect health and improve health outcomes of vulnerable population groups through
the following:
Support and increase the visibility of substance misuse recovery opportunities
across the county. This will be achieved by working with primary care, social
care and other key stakeholders to promote the Derbyshire service offer and
commissioning work on social marketing to look at how we support and
reduce harm in “at-risk” groups.
Extend the Healthy Home project to more people in fuel poverty to help
reduce associated health problems.
Work with strategic partners to review arrangements for the timely response
to public health incidents.
Continue to support the Local Resilience Forum and jointly co-ordinate the
Local Health Resilience Partnership with NHS England, PHE and local NHS
organisations.
Work collaboratively with Adult and Children Services to reduce the risk and
burden of flu amongst frontline staff. This will be done by making vaccines
available from multiple settings for staff e.g. local pharmacies using a voucher
scheme and monitoring vaccination uptake rates, targeting messages to staff,
as appropriate.
Work collaboratively across the County Council, Districts and Boroughs and
other key stakeholders on programmes to minimise health protection risks
(e.g. from air pollution) for Derbyshire residents.
Reduce the risk of harm to individuals and communities from substance
misuse through initiatives such as the procurement of a county-wide needle
and syringe programme, roll out the Naloxone programme, targeted work with
injecting steroid users, and improved access to Hepatitis C support.

PUBLIC
27 | P a g e
Provide Public Health support to the NHS (Healthcare Public Health) by delivering on
the following:
Provide support for reducing clinical variation with a key focus on primary care
quality.
Support a programme of work on the role of Clinical Commissioning Groups
(CCGs) in prevention, based on the NHS Five Year Forward View.
Produce a State Of Cancer report for a range of major groups of cancers
covering prevention, early identification, treatment and recovery services.
Support CCGs to develop improved End of Life Care in Derbyshire.

PUBLIC
28 | P a g e
Appendix
Figure 6 – Social care related quality of life
This indicator gives an idea of the quality of life for users of social care
support. It is a composite measure based on eight questions in the Adult
Social Care Survey.
Derbyshire’s measure (19.3) shows a slight improvement on 2014/15 (19.1).
Like last year, Derbyshire’s service users rate their social care related quality
of life at a similar level as those in other authorities, those matched with us,
the England and East Midlands averages.
19.3 19.1 19 19.1
0
5
10
15
20
25
Derbyshire England Average East Midlands Average Similar Local AuthoritiesAverage
Po
ints
ou
t o
f 2
4
Social care related quality of life
NHS Digital I 2016

PUBLIC
29 | P a g e
Figure 7 – Proportion of people who use services who have control over their daily
life
‘Personalisation’ is about matching services with what that individual both
needs and wants, thereby putting them in control of their care and support.
Asking users of Adult Care services the extent to which they feel in control of
their daily lives is one way of measuring whether or not this outcome is being
achieved.
Like last year, the amount of control that service users in Derbyshire have in
their daily lives is lower than the recorded level in our matched local
authorities.
However, the gap appears to be closing. Derbyshire’s indicator has increased
slightly (from 75%), and the percentage recorded by the local authorities we
are compared with has dropped (from 79% last year).
75.3 76.6 76.4 77.6
0
20
40
60
80
100
Derbyshire England Average East Midlands Average Similar Local AuthoritiesAverage
Pe
rce
nta
ge (
%)
Service users with control over their daily life
NHS Digital I 2016

PUBLIC
30 | P a g e
Figure 8 – Proportion of adults receiving self-directed support
When an individual is allocated a budget, and the freedom to decide how this
is spent in achieving their social care outcomes, this is known as ‘self-directed
support’.
This ASCOF measure is designed to reflect the progress made by local
authorities in delivering personalised services in this way and is based on
their own data.
All the categories above show increases compared with the previous year, but
the increase for Derbyshire is quite marked, rising to 92.1% from 85.7% in
2014/15.
This is likely to be the result of efforts to meet the responsibilities of the Care
Act which came into force in April 2015. This places responsiblities on local
authorities to work with people to enhance their wellbeing, and to do so in a
way that places the individual at the heart of the process – the essence of
self-directed support.
92.1 86.9
96
85
0
20
40
60
80
100
Derbyshire England Average East Midlands Average Similar Local AuthoritiesAverage
Pe
rce
nta
ge (
%)
People receiving self-directed support
NHS Digital I 2016
PUBLIC
31 | P a g e
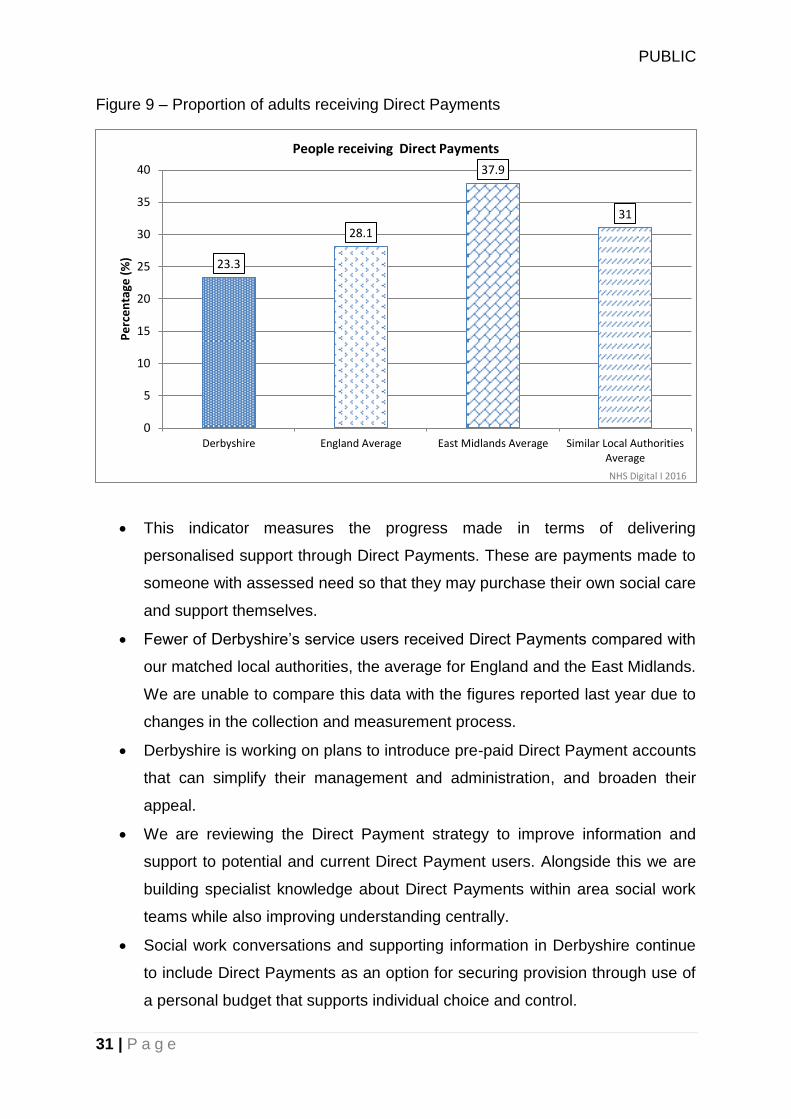
Figure 9 – Proportion of adults receiving Direct Payments
This indicator measures the progress made in terms of delivering
personalised support through Direct Payments. These are payments made to
someone with assessed need so that they may purchase their own social care
and support themselves.
Fewer of Derbyshire’s service users received Direct Payments compared with
our matched local authorities, the average for England and the East Midlands.
We are unable to compare this data with the figures reported last year due to
changes in the collection and measurement process.
Derbyshire is working on plans to introduce pre-paid Direct Payment accounts
that can simplify their management and administration, and broaden their
appeal.
We are reviewing the Direct Payment strategy to improve information and
support to potential and current Direct Payment users. Alongside this we are
building specialist knowledge about Direct Payments within area social work
teams while also improving understanding centrally.
Social work conversations and supporting information in Derbyshire continue
to include Direct Payments as an option for securing provision through use of
a personal budget that supports individual choice and control.
23.3
28.1
37.9
31
0
5
10
15
20
25
30
35
40
Derbyshire England Average East Midlands Average Similar Local AuthoritiesAverage
Pe
rce
nta
ge (
%)
People receiving Direct Payments
NHS Digital I 2016
PUBLIC
32 | P a g e
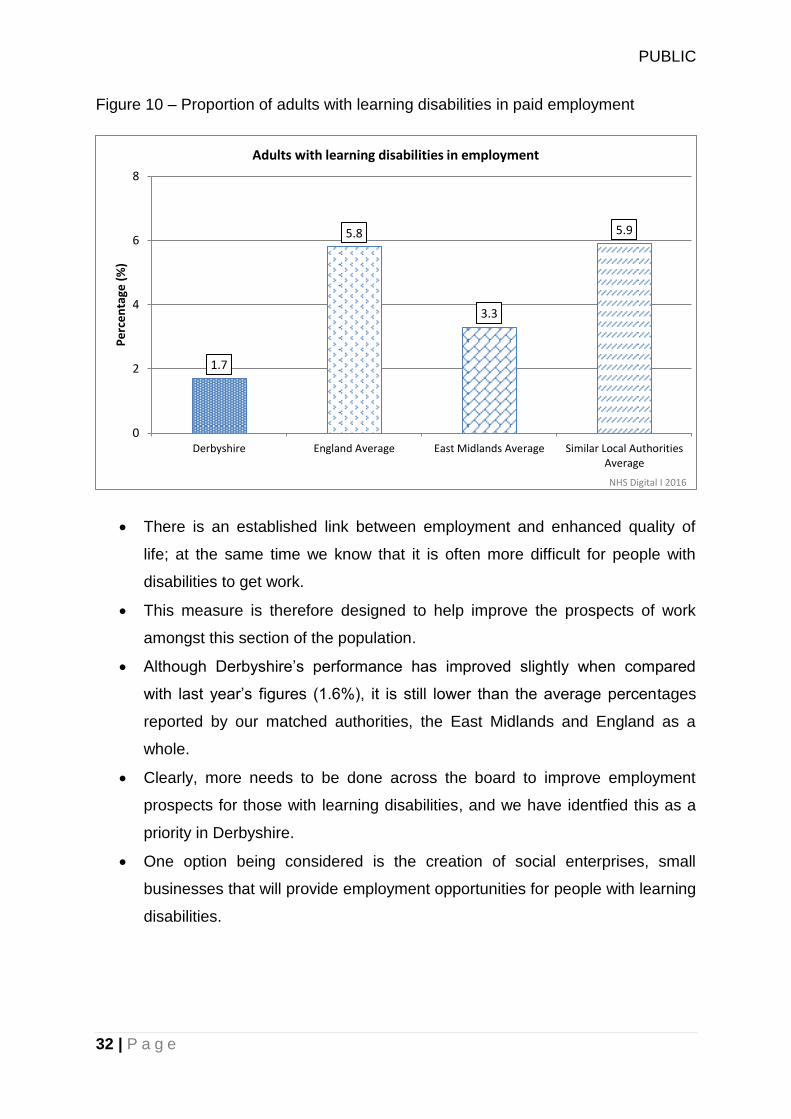
Figure 10 – Proportion of adults with learning disabilities in paid employment
There is an established link between employment and enhanced quality of
life; at the same time we know that it is often more difficult for people with
disabilities to get work.
This measure is therefore designed to help improve the prospects of work
amongst this section of the population.
Although Derbyshire’s performance has improved slightly when compared
with last year’s figures (1.6%), it is still lower than the average percentages
reported by our matched authorities, the East Midlands and England as a
whole.
Clearly, more needs to be done across the board to improve employment
prospects for those with learning disabilities, and we have identfied this as a
priority in Derbyshire.
One option being considered is the creation of social enterprises, small
businesses that will provide employment opportunities for people with learning
disabilities.
1.7
5.8
3.3
5.9
0
2
4
6
8
Derbyshire England Average East Midlands Average Similar Local AuthoritiesAverage
Pe
rce
nta
ge (
%)
Adults with learning disabilities in employment
NHS Digital I 2016

PUBLIC
33 | P a g e
Figure 11 – Proportion of adults in contact with secondary mental health services in
paid employment
If an individual’s mental health needs cannot be supported by primary care
services, they may be referred for more specialist support known as
secondary care, (provided by community mental health teams, and other
mental health service providers). This indicator measures the employment of
those adults that are in contact with these services.
Derbyshire’s performance is better than that of similar authorities, the national
and East Midlands average. Having said that, Derbyshire has dropped from
11.7% in 2014/15 while the percentage for simlar authorities has increased
slightly from 8.7% in 2014/15.
D2N210 funding for the Inspire Programme will help Derbyshire residents with
serious mental illness to get back to work or support them towards
employment.
In addition, the Recovery and Peer Support service will be in place from April
2017, one of the aims of which is to improve employment outcomes for people
with mental ill health.
10
D2N2 is the Local Enterprise Partnership for Derby, Derbyshire, Nottingham and Nottinghamshire
9.4
6.7
4.7
9
0
3
5
8
10
13
15
Derbyshire England Average East Midlands Average Similar Local AuthoritiesAverage
Pe
rce
nta
ge (
%)
Adults in contact with mental health services in paid employment
NHS Digital I 2016

PUBLIC
34 | P a g e
Figure 12 – Proportion of adults with learning disabilities who live in their own home
or with their family
This indicator examines the percentage of adults with a learning disability
living in a stable and appropriate home environment, a factor known to affect
overall quality of life.
Although the percentage for Derbyshire is significantly higher than that of the
similar local authorities, the East Midlands and the England average, it has
dropped over the last 12 months, as has the performance across all these
comparator groups.
It is important to consider this in the context of Derbyshire’s historical
performance with this indicator, as percentages increased year on year prior
to this point (from 59.5% in 2010/11 to 88.8% in 2014/15).
The reason for this reduction is not clear. However, one possible factor may
be the proposed changes in housing benefit resulting in the removal of
enhanced rates to accommodation providers of people with learning
disabilities. This may in turn have led to a reduction in the amount of available
accommodation being put forward in this sector of the market due to lack of
confidence in future funding.
84.3
75.4 76.3 75.9
0
20
40
60
80
100
Derbyshire England Average East Midlands Average Similar Local AuthoritiesAverage
Pe
rce
nta
ge (
%)
Adults with learning disabilities in stable accommodation
NHS Digital I 2016

PUBLIC
35 | P a g e
Figure 13 – Proportion of adults in contact with secondary mental health services
who live independently, with or without support
This measure is intended to improve outcomes for adults with mental health
problems by demonstrating the proportion in stable and appropriate
accommodation. This is closely linked to improving individual safety and
reducing risk of social exclusion.
Although Derbyshire shows a large increase over the last 12 months (from
57.1% in 2014/15), and current figures are significantly higher than our
matched local authorities, the national and East Midlands averages, this
significant upward trajectory must be considered with caution.
Due to changes in the collection methods in January 2016, the 2015/16
outcomes are based on eight months of data rather than the usual 12. As a
result, the ASCOF measures have been calculated using an average over
part of the year.
The outcomes for 2016/17 will therefore provide a more realistic indication of
performance in this measure, but, again, it will not be possible to make robust
year-on-year comparisons until the subsequent ASCOF has been published.
82.1
58.6
48.1 53.9
0
25
50
75
100
Derbyshire England Average East Midlands Average Similar Local AuthoritiesAverage
Pe
rce
nta
ge (
%)
Adults in contact with mental health services in stable accommodation
NHS Digital I 2016

PUBLIC
36 | P a g e
Figure 14 - Proportion of people who use services who reported that they had as
much social contact as they would like
Loneliness is known to impact on an individual’s mental and physical health.
This indicator is therefore based on responses to the ASCS in which social
care users were asked to indicate the level of social contact they experienced.
The percentage of service users in Derbyshire that consider that they have as
much social contact as they would like is higher than those in our comparator
group of local authorities and the East Midlands, plus the national average.
This measure is also higher than last year’s reported figure for Derbyshire of
42.4%.
47.2 45.4
43.4 44.8
0
10
20
30
40
50
Derbyshire England Average East Midlands Average Similar Local AuthoritiesAverage
Pe
rce
nta
ge (
%)
Service users with as much social contact as they would like
NHS Digital I 2016

PUBLIC
37 | P a g e
Figure 15 – Long term support needs of adults aged 18-64 met by admission to
residential and nursing care homes, per 100,000 population
As a general rule, people prefer to stay in their own homes rather than move
into residential care. Avoiding long term placements of this kind is therefore
considered a good measure of individual independence.
Unfortunately, because of changes in the collection and measurement
process, we are unable to compare this data with the figures for 2014/15.
Although the level of Derbyshire’s admissions to long-term care for those
aged 18-64 is higher than our matched local authorities and above that for the
East Midlands authorities, it is slightly lower than the average for England.
In an effort to reduce long term care admissions for this age group,
Derbyshire has improved co-ordination of access to Supported Living
options11 for those with a learning disability. We have also continued to
develop other living options for vulnerable adults in this age group through
programmes such as Shared Lives12.
11
Supported living provides support and accommodation to help clients live as independently as possible. 12
Shared Lives provides accommodation based in approved family homes for those who rely on the help and support of others help maintain independence.
12.9 13.3
11.3 12.6
0
5
10
15
20
25
Derbyshire England Average East Midlands Average Similar Local AuthoritiesAverage
Pe
r 1
00
,00
0 p
eo
ple
Permanent admissions to care homes: people aged 18-64
NHS Digital I 2016

PUBLIC
38 | P a g e
Figure 16 – Long term support needs of adults aged 65 and over met by admission
to residential and nursing care homes, per 100,000 population
As mentioned under Figure 15, avoiding permanent placements in residential
and nursing care homes is a good measure of delaying dependency.
Again, we are unable to compare this data with the figures reported last year
due to changes in the collection and measurement process.
However, it is possible to see that Derbyshire admitted a higher rate of people
aged 65 and over to long term care placements than our matched authorities,
the East Midlands and England average.
It is a strategic aim within Derbyshire to help reduce this high long term
admissions rate, and we hope to see improvements on this figure in next
year’s performance data.
730.7
628.2 612.7 589.6
0
200
400
600
800
Derbyshire England Average East Midlands Average Similar Local AuthoritiesAverage
Pe
r 1
00
,00
0 p
eo
ple
Permanent admissions to care homes: people aged 65 and over
NHS Digital I 2016

PUBLIC
39 | P a g e
Figure 17 – Proportion of older people (65 and over) who were still at home 91 days
after discharge from hospital into reablement/rehabilitation services (effectiveness of
the service)
Reablement services support people in their own homes after leaving hospital
as a result of illness or injury. They also form part of the Better Care Fund
national measures which require that this indicator is at least 82.5%.
Unfortunately, this has dropped in Derbyshire compared with last year
(87.1%) when we had the highest proportion of older people still living at
home three months after reablement (compared with our matched authorities
plus the East Midlands and England average). We also now compare
unfavourably with these comparators in this year’s figures13.
However, the indicator is reported using data collected during the final quarter
when performance dipped significantly in Derbyshire and also when there was
a 27% increase in referrals compared with the previous quarter. The service
also coped with a higher number of clients overall in 2015-16 than in 2014-15.
We are currently undertaking a comprehensive review of the reablement
service; part of this work is looking into ways of targeting the service more
effectively.
13
Taking this into account, actual performance for 2015-16 was 82.0%.
77 82.7 80.5
84.1
0
20
40
60
80
100
Derbyshire England Average East Midlands Average Similar Local AuthoritiesAverage
Pe
rce
nta
ge (
%)
Older people at home 91 days after leaving hospital into reablement
NHS Digital I 2016

PUBLIC
40 | P a g e
Figure 18 – Delayed transfers of care from hospital which are attributable to adult
social care per 100,000 population
This examines the prevalence of delayed transfers (when someone is ready
to leave hospital but is still occupying a bed) which are ascribed to social care;
the lower the figure the better the performance level.
Not only is Derbyshire’s 2015/16 figure better than the England, regional and
similar authorities’ average, our performance has improved compared with
last year; in 2015/16 Derbyshire recorded 2.7 delayed transfers per 100,000
people compared with 3.3 in 2014/15.
Another notable shift in the last 12 months is that, while the 2014/15 figures
show Derbyshire with a similar performance across the national (3.7), East
Midlands (3) and matched local authorities average (3.8), in 2015/16 the
figures have become more disparate.
The reduction in delays attributable to Adult Care can be linked to the
investment in, and commitment to, increasing social work capacity within the
acute hospital sector. During 2015-16 staffing teams were co-located in both
Chesterfield and Derby hospitals to facilitate the timely discharge of people
back home.
2.7
4.7
3.7
5.6
0
1
2
3
4
5
6
Derbyshire England Average East Midlands Average Similar Local AuthoritiesAverage
Pe
r 1
00
,00
0 p
eo
ple
Delayed transfers of care attributable to social services
NHS Digital I 2016
PUBLIC
41 | P a g e
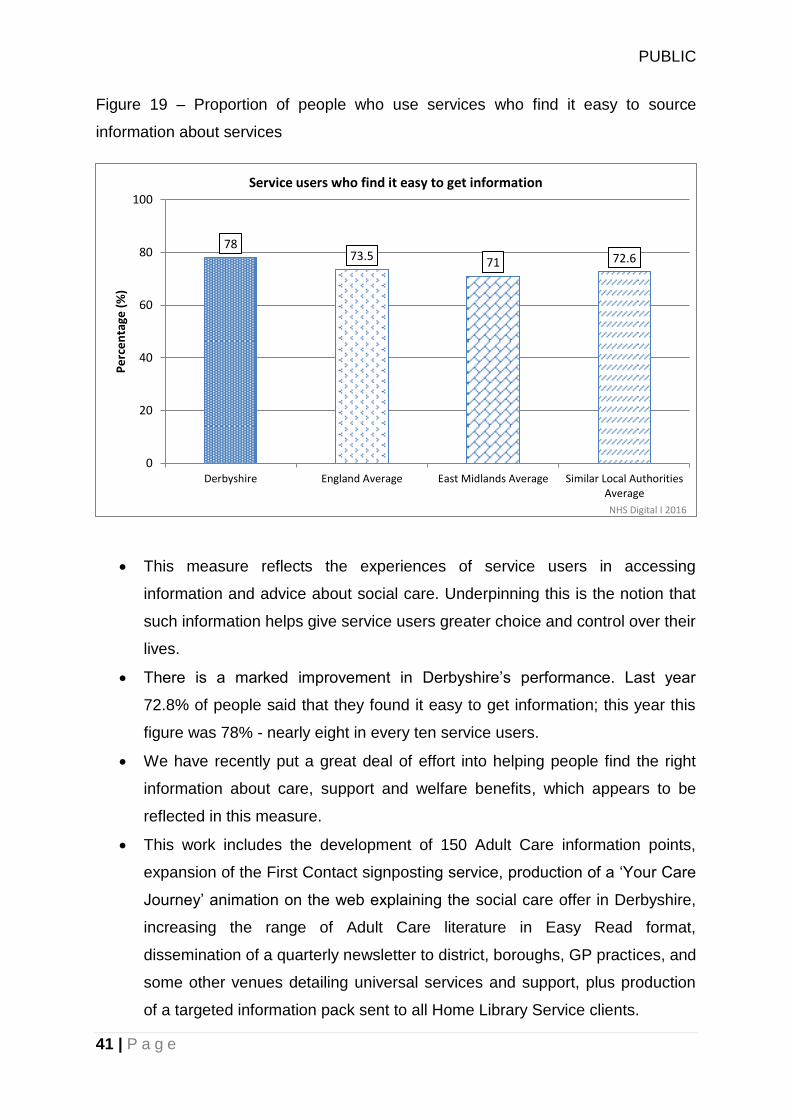
Figure 19 – Proportion of people who use services who find it easy to source
information about services
This measure reflects the experiences of service users in accessing
information and advice about social care. Underpinning this is the notion that
such information helps give service users greater choice and control over their
lives.
There is a marked improvement in Derbyshire’s performance. Last year
72.8% of people said that they found it easy to get information; this year this
figure was 78% - nearly eight in every ten service users.
We have recently put a great deal of effort into helping people find the right
information about care, support and welfare benefits, which appears to be
reflected in this measure.
This work includes the development of 150 Adult Care information points,
expansion of the First Contact signposting service, production of a ‘Your Care
Journey’ animation on the web explaining the social care offer in Derbyshire,
increasing the range of Adult Care literature in Easy Read format,
dissemination of a quarterly newsletter to district, boroughs, GP practices, and
some other venues detailing universal services and support, plus production
of a targeted information pack sent to all Home Library Service clients.
78 73.5 71 72.6
0
20
40
60
80
100
Derbyshire England Average East Midlands Average Similar Local AuthoritiesAverage
Pe
rce
nta
ge (
%)
Service users who find it easy to get information
NHS Digital I 2016

PUBLIC
42 | P a g e
Figure 20 - Delayed transfers of care from hospital per 100,000 population
This measure illustrates the prevalence of delays in people transferring
from hospital into Adult Care support. This looks at these delays in general
terms, rather than Figure 18 which examines delays specifically
attributable to social services. Similarly, the lower the figure, the better the
performance (the fewer the delays).
The figures show an improvement for Derbyshire compared with last year.
In 2014/15 there were 9.7 delays per 100,000 people; in 2015/16 this had
reduced to 8.5 delays. Again, as with last year, our performance is better
than the average figures for England, the East Midlands and our matched
local authority group.
Figure 18 explains the action Adult Care is taking in order to help manage
more timely discharge of people back home. It is worth noting that, whilst the
2015-16 performance represents a big improvement, across the country as a
whole delayed transfers of care rates started to increase towards the end of
the financial year. This upward trend is expected to continue during 2016-17.
8.5
12.1 12.7
14
0
3
5
8
10
13
15
Derbyshire England Average East Midlands Average Similar Local AuthoritiesAverage
Pe
r 1
00
,00
0 p
eo
ple
Delayed transfers of care
NHS Digital I 2016

PUBLIC
43 | P a g e
Figure 21 – Overall satisfaction of people who use services with their with care
and support
Like last year, Derbyshire’s rate of client satisfaction in terms of the quality
of care and support received is better than our matched authorities,
England and the East Midlands.
This indicator also shows a slight increase on last year’s figure (69% in
2014/15).
This is extremely encouraging bearing in mind the very difficult financial
pressures placed on social care currently.
70.1
64.4 64.1 64.6
0
20
40
60
80
Derbyshire England Average East Midlands Average Similar Local AuthoritiesAverage
Pe
rce
nta
ge (
%)
Client satisfaction with care and support
NHS Digital I 2016

PUBLIC
44 | P a g e
Figure 22 – Proportion of people who use services who feel safe
More of Derbyshire’s service users feel safe compared with the average
for England, the East Midlands and similar local authorities.
This percentage has increased from last year (65.2% in 2014/15) when
Derbyshire’s performance was also lower than the comparator groups.
A significant amount of work has been done over the year to expand the
Safe Place scheme and Keeping Safe Cards to support people with
learning disabilities. The number of safe places across the county has
increased from 51 to 114. The number of Keep Safe Cards has increased
from 145 to 413.
There are now Safe Places in all Derbyshire borough and district areas. 19
GP practices have signed up to the scheme and there is at least one of
these Safe Place practices in each Derbyshire borough or district. The
growth of the Safe Place scheme and Keeping Safe Cards is likely to have
made a contribution to improving our performance for this indicator.
70.6 69.2 68.2 69.4
0
20
40
60
80
Derbyshire England Average East Midlands Average Similar Local AuthoritiesAverage
Pe
rce
nta
ge (
%)
People who use services and feel safe
NHS Digital I 2016

PUBLIC
45 | P a g e
Figure 23 – Proportion of people who use services who say that those services
have made them feel safe and secure
Nearly 87% of service users in Derbyshire say that the Adult Care services
help them to feel safe.
Although Figure 22 indicates that more service users in Derbyshire feel
safe, the percentage those that say services play a part in this is slightly
lower than last year’s figure (90.3%), but still very positive.
This year’s indicator is higher than the national average but lower than the
regional figure, and that of our matched authorities.
86.9 85.4 88.5 87.6
0
25
50
75
100
Derbyshire England Average East Midlands Average Similar Local AuthoritiesAverage
Pe
rce
nta
ge (
%)
People who say the services they use make them feel safe and secure
Health & Social Care Information Centre I 2016

PUBLIC
46 | P a g e
Feedback
We’d like to know what you think about this Local Account. Please share with us
your thoughts by completing and returning this form.
1) How do you rate the content of the Local Account? [please tick one option]
Poor Fair Good Very Good Excellent
2) How do you rate the charts and tables? [please tick one option]
Poor Fair Good Very Good Excellent
3) Which of the following words would you use to describe the Local
Account? [please tick all those that apply]
Boring Confusing Helpful Interesting Informative
4) Please use the space below to tell us any other feedback you might have
about the Local Account, and ideas on how we can improve it.
Thank you. Please return this form to: Service Need & Evaluation Section,
Derbyshire County Council, County Hall, Matlock, DE4 3AG or email it to: