Embed Size (px)
Citation preview

Local approaches to fracture: material, geometry and load
history effects
Andrey P Jivkov
Research Centre for Radwaste and DecommissioningModelling and Simulation Centre
Materials Performance Centre

Outline
� Introduction
� Part 1: Cleavage fracture – Is the weakest link argument not the weakest link in the argument?
� Part 2: Ductile fracture – Load history effects on ductile initiation fracture toughness
� Closure

INTRODUCTION

Why Local Approaches (LA)?
� To provide better understanding of the failure micro-mechanisms, i.e. events in the fracture process zone
� To deal with conditions that cannot be handled with the classical fracture mechanics, e.g. K or J� Residual stresses in welds� Effects of pre-stressing (or prior load history in general)� Irradiation embrittlement� Constraint effects � Effects of loading rate
� To provide justification for advanced “global” or engineering approaches, such as the J-Q assessment

Current status in R6
� Cleavage fracture� Beremin cleavage model – provides probability of cleavage
fracture by means of a scalar Weibull stress that accounts for the stress development in the plastic zone (post-processing mode)
� Ductile fracture� Gurson-Tvergaard-Needlemen model – provides predictions of
the material softening due to micro-void nucleation, growth and coalescence via a constitutive damage-plasticity relation
� Rousselier model – as above with different constitutive relation� Beremin ductile model – incorporates Rice-Tracey model for
growth of spherical micro-voids; can be used for initiation of ductile tearing only (post-processing mode)
CLEAVAGE FRACTURE

Engineering context
� Ferritic steels exhibit cleavage fracture at sufficiently low temperatures – important for RPV low-alloy steels
� Cleavage fracture susceptibility depends on temperature via associated changes in elastic-plastic properties
Notes
o Average toughness increases with T
o Spread of toughness values increases with T
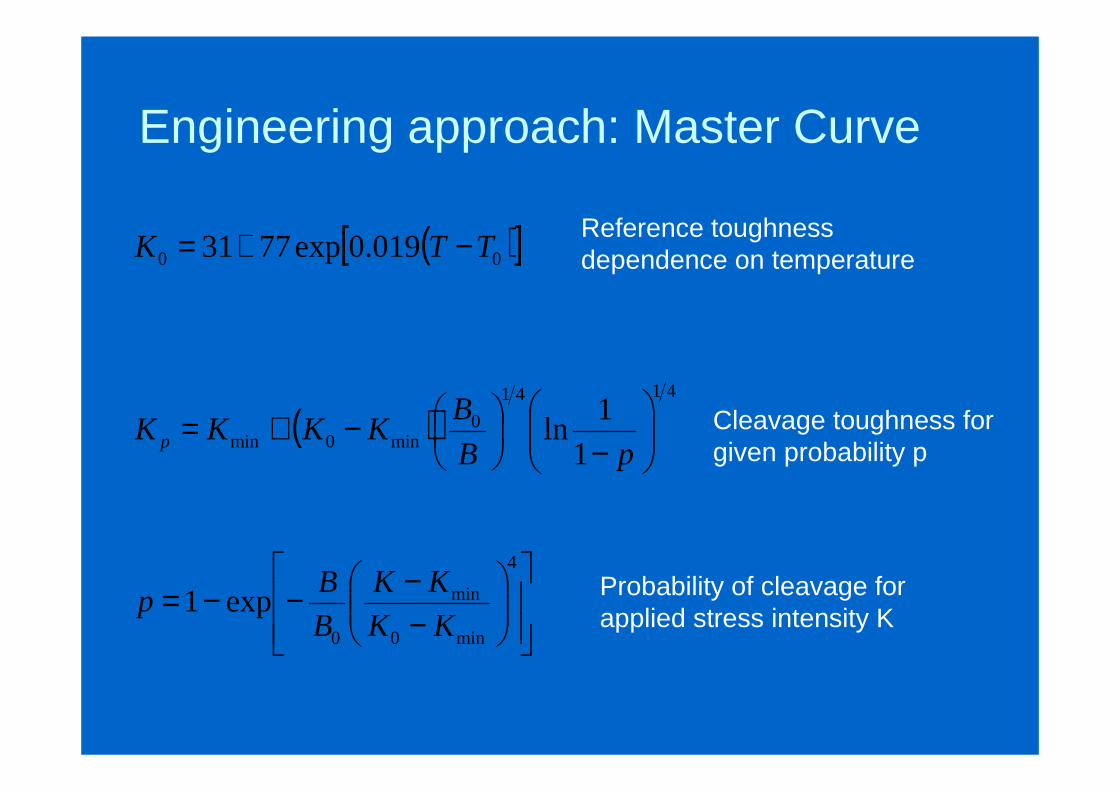
Engineering approach: Master Curve
Reference toughness dependence on temperature( )[ ]00 019.0exp7731 TTK −+=
( )4141
0min0min 1
1ln
−
−+=pB
BKKKK p
−−−−=
4
min0
min
0
exp1KK
KK
B
Bp Probability of cleavage for
applied stress intensity K
Cleavage toughness for given probability p

Irradiation and constraint effects
� Commonly represented by shifts in the DBTT (T0) – this is superficial for constraint and not soundly confirmed for irradiation
Notes
o Short crack (low-constraint) reduces T0
o Hardening mechanisms e.g. due to irradiation damage increase T0

Irradiation and constraint effects
� Are better characterised as cleavage fracture toughness changes at fixed temperature
Notes
o Irradiation damage reduces toughness via change of yield and flow properties
o Low-constraint increases effective toughness via change of fields

Defect tolerance assessment
� We need a model that can predict cleavage fracture behaviour as a function of defect geometry and loading configuration in a material with given in-service properties� Predict Master Curve (or calibrate against it)� Predict toughness changes due to material properties changes� Predict toughness changes due to loss of constraint
� We can achieve this only through understanding the failure mechanisms in the fracture process zone and incorporating these properly in the model

Mechanistic understanding
� Cleavage initiates by rupture of brittle second-phase particles due to plastic overload – micro-crack nucleation� Plastic strains are mandatory, but stress level and stress
triaxiality play role� Size effect is observed too: larger particles fail first
� Micro-cracks may extend into neighbouring grain(s) if sufficient opening stress is present – sub-grain growth
� Cleavage failure occurs when a micro-crack can be propagated by the present opening stress� Size distribution of micro-cracks and stress level of critical
importance� Plastic strains and stress triaxiality play role
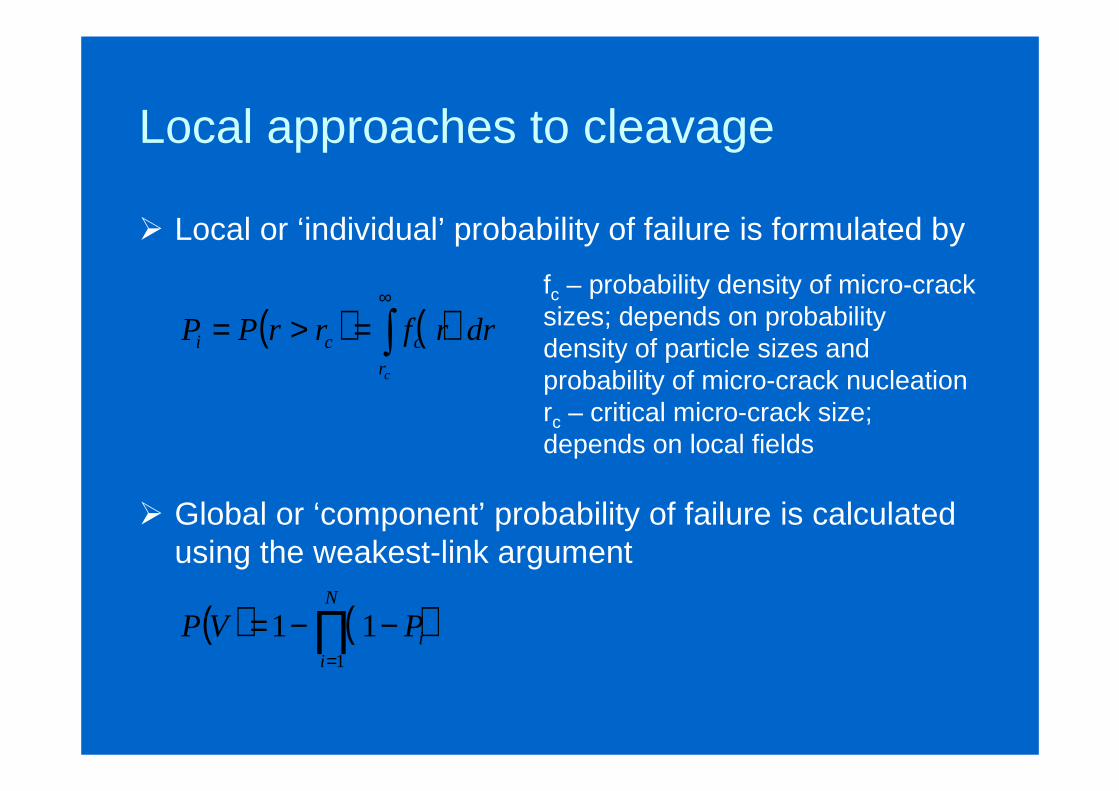
Local approaches to cleavage
� Local or ‘individual’ probability of failure is formulated by
( ) ( )∫∞
=>=cr
cci drrfrrPP
� Global or ‘component’ probability of failure is calculated using the weakest-link argument
( ) ( )∏=
−−=N
iiPVP
1
11
fc – probability density of micro-crack sizes; depends on probability density of particle sizes and probability of micro-crack nucleationrc – critical micro-crack size; depends on local fields

Weibull stress models (WSM)
� Assume fc = Pn fp (fp is probability density of particles)� Pn = 0 if εp = 0; Pn = 1 if εp > 0 – original Beremin model� Pn = c εp – later modifications (e.g. Gao et al 2006)� Pn = a εp exp(b σαα) – further modifications (e.g. Hohe et al 2008)
� Assume power-law for fp
� Calculate rc
� via Griffith
� via modified Griffith
( )α−
−=00
1
r
r
r
αrf p
( ) 2212 σν
γEπr s
c −=
( )( ) 2212
2/exp
σν
γEπr ps
c −=
ε

WSM summary
� Assumptions allow for closed form solution for Pi
where σeff depends on fields only and σu depends on material microstructure only
� Using FEA for Pi (element-wise), weakest-link, and assumption for smallness of Pi leads to
( ) ( )mueffueffiP σσσσ α == −22
( )
−−=
−−= ∑
m
u
w
k
mkeff
k
m
u V
VVP
σσσ
σexp1
1exp1 ,
0

Calibration issues
� For given m, the MC can be reproduced by varying σu –this is not physically acceptable as σu should depend on material microstructure only
� For given σu, the MC can be reproduced by varying m -this is also not physically acceptable as m = 2α-2 should depend on material microstructure only
� Increased plasticity requires increasing m (also at fixed temperature)
� In spite of these, people make calibrations to specific tests and try to extrapolate to all situations

Study: EURO Material A (22NiMoCr37)
� Start of life properties� Mechanical
� Fracture toughness with SEN(B): T0 = -104ºC with a/W = 0.5; T0,c = -128ºC with a/W = 0.1, i.e. ∆T0,c = -24ºC
� Properties of material irradiated at temperature 285°C to fluence 4.3 x 10¹⁹ n/cm2
� Mechanical
� Fracture toughness with SEN(B): T0,i = -78ºC with a/W = 0.5, i.e. ∆T0,i = 26ºC
20600090 +−= TE
( )91exp9.632.4210 T−+=σ( )108exp2.701.564 TUTS −+=σ
( )2.95/exp1.624.4900 T−+=σ( )2.188/exp1.1552.524 TUTS −+=σ20600090 +−= TE

WSM predictive capabilities
NoteResults (nearly) independent of model when large strain plasticity used, i.e. plasticity and triaxiality corrections have effect with small strain analysis

Wish list for WSM
Ideally we would like a model that� Keeps m constant, related to experimentally observed
size distribution of initiators
� Keeps σu constant with temperature, i.e. representing invariant material property
What can be improved� Better handle of fc(r) so it incorporates fp(r) and a fields-
and size-dependent criterion for particle rupture� Better handle of rc, so that all material changes are
incorporated in σeff

Microstructure-informed models (MIM)
‘Individual’ probability of failure
φr – measures the effect of local mechanical fields on the rupture of second phase particles; first factor = probability of particle rupture
φb– measures the effect of local mechanical fields on the blunting of nucleated micro-cracks; second factor = probability of micro-crack not blunting
rc – reflects changes in mechanical fields and material
( ) ( )∫∞
−
−−=>=
cr
pbrcci drrfr
r
r
rrrFP φφ
3
0
3
0
expexp1

Wallin-Saario-Torronen (WST) model
� Specific distribution of particle sizes – needs fitting
� Equal probability of rupture and blunting – needs calibration of σ0 and m
� Irwin-Orowan criterion for critical micro-crack size –needs calibration of γp with temperature
( ) ( )( ) ( )
−−
−Γ−=
−−
r
r
r
r
rrf p
0
00
1
2exp1
2 γγ
γγγ
m
partbr
σ
σ
==
0
φφ partmatrixmatrixpart Eεσ.σ 31=
( ) 2212
)(
σν
γEπr ps
c −+
=γ

New model 1
� Distribution of particle sizes – β = 2.7, r0 = 0.036 µm, ρ = 7.6×10¹⁷ m-3 (Ortner & Duff)
� Rupture factor – needs calibration of ψ0
� Blunting factor – needs calibration of ω0
( )
−
=
−−− ββ
0
1
00
expr
r
r
r
r
βrf p
( ) pαα
pF
Fr εσ
ν
νεσψ
ψ
ψ1
2
110 1
2 where,+
−==φ
pee
e
αα
e
ααD
Db dεσ
σ
σ
σ
σξdω
ω
ω
+==
2exp1 where,
0
φ

New model 2
� Criterion for critical micro-crack size – no calibration
� ‘Individual’ probability of failure
� Global probability of failure
( ) ( )2
12
121
2 141
12
−+
−=
σνεπ p
sc
E
σν
γEπr
( )∫∞
−
−−=
cr
i drrfr
r
r
rP
0
3
00
3
0
expexp1ωω
ψψ
( ) ( ) ( )∏∏=
∆
=
−−=−−=IP
i
Vi
IP
i
Ni
iii PPVP11
1111 ρ

Calibration
� Fitting to experimentally observed positions of the fracture initiation sites (Hohe et al 2010 for Material A)
Noteso Improved agreement between
experimentally measured and predicted local probability
o Blunting factor and critical micro-crack size account (approximately) for one and the same thing – one of these should be used

Predictionso Improved prediction of the
fracture toughness-temperature relation if used with sufficiently high (but not physically supported) shape of the particle size distribution
o Overestimates ∆T0,i : ∆T0,i is constant for 6 < α < 11 (on the safe side though)
o ∆T0,c decreases with increasing α (with best agreement for α = 8), which is exactly opposite to WSM

Source of limited predictability
� Particle size distribution incorrect – first coming to mind but not solving the problems
� Weakest-link argument does not describe the physics -interactions between micro-cracks not accounted for
For example� Number of critical micro-cracks that should be taken to act in a chain
is less than the number of critical micro-cracks predicted by the local probability model, such that this discrepancy increases with increasing plastic strain
� Effective shape of the distribution of critical micro-crack sizes included in the chain changes from a low value close to the shape of the particle size distribution at low plastic strains (hence low density of large micro-cracks) to higher values with increasing plastic strain

Conclusions and perspectives
� Past work on LA models for cleavage focused on improving ‘individual’ probability of failure – MIM provide better predictions than WSM
� The success of LA models for cleavage (MIM or WSM) to predict global probability of failure is limited by the weakest-link assumption
� Future research should focus on understanding the interactions between micro-cracks thereby addressing deficiencies in the weakest link assumption (but also improving ‘individual’ probability of failure model)

DUCTILE FRACTURE

Mechanistic understanding
Processes driving ductile extension of cracks� Micro-voids are nucleated by decohesion of second
phase inclusions� Micro-voids grow due to plastic straining� Neighbouring micro-voids coalesce� Ductile crack extension occurs when sufficient micro-
void growth and coalescence causes the ligaments between the micro-voids to break
Gurson-Tvergaard-Needleman (GTN) model accounts for these and is selected for the study

GTN model 1
� Continuum pressure-dependent associated plasticity –same yield surface and plastic potential
� Modified void volume fraction
( ) 012
3cosh2
2*3
0
2*1
2
0
=+−
+
==Φ fq
qfqg meq
σσ
σσ
( )
≥
<<−
−−
+
≤
=
fu
fcccf
cuc
c
fff
fffffff
fff
fff
f
,
,
,
*
**

GTN model 2
� Void volume fraction evolution
� Fully dense matrix equivalent plastic strain
( ) ( ) pm
pMeq
N
Np
Meq
N
N fSS
ff εε
εεπ
&&& −+
−−= 13
2
1exp
2)(
2
( ) ( ) 01
3
σεσεσ
εf
pmm
peqeqp
Meq −+
=&&
&

Implementation details
� GTN material model implemented with an in-house UMAT subroutine for ABAQUS (small strains though)
� Fracture process zone confined to first element ahead of the crack tip – as usual in literature
� Local damage parameter d equals the void volume fraction at the integration point closest to the tip in the process zone

Objectives
� Demonstrate the potential benefit of using a local approach to situations which� relate to events in the plant loading history with possibly
significant effect on critical load and crack driving force� are not treated in current design codes
� Quantify the effect of selected load histories on the critical load and crack driving force (CDF)
� Assess global vs local CDF behaviour, i.e. far-field and near-field J-integrals – is the critical near-field J-integral sufficient as a measure of fracture toughness under these load history conditions?
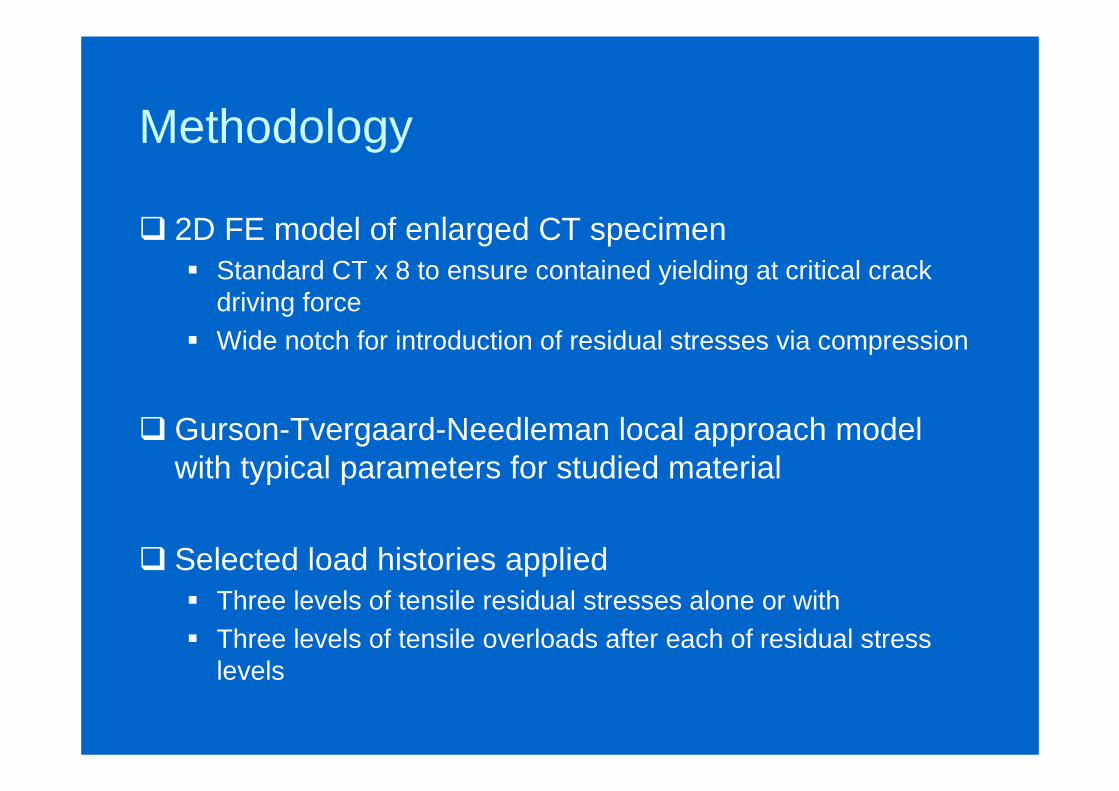
Methodology
� 2D FE model of enlarged CT specimen� Standard CT x 8 to ensure contained yielding at critical crack
driving force� Wide notch for introduction of residual stresses via compression
� Gurson-Tvergaard-Needleman local approach model with typical parameters for studied material
� Selected load histories applied� Three levels of tensile residual stresses alone or with� Three levels of tensile overloads after each of residual stress
levels

Geometry
Plane strain 8-node isoparametric elements; Abaqus Standard

Material: 316 stainless steel weld metal
� Elastic behaviour – E = 171 GPa, ν = 0.294� GTN model parameters
� Hardening of fully dense matrix – tabular data
f0
fc ff fu* fN εN SN q1 q2 q3=q1
2
0.00072 0.15 0.60 2/3 0.01 0.3 0.1 1.5 1.0 2.25
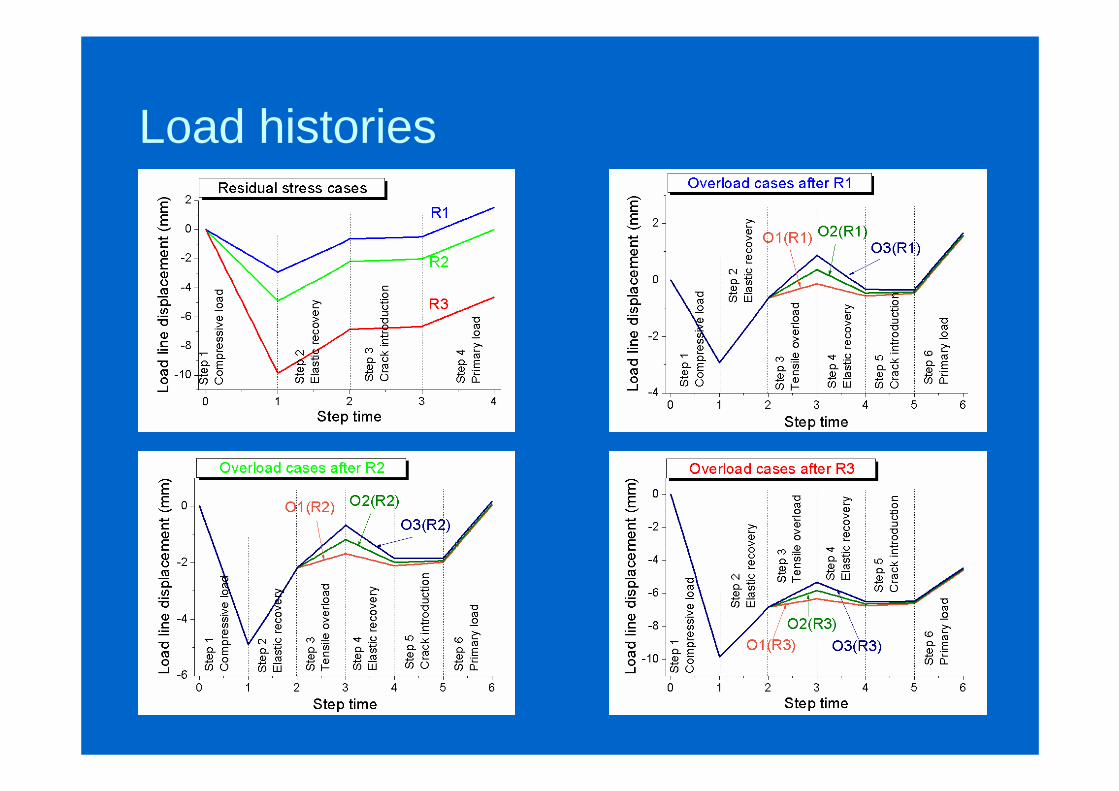
Load histories

Stress profiles before crack introduction

Monitored parameters
� Global (far-field) CDF calculated from load-displacement curve as prescribed by ASTE E1820
� Local (near-field) CDF calculated as J-integral using an in-house code JEDI that accounts for initial residual stresses, plastic strains and non-proportional loading
� Critical loads and CDFs defined at critical local damage dc = 0.15

Near-field CDF and damage during crack introduction
NoteLoad does not change during crack introduction; far-field CDF is therefore undefined

Load vs damage during primary loading
o V-curve – solution without any history prior to primary load
o Substantial reduction of critical load with increased residual stress
o Effect reduced progressively by increased tensile overload

Global CDF vs damage during loading
o Global critical CDF behaves similarly to critical load
o Substantial reduction of “toughness” with increased residual stress
o Effect reduced progressively by increased tensile overload

Local CDF vs damage during loading
o Local critical CDF behaves dissimilarly to global parameters
o Insignificant change of “toughness” due to tensile residual stress
o Increased “toughness” due to increased tensile overload

Observations 1
� Tensile residual stresses are shown to have substantial detrimental effect on global load carrying capacity and global fracture toughness
� Tensile overloads in a component with tensile residual stresses are shown to partially mitigate this detrimental effect
Observations 2
� Tensile residual stresses are shown to have little effect on local fracture toughness
� Tensile overloads are shown to increase local fracture toughness relative to underlying residual stress case, suggesting a dual beneficial effect of overloads
� Compared to global parameters, however, this questions the use of critical near-field J-integral as local fracture toughness for complex load histories.

Notes on results with very high residual stress� Critical load and fracture toughness for R3 (higher
residual stress) are shown to be higher than these for R2 (lower residual stress), contrary to expected
� This is attributed to formation of damage band (inclined with respect to crack plane) in R3, whereas void volume fraction increases significantly outside the assumed damage process zone
� This indicates that the criterion for critical event adopted in the work is not universally valid
� Further work is required to formulate improved definition for local damage for such cases

Conclusions
� Local approach methods can be useful for studies of component behaviour during complex loading histories
� The GTN model is capable of predicting the detrimental effect of tensile residual stresses and the relative beneficial effect of tensile overloads in terms of load carrying capacity and global fracture toughness
� The use of near-field J-integral to define local fracture toughness at critical damage event is not sufficient for complex load histories
� Further work is needed to formulate a critical event in terms of void volume fraction distribution in the near-tip vicinity

CLOSURE

LA for advanced users / developers
� Materials Science is concerned with the “structure-properties” correlation – understanding possible damage micro-mechanisms in materials
� Engineering is concerned with the performance of materials in service – integrity, durability
� Local approaches could provide the link between scientific understanding and engineering needs – the “mechanisms-performance” correlation
� Successful LA = reduced testing (empiricism) + increased predictability = reduced costs
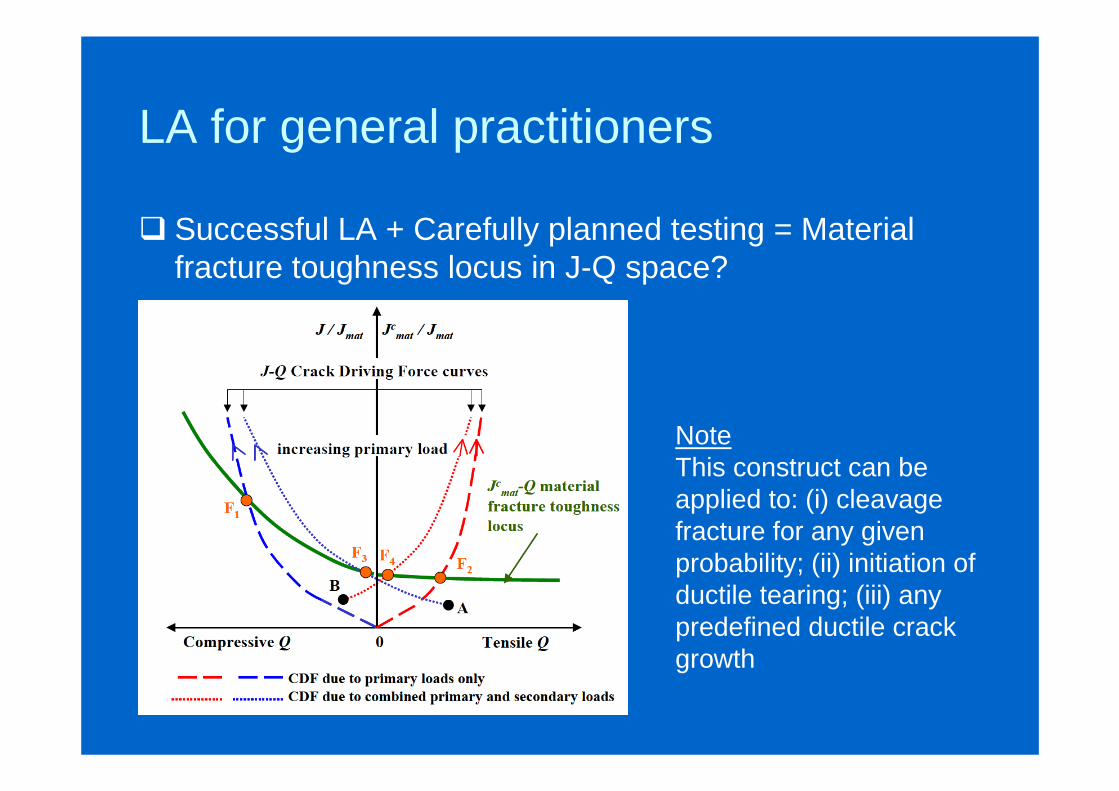
LA for general practitioners
� Successful LA + Carefully planned testing = Material fracture toughness locus in J-Q space?
NoteThis construct can be applied to: (i) cleavage fracture for any given probability; (ii) initiation of ductile tearing; (iii) any predefined ductile crack growth

Can LA deliver?
• Yes, in principle – absorbing evidence of micro-structural features and micro-mechanisms of damage into models is the way forward
• Not just yet – even the current understanding of these is not absorbed adequately
• All problems outside the classical semi-infinite crack in infinite body boil down to plasticity effects
• Add large strains in the process zone (LA domain) to arrive at the main responsibility of non-linear mechanics – large strain plasticity


![FEMORAL IMPACT RESPONSE AND FRACTURE USA · mechanisms of femoral fracture [2,8], 3) femoral fracture tolerance [8-16], and 4) methods of laboratory evaluation of femoral fracture](https://img.pdfslide.net/doc/110x75/5eb7edd6b932f93c7837f9c5/femoral-impact-response-and-fracture-mechanisms-of-femoral-fracture-28-3-femoral.jpg)