Embed Size (px)
Citation preview


© 2015 WOODS & POOLE ECONOMICS, INC. • WASHINGTON, D.C. 20009-2808 • 800-786-1915 • WWW.WOODSANDPOOLE.COM
Local Broadcasting: An Engine for Economic Growth
Copyright 2017, Woods & Poole Economics, Inc.All rights reserved. Reproduction by any method is prohibited.
The local commercial broadcast television and radio data contained in this report are estimated by Woods & Poole Economics, Inc. Some of the historical data is estimated and is subject to revision. Forecasts and projections are uncertain and future data may differ substantially from the forecasts and projections in this report.
© 2017 WOODS & POOLE ECONOMICS, INC. • WASHINGTON, D.C. • 800-786-1915 • WWW.WOODSANDPOOLE.COM
TABLE OF CONTENTS
Executive Summary .......................................................................................... 1
Overview ........................................................................................................... 3
Direct Impact of Local Television and Radio .................................................. 3
Effect of Local Television and Radio on Other Industries .............................. 4
Stimulative Effect of Local Television and Radio on the U.S. Economy ....... 4
The Outlook for Local Television and Radio Revenues ................................. 6
United States Data Table ................................................................................. 7
State Data Tables ............................................................................................. 8
Technical Documentation .............................................................................. 59

© 2017 WOODS & POOLE ECONOMICS, INC. • WASHINGTON, D.C. • 800-786-1915 • WWW.WOODSANDPOOLE.COM
1Local Radio and TV: Helping Drive the U.S. Economy
Local Radio and TV: Helping Drive the U.S. Economy
Executive SummaryThe commercial local broadcast industry, terrestrial radio and television stations, is critically important to the United States economy as a whole and to local economies in particular. Local radio and television's key role in the dissemination of entertainment and local programming is well established. Its important value to the national economy is often overlooked, and in many ways taken for granted. This analysis quantifies some of the core ways commercial local radio and television stations enhance economic productivity, efficiency, and growth. Only local commercial broadcast radio and television is included in this analysis.
Results of this study show:
$1.18 trillion of Gross Domestic Product originating in the commercial local radio and television industry annually
2.42 million jobs attributable to the local radio and television industry on an annual basis
The commercial local radio and television broadcast industry is important not only because of its direct employment, estimated at more than 303 thousand jobs nationwide, but because of the industries and economic activity it supports. Through advertising, the industry provides consumers with critical economic data on the price and features of products and services. To businesses, the industry provides a forum for getting messages about innovations and efficiencies directly to consumers. An unintended benefit of business to consumer advertising is that other businesses receive the same information and are prodded to adopt technologies and efficiencies to remain competitive; this free competitive intelligence is very valuable to consumers and to the economy as a whole.
The following analysis identifies, explains, and quantifies all of these effects. Table 1 on the following page displays the economic impact for the United States as a whole. The impact on individual states follows the national analysis.
Local radio and television broadcasting directly, and through their stimulative effect on the economy, support 2.42 million jobs nationwide.

© 2017 WOODS & POOLE ECONOMICS, INC. • WASHINGTON, D.C. • 800-786-1915 • WWW.WOODSANDPOOLE.COM
2Local Radio and TV: Helping Drive the U.S. Economy
Table 1. The 2016 Impact in GDP and Jobs
Total Impact of Local Television and Radio Broadcasting
$1.18 trillion in GDP annually $733.50 billion from television $445.48 billion from radio
2.42 million jobs on an annual basis 1.50 million in television 0.92 million in radio
Direct Impact of Local Television and Radio
$53.37 billion in GDP annually $33.12 billion from television $20.25 billion from radio
303.27 thousand jobs on an annual basis 188.18 thousand in television 115.09 thousand in radio
Effect of Local Television and Radio on Other Industries
$133.46 billion in GDP annually $84.75 billion from television $48.71 billion from radio
755.13 thousand jobs on an annual basis 468.56 thousand in television 286.57 thousand in radio
Stimulative Effect of Local Television and Radio on the Economy
$992.16 billion in GDP annually $615.64 billion from television $376.52 billion from radio
1.36 million jobs on an annual basis 846.33 thousand in television 517.61 thousand in radio

© 2017 WOODS & POOLE ECONOMICS, INC. • WASHINGTON, D.C. • 800-786-1915 • WWW.WOODSANDPOOLE.COM
3Local Radio and TV: Helping Drive the U.S. Economy
OverviewThe economic impact of the commercial local broadcast industry, terrestrial television and radio stations, has three major components.
First, the direct impact of the industry is the result of its significant size: 1,351 commercial television stations and 10,955 commercial radio stations sustaining more than 303 thousand jobs and $53 billion in output.
Second, as with any industry in a developed economy, workers in the commercial local broadcast television and radio industry consume goods and services in all other sectors of the economy supporting more jobs and creating more income and output. This ripple effect is estimated to result in 755 thousand jobs and more than $133 billion in output.
Third, the output of commercial local broadcast television and radio industry stimulates economic activity by providing a forum for advertising that is free to consumers. The stimulative effect of advertising on local commercial broadcasts is very significant. An estimated $992 billion in United States output and 1.36 million jobs are attributable to the stimulative effects of advertising on local television and radio.
It is important to note that only commercial local broadcast television and radio is included in this analysis. If noncommercial local broadcast television and radio were included the impact on the United States economy would be greater.
The Direct ImpactThe direct impact of local television and radio broadcasting on the United States economy is estimated at more than 303 thousand jobs and $53 billion in economic output. Local television broadcast stations generate 188 thousand jobs and $33 billion in economic output, while local radio broadcast stations generate another 115 thousand jobs and $20 billion in economic output.
The core direct impact of local television and radio broadcasting includes the number of jobs directly in local television and radio as well as the number of jobs in advertising and programming. It is estimated that local television and radio broadcasting and advertising and programming alone account for 207 thousand jobs. In addition however, other industries are impacted by local television and radio broadcasting because they provide goods and services used in creating local television and radio broadcasting and advertising.
Local television and radio commercial broadcasting directly accounts for more than 303 thousand jobs and $53 billion in U.S. economic output.
The direct impact includes industries supplying goods and services directly to local broadcasters.

© 2017 WOODS & POOLE ECONOMICS, INC. • WASHINGTON, D.C. • 800-786-1915 • WWW.WOODSANDPOOLE.COM
4Local Radio and TV: Helping Drive the U.S. Economy
Industries as varied as telecommunications, public utilities, manufacturing, transportation and retail trade provide inputs into the production of local television and radio broadcasting. When measured with a technical input-output analysis an additional 96 thousand jobs are supported in other industries because of the goods and services requirements of local television and radio broadcast stations.
The Economic Impact on Other IndustriesThe income earned by workers in jobs directly related to local television and radio broadcasting, either in the industry itself or in the many suppliers that support the industry directly, helps create additional economic activity. Each worker directly employed in local television and radio broadcasting maintains a household and consumes all of the goods and services American workers consume. A worker in local broadcast television advertising consumes manufacturing output when he or she purchases an automobile. A worker in local radio broadcasting consumes construction sector output when he or she purchases a new home.
The income from local television and radio broadcast jobs flows through the economy creating additional jobs and income in various economic sectors. A job in local television and radio broadcast stations multiplies itself by helping create jobs in construction, farming, mining, state and local government and all other economic sectors. The workers in the industries supplying goods and services to local television and radio broadcast workers in turn consume goods and services. It is estimated that the cascading effect of jobs and income emanating in local television and radio broadcasting results in more than $133 billion in additional GDP and 755 thousand jobs nationwide.
The Stimulative Effect on the EconomyThe commercial local broadcast industry, terrestrial television and radio stations, stimulates additional economic activity by providing a forum for advertising goods and services. The advertising provided by commercial local television and radio is unique in its comprehensive coverage and very low cost to consumers. Local television and radio advertising serves an important role for both consumers and businesses in providing economic information on product prices and features. This information increases market efficiencies and results in greater demand for well made and well priced goods and services. The additional demand contributes to aggregate economic growth. With the product and service feature and price information obtained from local broadcast television and radio advertising consumers allocate their purchases more efficiently and businesses design goods and services to keep pace with their competitors.
The ripple effect of the economic impact of local commercial broadcasting on other industries is also called the “multiplier effect.”
The stimulative effect is the result of the economically beneficial role advertising plays in the economy.

© 2017 WOODS & POOLE ECONOMICS, INC. • WASHINGTON, D.C. • 800-786-1915 • WWW.WOODSANDPOOLE.COM
5Local Radio and TV: Helping Drive the U.S. Economy
The stimulative effect of local broadcast television and radio advertising
can be very great because almost all households in the United States
receive the information creating significant demand and economies of
scale for producers and consumers alike.
The primary role of broadcast television and radio is reducing the cost of
product information through advertising. In this way, broadcast television
and radio stations have their most significant impact on economic
growth, although the entertainment value of local broadcast television
and radio is often emphasized in discussions on their impact on society.
Reaching all United States households, local broadcast television and
radio stations provide consumers with highly valued marketplace
information and businesses with immediate economic and competitive
intelligence.
Paid advertising on television and radio provides consumers with product
information and price comparisons that enable efficient consumer expenditures.
An unintended consequence of paid advertising by business is that competitors
can learn of product features, innovations and price structures. This competitive
intelligence encourages businesses to adapt and to offer better products at
lower prices benefiting consumers and creating real economic growth and
increases in wealth.
The economic impact of advertising on both consumers and competitors
is significant. Advertising on local broadcast television and radio stations
is estimated to stimulate $992 billion in economic activity and support
1.36 million jobs.
Scope of this Analysis
Local commercial broadcast radio and television stations including locally
owned and operated commercial stations, affiliate stations and independent
stations are included in this study. The operations of over-the-air broadcast
networks are not part of this analysis, except for their owned-and-operated
local television stations. By definition, cable, satellite and other video provider
networks and stations are not included because this study covers only
commercial broadcast television and radio stations. Noncommercial radio
and television stations are also not included.
Advertising benefits consumers because businesses learn of competitors innovations and adopt them.
This analysis covers local commercial broadcast radio and television stations.

© 2017 WOODS & POOLE ECONOMICS, INC. • WASHINGTON, D.C. • 800-786-1915 • WWW.WOODSANDPOOLE.COM
6Local Radio and TV: Helping Drive the U.S. Economy
The OutlookThe outlook for growth in the commercial local broadcast industry, terrestrial television and radio stations, is strong. Research suggests that both television and radio local broadcast revenues will grow through the year 2021 (see Charts below). The unique forum and low cost of providing entertainment and product information to consumers ensure that revenues will increase in coming years. The economic impact previously described in this study will show parallel growth.
The outlook for local broadcasting revenue growth is positive.
Television Station Revenues 2011 – 2021
Radio Station Revenues 2011 – 2021

7Local Radio and TV: Helping Drive the U.S. Economy
© 2017 WOODS & POOLE ECONOMICS, INC. • WASHINGTON, D.C. • 800-786-1915 • WWW.WOODSANDPOOLE.COM
Total U.S. Economic Impact $1.18 trillion in GDP Television $733.50 billion Radio $445.48 billion 2.42 million jobs Television 1.50 million jobs Radio 0.92 million jobs
Direct Economic Impact in U.S. $53.37 billion in GDP 303.27 thousand jobs
Economic Impact on Other Industries in U.S. $133.46 billion in GDP 755.13 thousand jobs
Stimulative Effect on Economy in U.S. $992.16 trillion in GDP 1.36 million jobs
United States Economy 2016 2025
Population (thousands) 324,160.75 352,314.55Households (thousands) 125,957.46 137,979.53
Employment (thousands of jobs) 193,022.61 218,269.97
Retail Sales (billions 2014 $) $5,387.86 $6,210.31GDP (billions 2014 $) $18,737.40 $22,626.87Income per Capita (2014 $) $49,420 $56,413
NUMBER OF COMMERCIAL STATIONS
Television: 1,351Radio: 10,955
United States – Local Television and Radio

8Local Radio and TV: Helping Drive the U.S. Economy
© 2017 WOODS & POOLE ECONOMICS, INC. • WASHINGTON, D.C. • 800-786-1915 • WWW.WOODSANDPOOLE.COM
Total Economic Impact in State $14.16 billion in GDP Television $8.50 billion Radio $5.66 billion 31.13 thousand jobs Television 18.68 thousand jobs Radio 12.45 thousand jobs
Direct Economic Impact in State $0.64 billion in GDP 3.90 thousand jobs
Economic Impact on Other Industries in State $1.60 billion in GDP 9.70 thousand jobs
Stimulative Effect on Economy in State $11.92 billion in GDP 17.53 thousand jobs
Alabama Economy 2016 2025
Population (thousands) 4,888.44 5,192.72Households (thousands) 2,000.35 2,142.08
Employment (thousands of jobs) 2,631.26 2,934.66
Retail Sales (billions 2014 $) $72.82 $82.01Gross State Product (billions 2014 $) $209.81 $250.53Income per Capita (2014 $) $39,267 $45,170
NUMBER OF COMMERCIAL STATIONS
Television: 34Radio: 286
Alabama – Local Television and Radio

9Local Radio and TV: Helping Drive the U.S. Economy
© 2017 WOODS & POOLE ECONOMICS, INC. • WASHINGTON, D.C. • 800-786-1915 • WWW.WOODSANDPOOLE.COM
Total Economic Impact in State $3.10 billion in GDP Television $1.88 billion Radio $1.22 billion 5.65 thousand jobs Television 3.41 thousand jobs Radio 2.24 thousand jobs
Direct Economic Impact in State $0.14 billion in GDP 0.71 thousand jobs
Economic Impact on Other Industries in State $0.35 billion in GDP 1.76 thousand jobs
Stimulative Effect on Economy in State $2.61 billion in GDP 3.18 thousand jobs
Alaska Economy 2016 2025
Population (thousands) 746.25 825.18Households (thousands) 285.26 322.15
Employment (thousands of jobs) 472.34 534.21
Retail Sales (billions 2014 $) $13.35 $15.65Gross State Product (billions 2014 $) $62.29 $75.49Income per Capita (2014 $) $57,298 $64,249
NUMBER OF COMMERCIAL STATIONS
Television: 13Radio: 74
Alaska – Local Television and Radio

10Local Radio and TV: Helping Drive the U.S. Economy
© 2017 WOODS & POOLE ECONOMICS, INC. • WASHINGTON, D.C. • 800-786-1915 • WWW.WOODSANDPOOLE.COM
Total Economic Impact in State $24.83 billion in GDP Television $15.54 billion Radio $9.30 billion 52.96 thousand jobs Television 33.04 thousand jobs Radio 19.92 thousand jobs
Direct Economic Impact in State $1.18 billion in GDP 7.14 thousand jobs
Economic Impact on Other Industries in State $2.81 billion in GDP 16.51 thousand jobs
Stimulative Effect on Economy in State $20.90 billion in GDP 29.82 thousand jobs
Arizona Economy 2016 2025
Population (thousands) 6,932.66 7,996.11Households (thousands) 2,676.37 3,111.95
Employment (thousands of jobs) 3,611.94 4,288.19
Retail Sales (billions 2014 $) $110.12 $134.66Gross State Product (billions 2014 $) $305.01 $395.26Income per Capita (2014 $) $40,172 $46,693
NUMBER OF COMMERCIAL STATIONS
Television: 26Radio: 186
Arizona – Local Television and Radio

11Local Radio and TV: Helping Drive the U.S. Economy
© 2017 WOODS & POOLE ECONOMICS, INC. • WASHINGTON, D.C. • 800-786-1915 • WWW.WOODSANDPOOLE.COM
Total Economic Impact in State $8.43 billion in GDP Television $5.03 billion Radio $3.40 billion 18.73 thousand jobs Television 11.18 thousand jobs Radio 7.55 thousand jobs
Direct Economic Impact in State $0.38 billion in GDP 2.34 thousand jobs
Economic Impact on Other Industries in State $0.95 billion in GDP 5.84 thousand jobs
Stimulative Effect on Economy in State $7.10 billion in GDP 10.55 thousand jobs
Arkansas Economy 2016 2025
Population (thousands) 3,001.58 3,242.70Households (thousands) 1,235.69 1,346.51
Employment (thousands of jobs) 1,638.90 1,845.79
Retail Sales (billions 2014 $) $45.43 $52.03Gross State Product (billions 2014 $) $126.96 $155.02Income per Capita (2014 $) $39,619 $46,133
NUMBER OF COMMERCIAL STATIONS
Television: 20Radio: 240
Arkansas – Local Television and Radio

12Local Radio and TV: Helping Drive the U.S. Economy
© 2017 WOODS & POOLE ECONOMICS, INC. • WASHINGTON, D.C. • 800-786-1915 • WWW.WOODSANDPOOLE.COM
Total Economic Impact in State $157.72 billion in GDP Television $99.17 billion Radio $58.55 billion 307.99 thousand jobs Television 193.26 thousand jobs Radio 114.73 thousand jobs
Direct Economic Impact in State $7.14 billion in GDP 38.56 thousand jobs
Economic Impact on Other Industries in State $17.86 billion in GDP 96.01 thousand jobs
Stimulative Effect on Economy in State $132.72 billion in GDP 173.42 thousand jobs
California Economy 2016 2025
Population (thousands) 39,512.72 43,236.62Households (thousands) 13,611.65 14,950.69
Employment (thousands of jobs) 22,968.92 26,174.35
Retail Sales (billions 2014 $) $627.03 $727.44Gross State Product (billions 2014 $) $2,597.13 $3,164.08Income per Capita (2014 $) $55,041 $62,264
NUMBER OF COMMERCIAL STATIONS
Television: 91Radio: 671
California – Local Television and Radio

13Local Radio and TV: Helping Drive the U.S. Economy
© 2017 WOODS & POOLE ECONOMICS, INC. • WASHINGTON, D.C. • 800-786-1915 • WWW.WOODSANDPOOLE.COM
Total Economic Impact in State $21.79 billion in GDP Television $13.73 billion Radio $8.06 billion 45.58 thousand jobs Television 28.64 thousand jobs Radio 16.94 thousand jobs
Direct Economic Impact in State $0.99 billion in GDP 5.71 thousand jobs
Economic Impact on Other Industries in State $2.47 billion in GDP 14.21 thousand jobs
Stimulative Effect on Economy in State $18.33 billion in GDP 25.66 thousand jobs
Colorado Economy 2016 2025
Population (thousands) 5,526.18 6,231.80Households (thousands) 2,198.09 2,512.11
Employment (thousands of jobs) 3,626.61 4,211.59
Retail Sales (billions 2014 $) $90.86 $108.63Gross State Product (billions 2014 $) $335.11 $414.40Income per Capita (2014 $) $52,418 $59,245
NUMBER OF COMMERCIAL STATIONS
Television: 27Radio: 210
Colorado – Local Television and Radio
14Local Radio and TV: Helping Drive the U.S. Economy
© 2017 WOODS & POOLE ECONOMICS, INC. • WASHINGTON, D.C. • 800-786-1915 • WWW.WOODSANDPOOLE.COM
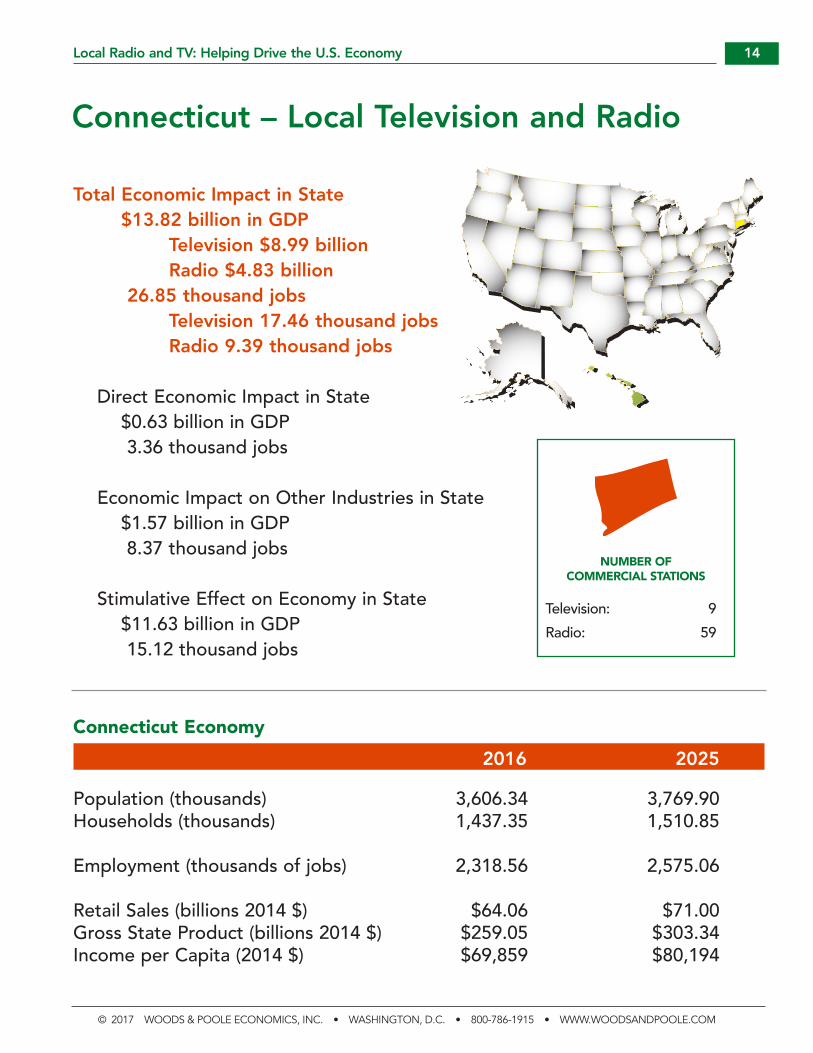
Total Economic Impact in State $13.82 billion in GDP Television $8.99 billion Radio $4.83 billion 26.85 thousand jobs Television 17.46 thousand jobs Radio 9.39 thousand jobs
Direct Economic Impact in State $0.63 billion in GDP 3.36 thousand jobs
Economic Impact on Other Industries in State $1.57 billion in GDP 8.37 thousand jobs
Stimulative Effect on Economy in State $11.63 billion in GDP 15.12 thousand jobs
Connecticut Economy 2016 2025
Population (thousands) 3,606.34 3,769.90Households (thousands) 1,437.35 1,510.85
Employment (thousands of jobs) 2,318.56 2,575.06
Retail Sales (billions 2014 $) $64.06 $71.00Gross State Product (billions 2014 $) $259.05 $303.34Income per Capita (2014 $) $69,859 $80,194
NUMBER OF COMMERCIAL STATIONS
Television: 9Radio: 59
Connecticut – Local Television and Radio

15Local Radio and TV: Helping Drive the U.S. Economy
© 2017 WOODS & POOLE ECONOMICS, INC. • WASHINGTON, D.C. • 800-786-1915 • WWW.WOODSANDPOOLE.COM
Total Economic Impact in State $3.79 billion in GDP Television $2.34 billion Radio $1.44 billion 7.18 thousand jobs Television 4.42 thousand jobs Radio 2.75 thousand jobs
Direct Economic Impact in State $0.17 billion in GDP 0.90 thousand jobs
Economic Impact on Other Industries in State $0.43 billion in GDP 2.24 thousand jobs
Stimulative Effect on Economy in State $3.19 billion in GDP 4.04 thousand jobs
Delaware Economy 2016 2025
Population (thousands) 955.84 1,055.88Households (thousands) 370.91 411.78
Employment (thousands of jobs) 578.40 663.40
Retail Sales (billions 2014 $) $18.53 $21.70Gross State Product (billions 2014 $) $69.20 $81.29Income per Capita (2014 $) $49,004 $56,234
NUMBER OF COMMERCIAL STATIONS
Television: 3Radio: 21
Delaware – Local Television and Radio

16Local Radio and TV: Helping Drive the U.S. Economy
© 2017 WOODS & POOLE ECONOMICS, INC. • WASHINGTON, D.C. • 800-786-1915 • WWW.WOODSANDPOOLE.COM
Total Economic Impact in State $4.48 billion in GDP Television $2.82 billion Radio $1.66 billion 7.61 thousand jobs Television 4.78 thousand jobs Radio 2.83 thousand jobs
Direct Economic Impact in State $0.20 billion in GDP 0.95 thousand jobs
Economic Impact on Other Industries in State $0.51 billion in GDP 2.37 thousand jobs
Stimulative Effect on Economy in State $3.77 billion in GDP 4.28 thousand jobs
District of Columbia Economy 2016 2025
Population (thousands) 675.73 710.78Households (thousands) 287.26 305.91
Employment (thousands of jobs) 881.65 960.45
Retail Sales (billions 2014 $) $8.81 $9.82Gross State Product (billions 2014 $) $121.39 $134.09Income per Capita (2014 $) $74,718 $83,474
NUMBER OF COMMERCIAL STATIONS
Television: 6Radio: 16
District of Columbia – Local Television and Radio

17Local Radio and TV: Helping Drive the U.S. Economy
© 2017 WOODS & POOLE ECONOMICS, INC. • WASHINGTON, D.C. • 800-786-1915 • WWW.WOODSANDPOOLE.COM
Total Economic Impact in State $77.04 billion in GDP Television $52.04 billion Radio $25.00 billion 166.55 thousand jobs Television 111.80 thousand jobs Radio 54.75 thousand jobs
Direct Economic Impact in State $3.49 billion in GDP 20.85 thousand jobs
Economic Impact on Other Industries in State $8.75 billion in GDP 51.92 thousand jobs
Stimulative Effect on Economy in State $64.81 billion in GDP 93.78 thousand jobs
Florida Economy 2016 2025
Population (thousands) 20,554.15 23,423.02Households (thousands) 8,219.53 9,412.32
Employment (thousands of jobs) 11,501.63 13,434.82
Retail Sales (billions 2014 $) $359.38 $434.20Gross State Product (billions 2014 $) $922.05 $1,142.87Income per Capita (2014 $) $45,738 $52,680
NUMBER OF COMMERCIAL STATIONS
Television: 78Radio: 462
Florida – Local Television and Radio

18Local Radio and TV: Helping Drive the U.S. Economy
© 2017 WOODS & POOLE ECONOMICS, INC. • WASHINGTON, D.C. • 800-786-1915 • WWW.WOODSANDPOOLE.COM
Total Economic Impact in State $34.90 billion in GDP Television $21.06 billion Radio $13.85 billion 74.15 thousand jobs Television 44.65 thousand jobs Radio 29.50 thousand jobs
Direct Economic Impact in State $1.58 billion in GDP 9.28 thousand jobs
Economic Impact on Other Industries in State $3.95 billion in GDP 23.12 thousand jobs
Stimulative Effect on Economy in State $29.38 billion in GDP 41.75 thousand jobs
Georgia Economy 2016 2025
Population (thousands) 10,338.62 11,594.58Households (thousands) 3,957.39 4,475.14
Employment (thousands of jobs) 5,923.15 6,820.14
Retail Sales (billions 2014 $) $155.50 $184.90Gross State Product (billions 2014 $) $517.20 $636.22Income per Capita (2014 $) $41,333 $47,043
NUMBER OF COMMERCIAL STATIONS
Television: 35Radio: 366
Georgia – Local Television and Radio

19Local Radio and TV: Helping Drive the U.S. Economy
© 2017 WOODS & POOLE ECONOMICS, INC. • WASHINGTON, D.C. • 800-786-1915 • WWW.WOODSANDPOOLE.COM
Total Economic Impact in State $4.47 billion in GDP Television $2.56 billion Radio $1.92 billion 9.42 thousand jobs Television 5.38 thousand jobs Radio 4.04 thousand jobs
Direct Economic Impact in State $0.20 billion in GDP 1.18 thousand jobs
Economic Impact on Other Industries in State $0.50 billion in GDP 2.94 thousand jobs
Stimulative Effect on Economy in State $3.77 billion in GDP 5.30 thousand jobs
Hawaii Economy 2016 2025
Population (thousands) 1,450.01 1,618.17Households (thousands) 497.95 559.87
Employment (thousands of jobs) 916.51 1,061.85
Retail Sales (billions 2014 $) $26.07 $30.84Gross State Product (billions 2014 $) $83.76 $103.94
Income per Capita (2014 $) $49,557 $56,168
NUMBER OF COMMERCIAL STATIONS
Television: 23Radio: 84
Hawaii – Local Television and Radio
20Local Radio and TV: Helping Drive the U.S. Economy
© 2017 WOODS & POOLE ECONOMICS, INC. • WASHINGTON, D.C. • 800-786-1915 • WWW.WOODSANDPOOLE.COM
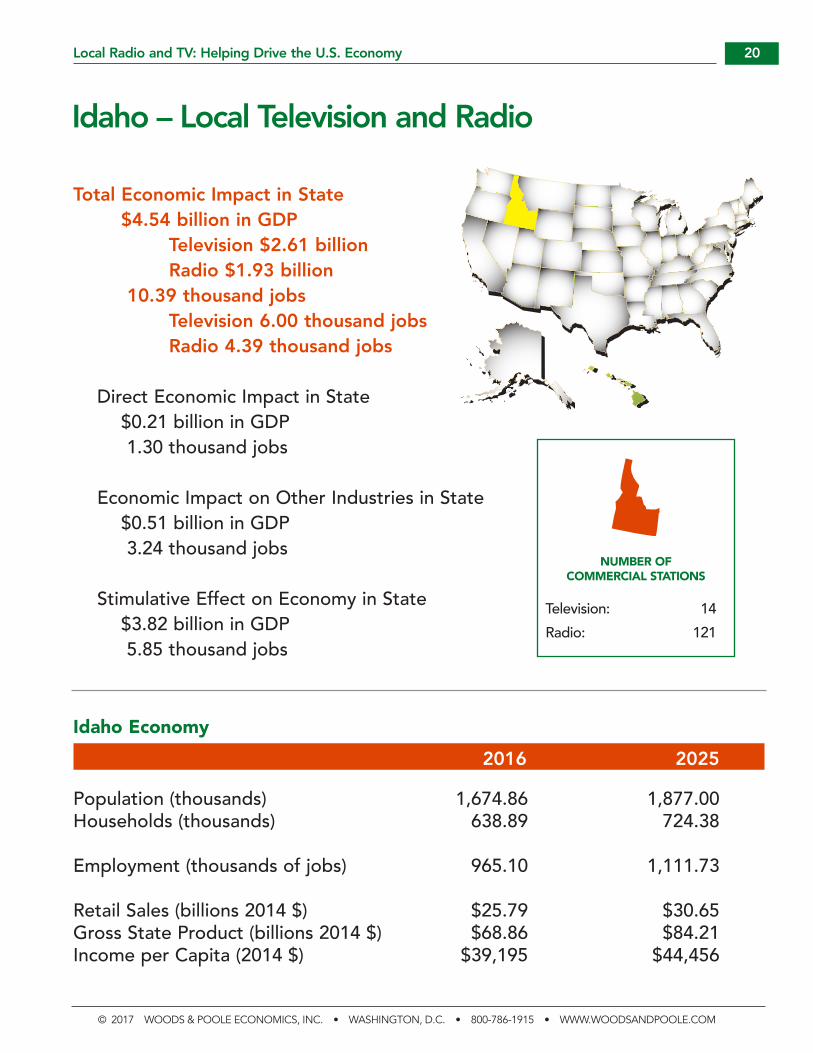
Total Economic Impact in State $4.54 billion in GDP Television $2.61 billion Radio $1.93 billion 10.39 thousand jobs Television 6.00 thousand jobs Radio 4.39 thousand jobs
Direct Economic Impact in State $0.21 billion in GDP 1.30 thousand jobs
Economic Impact on Other Industries in State $0.51 billion in GDP 3.24 thousand jobs
Stimulative Effect on Economy in State $3.82 billion in GDP 5.85 thousand jobs
Idaho Economy 2016 2025
Population (thousands) 1,674.86 1,877.00Households (thousands) 638.89 724.38
Employment (thousands of jobs) 965.10 1,111.73
Retail Sales (billions 2014 $) $25.79 $30.65Gross State Product (billions 2014 $) $68.86 $84.21Income per Capita (2014 $) $39,195 $44,456
NUMBER OF COMMERCIAL STATIONS
Television: 14Radio: 121
Idaho – Local Television and Radio
21Local Radio and TV: Helping Drive the U.S. Economy
© 2017 WOODS & POOLE ECONOMICS, INC. • WASHINGTON, D.C. • 800-786-1915 • WWW.WOODSANDPOOLE.COM
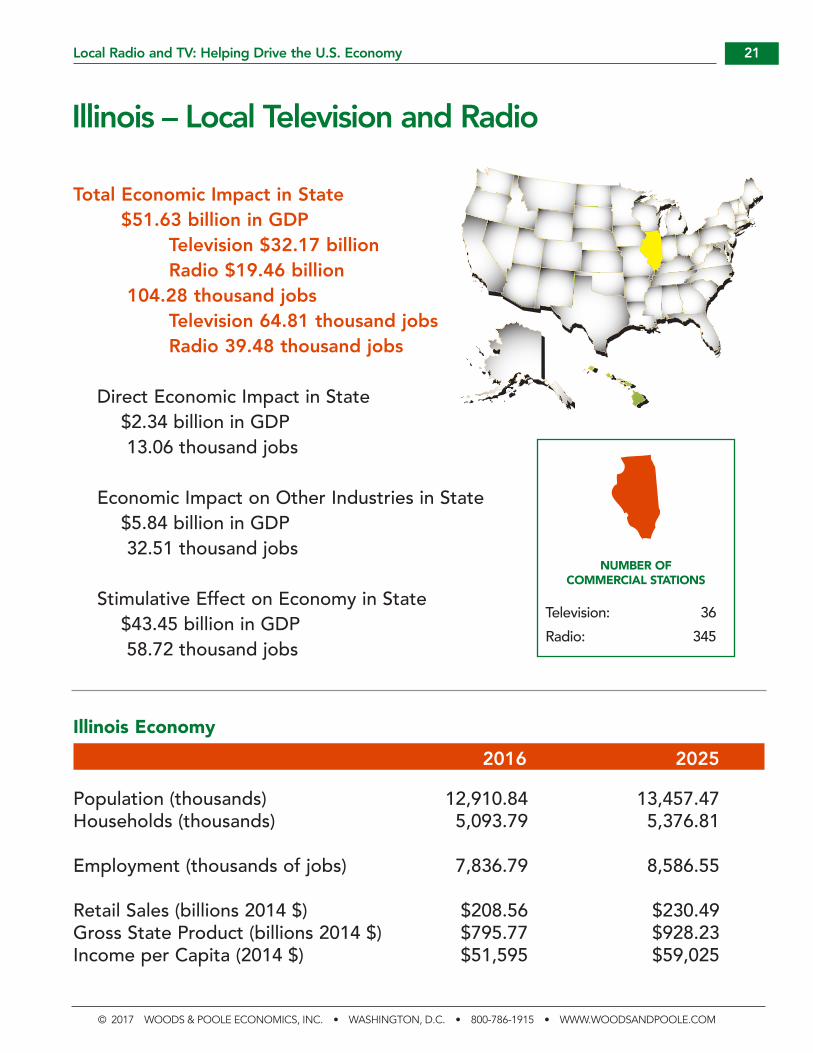
Total Economic Impact in State $51.63 billion in GDP Television $32.17 billion Radio $19.46 billion 104.28 thousand jobs Television 64.81 thousand jobs Radio 39.48 thousand jobs
Direct Economic Impact in State $2.34 billion in GDP 13.06 thousand jobs
Economic Impact on Other Industries in State $5.84 billion in GDP 32.51 thousand jobs
Stimulative Effect on Economy in State $43.45 billion in GDP 58.72 thousand jobs
Illinois Economy 2016 2025
Population (thousands) 12,910.84 13,457.47Households (thousands) 5,093.79 5,376.81
Employment (thousands of jobs) 7,836.79 8,586.55
Retail Sales (billions 2014 $) $208.56 $230.49Gross State Product (billions 2014 $) $795.77 $928.23Income per Capita (2014 $) $51,595 $59,025
NUMBER OF COMMERCIAL STATIONS
Television: 36Radio: 345
Illinois – Local Television and Radio

22Local Radio and TV: Helping Drive the U.S. Economy
© 2017 WOODS & POOLE ECONOMICS, INC. • WASHINGTON, D.C. • 800-786-1915 • WWW.WOODSANDPOOLE.COM
Total Economic Impact in State $21.99 billion in GDP Television $13.08 billion Radio $8.92 billion 46.42 thousand jobs Television 27.56 thousand jobs Radio 18.87 thousand jobs
Direct Economic Impact in State $1.00 billion in GDP 5.81 thousand jobs
Economic Impact on Other Industries in State $2.49 billion in GDP 14.47 thousand jobs
Stimulative Effect on Economy in State $18.51 billion in GDP 26.14 thousand jobs
Indiana Economy 2016 2025
Population (thousands) 6,653.10 7,001.15Households (thousands) 2,647.18 2,804.33
Employment (thousands of jobs) 3,855.30 4,228.44
Retail Sales (billions 2014 $) $107.26 $119.67Gross State Product (billions 2014 $) $344.36 $397.07Income per Capita (2014 $) $42,767 $49,055
NUMBER OF COMMERCIAL STATIONS
Television: 31Radio: 239
Indiana – Local Television and Radio

23Local Radio and TV: Helping Drive the U.S. Economy
© 2017 WOODS & POOLE ECONOMICS, INC. • WASHINGTON, D.C. • 800-786-1915 • WWW.WOODSANDPOOLE.COM
Total Economic Impact in State $12.06 billion in GDP Television $7.65 billion Radio $4.41 billion 25.68 thousand jobs Television 16.23 thousand jobs Radio 9.45 thousand jobs
Direct Economic Impact in State $0.55 billion in GDP 3.21 thousand jobs
Economic Impact on Other Industries in State $1.37 billion in GDP 8.01 thousand jobs
Stimulative Effect on Economy in State $10.15 billion in GDP 14.46 thousand jobs
Iowa Economy 2016 2025
Population (thousands) 3,134.33 3,248.99Households (thousands) 1,282.95 1,346.34
Employment (thousands of jobs) 2,089.79 2,295.89
Retail Sales (billions 2014 $) $54.76 $60.18Gross State Product (billions 2014 $) $183.58 $216.64Income per Capita (2014 $) $47,373 $54,280
NUMBER OF COMMERCIAL STATIONS
Television: 23Radio: 211
Iowa – Local Television and Radio

24Local Radio and TV: Helping Drive the U.S. Economy
© 2017 WOODS & POOLE ECONOMICS, INC. • WASHINGTON, D.C. • 800-786-1915 • WWW.WOODSANDPOOLE.COM
Total Economic Impact in State $9.90 billion in GDP Television $5.74 billion Radio $4.16 billion 21.59 thousand jobs Television 12.54 thousand jobs Radio 9.06 thousand jobs
Direct Economic Impact in State $0.45 billion in GDP 2.70 thousand jobs
Economic Impact on Other Industries in State $1.12 billion in GDP 6.73 thousand jobs
Stimulative Effect on Economy in State $8.33 billion in GDP 12.16 thousand jobs
Kansas Economy 2016 2025
Population (thousands) 2,929.14 3,112.42Households (thousands) 1,183.90 1,269.27
Employment (thousands of jobs) 1,938.93 2,152.69
Retail Sales (billions 2014 $) $47.37 $53.37Gross State Product (billions 2014 $) $158.36 $188.49Income per Capita (2014 $) $48,111 $55,043
NUMBER OF COMMERCIAL STATIONS
Television: 23Radio: 190
Kansas – Local Television and Radio
25Local Radio and TV: Helping Drive the U.S. Economy
© 2017 WOODS & POOLE ECONOMICS, INC. • WASHINGTON, D.C. • 800-786-1915 • WWW.WOODSANDPOOLE.COM
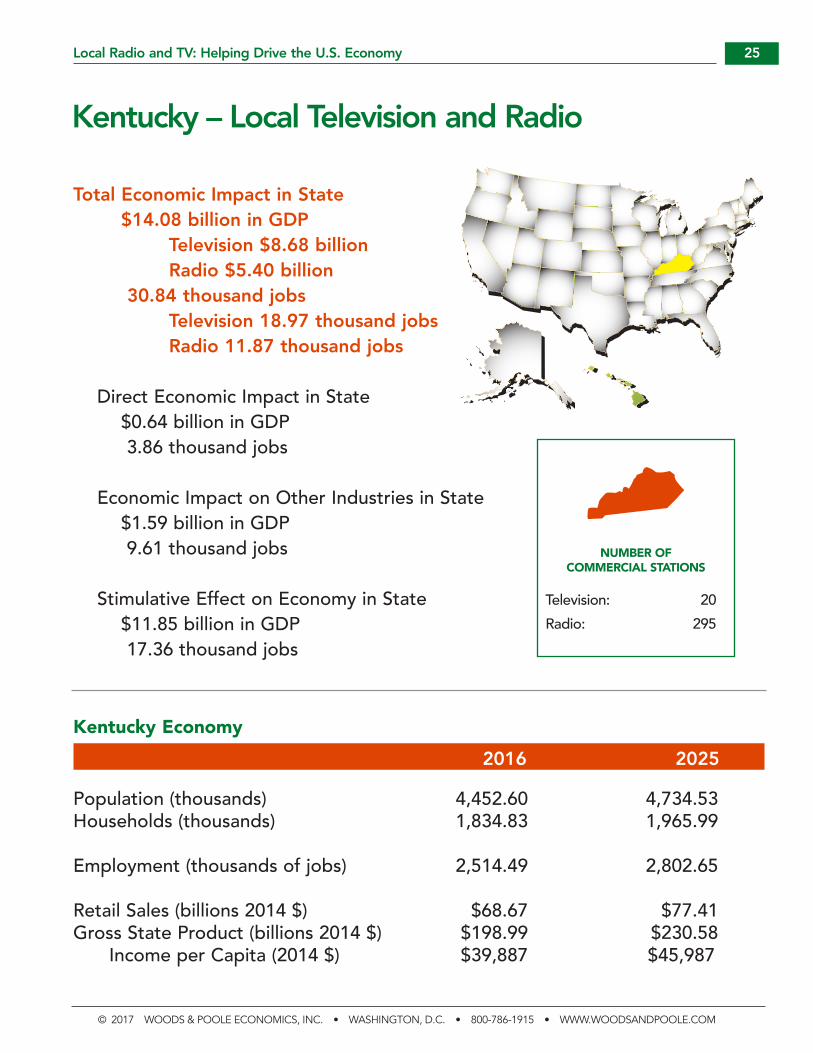
Total Economic Impact in State $14.08 billion in GDP Television $8.68 billion Radio $5.40 billion 30.84 thousand jobs Television 18.97 thousand jobs Radio 11.87 thousand jobs
Direct Economic Impact in State $0.64 billion in GDP 3.86 thousand jobs
Economic Impact on Other Industries in State $1.59 billion in GDP 9.61 thousand jobs
Stimulative Effect on Economy in State $11.85 billion in GDP 17.36 thousand jobs
Kentucky Economy 2016 2025
Population (thousands) 4,452.60 4,734.53Households (thousands) 1,834.83 1,965.99
Employment (thousands of jobs) 2,514.49 2,802.65
Retail Sales (billions 2014 $) $68.67 $77.41Gross State Product (billions 2014 $) $198.99 $230.58
Income per Capita (2014 $) $39,887 $45,987
NUMBER OF COMMERCIAL STATIONS
Television: 20Radio: 295
Kentucky – Local Television and Radio

26Local Radio and TV: Helping Drive the U.S. Economy
© 2017 WOODS & POOLE ECONOMICS, INC. • WASHINGTON, D.C. • 800-786-1915 • WWW.WOODSANDPOOLE.COM
Total Economic Impact in State $16.09 billion in GDP Television $9.98 billion Radio $6.11 billion 33.44 thousand jobs Television 20.68 thousand jobs Radio 12.76 thousand jobs
Direct Economic Impact in State $0.73 billion in GDP 4.19 thousand jobs
Economic Impact on Other Industries in State $1.82 billion in GDP 10.43 thousand jobs
Stimulative Effect on Economy in State $13.54 billion in GDP 18.83 thousand jobs
Louisiana Economy 2016 2025
Population (thousands) 4,700.91 5,012.48Households (thousands) 1,860.78 2,019.51
Employment (thousands of jobs) 2,744.85 3,071.25
Retail Sales (billions 2014 $) $77.74 $87.88Gross State Product (billions 2014 $) $259.86 $306.55Income per Capita (2014 $) $44,036 $50,255
NUMBER OF COMMERCIAL STATIONS
Television: 31Radio: 212
Louisiana – Local Television and Radio

27Local Radio and TV: Helping Drive the U.S. Economy
© 2017 WOODS & POOLE ECONOMICS, INC. • WASHINGTON, D.C. • 800-786-1915 • WWW.WOODSANDPOOLE.COM
Total Economic Impact in State $4.05 billion in GDP Television $2.21 billion Radio $1.83 billion 9.25 thousand jobs Television 5.11 thousand jobs Radio 4.14 thousand jobs
Direct Economic Impact in State $0.18 billion in GDP 1.16 thousand jobs
Economic Impact on Other Industries in State $0.46 billion in GDP 2.88 thousand jobs
Stimulative Effect on Economy in State $3.41 billion in GDP 5.21 thousand jobs
Maine Economy 2016 2025
Population (thousands) 1,336.35 1,409.73Households (thousands) 591.92 635.94
Employment (thousands of jobs) 832.92 919.10
Retail Sales (billions 2014 $) $26.05 $29.14Gross State Product (billions 2014 $) $59.56 $70.36Income per Capita (2014 $) $43,945 $50,203
NUMBER OF COMMERCIAL STATIONS
Television: 10Radio: 92
Maine – Local Television and Radio

28Local Radio and TV: Helping Drive the U.S. Economy
© 2017 WOODS & POOLE ECONOMICS, INC. • WASHINGTON, D.C. • 800-786-1915 • WWW.WOODSANDPOOLE.COM
Total Economic Impact in State $23.62 billion in GDP Television $14.81 billion Radio $8.82 billion 47.54 thousand jobs Television 29.72 thousand jobs Radio 17.81 thousand jobs
Direct Economic Impact in State $1.07 billion in GDP 5.95 thousand jobs
Economic Impact on Other Industries in State $2.67 billion in GDP 14.82 thousand jobs
Stimulative Effect on Economy in State $19.88 billion in GDP 26.77 thousand jobs
Maryland Economy 2016 2025
Population (thousands) 6,057.52 6,571.06Households (thousands) 2,332.32 2,543.75
Employment (thousands of jobs) 3,653.20 4,112.68
Retail Sales (billions 2014 $) $98.12 $112.85Gross State Product (billions 2014 $) $375.11 $450.54Income per Capita (2014 $) $57,243 $64,934
NUMBER OF COMMERCIAL STATIONS
Television: 10Radio: 104
Maryland – Local Television and Radio

29Local Radio and TV: Helping Drive the U.S. Economy
© 2017 WOODS & POOLE ECONOMICS, INC. • WASHINGTON, D.C. • 800-786-1915 • WWW.WOODSANDPOOLE.COM
Total Economic Impact in State $28.56 billion in GDP Television $17.16 billion Radio $11.40 billion 56.31 thousand jobs Television 33.69 thousand jobs Radio 22.62 thousand jobs
Direct Economic Impact in State $1.29 billion in GDP 7.05 thousand jobs
Economic Impact on Other Industries in State $3.23 billion in GDP 17.55 thousand jobs
Stimulative Effect on Economy in State $24.04 billion in GDP 31.71 thousand jobs
Massachusetts Economy 2016 2025
Population (thousands) 6,825.24 7,150.80Households (thousands) 2,688.50 2,844.16
Employment (thousands of jobs) 4,599.83 5,095.27
Retail Sales (billions 2014 $) $120.87 $134.26Gross State Product (billions 2014 $) $501.88 $600.35Income per Capita (2014 $) $64,482 $73,899
NUMBER OF COMMERCIAL STATIONS
Television: 18Radio: 120
Massachusetts – Local Television and Radio

30Local Radio and TV: Helping Drive the U.S. Economy
© 2017 WOODS & POOLE ECONOMICS, INC. • WASHINGTON, D.C. • 800-786-1915 • WWW.WOODSANDPOOLE.COM
Total Economic Impact in State $33.12 billion in GDP Television $20.37 billion Radio $12.75 billion 70.47 thousand jobs Television 43.25 thousand jobs Radio 27.22 thousand jobs
Direct Economic Impact in State $1.50 billion in GDP 8.82 thousand jobs
Economic Impact on Other Industries in State $3.75 billion in GDP 21.97 thousand jobs
Stimulative Effect on Economy in State $27.87 billion in GDP 39.68 thousand jobs
Michigan Economy 2016 2025
Population (thousands) 9,942.16 10,182.13Households (thousands) 4,029.22 4,197.51
Employment (thousands of jobs) 5,579.03 6,059.02
Retail Sales (billions 2014 $) $147.28 $159.92Gross State Product (billions 2014 $) $485.58 $565.39Income per Capita (2014 $) $44,040 $50,808
NUMBER OF COMMERCIAL STATIONS
Television: 41Radio: 333
Michigan – Local Television and Radio

31Local Radio and TV: Helping Drive the U.S. Economy
© 2017 WOODS & POOLE ECONOMICS, INC. • WASHINGTON, D.C. • 800-786-1915 • WWW.WOODSANDPOOLE.COM
Total Economic Impact in State $19.96 billion in GDP Television $11.71 billion Radio $8.25 billion 41.87 thousand jobs Television 24.52 thousand jobs Radio 17.35 thousand jobs
Direct Economic Impact in State $0.90 billion in GDP 5.24 thousand jobs
Economic Impact on Other Industries in State $2.25 billion in GDP 13.05 thousand jobs
Stimulative Effect on Economy in State $16.80 billion in GDP 23.58 thousand jobs
Minnesota Economy 2016 2025
Population (thousands) 5,535.66 6,004.21Households (thousands) 2,258.93 2,486.00
Employment (thousands of jobs) 3,736.05 4,260.27
Retail Sales (billions 2014 $) $99.10 $113.96Gross State Product (billions 2014 $) $344.70 $420.58Income per Capita (2014 $) $52,446 $60,123
Minnesota – Local Television and Radio
NUMBER OF COMMERCIAL STATIONS
Television: 24Radio: 270

32Local Radio and TV: Helping Drive the U.S. Economy
© 2017 WOODS & POOLE ECONOMICS, INC. • WASHINGTON, D.C. • 800-786-1915 • WWW.WOODSANDPOOLE.COM
Total Economic Impact in State $8.15 billion in GDP Television $5.26 billion Radio $2.90 billion 18.67 thousand jobs Television 11.97 thousand jobs Radio 6.70 thousand jobs
Direct Economic Impact in State $0.37 billion in GDP 2.34 thousand jobs
Economic Impact on Other Industries in State $0.92 billion in GDP 5.82 thousand jobs
Stimulative Effect on Economy in State $6.86 billion in GDP 10.51 thousand jobs
Mississippi Economy 2016 2025
Population (thousands) 3,010.49 3,201.13Households (thousands) 1,187.34 1,280.04
Employment (thousands of jobs) 1,593.28 1,778.31
Retail Sales (billions 2014 $) $45.31 $51.08Gross State Product (billions 2014 $) $110.45 $130.58Income per Capita (2014 $) $35,888 $41,328
Mississippi – Local Television and Radio
NUMBER OF COMMERCIAL STATIONS
Television: 22Radio: 224
33Local Radio and TV: Helping Drive the U.S. Economy
© 2017 WOODS & POOLE ECONOMICS, INC. • WASHINGTON, D.C. • 800-786-1915 • WWW.WOODSANDPOOLE.COM
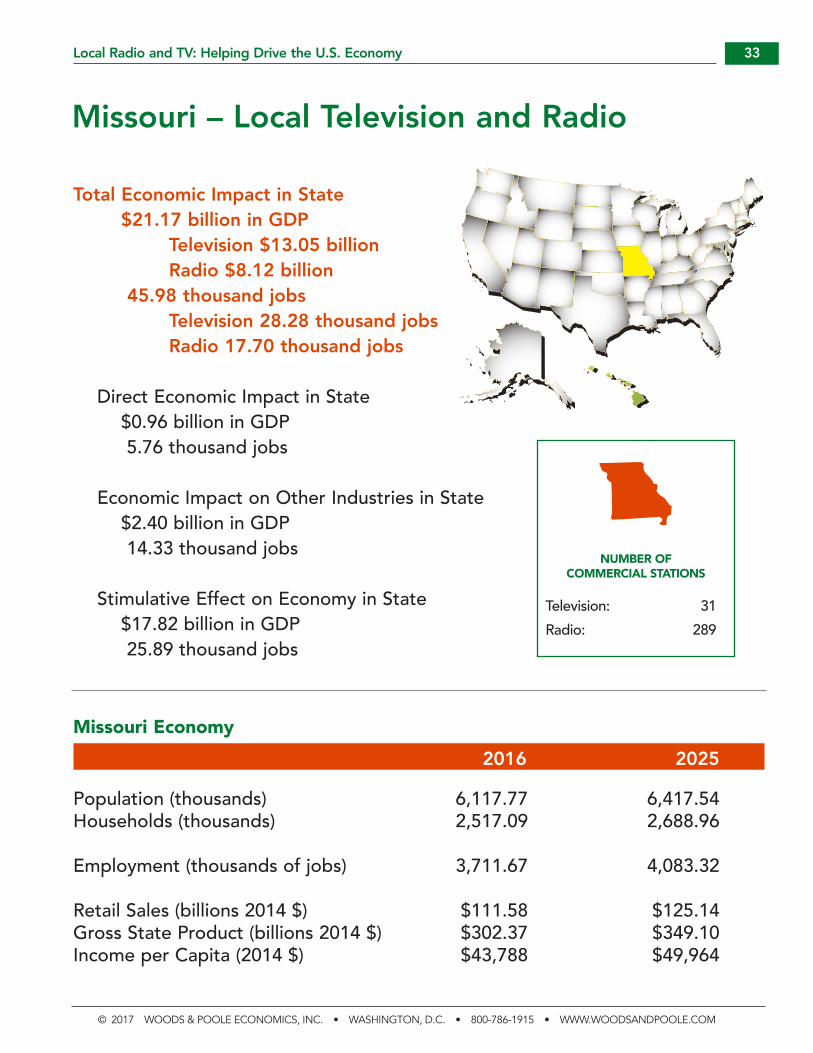
Total Economic Impact in State $21.17 billion in GDP Television $13.05 billion Radio $8.12 billion 45.98 thousand jobs Television 28.28 thousand jobs Radio 17.70 thousand jobs
Direct Economic Impact in State $0.96 billion in GDP 5.76 thousand jobs
Economic Impact on Other Industries in State $2.40 billion in GDP 14.33 thousand jobs
Stimulative Effect on Economy in State $17.82 billion in GDP 25.89 thousand jobs
Missouri Economy 2016 2025
Population (thousands) 6,117.77 6,417.54Households (thousands) 2,517.09 2,688.96
Employment (thousands of jobs) 3,711.67 4,083.32
Retail Sales (billions 2014 $) $111.58 $125.14Gross State Product (billions 2014 $) $302.37 $349.10Income per Capita (2014 $) $43,788 $49,964
Missouri – Local Television and Radio
NUMBER OF COMMERCIAL STATIONS
Television: 31Radio: 289

34Local Radio and TV: Helping Drive the U.S. Economy
© 2017 WOODS & POOLE ECONOMICS, INC. • WASHINGTON, D.C. • 800-786-1915 • WWW.WOODSANDPOOLE.COM
Total Economic Impact in State $3.11 billion in GDP Television $1.96 billion Radio $1.16 billion 7.13 thousand jobs Television 4.46 thousand jobs Radio 2.66 thousand jobs
Direct Economic Impact in State $0.14 billion in GDP 0.89 thousand jobs
Economic Impact on Other Industries in State $0.35 billion in GDP 2.22 thousand jobs
Stimulative Effect on Economy in State $2.62 billion in GDP 4.01 thousand jobs
Montana Economy 2016 2025
Population (thousands) 1,041.75 1,132.06Households (thousands) 444.71 495.52
Employment (thousands of jobs) 671.87 759.20
Retail Sales (billions 2014 $) $19.83 $22.85Gross State Product (billions 2014 $) $48.33 $58.12Income per Capita (2014 $) $42,904 $49,061
Montana – Local Television and Radio
NUMBER OF COMMERCIAL STATIONS
Television: 18Radio: 150

35Local Radio and TV: Helping Drive the U.S. Economy
© 2017 WOODS & POOLE ECONOMICS, INC. • WASHINGTON, D.C. • 800-786-1915 • WWW.WOODSANDPOOLE.COM
Total Economic Impact in State $7.32 billion in GDP Television $4.30 billion Radio $3.02 billion 15.52 thousand jobs Television 9.10 thousand jobs Radio 6.42 thousand jobs
Direct Economic Impact in State $0.33 billion in GDP 1.94 thousand jobs
Economic Impact on Other Industries in State $0.83 billion in GDP 4.84 thousand jobs
Stimulative Effect on Economy in State $6.16 billion in GDP 8.74 thousand jobs
Nebraska Economy 2016 2025
Population (thousands) 1,908.13 2,032.00Households (thousands) 771.17 829.57
Employment (thousands of jobs) 1,322.69 1,477.42
Retail Sales (billions 2014 $) $37.68 $42.54Gross State Product (billions 2014 $) $115.30 $138.13Income per Capita (2014 $) $49,337 $56,006
Nebraska – Local Television and Radio
NUMBER OF COMMERCIAL STATIONS
Television: 17Radio: 130
36Local Radio and TV: Helping Drive the U.S. Economy
© 2017 WOODS & POOLE ECONOMICS, INC. • WASHINGTON, D.C. • 800-786-1915 • WWW.WOODSANDPOOLE.COM
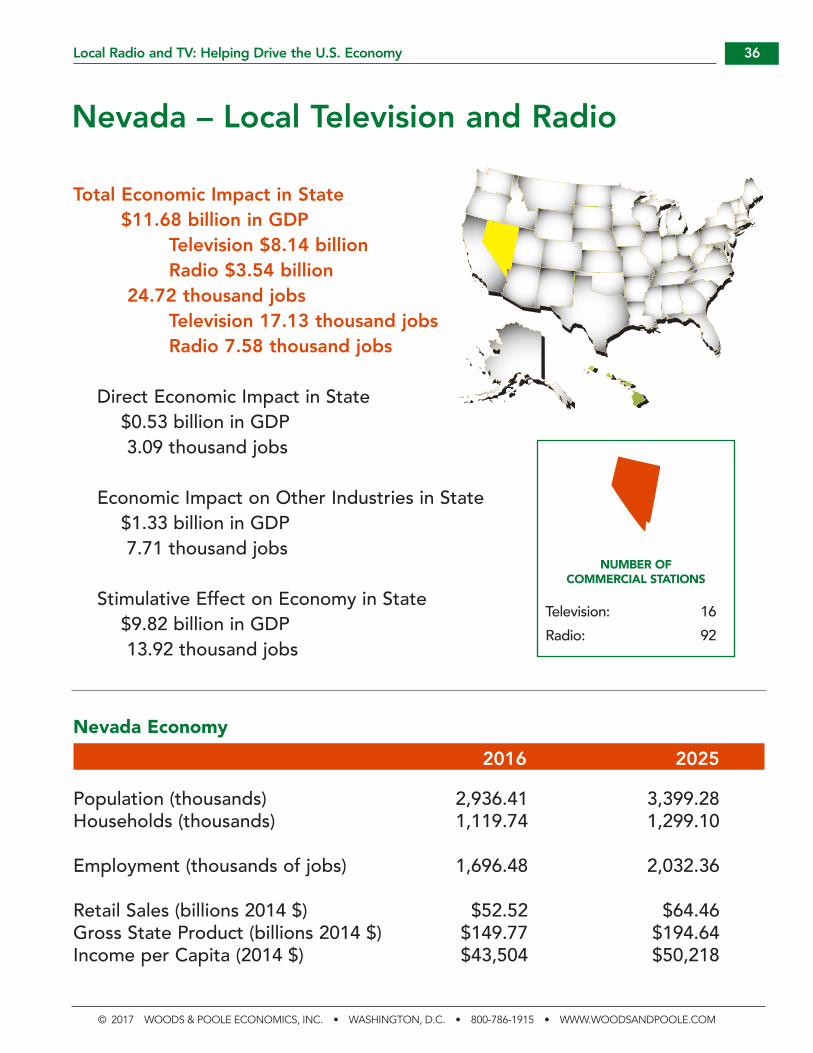
Total Economic Impact in State $11.68 billion in GDP Television $8.14 billion Radio $3.54 billion 24.72 thousand jobs Television 17.13 thousand jobs Radio 7.58 thousand jobs
Direct Economic Impact in State $0.53 billion in GDP 3.09 thousand jobs
Economic Impact on Other Industries in State $1.33 billion in GDP 7.71 thousand jobs
Stimulative Effect on Economy in State $9.82 billion in GDP 13.92 thousand jobs
Nevada Economy 2016 2025
Population (thousands) 2,936.41 3,399.28Households (thousands) 1,119.74 1,299.10
Employment (thousands of jobs) 1,696.48 2,032.36
Retail Sales (billions 2014 $) $52.52 $64.46Gross State Product (billions 2014 $) $149.77 $194.64Income per Capita (2014 $) $43,504 $50,218
Nevada – Local Television and Radio
NUMBER OF COMMERCIAL STATIONS
Television: 16Radio: 92

37Local Radio and TV: Helping Drive the U.S. Economy
© 2017 WOODS & POOLE ECONOMICS, INC. • WASHINGTON, D.C. • 800-786-1915 • WWW.WOODSANDPOOLE.COM
Total Economic Impact in State $5.39 billion in GDP Television $3.17 billion Radio $2.22 billion 11.44 thousand jobs Television 6.73 thousand jobs Radio 4.71 thousand jobs
Direct Economic Impact in State $0.24 billion in GDP 1.43 thousand jobs
Economic Impact on Other Industries in State $0.61 billion in GDP 3.57 thousand jobs
Stimulative Effect on Economy in State $4.54 billion in GDP 6.44 thousand jobs
New Hampshire Economy 2016 2025
Population (thousands) 1,339.62 1,431.69Households (thousands) 554.71 598.74
Employment (thousands of jobs) 871.80 970.98
Retail Sales (billions 2014 $) $31.60 $35.80Gross State Product (billions 2014 $) $75.74 $89.11Income per Capita (2014 $) $57,569 $65,483
New Hampshire – Local Television and Radio
NUMBER OF COMMERCIAL STATIONS
Television: 4Radio: 70

38Local Radio and TV: Helping Drive the U.S. Economy
© 2017 WOODS & POOLE ECONOMICS, INC. • WASHINGTON, D.C. • 800-786-1915 • WWW.WOODSANDPOOLE.COM
Total Economic Impact in State $34.14 billion in GDP Television $21.79 billion Radio $12.35 billion 67.42 thousand jobs Television 42.97 thousand jobs Radio 24.45 thousand jobs
Direct Economic Impact in State $1.55 billion in GDP 8.44 thousand jobs
Economic Impact on Other Industries in State $3.87 billion in GDP 21.02 thousand jobs
Stimulative Effect on Economy in State $28.72 billion in GDP 37.96 thousand jobs
New Jersey Economy 2016 2025
Population (thousands) 8,998.39 9,425.60Households (thousands) 3,373.88 3,564.39
Employment (thousands of jobs) 5,349.87 5,897.97
Retail Sales (billions 2014 $) $165.13 $183.39Gross State Product (billions 2014 $) $577.69 $677.35Income per Capita (2014 $) $61,322 $70,021
New Jersey – Local Television and Radio
NUMBER OF COMMERCIAL STATIONS
Television: 12Radio: 81

39Local Radio and TV: Helping Drive the U.S. Economy
© 2017 WOODS & POOLE ECONOMICS, INC. • WASHINGTON, D.C. • 800-786-1915 • WWW.WOODSANDPOOLE.COM
Total Economic Impact in State $6.61 billion in GDP Television $3.96 billion Radio $2.64 billion 13.89 thousand jobs Television 8.32 thousand jobs Radio 5.57 thousand jobs
Direct Economic Impact in State $0.30 billion in GDP 1.74 thousand jobs
Economic Impact on Other Industries in State $0.75 billion in GDP 4.33 thousand jobs
Stimulative Effect on Economy in State $5.56 billion in GDP 7.82 thousand jobs
New Mexico Economy 2016 2025
Population (thousands) 2,110.40 2,366.94Households (thousands) 876.40 996.75
Employment (thousands of jobs) 1,115.35 1,288.67
Retail Sales (billions 2014 $) $31.40 $37.34Gross State Product (billions 2014 $) $100.77 $120.87Income per Capita (2014 $) $39,183 $45,100
New Mexico – Local Television and Radio
NUMBER OF COMMERCIAL STATIONS
Television: 19Radio: 178
40Local Radio and TV: Helping Drive the U.S. Economy
© 2017 WOODS & POOLE ECONOMICS, INC. • WASHINGTON, D.C. • 800-786-1915 • WWW.WOODSANDPOOLE.COM
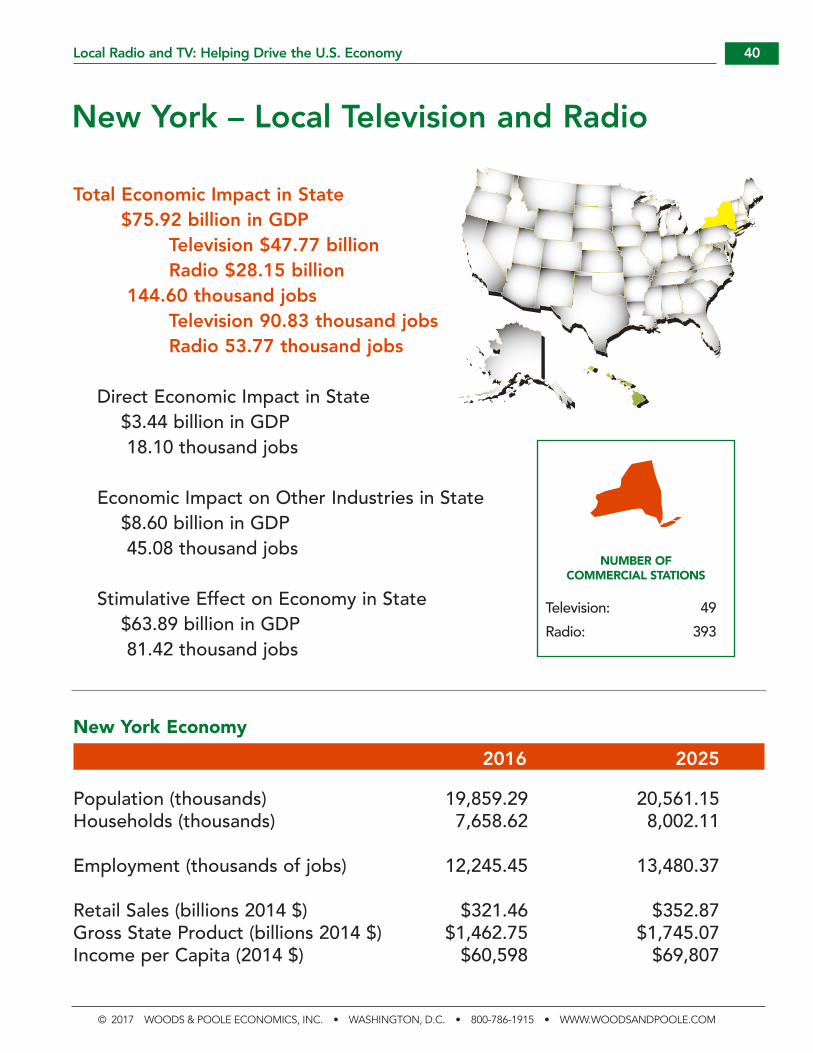
Total Economic Impact in State $75.92 billion in GDP Television $47.77 billion Radio $28.15 billion 144.60 thousand jobs Television 90.83 thousand jobs Radio 53.77 thousand jobs
Direct Economic Impact in State $3.44 billion in GDP 18.10 thousand jobs
Economic Impact on Other Industries in State $8.60 billion in GDP 45.08 thousand jobs
Stimulative Effect on Economy in State $63.89 billion in GDP 81.42 thousand jobs
New York Economy 2016 2025
Population (thousands) 19,859.29 20,561.15Households (thousands) 7,658.62 8,002.11
Employment (thousands of jobs) 12,245.45 13,480.37
Retail Sales (billions 2014 $) $321.46 $352.87Gross State Product (billions 2014 $) $1,462.75 $1,745.07Income per Capita (2014 $) $60,598 $69,807
New York – Local Television and Radio
NUMBER OF COMMERCIAL STATIONS
Television: 49Radio: 393

41Local Radio and TV: Helping Drive the U.S. Economy
© 2017 WOODS & POOLE ECONOMICS, INC. • WASHINGTON, D.C. • 800-786-1915 • WWW.WOODSANDPOOLE.COM
Total Economic Impact in State $32.23 billion in GDP Television $20.42 billion Radio $11.81 billion 68.15 thousand jobs Television 43.04 thousand jobs Radio 25.11 thousand jobs
Direct Economic Impact in State $1.46 billion in GDP 8.53 thousand jobs
Economic Impact on Other Industries in State $3.65 billion in GDP 21.24 thousand jobs
Stimulative Effect on Economy in State $27.12 billion in GDP 38.37 thousand jobs
North Carolina Economy 2016 2025
Population (thousands) 10,169.37 11,452.36Households (thousands) 4,139.87 4,704.36
Employment (thousands of jobs) 5,807.04 6,695.09
Retail Sales (billions 2014 $) $156.24 $186.55Gross State Product (billions 2014 $) $517.68 $641.82Income per Capita (2014 $) $41,944 $48,013
North Carolina – Local Television and Radio
NUMBER OF COMMERCIAL STATIONS
Television: 38Radio: 347

42Local Radio and TV: Helping Drive the U.S. Economy
© 2017 WOODS & POOLE ECONOMICS, INC. • WASHINGTON, D.C. • 800-786-1915 • WWW.WOODSANDPOOLE.COM
Total Economic Impact in State $3.46 billion in GDP Television $1.98 billion Radio $1.48 billion 6.93 thousand jobs Television 3.94 thousand jobs Radio 2.99 thousand jobs
Direct Economic Impact in State $0.16 billion in GDP 0.87 thousand jobs
Economic Impact on Other Industries in State $0.39 billion in GDP 2.16 thousand jobs
Stimulative Effect on Economy in State $2.91 billion in GDP 3.90 thousand jobs
North Dakota Economy 2016 2025
Population (thousands) 764.91 846.34Households (thousands) 308.08 347.06
Employment (thousands of jobs) 611.04 706.72
Retail Sales (billions 2014 $) $20.07 $23.55Gross State Product (billions 2014 $) $63.71 $77.32Income per Capita (2014 $) $57,723 $66,253
North Dakota – Local Television and Radio
NUMBER OF COMMERCIAL STATIONS
Television: 20Radio: 86

43Local Radio and TV: Helping Drive the U.S. Economy
© 2017 WOODS & POOLE ECONOMICS, INC. • WASHINGTON, D.C. • 800-786-1915 • WWW.WOODSANDPOOLE.COM
Total Economic Impact in State $41.07 billion in GDP Television $25.43 billion Radio $15.64 billion 86.27 thousand jobs Television 53.28 thousand jobs Radio 32.98 thousand jobs
Direct Economic Impact in State $1.86 billion in GDP 10.80 thousand jobs
Economic Impact on Other Industries in State $4.65 billion in GDP 26.89 thousand jobs
Stimulative Effect on Economy in State $34.56 billion in GDP 48.57 thousand jobs
Ohio Economy 2016 2025
Population (thousands) 11,645.91 12,021.67Households (thousands) 4,804.38 5,016.87
Employment (thousands of jobs) 6,963.08 7,611.33
Retail Sales (billions 2014 $) $190.89 $208.92Gross State Product (billions 2014 $) $641.78 $757.29Income per Capita (2014 $) $45,129 $52,246
Ohio – Local Television and Radio
NUMBER OF COMMERCIAL STATIONS
Television: 40Radio: 297

44Local Radio and TV: Helping Drive the U.S. Economy
© 2017 WOODS & POOLE ECONOMICS, INC. • WASHINGTON, D.C. • 800-786-1915 • WWW.WOODSANDPOOLE.COM
Total Economic Impact in State $14.01 billion in GDP Television $8.79 billion Radio $5.21 billion 29.49 thousand jobs Television 18.47 thousand jobs Radio 11.03 thousand jobs
Direct Economic Impact in State $0.63 billion in GDP 3.69 thousand jobs
Economic Impact on Other Industries in State $1.59 billion in GDP 9.19 thousand jobs
Stimulative Effect on Economy in State $11.79 billion in GDP 16.61 thousand jobs
Oklahoma Economy 2016 2025
Population (thousands) 3,939.23 4,223.89Households (thousands) 1,563.48 1,683.72
Employment (thousands of jobs) 2,321.66 2,598.07
Retail Sales (billions 2014 $) $63.47 $72.16Gross State Product (billions 2014 $) $207.92 $246.45Income per Capita (2014 $) $46,858 $52,468
Oklahoma – Local Television and Radio
NUMBER OF COMMERCIAL STATIONS
Television: 24Radio: 199
45Local Radio and TV: Helping Drive the U.S. Economy
© 2017 WOODS & POOLE ECONOMICS, INC. • WASHINGTON, D.C. • 800-786-1915 • WWW.WOODSANDPOOLE.COM
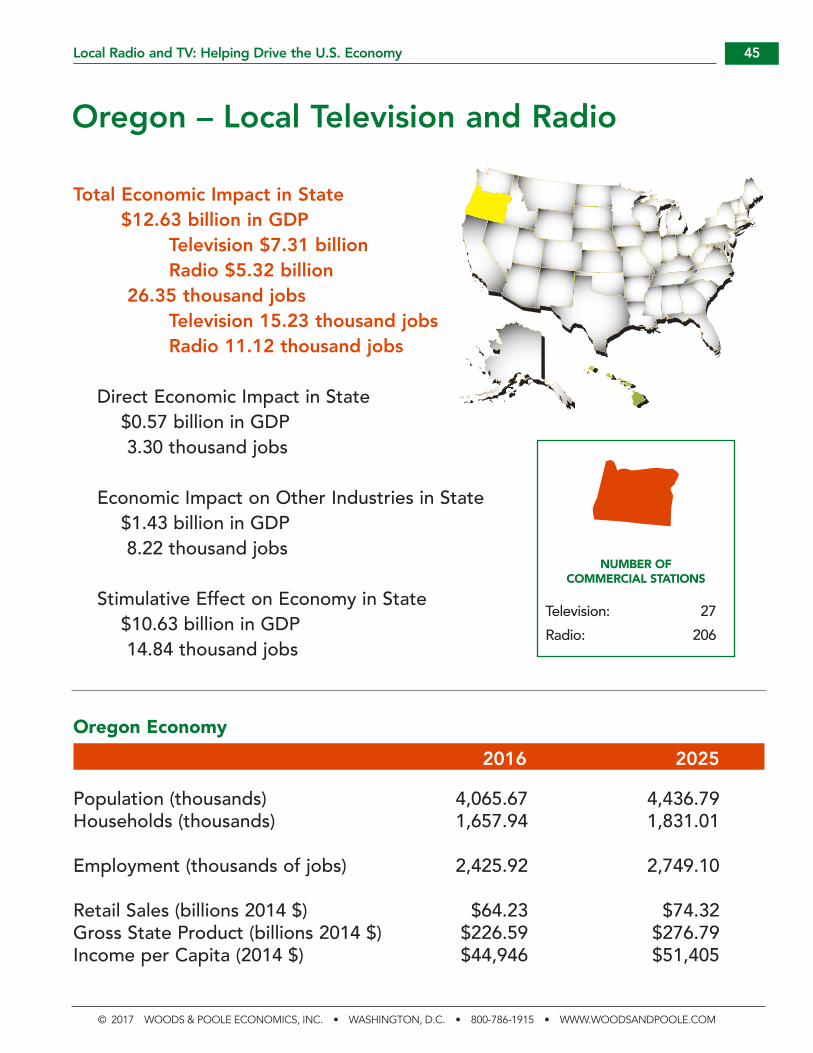
Total Economic Impact in State $12.63 billion in GDP Television $7.31 billion Radio $5.32 billion 26.35 thousand jobs Television 15.23 thousand jobs Radio 11.12 thousand jobs
Direct Economic Impact in State $0.57 billion in GDP 3.30 thousand jobs
Economic Impact on Other Industries in State $1.43 billion in GDP 8.22 thousand jobs
Stimulative Effect on Economy in State $10.63 billion in GDP 14.84 thousand jobs
Oregon Economy 2016 2025
Population (thousands) 4,065.67 4,436.79Households (thousands) 1,657.94 1,831.01
Employment (thousands of jobs) 2,425.92 2,749.10
Retail Sales (billions 2014 $) $64.23 $74.32Gross State Product (billions 2014 $) $226.59 $276.79Income per Capita (2014 $) $44,946 $51,405
Oregon – Local Television and Radio
NUMBER OF COMMERCIAL STATIONS
Television: 27Radio: 206

46Local Radio and TV: Helping Drive the U.S. Economy
© 2017 WOODS & POOLE ECONOMICS, INC. • WASHINGTON, D.C. • 800-786-1915 • WWW.WOODSANDPOOLE.COM
Total Economic Impact in State $45.39 billion in GDP Television $28.51 billion Radio $16.88 billion 93.46 thousand jobs Television 58.55 thousand jobs Radio 34.91 thousand jobs
Direct Economic Impact in State $2.05 billion in GDP 11.70 thousand jobs
Economic Impact on Other Industries in State $5.14 billion in GDP 29.13 thousand jobs
Stimulative Effect on Economy in State $38.20 billion in GDP 52.62 thousand jobs
Pennsylvania Economy 2016 2025
Population (thousands) 12,840.88 13,275.37Households (thousands) 5,243.13 5,477.80
Employment (thousands of jobs) 7,612.74 8,347.68
Retail Sales (billions 2014 $) $218.84 $239.87Gross State Product (billions 2014 $) $731.57 $860.44Income per Capita (2014 $) $51,017 $59,010
Pennsylvania – Local Television and Radio
NUMBER OF COMMERCIAL STATIONS
Television: 39Radio: 364
47Local Radio and TV: Helping Drive the U.S. Economy
© 2017 WOODS & POOLE ECONOMICS, INC. • WASHINGTON, D.C. • 800-786-1915 • WWW.WOODSANDPOOLE.COM
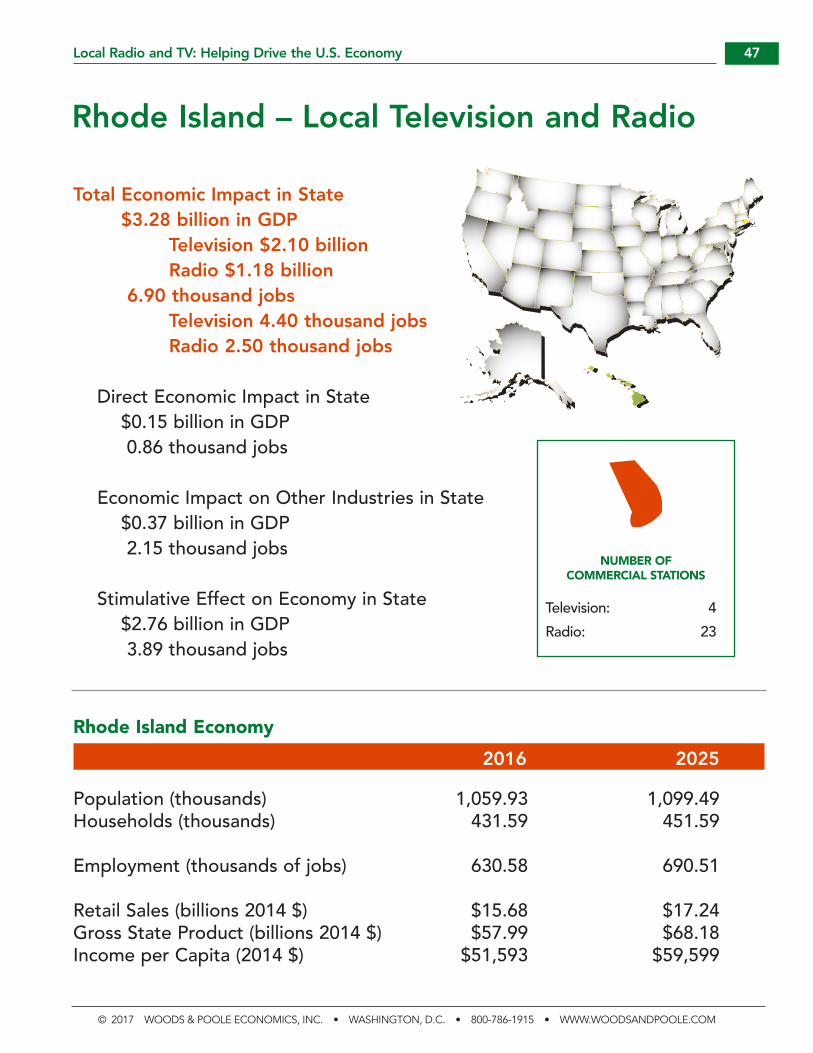
Total Economic Impact in State $3.28 billion in GDP Television $2.10 billion Radio $1.18 billion 6.90 thousand jobs Television 4.40 thousand jobs Radio 2.50 thousand jobs
Direct Economic Impact in State $0.15 billion in GDP 0.86 thousand jobs
Economic Impact on Other Industries in State $0.37 billion in GDP 2.15 thousand jobs
Stimulative Effect on Economy in State $2.76 billion in GDP 3.89 thousand jobs
Rhode Island Economy 2016 2025
Population (thousands) 1,059.93 1,099.49Households (thousands) 431.59 451.59
Employment (thousands of jobs) 630.58 690.51
Retail Sales (billions 2014 $) $15.68 $17.24Gross State Product (billions 2014 $) $57.99 $68.18Income per Capita (2014 $) $51,593 $59,599
Rhode Island – Local Television and Radio
NUMBER OF COMMERCIAL STATIONS
Television: 4Radio: 23

48Local Radio and TV: Helping Drive the U.S. Economy
© 2017 WOODS & POOLE ECONOMICS, INC. • WASHINGTON, D.C. • 800-786-1915 • WWW.WOODSANDPOOLE.COM
Total Economic Impact in State $14.74 billion in GDP Television $9.38 billion Radio $5.36 billion 32.53 thousand jobs Television 20.62 thousand jobs Radio 11.91 thousand jobs
Direct Economic Impact in State $0.67 billion in GDP 4.07 thousand jobs
Economic Impact on Other Industries in State $1.67 billion in GDP 10.14 thousand jobs
Stimulative Effect on Economy in State $12.40 billion in GDP 18.32 thousand jobs
South Carolina Economy 2016 2025
Population (thousands) 4,951.09 5,508.29Households (thousands) 1,974.68 2,224.78
Employment (thousands of jobs) 2,679.87 3,075.59
Retail Sales (billions 2014 $) $75.76 $89.36Gross State Product (billions 2014 $) $207.11 $252.54Income per Capita (2014 $) $39,279 $45,074
South Carolina – Local Television and Radio
NUMBER OF COMMERCIAL STATIONS
Television: 23Radio: 204

49Local Radio and TV: Helping Drive the U.S. Economy
© 2017 WOODS & POOLE ECONOMICS, INC. • WASHINGTON, D.C. • 800-786-1915 • WWW.WOODSANDPOOLE.COM
Total Economic Impact in State $2.87 billion in GDP Television $1.64 billion Radio $1.23 billion 6.30 thousand jobs Television 3.62 thousand jobs Radio 2.68 thousand jobs
Direct Economic Impact in State $0.13 billion in GDP 0.79 thousand jobs
Economic Impact on Other Industries in State $0.32 billion in GDP 1.96 thousand jobs
Stimulative Effect on Economy in State $2.42 billion in GDP 3.55 thousand jobs
South Dakota Economy 2016 2025
Population (thousands) 865.38 935.74Households (thousands) 349.15 384.33
Employment (thousands of jobs) 605.28 685.72
Retail Sales (billions 2014 $) $17.16 $19.67Gross State Product (billions 2014 $) $49.50 $59.25Income per Capita (2014 $) $49,107 $55,696
South Dakota – Local Television and Radio
NUMBER OF COMMERCIAL STATIONS
Television: 17Radio: 98
50Local Radio and TV: Helping Drive the U.S. Economy
© 2017 WOODS & POOLE ECONOMICS, INC. • WASHINGTON, D.C. • 800-786-1915 • WWW.WOODSANDPOOLE.COM
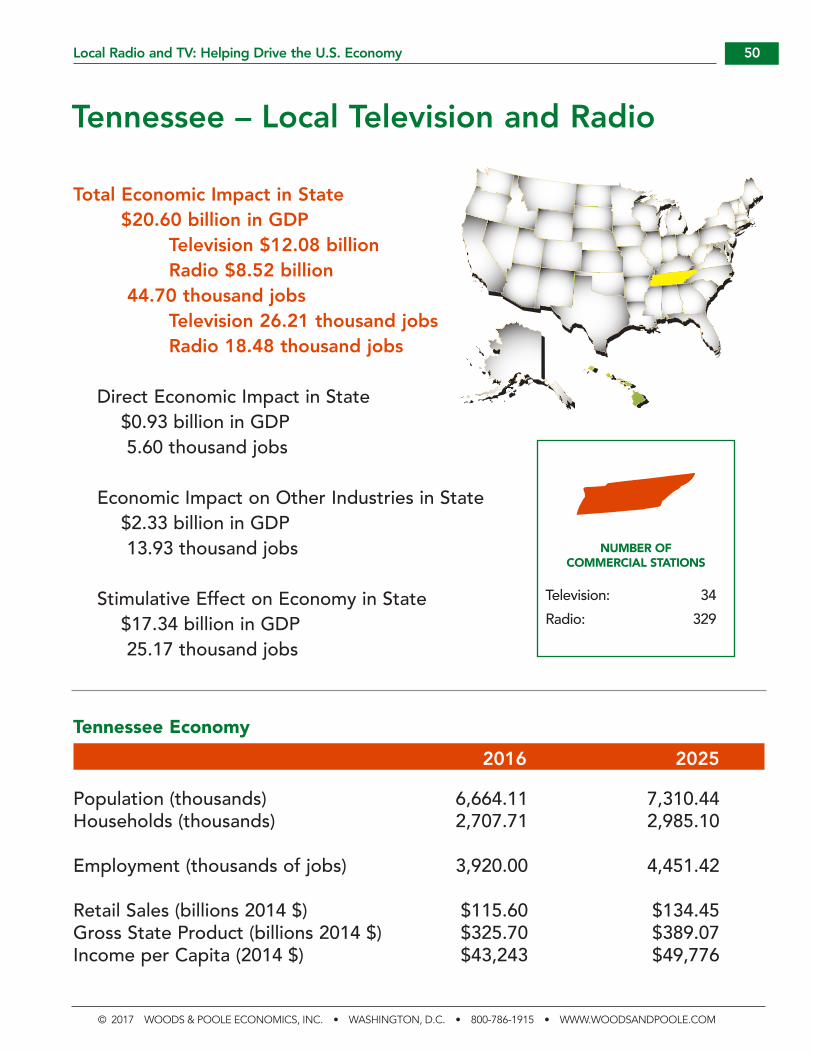
Total Economic Impact in State $20.60 billion in GDP Television $12.08 billion Radio $8.52 billion 44.70 thousand jobs Television 26.21 thousand jobs Radio 18.48 thousand jobs
Direct Economic Impact in State $0.93 billion in GDP 5.60 thousand jobs
Economic Impact on Other Industries in State $2.33 billion in GDP 13.93 thousand jobs
Stimulative Effect on Economy in State $17.34 billion in GDP 25.17 thousand jobs
Tennessee Economy 2016 2025
Population (thousands) 6,664.11 7,310.44Households (thousands) 2,707.71 2,985.10
Employment (thousands of jobs) 3,920.00 4,451.42
Retail Sales (billions 2014 $) $115.60 $134.45Gross State Product (billions 2014 $) $325.70 $389.07Income per Capita (2014 $) $43,243 $49,776
Tennessee – Local Television and Radio
NUMBER OF COMMERCIAL STATIONS
Television: 34Radio: 329
51Local Radio and TV: Helping Drive the U.S. Economy
© 2017 WOODS & POOLE ECONOMICS, INC. • WASHINGTON, D.C. • 800-786-1915 • WWW.WOODSANDPOOLE.COM
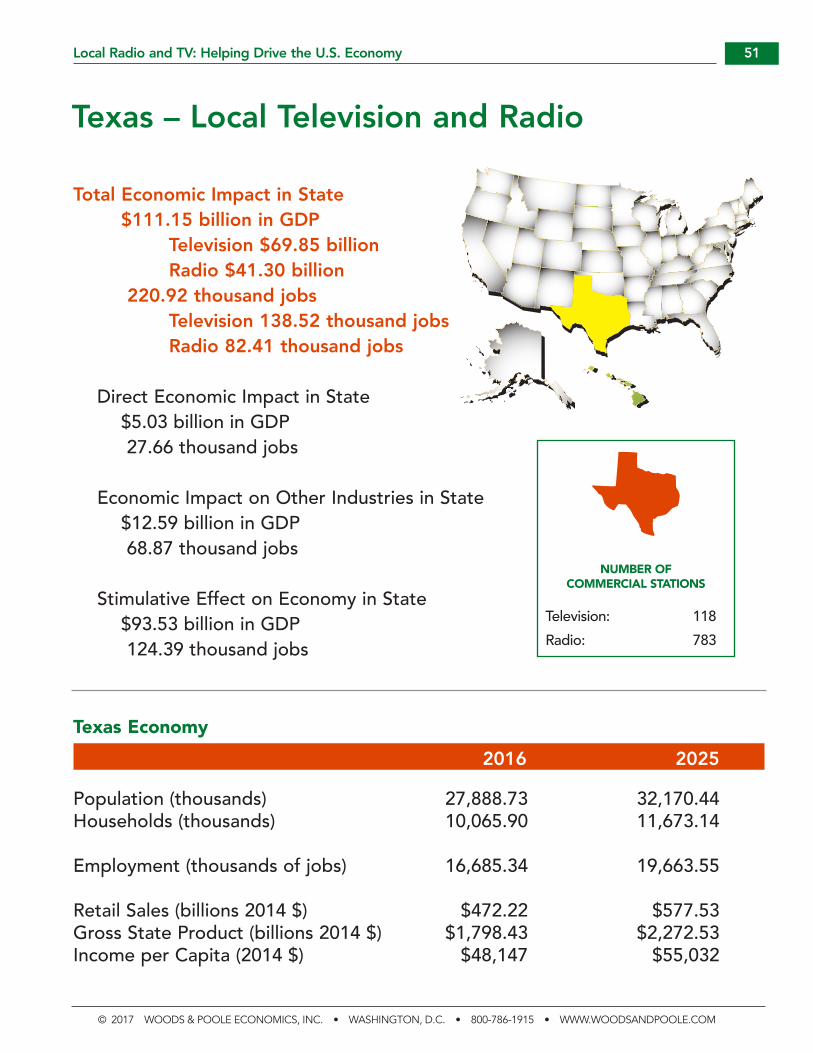
Total Economic Impact in State $111.15 billion in GDP Television $69.85 billion Radio $41.30 billion 220.92 thousand jobs Television 138.52 thousand jobs Radio 82.41 thousand jobs
Direct Economic Impact in State $5.03 billion in GDP 27.66 thousand jobs
Economic Impact on Other Industries in State $12.59 billion in GDP 68.87 thousand jobs
Stimulative Effect on Economy in State $93.53 billion in GDP 124.39 thousand jobs
Texas Economy 2016 2025
Population (thousands) 27,888.73 32,170.44Households (thousands) 10,065.90 11,673.14
Employment (thousands of jobs) 16,685.34 19,663.55
Retail Sales (billions 2014 $) $472.22 $577.53Gross State Product (billions 2014 $) $1,798.43 $2,272.53Income per Capita (2014 $) $48,147 $55,032
Texas – Local Television and Radio
NUMBER OF COMMERCIAL STATIONS
Television: 118Radio: 783

52Local Radio and TV: Helping Drive the U.S. Economy
© 2017 WOODS & POOLE ECONOMICS, INC. • WASHINGTON, D.C. • 800-786-1915 • WWW.WOODSANDPOOLE.COM
Total Economic Impact in State $8.39 billion in GDP Television $4.77 billion Radio $3.62 billion 18.46 thousand jobs Television 10.52 thousand jobs Radio 7.94 thousand jobs
Direct Economic Impact in State $0.38 billion in GDP 2.31 thousand jobs
Economic Impact on Other Industries in State $0.95 billion in GDP 5.75 thousand jobs
Stimulative Effect on Economy in State $7.06 billion in GDP 10.39 thousand jobs
Utah Economy 2016 2025
Population (thousands) 3,038.17 3,468.11Households (thousands) 989.41 1,140.85
Employment (thousands of jobs) 1,897.63 2,204.12
Retail Sales (billions 2014 $) $48.75 $59.00Gross State Product (billions 2014 $) $156.51 $194.56Income per Capita (2014 $) $40,491 $45,579
Utah – Local Television and Radio
NUMBER OF COMMERCIAL STATIONS
Television: 13Radio: 97

53Local Radio and TV: Helping Drive the U.S. Economy
© 2017 WOODS & POOLE ECONOMICS, INC. • WASHINGTON, D.C. • 800-786-1915 • WWW.WOODSANDPOOLE.COM
Total Economic Impact in State $1.81 billion in GDP Television $1.04 billion Radio $0.77 billion 4.22 thousand jobs Television 2.44 thousand jobs Radio 1.77 thousand jobs
Direct Economic Impact in State $0.08 billion in GDP 0.53 thousand jobs
Economic Impact on Other Industries in State $0.20 billion in GDP 1.31 thousand jobs
Stimulative Effect on Economy in State $1.52 billion in GDP 2.37 thousand jobs
Vermont Economy 2016 2025
Population (thousands) 630.46 675.60Households (thousands) 273.75 297.73
Employment (thousands of jobs) 441.25 495.89
Retail Sales (billions 2014 $) $12.01 $13.65Gross State Product (billions 2014 $) $31.42 $38.13Income per Capita (2014 $) $50,151 $57,485
Vermont – Local Television and Radio
NUMBER OF COMMERCIAL STATIONS
Television: 4Radio: 56

54Local Radio and TV: Helping Drive the U.S. Economy
© 2017 WOODS & POOLE ECONOMICS, INC. • WASHINGTON, D.C. • 800-786-1915 • WWW.WOODSANDPOOLE.COM
Total Economic Impact in State $31.87 billion in GDP Television $19.22 billion Radio $12.65 billion 65.61 thousand jobs Television 39.47 thousand jobs Radio 26.15 thousand jobs
Direct Economic Impact in State $1.44 billion in GDP 8.21 thousand jobs
Economic Impact on Other Industries in State $3.60 billion in GDP 20.45 thousand jobs
Stimulative Effect on Economy in State $26.82 billion in GDP 36.94 thousand jobs
Virginia Economy 2016 2025
Population (thousands) 8,471.59 9,376.25Households (thousands) 3,350.66 3,726.78
Employment (thousands of jobs) 5,139.83 5,868.16
Retail Sales (billions 2014 $) $140.98 $165.43Gross State Product (billions 2014 $) $494.86 $591.47Income per Capita (2014 $) $53,709 $60,985
Virginia – Local Television and Radio
NUMBER OF COMMERCIAL STATIONS
Television: 27Radio: 287

55Local Radio and TV: Helping Drive the U.S. Economy
© 2017 WOODS & POOLE ECONOMICS, INC. • WASHINGTON, D.C. • 800-786-1915 • WWW.WOODSANDPOOLE.COM
Total Economic Impact in State $24.55 billion in GDP Television $14.21 billion Radio $10.35 billion 48.38 thousand jobs Television 27.82 thousand jobs Radio 20.56 thousand jobs
Direct Economic Impact in State $1.11 billion in GDP 6.06 thousand jobs
Economic Impact on Other Industries in State $2.77 billion in GDP 15.08 thousand jobs
Stimulative Effect on Economy in State $20.67 billion in GDP 27.24 thousand jobs
Washington Economy 2016 2025
Population (thousands) 7,256.63 8,130.38Households (thousands) 2,896.70 3,277.47
Employment (thousands of jobs) 4,266.14 4,884.31
Retail Sales (billions 2014 $) $150.53 $178.81Gross State Product (billions 2014 $) $462.31 $568.06Income per Capita (2014 $) $53,035 $59,507
Washington – Local Television and Radio
NUMBER OF COMMERCIAL STATIONS
Television: 27Radio: 218

56Local Radio and TV: Helping Drive the U.S. Economy
© 2017 WOODS & POOLE ECONOMICS, INC. • WASHINGTON, D.C. • 800-786-1915 • WWW.WOODSANDPOOLE.COM
Total Economic Impact in State $5.78 billion in GDP Television $3.47 billion Radio $2.31 billion 12.39 thousand jobs Television 7.43 thousand jobs Radio 4.96 thousand jobs
Direct Economic Impact in State $0.26 billion in GDP 1.55 thousand jobs
Economic Impact on Other Industries in State $0.65 billion in GDP 3.86 thousand jobs
Stimulative Effect on Economy in State $4.87 billion in GDP 6.97 thousand jobs
West Virginia Economy 2016 2025
Population (thousands) 1,849.17 1,907.94Households (thousands) 795.16 826.49
Employment (thousands of jobs) 917.51 1,000.57
Retail Sales (billions 2014 $) $27.49 $30.07Gross State Product (billions 2014 $) $76.94 $85.55Income per Capita (2014 $) $37,668 $43,407
West Virginia – Local Television and Radio
NUMBER OF COMMERCIAL STATIONS
Television: 15Radio: 150

57Local Radio and TV: Helping Drive the U.S. Economy
© 2017 WOODS & POOLE ECONOMICS, INC. • WASHINGTON, D.C. • 800-786-1915 • WWW.WOODSANDPOOLE.COM
Total Economic Impact in State $21.29 billion in GDP Television $12.80 billion Radio $8.49 billion 45.63 thousand jobs Television 27.40 thousand jobs Radio 18.23 thousand jobs
Direct Economic Impact in State $0.96 billion in GDP 5.71 thousand jobs
Economic Impact on Other Industries in State $2.41 billion in GDP 14.22 thousand jobs
Stimulative Effect on Economy in State $17.92 billion in GDP 25.69 thousand jobs
Wisconsin Economy 2016 2025
Population (thousands) 5,803.63 6,138.56Households (thousands) 2,433.82 2,621.69
Employment (thousands of jobs) 3,689.88 4,101.48
Retail Sales (billions 2014 $) $96.17 $107.85Gross State Product (billions 2014 $) $314.49 $376.93Income per Capita (2014 $) $47,224 $54,257
Wisconsin – Local Television and Radio
NUMBER OF COMMERCIAL STATIONS
Television: 35Radio: 266

58Local Radio and TV: Helping Drive the U.S. Economy
© 2017 WOODS & POOLE ECONOMICS, INC. • WASHINGTON, D.C. • 800-786-1915 • WWW.WOODSANDPOOLE.COM
Total Economic Impact in State $2.24 billion in GDP Television $1.30 billion Radio $0.93 billion 4.41 thousand jobs Television 2.56 thousand jobs Radio 1.86 thousand jobs
Direct Economic Impact in State $0.10 billion in GDP 0.55 thousand jobs
Economic Impact on Other Industries in State $0.25 billion in GDP 1.38 thousand jobs
Stimulative Effect on Economy in State $1.88 billion in GDP 2.48 thousand jobs
Wyoming Economy 2016 2025
Population (thousands) 592.42 656.09Households (thousands) 247.39 278.20
Employment (thousands of jobs) 413.22 472.02
Retail Sales (billions 2014 $) $11.72 $13.76Gross State Product (billions 2014 $) $44.15 $51.97Income per Capita (2014 $) $57,067 $64,090
Wyoming – Local Television and Radio
NUMBER OF COMMERCIAL STATIONS
Television: 12Radio: 131

© 2017 WOODS & POOLE ECONOMICS, INC. • WASHINGTON, D.C. • 800-786-1915 • WWW.WOODSANDPOOLE.COM
59Local Radio and TV: Helping Drive the U.S. Economy
IntroductionThe Woods & Poole Economics, Inc. database contains more than 900 economic and demographic variables for every county in the United States for every year from 1970 to 2050. This comprehensive database includes detailed population data by age, sex, and race; employment and earnings by major industry; personal income by source of income; retail sales by kind of business; and data on the number of households, their size, and their income. All of these variables are projected for each year through 2050. In total, there are over 200 million statistics in the regional database. The regional model that produces the projection component of this database was developed by Woods & Poole. The regional projection methods are revised somewhat year to year to reflect new computational techniques and new sources of regional economic and demographic information. Each year, a new projection is produced based on an updated historical database and revised assumptions.
The fact that the proprietary Woods & Poole economic and demographic projections rely on a very detailed database, makes them one of the most comprehensive county-level projections available. A description of some characteristics of the database and projection model is contained in this chapter.
Overview of the Projection MethodsThe strength of Woods & Poole’s economic and demographic projections stems from the comprehensive historical county database and the integrated nature of the projection model. The projection for each county in the United States is done simultaneously so that changes in one county will affect growth or decline in other counties. For example, growth in employment and population in Houston will affect growth in other metropolitan areas, such as Cleveland. This reflects the flow of economic activity around the country as new industries emerge or relocate in growing areas and as people migrate, in part because of job opportunities. The county projections are developed within the framework of the United States projection made by Woods & Poole. The U.S. projection is the control total for the 2017 regional projections and is described in the “Overview of the 2017 Projections” chapter included in Woods & Poole publications.
Woods & Poole Economics, Inc. is a small, independent corporation that specializes in long-term county economic and demographic projections. Woods & Poole's database for every county in the U.S. contains projections through 2050 for more than 900 variables.
This document is a summary. Please contact Woods & Poole Economics, Inc. at (800)786-1915 for a more detailed Technical Description of the 2017 Regional Projections and Database.
Summary Technical Description of the Woods & Poole Economics, Inc.2017 Regional Projections and Database
© 2017 WOODS & POOLE ECONOMICS, INC. • WASHINGTON, D.C. • 800-786-1915 • WWW.WOODSANDPOOLE.COM
60Local Radio and TV: Helping Drive the U.S. Economy
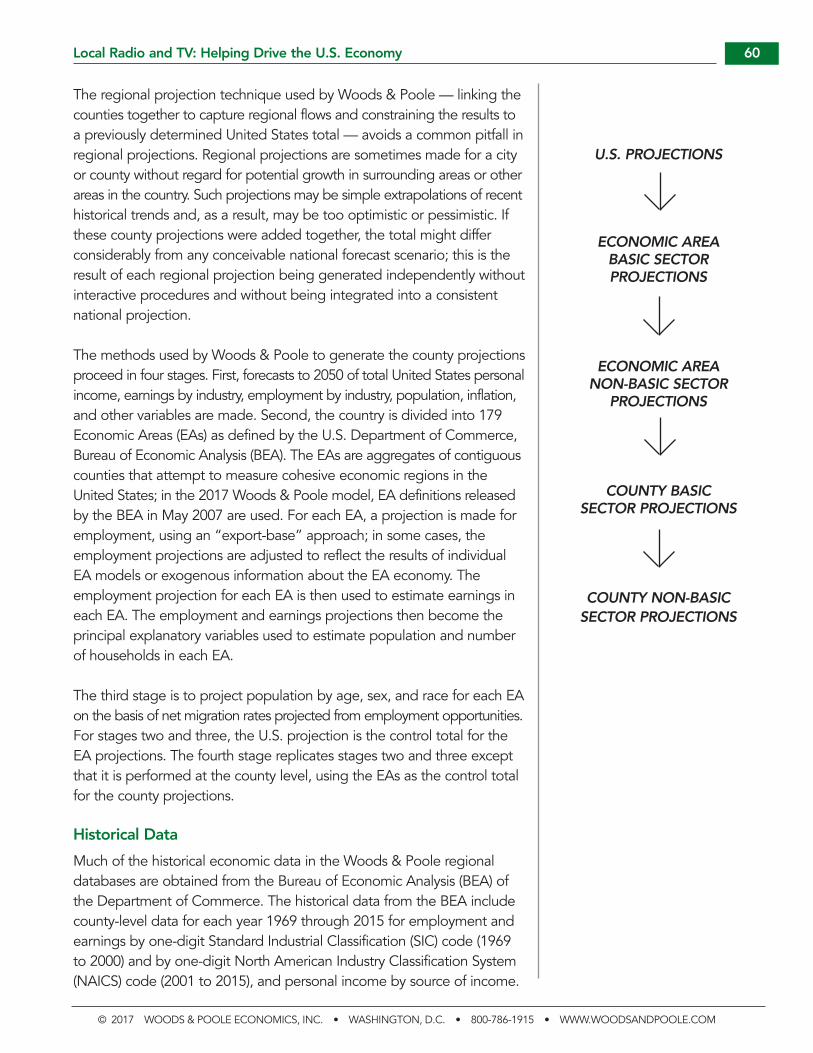
The regional projection technique used by Woods & Poole — linking the counties together to capture regional flows and constraining the results to a previously determined United States total — avoids a common pitfall in regional projections. Regional projections are sometimes made for a city or county without regard for potential growth in surrounding areas or other areas in the country. Such projections may be simple extrapolations of recent historical trends and, as a result, may be too optimistic or pessimistic. If these county projections were added together, the total might differ considerably from any conceivable national forecast scenario; this is the result of each regional projection being generated independently without interactive procedures and without being integrated into a consistent national projection.
The methods used by Woods & Poole to generate the county projections proceed in four stages. First, forecasts to 2050 of total United States personal income, earnings by industry, employment by industry, population, inflation, and other variables are made. Second, the country is divided into 179 Economic Areas (EAs) as defined by the U.S. Department of Commerce, Bureau of Economic Analysis (BEA). The EAs are aggregates of contiguous counties that attempt to measure cohesive economic regions in the United States; in the 2017 Woods & Poole model, EA definitions released by the BEA in May 2007 are used. For each EA, a projection is made for employment, using an “export-base” approach; in some cases, the employment projections are adjusted to reflect the results of individual EA models or exogenous information about the EA economy. The employment projection for each EA is then used to estimate earnings in each EA. The employment and earnings projections then become the principal explanatory variables used to estimate population and number of households in each EA.
The third stage is to project population by age, sex, and race for each EA on the basis of net migration rates projected from employment opportunities. For stages two and three, the U.S. projection is the control total for the EA projections. The fourth stage replicates stages two and three except that it is performed at the county level, using the EAs as the control total for the county projections.
Historical DataMuch of the historical economic data in the Woods & Poole regional databases are obtained from the Bureau of Economic Analysis (BEA) of the Department of Commerce. The historical data from the BEA include county-level data for each year 1969 through 2015 for employment and earnings by one-digit Standard Industrial Classification (SIC) code (1969 to 2000) and by one-digit North American Industry Classification System (NAICS) code (2001 to 2015), and personal income by source of income.
U.S. PROJECTIONS
ECONOMIC AREABASIC SECTORPROJECTIONS
ECONOMIC AREANON-BASIC SECTOR
PROJECTIONS
COUNTY BASICSECTOR PROJECTIONS
COUNTY NON-BASICSECTOR PROJECTIONS

© 2017 WOODS & POOLE ECONOMICS, INC. • WASHINGTON, D.C. • 800-786-1915 • WWW.WOODSANDPOOLE.COM
61Local Radio and TV: Helping Drive the U.S. Economy
Other sources of data include the 1970, 1980, 1990, 2000, and 2010 Censuses and post-Censal reports for population and household data, and the quinquennial Census of Retail Trade for retail sales data. Woods & Poole generally accepts the government data as given unless indicated otherwise in this chapter. The discussion which follows, of the historical data used by Woods & Poole, is not intended to be a complete explanation of the historical data; the user should consult the government sources of the historical data for a complete explanation. Some of the sources of government data used by Woods & Poole have technical explanations of how the historical data is collected, how the data can be used, and limitations to the data; the documentation may contain important information on the applicability of the data for particular applications and should be reviewed by users of the historical data; the documentation can be obtained from the U.S. Dept. of Commerce, the Government Printing Office or many public libraries. All data for the years 2016-2050 are projected by Woods & Poole.
Historical data are subject to revision from time to time. Historical employment and income data from the Bureau of Economic Analysis are revised on a regular basis. For example, historical data released by the Bureau of Economic Analysis in 1984 showed total employment for the United States in 1980 to be 106.4 million jobs; the current estimate of 1980 U.S. total employment is 114.0 million jobs. When using the historical data, it is important to use the current revision and not combine this data with previous versions since there may be definitional changes in the data.
Gross Domestic Product by StateGross Domestic Product by State, formerly Gross State Product (GSP), is called Gross Regional Product (GRP) in the Woods & Poole database. GRP is historical for the United States total, regions, and states for the years 1969-2014 from the Bureau of Economic Analysis Gross Domestic Product by State series. All county, and metropolitan area, historical GRP data, 1969-2014, are estimated by Woods & Poole by allocating state GRP in a particular year to counties within the state based on the proportion of total state earnings of employees originating in a particular county. County GRP estimates are constrained to state totals for the years 1969-2014. All GRP data are establishment based.
Local Television and Radio Employment and OutputAll of the estimates provided in this report are for 2016. The estimates of local radio and television employment were obtained from the U.S. Department of Commerce, Bureau of the Census. Employment estimates by detailed NAICS industries for broadcasting and advertising were used to create U.S. and state employment estimates for television and radio.
Historical data used by Woods & Poole are subject to significant revisions.
Gross Domestic Product by State (formerly Gross State Product or GSP) is called Gross Regional Product (GRP) in the Woods & Poole database.

© 2017 WOODS & POOLE ECONOMICS, INC. • WASHINGTON, D.C. • 800-786-1915 • WWW.WOODSANDPOOLE.COM
62Local Radio and TV: Helping Drive the U.S. Economy
The input-output factors to estimate employment from suppliers were obtained from the detailed input-output tables of the Bureau of Economic Analysis. The multiplier factors were assumed to always be less than 2.5 jobs. The stimulative factor was always assumed to be less than $19 of economic output per $1 of advertising output and less than 40 jobs per $1 million of advertising output. The output data was obtained from local television and radio broadcasting sources.
EmploymentThe employment data in the Woods & Poole database are a complete measure of the number of full- and part-time jobs by place of work. Historical data, 1969-2015 are from the U.S. Department of Commerce, Bureau of Economic Analysis. The employment data include wage and salary workers, proprietors, private household employees, and miscellaneous workers. Wage and salary employment data are based on an establishment survey in which employers are asked the number of full- and part-time workers at a given establishment. Because part-time workers are included, a person holding two part-time jobs would be counted twice. Also, since the wage and salary employment data are based on an establishment survey, jobs are counted by place of work and not place of residence of the worker; thus, a job in the New York Metropolitan Area is counted in the New York Metropolitan Area regardless of where the worker lives.
Data on proprietors include farm and non-farm proprietors by sector. Proprietors include not only those people who devote the majority of their time to their proprietorship, but people who devote any time at all to a proprietorship. Thus, a person who has a full-time wage and salary job and on nights and weekends runs a small business legally defined as a proprietorship would be counted twice. The employment data therefore include full- and part-time proprietors.
Private household employment data include persons employed by a household on the premises, such as full-time baby-sitters, housekeepers, gardeners, and butlers. Miscellaneous employment data include judges and all elected officials, persons working only on commission in sectors such as real estate and insurance, students employed by the colleges or universities in which they are enrolled, and unincorporated subcontractors in sectors such as construction.
The employment data used by Woods & Poole comprise the most complete definition of the number of jobs by county. Woods & Poole data may be higher than that from other sources because they measure more kinds of employment. There are three other commonly used government sources for employment data: the Bureau of Labor Statistics
Employment data are historical for the years 1969 – 2013 and projected for the years 2014 – 2050. Employment data by NAICS industries is estimated for the years 1969 – 2000.
© 2017 WOODS & POOLE ECONOMICS, INC. • WASHINGTON, D.C. • 800-786-1915 • WWW.WOODSANDPOOLE.COM
63Local Radio and TV: Helping Drive the U.S. Economy
(BLS), the Bureau of the Census, and the National Income and Product Accounts (NIPA). These sources of employment data differ from the data used by Woods & Poole. The BLS establishment data are generally much lower than the Woods & Poole data because agricultural workers, the military, proprietors, households, and miscellaneous employment are not included; the exclusion of proprietors from the BLS data is the most significant difference. Data from the Census (and some survey data from the BLS) are based on employment by place of residence and differ fundamentally in concept from the Woods & Poole employment data by place of work; Census employment data are generally lower than Woods & Poole data, but not always. Since Census data are based on a household survey, persons holding two jobs would be counted only once, and, therefore, the data would be lower than Woods & Poole. However, Census survey data for counties that have a large number of commuters and relatively few jobs within the county could yield employment data higher than Woods & Poole. Employment data in the National Income and Product Accounts are close to Woods & Poole data, except that part-time proprietors and certain miscellaneous employees are excluded; therefore, these data are usually lower. Personal IncomeThe historical data (1969-2015) for total personal income are from the U.S. Department of Commerce, Bureau of Economic Analysis. Total personal income is the income received by persons from all sources, that is, from participation in production, from both government and business transfer payments, and from government interest, which is treated like a transfer payment. Persons consist of individuals, nonprofit institutions serving individuals, private uninsured welfare funds, and private trust funds. Personal income is the sum of wages and salaries, other labor income, proprietors’ income, rental income of persons, dividend income, personal interest income, and transfer payments less personal contributions for social insurance.
As with employment, the definition of total personal income used by Woods & Poole is the most comprehensive one available. Another commonly used measure of income is money income of persons. Money income is the concept used by the Bureau of the Census and is widely used in other sources. When Woods & Poole’s income data are higher than data from another source, once inflation adjustments are taken into account, it is probably because the other source uses money income base data. Total personal income includes all of money income plus the exclusions to money income. Money income excludes payments-in-kind such as food stamps, agricultural payments-in-kind, and the value of in-kind medical payments; the imputed rental value of owner-occupied
Historical data in the Woods & Poole database are revised each year.
Personal income data are historical for the years 1969 – 2015 and projected for the years 2016 – 2050.
Employment data in the Woods & Poole database are usually much higher than BLS employment data because Woods & Poole includes proprietors and government workers.

© 2017 WOODS & POOLE ECONOMICS, INC. • WASHINGTON, D.C. • 800-786-1915 • WWW.WOODSANDPOOLE.COM
64Local Radio and TV: Helping Drive the U.S. Economy
housing; the imputed value of certain interest payments such as the value to consumers of free non-interest bearing checking accounts; all other labor income; capital consumption adjustments for proprietors; inventory valuation adjustments, although sometimes this is negative; and lump-sum payments such as liability judgments and consumer defaults on debts to businesses. For the U.S. as a whole, money income is about 25% less than total personal income; at the regional level, the difference varies depending on the specific composition of total personal income.
Another commonly used measure of income is disposable income, which is defined as total personal income less personal tax and non-tax payments. Disposable income is the income available to persons for spending or saving. Tax payments are payments, net of refunds, made by persons to the government; it includes taxes such as income, estate and gift, and personal property taxes, but it excludes personal contributions to social insurance. Non-tax payments include tuition and fees paid to schools and hospitals operated mainly by the government, donations to such institutions, passport fees, and fines and penalties.
Retail Sales and Food Services SalesData for retail sales by kind of business are from the 1972, 1977, 1982, 1987, 1992, 1997, 2002, 2007 and 2012 Census of Retail Trade (U.S. Department of Commerce, Bureau of the Census). Retail sales data for 1972, 1977, 1982, 1987, 1992, and 1997 has been changed by Woods & Poole from SIC classifications to estimated NAICS kind of business classifications to be consistent with 2002 Census of Retail Trade data. The intervening historical data for the years 1969-71, 1973-76, 1978-81, 1983-86, 1988-91, 1993-96, 1998-2001, 2003-2006, and 2008-2011 are also estimated by Woods & Poole. These estimates are made by interpolating retail sales by kind of business per capita for the intervening years (e.g., 1973-76). These proportions are then multiplied by population for the intervening years to estimate retail sales by kind of business. The estimates are then constrained to U.S. retail sales by kind of business for the intervening years. U.S. retail sales data for 1969-2012 are from the Bureau of Economic Analysis but are revised by Woods & Poole to be consistent with the sum of the county retail sales data for the Census years. Therefore, retail sales data for the U.S. are the sum of county retail sales as published in the Census of Retail Trade and differ from the U.S. data published monthly by the Department of Commerce.
Some county data from the Census of Retail Trade are withheld because of Federal information disclosure policies. All withheld data have been estimated by Woods & Poole; the techniques used to make these estimates are described below in the section titled “Estimation of Missing Historical Data.”
Personal income (and income per capita) data used by Woods & Poole are usually much higher than money income data used by the Census because money income excludes some forms of income.
Retail sales data are historical for the years 1972, 1977, 1982, 1987, 1992, 1997, 2002, 2007 and 2012; estimated for all other years 1969 – 2011 and projected for the years 2013 – 2050.
Retail sales by kind of business are based NAICS classifications. Total retail sales includes food services and drinking places.

© 2017 WOODS & POOLE ECONOMICS, INC. • WASHINGTON, D.C. • 800-786-1915 • WWW.WOODSANDPOOLE.COM
65Local Radio and TV: Helping Drive the U.S. Economy
In the 2017 Woods & Poole database total retail sales are modified to include food services and drinking places sales (NAICS 722). The inclusion of food services and drinking places sales makes total retail sales more consistent with the SIC definition.
Retail sales are counted, as are employment and earnings, on an establishment basis. Mail-order sales are counted at the point from which the merchandise is sent and not at the point at which it is received. Retail sales are classified by kind of business according to the principal lines of commodities sold (e.g., groceries or hardware) or the usual trade designation (e.g., drug store or cigar store). In some cases, an establishment sells goods in several different business groups, such as a convenience store with gasoline pumps. In these cases, all the establishment’s sales are classified in the business group that is the primary activity of the establishment; therefore, the retail sales data by kind of business does not reflect retail sales by merchandise line.
PopulationThe historical population data for the years 1969 to 2015 are from the U.S. Department of Commerce, Bureau of the Census. The historical county total population and population by single year of age by race and sex for the years 1991-1999, 2001-2009, and 2011-2015 are estimated by the National Institutes of Health based on Bureau of the Census intercensal and Vintage 2015 postcensal estimates. The historical county population by single year of age by race and sex for the years 1971-1979 and 1981-1989 are estimated by using single year of age data from the 1970, 1980, and 1990 Census of Population for counties, and U.S. annual population by single year of age by race and sex.
Population is defined as July 1 residential population and includes: civilian population; military population except personnel stationed overseas; college residents; institutional populations, such as prison inmates and residents of mental institutions, nursing homes, and hospitals; and estimates of undocumented aliens. Excluded are persons residing in Puerto Rico, U.S. territories and possessions, and U.S. citizens living abroad.
The population data in the Woods & Poole database are generally consistent with data from other sources, including the Census Bureau. The most significant difference between the Census Bureau data used by Woods & Poole and the actual 1970, 1980, 1990, 2000, and 2010 Census results is that Woods & Poole data are July 1-based and the decennial census data are April 1-based. Decennial census data were adjusted forward from April 1 to July 1 to make them consistent with population data for other years as well as with the employment and income data, which are also July 1-based.
Total population data are historical for the years 1969 – 2015, and projected for the years 2016 – 2050.
The 2015 Woods & Poole database includes 2010 Census population data.

© 2017 WOODS & POOLE ECONOMICS, INC. • WASHINGTON, D.C. • 800-786-1915 • WWW.WOODSANDPOOLE.COM
66Local Radio and TV: Helping Drive the U.S. Economy
HouseholdsThe data for households are from Census Bureau counts in 1970, 1980, 1990, 2000, and 2010 and Census Bureau estimates for 1985. As with population, the household data from the decennial censuses were adjusted from April 1 to July 1. The 1985 Census Bureau estimate was already July 1-based. All other years of county household data (i.e., 1969, 1971-1979, 1981-1984, 1986-1989, 1991-1999, and 2001-2009) are estimates. Household data for the U.S. and states, 1969-2010, are based on Census Bureau data.
Household data for total number of households, group quarters population, and average size of households from the 1990, 2000, and 2010 Census, adjusted to a July-1 base, are included in the Woods & Poole database.
Households are defined as occupied housing units. A housing unit is a house, an apartment, a group of rooms, or a single room occupied as separate living quarters. The occupants of a housing unit may be a single family, one person living alone, two or more families living together, or any group of related or unrelated persons who share living quarters. All people are part of a household except those who reside in group quarters. Group quarters include living arrangements such as prisons, homes for the aged, rooming houses, college dormitories, and military barracks. The average size of households is defined as total population less group quarters population divided by the number of households. Mean household income is defined as total personal income less estimated income of group quarters population divided by the number of households.
Household data are historical for the years 1970, 1980, 1985 1990, 2000, and 2010; estimated for all other years 1969 – 2009; and projected for the years 2011 – 2050.

1771 N Street NW Washington DC 20036 2800nabstore.com