Embed Size (px)
Citation preview
Local energy planning as a
component of a national IEP Mark Borchers/ Megan Euston-Brown

Top 15 cities
~40% of total national consumption
~ 3% of land area (i.e. very energy intensive)

• Building regulations
• Urban layout
• Transport planning
• Electricity distribution
• Electrification
• Embedded RE generation
• Disaster management
• By-laws
• Standards & codes
• Procurement policies
• Budget allocations
• Air Quality control measures
• Etc…
City authorities are de-facto big players in
implementation:
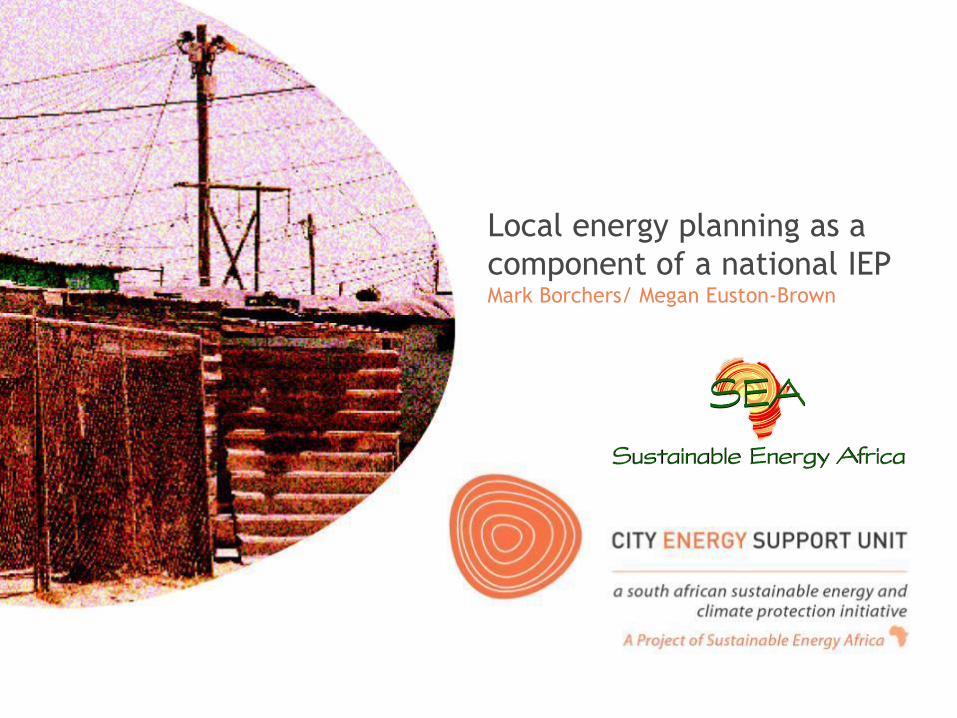
IEP: Demand-led planning and municipalities
IRP demand forcasting for electricity indicative of substantial role of
municipalities, particularly metros
Re-distributors (mainly metros)

IEP: Demand-led planning and municipalities
•Municipal demand is a big part of the national energy picture (over 40%)
and it is important that it is seriously modeled within any IEP/IRP process
•This must factor in:
• Detailed demand data already collected
• Local energy strategies, plans and targets
• EEDSM programmes planned and underway
• Transport plans and mandates
• Transport infrastructure costs
• Electrification programmes
• Transmission and distribution costs

IEP: Demand-led planning and municipalities: EEDSM
potential

R 0
R 200,000,000
R 400,000,000
R 600,000,000
R 800,000,000
R 1,000,000,000
R 1,200,000,000
R 1,400,000,000
LI lighting LI fridge HI lighting HI fridge HI water COM
HVAC
COM water COM
lighting
LG lighting LG HVAC LG street
lights
LG traffic
signals
Cumulative net saving from electricity efficiency interventions up to 2025
The bars represent cumulative net savings (i.e. considering capital costs and electricity savings) of electricity efficiency interventions.
Low-inc residential
Commercial
Govt
Mid-hi inc residential

IEP: Access to energy in urban areas
•Access a key national poverty alleviation issue
(currently, 18% of households do not have access to
electricity)
•Growth - urban informal housing sector – 10% of households
•Free Basic Alternative Energy (FBAE) initiative has not
worked, and unlikely to in future.
•Electrification in informal urban (grid linked) areas
now well understood and valuable and workable
solution for access.
•IEP must factor this expansion of grid and demand into
the modeling and financing of the IEP
•Where grid is unlikely to reach communities, off-grid
solutions need to be planned and resourced.
•Know electrification doesn’t mean end of dirty,
dangerous fuels and ongoing support and work required.
•Affordability of electricity – complex: not burden poor
while not losing high end users
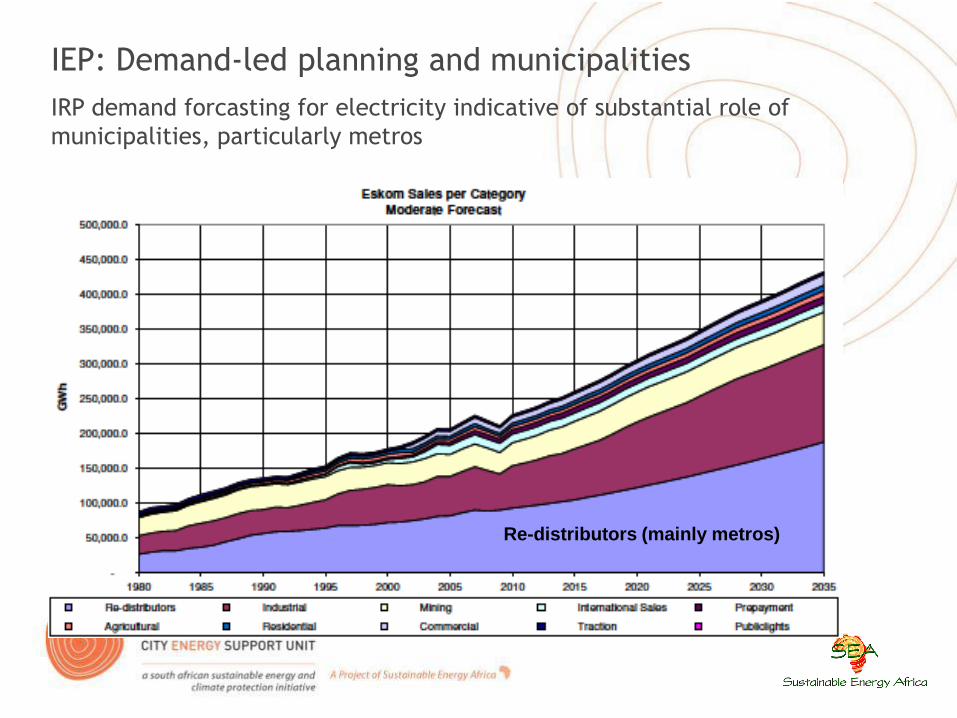
IEP: Supply options and municipalities
•Municipal supply options must be seriously considered: landfill gas, waste
water to electricity, pv installations
•Embedded generation can be significant and must be provided for in an IRP
– providing a ‘municipal generation reserve’. Without this provision NERSA
may not issue generation licenses.

IEP: Transport and urban planning
• Huge energy and carbon implications
•Powers being devolved to local level
•Huge infrastructure cost implications
•Big changes in urban spatial planning essential
for more efficient, cost-effective transport
systems

IEP: Demand-led planning and municipalities
All have Energy, climate and integrated transport strategies and plans
City EE SWH RE Transport
Buffalo
City
Streetlighting – 693MW ITP
Cape Town Street and traffic lighting
841MWh/yr
Savings campaign
Public buildings
Commercial energy forum
Target 300 000
SWH by 2012 =
600GWh
reduction (6%)
10% RE by 2020
Waste to energy plans
Darling wind farm – 5MW
BRT
Efficient vehicles
Urban planning
City of
Joburg
Streetlighting
Public buildings
Waste water potential underway Rea Vaya
Planning regs
Ekruhuleni Council buildings / Street
lighting / Residential
programme
Mass rollout under
design
2MW PV underway
Landfill gas 5MW potential
ITP
eThekwini Street and traffic lighting
KSEF
DICCP
Shisa solar (15000
systems)
900 low-inc SWHs
10MW landfill
Exploring micro hydro
20MW wind potential in city
ITP
NMBMM 1MW potential – buildings
Street lighting
60 000 units next 5
years = 41MW
100 MW wind potential in city
2,5 – 5MW waste water potential
ITP
Tshwane Street lighting project 10% RE local generation target ITP
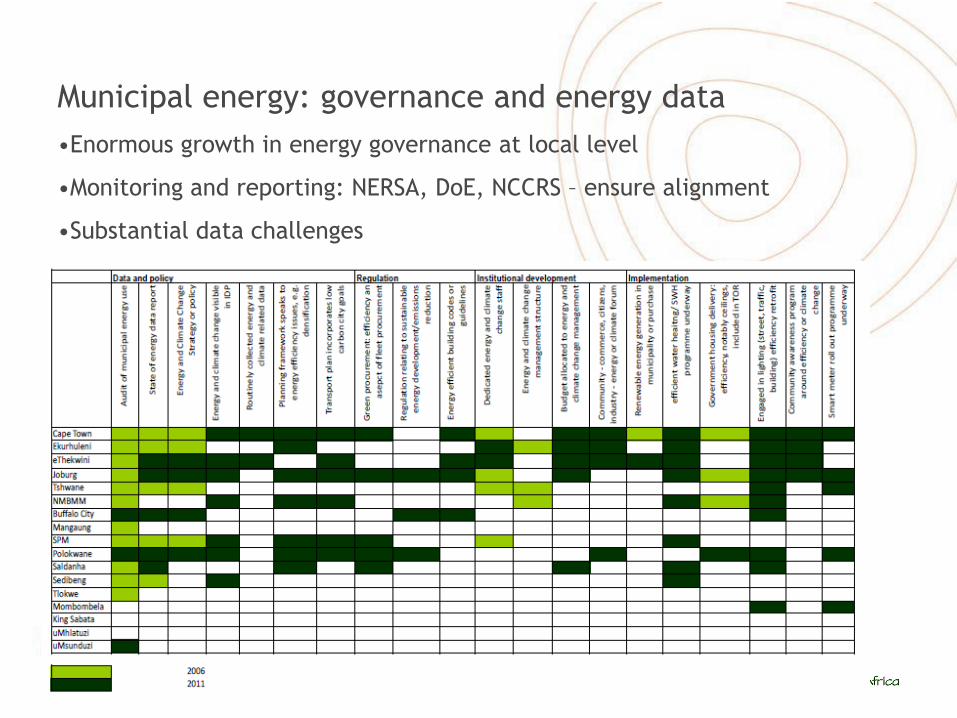
Municipal energy: governance and energy data
•Enormous growth in energy governance at local level
•Monitoring and reporting: NERSA, DoE, NCCRS – ensure alignment
•Substantial data challenges

Key proposals to IEP
1. City demand expectations and strategies to be included in
demand forecasting
2. Implementation role of cities to be explicitly considered
3. Informal electrification critical for welfare and driven by cities –
demand and budget implication in IEP
4. Budget alignment with implementation role
E.g. Transport budget and capacity alignment NB
5. Cities as key implementers supports diversity of approaches –
diversity NB in a fast changing environment…

City Energy Support Unit, Sustainable Energy Africa www.cityenergy.org.za
Sustainable Energy Africa and City
Energy Support
•Constitution of SA: developmental local
government
•Energy policy post 1994: introduces integrated
(demand-led) planning, access, environmental
considerations – strong role local government
•SEA pioneering local sustainable energy policy
development and building local capacity to tackle
new area of work – SEED Programme 1998 - ; City
Energy Support Unit 2008 –
•First city level energy data collated in City of Cape
Town State of Energy Report, 2003
•Today at least 8 – 10 cities/towns have Energy and
Climate Strategies, based on international protocols
and methodologies pioneered by SEA
•First picture of role of urban energy within the
national energy picture developed through SEA’s
State of Energy in SA Cities, 2006 and updated in
State of Energy in SA Cities 2010.

Municipal energy: governance and energy data
•Enormous growth in energy governance at local level
•Monitoring and reporting: NERSA, DoE, NCCRS – ensure alignment
•Substantial data challenges
• NERSA unable to produce annual data reports because of paucity data
from municipalities and the quality of the data
• Eskom data not readily available and doesn’t line up with municipal
boundaries
• SAPIA data future uncertain (and magisterial boundaries don’t align
with municipal)