Embed Size (px)
Citation preview
Legislative Audit Bureau n
Report 12-7 April 2012
Local Government Property Insurance Fund Office of the Commissioner of Insurance

Report 12-7 April 2012
Local Government Property Insurance Fund
Office of the Commissioner of Insurance
2011-2012 Joint Legislative Audit Committee Members
Senate Members: Assembly Members: Robert Cowles, Co-chairperson Samantha Kerkman, Co-chairperson Mary Lazich Kevin Petersen Alberta Darling Robin Vos Kathleen Vinehout Andy Jorgensen Julie Lassa Jon Richards
LEGISLATIVE AUDIT BUREAU The Bureau is a nonpartisan legislative service agency responsible for conducting financial and program evaluation audits of state agencies. The Bureau’s purpose is to provide assurance to the Legislature that financial transactions and management decisions are made effectively, efficiently, and in compliance with state law and that state agencies carry out the policies of the Legislature and the Governor. Audit Bureau reports typically contain reviews of financial transactions, analyses of agency performance or public policy issues, conclusions regarding the causes of problems found, and recommendations for improvement. Reports are submitted to the Joint Legislative Audit Committee and made available to other committees of the Legislature and to the public. The Audit Committee may arrange public hearings on the issues identified in a report and may introduce legislation in response to the audit recommendations. However, the findings, conclusions, and recommendations in the report are those of the Legislative Audit Bureau. For more information, write the Bureau at 22 East Mifflin Street, Suite 500, Madison, WI 53703, call (608) 266-2818, or send e-mail to [email protected]. Electronic copies of current reports are available at www.legis.wisconsin.gov/lab.
State Auditor – Joe Chrisman
Audit Prepared by
Carolyn Stittleburg, Financial Audit Director
Tammi Richmond Rachel Haberkorn Lanae Nickelotti Emily Pape Amelia Slaney
Report Design and Production – Susan Skowronski
CONTENTS
Letter of Transmittal 1
Introduction 3
Financial Status 5 Monitoring the Surplus Balance 7
Audit Opinion 9
Independent Auditor’s Report on the Financial Statements of the Wisconsin Local Government Property Insurance Fund
Management’s Discussion and Analysis 11
Financial Statements 25
Statement of Net Assets as of June 30, 2011, 2010, and 2009 26
Statement of Revenues, Expenses, and Changes in Fund Net Assets for the Years Ended June 30, 2011, 2010, and 2009 27
Statement of Cash Flows for the Years Ended June 30, 2011, 2010, and 2009 28
Notes to the Financial Statements 31
Required Supplementary Information 45
Ten-Year Claims Development Information 47
Report on Internal Control and Compliance 49
Independent Auditor’s Report on Internal Control over Financial Reporting and on Compliance and Other Matters Based on an Audit of Financial Statements Performed in Accordance with Government Auditing Standards
Response
From the Office of the Commissioner of Insurance


April 11, 2012
Senator Robert Cowles and Representative Samantha Kerkman, Co-chairpersons Joint Legislative Audit Committee State Capitol Madison, Wisconsin 53702 Dear Senator Cowles and Representative Kerkman: As required by s. 13.94(1)(de), Wis. Stats., we have completed a financial audit of the Local Government Property Insurance Fund, which provides property insurance to counties, cities, towns, villages, school districts, and other local units of government. The Property Fund is administered by the Office of the Commissioner of Insurance (OCI). As of June 30, 2011, it insured $50.0 billion in property owned by 1,087 local units of government. We have issued an unqualified opinion on the Property Fund’s financial statements for the fiscal years (FYs) ended June 30, 2011, June 30, 2010, and June 30, 2009. The Property Fund’s surplus balance, or net assets available to pay future claims, declined from $41.2 million as of June 30, 2009, to $20.5 million as of June 30, 2011. A $12.0 million dividend declared during FY 2009-10 and the highest level of claims activity to date during FY 2010-11 each contributed to the decline in the surplus balance. In response, OCI is implementing premium rate increases and will continue monitoring the surplus balance. We appreciate the courtesy and cooperation extended to us by OCI staff and the private contractors responsible for administration of the Property Fund. OCI’s response follows our report. Respectfully submitted, Joe Chrisman State Auditor JC/CS/ss

3
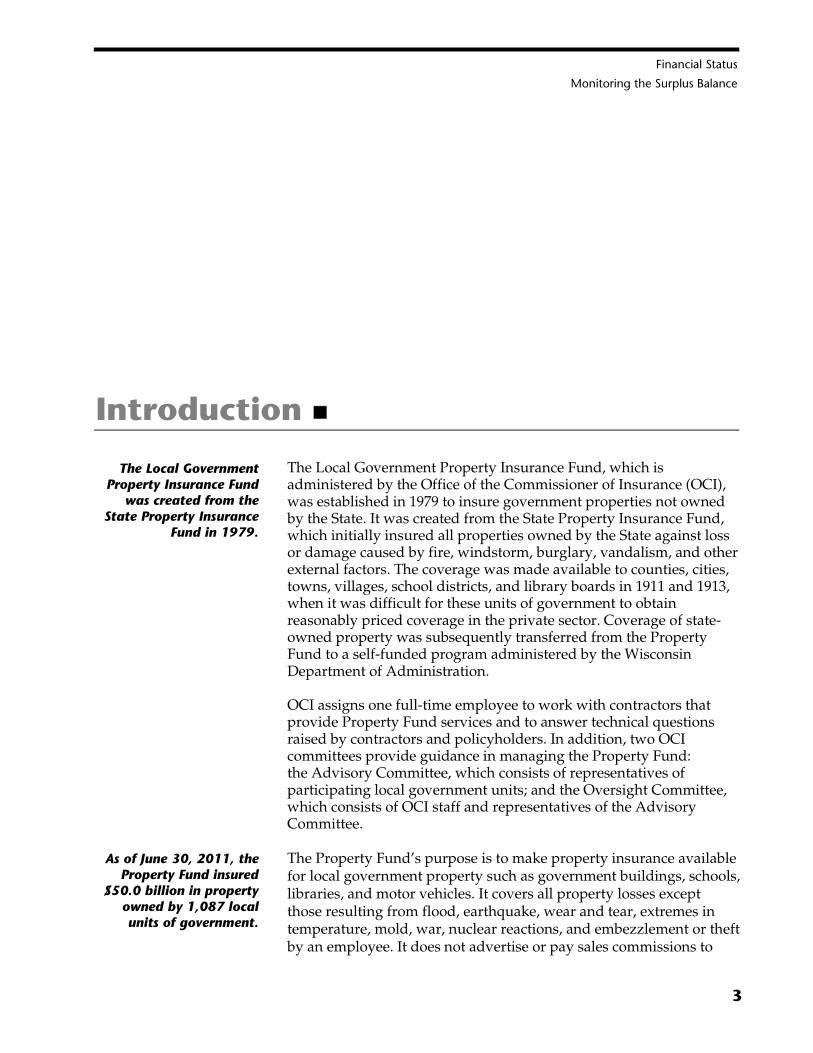
The Local Government Property Insurance Fund, which is administered by the Office of the Commissioner of Insurance (OCI), was established in 1979 to insure government properties not owned by the State. It was created from the State Property Insurance Fund, which initially insured all properties owned by the State against loss or damage caused by fire, windstorm, burglary, vandalism, and other external factors. The coverage was made available to counties, cities, towns, villages, school districts, and library boards in 1911 and 1913, when it was difficult for these units of government to obtain reasonably priced coverage in the private sector. Coverage of state-owned property was subsequently transferred from the Property Fund to a self-funded program administered by the Wisconsin Department of Administration. OCI assigns one full-time employee to work with contractors that provide Property Fund services and to answer technical questions raised by contractors and policyholders. In addition, two OCI committees provide guidance in managing the Property Fund: the Advisory Committee, which consists of representatives of participating local government units; and the Oversight Committee, which consists of OCI staff and representatives of the Advisory Committee. The Property Fund’s purpose is to make property insurance available for local government property such as government buildings, schools, libraries, and motor vehicles. It covers all property losses except those resulting from flood, earthquake, wear and tear, extremes in temperature, mold, war, nuclear reactions, and embezzlement or theft by an employee. It does not advertise or pay sales commissions to
Introduction
The Local Government Property Insurance Fund
was created from the State Property Insurance
Fund in 1979.
As of June 30, 2011, the Property Fund insured
$50.0 billion in property owned by 1,087 local units of government.
Financial Status
Monitoring the Surplus Balance

4 INTRODUCTION
insurance agents and does not actively solicit business. Local units of government generally become aware of the Property Fund by word of mouth or from information available on OCI’s website. As shown in Table 1, the Property Fund insured 1,087 local units of government as of June 30, 2011, and insured property was valued at $50.0 billion.
Table 1
Number of Policyholders by Governmental Unit As of June 30
Governmental Unit 2009 2010 2011
Counties 71 71 71
Cities 156 155 153
Towns 187 184 176
Villages 262 260 258
School Districts 315 312 305
Other 123 123 124
Total 1,114 1,105 1,087 Insurance in Force (in billions)
$48.1
$49.9
$50.0
Total participation in the Property Fund declined from 1,183 local units of government as of June 30, 2002, to 1,087 as of June 30, 2011. Participation in the Property Fund peaked with 1,206 local units of government as of June 30, 2003. While other units of government have shown minimal increases and decreases in participation over the past ten years, the number of towns participating declined from 270 as of June 30, 2002, to 176 as of June 30, 2011. Factors that may have affected participation include the availability of other insurance options in the market and the merger of municipal governments. Despite a decline in the number of governmental units insured with the Property Fund, the value of insurance in force has continued to increase as a result of both inflationary growth in the property base and new construction.
INTRODUCTION 5
Financial Status
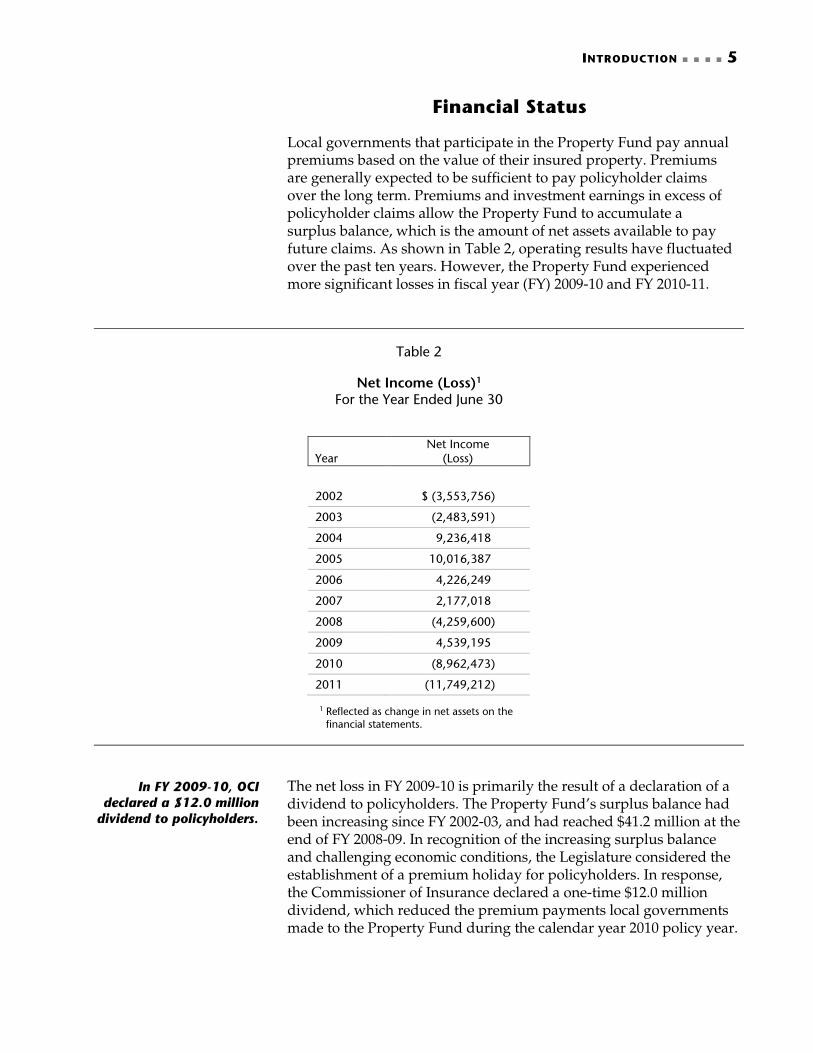
Local governments that participate in the Property Fund pay annual premiums based on the value of their insured property. Premiums are generally expected to be sufficient to pay policyholder claims over the long term. Premiums and investment earnings in excess of policyholder claims allow the Property Fund to accumulate a surplus balance, which is the amount of net assets available to pay future claims. As shown in Table 2, operating results have fluctuated over the past ten years. However, the Property Fund experienced more significant losses in fiscal year (FY) 2009-10 and FY 2010-11.
Table 2
Net Income (Loss)1
For the Year Ended June 30
Year Net Income
(Loss)
2002 $ (3,553,756)
2003 (2,483,591)
2004 9,236,418
2005 10,016,387
2006 4,226,249
2007 2,177,018
2008 (4,259,600)
2009 4,539,195
2010 (8,962,473)
2011 (11,749,212)
1 Reflected as change in net assets on the financial statements.
The net loss in FY 2009-10 is primarily the result of a declaration of a dividend to policyholders. The Property Fund’s surplus balance had been increasing since FY 2002-03, and had reached $41.2 million at the end of FY 2008-09. In recognition of the increasing surplus balance and challenging economic conditions, the Legislature considered the establishment of a premium holiday for policyholders. In response, the Commissioner of Insurance declared a one-time $12.0 million dividend, which reduced the premium payments local governments made to the Property Fund during the calendar year 2010 policy year.
In FY 2009-10, OCI declared a $12.0 million
dividend to policyholders.
6 INTRODUCTION
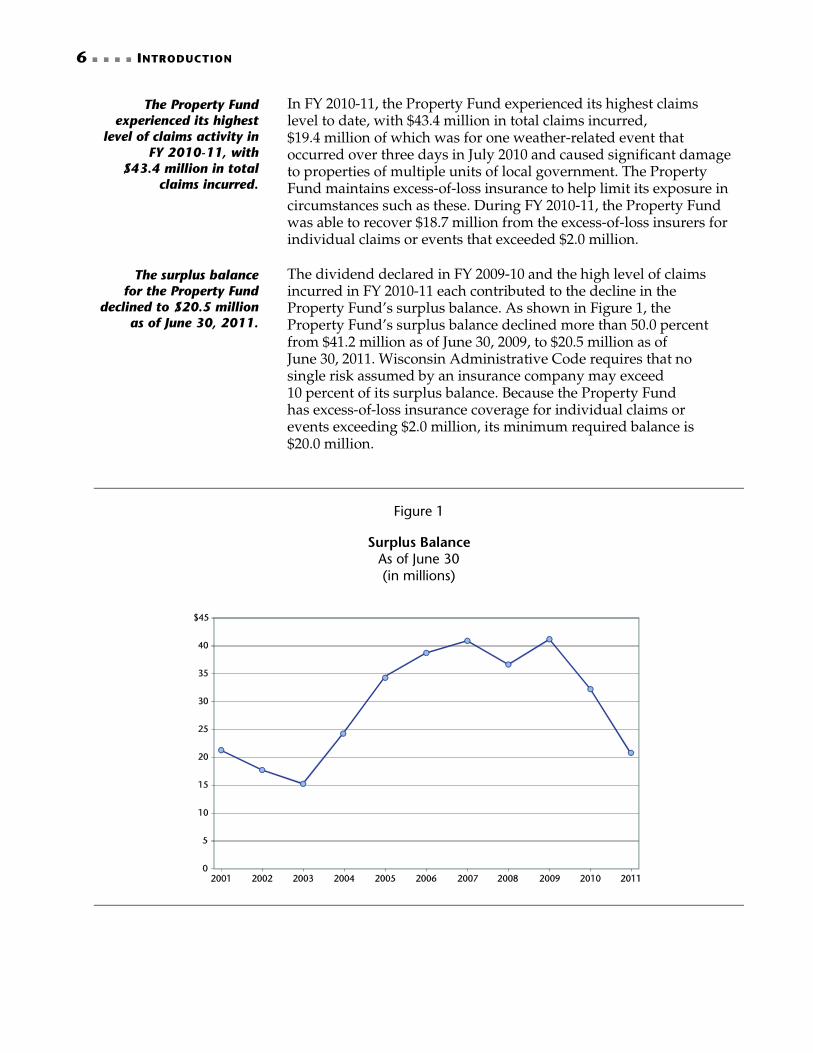
In FY 2010-11, the Property Fund experienced its highest claims level to date, with $43.4 million in total claims incurred, $19.4 million of which was for one weather-related event that occurred over three days in July 2010 and caused significant damage to properties of multiple units of local government. The Property Fund maintains excess-of-loss insurance to help limit its exposure in circumstances such as these. During FY 2010-11, the Property Fund was able to recover $18.7 million from the excess-of-loss insurers for individual claims or events that exceeded $2.0 million. The dividend declared in FY 2009-10 and the high level of claims incurred in FY 2010-11 each contributed to the decline in the Property Fund’s surplus balance. As shown in Figure 1, the Property Fund’s surplus balance declined more than 50.0 percent from $41.2 million as of June 30, 2009, to $20.5 million as of June 30, 2011. Wisconsin Administrative Code requires that no single risk assumed by an insurance company may exceed 10 percent of its surplus balance. Because the Property Fund has excess-of-loss insurance coverage for individual claims or events exceeding $2.0 million, its minimum required balance is $20.0 million.
Figure 1
Surplus Balance
As of June 30 (in millions)
The Property Fund experienced its highest
level of claims activity in FY 2010-11, with
$43.4 million in total claims incurred.
The surplus balance for the Property Fund
declined to $20.5 million as of June 30, 2011.

INTRODUCTION 7
Monitoring the Surplus Balance
As noted, OCI sets premiums to cover anticipated claims. However, because claims are unpredictable, an adequate surplus balance is needed to ensure the Property Fund can pay claims while maintaining steady premium rates for local government policyholders. OCI and the Oversight and Advisory committees have been actively monitoring the surplus balance and working to address its decline. OCI approved premium rate increases of 6.8 percent and 12.0 percent effective July 1, 2011, and July 1, 2012, respectively, and anticipates additional rate increases in future years. As reported in OCI’s unaudited regulatory financial statements, the surplus balance declined to $18.4 million for the period ended December 31, 2011. Due to a continued decline in the surplus balance, there were changes to the Property Fund’s excess-of-loss insurance policy. The new policy includes coverage for individual claims or events exceeding $1.8 million, increasing the expected risk of excess-of-loss insurers. This change in coverage, along with price increases already present in the property insurance market, resulted in an increase in the rates paid by the Property Fund for its excess-of-loss insurance. For the policy effective March 31, 2012, the Property Fund’s rates for excess-of-loss insurance increased by 11.0 percent to $6.9 million. In monitoring the adequacy of the surplus balance, an insurance industry standard is to compare the level of premiums to the surplus balance. In April 2009, the Property Fund formally established a target premium-to-surplus ratio of 1-to-2, which means for every $1 in total premiums the Property Fund seeks to have $2 in surplus. With the decline in the surplus in FY 2009-10, and the desire to limit overall rate increases to local governments, in April 2010 the Property Fund revised the target premium-to-surplus ratio to $1 in total premiums for every $1.40 to $1.60 in surplus. As shown in Table 3, the actual premium-to-surplus ratio for FY 2009-10 was 1-to-1.5, which was within the target range. However, at the end of FY 2010-11, the actual premium-to-surplus ratio had declined to 1-to-1. As a result, the Property Fund is at an increased risk of not having an adequate surplus balance to pay future claims.
To address the decline in the surplus balance, OCI
is increasing premium rates for policyholders.
As of June 30, 2011, the surplus balance was
below OCI’s established target ratio.

8 INTRODUCTION
Table 3
Premium-to-Surplus Ratios
As of June 30
Year Total Premiums1 Surplus Balance Premium-to-Surplus Ratio
2008 $21,594,902 $36,661,193 1-to-1.7
2009 21,913,029 41,200,388 1-to-1.9
2010 21,272,008 32,237,915 1-to-1.5
2011 21,001,576 20,488,703 1-to-1.0
1 Does not reflect premiums paid to the Property Fund’s excess-of-loss insurers, which reduce premiums as reflected in the financial statements.
Because of the Property Fund’s unique characteristics, OCI insurance examiners who monitor the solvency of domestic and foreign insurance companies believe a more conservative target, such as the ratio of 1-to-2 established in April 2009, should be maintained. For example, the Property Fund is more susceptible to risks that cannot be offset by diversification because it cannot offer other types of insurance or offer insurance outside of Wisconsin. Further, the Property Fund cannot refuse to insure riskier entities the way a private insurer might. OCI also indicated that larger surpluses may help to smooth premium rate changes over time, which can simplify annual budgeting for the local governments that are policyholders. It will be important for OCI to continue to closely monitor the financial condition of the Property Fund and balance its need for an adequate surplus with policyholder needs for reasonable premium rates. An adequate surplus balance provides assurance that sufficient funds will be available to pay claims and helps to keep premium rates stable for local governments. However, if the surplus balance becomes insufficient to pay claims, the Property Fund would need to obtain a loan from the General Fund, as provided by s. 605.30 Wis. Stats., which could lead to further increases in policyholder premium rates.
An adequate surplus balance is important to ensure the
financial stability of the Property Fund.

9
Independent Auditor’s Report on the Financial Statements of the Wisconsin Local Government Property Insurance Fund We have audited the accompanying financial statements of the Wisconsin Local Government Property Insurance Fund as of and for the years ended June 30, 2011, June 30, 2010, and June 30, 2009, as listed in the table of contents. These financial statements are the responsibility of management of the Wisconsin Local Government Property Insurance Fund. Our responsibility is to express an opinion on these financial statements based on our audit. We conducted our audit in accordance with auditing standards generally accepted in the United States of America and the standards applicable to financial audits contained in Government Auditing Standards, issued by the Comptroller General of the United States. Those standards require that we plan and perform the audit to obtain reasonable assurance about whether the financial statements are free of material misstatement. An audit includes examining, on a test basis, evidence supporting the amounts and disclosures in the financial statements. An audit also includes assessing the accounting principles used and significant estimates made by management, as well as evaluating the overall financial statement presentation. We believe that our audit provides a reasonable basis for our opinion. As discussed in Note 2A, the financial statements referred to in the first paragraph present only the Wisconsin Local Government Property Insurance Fund and do not purport to, and do not, present fairly the financial position of the State of Wisconsin and the changes in its financial position and its cash flows, where applicable, in conformity with accounting principles generally accepted in the United States of America.
Audit Opinion
10 AUDIT OPINION
In our opinion, the financial statements referred to in the first paragraph present fairly, in all material respects, the financial position of the Wisconsin Local Government Property Insurance Fund as of June 30, 2011, June 30, 2010, and June 30, 2009, and the changes in its financial position and its cash flows for the years then ended in conformity with accounting principles generally accepted in the United States of America. In accordance with Government Auditing Standards, we have also issued a report dated March 30, 2012, on our consideration of the Wisconsin Local Government Property Insurance Fund’s internal control over financial reporting; our tests of its compliance with certain provisions of laws, regulations, and contracts; and other matters. The purpose of that report is to describe the scope of our testing of internal control over financial reporting and compliance and the results of that testing, and not to provide an opinion on the internal control over financial reporting or on compliance. That report is an integral part of an audit performed in accordance with Government Auditing Standards and should be considered in assessing the results of our audit. The Ten-Year Claims Development Information on pages 45 through 47 is not a required part of the financial statements of the Wisconsin Local Government Property Insurance Fund, but is supplementary information required by accounting principles generally accepted in the United States of America. We have applied certain limited procedures, which consisted principally of inquiries of management regarding the methods of measurement and presentation of the required supplementary information. However, we did not audit the information and express no opinion on it. Our audit was conducted for the purpose of forming an opinion on the financial statements of the Wisconsin Local Government Property Insurance Fund. The supplementary information included as Management’s Discussion and Analysis on pages 11 through 23 is presented for purposes of additional analysis and is not a required part of the financial statements referred to in the first paragraph. We have applied certain limited procedures, which consisted principally of inquiries of management regarding the methods of measurement and presentation of the supplementary information. However, we did not audit the information and express no opinion on it. LEGISLATIVE AUDIT BUREAU March 30, 2012 by Carolyn Stittleburg Audit Director
11
Prepared by Management of the Local Government Property Insurance Fund Management’s Discussion and Analysis is an element of the financial reporting model adopted by the Governmental Accounting Standards Board (GASB). This section presents management’s discussion and analysis of the financial performance of the Local Government Property Insurance Fund during the fiscal years ended June 30, 2011, June 30, 2010, and June 30, 2009. This discussion should be read in conjunction with the accompanying financial statements and notes. The financial statements, notes, and this discussion are the responsibility of the management of the Property Fund.
Overview of the Fund
The Property Fund is a segregated fund administered by the Office of the Commissioner of Insurance (OCI) of the State of Wisconsin. Its purpose is to make property insurance available for local government property such as government buildings, schools, libraries, and motor vehicles. The Property Fund provides policy and claim service to the policyholders. It does not have agents, does not advertise, and is not permitted to selectively underwrite risks. Otherwise, it operates like an insurance company by collecting premiums from its policyholders and paying losses when they occur. It also incurs costs or expenses to underwrite policies and to adjust or settle loss claims. Participation in the Property Fund is voluntary and requires that the local governmental unit submit an approved resolution authorizing coverage. A local governmental unit may terminate coverage at any time by a majority vote and by certifying such action to the Property Fund.
Management’s Discussion and Analysis
12 MANAGEMENT’S DISCUSSION AND ANALYSIS
The Commissioner of Insurance acts as the Property Fund manager and is assisted by the Insurance Program Manager, who is a full-time OCI staff member. The Property Fund is administered by two contracted companies. The policy administrator maintains the Property Fund home office in Madison, Wisconsin. The claims administrator is located in Brookfield, Wisconsin. Several standing committees provide assistance to the Commissioner in the governance of the Property Fund. The Oversight Committee consists of six members: four OCI staff members and two representatives from the Advisory Committee. This committee reviews recommendations on policies and procedures from the Advisory Committee and makes recommendations to the Commissioner as to the management and operational activities of the Property Fund. The Oversight Committee generally meets two times a year to formulate its recommendations to the Commissioner. The Advisory Committee is a 21-member committee comprising representative members insured by the Property Fund. The Advisory Committee makes recommendations to the Oversight Committee on policies, rating, procedures, and items of members’ interest regarding operations of the Property Fund. The Advisory Committee also meets two times a year. The Advisory Committee has established seven subcommittees that include both members of the Advisory Committee and other policyholders. The current subcommittees are Mission Statement, Bylaws, Policy and Underwriting Issues, Rate Analysis, Loss Control and Claims, Information Technology, and Excess-of-Loss and Flood. The Property Fund operates on a July 1 through June 30 fiscal year basis. Administrative costs and operating costs, including claim payments, are funded through direct premiums from insured local governments. The Property Fund’s insurance in force represents property that is insured against loss. To reduce insurance risk, the Property Fund purchases excess-of-loss coverage, analogous to “reinsurance,” through a broker.
Policy Count and Insurance in Force
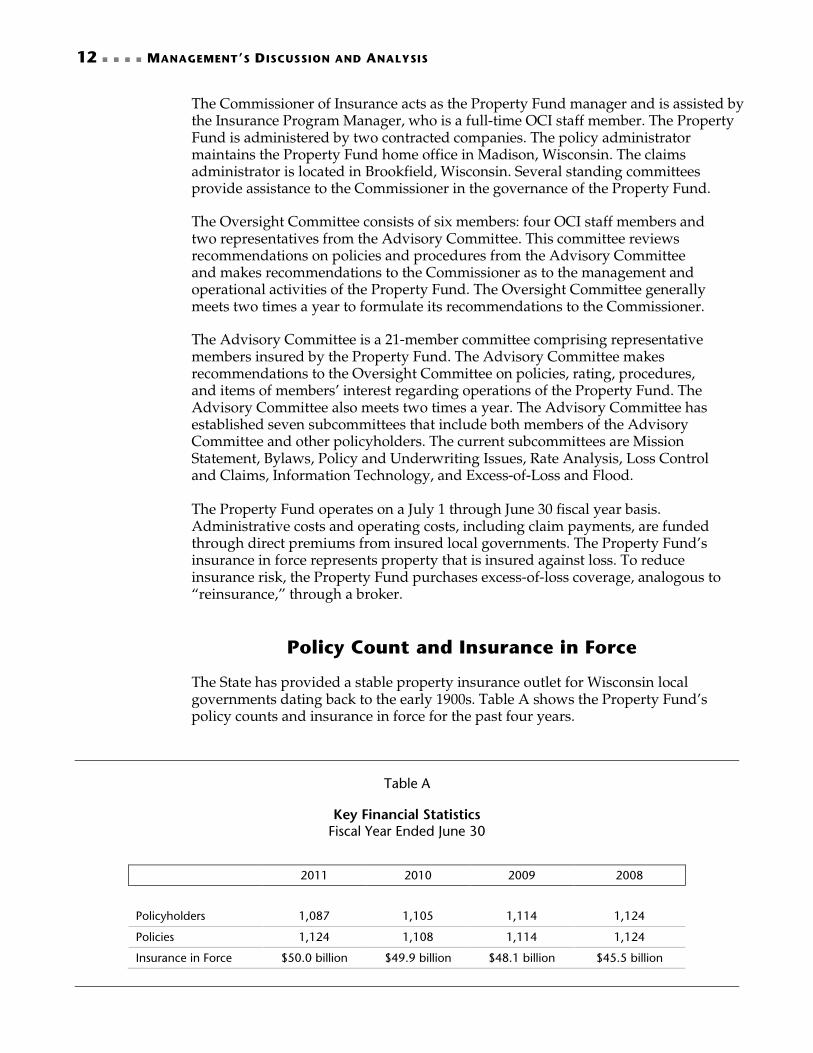
The State has provided a stable property insurance outlet for Wisconsin local governments dating back to the early 1900s. Table A shows the Property Fund’s policy counts and insurance in force for the past four years.
Table A
Key Financial Statistics
Fiscal Year Ended June 30
2011 2010 2009 2008
Policyholders 1,087 1,105 1,114 1,124
Policies 1,124 1,108 1,114 1,124
Insurance in Force $50.0 billion $49.9 billion $48.1 billion $45.5 billion
MANAGEMENT’S DISCUSSION AND ANALYSIS 13
As of June 30, 2011, 1,087 policyholders were insured: 71 counties, 305 school districts, 153 cities, 176 towns, 258 villages, and 124 miscellaneous local government tax-supported entities (such as libraries or water, sanitation, or fire department districts). Beginning in June 2010, the Property Fund has offered a builder’s risk policy to its policyholders for new building construction and renovations as opposed to offering this coverage by endorsements. As of June 30, 2011, the Property Fund had written 37 builder’s risk policies. The Property Fund’s total insurance in force has increased 10 percent since June 30, 2008. That growth is primarily due to inflationary increases in the insurance property base and to new construction.
Financial Highlights
The Property Fund’s surplus balance declined from $40.9 million at June 30, 2007, to $20.5 million at June 30, 2011. This decrease is primarily attributed to the following events: Dividend to Policyholders—In November 2009, the Property Fund
declared a dividend of approximately $12.0 million in response to the Assembly’s unanimous passage of 2009 Assembly Bill 403, which initially required a premium holiday of approximately $20.0 million, but was amended to require a dividend of $12.0 million. The dividend was applied as premium credits against policyholders’ 2010 renewal premiums and was calculated based on a percentage of each insured’s previous five years earned premium through June 30, 2009, over the total premium earned by the Property Fund for the same five-year period. The dividends were a return of approximately 10.9 percent of each insured’s total five-year premium earned, or approximately 57.0 percent of the insured’s 2010 expected renewal premium;
Claims Activity—During FY 2007-08 and FY 2010-11, the Property Fund experienced an increase in severe weather-related claims activity. Losses and loss expenses was $25.7 million during FY 2010-11 and $21.9 million during FY 2007-08, in comparison to $12.1 million in FY 2009-10 and $11.6 million in FY 2008-09; and
Net Premiums Earned have remained fairly consistent over the four-year period.
Financial Statements
The Property Fund’s financial statements have been prepared in accordance with accounting principles generally accepted in the United States of America as prescribed by GASB. The financial statements are prepared based on the economic resources measurement focus and the full accrual basis of accounting, and they consist of the following:
14 MANAGEMENT’S DISCUSSION AND ANALYSIS
the Statement of Net Assets, which reports on all assets and liabilities of the Property Fund;
the Statement of Revenues, Expenses, and Changes in Fund Net Assets, which presents all revenues earned and expenses incurred during the year, as well as changes in fund net assets; and
the Statement of Cash Flows, which presents information related to cash inflows and outflows summarized by operating, noncapital financing, and investing activities.
The notes to the financial statements provide additional detail to accompany the information in the financial statements.
Financial Position
Assets
Table B
Assets
Fiscal Year Ended June 30
2011 2010 2009 2008
Cash and Cash Equivalents $21,163,586 $26,310,072 $33,613,901 $53,279,876
Investments 16,305,787 20,963,681 18,939,890 0
Other Receivables 1,158,983 1,646,228 1,655,506 2,874,536
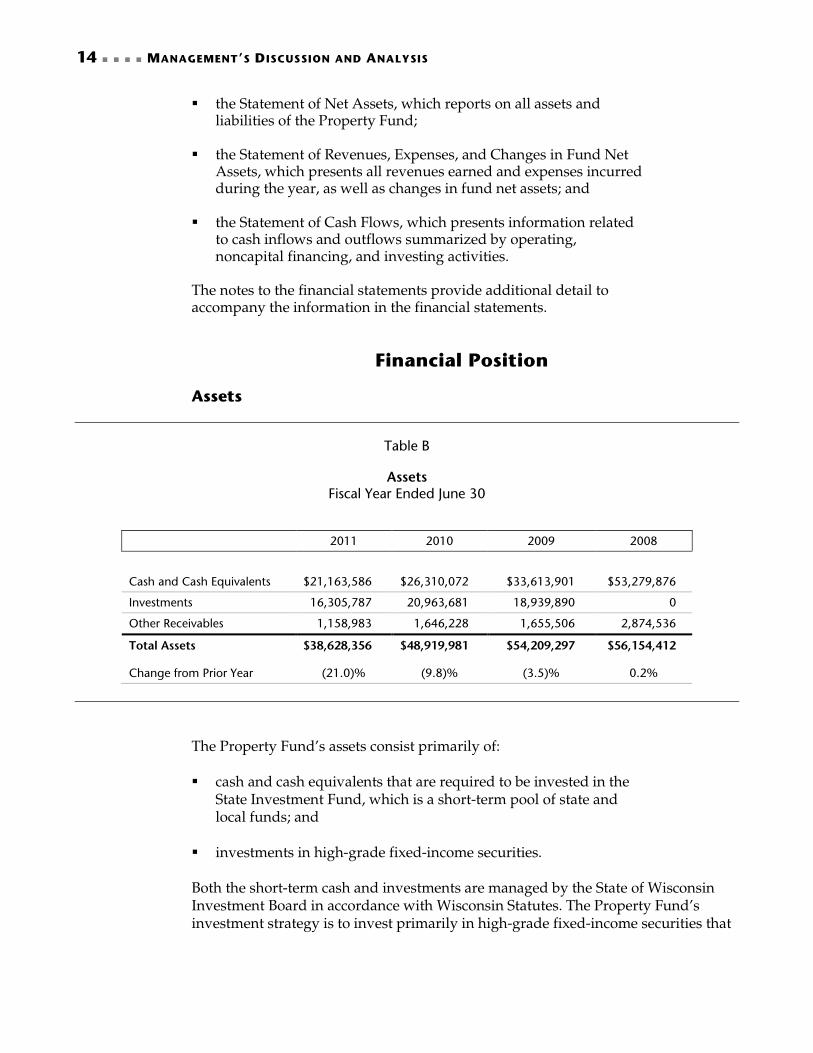
Total Assets $38,628,356 $48,919,981 $54,209,297 $56,154,412 Change from Prior Year (21.0)% (9.8)% (3.5)% 0.2%
The Property Fund’s assets consist primarily of: cash and cash equivalents that are required to be invested in the
State Investment Fund, which is a short-term pool of state and local funds; and
investments in high-grade fixed-income securities. Both the short-term cash and investments are managed by the State of Wisconsin Investment Board in accordance with Wisconsin Statutes. The Property Fund’s investment strategy is to invest primarily in high-grade fixed-income securities that

MANAGEMENT’S DISCUSSION AND ANALYSIS 15
have a reasonable degree of safety of principal and income-paying ability, with high priority given to matching the maturity of assets with the liquidity needs of the Property Fund’s liabilities. The fluctuation between these accounts, as shown in Table B, relates to a determination that was made in March 2006, that Wisconsin Statutes permitted the Property Fund to invest only in the State Investment Fund. Broader guidelines had been in place, which permitted investment in high-grade fixed-income securities. After that determination, no new investments were made outside of the State Investment Fund, and the State of Wisconsin Investment Board deposited the proceeds from the few remaining securities into the State Investment Fund upon maturity. In April 2008, Wisconsin Statutes were changed to allow for investments outside of the State Investment Fund, and the Property Fund began investing in long-term fixed-income bonds through the State of Wisconsin Investment Board. Table B shows total assets over the three-year period from June 30, 2008, through June 30, 2011. Total assets decreased by $17.5 million, or 31.2 percent, over the three years. One of the primary reasons for the decrease is the issuance of the dividend in FY 2009-10 (discussed in the “Financial Highlights” section). In addition, the Property Fund experienced an increase in claim payments in FY 2010-11 as a result of significant loss experience mainly from weather-related activity. Other receivables include excess-of-loss insurance recoverable on paid claims, premiums receivable from policyholders, and accrued investment income. Liabilities
Table C
Liabilities
Fiscal Year Ended June 30
2011 2010 2009 2008
Net Unpaid Loss Liabilities $13,374,614 $ 6,275,211 $ 6,790,232 $13,029,503
Deferred Revenue for Unearned Premiums 3,652,539 4,020,871 4,436,714 5,245,798
Dividends Payable 0 4,908,164 0 0
Other Current and Long-Term Liabilities 1,112,500 1,477,820 1,781,963 1,217,918
Total Liabilities $18,139,653 $16,682,066 $13,008,909 $19,493,219 Change from Prior Year 8.7% 28.2% (33.3)% 28.9%
16 MANAGEMENT’S DISCUSSION AND ANALYSIS
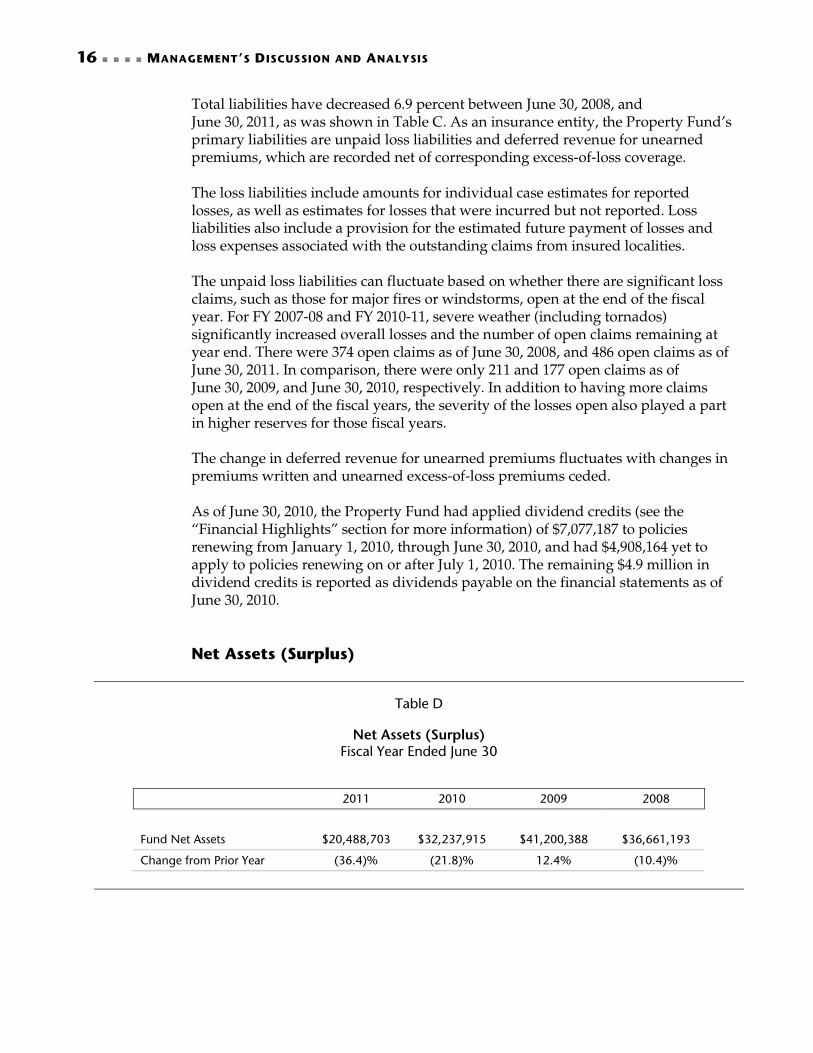
Total liabilities have decreased 6.9 percent between June 30, 2008, and June 30, 2011, as was shown in Table C. As an insurance entity, the Property Fund’s primary liabilities are unpaid loss liabilities and deferred revenue for unearned premiums, which are recorded net of corresponding excess-of-loss coverage. The loss liabilities include amounts for individual case estimates for reported losses, as well as estimates for losses that were incurred but not reported. Loss liabilities also include a provision for the estimated future payment of losses and loss expenses associated with the outstanding claims from insured localities. The unpaid loss liabilities can fluctuate based on whether there are significant loss claims, such as those for major fires or windstorms, open at the end of the fiscal year. For FY 2007-08 and FY 2010-11, severe weather (including tornados) significantly increased overall losses and the number of open claims remaining at year end. There were 374 open claims as of June 30, 2008, and 486 open claims as of June 30, 2011. In comparison, there were only 211 and 177 open claims as of June 30, 2009, and June 30, 2010, respectively. In addition to having more claims open at the end of the fiscal years, the severity of the losses open also played a part in higher reserves for those fiscal years. The change in deferred revenue for unearned premiums fluctuates with changes in premiums written and unearned excess-of-loss premiums ceded. As of June 30, 2010, the Property Fund had applied dividend credits (see the “Financial Highlights” section for more information) of $7,077,187 to policies renewing from January 1, 2010, through June 30, 2010, and had $4,908,164 yet to apply to policies renewing on or after July 1, 2010. The remaining $4.9 million in dividend credits is reported as dividends payable on the financial statements as of June 30, 2010. Net Assets (Surplus)
Table D
Net Assets (Surplus) Fiscal Year Ended June 30
2011 2010 2009 2008
Fund Net Assets $20,488,703 $32,237,915 $41,200,388 $36,661,193
Change from Prior Year (36.4)% (21.8)% 12.4% (10.4)%
MANAGEMENT’S DISCUSSION AND ANALYSIS 17
The Property Fund’s net assets represent the excess of assets over liabilities. Changes in its net assets, known as surplus, are attributable to the difference between its revenues and expenses, that is, its net income. As was shown in Table D, the Property Fund’s surplus decreased by $16.2 million, or 44.1 percent, from June 30, 2008, to June 30, 2011. The decrease primarily relates to the net operating losses reported for the Property Fund in FY 2009-10 and FY 2010-11 due to the payout of a dividend and increases in claim payments. Property Fund management considers several factors in establishing an appropriate surplus level to maintain. First, in accordance with s. Ins 6.72(1), Wis. Adm. Code, minimum surplus is established using the criteria that “no single risk assumed by any insurance company (net of excess-of-loss insurance) shall exceed 10 percent of surplus as regards policyholders.” In the Property Fund’s case, its net retention is $2 million per occurrence, which yields a minimum surplus level of $20 million. Second, the Property Fund seeks to maintain its surplus at a level consistent with the insurance exposures in force and annual premiums written. As insurance in force has increased by $4.5 billion over the past three years, management has sought to maintain a higher surplus level. Finally, management also takes into consideration the fact that the Property Fund is a mono-line property insurer and operates solely in Wisconsin. These are elements that can cause increased volatility in annual loss experience, because the Property Fund does not have other lines of business or geographical regions to smooth out losses in a given year. The Property Fund also strives to smooth any rate changes over time, and thereby avoid large fluctuations in premiums charged to local units of government. For further discussion of surplus, see the section labeled “Change in Fund Net Assets (Surplus).”
Change in Financial Position
Revenues The Property Fund’s operating revenues consist of premiums from insured local governments, net of excess-of-loss insurance premiums ceded. All Property Fund policyholders are billed annually, but not all are billed in the same renewal month because insurance policies are issued or renewed throughout the entire year. The Building and Contents line of insurance for the Property Fund’s primary policy types uses rates obtained annually for each insured from an independent insurance rating organization. Other lines of insurance use rates established by the Oversight Committee, after considering input from an independent actuary and the Advisory Committee. Continuing a policy started in FY 2003-04, the Property Fund calculates each policyholder’s premium based on 100 percent of insured value and current (one year in arrears) policyholder-specific Insurance Services Office (ISO) loss costs.

18 MANAGEMENT’S DISCUSSION AND ANALYSIS
The Property Fund did not implement any rate changes in FY 2007-08. However, the following are rate changes that occurred from FY 2008-09 through FY 2010-11: On July 1, 2008, the Property Fund adopted the most recent
ISO loss costs and also modified the credit for the $1,000 Building and Contents deductible. The estimated rate level effect of these changes on Building and Contents rates was a decrease of 9.9 percent.
On July 1, 2009, the Property Fund again adopted the most recent ISO loss costs, and also eliminated the credit for the $500 Building and Contents deductible. The estimated rate level effect on the Building and Contents rates was a decrease of 9.4 percent.
On July 1, 2010, the Property Fund adopted updated ISO loss costs and increased its Building and Contents loss cost multiplier from 1.000 to 1.082, targeting a combined impact of zero percent on Building and Contents rates. The actual impact was a decrease of 2.4 percent.
Table E presents operating revenues over the four-year period ended June 30, 2011. The decline in revenue is attributable to increased costs to maintain excess-of-loss coverage (reinsurance), ISO rate fluctuations, policyholders taking higher deductibles, and a small reduction in the number of policyholders with larger coverages.
Table E
Operating Revenues
Fiscal Year Ended June 30
2011 2010 2009 2008
Operating Revenues $15,701,278 $16,064,586 $17,224,016 $16,856,149
Change from Prior Year (2.3)% (6.7)% 2.2% (5.4)%
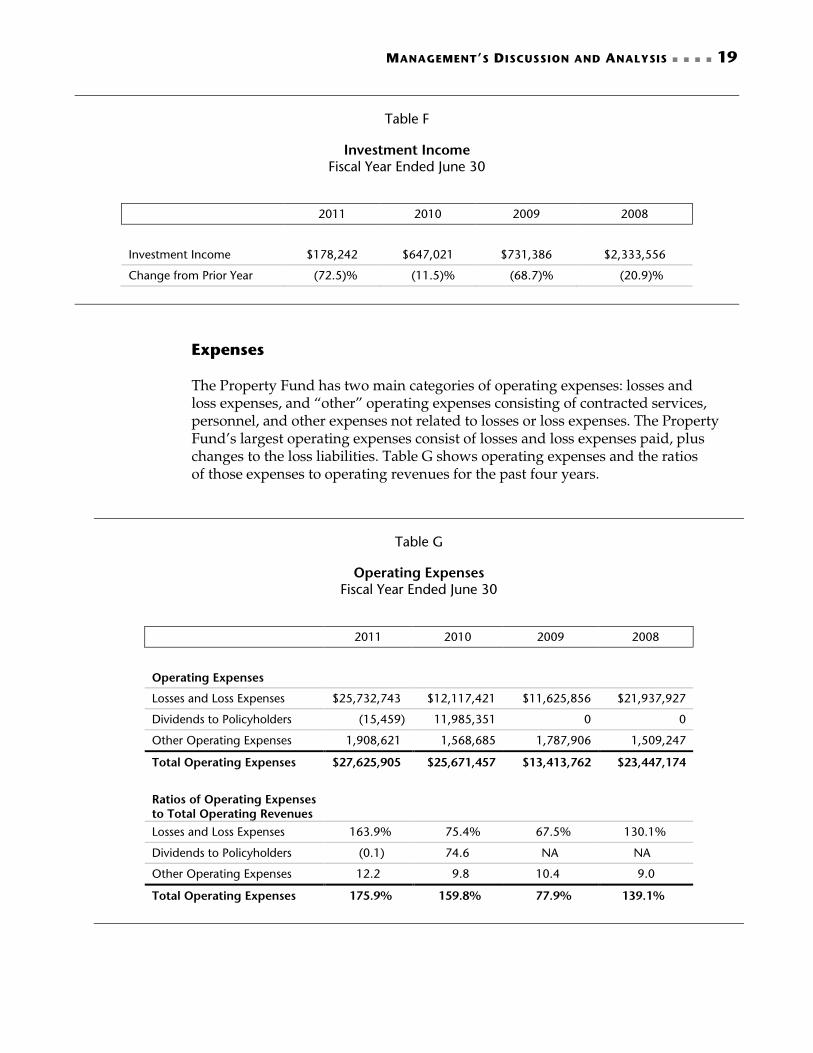
The Property Fund’s nonoperating revenues consist of investment income earned from interest on shares in the State Investment Fund, and interest and market gains/losses on investments in high-grade fixed-income securities. As shown in Table F, investment income has declined significantly since FY 2007-08. Over the past four years, market rates have played the biggest role in the decrease in investment income.
MANAGEMENT’S DISCUSSION AND ANALYSIS 19
Table F
Investment Income
Fiscal Year Ended June 30
2011 2010 2009 2008
Investment Income $178,242 $647,021 $731,386 $2,333,556
Change from Prior Year (72.5)% (11.5)% (68.7)% (20.9)%
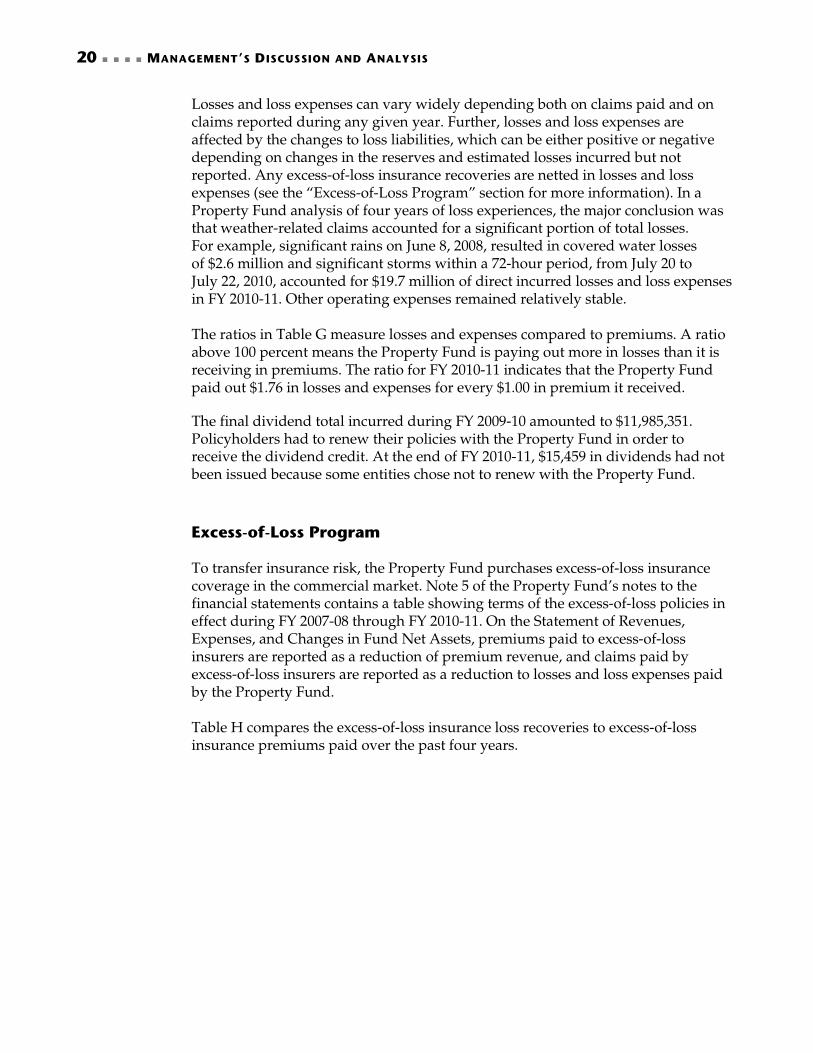
Expenses The Property Fund has two main categories of operating expenses: losses and loss expenses, and “other” operating expenses consisting of contracted services, personnel, and other expenses not related to losses or loss expenses. The Property Fund’s largest operating expenses consist of losses and loss expenses paid, plus changes to the loss liabilities. Table G shows operating expenses and the ratios of those expenses to operating revenues for the past four years.
Table G
Operating Expenses
Fiscal Year Ended June 30
2011 2010 2009 2008
Operating Expenses
Losses and Loss Expenses $25,732,743 $12,117,421 $11,625,856 $21,937,927
Dividends to Policyholders (15,459) 11,985,351 0 0
Other Operating Expenses 1,908,621 1,568,685 1,787,906 1,509,247
Total Operating Expenses $27,625,905 $25,671,457 $13,413,762 $23,447,174
Ratios of Operating Expenses to Total Operating Revenues
Losses and Loss Expenses 163.9% 75.4% 67.5% 130.1%
Dividends to Policyholders (0.1) 74.6 NA NA
Other Operating Expenses 12.2 9.8 10.4 9.0
Total Operating Expenses 175.9% 159.8% 77.9% 139.1%
20 MANAGEMENT’S DISCUSSION AND ANALYSIS
Losses and loss expenses can vary widely depending both on claims paid and on claims reported during any given year. Further, losses and loss expenses are affected by the changes to loss liabilities, which can be either positive or negative depending on changes in the reserves and estimated losses incurred but not reported. Any excess-of-loss insurance recoveries are netted in losses and loss expenses (see the “Excess-of-Loss Program” section for more information). In a Property Fund analysis of four years of loss experiences, the major conclusion was that weather-related claims accounted for a significant portion of total losses. For example, significant rains on June 8, 2008, resulted in covered water losses of $2.6 million and significant storms within a 72-hour period, from July 20 to July 22, 2010, accounted for $19.7 million of direct incurred losses and loss expenses in FY 2010-11. Other operating expenses remained relatively stable. The ratios in Table G measure losses and expenses compared to premiums. A ratio above 100 percent means the Property Fund is paying out more in losses than it is receiving in premiums. The ratio for FY 2010-11 indicates that the Property Fund paid out $1.76 in losses and expenses for every $1.00 in premium it received.
The final dividend total incurred during FY 2009-10 amounted to $11,985,351. Policyholders had to renew their policies with the Property Fund in order to receive the dividend credit. At the end of FY 2010-11, $15,459 in dividends had not been issued because some entities chose not to renew with the Property Fund. Excess-of-Loss Program To transfer insurance risk, the Property Fund purchases excess-of-loss insurance coverage in the commercial market. Note 5 of the Property Fund’s notes to the financial statements contains a table showing terms of the excess-of-loss policies in effect during FY 2007-08 through FY 2010-11. On the Statement of Revenues, Expenses, and Changes in Fund Net Assets, premiums paid to excess-of-loss insurers are reported as a reduction of premium revenue, and claims paid by excess-of-loss insurers are reported as a reduction to losses and loss expenses paid by the Property Fund. Table H compares the excess-of-loss insurance loss recoveries to excess-of-loss insurance premiums paid over the past four years.

MANAGEMENT’S DISCUSSION AND ANALYSIS 21
Table H
Excess-of-Loss Insurance Loss Recoveries versus Premiums Fiscal Year Ended June 30
Recoveries Received from Excess-of-Loss
Insurers1
Excess-of-Loss
Insurance Premiums Paid
Inflow from (Outflow to) Reinsurers
2008 $2,020,927 $4,738,753 $(2,717,826)
2009 0 4,689,013 (4,689,013)
2010 0 5,207,422 (5,207,422)
2011 18,858,960 5,300,298 13,558,662
1 Includes recoveries for losses and related loss expenses
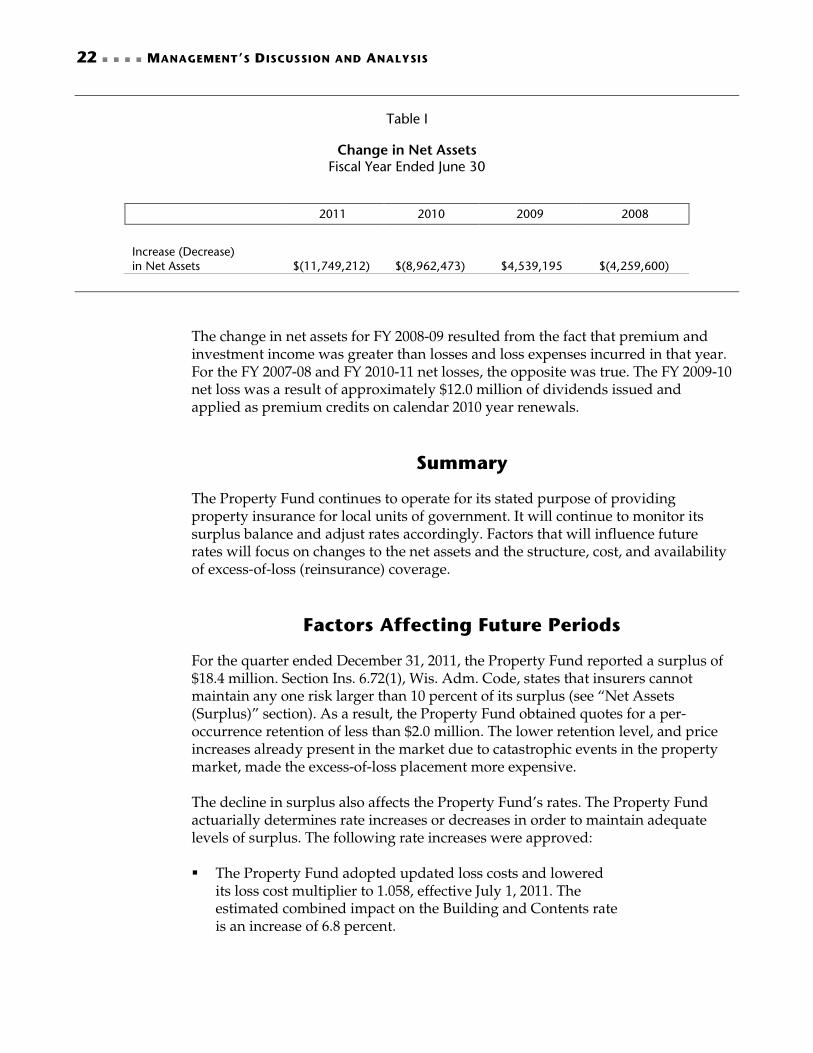
While the Property Fund paid more in premiums than it received in recoveries from excess-of-loss insurers for three of the past four years, the Property Fund uses excess-of-loss insurance to help reduce its exposure to significant loss events, given its levels of insurance in force as noted in Table A. The Property Fund annually reviews with its excess-of-loss broker the per-risk and aggregate excess-of-loss insurance retentions in relation to excess-of-loss insurance market pricing and selects a balance between risk retention and excess-of-loss insurance cost. For FY 2010-11, the Property Fund had two major losses related to storm water damage for which the excess-of-loss insurers reimbursed or will reimburse the Fund in excess of its $2 million per occurrence coverage. Of these two losses, one single event incurred $17.7 million of excess-of-loss insurance recoveries. Change in Fund Net Assets (Surplus) The change in fund net assets (surplus) reflects all revenues (operating and nonoperating), less expenses and transfers. Table I shows the increases or decreases in net assets for each of the past four years.
22 MANAGEMENT’S DISCUSSION AND ANALYSIS
Table I
Change in Net Assets
Fiscal Year Ended June 30
2011 2010 2009 2008
Increase (Decrease) in Net Assets $(11,749,212) $(8,962,473) $4,539,195 $(4,259,600)
The change in net assets for FY 2008-09 resulted from the fact that premium and investment income was greater than losses and loss expenses incurred in that year. For the FY 2007-08 and FY 2010-11 net losses, the opposite was true. The FY 2009-10 net loss was a result of approximately $12.0 million of dividends issued and applied as premium credits on calendar 2010 year renewals.
Summary
The Property Fund continues to operate for its stated purpose of providing property insurance for local units of government. It will continue to monitor its surplus balance and adjust rates accordingly. Factors that will influence future rates will focus on changes to the net assets and the structure, cost, and availability of excess-of-loss (reinsurance) coverage.
Factors Affecting Future Periods
For the quarter ended December 31, 2011, the Property Fund reported a surplus of $18.4 million. Section Ins. 6.72(1), Wis. Adm. Code, states that insurers cannot maintain any one risk larger than 10 percent of its surplus (see “Net Assets (Surplus)” section). As a result, the Property Fund obtained quotes for a per-occurrence retention of less than $2.0 million. The lower retention level, and price increases already present in the market due to catastrophic events in the property market, made the excess-of-loss placement more expensive. The decline in surplus also affects the Property Fund’s rates. The Property Fund actuarially determines rate increases or decreases in order to maintain adequate levels of surplus. The following rate increases were approved: The Property Fund adopted updated loss costs and lowered
its loss cost multiplier to 1.058, effective July 1, 2011. The estimated combined impact on the Building and Contents rate is an increase of 6.8 percent.

MANAGEMENT’S DISCUSSION AND ANALYSIS 23
The Property Fund plans to modify the credit for the $25,000 and $50,000 Building and Contents deductible (with aggregates) to 50 percent and 60 percent, effective July 1, 2012. The loss cost multiplier will also increase to 1.185. The estimated effect of these changes on Building and Contents rates is an increase of 12.0 percent.
Consistent with best practices, the Property Fund has started a project to revalue its insurance in force. This project includes on-site appraisals of all local governmental properties over $750,000.
Contact Information
This financial report is designed to provide a general overview of the Local Government Property Insurance Fund’s financial performance for FY 2008-09 through FY 2010-11. Questions concerning any of the information provided in this report, or requests for additional information, should be addressed to:
Danielle C. Rogacki, Insurance Program Manager Louis Cornelius, Insurance Administrator Local Government Property Insurance Fund 125 South Webster Street Madison, Wisconsin 53703-3474


25
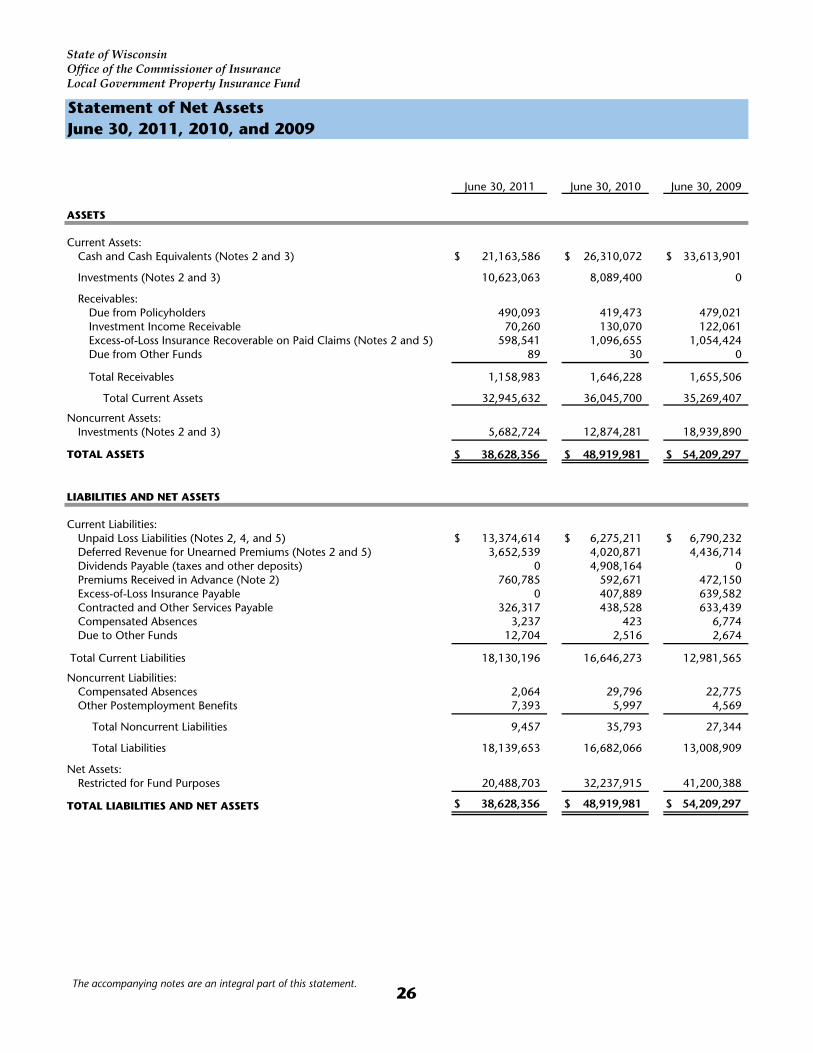
Financial Statements
June 30, 2011 June 30, 2010 June 30, 2009
ASSETS
Current Assets:Cash and Cash Equivalents (Notes 2 and 3) 21,163,586$ 26,310,072$ 33,613,901$
Investments (Notes 2 and 3) 10,623,063 8,089,400 0
Receivables:Due from Policyholders 490,093 419,473 479,021Investment Income Receivable 70,260 130,070 122,061Excess-of-Loss Insurance Recoverable on Paid Claims (Notes 2 and 5) 598,541 1,096,655 1,054,424Due from Other Funds 89 30 0
Total Receivables 1,158,983 1,646,228 1,655,506
Total Current Assets 32,945,632 36,045,700 35,269,407
Noncurrent Assets:Investments (Notes 2 and 3) 5,682,724 12,874,281 18,939,890
TOTAL ASSETS 38,628,356$ 48,919,981$ 54,209,297$
LIABILITIES AND NET ASSETS
Current Liabilities:Unpaid Loss Liabilities (Notes 2, 4, and 5) 13,374,614$ 6,275,211$ 6,790,232$ Deferred Revenue for Unearned Premiums (Notes 2 and 5) 3,652,539 4,020,871 4,436,714Dividends Payable (taxes and other deposits) 0 4,908,164 0Premiums Received in Advance (Note 2) 760,785 592,671 472,150Excess-of-Loss Insurance Payable 0 407,889 639,582Contracted and Other Services Payable 326,317 438,528 633,439 Compensated Absences 3,237 423 6,774 Due to Other Funds 12,704 2,516 2,674
Total Current Liabilities 18,130,196 16,646,273 12,981,565
Noncurrent Liabilities:Compensated Absences 2,064 29,796 22,775Other Postemployment Benefits 7,393 5,997 4,569
Total Noncurrent Liabilities 9,457 35,793 27,344
Total Liabilities 18,139,653 16,682,066 13,008,909
Net Assets: Restricted for Fund Purposes 20,488,703 32,237,915 41,200,388
TOTAL LIABILITIES AND NET ASSETS 38,628,356$ 48,919,981$ 54,209,297$
Statement of Net AssetsJune 30, 2011, 2010, and 2009
State of WisconsinOffice of the Commissioner of InsuranceLocal Government Property Insurance Fund
The accompanying notes are an integral part of this statement.26
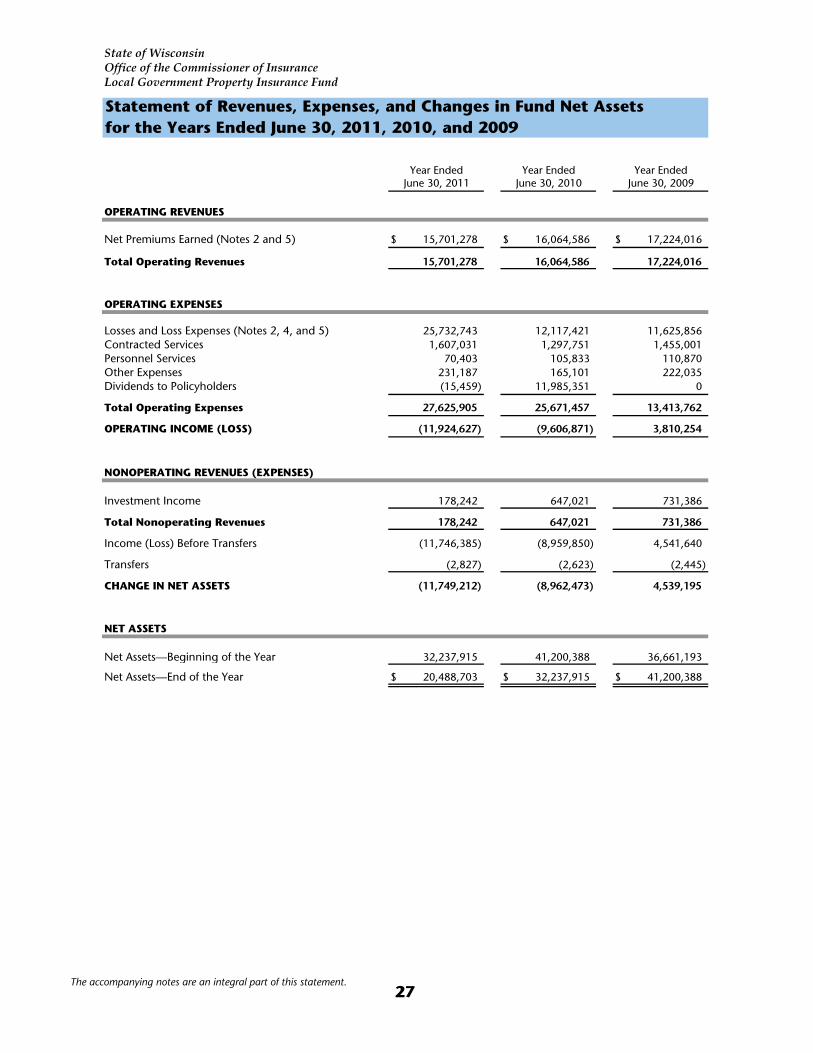
Year Ended Year Ended Year Ended
June 30, 2011 June 30, 2010 June 30, 2009
OPERATING REVENUES
Net Premiums Earned (Notes 2 and 5) 15,701,278$ 16,064,586$ 17,224,016$
Total Operating Revenues 15,701,278 16,064,586 17,224,016
OPERATING EXPENSES
Losses and Loss Expenses (Notes 2, 4, and 5) 25,732,743 12,117,421 11,625,856Contracted Services 1,607,031 1,297,751 1,455,001Personnel Services 70,403 105,833 110,870Other Expenses 231,187 165,101 222,035Dividends to Policyholders (15,459) 11,985,351 0
Total Operating Expenses 27,625,905 25,671,457 13,413,762
OPERATING INCOME (LOSS) (11,924,627) (9,606,871) 3,810,254
NONOPERATING REVENUES (EXPENSES)
Investment Income 178,242 647,021 731,386
Total Nonoperating Revenues 178,242 647,021 731,386
Income (Loss) Before Transfers (11,746,385) (8,959,850) 4,541,640
Transfers (2,827) (2,623) (2,445)
CHANGE IN NET ASSETS (11,749,212) (8,962,473) 4,539,195
NET ASSETS
Net Assets—Beginning of the Year 32,237,915 41,200,388 36,661,193
Net Assets—End of the Year 20,488,703$ 32,237,915$ 41,200,388$
Local Government Property Insurance Fund
Statement of Revenues, Expenses, and Changes in Fund Net Assetsfor the Years Ended June 30, 2011, 2010, and 2009
State of WisconsinOffice of the Commissioner of Insurance
27The accompanying notes are an integral part of this statement.

Year Ended Year Ended Year EndedJune 30, 2011 June 30, 2010 June 30, 2009
CASH FLOWS FROM OPERATING ACTIVITIES
Cash Received for Premiums 15,022,551$ 15,597,119$ 16,604,182$ Losses and Loss Expenses Paid (18,135,225) (12,674,673) (16,368,746)Cash Payments for Contracted Services (1,732,636) (1,492,663) (1,202,631)Cash Payments to Employee for Services (93,925) (103,734) (104,050)Cash Payments for Dividends to Policyholders (4,892,705) (7,077,187) 0Other Operating Revenues (Expenses) (207,664) (165,288) (261,720)
Net Cash Used by Operating Activities (10,039,604) (5,916,426) (1,332,965)
CASH FLOWS FROM NONCAPITAL FINANCING ACTIVITIES
Transfers Out (2,827) (2,623) (2,445)
Net Cash Used by Noncapital Financing Activities (2,827) (2,623) (2,445)
CASH FLOWS FROM INVESTING ACTIVITIES
Proceeds from Sale and Maturities of Investments 8,000,000 0 0Investment Income Received 497,265 615,020 649,800Purchase of Investments (3,601,320) (1,999,800) (18,980,365)
Net Cash Provided (Used) by Investing Activities 4,895,945 (1,384,780) (18,330,565)
NET DECREASE IN CASH AND CASH EQUIVALENTS (5,146,486) (7,303,829) (19,665,975)
Cash and Cash Equivalents at the Beginning of the Year 26,310,072 33,613,901 53,279,876
Cash and Cash Equivalents at the End of the Year 21,163,586$ 26,310,072$ 33,613,901$
for the Years Ended June 30, 2011, 2010, and 2009Statement of Cash Flows
State of WisconsinOffice of the Commissioner of InsuranceLocal Government Property Insurance Fund
The accompanying notes are an integral part of this statement.28
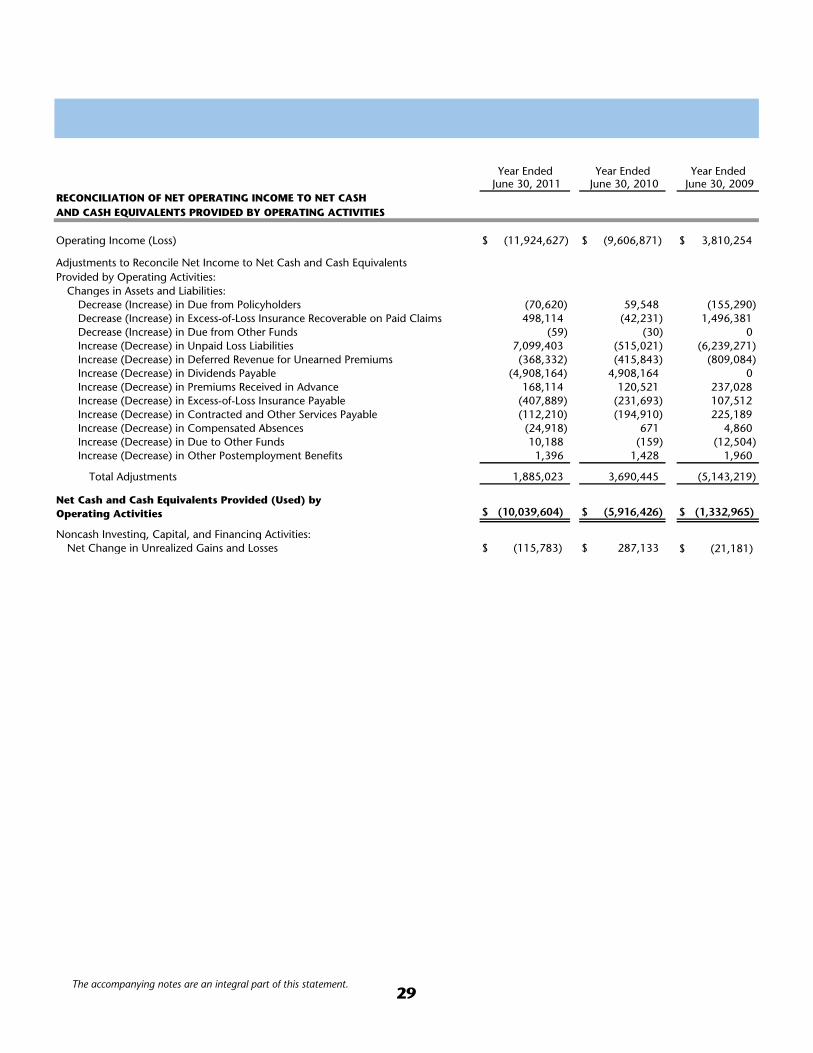
Year Ended Year Ended Year EndedJune 30, 2011 June 30, 2010 June 30, 2009
RECONCILIATION OF NET OPERATING INCOME TO NET CASH AND CASH EQUIVALENTS PROVIDED BY OPERATING ACTIVITIES
Operating Income (Loss) $ (11,924,627) $ (9,606,871) 3,810,254$
Adjustments to Reconcile Net Income to Net Cash and Cash Equivalents Provided by Operating Activities:
Changes in Assets and Liabilities:Decrease (Increase) in Due from Policyholders (70,620) 59,548 (155,290)Decrease (Increase) in Excess-of-Loss Insurance Recoverable on Paid Claims 498,114 (42,231) 1,496,381Decrease (Increase) in Due from Other Funds (59) (30) 0Increase (Decrease) in Unpaid Loss Liabilities 7,099,403 (515,021) (6,239,271)Increase (Decrease) in Deferred Revenue for Unearned Premiums (368,332) (415,843) (809,084)Increase (Decrease) in Dividends Payable (4,908,164) 4,908,164 0Increase (Decrease) in Premiums Received in Advance 168,114 120,521 237,028Increase (Decrease) in Excess-of-Loss Insurance Payable (407,889) (231,693) 107,512Increase (Decrease) in Contracted and Other Services Payable (112,210) (194,910) 225,189Increase (Decrease) in Compensated Absences (24,918) 671 4,860Increase (Decrease) in Due to Other Funds 10,188 (159) (12,504)Increase (Decrease) in Other Postemployment Benefits 1,396 1,428 1,960
Total Adjustments 1,885,023 3,690,445 (5,143,219)
Net Cash and Cash Equivalents Provided (Used) byOperating Activities $ (10,039,604) $ (5,916,426) $ (1,332,965)
Noncash Investing, Capital, and Financing Activities:Net Change in Unrealized Gains and Losses $ (115,783) 287,133$ $ (21,181)
The accompanying notes are an integral part of this statement.29

31
1. DESCRIPTION OF THE FUND
The Local Government Property Insurance Fund is part of the State of Wisconsin’s financial reporting entity and is reported as an other enterprise fund in the State’s basic financial statements. The purpose of the Property Fund is to provide property insurance coverage to tax-supported local units of government such as counties, towns, cities, villages, school districts, and library boards. Coverage is available on an optional basis. It grew out of the State Property Insurance Fund, which was created in 1903. Chapter 221, Laws of 1979, transferred coverage for state-owned property from the State Property Insurance Fund to a self-funded program administered by the Wisconsin Department of Administration. The Fund was re-created as the Local Government Property Insurance Fund to insure the remaining non-state government properties previously covered by the State Property Insurance Fund.
The Property Fund provides insurance coverage to local units of government against all property losses except flood, earthquake, wear and tear, extremes in temperature, mold, war, nuclear reaction, and embezzlement. Motor vehicle and inland marine property coverage, and builder’s risk policies for new building construction and renovations, are also available.
The Property Fund functions similarly to a commercial insurer. Policyholders receive insurance protection for an insurance premium. The Property Fund bears the risk of loss for property covered by the policies, subject to policy deductibles that vary from $500 to $100,000 per loss. Policyholders are obligated to pay the annual insurance premium and to report losses in a timely manner.
Notes to the Financial Statements
32 NOTES TO THE FINANCIAL STATEMENTS
Policyholders are not subject to any premium assessments should a premium deficiency exist. Pursuant to s. 605.30, Wis. Stats., if the Property Fund did not have sufficient assets to pay losses that are due, the Department of Administration would transfer from the State’s General Fund to the Property Fund amounts sufficient to pay the losses. The Property Fund would have to repay the General Fund. For this and other reasons, the Property Fund seeks to ensure that net assets are maintained at a sufficient level to minimize the potential for a premium deficiency to develop or to require transfers from the General Fund.
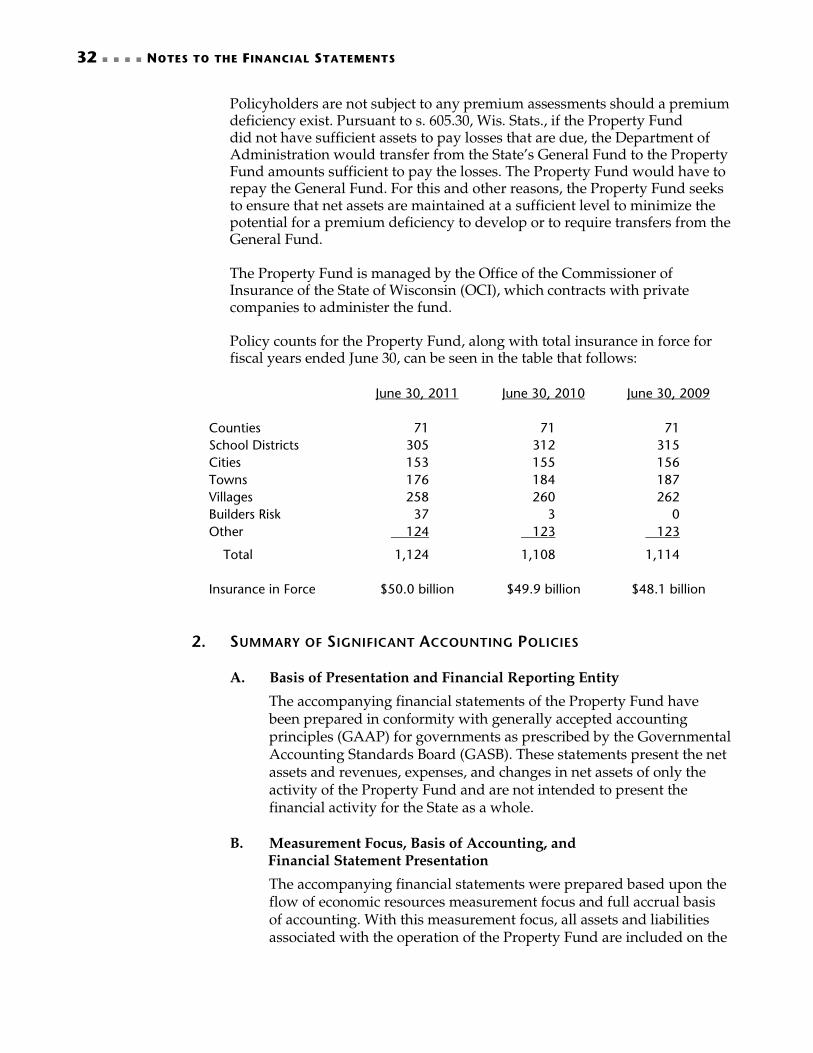
The Property Fund is managed by the Office of the Commissioner of Insurance of the State of Wisconsin (OCI), which contracts with private companies to administer the fund. Policy counts for the Property Fund, along with total insurance in force for fiscal years ended June 30, can be seen in the table that follows:
June 30, 2011
June 30, 2010
June 30, 2009
Counties 71
71
71
School Districts 305
312
315 Cities 153
155
156
Towns 176
184
187 Villages 258
260
262
Builders Risk 37
3
0 Other 124
123
123
Total 1,124
1,108
1,114
Insurance in Force $50.0 billion
$49.9 billion
$48.1 billion 2. SUMMARY OF SIGNIFICANT ACCOUNTING POLICIES
A. Basis of Presentation and Financial Reporting Entity
The accompanying financial statements of the Property Fund have been prepared in conformity with generally accepted accounting principles (GAAP) for governments as prescribed by the Governmental Accounting Standards Board (GASB). These statements present the net assets and revenues, expenses, and changes in net assets of only the activity of the Property Fund and are not intended to present the financial activity for the State as a whole.
B. Measurement Focus, Basis of Accounting, and
Financial Statement Presentation
The accompanying financial statements were prepared based upon the flow of economic resources measurement focus and full accrual basis of accounting. With this measurement focus, all assets and liabilities associated with the operation of the Property Fund are included on the

NOTES TO THE FINANCIAL STATEMENTS 33
Statement of Net Assets. Under the accrual basis of accounting, revenues are recorded when earned and expenses are recorded when the related liabilities are incurred. Revenues and expenses not related to the Property Fund’s primary purpose are reported as nonoperating revenues and expenses. Currently, the Property Fund’s only nonoperating activity consists of investment income and any related expenses offset within investment income. The Property Fund applies all applicable GASB pronouncements. Financial Accounting Standards Board (FASB) statements effective after November 30, 1989, are not applied in accounting for the operations of the Property Fund.
C. Accounting Estimates
The preparation of financial statements requires management to make estimates and assumptions that affect the amounts reported in the financial statements and accompanying notes. Actual results could differ from those estimates. Estimates that are particularly susceptible to significant change in future years are the liabilities for unpaid losses and loss expenses. In estimating these liabilities, management uses the methodology discussed in Note 2G.
D. Cash and Cash Equivalents
Cash and cash equivalents reported on the Statement of Net Assets and the Statement of Cash Flows are deposited with the State, where available balances beyond immediate needs are pooled in the State Investment Fund. The State Investment Fund is a short-term pool of state and local funds managed by the State of Wisconsin Investment Board with oversight by its Board of Trustees. Balances pooled in the State Investment Fund are restricted to legally stipulated investments valued consistent with GASB Statement No. 31, Accounting and Financial Reporting for Certain Investments and for External Investment Pools.
E. Investment Valuation
Investments of the Property Fund consist of high-grade, fixed-income securities managed by the State of Wisconsin Investment Board. Fixed-income obligations are reported at fair value consistent with the provisions of GASB Statement No. 31, Accounting and Financial Reporting for Certain Investments and for External Investment Pools. Fair value information is determined using quoted market prices.
F. Premiums
Policies are generally written for annual terms. Premiums are recognized as revenue over the terms of the insurance policies by
34 NOTES TO THE FINANCIAL STATEMENTS
calculating the earned premium on each policy. The daily pro rata portion of premiums written that are applicable to the unexpired terms of insurance policies in force as of the date of the Statement of Net Assets are reported as deferred revenues for unearned premiums. Premiums received on policies that are not yet in force as of the date of the Statement of Net Assets are reported as a liability for premiums received in advance.
G. Unpaid Loss Liabilities
The Property Fund establishes the liabilities for unpaid losses and loss expenses based on estimates of the ultimate cost of insureds’ losses and costs associated with settling losses that have been reported but not settled (case reserves) and of losses and related loss expenses that have been incurred but not reported (IBNR). The period of time for which such costs must be estimated varies depending on the coverage involved. Estimated amounts of excess-of-loss insurance recoverable on unpaid losses and loss expenses are deducted from these liabilities, as discussed further in Notes 4 and 5. The liabilities for unpaid losses and loss expenses are not discounted to present value.
While management believes that the liabilities for unpaid losses and loss expenses are adequate to cover the ultimate net cost of all incurred losses at year-end, the liabilities are estimates and no representation is made that the ultimate liabilities may not exceed such estimates. These liabilities are recomputed periodically to produce current estimates that reflect recent settlements, loss frequency, and other economic factors. A provision for inflation in the calculation of estimated future loss costs is implicit in the calculation because reliance is placed both on actual historical data that reflects past inflation and on other factors that are considered to be appropriate modifiers of past experience. Changes in estimates of losses and loss expenses resulting from the review process and from differences between estimates and payments for losses are charged or credited to expenses in the periods in which the estimates are changed or payments are made.
H. Excess-of-Loss Insurance Coverage
The Property Fund purchases excess-of-loss insurance coverage, the operation of which is analogous to “reinsurance,” to reduce its exposure to large losses on all types of insured events. Earned premiums ceded to excess-of-loss insurers are netted within earned premiums on the Statement of Revenues, Expenses, and Changes in Net Assets. The unearned portion of excess-of-loss insurance premiums paid is netted within the deferred revenue for unearned premiums liability on the Statement of Net Assets. Loss and loss expense recoveries from excess-of-loss insurance are netted within losses and loss expenses on the Statement of Revenues, Expenses, and Changes in Net Assets. Excess-of-loss insurance recoverable on paid claims is included as an asset and excess-of-loss insurance recoverable on

NOTES TO THE FINANCIAL STATEMENTS 35
unpaid losses is netted within unpaid loss liabilities on the Statement of Net Assets. Further detail on excess-of-loss insurance coverage is disclosed in Note 5.
I. Policy Acquisition Costs
Since the Property Fund has no marketing staff, does no advertising, and incurs no sales commissions, acquisition costs are minimal and charged to operations as incurred.
J. Employee Compensated Absences
The Property Fund’s compensated absence liability consists of accumulated unpaid leave, compensatory time, personal holiday hours, and Saturday/legal holiday hours earned and vested as of June 30. Unused earned compensated absences, other than accumulated sick leave, are accrued with a resulting liability. The liability and the expenses for compensated absences are based on current rates of pay. The related employer’s share of social security taxes, Medicare taxes, and contributions to the Wisconsin Retirement System is also accrued with a resulting liability. The compensated absences liability is classified as either a short-term or a long-term liability based upon an estimate determined by management.
3. DEPOSITS AND INVESTMENTS
A. Deposits
The balance of cash and cash equivalents consists of cash deposited in the State’s bank and cash invested by the State of Wisconsin Investment Board through the State Investment Fund. The following table presents these balances at fair value for the years ended June 30:
Cash and Cash Equivalents: June 30, 2011
June 30, 2010
June 30, 2009
Deposits in the State’s Bank $ 533
$ 88
$ 684 State Investment Fund Shares1 21,163,053
26,309,984
33,613,217
Total Cash and Cash Equivalents $21,163,586
$26,310,072
$33,613,901
1 Amounts include accrued interest of $2,053 for June 2011, $4,984 for June 2010, and $11,217 for June 2009.
The State Investment Fund is not registered with the Securities and Exchange Commission as an investment company. Shares in the State Investment Fund are reported at fair value as of June 30. The various types of securities in which the State Investment Fund may invest are enumerated in s. 25.17(3)(b), (ba), (bd), and (dg), Wis. Stats., and include direct obligations of the United States or its agencies, corporations wholly owned by the United States or chartered by an act of Congress, securities guaranteed by the United States, unsecured notes of financial and industrial issuers, direct obligations of
36 NOTES TO THE FINANCIAL STATEMENTS
or guaranteed by the government of Canada, certificates of deposit issued by banks in the United States and solvent financial institutions in Wisconsin, and bankers acceptances. The State of Wisconsin Investment Board’s Board of Trustees may specifically approve other prudent legal investments. Interest income, gains, and losses of the State Investment Fund are allocated monthly.
Custodial credit risk for deposits is the risk that, if a depository financial institution should fail, the Property Fund would not be able to recover deposits in the possession of an outside party. The Property Fund does not have a deposit policy specifically for custodial risk. Shares in the State Investment Fund are not required to be categorized under GASB Statement 40, Deposit and Investment Risk Disclosures. For the remaining deposits in the State’s bank, all deposits that are held in financial institutions are insured by the Federal Deposit Insurance Corporation (FDIC) for up to $250,000. The State of Wisconsin Public Deposit Guarantee Fund insures up to $400,000 above the amount of federal insurance. Therefore, only the amount of the Property Fund’s June 30 bank balance in excess of $650,000 would be exposed to custodial credit risk and considered uninsured and uncollateralized under GASB Statement 40. None of the Property Fund’s June 30 balances were above $650,000, and therefore none would be considered uninsured and uncollateralized.
B. Investments
As directed by s. 25.17(1)(jm), Wis. Stats., all of the Property Fund’s investments are managed by the State of Wisconsin Investment Board with the investment objectives to invest monies held in the Property Fund in a high-quality fixed-income obligation portfolio that provides for a high degree of liquidity, a relatively moderate degree of risk, and a high rate of return consistent with the priorities of liquidity and protection of principal.
The State of Wisconsin Investment Board recognizes that risk issues permeate the entire investment process from asset allocation to performance evaluation, and it monitors risk through multiple forms of analysis and reporting. Inspection of levels of diversification, nominal risk exposures, risk/return plots, and matching liabilities with assets form the core of the monitoring process. In addition, portfolios and asset classes are reviewed monthly for compliance with investment guidelines, and any exceptions are remedied in a prudent manner. When identified, guideline exceptions are reviewed by the State of Wisconsin Investment Board’s Enterprise Risk and Compliance Committee, which currently meets on a quarterly basis.
Credit Risk. Credit risk is the risk that an issuer or other counterparty to an investment will not fulfill its obligations to the Property Fund. The Property Fund’s investment guidelines provide that issues be rated “A-” or better at the time of purchase, based on the minimum credit
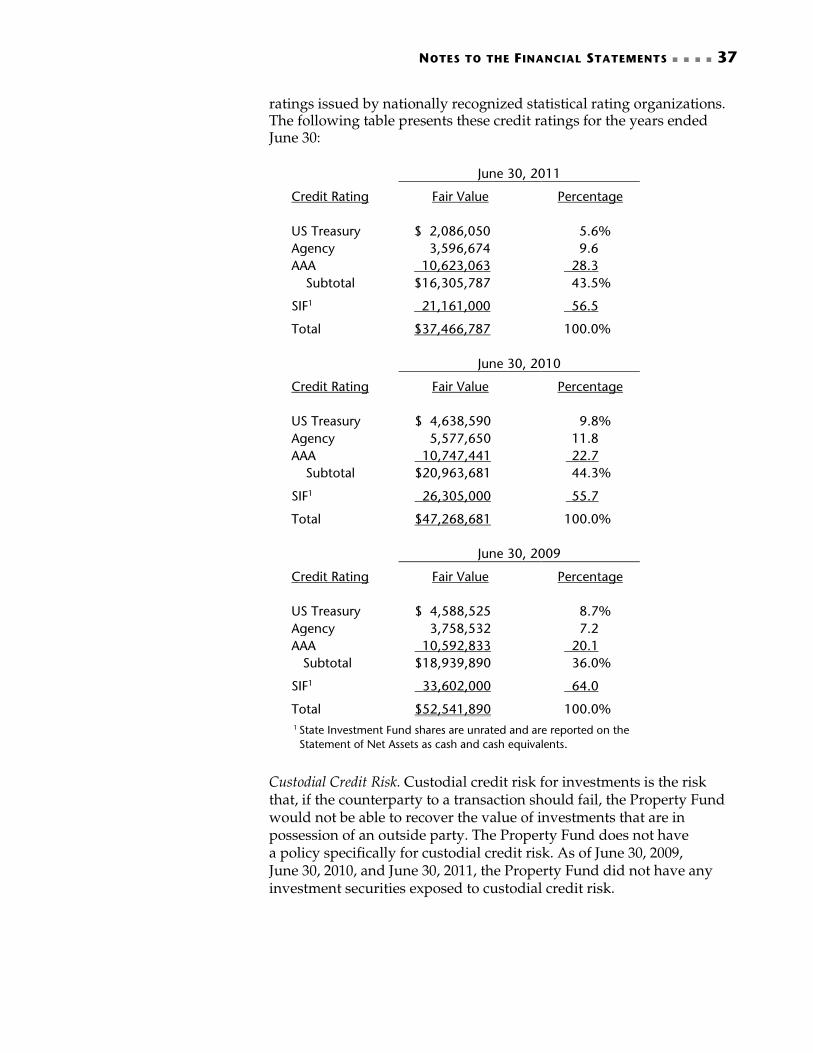
NOTES TO THE FINANCIAL STATEMENTS 37
ratings issued by nationally recognized statistical rating organizations. The following table presents these credit ratings for the years ended June 30:
June 30, 2011
Credit Rating Fair Value
Percentage
US Treasury $ 2,086,050
5.6% Agency 3,596,674 9.6 AAA 10,623,063
28.3
Subtotal $16,305,787
43.5% SIF1 21,161,000 56.5 Total $37,466,787
100.0%
June 30, 2010 Credit Rating Fair Value Percentage US Treasury $ 4,638,590 9.8% Agency 5,577,650 11.8 AAA 10,747,441 22.7 Subtotal $20,963,681 44.3% SIF1 26,305,000 55.7 Total $47,268,681 100.0% June 30, 2009 Credit Rating Fair Value
Percentage
US Treasury $ 4,588,525
8.7% Agency 3,758,532 7.2 AAA 10,592,833
20.1
Subtotal $18,939,890
36.0% SIF1 33,602,000
64.0
Total $52,541,890
100.0%
1 State Investment Fund shares are unrated and are reported on the Statement of Net Assets as cash and cash equivalents.
Custodial Credit Risk. Custodial credit risk for investments is the risk that, if the counterparty to a transaction should fail, the Property Fund would not be able to recover the value of investments that are in possession of an outside party. The Property Fund does not have a policy specifically for custodial credit risk. As of June 30, 2009, June 30, 2010, and June 30, 2011, the Property Fund did not have any investment securities exposed to custodial credit risk.
38 NOTES TO THE FINANCIAL STATEMENTS
Concentrations of Credit Risk. Concentration of credit risk is the risk of loss attributed to the magnitude of an organization’s investment in a single issuer. The Property Fund’s investment guidelines limit concentrations of credit risk by establishing maximum issuer and/or sector exposure limits. General guidelines provide that no single issuer may exceed 5.0 percent of the total of the Property Fund’s investments plus cash and cash equivalents in the State Investment Fund, with the exception of the U.S. government and its agencies and the State Investment Fund, which may be unlimited. In addition, the Property Fund further limits AAA-rated mortgage-backed, AAA-rated asset-backed, and individual corporate issuers to 3.0 percent of the Property Fund’s investments plus cash and cash equivalents in the State Investment Fund.
The Property Fund’s investments in individual corporate issuers did not exceed these guidelines as of June 30, 2009; however, the investments did exceed the limitations as of June 30, 2010, and June 30, 2011. Certain events occurred during these years that caused a significant decline in cash and cash equivalents that led to certain issuers exceeding the 3.0 percent limitation. During FY 2009-10, the Property Fund declared a dividend of approximately $12.0 million, which decreased cash and cash equivalents. In addition, the FY 2010-11 increased loss activity significantly decreased cash and cash equivalents. All individual corporate issuers are due to mature within one year and will be reinvested in amounts not to exceed the 3.0 percent limitation.
Interest Rate Risk. Interest rate risk is the risk that changes in interest rates will adversely affect the fair value of an investment. The Property Fund uses the duration method to identify and manage its interest rate risk. The Property Fund’s guidelines require that a bond’s maturity must not exceed ten years.
The following table presents the durations for each type of fixed-income security held, as well as for the State Investment Fund, for the years ended June 30:

NOTES TO THE FINANCIAL STATEMENTS 39
June 30, 2011
Fair Value Duration (in years)
Government/Agency $ 5,682,724 1.42 Corporate 10,623,063 0.61 State Investment Fund 21,161,000 0.20 Total $37,466,787 June 30, 2010
Fair Value Duration (in years)
Government/Agency $10,216,240 0.95 Corporate 10,747,441 1.58 State Investment Fund 26,305,000 0.21 Total $47,268,681 June 30, 2009
Fair Value Duration (in years)
Government/Agency $ 8,347,057 1.97 Corporate 10,592,833 2.52 State Investment Fund 33,602,000 0.19 Total $52,541,890
Foreign Currency Risk. Foreign currency risk is the risk that changes in exchange rates will adversely impact the fair value of an investment. The Property Fund’s investment guidelines do not specifically address foreign currency risk. As of June 30, 2009, June 30 2010, and June 30, 2011, the Property Fund did not own any issues denominated in a foreign currency.
4. UNPAID LOSS LIABILITIES
The Property Fund establishes a liability for both reported and unreported insured events that includes estimates of both future payments of losses and related loss expenses. The following schedule represents changes in those aggregate liabilities for the Property Fund for the past three fiscal years.

40 NOTES TO THE FINANCIAL STATEMENTS
Fiscal Year Ended June 30
(in thousands)
2011
2010
2009
Unpaid Loss Liabilities at Beginning of Year $ 6,275
$ 9,506
$18,118 Less: Excess-of-Loss Insurance Recoverable 0
(2,716)
(5,088)
Net Unpaid Loss Liabilities at Beginning of Year 6,275
6,790
13,030
Incurred Losses and Loss Expenses: Provision for insured events of the current year 23,963
12,113
11,372
Increase (decrease) in provision for insured events of prior years 1,770
4
254
Total Incurred Losses and Loss Expenses 25,733
12,117
11,626
Payments1: Losses and loss expenses attributable to insured
events of the current year
11,426
6,228
6,896
Losses and loss expenses attributable to insured events of prior years
7,207
6,404
10,970
Total Payments 18,633
12,632
17,866
Unpaid Loss Liabilities at End of Year 13,375
6,275
6,790 Plus: Excess-of-Loss Insurance Recoverable 1,743
0
2,716
Total Unpaid Loss Liabilities at End of Year $15,118
$6,275
$9,506
1 Payments include the change in excess-of-loss recoverable on paid losses and drafts outstanding of ($498,114) in FY 2010-11, $42,231 in FY 2009-10, and ($1,496,381) in FY 2008-09.
The unpaid loss liabilities are continually reviewed and adjusted as claims develop and new information is received. These liabilities are necessarily based on estimates, and although management believes that the amounts are adequate, the ultimate liabilities will differ from the amounts provided. The methods for making such estimates and for establishing the resulting liabilities are reviewed annually, and any adjustments are reflected in current earnings. The changes in the provision for incurred loss liabilities attributable to the prior fiscal years do not result in additional or return premiums for those years.
5. EXCESS-OF-LOSS INSURANCE COVERAGE
To reduce its exposure to large losses on all types of insured events, the Property Fund purchases excess-of-loss insurance coverage, the operation of which is analogous to “reinsurance.” Excess-of-loss insurance permits recovery of a portion of losses from the excess-of-loss insurers, although it does not discharge the primary liability of the Property Fund as direct insurer of the risk reinsured. The Property Fund does not report excess-of-loss insured risks as liabilities unless it is probable that those risks will not be covered by excess-of-loss insurers.

NOTES TO THE FINANCIAL STATEMENTS 41
The following table shows the excess-of-loss insurance retentions, deductibles, and limits for the terms in force during the period of these financial statements. For the aggregate excess-of-loss insurance contracts, only losses over the underlying per loss deductible are included in the aggregate calculation, and once the aggregate retention is met, only loss occurrences over $10,000 are included in the recoverable calculation.
Excess-of-Loss Insurance Term
Per Risk
Occurrence Retention
Aggregate Retention
Aggregate Limit
Aggregate Underlying
Per Loss Deductible
3/31/2008 – 3/31/2009 $2,000,000 $22,000,000 $425,000,000 $5,000
3/31/2009 – 3/31/2010 2,000,000 22,000,000 425,000,000 5,000
3/31/2010 – 3/31/2011 2,000,000 22,000,000 425,000,000 5,000
3/31/2011 – 3/31/2012 2,000,000 22,000,000 425,000,000 5,000
Premiums ceded to the excess-of-loss insurers are netted within earned premiums on the Statement of Revenues, Expenses, and Changes in Net Assets. The following table presents total premiums, excess-of-loss insurance premiums ceded, and net premiums earned.
For the Year Ended June 30
2011
2010
2009
Total Premiums $21,001,576
$21,272,008
$21,913,029 Less Excess-of-Loss Insurance Premiums Ceded 5,300,298
5,207,422
4,689,013
Net Premiums Earned $15,701,278
$16,064,586
$17,224,016
Deferred revenue for unearned premiums is presented on the Statement of Net Assets net of related unearned excess-of-loss insurance premiums ceded. The following table presents total deferred premiums, unearned excess-of-loss insurance premiums ceded, and net deferred revenue for unearned premiums.
For the Year Ended June 30
2011
2010
2009
Total Deferred Premiums $8,320,402
$8,173,104
$8,467,969 Less Unearned Excess-of-Loss Insurance Premiums Ceded
4,667,863
4,152,233
4,031,255
Net Deferred Revenue for Unearned Premiums 3,652,539
4,020,871
4,436,714
42 NOTES TO THE FINANCIAL STATEMENTS
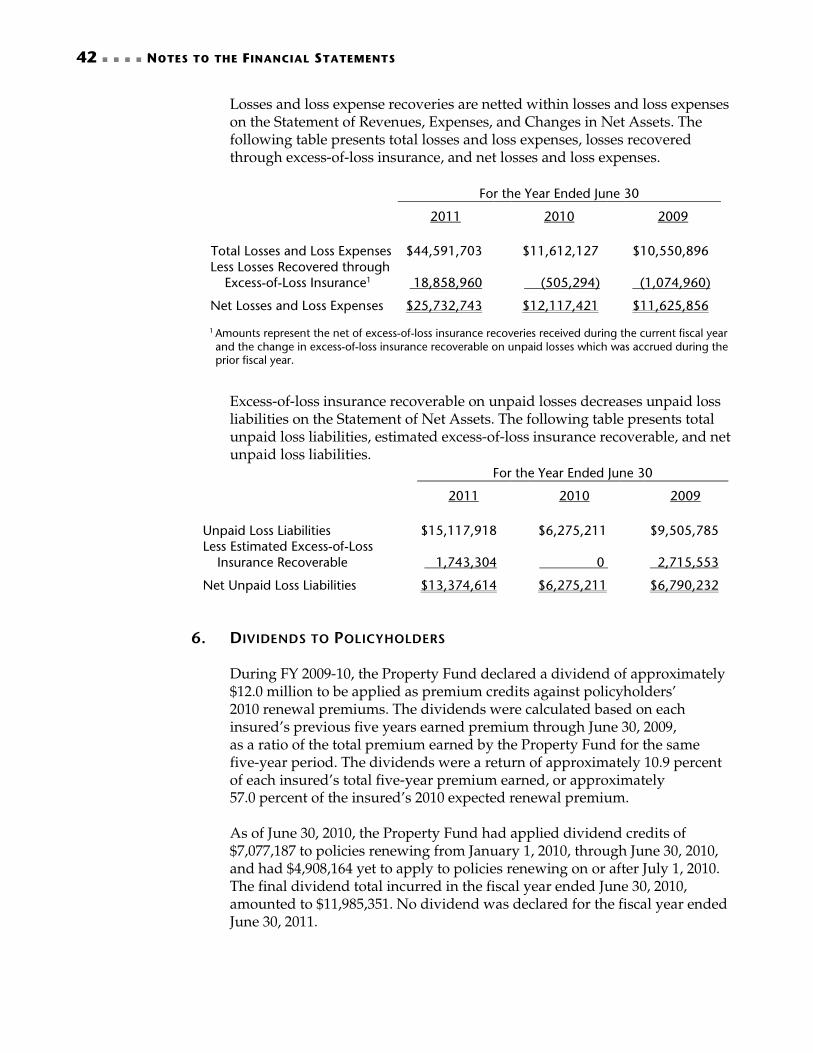
Losses and loss expense recoveries are netted within losses and loss expenses on the Statement of Revenues, Expenses, and Changes in Net Assets. The following table presents total losses and loss expenses, losses recovered through excess-of-loss insurance, and net losses and loss expenses.
For the Year Ended June 30
2011
2010
2009
Total Losses and Loss Expenses $44,591,703
$11,612,127
$10,550,896 Less Losses Recovered through Excess-of-Loss Insurance1
18,858,960
(505,294)
(1,074,960)
Net Losses and Loss Expenses $25,732,743
$12,117,421
$11,625,856
1 Amounts represent the net of excess-of-loss insurance recoveries received during the current fiscal year and the change in excess-of-loss insurance recoverable on unpaid losses which was accrued during the prior fiscal year.
Excess-of-loss insurance recoverable on unpaid losses decreases unpaid loss liabilities on the Statement of Net Assets. The following table presents total unpaid loss liabilities, estimated excess-of-loss insurance recoverable, and net unpaid loss liabilities.
For the Year Ended June 30
2011
2010
2009
Unpaid Loss Liabilities $15,117,918
$6,275,211
$9,505,785 Less Estimated Excess-of-Loss Insurance Recoverable
1,743,304
0
2,715,553
Net Unpaid Loss Liabilities $13,374,614
$6,275,211
$6,790,232 6. DIVIDENDS TO POLICYHOLDERS
During FY 2009-10, the Property Fund declared a dividend of approximately $12.0 million to be applied as premium credits against policyholders’ 2010 renewal premiums. The dividends were calculated based on each insured’s previous five years earned premium through June 30, 2009, as a ratio of the total premium earned by the Property Fund for the same five-year period. The dividends were a return of approximately 10.9 percent of each insured’s total five-year premium earned, or approximately 57.0 percent of the insured’s 2010 expected renewal premium. As of June 30, 2010, the Property Fund had applied dividend credits of $7,077,187 to policies renewing from January 1, 2010, through June 30, 2010, and had $4,908,164 yet to apply to policies renewing on or after July 1, 2010. The final dividend total incurred in the fiscal year ended June 30, 2010, amounted to $11,985,351. No dividend was declared for the fiscal year ended June 30, 2011.
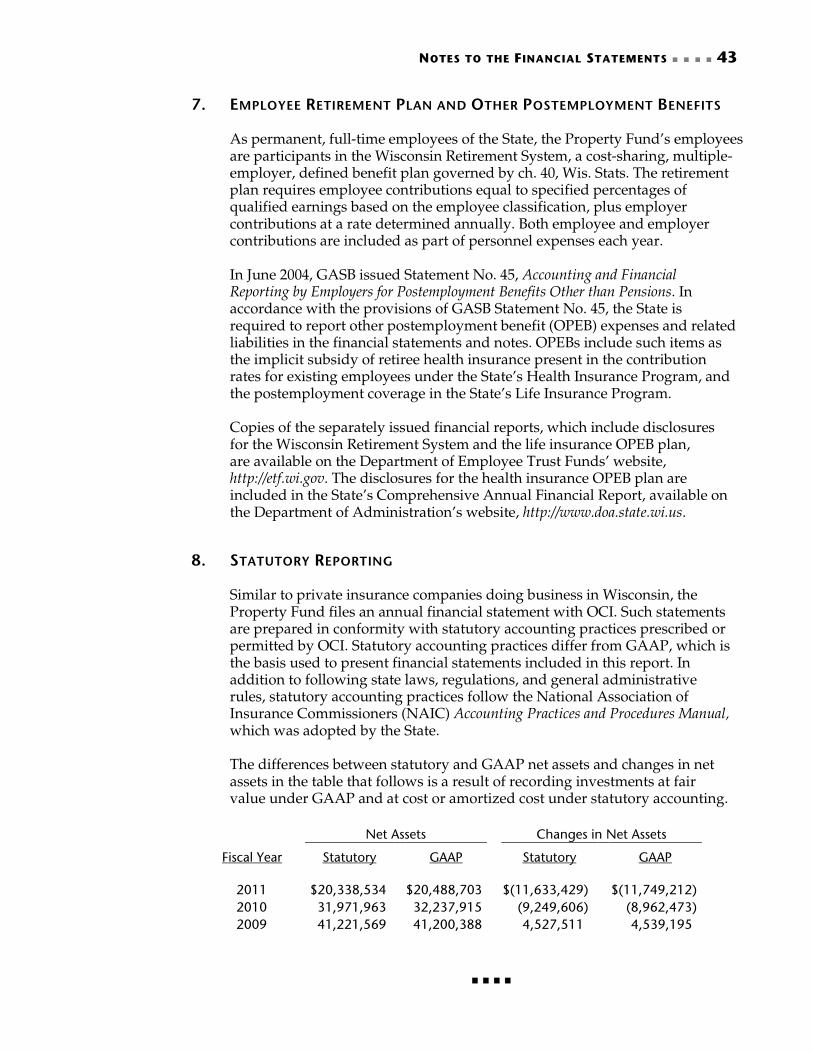
NOTES TO THE FINANCIAL STATEMENTS 43
7. EMPLOYEE RETIREMENT PLAN AND OTHER POSTEMPLOYMENT BENEFITS
As permanent, full-time employees of the State, the Property Fund’s employees are participants in the Wisconsin Retirement System, a cost-sharing, multiple- employer, defined benefit plan governed by ch. 40, Wis. Stats. The retirement plan requires employee contributions equal to specified percentages of qualified earnings based on the employee classification, plus employer contributions at a rate determined annually. Both employee and employer contributions are included as part of personnel expenses each year. In June 2004, GASB issued Statement No. 45, Accounting and Financial Reporting by Employers for Postemployment Benefits Other than Pensions. In accordance with the provisions of GASB Statement No. 45, the State is required to report other postemployment benefit (OPEB) expenses and related liabilities in the financial statements and notes. OPEBs include such items as the implicit subsidy of retiree health insurance present in the contribution rates for existing employees under the State’s Health Insurance Program, and the postemployment coverage in the State’s Life Insurance Program. Copies of the separately issued financial reports, which include disclosures for the Wisconsin Retirement System and the life insurance OPEB plan, are available on the Department of Employee Trust Funds’ website, http://etf.wi.gov. The disclosures for the health insurance OPEB plan are included in the State’s Comprehensive Annual Financial Report, available on the Department of Administration’s website, http://www.doa.state.wi.us.
8. STATUTORY REPORTING
Similar to private insurance companies doing business in Wisconsin, the Property Fund files an annual financial statement with OCI. Such statements are prepared in conformity with statutory accounting practices prescribed or permitted by OCI. Statutory accounting practices differ from GAAP, which is the basis used to present financial statements included in this report. In addition to following state laws, regulations, and general administrative rules, statutory accounting practices follow the National Association of Insurance Commissioners (NAIC) Accounting Practices and Procedures Manual, which was adopted by the State. The differences between statutory and GAAP net assets and changes in net assets in the table that follows is a result of recording investments at fair value under GAAP and at cost or amortized cost under statutory accounting.
Net Assets Changes in Net Assets Fiscal Year Statutory GAAP Statutory GAAP 2011 $20,338,534 $20,488,703 $(11,633,429) $(11,749,212) 2010 31,971,963 32,237,915 (9,249,606) (8,962,473) 2009 41,221,569 41,200,388 4,527,511 4,539,195


45
The table on page 47 illustrates how the Property Fund’s total revenues (net of excess-of-loss insurance premiums ceded) compares to related costs of losses and loss expenses (net of losses assumed by excess-of-loss insurers) as of the end of each of the last ten years. The rows of the table are defined as follows: 1. Premiums and Investment Revenue—Shows total fiscal year gross earned
premium revenue and reported investment revenue, amount of excess-of-loss premium ceded, and net earned premium and investment revenues.
2. Loss Expenses—Shows each fiscal year’s loss expenses paid (included in line 4), including defense and containment costs and other adjusting expenses not allocable to individual losses.
3. Estimated Incurred Losses and Loss Expenses as of End of Policy Year—Shows gross incurred losses and loss expenses (both paid and accrued), losses assumed by excess-of-loss insurers, and the net amount of incurred losses and loss expenses as originally reported at the end of the first year in which the event that triggered coverage under the contract occurred (called policy year).
4. Net Paid (Cumulative)—Shows cumulative net amounts paid for losses and loss expenses as of the end of successive years for each policy year.
5. Reestimated Ceded Losses and Loss Expenses—Shows the reestimated amount of losses and loss expenses assumed by excess-of-loss insurers as of the end of the current fiscal year for each policy year.
6. Reestimated Net Incurred Losses and Loss Expenses—Shows the development of each policy year’s incurred losses and loss expenses as of the end of
Required Supplementary Information
46 REQUIRED SUPPLEMENTARY INFORMATION
successive years. The annual reestimated amounts result from new information received on known losses and from reevaluation of existing information on known losses, as well as from the emergence of new losses not previously known.
7. Increase/Decrease in Estimated Incurred Losses and Loss Expenses from End of Policy Year—Compares the most recent reestimation for net incurred loss and loss expenses (line 6) to the amount originally established (line 3). As data for individual policy years mature, the correlation between original estimates and reestimated amounts is commonly used to evaluate the accuracy of incurred losses and loss expenses currently recognized in less mature policy years.
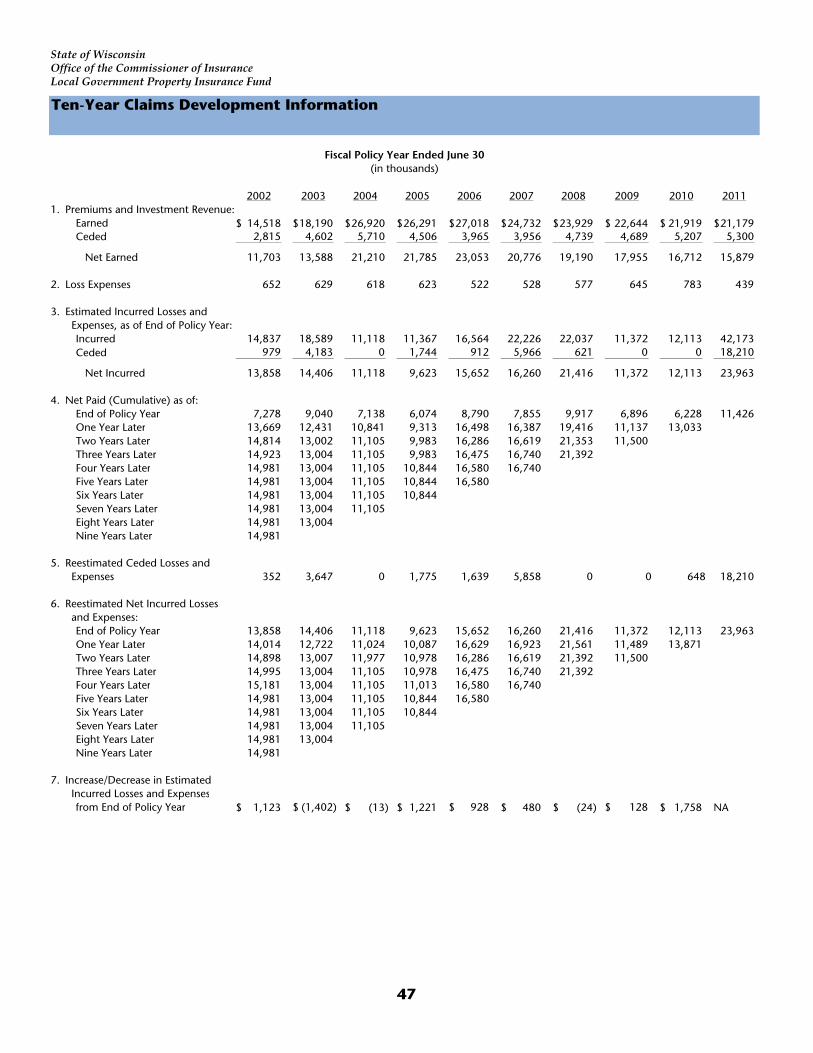
2002 2003 2004 2005 2006 2007 2008 2009 2010 20111. Premiums and Investment Revenue:
Earned 14,518$ 18,190$ 26,920$ 26,291$ 27,018$ 24,732$ 23,929$ 22,644$ 21,919$ 21,179$Ceded 2,815 4,602 5,710 4,506 3,965 3,956 4,739 4,689 5,207 5,300
Net Earned 11,703 13,588 21,210 21,785 23,053 20,776 19,190 17,955 16,712 15,879
2. Loss Expenses 652 629 618 623 522 528 577 645 783 439
3. Estimated Incurred Losses and Expenses, as of End of Policy Year:
Incurred 14,837 18,589 11,118 11,367 16,564 22,226 22,037 11,372 12,113 42,173 Ceded 979 4,183 0 1,744 912 5,966 621 0 0 18,210
Net Incurred 13,858 14,406 11,118 9,623 15,652 16,260 21,416 11,372 12,113 23,963
4. Net Paid (Cumulative) as of:End of Policy Year 7,278 9,040 7,138 6,074 8,790 7,855 9,917 6,896 6,228 11,426 One Year Later 13,669 12,431 10,841 9,313 16,498 16,387 19,416 11,137 13,033 Two Years Later 14,814 13,002 11,105 9,983 16,286 16,619 21,353 11,500 Three Years Later 14,923 13,004 11,105 9,983 16,475 16,740 21,392 Four Years Later 14,981 13,004 11,105 10,844 16,580 16,740 Five Years Later 14,981 13,004 11,105 10,844 16,580 Six Years Later 14,981 13,004 11,105 10,844 Seven Years Later 14,981 13,004 11,105 Eight Years Later 14,981 13,004 Nine Years Later 14,981
5. Reestimated Ceded Losses and
Expenses 352 3,647 0 1,775 1,639 5,858 0 0 648 18,210
6. Reestimated Net Incurred Losses and Expenses:
End of Policy Year 13,858 14,406 11,118 9,623 15,652 16,260 21,416 11,372 12,113 23,963 One Year Later 14,014 12,722 11,024 10,087 16,629 16,923 21,561 11,489 13,871 Two Years Later 14,898 13,007 11,977 10,978 16,286 16,619 21,392 11,500 Three Years Later 14,995 13,004 11,105 10,978 16,475 16,740 21,392 Four Years Later 15,181 13,004 11,105 11,013 16,580 16,740 Five Years Later 14,981 13,004 11,105 10,844 16,580 Six Years Later 14,981 13,004 11,105 10,844 Seven Years Later 14,981 13,004 11,105 Eight Years Later 14,981 13,004 Nine Years Later 14,981
7. Increase/Decrease in Estimated Incurred Losses and Expenses
from End of Policy Year 1,123$ (1,402)$ (13)$ 1,221$ 928$ 480$ (24)$ 128$ 1,758$ NA
Fiscal Policy Year Ended June 30(in thousands)
Ten-Year Claims Development Information
Local Government Property Insurance Fund
State of WisconsinOffice of the Commissioner of Insurance
47

49
Independent Auditor’s Report on Internal Control over Financial Reporting and on Compliance and Other Matters Based on an Audit of Financial Statements Performed in Accordance with Government Auditing Standards We have audited the financial statements of the Wisconsin Local Government Property Insurance Fund as of and for the years ended June 30, 2011, June 30, 2010, and June 30, 2009, and have issued our report thereon dated March 30, 2012. We conducted our audit in accordance with auditing standards generally accepted in the United States of America and the standards applicable to financial audits contained in Government Auditing Standards, issued by the Comptroller General of the United States. INTERNAL CONTROL OVER FINANCIAL REPORTING In planning and performing our audit, we considered the Wisconsin Local Government Property Insurance Fund’s internal control over financial reporting (internal control) as a basis for designing our auditing procedures for the purpose of expressing our opinion on the financial statements, but not for the purpose of expressing an opinion on the effectiveness of the Wisconsin Local Government Property Insurance Fund’s internal control. Accordingly, we do not express an opinion on the effectiveness of the Wisconsin Local Government Property Insurance Fund’s internal control. A deficiency in internal control exists when the design or operation of a control does not allow management or employees, in the normal course of performing their assigned functions, to prevent or to detect and correct misstatements on a timely
Report on Internal Control and Compliance

50 REPORT ON INTERNAL CONTROL AND COMPLIANCE
basis. A material weakness is a deficiency or a combination of deficiencies in internal control, such that there is a reasonable possibility that a material misstatement of the entity’s financial statements will not be prevented or will not be detected and corrected on a timely basis. Our consideration of internal control was for the limited purpose described in the first paragraph of this section and was not designed to identify all deficiencies in internal control that might be deficiencies, significant deficiencies, or material weaknesses. We did not identify any deficiencies in internal control that we consider to be material weaknesses as defined in the previous paragraph. COMPLIANCE AND OTHER MATTERS As part of obtaining reasonable assurance about whether the Wisconsin Local Government Property Insurance Fund’s financial statements are free of material misstatement, we performed tests of its compliance with certain provisions of laws, regulations, and contracts, noncompliance with which could have a direct and material effect on the determination of financial statement amounts. However, providing an opinion on compliance with those provisions was not an objective of our audit and, accordingly, we do not express such an opinion. The results of our tests disclosed no instances of noncompliance or other matters that are required to be reported under Government Auditing Standards. We noted certain matters related to documentation of losses paid, application of aggregate deductible policies, and procedures related to check handling at the claims administrator that we reported to management of the Wisconsin Local Government Property Insurance Fund in a separate communication dated March 19, 2012. In its written response, the Property Fund’s management indicated it will take steps to review and improve its policies and procedures in these areas. We did not audit the Wisconsin Local Government Property Insurance Fund’s response and, accordingly, express no opinion on it. This independent auditor’s report is intended solely for the information and use of the Wisconsin Local Government Property Insurance Fund’s management and the Wisconsin Legislature. This report is a matter of public record and its distribution is not limited. However, because we do not express an opinion on the effectiveness of the Wisconsin Local Government Property Insurance Fund’s internal control or on compliance, this report is not intended to be used by anyone other than these specified parties. LEGISLATIVE AUDIT BUREAU March 30, 2012 by Carolyn Stittleburg Audit Director
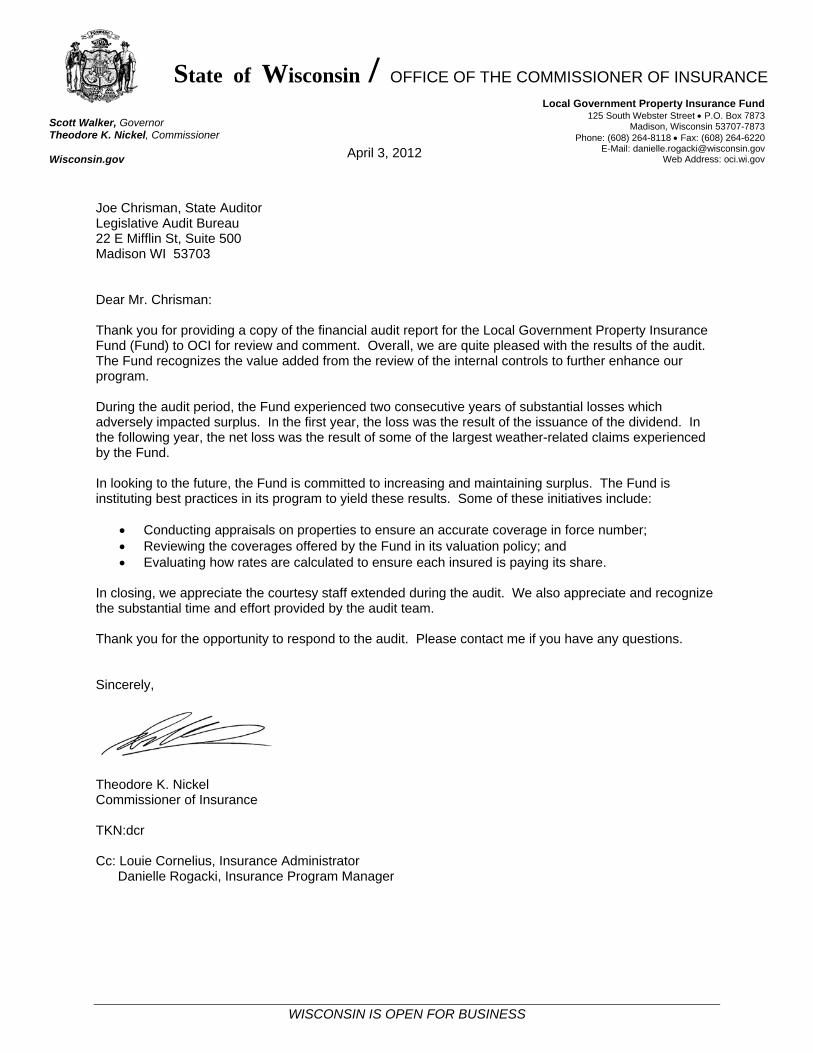
State of Wisconsin / OFFICE OF THE COMMISSIONER OF INSURANCE
April 3, 2012
WISCONSIN IS OPEN FOR BUSINESS
Local Government Property Insurance Fund125 South Webster Street P.O. Box 7873
Madison, Wisconsin 53707-7873Phone: (608) 264-8118 Fax: (608) 264-6220
E-Mail: [email protected] Address: oci.wi.gov
Scott Walker, Governor Theodore K. Nickel, Commissioner Wisconsin.gov
Joe Chrisman, State Auditor Legislative Audit Bureau 22 E Mifflin St, Suite 500 Madison WI 53703 Dear Mr. Chrisman: Thank you for providing a copy of the financial audit report for the Local Government Property Insurance Fund (Fund) to OCI for review and comment. Overall, we are quite pleased with the results of the audit. The Fund recognizes the value added from the review of the internal controls to further enhance our program. During the audit period, the Fund experienced two consecutive years of substantial losses which adversely impacted surplus. In the first year, the loss was the result of the issuance of the dividend. In the following year, the net loss was the result of some of the largest weather-related claims experienced by the Fund. In looking to the future, the Fund is committed to increasing and maintaining surplus. The Fund is instituting best practices in its program to yield these results. Some of these initiatives include:
Conducting appraisals on properties to ensure an accurate coverage in force number; Reviewing the coverages offered by the Fund in its valuation policy; and Evaluating how rates are calculated to ensure each insured is paying its share.
In closing, we appreciate the courtesy staff extended during the audit. We also appreciate and recognize the substantial time and effort provided by the audit team. Thank you for the opportunity to respond to the audit. Please contact me if you have any questions. Sincerely,
Theodore K. Nickel Commissioner of Insurance TKN:dcr Cc: Louie Cornelius, Insurance Administrator Danielle Rogacki, Insurance Program Manager