Embed Size (px)
Citation preview
Local level resource curse: The “Cholo Disease” in Peru
I. Initial comment
II. Introduction
III. The Natural Resource Curse and the Dutch Disease
IV. Local level research in Peru: description and main findings
a. Country background
b. Description of field work and research variables
c. Background on case studies
d. Main findings
i. Prices
ii. Wage rates
iii. Employment
iv. Other symptoms of the resource curse
V. Public policies undertaken to face local level distortions
VI. Some preliminary conclusions
VII. Other empirical research
VIII. Policy recommendations
Initial comment
The growth of the mining and hydrocarbon sectors in Peru in the last decade has been quick
and significant. And these activities have undoubtedly had important impacts on the territories
in which they take place.
This paper is an attempt to gather information about one specific impact: local economic
distortions generated by revenues from mining, oil and gas, which are spent in by local
governments.
A short article which summarized the main findings of this research was published in Quehacer
magazine. It was commented by César Bedoya1 who pointed out there were other kinds of
impacts from mining such as social, political, institutional, among others. He also highlighted
the need to continue researching this issue.
We completely agree on this point. In fact, more and more information is available which
shows both positive and negative impacts of these activities. For example, ECLAC published
earlier this year figures showing that in Latin America, the real exchange rate had fallen 16%
from its average between 99 and 2009, suggesting the possible existence of a “Dutch disease”
in the countries of the region.
In Peru there have been recent studies published that show that mining - through recruitment
of local workers, purchase of goods and direct contributions to fund local development
projects - has had a positive impact on the income of local populations in producing regions.
En el Perú se han hecho diversos estudios que muestran que la minería, a través de la
contratación de personal, la compra de bienes y distintas contribuciones directas a las
localidades como fondos para proyectos de desarrollo local, ha tenido un impacto positivo
sobre los ingresos de la población de las regiones productoras.
For instance, a recent study by Aragón and Rud from Yale, for the case of the Yanacocha mine
in northern Peru, finds there is a positive impact of mining activity on the income of local
populations that increased 1.7% for each additional 10% of local goods purchased by the
company.
Nevertheless, as mentioned by Bedoya, these benefits have a downside in the "new risks
political and institutional risks, since they can generate political instability and erode political
institutions." Based on research conducted by Cecilia Perla2, impacts are mentioned as "setting
new interest groups that fight over access, control and use of revenues; weak institutions to
process new social mobilization ..." among others.
Certainly, all these situations should be researched in more detail, with case studies that
produce local information.
1 DESCO: Revista Quehacer, Nº 185. “Otros síntomas de la “enfermedad chola”. Aportes de las industrias
extractivas y el desempeño de la institucionalidad política local.” César Bedoya G. 2 Perla, Cecilia, “¿Empresas mineras como promotoras del desarrollo?” En: Carlos Meléndez y Alberto
Vergara (eds.), La Iniciativa de la política. Lima, Fondo Editorial de la PUCP, 2010.

In this particular case, we were interested in looking into an economic distortion that affects
local actors such as agricultural producers and also, local populations that have to pay higher
prices for consumer goods. However, this impact takes place parallel o others, both positive
and negative, which should also be discussed and documented further.
I. Introduction
The Peruvian Constitution establishes that producing regions should access a portion of the
public rent generated by the extractive activities that take place in them. In a restricted
interpretation of the constitutional mandate, the Peruvian Canon Law enacted in 2001
established that subnational governments in producing areas would receive all of the royalties
and 50% of the income tax paid by the companies. Initially, the law established that that these
funds could only be used by sub national governments in investment projects, but now 20%
can be used to pay for project design and the maintenance of public infrastructure.3
By the middle of the decade, international commodity prices rose significantly, some
companies started paying income tax after their tax exemptions ran out and others started
paying royalties after the respective law was put into practice, so did the investment budgets
in these local governments and they struggled to spend, in some cases, over 30 times what
they normally spent in the previous years. Investments focused in infrastructure these local
areas lacked, such as roads, schools, hospitals and large municipal buildings.
As the international demand and prices for minerals and oil increased, so did some initial
questions and debates around the perils of the resource curse and, more specifically, the
Dutch disease. Will Peru fall prey of the curse? With the performance of other productive
sector be affected by exchange rate modifications resulting from the massive affluence of
dollars into our economy?
At the same time, RWI counterparts started to gather evidence of some new phenomena
taking place at the local level, basically the way public works by local governments, funded
with extractive rent, were competing with rural producers for non qualified labour in the rural
areas.
In response, the RWI Latin America Office decided to develop research on a possible local
version of the Dutch Disease, what we now have denominated as Enfermedad Chola4 or Creole
Disease. The working hypothesis, based on evidence collected along the last years by ourselves
and others, was that infrastructure investments by sub national authorities were paying higher
wages than those agricultural producers could afford, thus leaving producers without access to
local labour force. The end result is similar to that of the Dutch Disease, as higher wages
cannot be assumed by small scale farmers and agriculture as such becomes non competitive.
But the mechanism is different, based not on changes in the exchange rate but on changes in
the labour markets.
Now, the evidence gathered so far also suggested that local authorities had been reacting to
the pressure placed on them by the local producers. For example, in the gas producing
Amazon areas of the Cusco Region, coffee cooperatives had complained to local mayors about
3 1993 Political Constitution, Article 77, Canon Law (Law 27506 from 2001 and bylaws from 2002) and
Mining Royalty Law (2004). 4 Cholo is a racial term that refers to a half-caste or Creole person, resulting from Spanish and Indian
parents. It is usually an insulting racial slur, but is sometimes used in a friendlier manner between people who have a close relation.
the situation, and local mayors had reacted in one case by cancelling public works during the
harvest season, and in other by not hiring women in public works, in order to force all the
labour force –or at least women who are usually paid lower wages - back to the coffee harvest.
So, we had evidence that there was a problem and that there were public policies being
implemented in response to such problem.
In order to explore this hypothesis, RWI Latin America –with technical and financial support
from RWI- field research to collect information on the following guiding questions: i) Is there
something we can call the “Cholo Disease” in Peru? ii) What is being and can be done about it?
To answer these questions we present a brief description of the main points in the literature
on the Dutch Disease in section II, and then, in section III, we will discuss the main findings in
the field research carried out in the five districts with the highest EI revenue transfers. Finally,
we present some preliminary conclusions and policy recommendations.
II. The Natural Resource Curse and the Dutch Disease
The natural resource curse theory states countries that are rich in non renewable natural
resources like oil and minerals have performed relatively worse in terms of economic growth,
development, governance and welfare than countries that are not endowed with these natural
resources. In other words, it establishes a link between natural resource wealth and slow
economic growth, relatively higher poverty levels, corruption, conflict, authoritarian regimes
and weak accountability.
The term “Dutch disease” was coined by “The Economist” in 1977 to describe the process
through which a major gas discovery in the Netherlands in 1959, led to the dismantling of the
country's industrial sector. Indeed, when Holland began exporting gas, the massive inflow of
foreign currency led to an appreciation of the real exchange rate, which in turn caused exports
of the country's industrial sector to become less competitive. Since the value of the national
currency increased, it made the prices of industrial goods more expensive outside.
In the eighties, authors like van Wijnberger (1980) Corden and Neary (1982), Bruno and Sachs
(1982), among others, published articles formalizing the explanation of Dutch disease with
economic models which included three economic sectors. There is a non-traded good sector
and two traded good sectors: the booming sector and the non-booming tradable sector.
This formalization shows the channels through which the boom in the extractive sector
generated a loss of competitiveness in other sectors of the economy.
Indeed two channels are described. The first way is the most discussed one: the abrupt entry
of revenues in foreign currency from exports of oil or mining makes the national currency
stronger (real exchange rate appreciation). This makes the goods from the non-booming
tradable sector more expensive in the international market, thus reducing its competitiveness.
The second channel is complementary to the first: the booming tradable sector’s purchase of
non-traded goods causes prices to rise. Consequently, the non- booming tradable sector has to
pay higher prices, increasing its production costs and reducing its competitive even further.
The same applies to employment: the booming sector hires more workers paying higher
salaries, so it takes away workers from the non-booming tradable sector, which also has to pay
higher wages. This is known as the “crowding out effect".
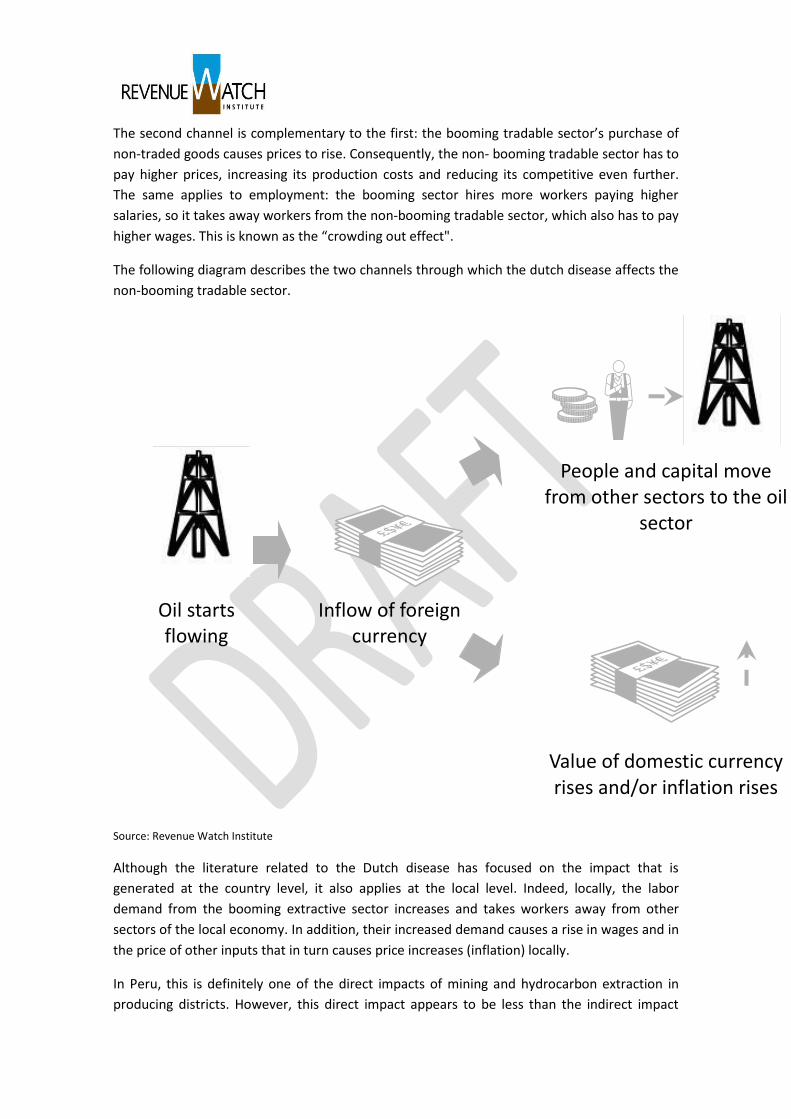
The following diagram describes the two channels through which the dutch disease affects the
non-booming tradable sector.
Source: Revenue Watch Institute
Although the literature related to the Dutch disease has focused on the impact that is
generated at the country level, it also applies at the local level. Indeed, locally, the labor
demand from the booming extractive sector increases and takes workers away from other
sectors of the local economy. In addition, their increased demand causes a rise in wages and in
the price of other inputs that in turn causes price increases (inflation) locally.
In Peru, this is definitely one of the direct impacts of mining and hydrocarbon extraction in
producing districts. However, this direct impact appears to be less than the indirect impact
Oil starts flowing
Inflow of foreign currency
People and capital move from other sectors to the oil
sector
Value of domestic currency rises and/or inflation rises
Export industries
become less competitive and decline
that is caused by the local public sector (district municipality) through expenditure of mining
and hydrocarbon revenues on local infrastructure.
The municipality seems to be playing the role of the "booming sector" at the local level and is
generating distortions in the local economy. Indeed, thanks to the massive influx of funds from
taxes on mining and hydrocarbons, district municipalities producers are making infrastructure
in the town demanding jobs and drive up wages and input prices in the local economy.
Because of this difference with the Dutch disease in its traditional form, we have called this
phenomenon the "cholo disease". However, it is only the actor that causes the distortions
which is different. The crowding out effect is the same as described in the Dutch disease.
Below we present the main results of the case studies carried out in five districts of Peru
where we describe what we call "cholo disease" as well as the policies that the local
governments have put in place to face this phenomenon.
III. Local level research in Peru: description and main findings
a. Country context.
Peru: mining boom with decentralization
After the privatization of the entire mining sector in the early nineties, investment and
production in this sector took off with large foreign private companies developing large scale
projects. Peru quickly became a major silver and copper producer, ranking first and second in
the world, respectively. Later, gold has become increasingly important and Peru became the
first gold producer in Latin America and the sixth in the world.
Mining activities in the country mostly take place in rural areas in the highlands, where the
main economic activity of local populations is subsistence or small scale agriculture, poverty
rates are high, and public service provision is low. Indeed, the 2010 UNDP Human
Development Report devoted one section to analyzing an indicator of the State’s presence in
the country and mining areas match with areas of very low State presence5.
But together with the boom in the mining sector, the Peruvian State began a decentralization
process which allocated a fixed percentage of the revenues generated by these extractive
activities to subnational governments in the producing regions. However, it did not
decentralize any competencies related to decision making on the mining activities themselves,
namely where and when concessions were granted, with what criteria, the approval of
environmental impact assessments, among other responsibilities that remained in the central
government, specifically in the Ministry of Energy and Mines.
In Peru, there are two subnational levels of government: regional and local governments.
Regional level governments were established in the late eighties, dissolved in the early nineties
5 UNDP Peru: “Informe de Desarrollo Humano Perú 2009, Por una densidad del Estado al servicio de la
gente”
and created again in 2002 through Law 27867. They have no tax collecting responsibilities.
Local governments, known as municipalities, are divided into two kinds: province and district
municipalities. Municipalities were created in 1891 and the latest changes to their Organic Law
happened in 2003, to adapt them to the decentralization process being launched then (Law
27972). They do have tax collecting responsibilities; in particular home and vehicle property
taxes, taxes on transactions related to property and taxes on gambling.
Even though the county’s 1993 Political Constitution states that subnational governments are
entitled to a share of the revenues generated by natural resource extraction, only in 2001 the
Peruvian government enacted a law to establish which revenues would be distributed and
how. This law is called Canon Law (Law 27506) and it establishes a mechanism though which
subnational governments in producing areas receive a portion of revenues generated by the
extractive sector according to be spent only in capital spending. This percentage of extractive
revenues allocated to subnational governments was called “canon” and has a fixed distribution
scheme described in figure 1. Subnational governments in non producing areas received
nothing from these revenues.
Figure 1. Distribution scheme for canon transfers
10% to the municipality in the producing district
25% to the municipalities in the producing province
40% to all the municipalities in the producing region
20% to the regional government in the producing region
5% to the public universities in the producing region
Source: Canon Law Nº 27506
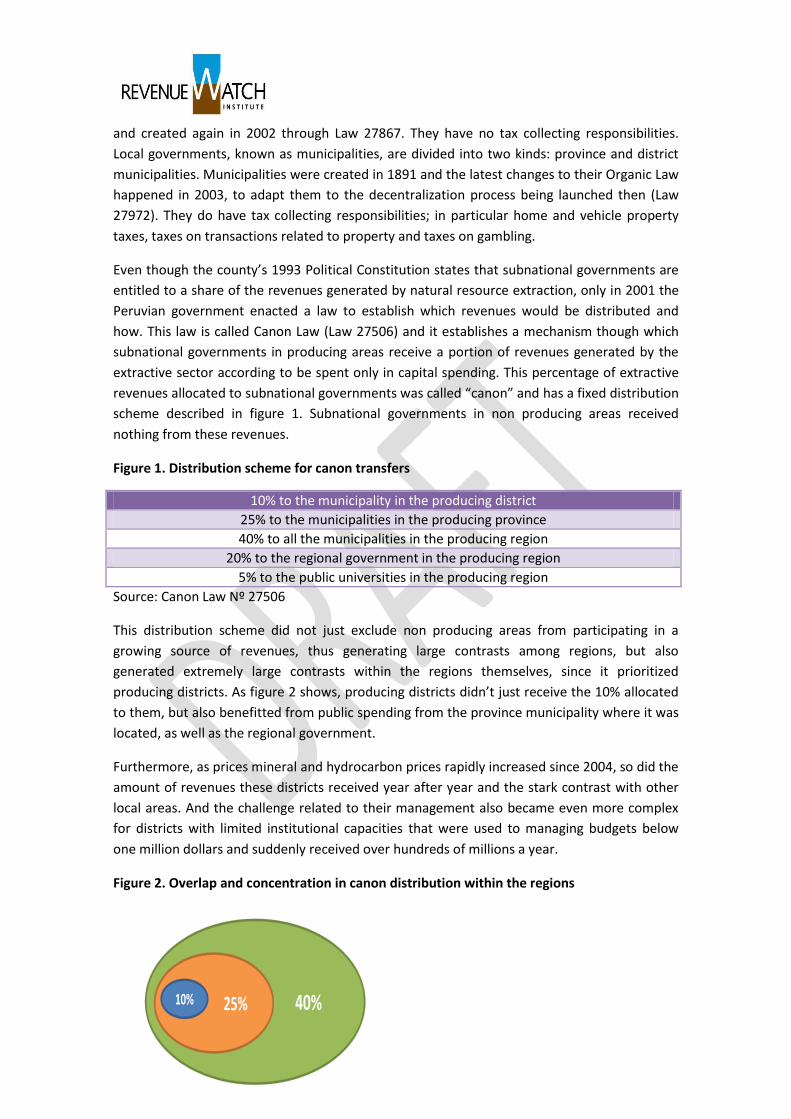
This distribution scheme did not just exclude non producing areas from participating in a
growing source of revenues, thus generating large contrasts among regions, but also
generated extremely large contrasts within the regions themselves, since it prioritized
producing districts. As figure 2 shows, producing districts didn’t just receive the 10% allocated
to them, but also benefitted from public spending from the province municipality where it was
located, as well as the regional government.
Furthermore, as prices mineral and hydrocarbon prices rapidly increased since 2004, so did the
amount of revenues these districts received year after year and the stark contrast with other
local areas. And the challenge related to their management also became even more complex
for districts with limited institutional capacities that were used to managing budgets below
one million dollars and suddenly received over hundreds of millions a year.
Figure 2. Overlap and concentration in canon distribution within the regions
40%25%10%
20% 12.5% 5% 20%12.5%5%
A B
To illustrate this point, we present a couple of examples. Ilabaya is a small district of 4
thousand people in the southern region of Tacna where the Cuajone mine of Southern Peru
Copper Corporation is located. It saw its revenue transfers from mining (canon minero)
multiplied over 37 times between 2004 and 2008. Indeed, in 2004 it received 4 million soles
(USD Equivalence will be interesting) and in 2008, when copper prices hit their record level, it
received 149 million soles. In 2010 transfers were 55.82 million soles, which is lower, but still a
considerable increase compared to the levels prior to 2004.
But the most extreme case in the country is the one of the district of Echarate in the Amazon
area of the Cusco region. This district of 42 thousand people is the location of the largest
natural gas extraction project in the country, the Camisea Project, which began operating in
2004. In this year, Echarate received 7 million soles in transfers, but in 2008, it received 140
million and kept on growing to reach 241 million in 2010.
After almost a decade of receiving and spending these huge amounts of revenues in local
areas, the question about the impact this spending has had on local economies emerges. Have
they improved local living standards? Has the increase in public spending caused distortions in
the local economies such as price hikes in locally consumed goods or labour market
distortions?
This research project focuses on local level economic distortions, trying to determine whether
the expenditure of natural resource revenues by local governments at the district level is a
source of problems that affect the well being and living standards of local populations in
resource rich areas by competing for consumption good and local labour and making them
more expensive.
It is important to note that, although this research focuses on public spending of extractive
revenues, the demand from extractives companies themselves can also generate this kind of
distortions at the local level if they purchase goods locally and hire local workers. We
acknowledge this effect and the fact that it can interact with the impact of public spending by
municipal governments, nevertheless, the surveys we conducted in the field focused
specifically on the impact of public spending and the demand of workers for public
construction projects and other municipal labour since they seem to be a more important
source of distortions.
b. Description of field work and research variables
Field work was conducted between September 12 and October 30, 2011 in the five districts
that receive the highest per capita canon transfers in the country: Ite, Ilabaya, Torata, San
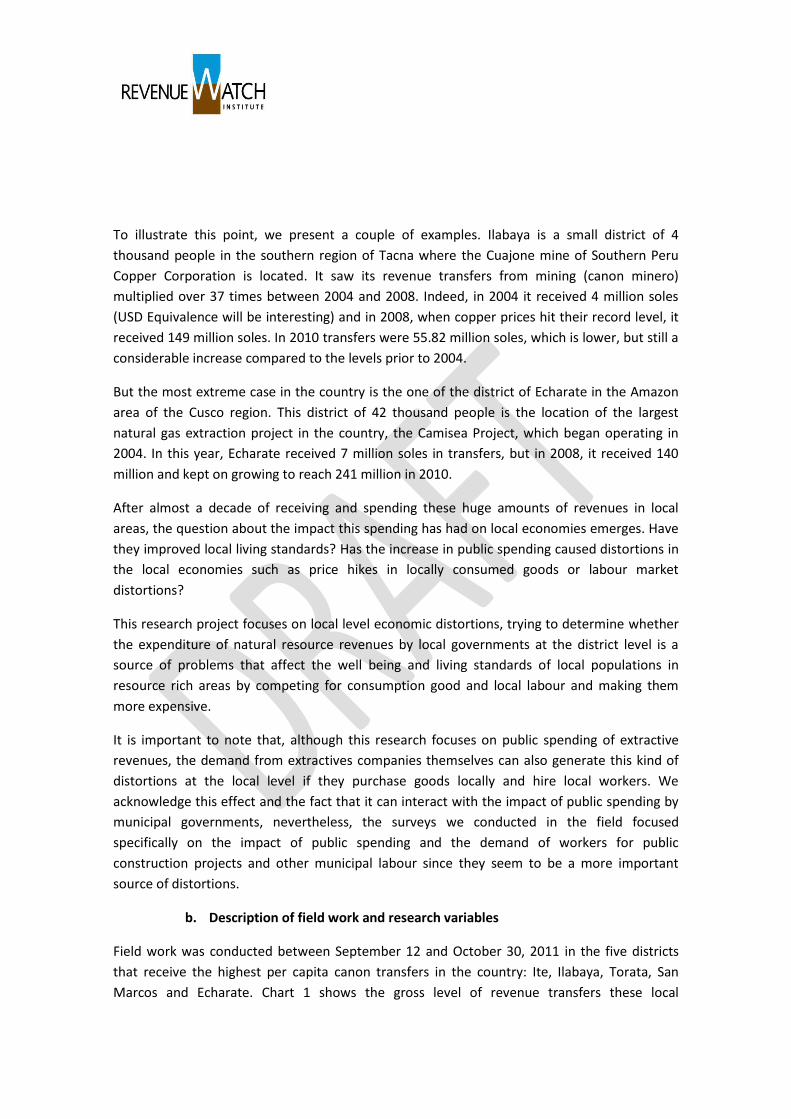
Marcos and Echarate. Chart 1 shows the gross level of revenue transfers these local

governments received between January and October of 2011 and the per capita transfers in
the same period.
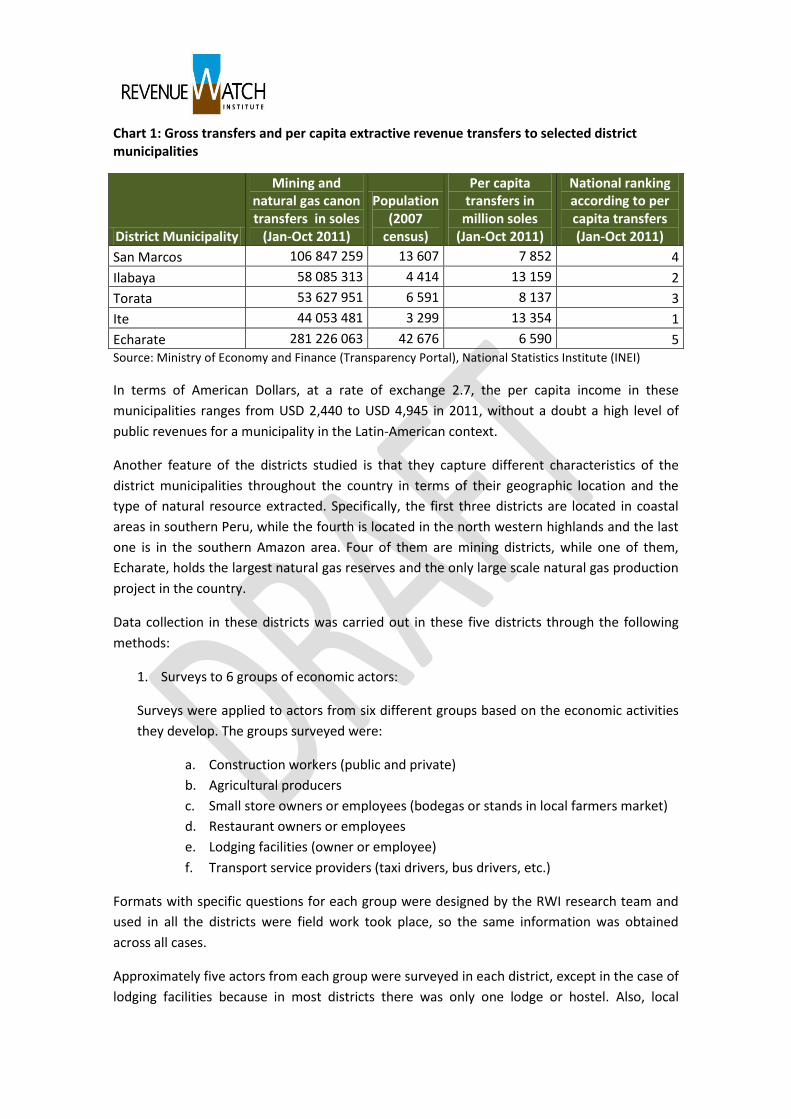
Chart 1: Gross transfers and per capita extractive revenue transfers to selected district municipalities
District Municipality
Mining and natural gas canon transfers in soles
(Jan-Oct 2011)
Population (2007
census)
Per capita transfers in
million soles (Jan-Oct 2011)
National ranking according to per capita transfers (Jan-Oct 2011)
San Marcos 106 847 259 13 607 7 852 4
Ilabaya 58 085 313 4 414 13 159 2
Torata 53 627 951 6 591 8 137 3
Ite 44 053 481 3 299 13 354 1
Echarate 281 226 063 42 676 6 590 5 Source: Ministry of Economy and Finance (Transparency Portal), National Statistics Institute (INEI)
In terms of American Dollars, at a rate of exchange 2.7, the per capita income in these
municipalities ranges from USD 2,440 to USD 4,945 in 2011, without a doubt a high level of
public revenues for a municipality in the Latin-American context.
Another feature of the districts studied is that they capture different characteristics of the
district municipalities throughout the country in terms of their geographic location and the
type of natural resource extracted. Specifically, the first three districts are located in coastal
areas in southern Peru, while the fourth is located in the north western highlands and the last
one is in the southern Amazon area. Four of them are mining districts, while one of them,
Echarate, holds the largest natural gas reserves and the only large scale natural gas production
project in the country.
Data collection in these districts was carried out in these five districts through the following
methods:
1. Surveys to 6 groups of economic actors:
Surveys were applied to actors from six different groups based on the economic activities
they develop. The groups surveyed were:
a. Construction workers (public and private)
b. Agricultural producers
c. Small store owners or employees (bodegas or stands in local farmers market)
d. Restaurant owners or employees
e. Lodging facilities (owner or employee)
f. Transport service providers (taxi drivers, bus drivers, etc.)
Formats with specific questions for each group were designed by the RWI research team and
used in all the districts were field work took place, so the same information was obtained
across all cases.
Approximately five actors from each group were surveyed in each district, except in the case of
lodging facilities because in most districts there was only one lodge or hostel. Also, local
transport was scarce due to the size of the districts, especially in those in Tacna and
Moquegua, where distances are short within the district so there are no buses or taxis. In total,
102 people were surveyed. The breakdown of these surveys by district and group is shown in
chart 2.
Chart 2. Number of people surveyed per group and district
District Agricultural producer
Construction worker
Small stores
Restaurant Transport Lodging Total per district
Ite 5 5 7 3 2 1 23
Ilabaya 4 4 3 2 2 2 17
Torata 4 4 2 2 1 0 13
San Marcos
5 5 5 3 4 2 24
Echarate 5 5 5 5 3 2 25
TOTAL 102
Surveys were conducted with assistance from local researchers. This was extremely important
as they provided insights on local dynamics and made local people more open to responding to
surveys and giving information.
2. Interviews to municipal government officials to request labour and wage data, as well
as their appreciations of the impact of municipal investment of extractive revenues.
The research team scheduled and conducted meetings with key municipal officials to request
information from the municipality databases on the amount of employment generated by the
municipality broken down by the type of jobs (manual labour, cleaning and maintenance jobs,
heads of sites, etc). Information on wages was also requested.
Besides directly requesting data, interviews also included a guide with open questions to
obtain the official’s opinion of municipal investments and their impact on the local economy, if
there was an express priority in the municipality to hire local population and which investment
projects they prioritized (roads, sanitation, others).
A limitation regarding these interviews was that the current administration has only taken
office in January of this year (2011), therefore most officials were new and would only speak
for their own administration. In fact, in most cases they express animosity towards the
previous administration and don’t have data from the previous years systematized or
available. Therefore, in most cases, except in San Marcos, only the most recent data was
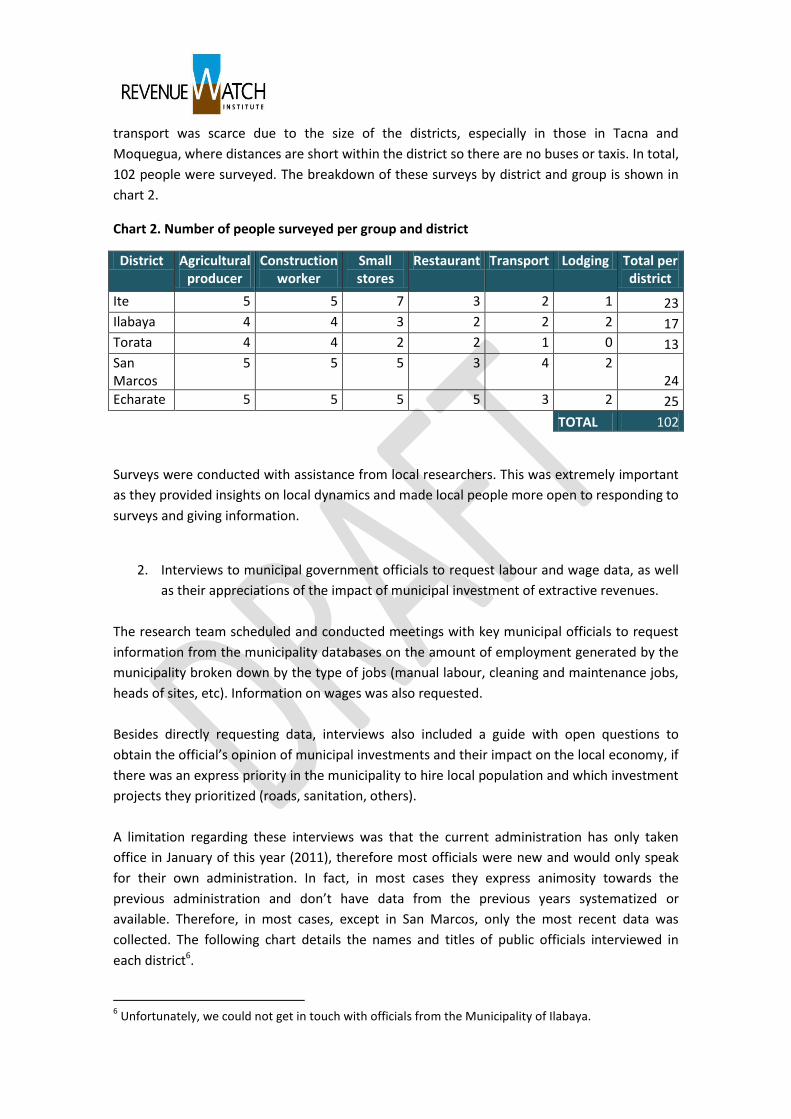
collected. The following chart details the names and titles of public officials interviewed in
each district6.
6 Unfortunately, we could not get in touch with officials from the Municipality of Ilabaya.

Chart 3. Interviewees per district
Ite
Carlos Gonzáles Manager of public infrastructure projects
Rubén Oviedo García Head of Personnel
Rolando Álvarez Head of Statistics and Information Office
Torata
Alexander Bellano Head of Personnel
Luis Colque Guerra Deputy head of the Programming and Investment Office
Juan Madueño Mamani First Alderman and Head of the Environmental Commission
Elisbán Torres Head of Institutional Image Issues
Echarate
Ronny Diaz Tello Head of Personnel
Rick Dennis Guzmán Head of Remuneration
Erick Bustamante Valencia Manager of the Economic Development Office
San Marcos
Leoncio Marcial Asencio Deputy head of human resources
The variables we wanted to obtain from interviews and surveys are the following:
Annual average price level of a basket of goods and services
Annual average of the daily wage levels paid by the agricultural sector
Annual average of the daily wage levels paid by the district municipality
Number of workers hired by the district municipality per year
The 2011 figures were obtained; however, we could not obtain a series for the previous
decade. But we included in the interviews questions about price and wage levels in 2003,
before the boom in canon transfers, as a reference level to compare against and determine
general growth rates.
c. Background on case studies
As mentioned in the previous section, the five districts in which in depth field work was
conducted vary significantly in terms of their geographic location and characteristics, as well as
in the type of extractive resource produced there. In particular, the districts studied are:
Three copper mining districts in the southern coast
One gold mining district in the northern highlands
One natural gas producing district in the south west Amazon area
But despite their differences they hold some common traits, namely high rural poverty rates
and agriculture as the most important economic activity in the local economy.
In the following section we will briefly describe the main characteristics of the five districts
which can provide some insights into the results of the field work presented in the next
paragraphs.
Ite
The district of Ite is located in the Tacna region in the southern coast of Peru, 95 kilometres
away from the capital city of Tacna and right off the “Costanera” highway which runs along the
ocean line. Although land in the coastal area is arid, in the 1930s irrigation projects began in
Tacna and agricultural production increased with crops such as cotton, alfalfa and corn.
Gradually, agricultural producers in Ite bought livestock and focused on producing forage to
feed them and producing milk as their main economic activity. As a result, this town became a
cattle area. Milk produced in Ite is mainly sold to the large scale Peruvian firm, Gloria S.A. who
then processes it. More recently, crops like chilli peppers, paprika and onions for exports have
become important products in the district since they generate relevant levels of income and
adapt to local climate conditions. Figures from the most recent National Census (2007) show
29.1% of Ite’s Economically Active Population (EAP) works in the agricultural sector.
There is no actual mining site in this district, but it is in the influence area of the Toquepala
mine located in Ilabaya. Still, there are reports of environmental impacts, specifically related to
water contamination. Other than this impact, there does not seem to be any direct
relationship between Ite and the mine, except from the fact that it receives revenues from its
activities. According to the interviews and surveys, local population is not hired to work in the
mine and no local goods are purchased by the mine. Data from the 2007 National Census
shows only 57 people (3% of Ite’s total Economically Active Population (EAP) works in mining.
Ilabaya
Also in the Tacna region, the district of Ilabaya is located 133 km from the capital city of Tacna,
but in contrast with Ite, this district is not close to the coast, but to the east of Ite, on the way
to the highlands. It is 1425 metres above sea level, while Ite is only 175 metres above sea level.
Again, agricultural production is the main economic activity, with a wide range of crops grown,
such as alfalfa, corn, onions and fruit. A large part of agricultural production is for subsistence
or sold in nearby markets, especially in the capital city of Tacna.
The Toquepala copper mine, operated by Southern Peru Copper Corporation – a private
mining company property of Mexican capitals – is located in the district of Ilabaya. This is one
of the oldest large scale mining projects in the country whose production began in 1960. As in
Ite, there are reports of water contamination in the district from Southern’s operations.
Although the company has worked to mitigate and reduce its impact on water quality in the
past decade, the local population is still suspicious of their water management methods.
According to the 2007 National Census, 471 people in Ilabaya, 14.4% of the district’s EAP,
works in mining. This is indeed higher a higher percentage than in Ite, but its relative
importance is lower if we consider 40.5% of Ilabaya’s EAP (1022 people) works either as non-
qualified workers or in construction and a significant portion of the projects that demand this
kind of workers are carried out by the district municipality.
Southern Peru provides no information in its annual reports regarding local purchases;
however, locals claimed the mining company did not buy goods or services in Ilabaya.

Torata
Torata is located in the Moquegua region in southern Peru, right next to Tacna. Southern Peru
Copper Corporation has its second mine, Cuajone, in this district. This mine began its
production of copper and molybdenum in 1976. Additionally, this district holds another
important copper deposit named Quellaveco, which is yet to be exploited. Anglo American has
been granted in concession this deposit and plans to begin its operations in 2014. This could
mean even higher revenues for this district of 6 thousand people.
The majority of the population are subsistence farmers: 25.2% of the districts population
works in agriculture and there is an additional 7.32% of the population that is denominated
“eventual worker”, who also work in agriculture during harvest periods. There are reports of
migration from this district to the cities of Moquegua and Arequipa, due to scarce work
opportunities since the 1980s, especially young people who go to study and work in the main
cities. Indeed, there is only primary education in Torata, so Torata’s population is mostly aging
or infants. Recent estimates by the National Statistics Institute (INEI) say the population in
2015 could fall to 5,874 from the 2012 estimate of 6,231.
The mine’s activities have affected the quality of the water supply to Torata, which has been
the cause of conflict and resistance of local populations to the exploitation of the Quellaveco
mining project. The municipality has even developed capacities to measure heavy metal
content and other substances in the water to monitor the mine’s environmental impact and
demand this be corrected.
According to the 2007 Census figures, only 1.4% of Torata’s EAP (48 people) work in the mining
sector; therefore, the impact on labour demand from the mine itself seems to be very limited.
As in the two previous cases (Ite and Ilabaya), Southern Peru provides no information in its
annual reports regarding local purchases, but locals say they do not take place.
San Marcos
In the northern highlands, in the Ancash region, the district of San Marcos is located 125
kilometres away from the capital city of Huaraz at 2,960 metres above sea level. This district is
comparatively larger than Ite and Ilabaya, with a population of approximately 13 thousand
people. Agriculture and cattle are the main sources of income for the population of San
Marcos, and the main products are potatoes and corn for local consumption or to sell to
nearby markets like Huari. This district is also home to the largest copper and zinc open pit
mine in the country, Antamina, a joint venture between BHP Billiton, Xstrata and Teck. The
amount these companies invested is reportedly the highest in a mining project in the history of
Peru.
The CSR activities of Antamina in San Marcos are very relevant. In fact, they have a Fund called
the “Fondo Minero Antamina” though which they channel CSR spending on social and
productive projects. Examples of this spending are the installation of an irrigation system for
120 families and vaccination of 20 thousand cows in the towns within San Marcos.7
Furthermore, Antamina works to provide capacity building and technical assistance to local
producers they choose as their “strategic partners” to strengthen their business and increase
their scale.
As far as direct hires of local population, Census figures say 19.3% of the district’s EAP work in
the mining sector. This is by far the case where the mining company is a relevant source of
labour demand for the local population. Also, Antamina states local purchases are a priority
within the company’s strategy and in its 2010 annual report they state they spent USD 95.5
million in the Ancash region. Even though they don’t say what percentage of these purchases
comes directly from San Marcos, it is still a high level of regional purchases and some of it may
also be affecting the district.
Echarate
Initially an area inhabited by indigenous communities of the “Machiguenga” peoples, the
district was founded after the migration of “colonos” who displaced indigenous peoples and
created haciendas to grow sugar cane and later cocoa and coffee. After an agricultural reform,
workers were granted property of the lands and several cocoa bean and coffee producer
cooperatives were developed. The case of coffee is remarkable. Today there is a large number
of coffee producer cooperatives and 22 of them have joined to form a “second tier”
cooperative called COCLA8. In total, 68% of the district’s EAP works in the agricultural sector,
the highest percentage of all the districts included in this study.
Although agriculture has historically been the sector responsible for the local economic
dynamics, in 2004 the Camisea project located in Echarate, began producing natural gas and
liquids in this district. This is the only large scale natural gas production project in the country
and has generated huge amounts of revenues for the Peruvian government in the form of
income tax and royalties, half of which is transferred to subnational governments in Cusco. The
Camisea project is operated by a consortium, where the largest shareholder is Pluspetrol
(Argentina), together with Hunt Oil, Repsol, SK Energy, Tecpetrol and Sonatrach.
Pluspetrol, the company with the majority stake in the Camisea project, informed in its annual
report that in 2010 it hired 93 people from the local communities adjacent to the project.
Although they do not report on local purchases, research carried out by Armando Mendoza on
local content in the extractive industries in Peru9 suggests these are also negligible because
hydrocarbon companies operating in the Amazon area deliberately restrict their linkages to
local populations to reduce the impact environmental and social impact they have on the
7 http://www.desarrollandoancash.blogspot.com/
8 http://www.coclaperu.com/
9 Mendoza, Armando: “Mejorando los Esquemas de Contenido Local en el Perú: Lecciones y recomendaciones.”
Consultancy for Revenue Watch Institute. January 2011.

nearby territories and populations. This is also supported by 2007 Census figures that say 331
people in the entire district, which represent 2.2% of the EAP, work in the mining and
hydrocarbons sector.
Summary
There are some characteristics we would like to highlight about the districts studied in this
paper. The first is that in all cases, agriculture is the most relevant economic sector for the
local population and, even further, the only viable economic activity other than mining that
exists in these areas. Also, the actual mining company does not have significant linkages to
these local areas either through hiring local population or through purchase of local goods and
services. The case of San Marcos appears to be different, since the company is taking on CSR
initiatives to build capacities among local producers and also directly hiring local population.
This district is the case with the highest reports of local population working in mining.
Therefore, this seems to be the only case in which the influence of the mine itself could also
have an impact on price increases or wage increases.
Existing research has also pointed towards this lack of linkages between mining companies and
local economies. For example, Juana Kuramoto’s research on Newmont’s mine in Cajamarca10
showed the mine’s activities did not have an impact or form linkages with neighbouring
communities. And the aforementioned research by Armando Mendoza, which surveys five
experiences to determine if they have developed any local content policies show these policies
are not being implemented in the sector and, when they are, they have many shortcomings
and do not appear sustainable. This further suggests that the impact that municipalities are
having on local areas through their spending of extractive revenues is more important than the
impact of mining companies themselves.
d. Main findings
This section will try to summarize the main findings obtained from the field work in the five
districts, both through surveys and through interviews with local actors and official data
provided by the municipality.
We will present the information related to the target variables described in section Ib and also
discuss information given by interviewees and local people surveyed on why these variables
have changed, how these changes have affected them and what is being done to face them, as
well as any public policies taken on by the municipal governments to respond to a new
outlook.
i. Prices
Surveys were carried out in Ite, Ilabaya, Torata, Echarate and San Marcos to record the current
prices of relevant consumer goods, as well as get an estimate of price levels before the boom
in canon revenue transfers to these municipalities. The year chosen to make a comparison was
2003. We had to rely on people’s estimates of price levels in one specific year in the past
because there is no price information at the district level produced by the INEI systematically.
It is worth mentioning that other research projects hired by companies themselves to measure
10
Kuramoto, Juana: “Las aglomeraciones productivas alrededor de la minería: el caso de minera Yanacocha S.A” GRADE, 1999.
the impact of the mine on local prices have made the comparison using price levels of a
basket. They were able to do this because the company provided a baseline they carried out
themselves at the beginning of their operations. However, not all companies have this
available or disclose it. The section of the Environmental Impact Assessments related to
socioeconomic impacts does not include prices as one of the variables of interest, therefore
not all companies record this data. For this research, we were not able to obtain these
baselines to compare against since we did not have contacts within the companies who could
inform us whether they exist and provide them if they do. However, we consider using them is
the most adequate way to make the comparison with current prices and in a more in depth
research project we could reach out to company representatives to ask for this information.
The information for both current and 2003 prices was obtained from surveys to workers or
owners of local stores (bodegas), restaurants and transport service providers (taxi or bus
drivers). The summary of the prices collected from these surveys and estimates of the increase
between 2003 and 2011 is presented in chart 4. The price levels in each municipality for each
good are the average price level of all the surveys collected for each good.
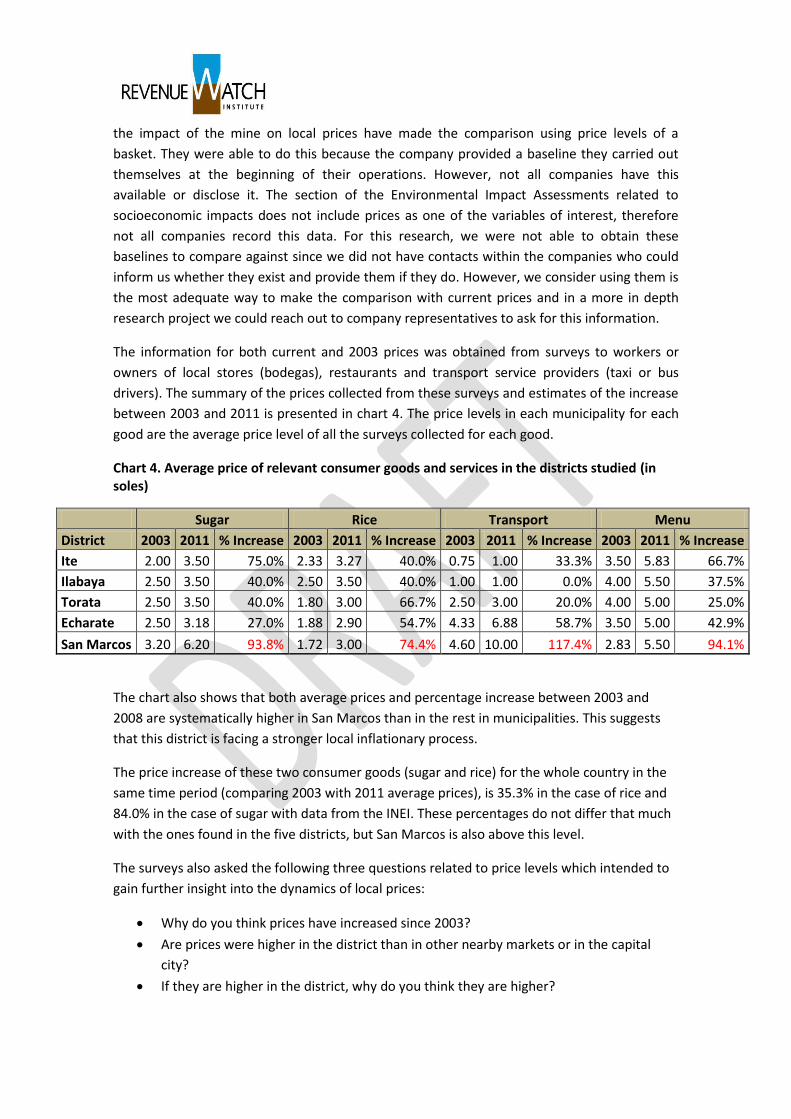
Chart 4. Average price of relevant consumer goods and services in the districts studied (in soles)
Sugar Rice Transport Menu
District 2003 2011 % Increase 2003 2011 % Increase 2003 2011 % Increase 2003 2011 % Increase
Ite 2.00 3.50 75.0% 2.33 3.27 40.0% 0.75 1.00 33.3% 3.50 5.83 66.7%
Ilabaya 2.50 3.50 40.0% 2.50 3.50 40.0% 1.00 1.00 0.0% 4.00 5.50 37.5%
Torata 2.50 3.50 40.0% 1.80 3.00 66.7% 2.50 3.00 20.0% 4.00 5.00 25.0%
Echarate 2.50 3.18 27.0% 1.88 2.90 54.7% 4.33 6.88 58.7% 3.50 5.00 42.9%
San Marcos 3.20 6.20 93.8% 1.72 3.00 74.4% 4.60 10.00 117.4% 2.83 5.50 94.1%
The chart also shows that both average prices and percentage increase between 2003 and
2008 are systematically higher in San Marcos than in the rest in municipalities. This suggests
that this district is facing a stronger local inflationary process.
The price increase of these two consumer goods (sugar and rice) for the whole country in the
same time period (comparing 2003 with 2011 average prices), is 35.3% in the case of rice and
84.0% in the case of sugar with data from the INEI. These percentages do not differ that much
with the ones found in the five districts, but San Marcos is also above this level.
The surveys also asked the following three questions related to price levels which intended to
gain further insight into the dynamics of local prices:
Why do you think prices have increased since 2003?
Are prices were higher in the district than in other nearby markets or in the capital
city?
If they are higher in the district, why do you think they are higher?
Regarding the first question, in the case of food (both goods and meals) 72% of people
surveyed in all districts said this increase was external or imported and that it was not
something unique to the district. However, in San Marcos 42% said it was due to economic
growth in the district since the increase in canon transfers. Two people specifically mentioned
it was due to “the mine”. In Echarate 35% said it was due to more people coming to the district
every day, buying lunch and other goods. In the other districts, people did not mention this as
the reason for the price increase. The general inflation rate in the country between 2003 and
2011 was 20.9%.
In the case of transport costs, 100% of those who declared there was a price increase
attributed it to oil prices. There were some people who said there had been no increase and
they stated this was due to the fact that more vehicles had entered the market due to an
increase in passengers, so supply had followed the increase in demand and kept prices stable.
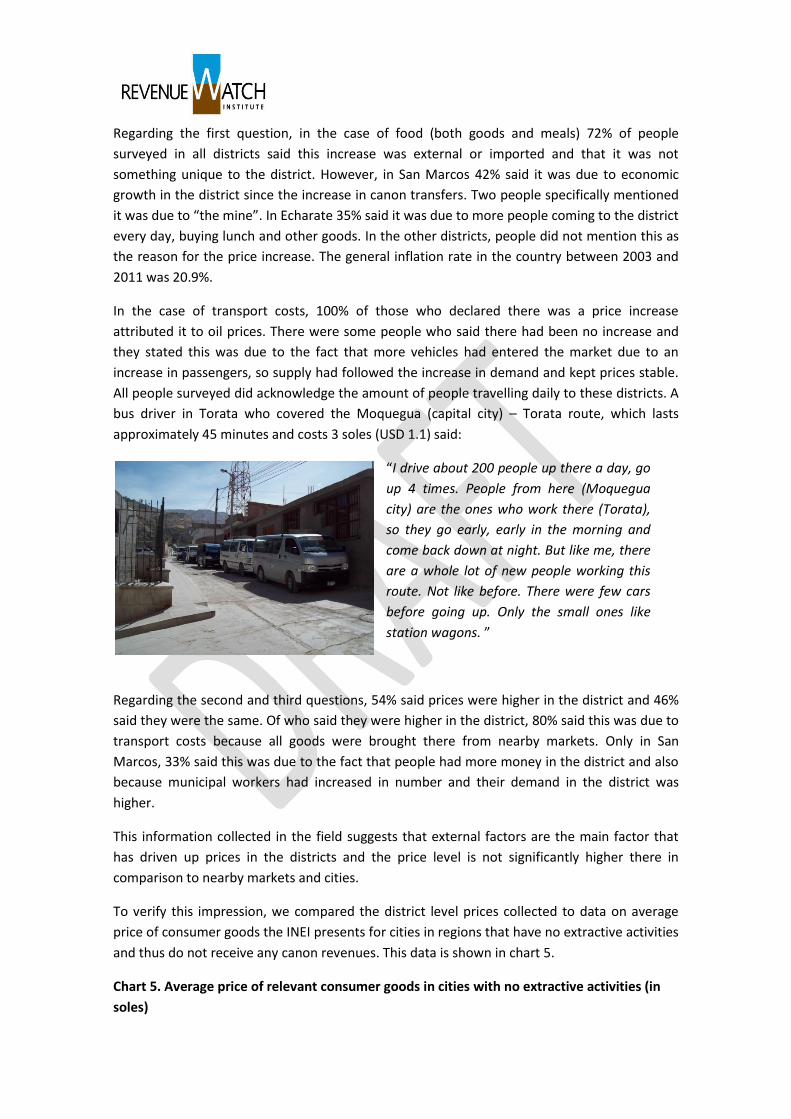
All people surveyed did acknowledge the amount of people travelling daily to these districts. A
bus driver in Torata who covered the Moquegua (capital city) – Torata route, which lasts
approximately 45 minutes and costs 3 soles (USD 1.1) said:
“I drive about 200 people up there a day, go
up 4 times. People from here (Moquegua
city) are the ones who work there (Torata),
so they go early, early in the morning and
come back down at night. But like me, there
are a whole lot of new people working this
route. Not like before. There were few cars
before going up. Only the small ones like
station wagons. ”
Regarding the second and third questions, 54% said prices were higher in the district and 46%
said they were the same. Of who said they were higher in the district, 80% said this was due to
transport costs because all goods were brought there from nearby markets. Only in San
Marcos, 33% said this was due to the fact that people had more money in the district and also
because municipal workers had increased in number and their demand in the district was
higher.
This information collected in the field suggests that external factors are the main factor that
has driven up prices in the districts and the price level is not significantly higher there in
comparison to nearby markets and cities.
To verify this impression, we compared the district level prices collected to data on average
price of consumer goods the INEI presents for cities in regions that have no extractive activities
and thus do not receive any canon revenues. This data is shown in chart 5.
Chart 5. Average price of relevant consumer goods in cities with no extractive activities (in
soles)
Sugar Rice
City 2003 2011 % increase 2003 2011 % increase
Amazonas 1.25 2.74 119.2% 1.53 2.36 54.2%
Lambayeque 1.17 2.52 115.4% 1.26 2.28 81.0%
San Martin 1.17 2.83 141.9% 1.06 2.39 125.5% Source: National Statistics Institute (INEI), Average consumer prices.
This information shows that prices in the five districts studied, compared to cities in non
producing regions, were in average 1.03 soles higher in 2003 and 1.04 cents higher in 2011.
Therefore, there seems to be no evidence that there are local inflationary processes in the
districts studied. If canon transfers had generated local inflation, the price difference with the
main cities in the region would be higher in 2011, but the gap seems to be stable.
However, as mentioned before, this analysis is limited because it is only based on two
consumer goods whose prices were available for the main cities. The price difference in San
Marcos for one of these goods (sugar) has increased well over its increase in Huaraz, which
could suggest there is inflation in some goods.
A more in depth study over time that collects information on a whole basket of consumer
goods representative to each district is needed to have certain results about the existence or
lack of local inflation.
ii. Wage rates
Information of current wage rates was collected both through surveys and though requests to
municipal officials who could provide access to databases. Unfortunately the municipalities
were not able this information in time, but only for the past two years.
The surveys asked about the wages in municipality infrastructure projects of cleaning and
maintenance jobs, but most answers were that there was no work in the municipality before
canon transfers began (2003). Therefore our analysis is limited here to the comparison of
current wage levels (2011) in municipal jobs and in the agricultural sector, which is the most
important source of work and income for the population of these districts.
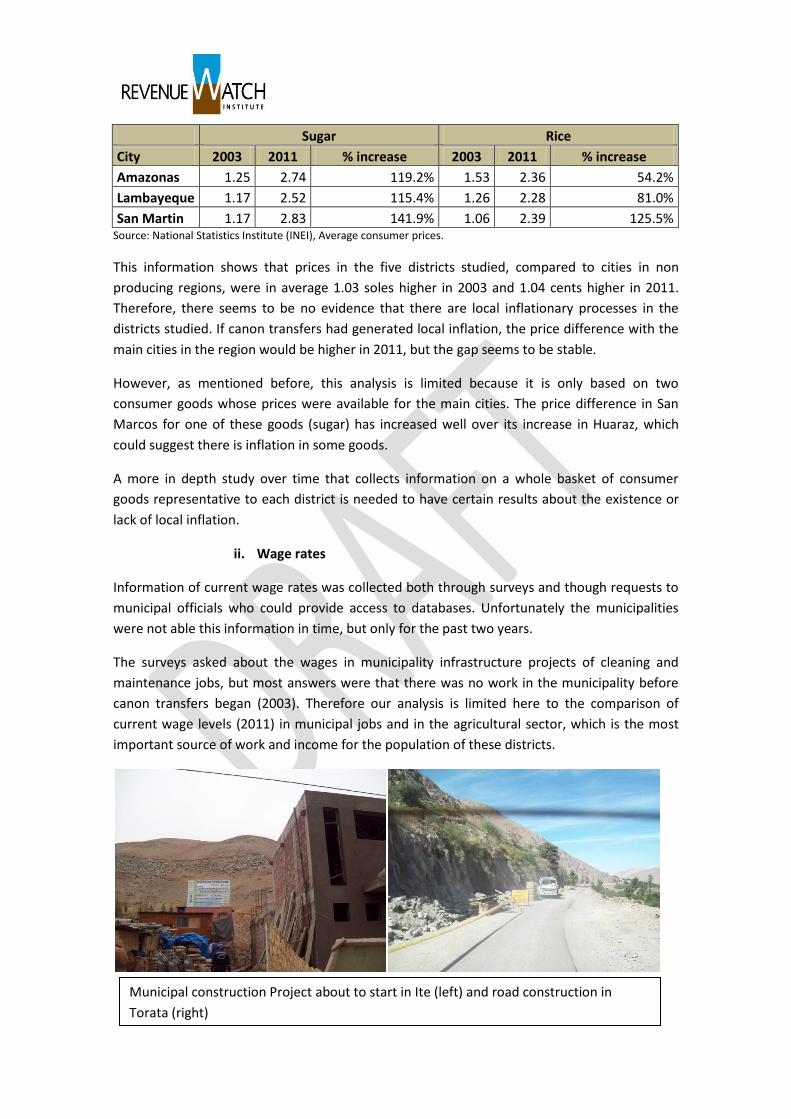
Municipal construction Project about to start in Ite (left) and road construction in
Torata (right)
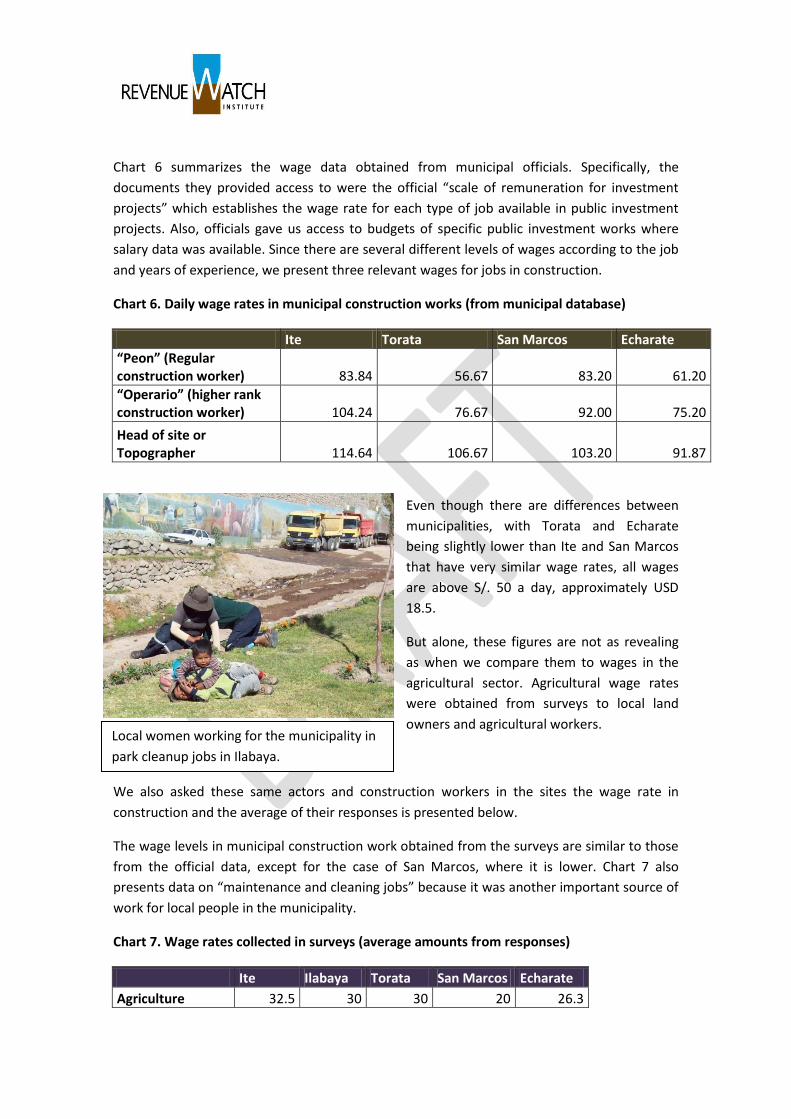
Chart 6 summarizes the wage data obtained from municipal officials. Specifically, the
documents they provided access to were the official “scale of remuneration for investment
projects” which establishes the wage rate for each type of job available in public investment
projects. Also, officials gave us access to budgets of specific public investment works where
salary data was available. Since there are several different levels of wages according to the job
and years of experience, we present three relevant wages for jobs in construction.
Chart 6. Daily wage rates in municipal construction works (from municipal database)
Ite Torata San Marcos Echarate
“Peon” (Regular construction worker) 83.84 56.67 83.20 61.20
“Operario” (higher rank construction worker) 104.24 76.67 92.00 75.20
Head of site or Topographer 114.64 106.67 103.20 91.87
Even though there are differences between
municipalities, with Torata and Echarate
being slightly lower than Ite and San Marcos
that have very similar wage rates, all wages
are above S/. 50 a day, approximately USD
18.5.
But alone, these figures are not as revealing
as when we compare them to wages in the
agricultural sector. Agricultural wage rates
were obtained from surveys to local land
owners and agricultural workers.
We also asked these same actors and construction workers in the sites the wage rate in
construction and the average of their responses is presented below.
The wage levels in municipal construction work obtained from the surveys are similar to those
from the official data, except for the case of San Marcos, where it is lower. Chart 7 also
presents data on “maintenance and cleaning jobs” because it was another important source of
work for local people in the municipality.
Chart 7. Wage rates collected in surveys (average amounts from responses)
Ite Ilabaya Torata San Marcos Echarate
Agriculture 32.5 30 30 20 26.3
Local women working for the municipality in
park cleanup jobs in Ilabaya.

Municipal construction work 86.4 82 77.5 52 58
Municipal maintenance jobs 63.8 58.8 55 40 49
The figures collected in the surveys show that wages in municipal construction are at least
twice as much as in agriculture in all five municipalities.
But an additional fact that came out of the interviews and surveys was that the wage rates in
agriculture have actually been pulled up by the higher wages in municipal jobs (even
maintenance and cleaning jobs are better paid than agricultural jobs). Although the surveys
asked about past wage levels in agriculture (in 2003), we cannot present this information
systematized because most workers had not worked for that long and did not know how much
they paid before. Most landowners surveys could not give a ballpark figure for 2003 either and
those who did gave very different amounts.
But some testimonies were enlightening to show that wage levels in agriculture have had to
increase due to the level of municipal wages.
“Paying jornales today is too expensive, no
longer pays off to hire people. Before it was
S/. 7, now S/. 25, like the Municipality. It’s too
expensive and we can’t afford it.” (Abdon
Aliaga, small agricultural producer from
Echarate)
A recent study carried out by the Instituto del Perú of the San Martin University (USMP) 11 also
gathered information on wage rates in the agricultural sector in the last decade through
surveys in 45 rural districts. The information they obtained says the average wage rate in
agriculture has increased from 11.4 soles in 2001 to 19.6 soles in 2011. They attribute this
increase to the improvement in communications, especially the improvement in road
infrastructure and the fall in the time taken to travel from one place to another.
11
Richard Webb, Presentación “La Revolución Comunicativa y el Desarrollo Rural” disponible en http://institutodelperu.org.pe
Local chili pepper producers in Ite stuffing
their products in bags to sell abroad.
According to these figures, wages in agriculture are increasing all over the country, and not just
because of increased demand in producing regions. However, the wage rates found in that
study are 10 soles lower than the wage rates we found in our research (an average of 27.7
soles an hour). Therefore, according to this information, it seems that wages in agriculture in
the 5 districts visited have grown even more than in the rest of the country. This suggests that
there is indeed a distortion caused by higher labor demand from the municipality.
The responses to the surveys also suggest the high levels of wage rates in the municipality are
indeed generating a distortion at the local level. 100% of people surveyed said workers are
moving from agriculture to municipal jobs and 79% of agricultural producers interviewed said
they had at some point gone to work in the municipality themselves. This has created labour
shortages in the agricultural sector.
One additional point obtained from interviews was the importance of job stability. Locals said
municipal work offers a secure pay check at the end of the month for a given period of time (6
months, a year). The agricultural sector is less safe and seasonal; therefore this is a key factor
to decide to move to this work, even if salaries were not very different. 27% of people
surveyed said “stability in time” was the reason why people leave agriculture and go to work
for the municipality, and not wages.
Finally, people acknowledged that municipal works were only temporary and this is why land
owners do not sell or rent out their land. Instead, they leave them barren or work outside their
work hours in municipal jobs or resort to family labour. 60% of people surveyed said their
strategy to face the labour shortage was to leave their land barren, while 30% say they work
on it nights or weekends. The remaining 10% were producers from Ite who mentioned they
requested workers from the municipality and sold their cows to cut costs.
In summary, wages are definitely a strong factor generating wage distortions at the local level,
but seasonality is an additional factor that explains the important migration of workers from
agriculture to the municipality and also explains why agricultural landowners don’t sell or rent
out their lands.
However, in districts where cattle was an important activity (Ite, Ilabaya, San Marcos and
Torata) people did report they had sold their cattle because costs to maintain them were too
high in comparison for what they received for selling milk or meat. In the case of Ite, local
owners sold their milk to the largest national milk processing company, Gloria, for only 9 cents
per litre (in local currency), which was extremely low, compared to the costs they had to keep
them.
iii. Employment
Employment databases in municipalities proved to be complex. We could only obtain this
information in two municipalities: Torata and Echarate, because databases are not
disaggregated or available for past years.
The two figures we could obtain show the extent of the importance of the municipality’s
demand for workers. Indeed, in Torata, municipal projects carried out only between January
and September of 2011 employed 2,312 people. In Echarate there was 2,739 people employed
in municipal works between January and September 2011, while in 2010, Echarate’s district
municipality hired 2,813 workers. In terms of the total Economically Active Population (EAP),
this is quite significant. In Torata it represents 80.7%. In Echarate the percentage is lower, due
partly to the larger relative population of the district, but still important: 18.6%.
The origin of workers is a very important issue locally. Wage levels have evidently generated
migration to these districts from other provinces or regions. However it is not always people
moving to actually live in the district. Some people commute from the nearby cities and others
live in municipal hostels that rent out rooms for months.
Ite has a municipal lodge which was completely occupied when field work was carried out. The
research teams asked about prices for rooms and they provided a monthly rate, but said the
lodge was full and rooms would be taken the rest of the year because they were for “long term
stays” by municipal staff. It is therefore obvious that several people from outside the district
are working in the municipality.
Municipality officials say it is their policy to hire local workers, even establishing as a
requirement that the worker’s ID shows he is from the district. However, to bypass this
requirement, people have changed their addresses in the National Registry (RENIEC), but don’t
actually live there. This is why locals say the population figure given by the INEI is inflated. In
Ite for example, we heard several times that the number of people that were in fact from Ite
were only 800 people, while the figure from INEI is 3,299 people. This claim is very plausible
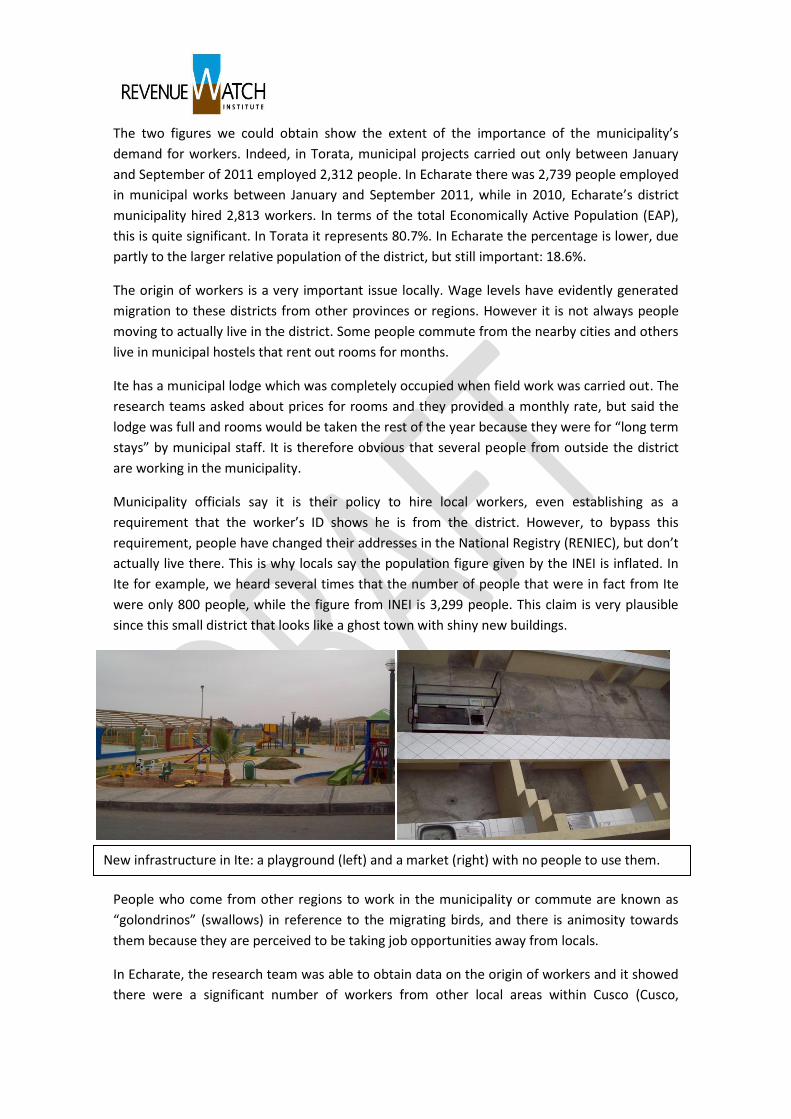
since this small district that looks like a ghost town with shiny new buildings.
People who come from other regions to work in the municipality or commute are known as
“golondrinos” (swallows) in reference to the migrating birds, and there is animosity towards
them because they are perceived to be taking job opportunities away from locals.
In Echarate, the research team was able to obtain data on the origin of workers and it showed
there were a significant number of workers from other local areas within Cusco (Cusco,
New infrastructure in Ite: a playground (left) and a market (right) with no people to use them.
Acomayo, Calca, Urubamba, Sicuani, Anta, Paucartambo) as well as from cities outside the
Cusco (Huancayo, Puno, Andahuaylas, Ucayali, Loreto, Ancash, Arequipa, Moquegua, Ica).
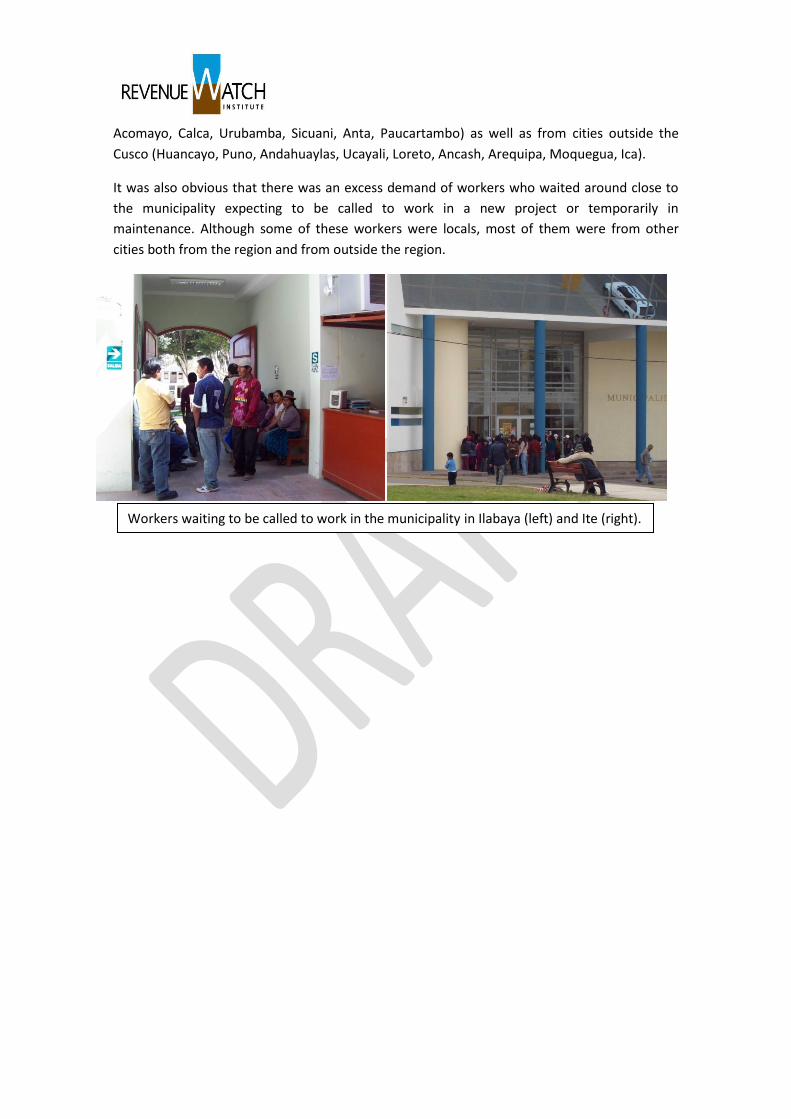
It was also obvious that there was an excess demand of workers who waited around close to
the municipality expecting to be called to work in a new project or temporarily in
maintenance. Although some of these workers were locals, most of them were from other
cities both from the region and from outside the region.
Workers waiting to be called to work in the municipality in Ilabaya (left) and Ite (right).
iv) Other symptoms of the resource curse
a. Fiscal laziness
One of the manifestations of the natural resource curse is the fact that governments don’t
have an incentive to collect taxes from their citizens because they receive revenues from the
EIs with no effort of their own. At the subnational government the same thing takes place. In
Peru, Regional Governments cannot collect taxes, but Municipalities do. Therefore, we wanted
to determine, with data available on the Ministry of Finance’s transparency portal, it this was
taking place in Peru.
Data on tax collection by municipality is available, but only since 2007. Still, these figures show
that, during the period of highest commodity prices and highest canon transfers, the five
richest districts still increased their tax collection, as shown in chart 8.
It is important to mention that one of the factors that have allowed these 5 municipalities to
collect growing amounts of taxes is indeed an increase in the local economic activity. People
now receiving higher wages are buying properties, for example. So the increase might not be a
result of an increased effort to collect taxes taken on by the municipality, but just due to the
better local economic context, which also has to do with the dynamics of the mining and
hydrocarbons sector and the revenues generated.
Given the fact that theses municipalities collected very small amounts of taxes before the
boom, any increase would seem very significant if we only looked at the growth rate.
Therefore, to compare the level of tax collection with all the municipalities in the country, we
use the per capita level of tax collection.
Certainly, these 5 municipalities have per capita tax collection levels that are below the
average country level. However, in recent years, three of them (Torata, Echarate and San
Marcos) have more than doubled their collection between 2007 and 2011. On the other hand,
per capita tax collection in Ite and Ilabaya has not increased much and is still far from the
average national level.
This could suggest that in these two municipalities, whose population is small and have the
largest per capita canon transfers, fiscal laziness could be taking place.
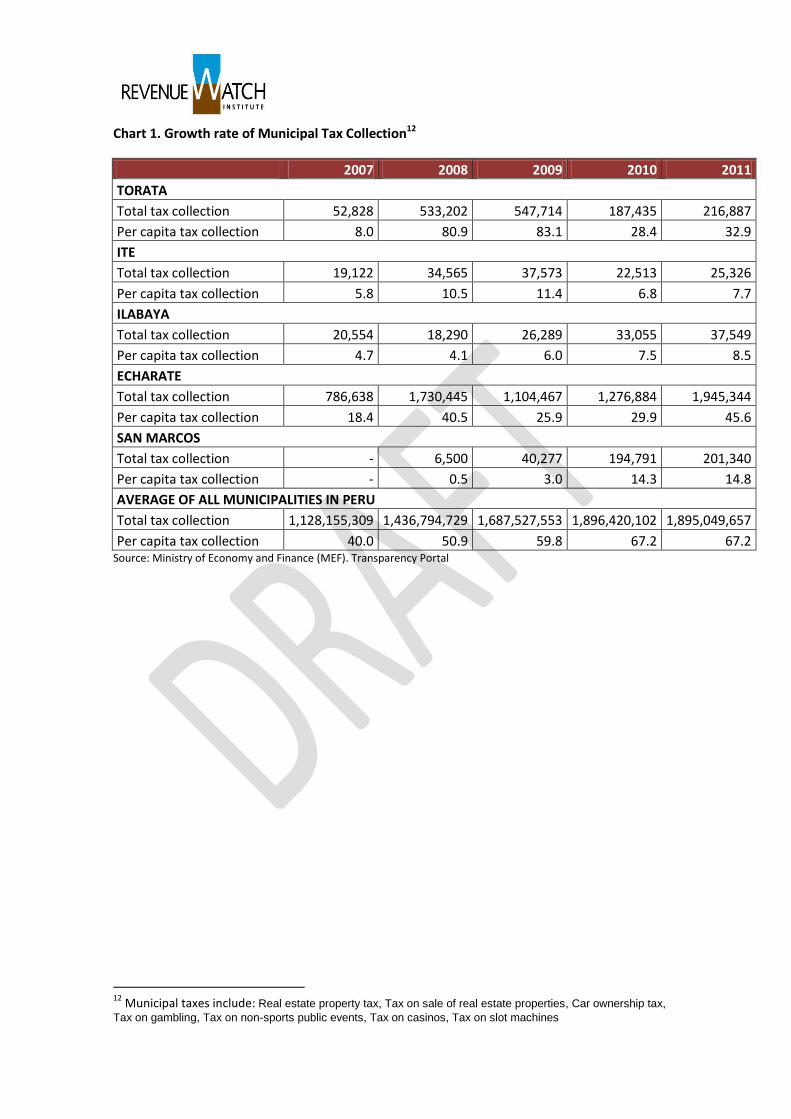
Chart 1. Growth rate of Municipal Tax Collection12
2007 2008 2009 2010 2011
TORATA
Total tax collection 52,828 533,202 547,714 187,435 216,887
Per capita tax collection 8.0 80.9 83.1 28.4 32.9
ITE
Total tax collection 19,122 34,565 37,573 22,513 25,326
Per capita tax collection 5.8 10.5 11.4 6.8 7.7
ILABAYA
Total tax collection 20,554 18,290 26,289 33,055 37,549
Per capita tax collection 4.7 4.1 6.0 7.5 8.5
ECHARATE
Total tax collection 786,638 1,730,445 1,104,467 1,276,884 1,945,344
Per capita tax collection 18.4 40.5 25.9 29.9 45.6
SAN MARCOS
Total tax collection - 6,500 40,277 194,791 201,340
Per capita tax collection - 0.5 3.0 14.3 14.8
AVERAGE OF ALL MUNICIPALITIES IN PERU
Total tax collection 1,128,155,309 1,436,794,729 1,687,527,553 1,896,420,102 1,895,049,657
Per capita tax collection 40.0 50.9 59.8 67.2 67.2 Source: Ministry of Economy and Finance (MEF). Transparency Portal
12
Municipal taxes include: Real estate property tax, Tax on sale of real estate properties, Car ownership tax,
Tax on gambling, Tax on non-sports public events, Tax on casinos, Tax on slot machines
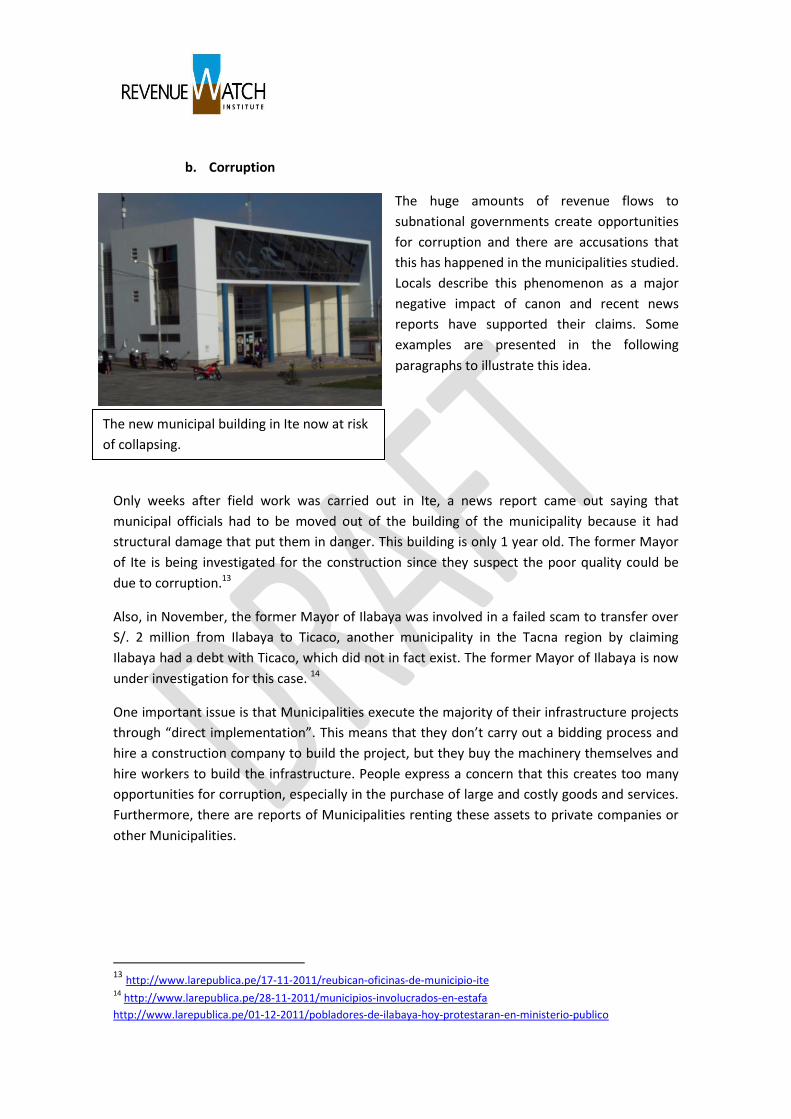
b. Corruption
The huge amounts of revenue flows to
subnational governments create opportunities
for corruption and there are accusations that
this has happened in the municipalities studied.
Locals describe this phenomenon as a major
negative impact of canon and recent news
reports have supported their claims. Some
examples are presented in the following
paragraphs to illustrate this idea.
Only weeks after field work was carried out in Ite, a news report came out saying that
municipal officials had to be moved out of the building of the municipality because it had
structural damage that put them in danger. This building is only 1 year old. The former Mayor
of Ite is being investigated for the construction since they suspect the poor quality could be
due to corruption.13
Also, in November, the former Mayor of Ilabaya was involved in a failed scam to transfer over
S/. 2 million from Ilabaya to Ticaco, another municipality in the Tacna region by claiming
Ilabaya had a debt with Ticaco, which did not in fact exist. The former Mayor of Ilabaya is now
under investigation for this case. 14
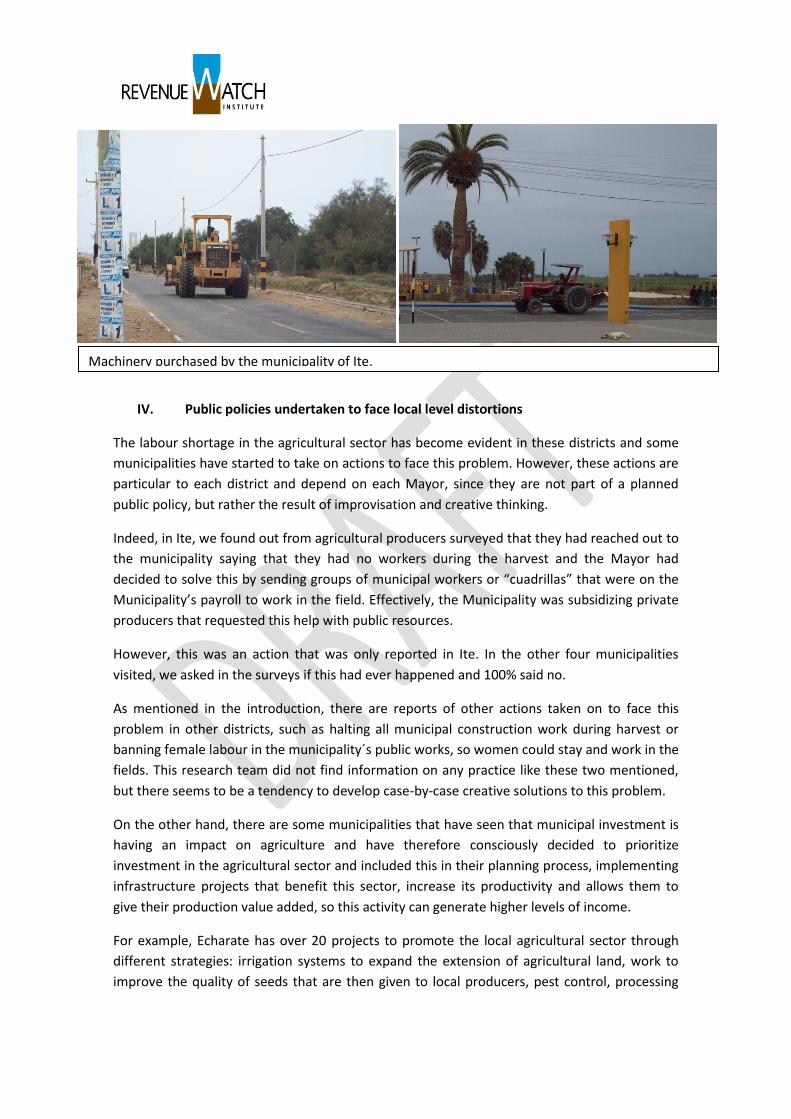
One important issue is that Municipalities execute the majority of their infrastructure projects
through “direct implementation”. This means that they don’t carry out a bidding process and
hire a construction company to build the project, but they buy the machinery themselves and
hire workers to build the infrastructure. People express a concern that this creates too many
opportunities for corruption, especially in the purchase of large and costly goods and services.
Furthermore, there are reports of Municipalities renting these assets to private companies or
other Municipalities.
13 http://www.larepublica.pe/17-11-2011/reubican-oficinas-de-municipio-ite 14
http://www.larepublica.pe/28-11-2011/municipios-involucrados-en-estafa
http://www.larepublica.pe/01-12-2011/pobladores-de-ilabaya-hoy-protestaran-en-ministerio-publico
The new municipal building in Ite now at risk
of collapsing.
IV. Public policies undertaken to face local level distortions
The labour shortage in the agricultural sector has become evident in these districts and some
municipalities have started to take on actions to face this problem. However, these actions are
particular to each district and depend on each Mayor, since they are not part of a planned
public policy, but rather the result of improvisation and creative thinking.
Indeed, in Ite, we found out from agricultural producers surveyed that they had reached out to
the municipality saying that they had no workers during the harvest and the Mayor had
decided to solve this by sending groups of municipal workers or “cuadrillas” that were on the
Municipality’s payroll to work in the field. Effectively, the Municipality was subsidizing private
producers that requested this help with public resources.
However, this was an action that was only reported in Ite. In the other four municipalities
visited, we asked in the surveys if this had ever happened and 100% said no.
As mentioned in the introduction, there are reports of other actions taken on to face this
problem in other districts, such as halting all municipal construction work during harvest or
banning female labour in the municipality´s public works, so women could stay and work in the
fields. This research team did not find information on any practice like these two mentioned,
but there seems to be a tendency to develop case-by-case creative solutions to this problem.
On the other hand, there are some municipalities that have seen that municipal investment is
having an impact on agriculture and have therefore consciously decided to prioritize
investment in the agricultural sector and included this in their planning process, implementing
infrastructure projects that benefit this sector, increase its productivity and allows them to
give their production value added, so this activity can generate higher levels of income.
For example, Echarate has over 20 projects to promote the local agricultural sector through
different strategies: irrigation systems to expand the extension of agricultural land, work to
improve the quality of seeds that are then given to local producers, pest control, processing
Machinery purchased by the municipality of Ite.
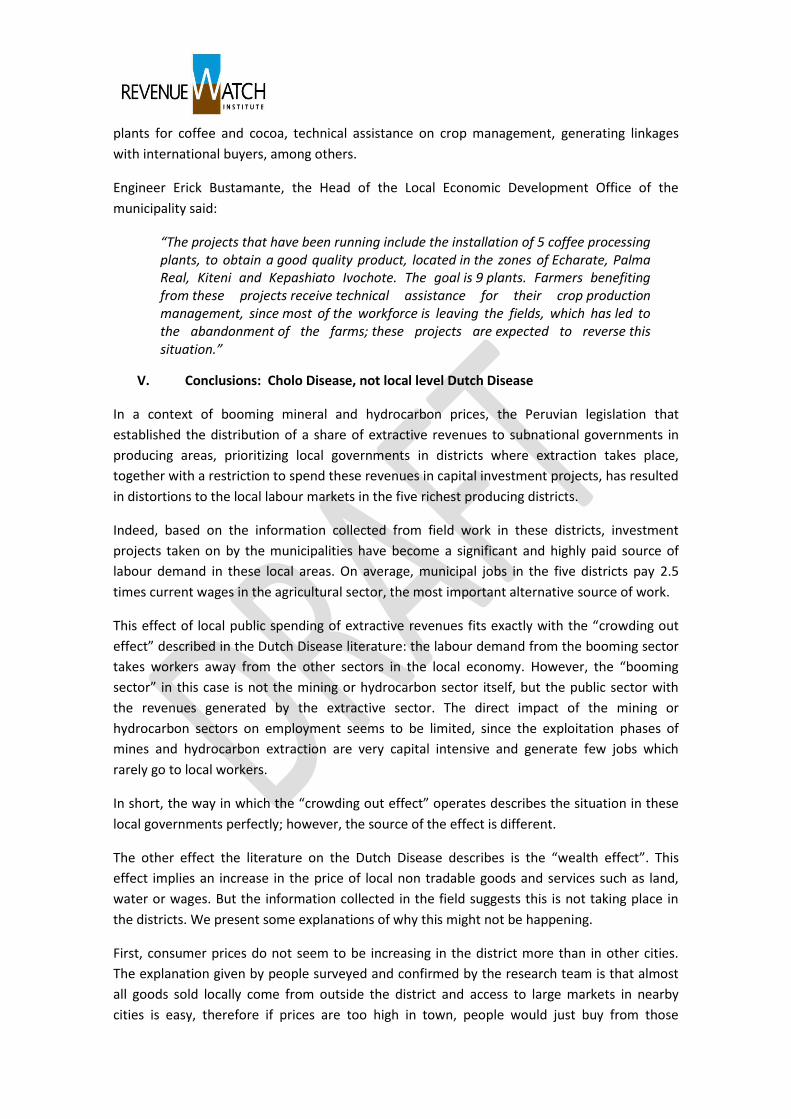
plants for coffee and cocoa, technical assistance on crop management, generating linkages
with international buyers, among others.
Engineer Erick Bustamante, the Head of the Local Economic Development Office of the
municipality said:
“The projects that have been running include the installation of 5 coffee processing plants, to obtain a good quality product, located in the zones of Echarate, Palma Real, Kiteni and Kepashiato Ivochote. The goal is 9 plants. Farmers benefiting from these projects receive technical assistance for their crop production management, since most of the workforce is leaving the fields, which has led to the abandonment of the farms; these projects are expected to reverse this situation.”
V. Conclusions: Cholo Disease, not local level Dutch Disease
In a context of booming mineral and hydrocarbon prices, the Peruvian legislation that
established the distribution of a share of extractive revenues to subnational governments in
producing areas, prioritizing local governments in districts where extraction takes place,
together with a restriction to spend these revenues in capital investment projects, has resulted
in distortions to the local labour markets in the five richest producing districts.
Indeed, based on the information collected from field work in these districts, investment
projects taken on by the municipalities have become a significant and highly paid source of
labour demand in these local areas. On average, municipal jobs in the five districts pay 2.5
times current wages in the agricultural sector, the most important alternative source of work.
This effect of local public spending of extractive revenues fits exactly with the “crowding out
effect” described in the Dutch Disease literature: the labour demand from the booming sector
takes workers away from the other sectors in the local economy. However, the “booming
sector” in this case is not the mining or hydrocarbon sector itself, but the public sector with
the revenues generated by the extractive sector. The direct impact of the mining or
hydrocarbon sectors on employment seems to be limited, since the exploitation phases of
mines and hydrocarbon extraction are very capital intensive and generate few jobs which
rarely go to local workers.
In short, the way in which the “crowding out effect” operates describes the situation in these
local governments perfectly; however, the source of the effect is different.
The other effect the literature on the Dutch Disease describes is the “wealth effect”. This
effect implies an increase in the price of local non tradable goods and services such as land,
water or wages. But the information collected in the field suggests this is not taking place in
the districts. We present some explanations of why this might not be happening.
First, consumer prices do not seem to be increasing in the district more than in other cities.
The explanation given by people surveyed and confirmed by the research team is that almost
all goods sold locally come from outside the district and access to large markets in nearby
cities is easy, therefore if prices are too high in town, people would just buy from those
markets. Very little local production is sold in the district, except in Echarate, the only one of
these five districts that actually has a local farmers market. Still, a lot of what is sold in this
market is brought from outside the district because production in the district is poor, for their
own subsidence or is sold abroad (for example coffee and cocoa produced in Echarate is not
sold there, it is only exported).
Second, prices of land are not increasing more than in other cities. This is mainly because there
is no local land market developed in these districts. The majority of parcels of land are very
small and landowners are not willing to abandon their land, they would rather work on them
partially or leave them barren for some time, but will not sell or rent them. And since the
“booming sector” in this case is not the mining or hydrocarbon sector, but the public sector, it
does not create a demand for land which would otherwise drive up prices.
Third, prices of local services (meals, transport) do not increase more than in other cities
because in these cases, even though demand is higher due to a larger number of people
travelling daily to the districts, the supply has also increased with both local workers and
workers from other cities. This offsets the increase in demand and therefore there is no
increase in prices.
Finally, the increase in labour demand from the municipality increases, but even though there
is an increase in the supply of workers (labour migration from outside the district), this does
not offset the increase in wages because, since the “booming sector” is public, wages are fixed
at a certain level and are not subject to market forces.
This analysis leads us to think that this is not the classic Dutch Disease, but a different kind of
disease we have named the “Cholo Disease”. The main reason to state this is indeed different
is the fact that the “booming sector”, the source of all the effects on the local area is the local
public sector and this introduces particular traits into the analysis. Especially, the fact that
wages are fixed at levels that are significantly over the market wages in other sector is the
main trigger of the local labour market distortions, the most important effect in the local
economy. If the “booming sector” was private, increase in supply would offset the wage
increase and the most important distortion would be a large influx of migrant workers to these
districts.
Of course, it is also possible that some of these producing areas could also be affected by the
nore classical Dutch Disease. This could be the case of, for example, coffee producers of
Echarate, in La Convencion, Cusco. As we have seen, they are for sure impacted by the Cholo
Disease, but it is probable that they also affected by the appreciation of the exchange rate as
the dollars they get for their coffee in the international markets loses value in face of the soles
they need to pay their local costs, including increasingly expensive wages. Further field
research in which export oriented agriculture happens along with minerals or hydrocarbons
production should tell us if both phenomena –Dutch and Cholo Disease- might be happening at
the same time.
VI. Other empirical research
Today, there are a growing number of studies carried out in Peru linking mining with better
living conditions of the local populations. Some of them say that the impact is insignificant or
differentiated between urban and rural areas, while others do find evidence of improvement
in general.
For instance, research by Zegarra (2007), which carried out an impact assessment on
households in mining districts, using both data from the National Household Survey (ENAHO)
and surveys, found "a positive association of mining revenue and expenditure of urban
households, but not for the case of rural families.”
A recent study by Aragon and Rud (2011) for the case of the Yanacocha mine, says that mining
has a positive impact on the incomes of local areas and markets near the mine. The impact is
generated through the increase in the price of locally produced goods which are purchased by
the mine.
Although there are few studies on the impact of canon revenues on local areas, Aragon and
Rud study also evaluated this variable and discard that the positive impact on household
income is generated by canon transfers that municipalities spend.
This would contradict our findings because in fieldwork in five districts, we found that the links
between the mining sector and the local economy were scarce, while local public spending of
canon revenues had more relevance in the local economy.
It is therefore important to carry out further research on the linkages of mining and
hydrocarbon companies in local economies through purchases of local goods and services, as
well as the interaction of this effect with the expenditure of canon revenues by local
governments.
VII. Policy recommendations
The distortions at the local level on which we have collected information stem from the
legislation related to the distribution and use of extractive resources, namely, the fact that the
producing district receives a large percent of the extractive rent, which is in turn, restricted to
capital expenditure and associated maintenance works. As prices and revenues rose
exponentially, district municipalities had to race to build all the infrastructure they could to
spend their rapidly growing budgets. To do so, they bought machinery and hired an increasing
number of workers, paying them very high wages.
The main source of the distortion is national legislation. However, we have also found at least
two cases of local level policies in response to the problems generated by the national policies
regarding the distribution and use of the extractive rent. Therefore, we consider policies
should be taken on not only at the national level, but also at the local level to deal with the
distortions.
Both at the national and local levels, it is important to make the distinction between short and
long term policies.
A. Long term national policies
1. Amend legislation regarding the distribution of EI revenues
The obvious solution would be to amend the legislation on distribution of extractive revenues,
and this is indeed being discussed in the country. However this is far from simple. Peru has
already experienced violent conflicts related to changes in the distribution between regions,
like the one between Tacna and Moquegua in 2008, and has learnt that this can be very costly
both socially and politically. Producing regions are not willing to give up their canon, since they
see it as a right.
But there is a growing consensus that the distribution scheme within each producing region
should be amended, especially the amount allocated to producing districts, which is
considered disproportionate. This change will not be an easy task either because producing
districts consider the revenues they receive are a compensation for the impacts
(environmental and social) they have to deal with. But with a better distribution scheme that
doesn’t generate as many overlaps as the current one; they could still receive large transfers
and be compensated without the amount being so extreme. And this process should be taken
forward in a participatory manner, with a lot of debate in each region.
2. Amend legislation regarding the focus on infrastructure spending
Current legislation on the use of extractive revenues states they can only be used in capital
expenditure, thus creating an incentive to spend all these revenues in building infrastructure,
especially roads, even when this is not the kind of expenditure that will have the most impact
on the local population’s wellbeing.
Furthermore, municipalities, especially rural ones, generally have a low level of institutional
capacities and therefore find building infrastructure as the easiest way to spend the revenues
they receive. Since the excessive focus on infrastructure projects is one of the factors
generating the distortions at the local level, there is a need to amend the legislation that is
contributing to this situation. This could force local governments to spend their revenues on
other investment.
3. Amend legislation to allow local governments to establish savings funds
A further policy that should be discuss and could mitigate the distortions at the local level is
the creation of local stabilization or intergenerational funds. This could allow municipalities to
save a portion of the revenues they receive in boom years, lowering the pressure to spend and
the labour demand in the district, and have an amount available for slow years.
In the longer term, the country should move towards a national integrated strategy to invest in
economic diversification, promoting the sectors with the most potentialities in each region,
thus reducing the dependency on extractive revenues and the vulnerability to volatility and the
inevitable exhaustion of the resources, since they are non-renewable by nature.
B. Short term local policies
But while these long term policies are debated and the legal amendments needed to apply
them are approved, there are real impacts for local people in the agricultural sector that have
to face higher labour costs and labour shortages and are increasingly halting their production,
which should be mitigated.
1. Use EI revenues to promote economic diversification locally by investing in
sustainable economic sectors
Thinking more strategically, investment projects like the ones in Echarate could also help
mitigate the increase in costs to the agricultural sector by making their production more
profitable through technical assistance, investment in seed improvement, processing plants to
generate value added, irrigation systems, etc. And the latter goes together with the district’s
development plan and also strengthens an economic sector that is sustainable, thus reducing
the dependency on the extractive industries.
C. Long term local policies
In addition to having an important role in short term policies to mitigate impact of distortions
at the local level, Municipalities also need to take on long term policies that can prevent the
generation of further distortions and impacts, while promoting actions and mechanisms that
maximize the benefit local areas can obtain from extractive activities.
1. Strengthen citizen participation mechanisms and accountability
Even with the legal limitations in the framework related to spending, local governments have a
relative amount of discretion to determine the use of resources from EI. However, to ensure
this spending is as effective as possible and has a real impact on the wellbeing of local
populations, mechanisms for citizen participation, transparency and accountability are crucial.
Therefore Municipalities should work to improve their transparency, increase and improve the
quality of participation in existing mechanisms such as participatory budgeting.
2. Promoting local content policies
Extractive activities can benefit local populations through linkages with local economic sectors,
for example though purchase of local goods and services. These linkages increase economic
activity in the local area and generate higher income levels for the local population. This could
in turn protect them from the distortions mentioned, since they could receive levels of income
that could compete with municipal wages and prevent the shift of labour from other sectors to
public works.
In Peru, the legal framework does not establish any obligations in terms of local content.
Mining companies have developed some initiatives related to local purchases and hiring local
workers, but their success has been limited.
In this context, local governments can play an important role as to facilitate, monitor and
articulate local content initiatives from companies.
3. Strengthening local institutional capacities to link investment with long term Local
Economic Development goals
One of the hardest challenges in terms of local government management is to effectively
promote local development. There are various difficulties which have to do with structural
weakness and legislative limitations, as well as the need to define and execute far reaching
public policies.
Private initiatives taken on by mining and oil companies through their CSR actions have also
had limited impact to promote local development in neighbouring areas.
Some successful local development experiences have been based on public-private
partnerships, where the local government has taken on the role of facilitator and coordinator
of initiatives and projects that are developed by civil society and the business sector.
A kind of public management based on a participatory and inclusive strategy to promote local
economic development can act as a guarantee to avoid the resource curse at the local level.