Embed Size (px)
Citation preview

Local Municipalities and Progress with the Delivery
of Basic Services in South Africa
Waldo Krugell, Hannelie Otto & Jacky van der Merwe12
Working Paper Number 116
1 School of Economics, School of Communication Studies and School of Economics respectively, North-West University, Potchefstroom Campus. Contact author: [email protected] 2 The authors would like to thank an anonymous Economic Research Southern Africa (ERSA) referee whose comments greatly improved the paper. All errors and omissions remain our own.

Local Municipalities and Progress with the Delivery of BasicServices in South Africa
Waldo Krugell, Hannelie Otto & Jacky van der Merwe�y
February 17, 2009
Abstract
In 1994, South Africa adopted the Reconstruction and Development Programme (RDP)and emphasised the delivery of services to meet basic needs. Since then, great strides havebeen made to redress past social inequalities. However, analysis of these successes have beenlimited to national or provincial aggregates, when much of the responsibility for meeting theRDP commitment lies at the local government level. The need for closer investigation of basicservice delivery is clear from continuing protests over poor service delivery. This paper aimsto shed more light on delivery at a local level by using data from the 2001 Census and the2007 Community Survey. The analysis involves the construction of a service delivery index foreach municipality and analysis of variance to explain the changes in service delivery over theperiod 2001 to 2007. The results show that improved service provision may require furtherurbanisation and densi�cation. Also, local economic growth in itself may not be important, butit would contribute to the ability to pay for services, thereby aiding delivery.
KEYWORDS: Delivery, basic services, community survey, local government, South Africa.JEL codes: H11, H83, 012
1 Introduction
In 1994, government adopted the Reconstruction and Development Programme (RDP) as its socio-economic policy framework and spelt out key pillars of delivery, including meeting basic needs anddeveloping human resources. Subsequently, macroeconomic policy frameworks such as Growth,Employment and Redistribution (GEAR) (1996) and the Accelerated and Shared Growth Initiativefor South Africa (ASGI-SA) (2006) were put in place to meet the RDP commitment. Today, it issaid that great strides forward have been made to redress past social inequalities. The �ndings of the2007 Community Survey show that 70 per cent of households now live in formal dwellings, comparedto 65 per cent in 1996 and 68 per cent in 2001. The percentage of households with access to pipedwater increased from 84 per cent in 2001 to 88 per cent in 2007. The use of electricity as the mainenergy source for lighting increased from 57 per cent in 1996 to 80 per cent in 2007. There werealso substantial improvements in access to refuse removal and sanitation services (StatsSA, 2007:6).However, evidence of government�s successes in meeting basic needs is often presented only in theform of provincial and national aggregates, while much of the responsibility for meeting the RDPcommitment actually lies at the local government level.This paper addresses the problem of limited analysis of the delivery of basic services at municipal
level. The current literature consists of two broad strands of research: spatially aggregated analysis
�School of Economics, School of Communication Studies and School of Economics respectively, North-West Uni-versity. Potchefstroom Campus. Contact author: [email protected]
yThe authors would like to thank an anonymous Economic Research Southern Africa (ERSA) referee whose com-ments greatly improved the paper. All errors and omissions remain our own.
1

of earlier October Household Surveys (see, for example, Hirschowitz and Orkin, 1997; Budlender,1999; Ngwane et al., 2003) and a range of case studies of only a few places (see Burger, 2005 foran overview). This neglect of delivery at local level has been a function of the availability of data.Until recently, only 2001 Census data were disaggregated su¢ ciently to allow for analysis of theperformance of all local governments to meet the basic needs of their communities. The results ofthe 2007 Community Survey now also allow for analysis of delivery at municipal level.The motivation for this research stems from the Constitution which recognises that local gov-
ernment has a developmental as well as a service role in meeting the basic needs of communitiesand improving living conditions (Harris, 1999). Also, a need for closer investigation is clear fromcontinuing protests over poor service delivery (Botes et al., 2007).This paper will shed more light on delivery at local level through the construction of a service
delivery index for each municipality and an explanation of the possible drivers of changes in servicedelivery over the period 2001 to 2007. Principle component analysis is used to construct the index.The contribution of this study is that it is the �rst time that data from the 2001 Census and 2007Community Survey are used to construct an indicator of basic service delivery at the level of localmunicipalities. Such a measure may prove useful to policymakers interested in service delivery andspatial development.The results from the analysis indicate that between 2001 and 2007, the mean access to basic
services showed a marked improvement, but there were increases in the variation of access to basicservices between places. To improve the provision of capital-intensive, networked services will requireurbanisation and densi�cation. Local economic growth in itself may not be important, but it wouldcontribute to the ability to pay for services.The paper is structured as follows. The next section presents a brief overview of earlier studies of
the delivery of basic services in South Africa. Section 3 presents the results of the 2007 CommunitySurvey and compares the delivery of water, electricity, sanitation, refuse removal and housing withthe 2001 Census data. An aggregate service delivery index is constructed for each municipality usingprinciple component analysis. Section 4 contains the analysis of the basic services delivery index.In the �nal section, a number of conclusions are drawn and recommendations are made.
2 Literature overview
Earlier analyses of how the South African government has been able to deliver basic services and meetthe RDP commitment have followed a number of approaches. The aim of the literature overview isto show how this paper�s spatially disaggregated focus on service delivery at municipal level �ts intothe current body of knowledge.The �rst approach found in the literature is that of studies that have used national level databases
to examine development indicators. Hirschowitz and Orkin (1997) used data from the 1994 OctoberHousehold Survey (OHS) and analysed living conditions according to race, gender, urbanisation andemployment. They found stark contrasts between di¤erent groups at the national level. Africans,who constitute 76 per cent of the population, were more likely to be a¤ected by inequality andrelative deprivation. Africans were found to be more likely than other population groups to livein shacks in urban areas and in traditional dwellings in non-urban areas, and to have less accessto domestic infrastructure such as water, sanitation and electricity. Budlender (1999) examinedaccess to basic services across ten deciles of households de�ned on the basis of income. She used the1995 OHS and Income and Expenditure Survey (IES) and found that access to household services isclosely correlated with income. For example, in the bottom decile, 18 per cent of households reliedon water sources that are situated more than a kilometre from their dwelling; in the top three deciles,this was the case for less than one percent of households (Budlender, 1999:205). Her conclusion wasthat a household that has poor access to basic services will enjoy lower levels of well-being and havefewer opportunities to earn income (ibid :218). In a similar fashion, Møller and Devey (2003) used the
2

October Household Surveys of 1995 and 1998 to examine trends in living conditions and satisfactionamong poorer, older South Africans. They found that access to services is strongly correlated withincome, but that over the period 1995 to 1998, poorer and older households did record gains inaccess to clean water, electricity and home ownership (ibid :468).Ngwane et al. (2003) examined deprivation in terms of basic needs by comparing the progress
in service delivery at the provincial level between 1995 and 1999, using the October HouseholdSurveys. They found that nationally, the lack of formal housing seemed to be on the increase, whilethe proportion of households deprived of safe water was unchanged over the period (ibid : 556).The analysis highlighted disparities between rural and urban areas in South Africa. An exampleis the di¤erences in the use of electricity as an energy source for heating: in 1999, approximately77 per cent of households in urban areas were using electricity, compared to 16 per cent in ruralareas (ibid :560). The comparisons of provincial progress also showed the more rural provinces tobe at a disadvantage, for example, a relatively high proportion of households in the Eastern Capeand Limpopo Province still did not have any toilet facilities. Le Roux Booysen (2003) examinedthe progress that the provinces had made in delivering the RDP, through the use of reconstructionand development indices. The analysis employed data from surveys by the Development Bank ofSouthern Africa, the Advertising Research Foundation, the Institute of Race Relations, the HealthSystems Trust, the Election Task Group, the South African Policy Service and the 1996 Census.He found that provinces that are more urbanised have advantages over the more rural provincesin the delivery of infrastructure, the facilitation of demographic transition and the improvement ofstandards in secondary education (Le Roux Booysen, 2003:42).The most recent analysis in this �rst category is that of Leibbrandt et al. (2006); the study
examines patterns of access poverty and inequality with a comparison of 1996 and 2001 Census data.They �nd that in both 1996 and 2001, almost two thirds of households occupied formal dwellings. Inthe inter-censal period, the proportion of Africans in formal dwellings increased from 53 per cent to60 per cent. The proportion of households in formal dwellings increased in all provinces, especiallyin Limpopo. As regards other basic services, Leibbrandt et al.�s (2006) results show improvementsin access to water, electricity, sanitation and refuse removal, speci�cally for the Black populationand across all provinces.It is clear that the literature paints the familiar South African picture of disparities in access to
basic services and improvements since 1994. However, in all of the above cases, the level of geograph-ical disaggregation was limited to studies of the urban-rural divide or comparisons of provinces. Theanalyses did not allow for further distinctions of the performance of local governments in meetingthe basic needs of their communities.For a more local perspective, a second approach in the literature comes from speci�c surveys
of so-called quality of place. An example is the Human Sciences Research Council survey of 5700South Africans�perceptions of service delivery in 1995 (Møller & Jackson, 1997). Within this lineof work, it is also possible to distinguish between urban and rural settings. With speci�c focus oncities, Møller (2001) reported on the quality of life in the Durban metropolitan area. She foundthat background factors, such as access to formal housing and access to services, accounted for only10 per cent of the variance in life satisfaction. However, general neighbourhood satisfaction1 , alongwith the background factors, explained 33 per cent of variance in life satisfaction (ibid :233-234).In a more rural setting, Sotshongaye and Møller (2000) examined self-assessed development needsamong rural women in Ndwedwe in KwaZulu-Natal. The women, from the better-serviced Mavelaward, cited piped water and electricity in the home as important development needs. In the moreremote Cibane ward, the women indicated that more basic needs such as safe water, housing andaccess to roads were priorities (ibid :117).Finally, the third approach in the literature is one that examines cases where poor service delivery
has led to protests and unrest. The Centre for Development Support at Free State University has
1 Including satisfaction with dwelling, disinclination to move from the neighbourhood/Durban, perceived improve-ments in the neighbourhood over the preceding year and changes in the crime situation.
3
published four case studies of delivery failures and protests in Phumelela, Khutsong, Phomolong andNelson Mandela Bay municipalities (see Botes et al., 2007). They found that de�cient service deliveryhas been caused by poor governance, individual political struggles within local government, a lackof communication, an ine¤ective client interface, ine¢ cient management and issues of a¤ordabilityand unfunded mandates.In summary, national level databases show improvements in basic service delivery in accordance
with the RDP commitment made in 1994. Interesting variations between communities may, how-ever, be hidden by the level of aggregation, and earlier studies typically show that the rural areaslag behind. Closer inspection of service delivery at local level is required. The following sectionexamines the delivery of basic services more closely through the results of the 2001 Census and 2007Community Survey.
3 Construction of the basic services delivery index
In 2007, Statistics South Africa conducted a large-scale Community Survey to gather demographicand socio-economic data at municipal level. The results show that the population increased from44.8 million in 2001 (based on the 2001 Census) to 48.5 million in 2007 (based on the 2007 Commu-nity Survey). The fastest rates of increase in the population were recorded in the Western Cape andGuateng Provinces (StatsSA, 2007). Access to basic services improved across the board: approxi-mately 80 per cent of households used electricity for lighting, 88 per cent of the population enjoyedaccess to piped water, and 60 per cent of households had access to a �ush toilet. Typically, theurban provinces of Gauteng and the Western Cape lie above the national averages, and the ruralprovinces such as the Eastern Cape, KwaZulu-Natal and Limpopo tend to lag behind (ibid). Sucha high level of spatial aggregation however, obscures interesting variations between communities.Table 1 shows the mean and standard deviation of households�access to basic services in 2001 and2007 per local municipality.
[Insert table 1 approximately here]
Table 1 re�ects the successes described by national and provincial aggregates. Between 2001 and2007, mean access to piped water inside the dwelling increased from 24 per cent to 37 percent. Anaverage of 63 per cent of households used electricity for lighting in 2001, and this improved to almost76 per cent in 2007. Similarly, the households with access to �ush toilets and refuse removal alsoincreased. The proportion of households that live in brick dwellings increased substantially. Oneshould, however, keep in mind that improvements in mean access are only part of the story. Table1 shows that, except for the cases of the use of electricity for lighting and access to brick housing,the standard deviation of access to basic services between places increased.This widening of the distribution of access to services across municipalities raises the question
of which places are forging ahead and which places are falling behind? Further analyses per typeof service would, however, be cumbersome and this paper therefore proposes the construction of abasic service delivery index per local municipality as an aggregate measure of service delivery.The construction of a compound indicator of service delivery per municipality draws on the
notion that delivery in aggregate is a construct that cannot be directly measured, but analysis canidentify groups of variables that measure the construct. This idea is inspired by UNCTAD�s ForeignDirect Investment (FDI) Potential Index for countries (2007) and Zietsman et al.�s (2006) GrowthPotential Index for towns in the Western Cape.For the construction of a basic service delivery index per local municipality, access to basic
services can be measured as:
� the percentage of households with piped water inside the dwelling,
� the percentage of households that use electricity for cooking, heating and lighting,
4

� the percentage of households with a �ush toilet,
� the percentage of households whose refuse is removed by the local authority, and
� the percentage of households that live in a brick dwelling.
The choice of these indicators follows Le Roux Booysen (2003) who used similar measures toconstruct the so-called reconstruction and development indices per province. By construction, theindex values re�ect improvements in delivery if more households have access to piped water insidethe dwelling, or if more households have access to electricity for cooking, heating and lighting.The focus is on the level of local municipality, of which there are 231. This excludes six metropol-
itan municipalities and twenty district municipalities, which are outliers likely to bias the results oflater analysis. The metropolitan municipalities are excluded for their population size and diversityof access to services. Cities such as Johannesburg and Cape Town are populous and urbanised,but aggregation of data at the metropolitan level does not allow one to distinguish between someof the best and the worst in service delivery that the country has to o¤er in formal and informalsettlements. The district municipalities are excluded for their lack of population size and diversityof service delivery. These municipalities cover large, sparsely populated rural areas with limited de-livery of basic services. Both the Census and Community Survey data are presented in accordancewith 2005 boundaries.The method for constructing the index is principle component analysis. This approach helps to
screen the data, extract the factors, determine the communality and calculate the factor scores. Thefactor scores are then used for further analysis.The analysis was done with 2001 Census data and 2007 Community Survey data for the 231 local
municipalities described above. The �rst step was to screen the data using a correlation matrix.The analysis requires measures that correlate fairly well, but not perfectly. When all the variableslisted above were used, the correlation matrix showed high correlations between using electricity forcooking and using electricity for heating both in 2001 (r = .983) and in 2006 (r = .927). Consequently,the heating variable was dropped from further analysis.The second step in the analysis is to determine whether principle component analysis is ap-
propriate. Table 2 presents the test statistics for KMO (Kaiser-Meyer-Olkin measure of samplingadequacy) and Bartlett�s test for sphericity. KMO is a measure of sampling adequacy and representsthe ratio of the squared correlation between variables to the squared partial correlation between vari-ables. The statistic ranges between 0 and 1. A value close to 1 indicates that patterns of correlationsare relatively compact and principle component analysis should yield distinct and reliable factors(Field, 2005). Here, the KMO statistic is .805 in 2001 and .820 in 2007. Additional analysis of theanti-image correlation matrix shows the diagonal elements to be greater than .05 and the o¤-diagonalelements to be small. Thus principle component analysis is appropriate for this data.
[Insert table 2 approximately here]
Bartlett�s measure tests the null hypothesis that the original correlation matrix is an identitymatrix (ibid). The test is signi�cant, which means that the R-matrix is not an identity matrixand there are relationships between the variables that can be included in the analysis. Again, theconclusion is that principle component analysis is appropriate.The extraction of the factors identi�ed a single factor with an eigen value greater than one. The
factor explains 77 per cent of the variance of the service delivery construct in 2001 and 72 per centin 2007. Table 3 presents the communalities after extraction.
[Insert table 3 approximately here]
The communalities represent the amount of variance in each variable that can be explained bythe factor that has been retained. For example, in 2001, approximately 84 per cent of the variance
5

associated with piped water is shared variance. In 2007, approximately 88 per cent of the varianceassociated with refuse removal is shared variance. The communalities also re�ect what has beenshown in the descriptive statistics in table 1. Over the period 2001 to 2007, the dispersion of the use ofelectricity of lighting and brick housing between municipalities decreased. These measures of servicedelivery consequently show smaller communality with the aggregate service delivery construct.Finally, the component matrix shows the factor loadings for the single factor identi�ed through
the principle component analysis.
[Insert table 4 approximately here]
In 2001 all the measures show a large positive relationship with aggregate service delivery. Squar-ing the factor loadings gives an estimate of the amount of variance in a factor accounted for by avariable. For example, piped water inside the dwelling accounts for approximately 84 per cent ofthe variation. Note that in 2007, a greater percentage of households that live in brick housing arenegatively associated with aggregate delivery. This may be ascribed to the improved delivery ofhousing that is unrelated to the delivery of other basic services2 .Based on the analysis above, the �nal step was to calculate factor scores. The factor score is a
composite score of the service delivery indicators for each of the local municipalities. In this case,the Anderson-Rubin method was used to calculate the factor scores. These scores are uncorrelatedand have a mean of zero and standard deviation of one. The factors scores constitute the basicservices delivery index. Positive index values indicate better aggregate service delivery above thenational average. The following section presents the index results and rankings of municipalities.
4 Analysis of the basic services delivery index
Figure 1 shows a scatter plot of the aggregate service delivery indices for 2001 and 2007.
[Insert �gure 1 approximately here]
Figure 1 shows a strong positive relationship between the levels of service delivery in 2001 and2007. Because basic services are typically supplied through a network, the level of delivery in 2001explains 91 per cent of the variation of the level of delivery in 2007 from its mean. The completerankings are given in table A1 in the appendix, ranked by the 2007 index score. Dividing thescatter plot into four quadrants aids the interpretation as follows. Local municipalities in quadrant3 provided below average access to basic services in 2001 and 2007. Local municipalities in quadrant2 provided above average access to basic services in 2001 and 2007. However, the places in quadrant1 are of particular interest. These municipalities provided below average access to basic services in2001, but improved to provide above average access in 2007.Using the rankings in table A1, it is possible to present more detailed pro�les of each of the
municipalities that provided below average or above average access to basic services in 2001 and2007. However, of more general interest would be to examine the di¤erences in the characteristicsof those places that provided above and below average delivery and those that improved delivery.The characteristics of places would include the environment in which the services are delivered.
This draws on Brown and Jackson�s (1990) microeconomic model whereby increases in public expen-diture are explained by taking into account the factors that in�uence the demand for and the costs ofpublic goods and services. The in�uences on demand include the tastes and incomes of the medianvoter and the costs are in�uenced by the size and density of the population. At a sub-national level,available measures of the service environment include the initial values of population density, gross
2One has to keep in mind that the delivery of housing is a provincial responsibility, though it takes place atlocal level. Recently the National Treasury proposed that the responsibility and funding should be assigned to localmunicipalities in the hope that this may help to overcome a lack of capacity and technical expertise in order toe¤ectively provide this basic service (Ensor, 2008).
6

domestic product (GDP) per capita, the unemployment rate and the percentage of people living onless than $2 per day. These variables are calculated from the 2001 Census and sourced from GlobalInsight�s Regional Economic Explorer database. The hypothesis is that municipalities with higherpopulation densities and greater GDP per capita should be able to provide better access to services.Those with higher levels of unemployment and more people in poverty are more likely to face greaterbacklogs in service delivery.One also has to keep in mind that the environment in which basic services are delivered may
have changed over the period. To measure changes in the service environment, the growth of thenumber of households and the economic growth rate can be used. These measures are not obtainedfrom primary data, but are obtained from the Regional Economic Explorer database. Di¤erentsources of sub-national economic information from Statistics South Africa�s Census, governmentdepartments, development agencies and Regional Services Councils are compiled for these estimates(see www.globalinsight.co.za). Here the expectation is ambiguous: increases in population mayreduce the level of service provision, but it may also be that improved service delivery attractsmigrants. Increased population density should favour improvements in delivery. Economic growthwould aid the local community�s ability to pay for services and consequently raise the level of serviceprovision.Table 5 presents simple one-way ANOVA contrast tests of the di¤erences in these characteristics
between the municipalities that provided above average and below average service delivery.
[Insert table 5 approximately here]
Table 5 shows that there are signi�cant di¤erences between municipalities that were able to supplyabove average basic services and those that supplied below average services. The places that deliveredabove average services had signi�cantly higher levels of GDP per capita in 2001, signi�cantly lowerunemployment rates and signi�cantly fewer people in poverty. They also experienced signi�cantlyfaster growth in the number of households over the period 2001 to 2007. In terms of populationdensity and economic growth, the above and below average performers did not di¤er signi�cantly.It is also possible to narrow the focus to the places that were able to improve service delivery
over the period 2001 to 2007. In all, there were only 15 such municipalities according to the basicservices delivery index and this precludes more formal analysis. A description of the municipalitiesand their characteristics may help to shed light on the improvements in delivery shown by the index.Table 6 presents the municipalities and information about the characteristics discussed above.
[Insert table 6 approximately here]
Unfortunately the picture that emerges is not clear. Most of the municipalities that were able toimprove service delivery from below average to above average did not have high population densities.Except for Moretele and Madibeng, they all had population densities below the national average.Most of the places experienced some increase in population density over the period, but not by much.Generally, the places that were able to improve delivery have GDP per capita far below the nationalaverage. In most of the municipalities, GDP per capita increased over the period that they wereable to improve service delivery. The Sunday�s River Valley, Mookgopong, Modimolle, Madibeng,Mose Kotane and the Mamusa municipality show substantial increases. Unemployment statisticsshow that in 12 of the 15 places, unemployment was lower than the national average across allmunicipalities. In most places unemployment remained stable or increased slightly over the period.The poverty indicator also presents mixed evidence. In 7 of the 15 places, the percentage of peopleliving on less than $2 per day was more than the national average and in 8 places it was less than thenational average. In summary, it is not clear at all that initial conditions favoured improvements inservice delivery. Much the same can be said about the indicators of the service environment. Mostmunicipalities had to provide services to a greater number of households over the period 2001 to2006 and experienced some economic growth. A number of places, including Sunday�s Rivier Valley,
7

Musina, Mookgopong, Modimolle and Moretele showed economic growth rates in excess of 3 percent per annum.Along with measures of the service environment, improved service delivery may also be explained
by the capability of local government to supply basic services. Measures of this capability mayinclude the ratio of vacant positions to total budgeted sta¤, capital spending as a proportion of thetotal budget, as well as the ratio of grant income to rates income. The data are sourced from theNational Treasury, but unfortunately the latest available data are for the 2005/06 �nancial year. Thehypothesis is that local municipalities with fewer vacant positions, with a greater share of capitalspending in total spending and with more rates income relative to grants income will have the abilityto improve basic service delivery. Table 7 shows the municipalities and the available indictors of theability to supply services.
[Insert table 7 approximately here]
Again, the picture that emerges is one of disparities. The vacancy ration ranges from 5 per centin Setsoto to 43 per cent in Modimolle. Capital spending as a portion of total spending is quite lowin the Sunday�s River Valley and Setsoto municipalities but generally high in the cases of Moretele,Moses Kotane, Nketoana and Mookgopong. The ratio of grants income to rates income also does notprovide a clear picture. Madibeng has the lowest ratio of 0.3 and Tswelopele lies at 0.5. In general,income from grants by far exceeds the income from rates. Finally, only one of the municipalitiesthat were able to improve the delivery of basic services from below average to above average waspart of national government�s Project Consolidate which aims to build local capacity and improvedelivery.
5 Conclusions and recommendations
This paper set out to analyse the progress made in the delivery of basic services across local mu-nicipalities in South Africa. This involved the construction of a service delivery index for eachmunicipality and analysis of variance to explain the changes in service delivery over the period 2001to 2007. The results show that the mean access to basic services showed a marked improvement, butthat the variation of access to basic services between places, increased. This raised the questions ofwhich places are forging ahead and what are the predictors of improved service delivery?The construction of a basic service delivery index showed a strong positive relationship between
the levels of service delivery in 2001 and 2007. The index identi�ed the places that provided belowaverage access to basic services in 2001 and 2007, those that provided above average access to basicservices in 2001 and 2007, and those that were able to improve delivery over the period. Analysis ofvariance showed that the places that delivered above average services had signi�cantly higher levelsof GDP per capita in 2001, signi�cantly lower unemployment rates and signi�cantly fewer peoplein poverty. The description of the 15 places that were able to improve delivery did not provideconclusive results and other place-speci�c characteristics may be at work.There are three main conclusions. The �rst conclusion is that urbanisation and densi�cation may
be required to improve the provision of capital-intensive, networked services. The second conclusionis that local economic growth in itself may not be important, but it would contribute to the abilityto pay for services. The third conclusion is that the measures of the quality of local institutions haveto be further improved. It may be that the variables used do not measure this construct of capacityto deliver. The data are also a source of concern: a single observation per municipality in the middleof the period under analysis leaves much to be desired. Future research into this topic may taketwo directions: �rstly, improvements in the sharpness of the tools at the level of all municipalities,with more measures and more observations across time; secondly, case studies of the successes andfailures of delivery, conducting surveys and analyses of community pro�les.
8

References
[1] Botes, L., Lenka, M., Marais, L., Matebesi, Z. & Sigenu, K. 2007. The cauldron of local protests:Reasons, impacts and lessons learned. Centre for Development Support, Free State University.[Web:] http://www.uovs.ac.za/apps/yearbooks/index.php?id=57
[2] Brown, C.V. & Jackson, P.M. 1990. Public Sector Economics. Oxford: Blackwell.
[3] Budlender, D. 1999. Patterns of poverty in South Africa, Development Southern Africa, 16, pp.197-246.
[4] Burger, R. 2005. What we have learned from post-1994 innovations in pro-poor service deliveryin South Africa: a case study-based analysis, Development Southern Africa, 22, pp. 483-500.
[5] Clark, D.A. 2003. Concepts and perceptions of human wellbeing: Some evidence from SouthAfrica, Oxford Development Studies, 31, pp. 173-196.
[6] Ensor, L. 2008. Municipalities lack capacity, expertise to provide housing.http://www.businessday.co.za Date of access: 10 Nov. 2008.
[7] Field, A. 2005. Discovering statistics using SPSS. London: Sage.
[8] Harris, J.C. 1999. The challenge of local government delivery. Development Southern Africa,16, pp. 183-193.
[9] Hirschowitz, R. & Orkin, M. 1997. Inequality in South Africa: Findings from the 1994 OctoberHousehold Survey, Social Indicators Research, 41, pp. 119-136.
[10] Leibbrandt, M. Poswell, A. Naidoo, P. & Welch, M. 2006. Measuring recent changes in SouthAfrican inequality and poverty using 1996 and 2001 census data. (In Bhorat, H. and Kanbur,R. eds. Poverty and Policy in Post-Apartheid South Africa, Cape Town: HSRC Press).
[11] Le Roux Booysen, F. 2003. The extent of, and possible explanations for, provincial disparitiesin progress on reconstruction and development in South Africa. Development Southern Africa,20, pp. 21-48.
[12] Møller, V. 2001, Monitoring quality of life in cities: the Durban case, Development SouthernAfrica, 18, pp. 217-238.
[13] Møller, V. & Devey, R. 2003. Trends in living conditions and satisfaction among poorer olderSouth Africans: objective and subjective indicators of quality of life in the October HouseholdSurvey, Development Southern Africa, 20, pp. 457-476.
[14] Møller, V. & Jackson, A. 1997. Perceptions of service delivery and happiness. DevelopmentSouthern Africa, 14(2): 169-184.
[15] Ngwane, A.K., Yadavalli, V.S.S. & Ste¤ens, F.E. 2003. Poverty: Deprivations in terms of basicneeds, Development Southern Africa, 19, pp. 545-560.
[16] Sotshongaye, A. & Møller, V. 2000. �We want to live a better life like other people�: self-assesseddevelopment needs of rural women in Ndwedwe, KwaZulu-Natal, Development Southern Africa,17(1): 117-134.
[17] Statistics South Africa, 2007, The RDP Commitment: What South Africans say, [Web:]http://www.statssa.gov.za/publications/CS2007RDP/CS2007RDP.pdf
[18] UNCTAD, 2007. FDI potential and performance indices.http://www.unctad.org/Templates/Page.asp?intItemID=2468&lang=1
9

[19] Zietsman, H.L., Ferreira, S.L.A. & Van der Merwe, I.J. 2006. Measuring the growth capabilityof towns in the Western Cape, South Africa. Development Southern Africa, 23(5): 685-700.
10

Appendix: Figures and tables
Table 1: Households’ access to basic services, average per municipality Basic service Census 2001 Community Survey 2007 Mean Std deviation Mean Std deviation Piped water inside dwelling 24% 19.7 37% 24.7Use electricity for cooking 39% 22.0 57% 23.8Use electricity for heating 36% 20.8 47% 23.6Use electricity for lighting 63% 21.1 76% 18.7Flush toilet 41% 28.1 47% 32.3Refuse removal 43% 29.6 50% 33.6Brick housing 61% 20.3 84% 13.1 Table 2: KMO and Barlett’s test 2001 2007 Kaiser-Meyer-Olkin Measure of Sampling Adequacy .805 .820Bartlett's Test of Sphericity Approx. Chi-Square 1623.160 1483.861 df 15 15 Sig. .000 .000 Table 3: Communalities 2001 extraction 2007 extraction Piped water inside dwelling .836 .844Use electricity for cooking .895 .898Use electricity for lighting .746 .589Flush toilet .861 .897Refuse removal .794 .878Brick housing .535 .225 Table 4: Component matrix 2001 component 1 2007 component 1 Piped water inside dwelling .914 .919Use electricity for cooking .946 .948Use electricity for lighting .864 .768Flush toilet .928 .947Refuse removal .891 .937Brick housing .732 -.474
11

Table 5: Contrast tests Contrast Value of
Contrast Std. Error
t df Sig. (2-tailed)
Population density 01 Assume equal variances
1 -1.3426 15.31100 -.088 171 .930
Does not assume equal variances
1 -1.343 15.095 -.089 105.038 .929
GDP per capita 01 Assume equal variances
1 -14381.566 1547.609 -9.293 171.000 .000
Does not assume equal variances
1 -14381.566 1530.900 -9.394 126.385 .000
Unemployment rate 01 Assume equal variances
1 31.229 2.100 14.870 171.000 .000
Does not assume equal variances
1 31.229 2.111 14.794 154.511 .000
% of people on less than $2 per day
Assume equal variances
1 18.687 1.119 16.697 171.000 .000
Does not assume equal variances
1 18.687 1.129 16.551 133.063 .000
% growth of no of households 01-07
Assume equal variances
1 -4.300 1.332 -3.227 171.000 .001
Does not assume equal variances
1 -4.300 1.329 -3.235 169.312 .001
Economic growth 01-07 Assume equal variances
1 .356 .301 1.182 171.000 .239
Does not assume equal variances
1 .356 .300 1.185 168.188 .238
12
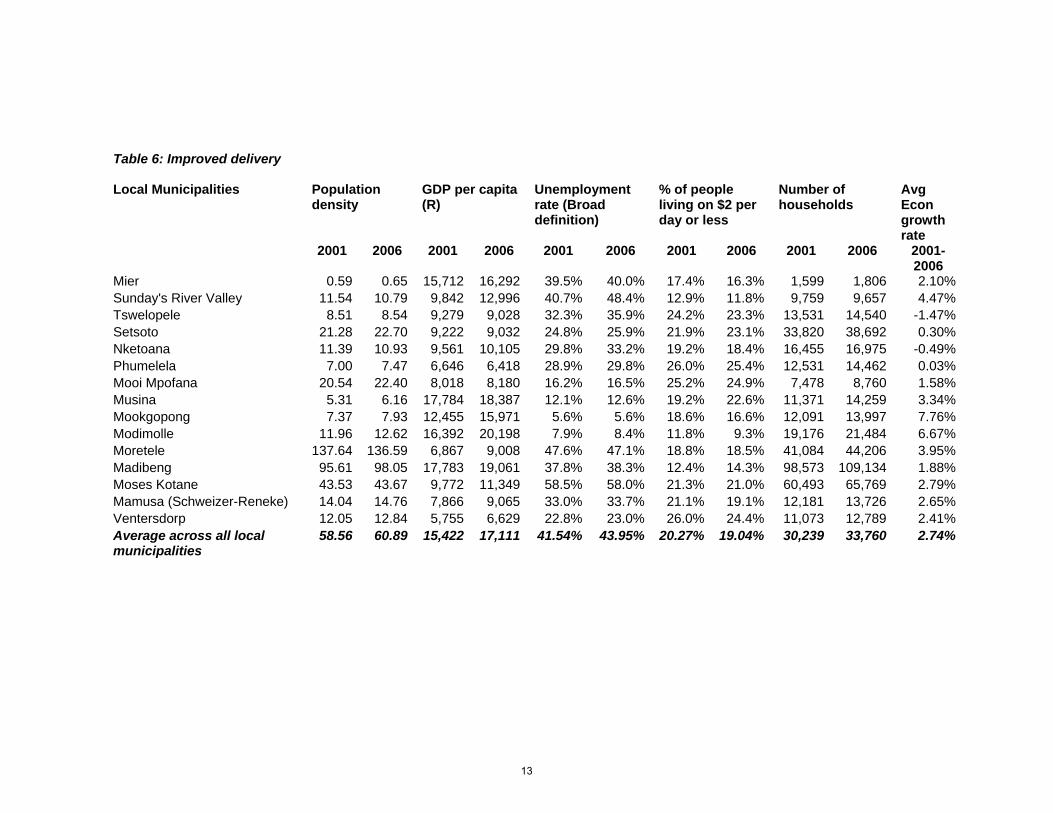
Table 6: Improved delivery Local Municipalities Population
density GDP per capita (R)
Unemployment rate (Broad definition)
% of people living on $2 per day or less
Number of households
Avg Econ growth rate
2001 2006 2001 2006 2001 2006 2001 2006 2001 2006 2001-2006
Mier 0.59 0.65 15,712 16,292 39.5% 40.0% 17.4% 16.3% 1,599 1,806 2.10%Sunday's River Valley 11.54 10.79 9,842 12,996 40.7% 48.4% 12.9% 11.8% 9,759 9,657 4.47%Tswelopele 8.51 8.54 9,279 9,028 32.3% 35.9% 24.2% 23.3% 13,531 14,540 -1.47%Setsoto 21.28 22.70 9,222 9,032 24.8% 25.9% 21.9% 23.1% 33,820 38,692 0.30%Nketoana 11.39 10.93 9,561 10,105 29.8% 33.2% 19.2% 18.4% 16,455 16,975 -0.49%Phumelela 7.00 7.47 6,646 6,418 28.9% 29.8% 26.0% 25.4% 12,531 14,462 0.03%Mooi Mpofana 20.54 22.40 8,018 8,180 16.2% 16.5% 25.2% 24.9% 7,478 8,760 1.58%Musina 5.31 6.16 17,784 18,387 12.1% 12.6% 19.2% 22.6% 11,371 14,259 3.34%Mookgopong 7.37 7.93 12,455 15,971 5.6% 5.6% 18.6% 16.6% 12,091 13,997 7.76%Modimolle 11.96 12.62 16,392 20,198 7.9% 8.4% 11.8% 9.3% 19,176 21,484 6.67%Moretele 137.64 136.59 6,867 9,008 47.6% 47.1% 18.8% 18.5% 41,084 44,206 3.95%Madibeng 95.61 98.05 17,783 19,061 37.8% 38.3% 12.4% 14.3% 98,573 109,134 1.88%Moses Kotane 43.53 43.67 9,772 11,349 58.5% 58.0% 21.3% 21.0% 60,493 65,769 2.79%Mamusa (Schweizer-Reneke) 14.04 14.76 7,866 9,065 33.0% 33.7% 21.1% 19.1% 12,181 13,726 2.65%Ventersdorp 12.05 12.84 5,755 6,629 22.8% 23.0% 26.0% 24.4% 11,073 12,789 2.41%Average across all local municipalities
58.56 60.89 15,422 17,111 41.54% 43.95% 20.27% 19.04% 30,239 33,760 2.74%
13

Table 7: Indicators of the ability to supply services
Vacancy ratio
Capital spending
to total budget
Grants income to
rates income
Project consolidate
Mier 0.06 0.157 13.065 0 Sunday's River Valley 0.23 0.021 3.522 0 Tswelopele 0.13 0.000 0.532 0 Setsoto 0.05 0.030 2.268 0 Nketoana 0.18 0.314 1.695 0 Phumelela 0.00 0.257 0.860 0 Mooi Mpofana 0.22 0.209 2.272 0 Musina 0.12 0.181 1.457 0 Mookgopong 0.11 0.292 0.717 0 Modimolle 0.43 0.159 1.259 0 Moretele 0.23 0.780 0 Madibeng 0.32 0.195 0.301 1 Moses Kotane 0.09 0.316 3.089 0 Mamusa (Schweizer-Reneke)
0.00 0.255 2.350 0
Ventersdorp 0.00 0.250 1.181 0
14

Table A1: Basic services delivery index rankings
Above average delivery Below average delivery 2001 2007 2001 2007 Saldanha Bay 1.96356 1.59488 Greater Kokstad -0.05467 -0.05741Overstrand 1.77084 1.55953 Ga-Segonyana -0.13845 -0.09707Stellenbosch 1.78148 1.53062 Mandeni -0.1927 -0.1137Bergrivier 1.75887 1.51781 Polokwane -0.0095 -0.12803Gamagara 1.66499 1.46106 Pixley Ka Seme -0.05063 -0.15237Kgatelopele 1.53354 1.4386 Tswaing -0.16156 -0.18541Cape Agulhas 1.95014 1.40683 Lephalale -0.23759 -0.22994Swartland 1.83019 1.40501 Mkhondo -0.81481 -0.26073Breede Valley 1.68369 1.38852 Maluti a Phofung -0.41904 -0.27707Swellendam 1.68096 1.38757 Kwa Sani -0.65675 -0.299Emfuleni 1.35987 1.38077 Mogalakwena -0.29936 -0.43973Hessequa/Langeberg 1.64707 1.34124 Molopo -0.30958 -0.515Camdeboo 1.21446 1.31369 JS Moroka -0.12291 -0.52814Beaufort West 1.71624 1.30809 Great Kei -0.6326 -0.56783Breede River/ Winelands
1.62887 1.30118 Thembisile -0.33956 -0.56788
Mossel Bay 1.79697 1.2998 Ramotshere Moiloa/ Zeerust
-0.28866 -0.58464
Richtersveld 1.59387 1.29157 Molemole -0.39143 -0.60095Nama Khoi 1.55166 1.2688 Umvoti -0.87264 -0.6385Metsimaholo 0.87908 1.26343 Abaqulusi -0.38731 -0.64883Midvaal 0.57587 1.25696 Ulundi -0.85522 -0.67785Theewaterskl 1.3992 1.24749 uPhongolo -0.73183 -0.68197Drakenstein 1.68558 1.24623 Lepelle-Nkumpi -0.34454 -0.69147Oudtshoorn 1.58789 1.22781 Nkonkobe -0.42497 -0.7076Moqhaka 0.8695 1.21912 Mbonambi -0.78302 -0.72998Cederberg 1.43142 1.21353 Greater Marble Hall -0.47633 -0.74314George 1.64583 1.20938 Tsolwana -0.30212 -0.74654Matzikama 1.48511 1.18961 Amahlati -0.81336 -0.77333Khai-Ma 0.90231 1.175 Richmond -0.78733 -0.78622Prince Albert 1.37847 1.16686 King Sabata
Dalindye -0.92251 -0.79034
Kouga 0.96821 1.16453 Emadlangeni -0.84977 -0.79344Govan Mbeki 0.59801 1.13454 Nkomazi -0.7741 -0.79862Tlokwe/Potchefstroom 0.91272 1.12645 Ngqushwa -0.95729 -0.82176Matjhabeng 0.50104 1.11483 Albert Luthuli -0.82329 -0.82319Mogale City 0.9809 1.10996 Dannhauser -0.90177 -0.83247Khara Hais 1.16064 1.10807 Greater Tzaneen -0.59519 -0.84499Emthanjeni 1.30114 1.0964 Greater Taung -0.76837 -0.84858Masilonya 0.09501 1.06466 Sakhisizwe -0.85685 -0.86221Sol Plaatjie 1.40106 1.05668 Elias Motsoaledi -0.56862 -0.86626
15

Steve Tshwete/ Middelburg
0.9196 1.04654 Maruleng -0.76626 -0.87303
Witzenberg 1.47673 1.00973 uMshwathi -0.7496 -0.90292Bitou/Plettenberg Bay 1.27663 0.99833 Mkhambathini -1.00982 -0.9417Knysna 1.18605 0.99134 uMuziwabantu -1.3138 -0.96768Randfontein 1.17243 0.98941 Greater Giyani -0.8461 -0.9681City of Matlosana/ Klerksdorp
0.82855 0.98177 Bushbuckridge -0.50788 -0.97568
Hantam 0.99157 0.96623 Makhado -0.68535 -1.00104Kopanong 0.7908 0.96511 Mthonjaneni -0.89545 -1.00231Laingsburg 1.31857 0.96481 Thulamela -0.83755 -1.00471Ngwathe 0.47842 0.95279 Makhuduthamaga -0.86497 -1.02567Mafube 0.32808 0.94098 Greater Tubatse -0.96154 -1.03386Inxuba Yethemba 1.22107 0.93118 Greater Letaba -0.79041 -1.04511Kannaland 1.33076 0.92383 eDumbe -1.05024 -1.0987Lesedi 0.60445 0.90831 Aganang -0.99087 -1.10009Merafong City 0.83635 0.89177 Ratlou/Setla-Kgobi -0.61825 -1.11571Lekwa-Teemane 0.4862 0.88679 Kagisano -0.67533 -1.12027Westonaria 0.29793 0.86548 Senqu -0.84511 -1.12503Makana 0.3652 0.85886 Umzinene -1.10427 -1.14794Bela-Bela 0.42449 0.8536 Impendle -1.08625 -1.15616Siyancuma 0.45821 0.83348 Mnquma -1.22322 -1.17374Lekwa/Standerton 0.2935 0.82991 Moshaweng -1.30773 -1.17915Naledi 0.45231 0.8203 uMlalazi -0.95701 -1.2124Tsantsabane 1.16203 0.8097 Ezingoleni/Izingolwe -1.30505 -1.23424Siyathemba 1.15114 0.80029 Indaka -1.10217 -1.24014Msunduzi 0.85161 0.79287 Fetakgomo -1.00969 -1.25156Endumeni 0.82659 0.79156 Okhahlamba -1.23032 -1.27146Dihlabeng 0.31268 0.78715 Blouberg -1.1454 -1.31976Kamiesberg 0.2857 0.7629 Ntambanana -1.3814 -1.32797Gariep 0.46189 0.73335 Jozini -1.57745 -1.36849Naledi 0.26493 0.72758 Emalahleni -1.20238 -1.37292Emakhazeni 0.46425 0.72724 Ubuhlebezwe -1.38716 -1.41463Dipaleseng 0.11298 0.7076 Mutale -1.26959 -1.43085Ubuntu 0.774 0.70659 Imbabazane -1.09122 -1.43534Mangaung 0.64007 0.68713 Nyandeni -1.66913 -1.4643Baviaans 0.65054 0.68455 Umzimkhulu -1.63944 -1.52606Magareng 0.77784 0.68357 Matatiele -1.49012 -1.54677Thembelihle 0.47936 0.647 Qaukeni -1.77579 -1.57909Ndlambe 0.36065 0.63655 Nongoma -1.47597 -1.59681Umjindi 0.32316 0.6297 Umzumbe -1.48645 -1.61731!Kai! Garib 0.67455 0.62515 Nkandla -1.78175 -1.63488Delmas 0.25038 0.58478 Engcobo -1.76533 -1.64554Inkwanca 0.39344 0.57456 Umzimvubu -1.65557 -1.65347
16

Maletswai 0.13113 0.57071 Hlabisa -1.35692 -1.68452Kou-Kamma 0.9489 0.56945 Maphumulo -1.75963 -1.68627Thabazimbi 0.04171 0.5566 Vulamehlo -1.53499 -1.68879Mantsopa 0.18627 0.54734 Nquthu -1.52121 -1.69351Blue Crane Route 0.40517 0.52297 Intsika Yethu -1.61584 -1.71942Rustenburg 0.11897 0.50758 Ndwedwe -1.50328 -1.73249Ikwezi 0.38756 0.50197 Ingwe -1.64918 -1.7358Phokwane 0.52473 0.48002 Mbhashe -1.8091 -1.74429Kgetlengrivier 0.16201 0.47629 Port St Johns -1.84749 -1.76118Newcastle 0.83967 0.4723 Elundini -1.62967 -1.76714Buffalo City 0.47651 0.47184 Mhlontlo -1.67667 -1.76723Letsemeng 0.58968 0.46594 Mbizana -1.70037 -1.81083Nala 0.07893 0.45641 Ntabankulu -1.90782 -1.97556Dikgatlong 0.25054 0.4479 Umhlabuyalingana -1.76592 -1.99323Karoo Hoogland 0.75315 0.44787 Msinga -1.88443 -2.12124Umsobomvu 0.63512 0.44128 Improved delivery uMngeni 0.80034 0.43286 2001 2007Kungwini 0.4558 0.42429 Sunday's River Valle -0.18637 0.62789Renosterberg 0.80862 0.4241 Tswelopele -0.22789 0.54827Nokeng tsa Taemane 0.44087 0.41654 Modimolle -0.23447 0.49507Lukhanji 0.35867 0.39134 Mookgopong -0.05235 0.4635KwaDukuza 0.32251 0.3889 Musina -0.17227 0.45664Thaba Chweu 0.39193 0.37849 Mamusa/Schweizer-
Reneke -0.07252 0.38664
uMhlathuze 0.7052 0.37788 Phumelela -0.20908 0.25375!Kheis 0.21597 0.30858 Madibeng -0.22897 0.23978Ditsobotla/Lichtenbu 0.27178 0.29773 Setsoto -0.21963 0.23912Kareeberg 0.75274 0.29282 Ventersdorp -0.16107 0.19934Nxuba 0.25563 0.28169 Moses Kotane -0.12243 0.18043Msukaligwa 0.26689 0.26069 Nketoana -0.11144 0.12953Mohokare 0.2411 0.22553 Mooi Mpofana -0.00178 0.12937Emalahleni 0.8179 0.22073 Mier Local -0.18596 0.02234Tokologo 0.06984 0.22069 Moretele -0.66051 0.00493Mtubatuba 0.25978 0.20794 Worsened delivery Maquassi Hills 0.12376 0.19311 Mbombela 0.03322 -0.01521Umtshezi 0.27183 0.08449 Emnambithi-
Ladysmith 0.25408 -0.07798
Hibiscus Coast 0.28641 0.03007 Umdoni 0.35753 -0.21723Ba-Phalaborwa 0.33712 0.02221 Mafikeng 0.1824 -0.28461
17

Figure 1: Service delivery indices in 2001 and 2007
-2.00
-1.00
0.00
1.00
Bas
ic s
ervi
ces
deliv
ery
inde
x 20
07
III IV
I II
-2.00 -1.00 0.00 1.00 2.00
Basic services delivery index 2001
18


![Appendix B APPENDICES] (Work in Progress) 1. Delivery](https://img.pdfslide.net/doc/110x75/61c4877225a8a20a3d08cc57/appendix-b-appendices-work-in-progress-1-delivery-.jpg)