Embed Size (px)
Citation preview

Piedmont Workforce Network 2211 HYDRAULIC ROAD, SUITE#104, CHARLOTTESVILLE, VA 22901 | (434) 979-5610
Local Plan Draft – 2016-2020 LOCAL WORKFORCE DEVELOPMENT AREA 6
Local Plan – 2016-2020
1 | P a g e
TABLE OF CONTENTS
I. Local Strategic Planning Elements ................................................................................... 3
A. Workforce Demand Analysis ........................................................................................... 3
B. Workforce Supply Analysis ........................................................................................... 18
C. SWOT Analysis.............................................................................................................. 23
D. Vision & Goals ............................................................................................................... 27
E. Strategy & Partnerships .................................................................................................. 31
F. Additional Strategic Elements ........................................................................................ 33
II. Local Workforce Development System Elements .......................................................... 40
A. Programs/Partners Overview.......................................................................................... 40
B. Collaborative Strategies ................................................................................................ 57
C. Business Services ............................................................................................................ 64
D. Economic Development Collaboration ......................................................................... 75
E. One Stop System ............................................................................................................ 76
F. Adult & Dislocated Worker Services Provided............................................................ 88
G. Rapid Response Coordination ....................................................................................... 92
H. Youth Services Provided ................................................................................................ 93
I. Supportive Service Provision ...................................................................................... 104
J. Training Services .......................................................................................................... 104
K. Collaboration with the Community Colleges ............................................................... 106

Local Plan – 2016-2020
2 | P a g e
L. Collaboration with Education ...................................................................................... 108
M. Collaboration with Adult Education and Literacy ....................................................... 110
N. Priority of Service ......................................................................................................... 111
O. Incorporation of Technology ........................................................................................ 112
P. Efficient and Effective Service Delivery ....................................................................... 113
Q. Fiscal Agent ................................................................................................................... 114
R. Procurement ................................................................................................................. 117
S. Performance ................................................................................................................. 118
T. Quality Assurance .......................................................................................................... 119
U. Public Comment Period ................................................................................................ 119

Local Plan – 2016-2020
3 | P a g e
I. LOCAL STRATEGIC PLANNING ELEMENTS
A. WORKFORCE DEMAND ANALYSIS
1. Existing and emerging in-demand industry sectors and occupations
Local Workforce Development Area 6 (LWDA6) is a diverse region incorporating both
rural and urban areas, leading to a variety of workforce development needs. The structure of the
Local Workforce Development Board is one of the best models in the state in terms of being
aligned with economic development. The regional economic development organization, the
Central Virginia Partnership for Economic Development, is co-located with PWN staff, creating
a close tie for the sharing of information and data related to economic and workforce
development. In 2012, the Central Virginia Partnership released the Comprehensive Target
Markets Report, a copy of which can be found in Appendix A, which identified the six priority
industries for economic development purposes. This report is still widely used in the region and
continues to be a basis for discussions related to not only economic development activities, but
also for workforce development. Based on the Comprehensive Target Markets Report, data
gathered from JobsEQ and the Labor Market Exchange operated by the Virginia Employment
Commission, and local employer needs, PWN has chosen four industries to prioritize for
workforce development initiatives:
• Business & Financial Services
• Health Services
• Information Technology
• Manufacturing/Distribution

Local Plan – 2016-2020
4 | P a g e
Target Industries1
Industry
Current (2016q2)
Historical (2011-2016)
Forecast (10 years)
Cur
rent
E
mpl
oym
ent
Ave
rage
W
ages
Em
ploy
men
t
Perc
ent
Cha
nge
Rep
lace
men
t D
eman
d
Gro
wth
D
eman
d
Tot
al
Dem
and
Ave
rage
A
nnua
l Pe
rcen
t G
row
th
Health Services 27,785 $47,233 3,380 2.9% 5,762 5,670 11,432 2.5% Business & Financial Services 12,973 $80,213 1,382 2.2% 2,869 1,917 4,786 1.1% Information Technology 7,307 $75,895 211 -5.3% 1,514 984 2,498 0.1% Manufacturing/Distribution 9,318 $47,137 1,399 5.8% 2,060 -417 1,643 -1.0%
Health Services in PWN’s region continues to be the industry with the most number of
individuals employed currently, and based on forecasting data, this industry will continue to
demand future workers in both new and replacement jobs with the need to fill over 11,400 jobs.
Business & Financial Services will also continue to be an industry with high employment, and
the demand is forecasted to increase by 1.1% annually over the next 10 years.
Information Technology has emerged as an industry that has had significant workforce
development needs over the last five years. Based on employment data, the growth potential over
the next 10 years is very small (0.1% annually), but analysis of the historical data shows that the
Information Technology industry has had similar growth to Health Services and Business &
Financial Services. While the data shows small growth, the local employers continue to vocalize
challenges in finding skilled and qualified workers to fill more technical middle-skilled
positions. In the Information Technology field, many individuals who have the skills in the field
tend to migrate toward larger cities or technology hubs such as New York City, Washington
D.C., and Palo Alto, California. This shortfall in workers has become a primary issue for not
only PWN, but also for the regional economic development firm, and talent attraction for these
1 JobsEQ, Chmura Economics, October 2016

Local Plan – 2016-2020
5 | P a g e
employers will be key in the next few years so that existing companies can remain and grow in
the region.
It is also important to note that while Information Technology is a versatile industry, it’s
also a “skill” that individuals can obtain to secure employment across all industry sectors.
Portions of Information Technology can be found in the Health Services, Manufacturing, and
Business & Financial Services industries. For example, many of the medical centers in the region
are moving toward more electronic processes and procedures, especially when it comes to
medical records. This move requires many more professionals who understand the technical
aspects of network and software administration.
The Manufacturing industry has taken a hit in employment since the recession in 2008-
2010. While it has been a slow recovery process, the industry will be at a crossroads within the
next 10 years due to the age of its workforce. Many of the local manufacturing employers have
stated that a majority of their workforce are nearing retirement, and based on data, 47% of the
individuals currently employed in the Manufacturing sector are between the ages of 45 and 642.
This retirement bubble will create a challenge in terms of replacing the institutional knowledge
and will be a focus for PWN in the years to come.
In terms of occupations within these target industries, the following data was collected on
the top 20 occupations within each of the industries. These occupations will be prioritized by
PWN to ensure that local employers in the region’s needs are met when employment
opportunities arise. These occupations have also been analyzed to develop career pathways in the
target industries.
2 LWDA6 Community Profile, http://www.virginialmi.com, Virginia Employment Commission, October 2016

Local Plan – 2016-2020
6 | P a g e
Target Industries: Top 20 In-Demand Occupations (10 year Projection)3
Health Services
SOC Title
Cur
rent
Em
ploy
men
t
Rep
lace
men
t D
eman
d
Gro
wth
D
eman
d
Tota
l D
eman
d
31-1010 Nursing, Psychiatric, and Home Health Aides 2,109 489 552 1,042 29-1140 Registered Nurses 1,521 370 316 686 39-9020 Personal Care Aides 1,505 175 418 593 31-9090 Miscellaneous Healthcare Support Occupations 1,105 250 236 486 43-6010 Secretaries and Administrative Assistants 764 81 155 236 29-2060 Licensed Practical and Licensed Vocational Nurses 583 160 115 275 43-4170 Receptionists and Information Clerks 506 149 126 275 29-1060 Physicians and Surgeons 569 172 98 270 29-1120 Therapists 484 132 184 316 37-2010 Building Cleaning Workers 353 95 77 172 43-9060 Office Clerks, General 338 80 62 142 39-9010 Childcare Workers 286 112 27 139 31-2020 Physical Therapist Assistants and Aides 160 52 78 130 21-1020 Social Workers 268 70 51 121 21-1090 Miscellaneous Community and Social Service Specialists 290 59 49 108 43-3020 Billing and Posting Clerks 206 46 51 97 11-9110 Medical and Health Services Managers 187 53 42 95 35-2010 Cooks 175 51 43 93 35-3040 Food Servers, Nonrestaurant 148 40 44 84 43-1010 First-Line Supervisors of Office and Administrative
Support Workers 198 33 48 81
3 JobsEQ, Chmura Economics, October 2016

Local Plan – 2016-2020
7 | P a g e
Business & Financial Services
SOC Title
Cur
rent
Em
ploy
men
t
Rep
lace
men
t D
eman
d
Gro
wth
D
eman
d
Tota
l D
eman
d
13-2011 Accountants and Auditors 618 192 127 319 11-9199 Managers, All Other 293 190 59 249 13-1111 Management Analysts 494 96 119 215 15-1132 Software Developers, Applications 445 78 129 208 43-4051 Customer Service Representatives 512 136 47 183 13-2052 Personal Financial Advisors 203 76 84 160 41-3021 Insurance Sales Agents 356 120 36 156 11-9141 Property, Real Estate, & Community Association Managers 283 98 56 154 15-1121 Computer Systems Analysts 332 50 103 154 23-1011 Lawyers 514 98 44 141 Maintenance & Repair Workers, General 330 93 45 138 11-1021 General & Operations Managers 311 87 49 136 43-9061 Office Clerks, General 429 96 30 126 15-1133 Software Developers, Systems Software 239 36 70 105 15-1151 Computer User Support Specialists 240 35 65 100 43-3071 Tellers 335 120 -27 94 41-3099 Sales Representatives, Services, All Other 205 56 38 93 13-1161 Market Research Analysts & Marketing Specialists 175 25 49 74 43-6014 Secretaries & Administrative Assistants, Except Legal,
Medical & Executive 393 43 28 72
41-3031 Securities, Commodities, & Financial Services Sales Agents 212 38 30 68

Local Plan – 2016-2020
8 | P a g e
Information Technology
SOC Title
Cur
rent
Em
ploy
men
t
Rep
lace
men
t D
eman
d
Gro
wth
D
eman
d
Tota
l D
eman
d
15-1132 Software Developers, Applications 333 59 106 166 15-1121 Computer Systems Analysts 213 33 73 106 15-1133 Software Developers, Systems Software 177 27 56 83 15-1151 Computer User Support Specialists 162 24 56 80 11-3021 Computer and Information Systems Managers 95 14 35 48 15-1142 Network and Computer Systems Administrators 85 13 27 40 41-3099 Sales Representatives, Services, All Other 75 21 17 37 11-1021 General and Operations Managers 65 19 14 33 43-4051 Customer Service Representatives 56 16 12 28 15-1134 Web Developers 41 8 17 24 13-1111 Management Analysts 47 9 11 20 15-1143 Computer Network Architects 51 7 11 18 15-1152 Computer Network Support Specialists 49 7 11 18 43-9061 Office Clerks, General 42 10 7 17 13-1161 Market Research Analysts and Marketing Specialists 36 5 11 17 41-4011 Sales Representatives, Wholesale and Manufacturing,
Technical and Scientific Products 39 8 9 17
15-1122 Information Security Analysts 30 4 11 15 13-2011 Accountants and Auditors 28 9 6 15 15-1199 Computer Occupations, All Other 38 6 8 15 15-1141 Database Administrators 25 6 7 13
Local Plan – 2016-2020
9 | P a g e
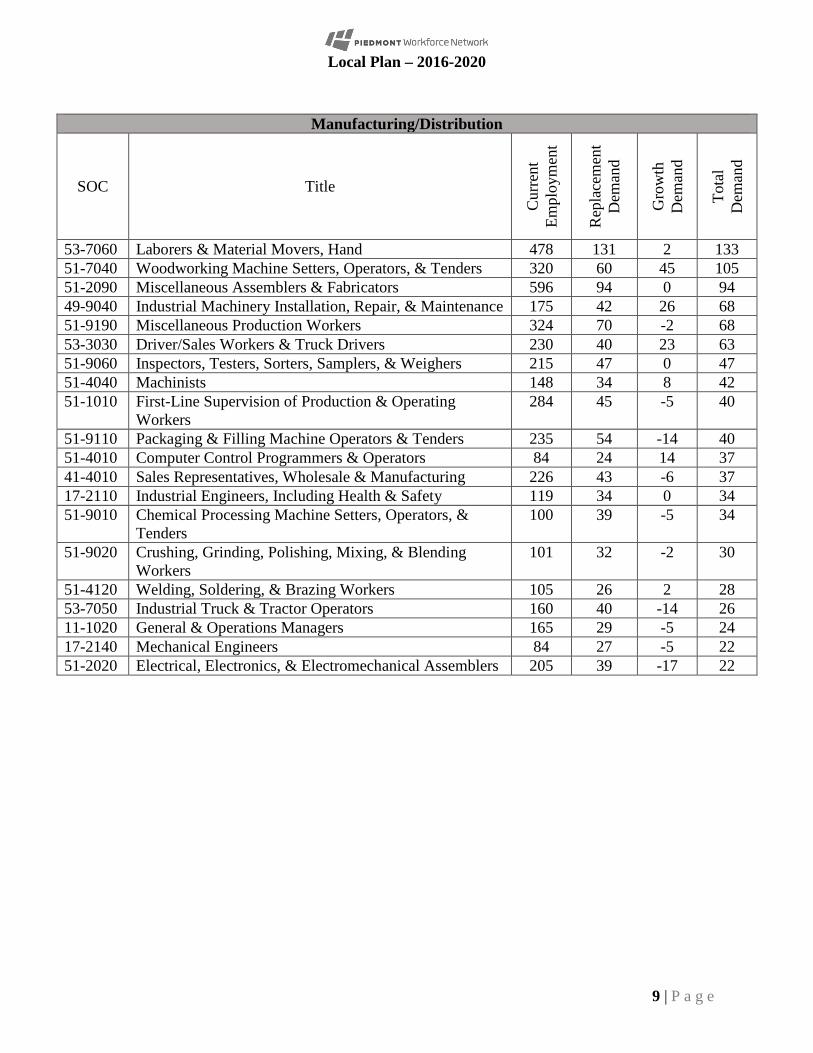
Manufacturing/Distribution
SOC Title
Cur
rent
Em
ploy
men
t
Rep
lace
men
t D
eman
d
Gro
wth
D
eman
d
Tota
l D
eman
d
53-7060 Laborers & Material Movers, Hand 478 131 2 133 51-7040 Woodworking Machine Setters, Operators, & Tenders 320 60 45 105 51-2090 Miscellaneous Assemblers & Fabricators 596 94 0 94 49-9040 Industrial Machinery Installation, Repair, & Maintenance 175 42 26 68 51-9190 Miscellaneous Production Workers 324 70 -2 68 53-3030 Driver/Sales Workers & Truck Drivers 230 40 23 63 51-9060 Inspectors, Testers, Sorters, Samplers, & Weighers 215 47 0 47 51-4040 Machinists 148 34 8 42 51-1010 First-Line Supervision of Production & Operating
Workers 284 45 -5 40
51-9110 Packaging & Filling Machine Operators & Tenders 235 54 -14 40 51-4010 Computer Control Programmers & Operators 84 24 14 37 41-4010 Sales Representatives, Wholesale & Manufacturing 226 43 -6 37 17-2110 Industrial Engineers, Including Health & Safety 119 34 0 34 51-9010 Chemical Processing Machine Setters, Operators, &
Tenders 100 39 -5 34
51-9020 Crushing, Grinding, Polishing, Mixing, & Blending Workers
101 32 -2 30
51-4120 Welding, Soldering, & Brazing Workers 105 26 2 28 53-7050 Industrial Truck & Tractor Operators 160 40 -14 26 11-1020 General & Operations Managers 165 29 -5 24 17-2140 Mechanical Engineers 84 27 -5 22 51-2020 Electrical, Electronics, & Electromechanical Assemblers 205 39 -17 22
Local Plan – 2016-2020
10 | P a g e
2. Employment needs of employers in existing and emerging in-demand
industry sectors and occupations
The overall employment of PWN’s region has recovered well since the recession period
of 2008-2010. Prior to the recession, the highest total employment number for PWN’s region
was in Quarter 4 (October 1 – December 31) of 2007, with 173,734 individuals in the workforce.
In Quarter 4 of 2015, PWN had surpassed that number with 179,972 individuals in the
workforce, a 3.5% increase. With the low unemployment rate, PWN’s region is reaching full
employment, which is creating hardship on local employers seeking to find qualified workers.
PWN’s Comprehensive and Affiliate One Stop Centers have noted that visitors to the Centers are
very low skilled and have significant barriers to employment. Local employers advertising for
more technical positions have stated that it is difficult to find qualified, high-caliber candidates
due to the lack of available workers.
It is important to note that the region’s employer needs are ever-changing, with the
integration of new technology playing an important role in the change in skills required to obtain
in-demand occupations. PWN uses a wide variety of resources to gauge the employment needs in
the region, including but not limited to, the Virginia Workforce Connection system, JobsEQ
maintained by Chmura Economics, Employer Advisory Councils facilitated by the community
college system, and industry roundtables held by various groups in the region. PWN recognizes
that while data systems and labor market systems are integral in producing data and research
regarding trends in workforce development, speaking to the local employers directly is the best
and most valuable way to gain accurate information.
While the skills and credentials for a specific occupation may change, one requirement
for employees to be successful is basic workplace readiness or “soft skills”. Local employers
have repeatedly stressed the need for individuals to have essential, basic work skills, including

Local Plan – 2016-2020
11 | P a g e
teamwork, problem solving, critical thinking, basic reading and math, and work ethic. Most of
these skills are inherent, and while they cannot be taught fully in a classroom setting, PWN and
the core and required partner programs are focused and committed to continuing to educate and
mentor job seekers in the region on successful workplace readiness skills.
Another core challenge facing the in-demand industry sectors is the retirement gap, as it
is well known that a majority of the workforce in the region will retire in the next 5-10 years.
Over 49,000 jobs will need to be replaced over the next 10 years, which can only be remedied by
the workforce development system collaborating together to create talent pipelines.
3. The knowledge and skills needed to meet the employment needs of the employers in the region, including employment needs in in-demand industry sectors and occupations
Because the PWN region is a diverse region consisting of eleven localities and two
different Planning Districts, the employer needs in the region vary across the localities. One
thing that remains consistent is the requirement for basic skills to obtain an in-demand
occupation within a target industry sector. The need for a High School Diploma or its equivalent
is required by most employers in the region within the target industries. Along with this
requirement, the ability to conduct basic math functions and ninth (9th) grade level reading
comprehension is imperative. Along with these, a proficient understanding of the English
language is required for most entry level positions within the target industries. There are some
exceptions to this rule, especially those employers in the Manufacturing industry who have taken
on a Spanish-speaking population.
In Spring 2015, PWN began a Labor Sector Strategy Study, which was recommended
after an audit of existing workforce development research showed that there was a lack of
information regarding employers needs and the skills and/or credentials needed by job seekers to
gain employment. The Labor Sector Strategy Study built off of the Comprehensive Target

Local Plan – 2016-2020
12 | P a g e
Markets Report released by the Central Virginia Partnership for Economic Development, and
focused first on the four priority industries for PWN; Business & Financial Services, Health
Services, Information Technology, and Manufacturing/Distribution.
The Labor Sector Strategy Study examined the occupations listed above that were in-
demand within the target industry sectors and used a combination of data collection and
employer roundtable discussions to verify the skills and/or credentials that are required to obtain
those occupations. To date, the research and data collection has been completed for three of the
four target industries; Health Services, Information Technology, and Manufacturing/Distribution.
Health Services
The number one in-demand occupation for the Health Services field is the Nurse Aide or
Home Health Aide position. This occupation requires the individual to be licensed through the
Virginia Board of Nursing as a Certified Nursing Assistant, but local employers have also stated
that further credentials and education is preferred. Nurse Aides are seen as versatile positions
and, within the hospital and medical center locations, these individuals are being cross-trained in
different departments. Many employers in the region have disclosed that a future requirement of
all Nurse Aide hires will be possession of a Phlebotomy Technician license.
Registered Nurses are also a pain point for the medical facilities in the region. Both of the
major medical facilities in the region, University of Virginia Health System and Sentara Martha
Jefferson Hospital have achieved Magnet status, which requires that most of their Registered
Nurses have a Bachelor’s of Science in Nursing. The University of Virginia Health System is
pushing for Registered Nurses to be hired at a fast pace and have resorted to offering sign-on
bonuses to nurses that accept employment.
Local Plan – 2016-2020
13 | P a g e
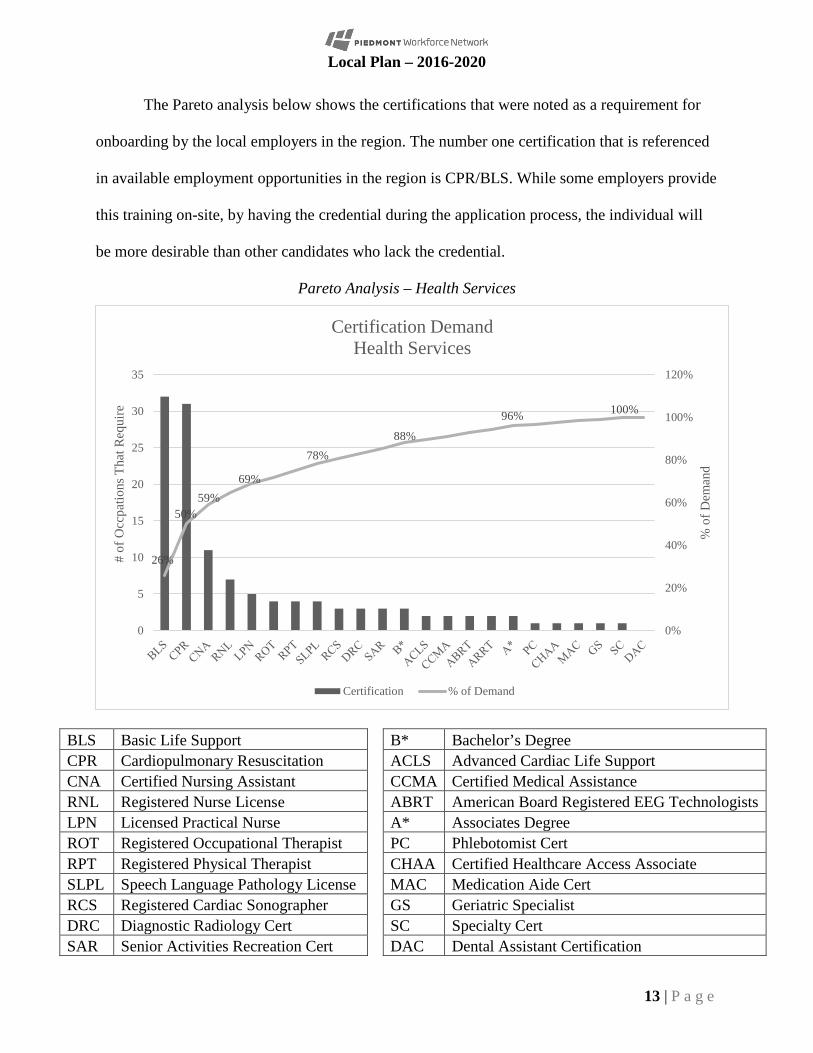
The Pareto analysis below shows the certifications that were noted as a requirement for
onboarding by the local employers in the region. The number one certification that is referenced
in available employment opportunities in the region is CPR/BLS. While some employers provide
this training on-site, by having the credential during the application process, the individual will
be more desirable than other candidates who lack the credential.
Pareto Analysis – Health Services
BLS Basic Life Support B* Bachelor’s Degree CPR Cardiopulmonary Resuscitation ACLS Advanced Cardiac Life Support CNA Certified Nursing Assistant CCMA Certified Medical Assistance RNL Registered Nurse License ABRT American Board Registered EEG Technologists LPN Licensed Practical Nurse A* Associates Degree ROT Registered Occupational Therapist PC Phlebotomist Cert RPT Registered Physical Therapist CHAA Certified Healthcare Access Associate SLPL Speech Language Pathology License MAC Medication Aide Cert RCS Registered Cardiac Sonographer GS Geriatric Specialist DRC Diagnostic Radiology Cert SC Specialty Cert SAR Senior Activities Recreation Cert DAC Dental Assistant Certification
26%
50%59%
69%
78%88%
96% 100%
0%
20%
40%
60%
80%
100%
120%
0
5
10
15
20
25
30
35
% o
f Dem
and
# of
Occ
patio
ns T
hat R
equi
re
Certification DemandHealth Services
Certification % of Demand
Local Plan – 2016-2020
14 | P a g e
Information Technology
Two different areas within the Information Technology industry exist in PWN’s region.
The first is the area of Cybersecurity or Defense Contracting. Shortly prior to the recession, the
federal government located personnel to the National Ground Intelligence Center (NGIC) and the
Defense Intelligence Agency (DIA) in northern Albemarle County. With this relocation, a
number of federal defense contractors also relocated to the region, bringing an influx of
cybersecurity and software development jobs that require a security clearance. There is also a
presence of these defense contracting firms within Fauquier County, due to the proximity of the
county to Northern Virginia and Washington D.C. Many of these contracting firms and
organizations require not only TS-SCI Security Clearance levels, but they also prefer an array of
certifications through CompTIA, such as A+, Network+, and Security+ Certifications. Other
Information Technology companies, such as private software development firms and general
networking departments within larger corporations, do not require credentials and certifications
for their new hires. Initiative, creativity, and willingness to learn additional skills are more of a
priority to these firms, which value portfolios or technical skills more than actual certifications.
Customer Service Representatives and Help Desk Technicians will be important
occupations for PWN to focus on in the future, as these positions do not require any technical
certifications or credentials besides a high school diploma, but do tend to have high turnover
resulting in frequent employment opportunities. The Pareto analysis below shows the data and
information collected on the Information Technology industry regarding skills and credentials in-
demand occupations.

Local Plan – 2016-2020
15 | P a g e
Pareto Analysis - Information Technology
Exp. IT Experience SSGB Six Sigma Green Belt TS-SCI Security Clearance CCDA Cisco Certified Design Associate Sec+ CompTIA Security+ OSHA Occupational Safety and Hazard Administration MCP Microsoft Certified Professional HVAC Heating, Venting, A/C PMP Project Management Professional MCSE Microsoft Certified Solutions Expert VCP VMWare Certified Professional CDL Commercial Driver's License CODA Certified Oracle Database Admin RoR Ruby on Rails A+ CompTIA A+ Java Java CCNA Cisco Certified Network Associate JavaS Java Script DoD8570 Security Clearance MA Mobile Applications (iOS, Android) Ser+ CompTIA Server+ CMC Certified Management Consultant
CISSP Certified Information Systems Security Professional
Net+ CompTIA Network+
CSM Certified Scrum Master
30%
42%51%
67%72%
78%
88%
100%
0%
20%
40%
60%
80%
100%
120%
0
5
10
15
20
25
30Ex
p.TS
-SC
ISe
c+PM
PM
CP
VC
PC
OD
A A+
CC
NA
DoD
8570
Ser+
CIS
SPC
SMSS
GB
CC
DA
OSH
AH
VA
CM
CSE
CD
LR
oR Java
Java
SM
AC
MC
EPA
Net
+
% o
f Dem
and
Dem
and
Certification DemandInformation Technology
Demand % of Demand

Local Plan – 2016-2020
16 | P a g e
Manufacturing/Distribution
Within the Manufacturing and Distribution industry, the credentials and skills that are
needed vary among employers in the region. The functions that are conducted and the products
that are produced in the region differ from each other and span from large distribution centers
such as the Wal-Mart Distribution Center in Louisa County to Continental Corporation in
Culpeper County; which manufactures anti-lock brake valve boxes that are used in one-third of
all the automobiles in the world. While the products manufactured or distributed vary, one of the
key workforce challenges local employers face when hiring new employees is a lack of basic
math and reading skills. Employers have stated that it is difficult for them to find employees who
have the ability to read a ruler or conduct basic mathematical functions that are key to production
line success. With multiple employers utilizing CNC Machines on their manufacturing floors, the
demand for employees that also have the ability to operate computerized machines is increasing.
Many of the employers state that CNC Machinists are very difficult to find in the region.
A Commercial Driver’s License is another credential that has recently become in-
demand, in all aspects of manufacturing and distribution. In October 2014, when PWN
conducted a demand planning exercise for the Commonwealth of Virginia, a Commercial
Driver’s License was the number two credential in-demand throughout the region. This is an area
that PWN will continue to focus on, as the credential is attainable in a short amount of time and
is amenable to individuals from all backgrounds.
The Pareto analysis below shows the data and information collected on the
Manufacturing/Distribution industry regarding skills and credentials in-demand occupations.

Local Plan – 2016-2020
17 | P a g e
Pareto Analysis – Manufacturing/Distribution
W&A Willing & Able CMRT Certified Maintenance and Reliability Technician
OSHA Occupational Safety and Health Administration
CNCL CNC Lathe Training
ACDL Class A Commercial Driver's License B* Bachelor’s Degree
CNCM CNC Machinist Certification PLC Programmable Logic Controllers Certification
HE Hazmat Endorsement AMRL AASHTO Materials Reference Laboratory Accredited
PIT Powered Industrial Truck VDOT Virginia Dept of Transportation Training BCDL Class B Commercial Driver's License A* Associates Degree
31 8 6 5 3 3 2 2 2 2 1 1 1 1
46%
57%
66%
74%78%
82%85%
88%91%
94% 96% 97% 99% 100%
0%
20%
40%
60%
80%
100%
120%
0
5
10
15
20
25
30
35
W&A OSHA ACDL CNCM HE PIT BCDL CMRT CNCL B* PLC AMRL VDOT A*
Dem
and
Certification DemandManufacturing/Distribution
Demand % of Demand

Local Plan – 2016-2020
18 | P a g e
Business & Financial Services
While a thorough analysis of the Business & Financial Services industry has not yet been
completed, PWN has done initial research regarding this industry and the trends impacting the
industry. Digital literacy has been and will continue to be a requirement for this industry, and
some occupations may require advanced computer skills for an individual to be successful. This
may or may not include a certification as a Microsoft Office Specialist. Accountants & Auditors,
as the number one occupation in-demand in the industry, require knowledge, skills, and abilities
with bookkeeping functions and may include proficiency in QuickBooks. Customer service skills
have also been identified as a requirement in occupations within the Business & Financial
Services industry. Further information regarding this industry, including a finite list of
credentials and skills needed by local employers will be determined in FY2017 during the
completion of the industry booklet for Business & Financial Services as part of the Labor Sector
Strategy Study.
B. WORKFORCE SUPPLY ANALYSIS
1. Current labor force employment and unemployment data
When referencing unemployment rates throughout Virginia, PWN’s region has been
known to have some of the lowest rates in the Commonwealth. Even during the recession in
2008-2010, while the region’s unemployment rate increased to its highest point of 7.5%4, it has
consistently remained below the Virginia and national rates. As of November 2016, PWN’s
region held at an unemployment rate of 3.4%, the third lowest of the Local Workforce
Development Areas in the Commonwealth.5
4 Labor Force, Employment, & Unemployment Report, http://www.virginialmi.com, Virginia Employment Commission, January 2017 5 Labor Force, Employment, & Unemployment Report, http://www.virginialmi.com, Virginia Employment Commission, January 2017

Local Plan – 2016-2020
19 | P a g e
While the unemployment rate tells one story, there is a second story that accompanies it
when analyzing the employment data for the region. The labor participation rate for the region
remains at 62.4% which is on par with Virginia (64.8%) and the nation (63.5%).6 During the
recession, individuals who were laid off from high-wage, high-skill jobs were unable to find
similar or comparable work in the region. Therefore, those individuals were found to take lower,
entry-level positions or they simply gave up looking any further. These individuals who gave up
looking exhausted their unemployment benefits and were no longer counted in statistics
regarding unemployment. Now that the economy is moving toward full employment with a low
unemployment rate, there are a number of those individuals who have never moved on from
those entry-level positions that they thought would be temporary. This has left a huge number of
families that are underemployed and unable to achieve self-sufficiency. It also has caused lower
skilled job seekers or individuals with barriers to employment to not be able to obtain entry-level
positions for which they are qualified.
2. Information on labor market trends
There are a number of economic and labor market trends in the PWN region that are
affecting the workforce development system. The first, which has been mentioned regarding the
Manufacturing industry, is the aging workforce. The workforce for a majority of employers is
within retirement age in the next 5-10 years, or have already reached the retirement age window
and continue to work. Many employees that are at the age of retirement have continued to work
in order to support their families and recover the financial assets they may have lost during the
recession period. The younger workforce will have a burden to take over the positions that are
being vacated by these retiring employees, which tend to be more advanced supervisory
6 JobsEQ, Chmura Economics, October 2016

Local Plan – 2016-2020
20 | P a g e
positions. Employers have already disclosed that succession planning regarding next steps and
educational training has begun to occur and the workforce development system will need to
remain agile to assist them.
Another trend that affects the workforce needs of the local employers in the region are
the commuting patterns. Due to the proximity to Northern Virginia, PWN’s region sees more
individuals commuting out of the region for work (70,714) than into the region (48,713).7 With
the lower cost of living in the region compared to the Northern Virginia and Washington D.C.
metro areas, many individuals choose to reside in the PWN region and travel for a higher wage.
The retail industry has recently become more prominent in the region, bringing in major
retailers such as Wegmans, Costco, and Field & Stream to Albemarle County. While the number
of jobs that these retailers brought to the area was large, the pay that these establishments offer to
their employees does not allow for families to be self-sufficient. These types of jobs do not
provide as much of a contribution to Virginia’s Gross State Product (GSP) as do jobs in the
health services, manufacturing, information technology, or business and financial services fields.
Retail trade occupations contribute an average of $61,637 to the GSP. In comparison, health
services, manufacturing, information technology, and business and financial services contribute a
combined average of $270,244 to the GSP8. There are also pay differentials that occur between
the retailers for similar jobs, so the turnover and competition between the companies continues to
be a challenge. Due to the economy moving toward full employment, there are also individuals
with higher education and skills obtaining these entry-level positions to the disadvantage of
lower skilled individuals.
7 LWDA6 Community Profile, http://www.virginialmi.com, Virginia Employment Commission, October 2016 8 GO Virginia Coalition Presentation, Stephen Fuller, June 29, 2016

Local Plan – 2016-2020
21 | P a g e
Besides the turnover in the retail establishments, turnover has become an issue in a large
number of employers in the region due to the lack of support outside of the workplace for their
employees. Barriers to retention include a lack of reliable transportation, lack of reliable or
affordable childcare opportunities, or family/medical challenges that prevent employees from
coming to work. Transportation continues to be a topic of agencies outside the workforce
development system, including the Planning District Commissions. The challenge of finding
reliable, affordable transportation from the rural areas to the urban areas in the region has been
on the table many times over the years, but a lack of funding and commitment from entities to
support it has always caused it to be put on the back burner. For the employers using shift work,
not only does it affect transportation, but it also affects the number of childcare providers in the
region that are able to meet the needs of employees working odd hours. This is especially true in
the healthcare field, as many nurses and workers in medical centers work 12 hour shifts.
3. Educational and skill levels of the workforce, including individuals with barriers to employment
Educational Attainment & Demographics9
Education Level PWN Virginia USA No High School Diploma 10.5% 9.9% 12.0% High School Graduate 27.3% 23.9% 26.5% Some College, No Degree 19.1% 20.6% 21.9% Associate’s Degree 6.9% 7.7% 8.7% Bachelor’s Degree 20.7% 22.3% 19.7% Postgraduate Degree 15.6% 15.5% 11.2%
The University of Virginia’s main campus residing in Charlottesville can sometimes
misrepresent the demographics of PWN’s region. While the University produces many graduates
each year in undergraduate and graduate studies, a vast majority of those students choose to
9 Jobs EQ, Chmura Economics, October 2016

Local Plan – 2016-2020
22 | P a g e
leave the region for larger markets. In actuality, the education levels of the workforce in the
region tend to be lower than even the Commonwealth’s levels. 10.5% individuals in the region
do not have a high school diploma or its equivalent, which severely limits their options in terms
of employment.10 The One Stop Centers in the region have seen an increase in the number of
visitors that are classified in this demographic. In terms of individuals who have been to college
or have an Associate’s Degree or Bachelor’s Degree, these numbers fall below the
Commonwealth’s levels. It is encouraging to note that the number of individuals with a
Postgraduate Degree is higher than both the Virginia and national levels, but challenges in
finding employment exist in this population, too. Some individuals with Ph.Ds. educations tend
to be considered overqualified for positions with local employers.
Demographic Information11
Populations with Barriers to Employmenti Percent
PWN Virginia USA Population Annual Average Growth 1.2% 1.0% 0.8% Older Individuals within Working Age (45-64 Years) 14.1% 13.6% 13.2% Veterans, Age 18-64 6.7% 9.1% 5.8% Poverty Level (of all people) 11.4% 11.5% 15.6% Disabled, Age 18-64 9.2% 9.1% 10.2% Labor Force Participation Rate and Size of Disabled Population, Age 18-64 43.2% 42.6% 41.2% Speak English Less Than Very Well (population 5 yrs and over) 3.1% 5.6% 8.6% Homeless12,13 0.1% 0.1% 0.2% SNAP Recipients14 13.2% 10.9% 14.6% Disconnected Youth 1.5% 2.2% 3.3% Children in Single Parent Families (% of all children) 27.7% 31.3% 34.7% Children in Foster Care 0.10% 0.05% 0.13% Migrant and Seasonal Farmworkers (non-H2A)15 0.14% n/a n/a
10 Jobs EQ, Chmura Economics, October 2016 11JobsEQ, Chmura Economics, October 2016; unless otherwise noted 12 Champion, Allison, “Local homelessness on the rise,” Culpeper Star Exponent, March 13, 2015 13 Hudexhance.com, accessed in January 2017 14 Virginia Department of Social Services, Local Department of Social Services Profile Report, SFY 2016 15 Virginia Employment Commission
Local Plan – 2016-2020
23 | P a g e
Migrant and Seasonal Farmworkers (H2A) 15 0.07% n/a n/a Migrant and Seasonal Farmworkers (Total) 15 0.20% 0.17% n/a TANF Recipients14 0.8% 2.7% 4.4% Youth Unemployment 16.3% 17.7% 19.6% Ex-Offenders16 0.19% 0.14% n/a Teen Pregnancy Rate (Age 10-19 per 1,000 population)14 7.6% 9.4% n/a Enrolled in Grade 12 (% of total population) 1.3% 1.3% 1.4% Children in Single Parent Families (% of all children) 27.7% 31.3% 34.7% Foreign Born 6.9% 11.6% 13.1%
C. SWOT ANALYSIS
1. Education and training in the region
PWN’s region is fortunate to span across three community college regions, Germanna
Community College, Lord Fairfax Community College, and Piedmont Virginia Community
College. There are also a variety of vocational, technical, and for-profit training institutions that
provide qualified training to the region’s job seekers.
In terms of strengths of the education and training available in the region, the number of
programs available in the region provides a plethora of choices for students. These programs
have also been structured to lead to industry recognized credentials and/or skills that lead to jobs.
The development of new programs is always analyzed to ensure that local employers’ needs are
being met. This business driven concept is a benefit to not only the students in the region, but
also the workforce development system as a whole. The connection and collaboration between
providers and the workforce development system, including the One Stop Centers, creates a
synchronized process for employers to meet their needs.
16 Virginia Department of Corrections, Judicial Mapping Project, FY2014 Report

Local Plan – 2016-2020
24 | P a g e
One of the challenges facing the education and training providers in the region continues
to be lack of seats to match the demand for classes. For example, students that are interested in
the medical field, particularly nurses, must complete clinical hours and hands-on training in
order to be successful with the examinations proctored by the Virginia Board of Nursing. These
clinics can only accommodate a small number of students at a time, which limits the size of
classes during each semester. There is also a challenge with finding off-site organizations or
employers to host clinical classes. Another challenge is the high cost of classes for students.
While the Workforce Credentials Grant has recently been put into place, offering financial
assistance for students interested in non-credit classes, this has caused many of the community
colleges to raise prices to accommodate the risk of this grant. For students not willing to sign the
promissory note or unable to qualify, this presents an obstacle for them.
An opportunity for the training and education providers and the workforce development
system together is to better tell the story of how the connection and collaboration between the
two facilitates successful job placement and skills gains for our region’s constituents. By
providing more examples of relevant success stories to the region’s employers and job seekers, it
will increase the number of individuals that are interested in furthering their education to meet
the needs of our local employers.
2. Strengths and weaknesses of workforce development activities
In October 2016, Mary Ann Lawrence, CEO/Owner of PowerNotes, LLC, facilitated a
strategic planning session with the PWN Board, Local Elected Officials, and other workforce
development partners in the system. During this strategic planning session, the group discussed
and developed an analysis of the region’s strengths, weaknesses, opportunities, and threats
within the current workforce development system. The following SWOT Analysis was
developed following the discussion.

Local Plan – 2016-2020
25 | P a g e
SWOT Analysis Strengths
• Dedicated, passionate staff to the Board • Co-located and integrated comprehensive
One Stop Center • Extensive on-the-ground knowledge • Diverse menu of services • Engagement of many internal and external
partners in the system • Job fair participation • Board committee engagement • Coordination with local government • Performance for WIOA programs
Weaknesses • Lack of a unified identity among partners • Understaffed • Web presence/website • Lack of ESL services • Lack of a clear understanding of partner
services by all front-line staff • Coordination with employers • No/minimal job fair performance outcomes • High number of Board members are new • Lack of metrics relating to mission • New Board member orientation • WIOA Provider results
Opportunities • Better tell PWN success stories • Engage in methods that involve business to
business story telling • Social media presence • Legislative input from CLEO members • Better data on employers needs and
expectations and jobseekers with skills to fill those needs
• Increased engagement with Chambers of Commerce
• New partnerships for funding or resources in order to stretch federal WIOA dollars
• Better metrics for customer satisfaction among job seekers, employers, and partners
• Regional collaboration
Threats • Increased number of job seekers with
significant barriers to employment • Funding cuts across the board within PWN
and internal and external partners • New legislation • Economic changes • Lack of skilled workers • Bureaucratic nature of system • Lack of Board time to understand services • Size and diversity of local area • Many qualified job seekers use other
mechanisms to find a job • Lease is up on the Charlottesville One Stop
3. Capacity to provide the workforce development activities to address the
education and skill needs of the workforce, including individuals with barriers to employment, and the employment needs of employers
PWN is the “go-to” place in the region linking local and regional economic development and
workforce efforts. With this close connection, PWN is able to anticipate industry needs and be
involved in key decisions and initiatives that affect the region’s workforce development
activities. As the regional convener for workforce development, PWN has strong partnerships
between the core and required workforce development partners, including the Virginia

Local Plan – 2016-2020
26 | P a g e
Employment Commission (VEC), the Department for Aging and Rehabilitative Services
(DARS), Adult Education and Literacy, and the community colleges, which allows information
to be disseminated quickly and education and training programs to be tailored to local employer
needs.
The public/private partnership that is the basis of the workforce development board,
which includes private sector representatives from all target industries (Healthcare,
Manufacturing/Distribution, Information Technology, and Business & Financial Services),
allows for extensive knowledge at the table to discuss and develop initiatives to address the
education and skill needs of the workforce. Many sources of funding exist to help this
partnership accomplish their goal, including, but not limited to:
• Workforce Innovation and Opportunity Act (WIOA) Funds to support:
o Adult Program
o Dislocated Worker Programs
o Youth Programs
• Incumbent Worker Training
• Locality Funding, secured through annual budgetary requests
• Virginia Incumbent Worker Innovation Program funding, providing additional incumbent
worker training funding to the Manufacturing Sector
• Workforce Innovation Fund Grant to implement the Virginia Financial Success Network
• Workforce Credentials Grant, administered through the community colleges
• SNAP Employment & Training Grant, administered through Piedmont Virginia
Community College

Local Plan – 2016-2020
27 | P a g e
• Additional discretionary grants operated by the workforce development partners within
the system
All of these grants and funding sources allow the workforce development system within
PWN’s region to be flexible and innovative when providing services to the area’s job seekers,
including individuals with barriers to employment, and employers.
With the PWN having one of the first comprehensive One Stop Centers in the
Commonwealth, the Virginia Workforce Center – Charlottesville, a fully integrated, co-located
Center, the region has been a model for how other One Stop Centers in Virginia should operate.
During the first One Stop Certification process conducted by the Virginia Community College
System, the Virginia Workforce Center – Charlottesville was one of only three comprehensive
One Stop Centers that achieved full certification initially in the Commonwealth. The Virginia
Workforce Center – Charlottesville, serving as the main hub in the region for referrals from the
Affiliate One Stops, continues to see large volumes of visitors each year, and in PY2015 saw a
total of 16,831 visitors, with many of those visitors having significant barriers to employment
(criminal background, low income, lack of supportive services such as transportation or
childcare, and/or low basic skills). PWN has also been extremely successful in the past with
operating the WIOA programs in the region. In PY2015, PWN exceeded all but one Federal
Common Measure, which was at a met level for the WIOA Adult, Dislocated Worker, and Youth
Programs.
D. VISION & GOALS
Mission
To be a proactive partner with employers and economic development leaders by providing a
qualified workforce that meets current and future job demand.

Local Plan – 2016-2020
28 | P a g e
Vision
A proactive, nimble organization that responds to the needs of employers.
1. Goals for preparing an educated and skilled workforce (including youth and individuals with barriers to employment)
PWN, along with the core and required partners in the region have agreed that under the
new WIOA legislation, all of the service delivery strategies and processes need to be developed
around the idea that the employer is the primary customer for the system. While services to the
job seekers are important and key to the development of a talent pipeline, these job seekers are
merely the “product” for the employers. PWN is fortunate to have staff involved with the Talent
Pipeline Management Academy, a pilot project put together by the U.S. Chamber of Commerce,
which utilizes supply chain management practices when developing talent pipelines for
employers. This methodology is available to the region to use and will be a tremendous resource
for PWN to accomplish the mission and vision of the region.
PWN worked with Mary Ann Lawrence, CEO/Owner of PowerNotes LLC, to develop a
strategic plan that would coincide with the timeline of the Local Plan (2016-2020). This strategic
plan devising strategies to meet the goals of the Combined Virginia State Plan, the new WIOA
legislation, and the needs of our local economy. Through the development process, the
workforce development system has set forth four priority goals for the next four years, two of
which directly relate to developing an educated and skilled workforce (including youth and
individuals with barriers to employment). Key objectives to these priority goals will be
established by the committees to the Workforce Development Board in PY2016.
• Priority Goal 1: Identify workforce development needs, including skills gaps, in
businesses within the targeted industries and develop talent pipeline strategies to meet
those needs.

Local Plan – 2016-2020
29 | P a g e
• Priority Goal 2: Support dynamic partner alignment and integration to better serve
business customers and job seeker clients.
The main focal point of the mission of PWN deals with creating a qualified workforce
that meets current and future job demand. A large part of creating this qualified workforce
involves making sure that our workforce has the skills and/or credentials necessary to meet our
employers’ needs. This will require the workforce development system to not only seek the
counsel of local employers on their employment needs, but also to rely on economic
development leaders in the communities to communicate needs as they arise. As the regional
convener for workforce development activities, the public/private partnership that makes up the
members of the Local Workforce Development Board provide a direct insight into the needs of
local employers. Also, due to the regional economic development organization, the Central
Virginia Partnership for Economic Development, being co-located with PWN, the workforce
development system has a direct line to the economic development partners.
Under the Workforce Investment Act (WIA), the achievement of credentials by
participants in the Adult and Dislocated Worker programs was a performance measure put into
place by the Commonwealth of Virginia. The definition of a “credential” was flexible, and
tended to include certificates of completion from non-credit community college courses. Under
the Workforce Innovation and Opportunity Act (WIOA), the measure falls under the Department
of Labor performance requirements, and the definition of credential has been changed to focus
more on industry-recognized credentials. These include credentials that are recognized by a
third-party institution, such as the Board of Nursing, manufacturing associations, and welding
associations. The credential attainment measure also becomes a performance measure for the
Youth program under WIOA, which previously did not exist under WIA. Below is a chart which

Local Plan – 2016-2020
30 | P a g e
details the performance goals of PWN for credential attainment in PY2016 and PY2017 versus
under WIA in PY2015.
PWN Credential Attainment Performance
Program PY2015 PY2016/2017 Target 80% Level Actual* Target
Adult Credential Rate 56.0% 44.8% 75.0% 61.0% Dislocated Worker Credential Rate 57.0% 45.6% 89.2% 74.1% Youth Credential Rate 52.0% 41.6% 88.6% 77.6%
*All actuals in PY2015 exceeded the target measure.
Another performance measure that was added under the federal standards is Measurable
Skills Gain. While this measure has not been defined completely, the measure will be related to
skills gained for the participants under the WIOA program. The first two years of the legislation
(PY2016 and PY2017) will be baseline years for the metric, and performance will be set
following the initial two years.
2. Goals relating to the performance accountability measures based on performance indicators described in §677.155(a)(1)
Under the Strategic Plan being developed for the region, PWN has prioritized the
methodology of documenting evidence-based return on investment data through a performance
management dashboard. The Board and Council (CLEOs) have always received a performance
dashboard from the Virginia Community College System (VCCS), detailing the performance of
the WIOA Adult, Dislocated Worker, and Youth Programs. The Board and Council (CLEOs)
have agreed that in order to review the workforce development system as a whole, the
performance dashboard must show measurements and outcomes beyond just the WIOA
programs. PWN commits to developing a performance based dashboard with additional
measures other than the Federal Common Measures for review on a quarterly basis. This
performance dashboard will inform the representatives on the PWN Board and help to drive
strategic conversations regarding workforce development initiatives.

Local Plan – 2016-2020
31 | P a g e
As stated above, the federal performance measures, or Common Measures, have changed
under the new WIOA legislation. These new performance measures streamline the workforce
development system, and bring Title I, Title II, Title III, and Title IV programs under the same
performance to strengthen and align services. Below are the Common Measures that have been
negotiated with the Commonwealth of Virginia for PWN’s region during PY2016 and PY2017.
PWN Performance Measures – PY2016 & PY2017 Adult PWN Virginia
Employment 2nd Quarter After Exit 73.8% 77.0% Employment 4th Quarter After Exit 78.3% 85.0% Median Earnings 2nd Quarter After Exit $3,286 $5,500 Credential Attainment 61.0% 61.0% Measurable Skills Gain Baseline Baseline
Dislocated Worker PWN Virginia Employment 2nd Quarter After Exit 77.8% 83.0% Employment 4th Quarter After Exit 83.0% 85.0% Median Earnings 2nd Quarter After Exit $6,027 $7,600 Credential Attainment 74.1% 64.0% Measurable Skills Gain Baseline Baseline
Youth PWN Virginia Employment 2nd Quarter After Exit 72.4% 63.0% Employment 4th Quarter After Exit 61.5% 60.0% Median Earnings 2nd Quarter After Exit Baseline Baseline Credential Attainment 77.6% 68.0% Measurable Skills Gain Baseline Baseline
E. STRATEGY & PARTNERSHIPS
Provide a description, taking into account the analyses described above, of a strategy to work with the entities that carry out the core programs and required partners to align resources available to the local area, to achieve the strategic vision and goals described above.
The focus of the strategy for the workforce development system will be to meet the needs
of local employers. While the strategy to focus on industry sectors will continue to be at the
forefront, PWN also recognizes that within each industry, needs vary from employer to
employer, so it is crucial to validate data and information gathered from outside sources with our
local businesses. In order to meet the needs of the local employers, PWN has put into place
Local Plan – 2016-2020
32 | P a g e
systems and processes to ensure that funding received from the Department of Labor for the
WIOA programs will be used solely to support the career pathways toward in-demand
occupations in the target industries.
While WIOA funding will be leveraged to support in-demand occupations and industries,
it is also important to leverage the other funding that is brought in by internal and external
partners in the workforce development system. This includes the Title II – Adult Education and
Literacy, Title III – Wagner-Peyser, and Title IV – Vocational Rehabilitation partners in the One
Stop system. With the release of the final rules of the WIOA legislation and the development of
policies by the Virginia Board of Workforce Development, PWN will be facilitating partner
meetings and development sessions to determine where duplicative resources exist and how
those can be eliminated, including financial resources.
It is important to analyze the customer flow and structure of the triage system in the One
Stop Centers, including not only the comprehensive center but also the affiliate sites. With the
elimination of the requirement that an individual must receive core and intensive services prior to
being provided training services, a customer now has access to training immediately. PWN will
be facilitating discussions relating to the intake and assessment process in the One Stop Centers,
including how referrals are facilitated and co-enrollment is encouraged. Co-enrollment is a best
practice for how to reduce duplication of services and will ensure that multiple funding streams
are utilized to achieve a common goal.
In order to further align resources and integrate services to carry out the vision and goals
as stated above, the partners in the workforce development system agree to:
• Understand the goals and performance metrics of each other’s organization to unify under
a common identity.

Local Plan – 2016-2020
33 | P a g e
• Align planning and budgeting processes in order to prioritize important workforce
development initiatives and reduce duplication of services.
• Conduct joint planning exercise, starting with front-line staff and processes and working
up toward management.
• Coordinate resources and promote information sharing to improve performance and
increase services to customers.
• Promote excellent customer service practices and focus on continuous improvement for
service delivery.
• Utilize teams, similar to Integrated Resource Teams that work for the region’s partner
organizations.
F. ADDITIONAL STRATEGIC ELEMENTS
1. A regional vision for workforce development
Processes and functions in the business world are sometimes operating at an extremely
fast pace. In order for the workforce development system to be successful, it must be nimble,
proactive, and flexible. In order to achieve this vision, significant collaboration and an effective
communication mechanism must be in place to streamline services and processes. The region has
also established that the employer is the primary customer for the workforce development
system, and the job seekers, while also customers, are the supply to be trained and prepared for
the region’s employers.

Local Plan – 2016-2020
34 | P a g e
2. Protocols for planning workforce strategies that anticipate industry needs
Economic development partners in the PWN are the first resource that will be used to
anticipate industry trends or immediate needs. As many of the localities and regional economic
development organization conduct business retention and outreach activities, PWN and the
workforce development system will utilize their activities as a way to gather information
regarding workforce development needs. By having fully functioning and efficient Business
Services Teams in the region, these teams will be the main point for the workforce development
system to communicate industry and employer needs with all partners.
The Labor Sector Strategy Study that has already been undertaken by PWN will also
serve as a resource to the workforce development system, as the information gathered during the
study details the industry and occupation trends in the region, as well as the skills and/or
credentials that are necessary to meet the needs of business. An annual update or review of the
information collected will be critical to remaining up-to-date and having real-time information
available to the workforce development system. All partners in the system, whether internal or
external, have committed to use the data and information gathered to plan programs, curricula,
and initiatives for future activities.
There are also several existing groups within the region that hear from employers on a
regular basis regarding their workforce needs. One prime example of such a group are the
Employer Advisory Councils that are required at the community colleges. These groups
incorporate economic development, employers, and providers in small groups to discuss
workforce challenges, needs, and initiatives that are ongoing. The structure varies between the
three community colleges in the region, but all are successful in gathering information that is
vital to the success of the workforce development system in the region.
Local Plan – 2016-2020
35 | P a g e
3. The needs of incumbent and underemployed workers in the region
Incumbent Worker Training is one of the services provided by the workforce
development system that is of great need and interest to the local employer community. The
potential for WIOA funding to be used for the training of existing workers creates opportunities
for the workforce development system to assist lower skilled individuals or job seekers that have
barriers to employment. By training their existing workforce and providing additional skills, the
employees in entry-level positions can progress along the career pathway into more middle and
high skilled occupations. This, in turn, leads to job openings in entry-level positions that are
easily accessible for the populations are unemployed or underemployed.
WIOA funding from the Adult and Dislocated Workers program can be used to provide
Incumbent Worker Training, but only for a limited amount. In order to provide ample services to
the employers in the region, PWN successfully secured a $200,000 award from the Virginia
Incumbent Worker Innovation Program released by the Governor for July 1, 2016 through
December 31, 2017. This funding is also being leveraged with the Workforce Credentials Grant
and FANTIC funding through the local community colleges to provide the most resources to the
employer as possible.
In order to establish the needs of incumbent workers in the region, it will be critical to
rely on existing groups and outreach efforts to communicate employers’ needs for their existing
workforce to the system of partners. The Business Services Team, economic development
partners, and Employer Advisory Councils will communicate any incumbent worker needs to the
PWN staff so that analysis and plans can be made to provide funding and training to local
employers’ existing workers.
In order to provide services and understand the needs of underemployed workers, PWN
will need to take a more proactive approach in seeking out innovative forms of marketing. This
Local Plan – 2016-2020
36 | P a g e
will include using existing social media and technological outlets that are accessed regularly by
the region’s job seekers, such as Facebook and Twitter. It also may result in holding more after-
hours job fairs so that individuals, who are underemployed and looking for an employment
opportunity that allows them to be self-sufficient, can attend.
4. The development of partners and guidelines for various forms of on-the-job training, such as registered apprenticeships
For on-the-job training opportunities, it will be critical to form public-private partnerships
between local employers and PWN. The success of these programs with the region’s job seekers
is dependent on the employer recognizing their important role in the development and execution
of on-the-job training and apprenticeship opportunities. PWN will explore best practices and
strategies with leveraging increased WIOA funding toward on-the-job training and
apprenticeship opportunities. One best practice that already exists in the region is Germanna
Community College and its registered apprenticeship programs. PWN and the other partners in
the workforce development system will explore Germanna’s strategies with the apprenticeship
programs and work toward expanding their model throughout the region.
5. The setting of standards and metrics for operational delivery
Virginia’s Combined State Plan outlined primary goals to align the Commonwealth’s
workforce development system. The federal common measures from the WIOA legislation
provide some insight into the success of the programs, but on a local level, the PWN Board and
Chief Local Elected Officials have requested that additional measures be established to show
success of the system. These measures will align with the goals of the Combined State Plan for
the Commonwealth as well as the strategic goals of the PWN Board and Chief Local Elected
Officials.
GOAL: Increase business engagement and deliver value to the customers

Local Plan – 2016-2020
37 | P a g e
Performance Metrics:
i
• Number of new employers receiving
services through the workforce
development system
• Number of employers receiving
more than one service through the
workforce development system
• Number of employers attending job
fair activities throughout the region
• Number of placements as a result of
job fair activities
• Number of job seeker referrals to
employers for employment
opportunities
• Number of placements as a result of
above referrals
GOAL: Achieve measurable skills development in our job seeking customers in the form of
workforce credentials that matter to business
Performance Metrics:
• Credentials obtained by participants
in core partner programs
• Number of individuals increasing
basic reading and math skill level by
one national level or more
GOAL: Fill in-demand occupations that show promise for long-term growth in industries that
are strategic to Virginia’s economy and strengthen PWN’s region
Performance Metrics:
• Number of individuals placed in
employment
• Number of individuals retaining
employment for at least one year
after placement

Local Plan – 2016-2020
38 | P a g e
• Number of job placements within
target industries
GOAL: Help individuals, including individuals with barriers, gain access to the middle class and
demonstrate career progression
Performance Metrics:
• Number of credentials gained with
target industries
• Median wages of participant
• Number of individuals with multiple
credential attainments in career
pathway progression
GOAL: Ensure that workforce system public investment generate a quality return to Virginia and
the customers we serve
Performance Metrics:
• Wage gains of individuals in core
programs
• Return on investment study
• Number of co-enrolled clients to
show leveraging of resources and
non-duplication of services
6. Alignment of monetary and other resources, including private funds and in-kind contributions, to support the workforce development system
One of the best practices that PWN has already implemented is requesting additional
funding from each of the eleven (11) localities within the region. During the annual budgetary
process, each locality offers an opportunity for outside agencies to request money to support the
constituents of the locality. To date, PWN receives consistent funding from 6 out of the 11
localities in the region and has received funding from as many as 8 localities over the years. By
reaching out to the localities and spreading awareness of the PWN’s mission and activities to
support workforce development, the goal is to have all 11 localities contributing to PWN in the
future.

Local Plan – 2016-2020
39 | P a g e
With the new WIOA legislation expanding the idea of infrastructure plans within
comprehensive One Stop Centers, PWN has already begun discussions with the core and
required partners in the comprehensive One Stop, the Virginia Workforce Center –
Charlottesville. The Virginia Workforce Center – Charlottesville was established in 2007 as one
of the pilot One Stops in the Commonwealth under Governor Tim Kaine. The Virginia
Workforce Center – Charlottesville has had an infrastructure plan in place since that time,
although with the new outlook from the Governor’s office toward the contributions of the core
partners, there may be some discussions regarding the methodology that is currently being used.
The ten year lease of the One Stop is coming to an end in January 2018. At that time, PWN looks
forward to implementing a new infrastructure cost plan that will include the core partners and
those partners that are co-located at the new One Stop location. This discussion will focus on
how to maximize the resources of the partners and eliminate duplication, while also referencing
the WIOA legislation, policy developed by the Virginia Board of Workforce Development, and
guidance from the Virginia Community College System.
7. The generation of new sources of funding to support workforce development in the region
In order for new sources of funding to be achieved and be used efficiently and
effectively, the core and required partners agree that collaboration and cooperation are key to
applying for and securing funds. Competition among the partners does not foster good working
relationships and can create confusion and duplication of services for the job seekers and
employers in the region. All of the core and required partners commit to strengthening
communication systems regarding additional funding opportunities and create systems for buy-in
and sharing of resources. The partners also agree to explore more local sources of funding prior
to reaching out for more advanced grants, such as grants administered by the Department of

Local Plan – 2016-2020
40 | P a g e
Labor. Examples of these funding opportunities would be the local United Way, community
foundations, and public/private partnerships.
PWN has already begun discussions with the core and required partners in the workforce
development system to identify gaps in services and areas where increased funding could
maximize services provided to the region’s job seekers and employers. Some of the identified
areas where additional funding would enhance services include:
• Veterans Services
• Supportive Services, such as childcare, transportation assistance, emergency and needs-
related payments, etc.
• Services to those individuals who are underemployed and do not meet the income
threshold of WIOA programs
• Funding to support contextualized and integrated training opportunities that include
workplace readiness, occupational skills training, and on-the-job training
• Funding available to employers to train their existing workforce
• Services to the homeless population for more intensive employment activities
• Education and training opportunities for English Language Learners
II. LOCAL WORKFORCE DEVELOPMENT SYSTEM ELEMENTS
A. PROGRAMS/PARTNERS OVERVIEW
Provide a description of the workforce development system in the local area that identifies:
1. The programs that are included in the system
The following programs are included within the workforce development system within
Local Workforce Development Area 6.

Local Plan – 2016-2020
41 | P a g e
• Title I – Workforce Innovation and Opportunity Act (WIOA) Programs – The three
WIOA Title I programs, Adult, Dislocated Worker, and Youth, are currently operated by
Goodwill Industries of the Valleys, in partnership with Rappahannock Goodwill
Industries. Goodwill was selected through a competitive procurement process to run the
three programs. The current contract extends through June 30, 2018.
• Title II – Adult Education and Literacy Programs – Virginia’s Department of Education
has competitively procured the contracts to operate the Adult Education and Literacy
programs in the Commonwealth, and in the PWN region, there are currently two separate
contractors. Thomas Jefferson Adult and Career Education (TJACE) is the operator for
adult education programs in Planning District 10 (City of Charlottesville and the Counties
of Albemarle, Fluvanna, Greene, Louisa, and Nelson), while Piedmont Regional Adult
and Continuing Education Programs (PRACEP) is the operator in Planning District 9
(Counties of Culpeper, Fauquier, Madison, Orange, and Rappahannock). A new Request
for Proposals will be released in January 2017 to begin a new procured contract as of July
1, 2017.
• Title III – Wagner Peyser – The Virginia Employment Commission (VEC) operates the
Title III programs under Wagner Peyser in PWN’s region. A regional office exists in the
region and is co-located with the comprehensive One Stop in Charlottesville. VEC
employees do travel to other localities within the region to provide services in rural and
remote locations, including spending time at the Affiliate Centers.
• Title IV – Vocational Rehabilitation – The Division of Rehabilitative Services within
Virginia’s Department for Aging and Rehabilitative Services and the Department for
Blind and Vision Impaired are two agencies that are located within the PWN region and

Local Plan – 2016-2020
42 | P a g e
administer vocational rehabilitation programs under Title IV. Two regional offices of
DARS are located within the region and one regional office is co-located with the
comprehensive One Stop in Charlottesville, covering the City of Charlottesville and the
Counties of Albemarle, Buckingham, Fluvanna, Greene, Louisa, and Nelson. The second
regional office is located in Culpeper County and serves the Counties of Culpeper,
Fauquier, Madison, Orange, and Rappahannock. DBVI does not have a physical office
located with the PWN region, as it is located in Staunton, Virginia, but vocational
rehabilitation counselors travel to the region to administer services to eligible individuals.
• Jobs for Veterans State Grants – The VEC also administers programs under the Jobs for
Veterans State Grant held by the Commonwealth of Virginia. Offices of a Local Veterans
Employment Representative and a Disabled Veterans Outreach Program (DVOP) Case
Manager are at the comprehensive One Stop in Charlottesville. These individuals conduct
outreach to local employers to promote incentives and programs for hiring Veterans,
including the Virginia Values Veterans (V3) Programs. The DVOP Case Manager assists
Veterans who are 80% or more disabled as a result of military tenure.
• Higher Education Programs – The three community colleges within the region,
Germanna Community College, Lord Fairfax Community College, and Piedmont
Virginia Community College (PVCC), all administer programs as well as provide
educational and training curricula for potential students. These programs are funded
through discretionary grants that have been received by the community colleges,
including but not limited to, GoodCare, Sector Partnership Grants, and the Workforce
Credentials Grant.
Local Plan – 2016-2020
43 | P a g e
• SNAP Employment & Training – PVCC was awarded one of the SNAP Employment &
Training Grants (SNAP E&T) through the Department of Labor. PVCC, in partnership
with the Departments of Social Services in Albemarle County, Greene County, and the
City of Charlottesville, administer the grant to qualified participants to provide them
training and education to help them enter the workforce.
• Community Based Organizations – There are multitudes of community-based
organizations in the region that contribute to the workforce development system,
including but not limited to, Chambers of Commerce, Planning District Commissions,
United Way branches, Literacy Volunteers and Councils, Community Action Agencies,
Regional Transit operations, and Housing and Redevelopment Authorities.
• Local Economic Development Offices – 10 out of 11 jurisdictions in the PWN region
have an office dedicated to economic development for the locality. All 10 offices
collaborate with PWN on a regular basis and provide valuable insight into the existing
business in the region, including business projects and potential expansions. The regional
economic development office, the Central Virginia Partnership for Economic
Development, is the fiscal and administrative agent for PWN, co-located on site at the
comprehensive One Stop in Charlottesville. The President of the Central Virginia
Partnership also serves as the Executive Director of PWN.
• Registered Apprenticeship – There are two entities in the region that function as the
regional apprenticeship offices, the Charlottesville Albemarle Technical Education
Center (CATEC) and Germanna Community College. Both organizations communicate
regularly with the Department of Labor and Industry (DOLI) regarding successes and
programmatic additions to the Registered Apprenticeship program in the Commonwealth.

Local Plan – 2016-2020
44 | P a g e
Currently, there are many opportunities for individuals who are interested in
apprenticeship opportunities to be sponsored by an employer and enter technical training.
• Senior Community Service Employment Program (SCSEP – Title V) – The SCSEP
Program is administered by Goodwill Industries of the Valleys in Planning District 10
and administered by Rappahannock Area Agency on Aging in Planning District 9. In
Planning District 10, the SCSEP Program is co-located at the comprehensive One Stop in
Charlottesville. The SCSEP Program is Planning District 9 is located frequently at the
Orange Workforce Center, which is an Affiliate Center within the region.
• Trade Act – While the Trade Act Program administered by the Virginia Employment
Commission (VEC) is not regularly active, there are some petitions still remaining within
PWN’s region. The VEC regional office, which is co-located at the comprehensive One
Stop in Charlottesville administers the Trade Act program to all eligible participants.
• Rapid Response Regional Office – Northern Virginia – PWN’s region falls under the
Northern Virginia region, administered by Northern Virginia Community College
(NVCC), for Rapid Response activities. Recently, NVCC added a second staff person for
the Rapid Response program that is located within the Shenandoah Valley region. This
has created a great resource for PWN’s region, as the person is now located nearby and
can attend events conducted by the One Stop system more regularly.
• Temporary Assistance for Needy Families (TANF)/ Virginia Initiative for Employment
Not Welfare (VIEW) – All Departments of Social Services within the eleven localities in
PWN’s region participate in the workforce development system, with the range of
participation varying. Some offices visit the One Stop Centers frequently to promote
services and receive referrals, and other outlying localities provide referrals through the

Local Plan – 2016-2020
45 | P a g e
use of technology. With the Governor agreeing that TANF/VIEW is a mandated partner
in the workforce development system, PWN plans to increase the communication and
involvement by these partners in service delivery.
2. How the Local WDB will support the strategy identified in the State Plan under § 676.105
Unify Under a Common Agenda and Shared Outcomes
The PWN and all partners within the workforce development system have established
that the primary goal is to create a qualified workforce that meets current and future job demand.
In order to accomplish this goal, it is imperative that each partner is educated on the services
provided by other entities in the system and the subsidiary goals that the other partners hope to
achieve. Along those same lines, it is also important that all partners, including ones that do not
fall under the WIOA legislation, are aware of the common performance measures under WIOA.
PWN will establish a common reporting mechanism so that the Local Workforce Development
Board reviews performance from all core partners in order to ensure that the workforce
development system is functioning at an efficient level. The PWN Board will also define
additional performance measures regarding return on investment, regional successes, and
outcomes that show the success of the workforce system as a whole rather than by agency or
program.
Embrace Technology and Data Integration Opportunities
Technology will be at the forefront of service delivery discussions and implementation
strategies going forward for PWN, with the ultimate goal of expanding service access throughout
the region, including into rural localities. PWN will purchase a set of laptops for each of the
Planning Districts in the region, to be housed at the Virginia Workforce Center – Charlottesville
and the Culpeper Workforce Center. These “mobile computer labs” will be available for any

Local Plan – 2016-2020
46 | P a g e
partner agency to check out in order to provide workshops, eligibility determinations, case
management services, or other workforce services in remote locations. PWN will also purchase
eleven webcams to be placed at one location in each locality. This will provide a direct link with
the Virginia Workforce Center – Charlottesville, the comprehensive One Stop in the region, and
the Culpeper Workforce Center, which is the main Affiliate site within Planning District 9. These
webcams could be placed at libraries, Departments of Social Services, or Community Action
Agencies in order for referrals to occur on a face-to-face basis or for questions to be asked
regarding available resources.
PWN has also been chosen by the University of Virginia Computer Science Department
as one of the non-profits to benefit from a student working group’s Capstone project. The team
of students is working with PWN staff to develop a Customer Relationship Management system
to be used by the Business Services Teams in the region. This system will allow for all partners
to input data in the system regarding services requested by an employer, assign tasks and duties
to partners in the workforce development system, regardless of physical location, follow-up
processes for providing those services, and include a file storage system to collect resumes and
store job descriptions. This project is projected to be completed in May 2017.
In the past with additional funding from the localities, PWN has conducted webinars on
the different services available to employers. These webinars were certified for SHRM credits
for Human Resources Professionals and were attractive to the local employers. PWN will
explore the opportunity to conduct these webinars again on the services that are available
through the workforce development system. In the meantime, PWN will conduct information
sessions on the services available throughout the region by presentations to groups such as
chambers of commerce, rotary clubs, and existing employer advisory groups.
Local Plan – 2016-2020
47 | P a g e
Effectively and Efficiently Manage and Develop Resources (Human and Financial)
A fully integrated comprehensive One Stop Center in the region will provide a resource
for job seekers and employers to receive services in order to meet their workforce development
needs. All mandated and co-located partners in the comprehensive One Stop commit to
contributing toward the comprehensive One Stop operation, and will develop an infrastructure
model to support the One Stop that is fair, equitable, and compliant with the ideas and policies
put forth by the Commonwealth of Virginia. The comprehensive One Stop in the region, the
Virginia Workforce Center – Charlottesville, which was one of the pilot One Stops in the
Commonwealth of Virginia, is nearing the end of a 10-year lease in the current space. The
location of the One Stop after January 31, 2018 has not yet been decided, and until the new space
has been designated, the current infrastructure (cost-allocation) plan will remain in place.
While an infrastructure model will assist in funding the comprehensive One Stop
location, PWN will also develop a functional organizational chart for the new One Stop Center,
which includes all mandated and co-located partners. This will further reduce the risk of
duplication of effort and services among the mandated and co-located partners. The layout of the
new One Stop will be focused on integration of services and PWN will explore the idea of
placing staff among functions, rather than by agency in the One Stop Center. Some functional
assignments may include Business Services, Veterans Services, Case Management, and/or Job
Development.
It will also be important for the mandated and co-located partners to review the guidance
released by the Virginia Board of Workforce Development and the Virginia Community College
System (VCCS) in order to maximize services and reduce duplication, especially the duplication
of financial resources. PWN will use the new WIOA legislation to further define the roles and

Local Plan – 2016-2020
48 | P a g e
responsibilities of partner agencies within the Resource Room and One Stop Center model and
include these duties in the Memorandums of Understanding (MOUs) that are developed.
Professional development is another activity that can be braided or combined to reduce
human and financial resources that are spent on these tasks. While it will save money and time of
staff, it will also provide opportunities for all staff to be educated on the workforce development
system as a whole, and give front-line staff best practices and strategies to serve job seekers and
employers. These professional development activities will include cross-training and education
regarding services, eligibility, and resources among mandated and required partners.
Develop and Respond to Actionable Labor Market Intelligence
There are many labor market intelligence tools in the region that exist today for
utilization by PWN and its partner agencies. These tools include the Labor Market Information
system provided by the Virginia Employment Commission (VEC), EMSI, JobsEQ, Hoovers, and
ESRI. While the PWN staff and partner agencies use this data on a frequent basis, PWN will
explore conducting a webinar or information session on the labor market tools that are currently
available in the region for job seekers and/or employers.
As a part of the Labor Sector Strategy Study that PWN began conducting in July 2015,
comparing and contrasting the data from all of these resources has provided information for
partner agencies on the state of the workforce in the region. PWN will continue with the Labor
Sector Strategy Study for the duration of this Local Plan and utilize not only data systems in
place, but also local economic development representatives to provide real-time information on
employer needs. One new initiative that PWN will undertake, pending financial resources, will
be the creation of an online platform to house this information and to connect all of the resources
together in a single location for use by not only the partners within the workforce development

Local Plan – 2016-2020
49 | P a g e
system, but also by interested job seekers and employers. With a variety of services in the
workforce development arena in the region, a single resource for this information does not exist.
Without this resource, agencies will continue to duplicate services and may request new funding
to add resources that already exist. This will further streamline processes and initiatives and help
the workforce development system act as a cohesive unit.
Employ Relevant and Effective Talent Development Strategies
As mentioned above, PWN is fortunate to be involved with the U.S. Chamber of
Commerce’s Talent Pipeline Management Academy, a new initiative that seeks to use supply
chain management tactics to create pipelines of potential candidates for employers. While the
methodology and curriculum for this strategy is still new, the tactics have been deployed by
some local communities around the nation. This methodology involves the development of
employer collaboratives to strengthen employer buy-in to workforce development activities. The
U.S. Chamber of Commerce Education Foundation researched the success of activities in the
past with workforce development and found overwhelmingly that without employer backing and
financial support, employers were less likely to participate fully in workforce development
activities. Employer collaboratives formed under the Talent Pipeline Management strategy drive
programmatic and funding decisions based on their recruitment pain points. PWN will work to
implement this methodology, form employer collaboratives, and analyze talent flows and
providers to maximize talent pipelines to local employers.
A proven success in the region has been the implementation of regional and local job
fairs hosted by the One Stop Centers in the region. The Virginia Workforce Center –
Charlottesville has been consistently hosting at least two job fairs a month for the region’s job
seekers, involving on average 10-20 employers each fair. PWN will capitalize on this success

Local Plan – 2016-2020
50 | P a g e
and commit to promoting targeted job fairs for the region’s industries, while emphasizing the
number of placements over the number of attendees.
It will also be important to ensure that the region’s incumbent workforce is provided the
opportunity to continue up the career pathway in order to fill replacement employment
opportunities with local employers as well as create additional job opportunities for entry-level
workers. This will involve the use of incumbent worker training funding, customized training,
and layoff retention strategies provided by the Rapid Response unit in Northern Virginia.
Transform the Workforce Service Delivery System
The new WIOA legislation provided an opportunity to analyze the service delivery and
customer flow within the comprehensive One Stop Center as well as the Affiliate Centers. The
elimination of the tier of services under the Workforce Investment Act (WIA) legislation
provides easier and quicker access to training services for job seekers, which can assist the
workforce development system in meeting the needs of businesses in a timely and efficient
manner. One area of opportunity for PWN is with the expiration of the lease at the
comprehensive One Stop Center in Charlottesville. The potential for the Virginia Workforce
Center – Charlottesville to relocate to a different facility presents the opportunity to redefine the
customer flow and integration of partners in a human centered design. By organizing the partner
agencies by function instead of by agency and integrating staff, partners will jointly work
together to meet common performance measures and goals. This design and strategy is more
applicable under WIOA than WIA since the Federal Common Measures applying to all core
partners in the new legislation.
This integration methodology also will encourage the utilization of co-enrollment
practices and the use of the Integrated Resource Team model. Under WIOA, with the Federal
Local Plan – 2016-2020
51 | P a g e
Common Measures applying to all core partners, co-enrollment becomes a priority as the
partners must work together in order to achieve performance goals as a region, as well as to drive
success in moving job seekers up the career pathway to self-sufficiency. By co-enrolling
individuals within the applicable partner agencies and using integrated education opportunities,
job seekers will be able to receive foundational skills, occupational skills training, mentoring and
counseling toward meeting their barriers to employment, and job placement services. Providing
all of these services together will ultimately lead to success for the job seekers and ensure
appropriate performance for the partner agencies.
This new era also allows PWN to expand some of the pilot programs and initiatives that
have been taking place in the region prior to the Local Plan being developed. Models of
integrated training that incorporate mentoring and mental health counseling (if applicable) into
occupational skills training opportunities have proven to provide not only a successful avenue for
credentials to be attained, but also promote job placement and retention with local employers.
Work-based learning opportunities have also been successful in the region, and by having
employer participation in these models, the potential for employment at the conclusion is
significantly higher. These small pilot programs have been centralized to one or two localities,
but with PWN functioning as the regional convener for workforce development, there may be an
opportunity to obtain additional resources and funding to expand access to these programs and
services.
Hold System Partners Accountable to Outcomes and Ensure Transparency in Performance
Reporting
Core partners identified in the WIOA legislation (Title I – WIOA Adult, Dislocated
Worker, and Youth Programs, Title II – Adult Education and Literacy, Title III, Wagner-Peyser,

Local Plan – 2016-2020
52 | P a g e
and Title IV – Vocational Rehabilitation) will each report on their progress and attainment of the
Federal Common Measures set forth by the WIOA legislation. These reports are provided by the
state agencies in charge of oversight of the programs. By sharing the same common measures
among each other, the processes for service delivery should align to provide a streamlined
process for job seekers and employers.
In alignment with the strategic plan developed for the workforce development area, the
core and mandated partners will also work toward the creation of a performance dashboard to be
reviewed on a quarterly basis. This report will go beyond the Federal Common Measures
reporting and provide outcomes for regional services and programs, such as hires from job fair
activities, employer satisfaction, and more. PWN will also utilize the data collection
methodology in the Quality Standards for One Stop Centers Policy developed by the Virginia
Board of Workforce Development to analyze service delivery and outreach.
3. How the Local WDB will work with the entities carrying out core programs and other workforce development programs, including programs of study authorized under the Carl D. Perkins Career and Technical Education Act of 2006 (20 U.S.C. 2301 et seq.) to support service alignment
PWN and its partner programs agree that collocation for required partners under WIOA is
the most effective and efficient way to eliminate duplication of services and resources. The core
partners outlined in the WIOA legislation provide key funding and programmatic resources for
the region’s job seekers and employers and providing services at a single location creates a
streamlined, tactical approach to service delivery for the region’s job seekers and employers.
Likewise, universal access to services provided by all workforce development system partners,
regardless of location, is critical to the success of the system as a whole. The potential for the
comprehensive One Stop Center to be in a new location or different set up is an opportunity to

Local Plan – 2016-2020
53 | P a g e
redesign the customer flow and service delivery process to ensure that these strategies are
implemented effectively.
While the partner programs are able to provide financial resources to train and educate
the workforce to meet current and future job demand, it is also critical that the programs being
offered by the community colleges and education providers are in targeted industries and meet
business needs in the region. These programs should provide job seekers with relevant skills,
education, and/or credentials to obtain in-demand occupations and assist in the development of
talent pipelines of qualified workers for the region’s employers. Job seekers will not be
successful in these programs without the foundational (reading and math) or workplace readiness
skills administered by Title II – Adult Education and Literacy providers. These foundational
skills are currently being taught on-site at the comprehensive One Stop Center and the partners
commit to promoting the utilization of the courses more and more with their job seeker
populations.
4. How the Local WDB will collaborate with the community colleges
See Section II. K.
5. How the Local WDB coordinates and interacts with Chief Local Elected Officials (CLEO)
The Board and Council (CLEO) for PWN’s region have always been a cooperative group
ensuring that the workforce development system is efficient and effective. In order to fully
establish the roles and responsibilities of PWN’s Board and Council (CLEO), a CLEO-WDB
Agreement was formed. Using the WIOA legislation, Virginia Board of Workforce Development
policy, and Virginia Workforce Letter guidance, the duties of each group were outlined with the
Board and Council both approving the document. This outline provides clarity to the member
representatives of the two groups and eliminates duplication. The two groups also participate in

Local Plan – 2016-2020
54 | P a g e
strategic planning activities at joint meetings at least once a year, which include the development
of Strategic and Local Plans and WIOA One Stop and Program Operator decisions.
In order to provide transparency and an efficient communication mechanism, the Council
meetings have always been held on the same day as an immediately prior to the Board meetings,
and Council members are encouraged to stay for the full Board meeting to hear a detailed
account of activities and initiatives that are new and/or ongoing. The Chair(s) of the Board also
attend the Council meetings as ex-officio members to provide input from the private sector and
the Board on Council decisions. With the new WIOA legislation promoting accountability and
performance sharing among the partners, PWN will explore ways to further inform the Council
members on activities overseen by the WDB, including a performance report on the partner
programs in the region. While it is important to show the performance of the WIOA programs, as
the Council members have fiscal responsibility for their success, it will be key to also inform the
Council members on the programs system-wide as they have the influence and capacity to
suggest policy changes from the top down.
6. How the Local WDB meets its responsibilities for oversight, monitoring, and corrective action for WIOA Title I programs
PWN staff to the Board perform administrative, fiscal, and programmatic monitoring
tasks in-house in order to inform the Board and Council members on the activities of the WIOA
Title I programs. Board staff are tasked with the oversight of the WIOA One Stop and Program
Operator, which is Goodwill Industries of the Valleys. The staff provide technical assistance on a
frequent basis to the WIOA Program staff and are always open to communication from case
managers and finance staff. PWN staff performs programmatic and administrative monitoring of
the WIOA Adult, Dislocated Worker, and Youth programs on a biannual basis and chooses at
least 10% of active files to review eligibility, activities, and services. Fiscal monitoring of

Local Plan – 2016-2020
55 | P a g e
expenditures occurs on a monthly basis, and 100% of invoices are reviewed for accuracy and
allowability. A larger fiscal monitoring takes place annually when PWN staff travel to Goodwill
Industries of the Valleys headquarters to meet with fiscal staff and review back-up
documentation for fiscal processes and payroll. After each biannual programmatic and annual
fiscal monitoring, a corrective action plan is issued to Goodwill Industries of the Valleys staff
with a 30 day response deadline. The corrective action plan provides explanation of the findings
and concerns within the monitoring process and requests specific corrective action to follow up.
Goodwill Industries of the Valleys not only responds to the request, but also provides back-up
documentation to show that the corrective action has been completed.
PWN also participates in compliance reviews and data validation by the Virginia
Community College System (VCCS). A compliance review of the files takes place biannually,
once as a desk review at the VCCS offices and another on-site review at PWN’s offices. This
compliance review involves VCCS monitoring staff reviewing programmatic, fiscal, and
administrative processes and procedures as well as documentation of expenditures noted in the
general ledger. A corrective action plan is provided to PWN with a 30 day response time and
detailed actions that are required to remedy findings and concerns. Data validation occurs on an
annual basis in order to maintain integrity of data that is placed in the system of record, the
Virginia Workforce Connection, and a final report of the findings is included in the corrective
action plan provided by VCCS.
7 . How the Local WDB conducts business in accordance with the Sunshine Provisions of WIOA
PWN conducts all actions of business in accordance with the Sunshine Provisions of
WIOA. In order to inform all Board and Council (CLEO) members of the Sunshine Provisions
under WIOA and the Virginia Freedom of Information Act, the provisions are noted in the
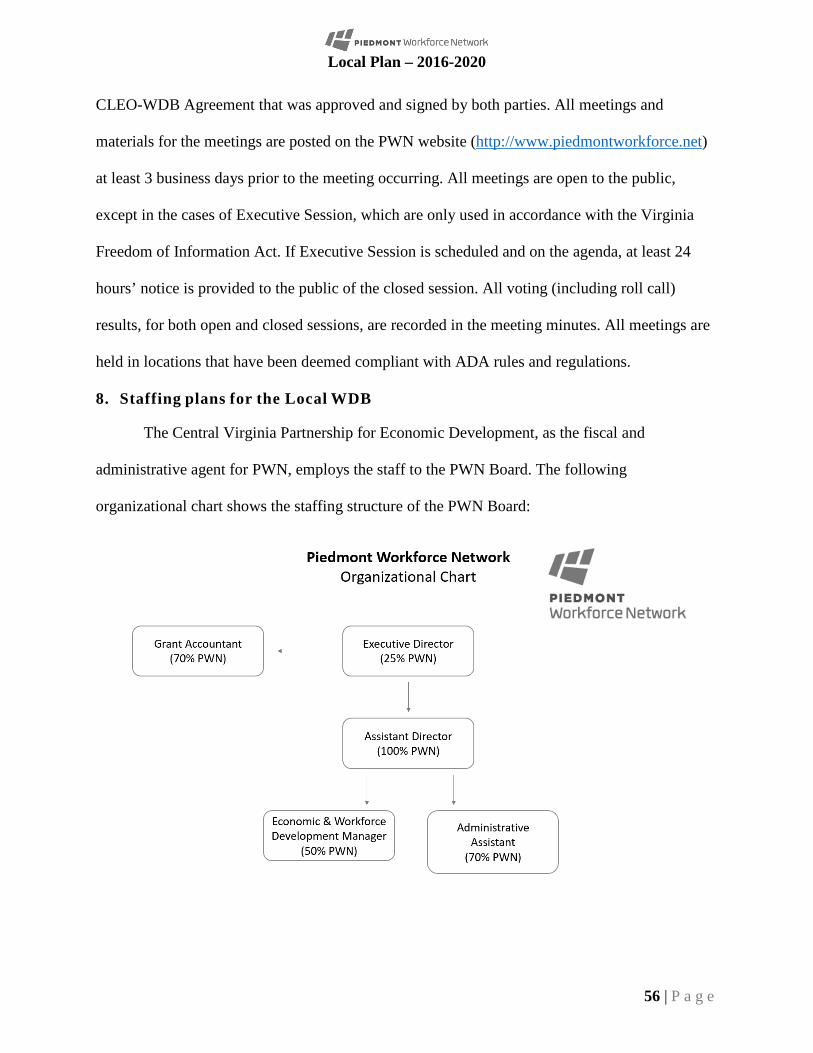
Local Plan – 2016-2020
56 | P a g e
CLEO-WDB Agreement that was approved and signed by both parties. All meetings and
materials for the meetings are posted on the PWN website (http://www.piedmontworkforce.net)
at least 3 business days prior to the meeting occurring. All meetings are open to the public,
except in the cases of Executive Session, which are only used in accordance with the Virginia
Freedom of Information Act. If Executive Session is scheduled and on the agenda, at least 24
hours’ notice is provided to the public of the closed session. All voting (including roll call)
results, for both open and closed sessions, are recorded in the meeting minutes. All meetings are
held in locations that have been deemed compliant with ADA rules and regulations.
8. Staffing plans for the Local WDB
The Central Virginia Partnership for Economic Development, as the fiscal and
administrative agent for PWN, employs the staff to the PWN Board. The following
organizational chart shows the staffing structure of the PWN Board:
Local Plan – 2016-2020
57 | P a g e
The percentages underneath the job titles represents the allocation of the staff salary to
PWN funds. The Central Virginia Partnership for Economic Development covers the remaining
portion of the staff salary that is not shown in the above chart.
B. COLLABORATIVE STRATEGIES
Provide a description of how the Local WDB will work with entities carrying out core programs to:
1. Expand access to employment, training, education, and supportive services for eligible individuals, particularly eligible individuals with barriers to employment
Under current WIOA legislation and PWN policy, a priority of service exists to serve
individuals that are low-income or basic skills deficient. In order to target and increase services
to these populations, a number of partnerships have been set up and/or maximized to facilitate
referrals. PWN has existing partnerships with many of the social service and community partners
around the region, in addition to the core and required partners that are laid out within the WIOA
legislation. In order to further maximize those partnerships, PWN will explore ways to integrate
and have resources available on-site at the Comprehensive and Affiliate One Stop Centers in the
region.
PWN will continue to recognize that foundational skills and a hands-on approach is
necessary for certain populations, especially those individuals with barriers to employment.
While the model of the Resource Room in the comprehensive One Stop under the WIA
legislation was focused on providing services that did not require staff assistance, the services
that can be provided under WIOA incorporates more leniency and a hands-on approach is
encouraged. PWN will move toward providing staff in the Resource Room to assist visitors one-
on-one, look to incorporate a workplace readiness curriculum conducted on-site at the
comprehensive and affiliate One Stop Centers for interested job seekers, and provide
Local Plan – 2016-2020
58 | P a g e
mentoring/shadowing opportunities coupled with educational and training opportunities. The
need for more work based learning opportunities exists in the region and leveraging resources
available (WIOA funding) to provide these opportunities will drive success for the region’s job
seekers.
In the comprehensive One Stop in the region, a partnership has been formed between
PWN, the local community college, Piedmont Virginia Community College (PVCC), and
Thomas Jefferson Adult and Career Education (TJACE), the local provider of Title II - Adult
Education and Literacy services. A representative from PVCC currently resides at the One Stop
to promote non-credit programs and connect individuals to financial assistance offered through
the FANTIC and Workforce Credentials Grant programs. PVCC and TJACE have agreed to
form a partnership in order to administer Title II – Adult Education and Literacy programs in
Planning District 10, and because of that partnership, the current staff will be educated and
trained on adult education and literacy activities and able to facilitate referrals and short-term
services on-site at the One Stop. This connection helps to bridge the gap and assist individuals
that are basic skills deficient address their barriers to employment in basic workplace readiness,
reading, and math as well as connect them with education and training to get the credentials they
need to become employed at a self-sufficient wage.
A number of individuals in the region lack transportation to travel between outlying
localities where they reside and urban areas for service delivery. PWN will work with county and
city officials as well as partner organizations in the region to define outreach points within each
of the jurisdictions for the placement of webcams and remote access technology. This will
facilitate a virtual connection between those partner organizations and the comprehensive One
Stop in order to screen for potential services and answer questions regarding employment
Local Plan – 2016-2020
59 | P a g e
resources available. PWN also will work with the partner organizations to develop a plan of how
to maximize the mobile computer labs that will be purchased to conduct workshops, intake
sessions, and assessments in rural locations.
It is also very important that all front-line staff in charge of providing excellent customer
service to our region’s job seekers and employers are provided cultural awareness and sensitivity
training. Individuals that have barriers to employment, including the English Language Learners
(ELL) population, require significant assistance to overcome those barriers and find gainful
employment. The staff at the comprehensive and One Stop Centers, including the staff of the
core and required partners, need to be aware of the social and cultural aspects of different
populations. This awareness will ensure that excellent customer service and effective service
delivery is conducted when assisting these populations. One additional key mechanism to be able
to serve the ELL population will be an enhancement of language services provided at the
comprehensive and affiliate One Stop Centers, including but not limited to, translation lines and
materials in various languages.
2. Facilitate the development of career pathways and co-enrollment, as appropriate, in core programs
Career pathways is a strategy that is being stressed in the Commonwealth of Virginia as a
successful methodology to ensure that individuals are placed in in-demand occupations that lead
to high growth and self-sufficient wage opportunities. Employers in PWN’s region are also
supportive of this model, as they see growth opportunities for their current workforce and by
using the career pathway model, they will be able to promote from within and provide entry-
level opportunities for the community’s job seekers. PWN fully embraces the career pathways
model and has already taken the necessary steps to ensure that funding in the region is prioritized
toward target industries and in-demand occupations that assist and individual to move up or enter

Local Plan – 2016-2020
60 | P a g e
a career pathway. First and foremost, in order to ensure that Title I funding is prioritized toward
these target industries and occupations by the WIOA One Stop and Program Operator, a policy
has already been created that has set forth the in-demand occupations in the region. A copy of
this policy can be found in Appendix A. Working with the core and required partners in the
development of this Local Plan, PWN has set forth four primary career pathways that can be
used when developing employment plans for individuals in the workforce development system.
Career Pathways Models

Local Plan – 2016-2020
61 | P a g e
In order to fully implement the above career pathways in the region, it will be imperative
that the core and required partners, including training and education providers, work together to
deliver integrated and contextualized training to the region’s job seekers. By providing adult
education services that coincide with occupational skills training, job seekers will be able to
finish training and gain skills in a timely manner to meet local employer demand. One challenge
that PWN will explore overcoming is the education requirements that are currently in place at
local education and training providers. In order for the contextualized model to be fully
functional, these education requirements must be waived or removed entirely. PWN will explore
this possibility with the education and training providers in the region.
With the potential relocation of the comprehensive One Stop Center after January 2018,
an opportunity has arisen to evaluate the customer flow and service delivery strategies in the One
Stop, particularly in the intake and screening process. PWN will explore the possibility of having
staff located in the Resource Room to screen each individual for eligibility and applicability of
services, including but not limited to, WIOA, Vocational Rehabilitation, Adult Education and
Literacy, and Unemployment Insurance. This hands-on approach will lead to more effective
referrals and a staff assisted approach to follow up and ensure that services are being delivered to

Local Plan – 2016-2020
62 | P a g e
customers in need. It will also further encourage the practice of co-enrollment and the leveraging
of funding sources. Any process that is put into place will be evaluated to ensure that continuous
improvement of service delivery is at the forefront of the One Stop Center.
3. Improve access to activities leading to a recognized postsecondary credential (including a credential that is an industry-recognized certificate or certification, portable, and stackable)
In order to improve access to activities leading to a recognized postsecondary credential,
PWN and its core and required partners agree that it is important to continue to recognize that a
secondary credential (i.e. High School Diploma or equivalent) is critical for job seekers to
receive prior to moving toward post-secondary credentialed programs. Title II – Adult Education
and Literacy partners are critical to ensuring that the region’s job seekers have the ability to
complete post-secondary training that leads to an industry-recognized credential. These providers
are also experts in their field when it comes to assessing an individuals’ job readiness and ability
to perform different functions.
Beginning in FY2017, the Commonwealth of Virginia greatly expanded access to non-
credit training programs through local community colleges to individuals that are low-income.
The Workforce Credentials Grant and the FANTIC financial assistance programs for the first
time allowed non-credit programs administered through the community colleges to be eligible
for financial assistance. With the Workforce Credentials Grant, colleges and students are now
incentivized for gaining industry-recognized credentials that lead to in-demand occupations.
PWN will continue to leverage funding through the Workforce Credentials Grant and FANTIC
with WIOA funding to lead to more industry-recognized credentials. The policy that was put into
place by PWN that determines in-demand occupations is also in line with the occupations on the
Workforce Credentials Grant list, and PWN will continue to dialogue with the community
colleges for occupations that are needed by local employers.
Local Plan – 2016-2020
63 | P a g e
Another avenue that PWN is exploring is to further develop awareness regarding the in-
demand occupations in the region, the training programs that lead to those occupations, and the
financial and programmatic resources available for job seekers to obtain training in the region.
Similar to the Valley Career Hub16 developed by the Shenandoah Valley Partnership, PWN is
exploring the opportunity to create a similar source in Local Workforce Development Area 6.
This resource will allow PWN to create an online platform that links existing resources into one
single virtual location. This platform will include information about the in-demand occupations
in the region, with a potential partnership with local news stations to highlight different
employment opportunities with local employers, a searchable database of all of the training and
education providers and programs in the region (public and private), as well as a list of
programmatic and financial resources available, such as grants and financial assistance, for
individuals to access. Many of the core and required partners have secured additional funding to
deliver workforce development programs in the region, and in order to further leverage funding,
a single virtual resource should be available for reference. This resource will include funding
availability, eligibility requirements, and contact information, as well as a link to any existing
information or current website for the host organization. PWN has requested funding from each
of the 11 localities in the region to develop this platform and will continue to reach out to other
local organizations for assistance in this development.
16 Valley Career Hub, http://www.valleycareerhub.com

Local Plan – 2016-2020
64 | P a g e
C. BUSINESS SERVICES
Provide a description of how the plan shall:
1. Specify the policies and protocols to be followed by all of the region's workforce development entities when engaging the region's employers
The region’s workforce development entities work together in a cohesive unit to provide
services to the region’s employers. PWN emphasizes that the main customer in the workforce
development system is the employer, with the job seekers as the supply to meet the employer
demand. The two Business Services Teams that have been established in the region, one for
Planning District 10 and one for Planning District 9, involve all of the key workforce
development partners in the area to work together to meet the needs of local employers. PWN’s
region embraces the methodology of having a single point of contact for businesses to tap into
workforce development services and utilize this strategy by having the Business Services Teams
serve as the single point of contact. PWN believes that there is no wrong door for inquiring and
receiving services. PWN and the partner organizations have agreed that while any members of
the Business Services Teams can initiate or reciprocate contact with employers, information
gathered from those contacts will be shared with the entire Business Services Teams to ensure
services are promoted equally and effectively. This is the most effective and efficient way to
provide comprehensive services to the region’s employers. The partners in the system have also
agreed that a response to business inquiries should be provided within two (2) business days.
In order for the single point of contact strategy to work effectively, it is also critical that
all Business Services Team members and front-line staff working directly with employers have
the same “elevator speech” and marketing tactics to promote the workforce development system
as a whole. PWN is in the process of evaluating the region’s marketing materials for business
services activities, with the goal of eliminating specific agency attachments and to promote

Local Plan – 2016-2020
65 | P a g e
services holistically. It is also a key strategy to coordinate activities with economic development
leaders in the region to tap into existing business outreach efforts that already exist so as to not
duplicate services or outreach to local employers.
One of the challenges associated with providing business services to the region’s
employers has been not having a customer relationship management (CRM) system that all
partners are able to use to track services provided. In Fall 2016, PWN was chosen by the
University of Virginia Computer Science Department to participate with a group of senior
students completing their Capstone project. These students are in the process of developing a
CRM system for PWN and the workforce development partners that will allow for employer
contacts and services to be tracked in an efficient manner, as well as provide data and reporting
mechanisms to show return on investment and business satisfaction results. The CRM system
will be deployed fully in May 2017 and all partners in the workforce development system will
have access to the system. PWN will use this system to track performance of providing services
to local employers.
In order to improve communication and further connect with economic development
efforts in the future, PWN will explore the possibility of adding economic development
representatives to the two Business Services Teams in the region, particularly those with active
business expansion and retention efforts. This could include the addition and further
communication with the Virginia Jobs Investment Program (VJIP). PWN will work with VJIP
staff to better serve employers, and explore ways that PWN staff and VJIP staff can collaborate
better on business expansion projects. PWN will also explore an efficient business satisfaction
survey that will gather feedback on their experience with workforce services to ensure
continuous improvement is always at the forefront of discussions.

Local Plan – 2016-2020
66 | P a g e
2. Address how the region's workforce entities will involve employers in the formation of new workforce development initiatives
PWN and the workforce entities in the region believe that employers should not only be
involved in the development of new workforce development initiatives, but they should be at the
forefront of discussions and driving conversations regarding structure and strategy. By
participating in the U.S. Chamber of Commerce’s Talent Pipeline Management Academy, PWN
will explore implementing this model to use supply chain management strategies in order to
provide a workforce that meets current and future job demand. This involves the formation of
employer collaboratives that are run solely by the employers so the initiatives that develop have
complete employer buy-in. This model also encourages the employers to fund the initiatives that
develop so that they have “skin in the game” and will be more proactive and involved in the
performance and management of new programs. These employer collaboratives will provide an
additional outlet for employers to discuss needs in terms of employment opportunities as well as
the skills and credentials that are required for job seekers to obtain those opportunities.
These employer collaboratives will also allow for the Labor Sector Strategy Study that
was completed to be updated on at least an annual basis to ensure that all workforce development
entities in the region have up-to-date real-time labor market information. This information,
coupled with the information that is provided by the Labor Market Information system
administered by the Virginia Employment Commission, information provided by the community
college Employer Advisory Councils, and Employer Network meetings hosted by the
Department for Aging and Rehabilitative Services and the Department for Blind and Vision
Impaired will allow for employers and partners to make educated decisions on new workforce
development programs in the region.

Local Plan – 2016-2020
67 | P a g e
PWN has already worked to form two industry sector focused collaboratives in
Healthcare and Manufacturing. Both of these groups have worked together to apply for new
sources of funding with the Manufacturing group being successful in securing funding through
the Virginia Incumbent Worker Innovation Program for existing worker training. The Healthcare
collaborative focused on two Department of Labor funding opportunities (America’s Promise
Grant and Strengthening Working Families Initiative). While these funding opportunities were
not awarded to PWN, the process for grant application development and program analysis was
extremely helpful, and PWN is now well-positioned to apply for future funding opportunities as
well as assist these employers with their needs on a smaller level with current funding
allocations.
One model that PWN will continue to monitor is a new strategy that is being
implemented in Fauquier County. Lord Fairfax Community College and Fauquier County
Economic Development Office partnered together to create a jointly funded position focused
solely on business development in Fauquier County. This position is uniquely positioned to work
with to local employers regarding expansion or retention efforts as well as speak with future
prospects regarding workforce needs and assets. Not only is the position able to speak regarding
economic development services, but it is also a direct line to a major education and training
providers and the workforce development system that can adapt to meet the employer’s needs.
While this position is new, PWN feels that this has the potential to become a best practice and
may be a strategy that can be expanded to other localities in the region.
3. Identify what activities will be undertaken to address employers' specific workforce needs
PWN will capitalize on the flexibility offered by the new WIOA legislation for
Incumbent Worker Training. Under the previous legislation, Incumbent Worker Training could

Local Plan – 2016-2020
68 | P a g e
only be provided in cases of layoff aversion, which many employers did not have the ability or
capacity to conduct. Now, with the expansion to career and skill advancement, Incumbent
Worker Training has become extremely attractive to local employers to upskill their current
workforce and create more entry-level opportunities for the region’s job seekers. PWN will
continue to use the WIOA funds that are able to be used for Incumbent Worker Training, as well
as utilize the Virginia Incumbent Worker Innovation Program through the Governor’s office.
PWN will also explore additional funding opportunities to further provide existing worker
training to the local employers.
Work-based training, including On-the-Job Training and Internship/Work Experience
opportunities will also be utilized to serve employers. Traditionally, the number of On-the-Job
Training contracts that have been executed in the region has been low. PWN will explore the
opportunity to increase the number of On-the-Job Training contracts in the region with the
WIOA One Stop and Program Operator and emphasize the importance of work-based training as
well as occupational skills training. Internships and Work Experiences have been a successful
model in the past, but it will be crucial for the future that individuals are placed with employers
representing the target industries or in opportunities that lead to career pathways.
Job fairs at the comprehensive and affiliate One Stop Centers have been successful to
date, but PWN will emphasize going forward quality versus quantity. Many job seekers attend
the bimonthly job fairs that are hosted at the comprehensive One Stop, but it has been difficult to
track outcomes related to the hires as a result of those job fairs. PWN will work with the WIOA
One Stop Operator to emphasize the importance of capturing outcomes related to these activities,
determine how to move toward more targeted job fairs for industry sectors and employers and
enhance marketing efforts surrounding these events. PWN will also work with the partners in the

Local Plan – 2016-2020
69 | P a g e
workforce development system to ensure that effective recruitment and screening opportunities
are being utilized to bring qualified candidates to meet with employers attending job fairs.
Other activities that will continue to be conducted include job analysis for
accommodations and job description review, job order posting in the Virginia Workforce
Connection and the distribution of those postings to all workforce partners, and cohort,
contextualized, and customized training efforts to meet individual employer demand. One of the
things that PWN and its partners continue to find is that job descriptions that are used today are
outdated and have skills and credential requirements that are no longer relevant for the positions.
Some employers have stated that the job description is a formality and the experience and
requirements on the description do not match what the hiring manager looks for in an applicant.
It will be critical for PWN and its partners to work with local employers to identify priority skills
and requirements for in-demand occupations and understand the need for those skills in the
present and in the future. PWN will continue to stress to local employers the need for not only
short term projections for workforce development needs, but also long term projections so that
the workforce system in the region can prepare a workforce that is qualified and meets the future
demand. PWN and the partners in the workforce system will continue to strive to understand
employers’ needs on a sector level, and at a more granular level, to provide for individualized
services.
Provide a description of the strategies and services that will be used in the local area:
4. To facilitate engagement of employers in workforce development programs, including small employers and employers in in-demand industry sectors and occupations
PWN has already undertaken several strategies to engage employers and have them take
advantage of the workforce development programs that are available in the region. These

Local Plan – 2016-2020
70 | P a g e
strategies include the facilitation of employer roundtables and the distribution of information
regarding the target industries as a part of the Labor Sector Strategy Study, the development and
implementation of the Virginia Incumbent Worker Innovation Program for existing worker
training in the Manufacturing industry, as well as promotion of the services provided by the
Small Business Development Center and business incubators in the region.
In order to further increase the utilization of services in the region by local employers,
PWN and its partners agree that the best method for marketing programs and services is business
to business. Businesses that have utilized the services in the past are the best promoters of the
services available and can provide explanations that other businesses will understand. This
strategy could be implemented by presenting at local chambers of commerce events, the
development of marketing materials for distribution by the partners in the workforce
development system, or inclusion on PWN’s website. Success stories are always beneficial to
show return on investment and satisfaction with services and programs, and PWN has not yet
capitalized on using businesses to tell those success stories.
Best practices are also always on the radar of PWN, especially best practices that have
been implemented by partners within the workforce development system. With the local
economy nearing full employment and employers stating their difficulty in finding exactly what
they need to fill employment opportunities, the need for customized and integrated training has
increased. Models like the PluggedIn programs run by Title II – Adult Education and Literacy
partners and Growing Opportunities (GO) programs developed in partners with the City of
Charlottesville and Piedmont Virginia Community College have proven to prepare job seekers to
secure employment with local employers that have a specific need. By combining workplace
readiness, occupational skills training, on-the-job training, supportive services, and

Local Plan – 2016-2020
71 | P a g e
mentoring/counseling activities, job seekers are more prepared for job opportunities because they
are being taught both soft and hard skills that help them become resourceful and an efficient
worker. PWN will explore ways that it can further enhance and expand those models to provide
more opportunities for the region’s job seekers, including the exploration of additional funding
sources for these programs.
Another strategy to increase employer involvement is to partner with major employers in
the region to provide facility tours and job shadowing opportunities to help in the career
exploration process of the region’s job seekers. Many times, job seekers are unaware of the
employers and opportunities that exist in their own backyard. Awareness could also be fostered
by inviting willing employers to attend workshops or classes conducted by the partners in the
workforce development system to discuss their hiring practices, provide input on interviewing
styles, and discuss current job openings and future opportunities. By opening up and creating
awareness opportunities for the local employers, it will encourage individuals to fill the jobs
located within the region instead of potentially accepting other opportunities that require longer
commutes.
5. To support a local workforce development system that meets the needs of businesses in the local area
The key to having a workforce development system that meets the needs of businesses in
the local area is to have effective and efficient communication with all of the partners in the
region’s system. By having effective communication strategies in place, partners are able to
disseminate information regarding employers’ needs, employment opportunities, and challenges
to providing services. At the comprehensive One Stop Center, the WIOA One Stop Operator has
developed an Interagency Partner Team, which consists of 40-50 partner members that meet on a
bimonthly basis to discuss workforce needs, new programs and funding sources, and challenges

Local Plan – 2016-2020
72 | P a g e
to address within the workforce development system. This team not only includes the core and
required partners named in the WIOA legislation, but also include community based
organizations and non-profits that are vital to the success of the local economy and the programs
that are provided to the region’s job seekers and employers.
The elimination of duplicate services is another way to enhance a system that meets the
needs of business. The local community colleges each have staff that are tasked with connecting
with employers to evaluate their needs and provide customized training and education options to
upskill their workforce. Instead of duplicating calls and visits to the employers that the
community college staff are working with, by communicating their needs and providing a
singular message about all of the services the workforce development system can provide, the
single point of contact methodology is still utilized.
One strategy that was identified during the local planning process was to analyze the
trends of peak hiring seasons for the region’s employers. Many of the Manufacturing and
Distribution employers have a peak time during the holiday season and then experience a lull in
hiring for the following winter months. PWN will explore the creation of a calendar of employer
hiring practices to identify when employers hire, when there are lulls in productivity, and the
skills that are in the highest demand during those peak times. During the lulls, PWN will have an
opportunity to capitalize on promoting incumbent worker training and help them to “winterize”
their business.
6. To better coordinate workforce development programs and economic development
Because the Central Virginia Partnership for Economic Development is the fiscal and
administrative agent for PWN, and is co-located with PWN, and shares its President with PWN,
there are opportunities to further coordinate activities to promote workforce development

Local Plan – 2016-2020
73 | P a g e
services to the region’s employers. Currently, any workforce development need that is
communicated to the economic development partners is disseminated to PWN staff, which then
involve the appropriate member of the Business Services Team for follow-up. This strategy
ensures that the economic development partners also have a single point of contact to ensure that
their employer’s need is solved.
On a monthly basis, the Central Virginia Partnership hosts a meeting between the
economic development representatives in 9 out of 11 localities in the region. PWN will request
that at these meetings, a section for workforce is added to the agenda where PWN staff can share
information, inquire about current and future workforce development needs, and the economic
development partners can share information about employers located within their localities. This
time will also be an opportunity for PWN staff to provide marketing materials or any other
promotional item, or obtain ideas regarding future needs for materials, to the economic
development representatives. The PWN Board, as a partnership between public and private
entities, is also an outlet that could benefit from learning more about economic development
efforts in the region. PWN will explore the opportunity to have economic development
representatives present to the PWN Board when new initiatives or projects are developed.
7. To strengthen linkages between the one-stop delivery system and unemployment insurance programs that may include the implementation of initiatives such as incumbent worker training programs, on-the-job training programs, customized training programs, industry and sector strategies, career pathways initiatives, utilization of effective business intermediaries, and other business services and strategies designed to meet the needs of regional employers
The Virginia Employment Commission (VEC) regional office that serves PWN’s region
has initiated an innovative approach to serving individuals that have applied and/or are receiving
unemployment insurance benefits. Every individuals that applies for unemployment insurance
benefits that resides within the region is invited to an initial workshop at the comprehensive of

Local Plan – 2016-2020
74 | P a g e
affiliate One Stop that is closest to their home residence. At this workshop, VEC staff go over a
variety of topics, including the process for being approved for unemployment, how to file a
weekly claim, job search tools available to them, resources in the One Stop Centers and the
Virginia Workforce Connection website. During the workshops at the comprehensive One Stop,
the WIOA Title I program staff attend to promote the program and explain the services that are
available to Dislocated Workers. At the affiliate One Stop Centers, the VEC staff have been
trained to provide information on the programs and refer the individuals that are interested to the
appropriate WIOA case management staff.
Another strategy that the VEC and partner programs have capitalized on is the
information that applicants for unemployment insurance benefits can provide. When large
numbers of individuals are seen through the unemployment system from one employer, the VEC
has been forthcoming in sharing that information with PWN and partner staff to alert a potential
opportunity for layoff aversion and Rapid Response activities. VEC will continue to monitor
these trends and continue to communicate that information through the Business Services Teams
and to PWN staff.
While promoting the WIOA programs has been an effective outreach method, there are
other ways that PWN will explore to improve the connection and referral process for individuals
on unemployment insurance benefits to the workforce development system. In line with
analyzing the customer flow of the Resource Room as a result of the new WIOA legislation,
PWN will also explore the opportunity to assess the one-on-one individuals who attend the
unemployment insurance workshops. By providing a one-on-one assessment opportunity, this
could increase the number of referrals to partner agencies, besides just WIOA Title I, and also
potentially decrease the amount of time that individuals rely on unemployment insurance. PWN

Local Plan – 2016-2020
75 | P a g e
will also work toward expanding the current weekly workshops that are being held by the VEC
to not only include information about unemployment insurance benefits and filing processes, but
also to incorporate other services provided through the workforce development system.
D. ECONOMIC DEVELOPMENT COLLABORATION
Provide a description of how the Local WDB will coordinate local workforce investment activities with regional economic development activities that are carried out in the local area and how the Local WDB will promote entrepreneurial skills training and microenterprise services.
PWN’s region serves as a best practice in the Commonwealth for being connected with
economic development, as the Central Virginia Partnership for Economic Development, the
regional economic development firm, is the fiscal and administrative agent for the Local
Workforce Development Board. As the regional economic development firm, the Central
Virginia Partnership works with the Virginia Economic Development Partnership to bring
potential projects to the region. PWN is able to assist the economic development partners in the
region to plan to meet the workforce needs of prospects at the onset. Over the past few years, the
topic of workforce development has been a prominent concern of prospects looking to set up
operations in the region or expand their current facilities. PWN is able to provide relevant
information and service descriptions to make the region more attractive to prospects. PWN’s co-
location with the Central Virginia Partnership further streamlines communication with the
economic development entities around the region.
In terms of promoting entrepreneurial skills training and microenterprise services, PWN
is also co-located with the Central Virginia Small Business Development Center (CVSBDC),
which provides services to small businesses in the City of Charlottesville and the Counties of
Albemarle, Fluvanna, Greene, Louisa, Nelson, and Orange. The CVSBDC provides workshops
on-site on topics such as business startup practices, accounting and financial skills, and

Local Plan – 2016-2020
76 | P a g e
marketing and social media. Consultants also host one-on-one counseling sessions on-site as well
as in the region depending on the best location for their clients. Besides the CVSBDC, the
Virginia Employment Commission (VEC), as part of the labor exchange system, provides free
workshops and seminars located online on the Virginia Workforce Connection system. The
workshops provided include a variety of topics including entrepreneurial training. All partners in
the workforce development system are open to microenterprise opportunities and, depending on
the situation, referrals are made for individuals that are interested in starting or expanding their
own small business.
E. ONE STOP SYSTEM
Provide a description of the one-stop delivery system in the local area, including:
1. How the Local WDB will ensure the continuous improvement of eligible providers through the system and that such providers will meet the employment needs of local employers, workers, and job seekers
Goodwill Industries of the Valleys is the current One Stop Operator and the operator of
the WIOA Title I Adult, Dislocated Worker, and Youth programs. In order to ensure continuous
improvement of Goodwill, as the provider of career services in PWN’s region, an annual review
of the contract terms and statement of work is conducted by the committees to the PWN Board
on a detailed level, and an overarching review is done jointly by the PWN Board and Council
(CLEO) members. The process to select the One Stop and Program Operator(s) is done through a
competitive review process, with an RFP released and contracts awarded for one year with an
option for two, one-year renewal cycles. The contract that is developed between the One Stop
and Program Operator(s) details funding allocated, participants that should be served by the
programs, and performance measures that are required to be met by federal, state, and local
standards. It also details additional programmatic, financial, and administrative requirements that
are set forth by the members of the PWN Board and Council. In terms of measures that are

Local Plan – 2016-2020
77 | P a g e
specific to meeting the needs of local employers, the federal common measures under WIOA
now set forth specific measurements of the credentials obtained by the participants in the
programs. This measure will allow PWN to review the credentials that are being obtained
through the programs and ensure that they are in line with the target industries and the in-demand
occupations set forth in policy. It will also allow PWN to see the success rate of the participants
in the programs, and how well the One Stop and Program Operator(s) are doing with follow-up
and case management services. The progress of the One Stop Operator is also reviewed by the
Management Team of the comprehensive One Stop Center, as the Team reviews customer
satisfaction ratings, job fair success, and other outcomes as deemed necessary to the daily
operations of the One Stop.
Other eligible providers in the workforce development system are the training and
education providers that are included on the Eligible Training Provider List (ETPL) for Virginia.
PWN is responsible for receiving applications from education and training providers in the
region and evaluating them for their placement on the ETPL list. This evaluation process
involves the review at the committee, Board, and Council level, and also involves an annual
review process detailing success of participants in the training programs that are approved. If a
training provider is not performing at a level that is acceptable to be included on the ETPL list
for Virginia, PWN has the ability to remove them from the list and deny them access to funding
through the WIOA programs. In order to further gauge success of the education and training
providers in the region, PWN will explore the possibility of conducting a satisfaction survey of
the participants in core and required partners that attend programs offered by providers on the
ETPL. This feedback will be provided to the education and training providers in order to ensure
continuous improvement and allow any issues to be addressed.

Local Plan – 2016-2020
78 | P a g e
2. How the Local WDB will facilitate access to services provided through the one-stop delivery system, including in remote areas, through the use of technology and other means
The workforce development system in PWN’s region is committed to providing access to
residents of all jurisdictions, with the goal of assuring that residents of Planning District 9 and
Planning District 10 are able to access all services provided through the system within a 30-mile
radius of their home residence. As stated in prior sections, PWN is looking to install webcams in
each of the outlying localities to provide for virtual access and connection to the comprehensive
One Stop for the localities’ constituents. In addition, the purchase of laptop computers to be used
in a mobile computer lab will extend workshops, intake sessions, and assessment capabilities
into outlying areas and outreach locations in rural areas. In addition to the efforts that PWN is
undertaking to increase access in rural areas, the partners in the workforce development system
have already taken steps to address this challenge as well. Title I – WIOA Program staff also
travel to outlying localities to meet with prospective clients and conduct services off-site. Title II
– Adult Education and Literacy providers are located in every locality in the region, providing
easy access for individuals that need assistance with basic skills, citizenship education, ELL
classes, and workplace readiness skills. Title III – Wagner Peyser staff are stationed in outlying
areas and use libraries, churches, and affiliate One Stop Centers to administer services to job
seekers throughout the region. Title IV – Vocational Rehabilitation services, which are provided
by the Department for Aging and Rehabilitative Services and the Department for Blind and
Vision Impaired, has case management staff that is assigned to rural counties and spend a
majority of their time located in rural areas to provide convenient access for their clients. They
also conduct outreach at the local high schools in the region to allow for youth participants the
ability to access services.
Local Plan – 2016-2020
79 | P a g e
PWN is always looking to improve access to services for the region’s population,
especially for the growing number of individuals not having access to adequate transportation.
Without a regional transportation solution, a majority of the job seekers in the region are not able
to travel to one of the current comprehensive and affiliate One Stop Centers. PWN will explore
the possibilities of opening additional affiliate sites in coordination with the partners in the
workforce development system. PWN will also work to strengthen relationships with community
partners, such as libraries, to ensure that at a minimum, information on the services provided by
the workforce development system is available to visitors.
3. How entities within the one-stop delivery system, including one-stop operators and the one-stop partners, will comply with WIOA sec. 188, if applicable, and applicable provisions of the Americans with Disabilities Act of 1990 (42 U.S.C. 12101 et seq.) regarding the physical and programmatic accessibility of facilities, programs and services, technology, and materials for individuals with disabilities, including providing staff training and support for addressing the needs of individuals with disabilities
The comprehensive One Stop Center in the region has been ADA compliant since its
opening in 2007. With the potential relocation of the comprehensive One Stop Center, PWN will
work with the experts in the field regarding ADA Compliance (Title IV – Vocational
Rehabilitation providers) and request that assessments are completed, recommendations are
made, and sites are reviewed for compliance to ensure that the new location is ADA compliant
and allows access to services to all individuals in the region. As the definition of an affiliate site
has changed under new policy released by the Virginia Board of Workforce Development, it will
be imperative that PWN conduct ADA assessments with the current affiliate or satellite centers
to ensure they are ADA accessible. If they are not, PWN will work with them to come up with
solutions to address this challenge.
In addition to the accessibility of the physical location and building of the comprehensive
and affiliate One Stop Centers, it is also important that services can be accessed by individuals

Local Plan – 2016-2020
80 | P a g e
with disabilities as well. The comprehensive One Stop Center and the Orange Workforce Center
both have universal access computer stations set up with applicable technology and materials for
individuals with disabilities to use to conduct their job search. These stations will be maintained
by the One Stop Operator and are reviewed consistently to make sure they are in proper working
order. Both the Department for Aging and Rehabilitative Services and the Department for Blind
and Vision Impaired have provided disability awareness training to assure customers of all
abilities are served appropriately.
4. The roles and resource contributions of the one-stop partners
In order for the comprehensive One Stop Center to operate efficiently and effectively,
and to remain within federal guidelines, an infrastructure plan must be in place to fund the
operations of the Center. The comprehensive One Stop Center for PWN currently has an
infrastructure model in place, and all core partners are currently contributing to the model. PWN
has addressed the current model with the partners, and all have agreed that a reevaluation will be
necessary to adjust the methodology behind cost sharing. While this has been agreed upon, PWN
and its partners recognize that an infrastructure model should be set in place after the location of
the comprehensive One Stop after January 2018 has been decided, as the composition of the One
Stop Center will also be known at that time. PWN has offered three methodologies to use when
choosing between allocation methods; square footage, FTEs, and visitor traffic to the One Stop
Center. These three choices will be used when deciding the new infrastructure model and to
assist in the development of a new MOU in compliance with WIOA legislation, which will also
include the roles of each partner in the workforce development system.

Local Plan – 2016-2020
81 | P a g e
5. The services provided by each partner mandated by federal and state law, and other optional partners
The service provided by each partner in the workforce development system will always
be consistent with federal and state law, as well as policy released by the Virginia Board of
Workforce Development and guidance released by the Virginia Community College System
(VCCS). A Memorandum of Understanding (MOU) has existed with the workforce development
partners since 2007, but with the reauthorization of the WIOA legislation, a new MOU will need
to be drafted to reflect the new guidelines. PWN began the process of discussing the MOU
criteria and composition in conjunction with the development of the Local Plan. All core partners
have agreed to provide the services that are outlined in their corresponding sections in WIOA
legislation (Title I – WIOA Adult, Dislocated Worker, and Youth Programs, Title II – Adult
Education and Literacy Program, Title III – Wagner Peyser, Title IV – Vocational
Rehabilitation). PWN is also awaiting further guidance from VCCS, as the Title I Administrator,
on the composition, format, and required elements of the new MOUs.
6. The Virginia Workforce Center Operator for each site in the area
Under the competitive procurement cycle that began in July 2015, Goodwill Industries of
the Valleys, in partnership with Rappahannock Goodwill Industries, is the One Stop Operator for
the region. Goodwill Industries of the Valleys is the lead Operator on the contract and is charged
with coordinating the services at the comprehensive One Stop Center, as well as facilitating
referrals and operations at the affiliate One Stop Centers, as needed. A Request for Proposals
will be released no later than January 2018 for a new round of contracts to operate the One Stop
system in the region and will follow the same competitive procurement process and schedule.
The new contract will go into place beginning on July 1, 2018.
Local Plan – 2016-2020
82 | P a g e
7. The physical locations of each comprehensive Virginia Workforce Center in the local area, and the co-location strategy for each center (current and planned)
The current location of the comprehensive One Stop Center for the region, the Virginia
Workforce Center – Charlottesville, is in the City of Charlottesville at 2211 Hydraulic Road,
Charlottesville, VA 22901. This location has been in place since December 2007, at the direction
of then Governor Tim Kaine, as one of the pilot One Stop Centers in the Commonwealth of
Virginia. The lease on this site concludes on January 31, 2018, and the location of the
comprehensive One Stop Center after that date not yet known. The leaseholder for the
comprehensive One Stop was set up in 2007 to be the Department of General Services (DGS),
but they have declined to continue this agreement with the location of the new One Stop Center.
Thus, the City of Charlottesville has agreed to be the leaseholder if the location of the One Stop
Center is in the City limits, and Albemarle County has agreed to be the leaseholder if the location
is within the County limits. The agreement of the Board and Council (CLEO) members was to
keep the comprehensive One Stop Center within the jurisdictions of Albemarle County and the
City of Charlottesville as this was the main center of activity and has the greatest number of
constituents in need of workforce development services.
At the current location of the Virginia Workforce Center – Charlottesville, the One Stop
is fortunate to have regional offices of both the Virginia Employment Commission (VEC) and
the Department for Aging and Rehabilitative Services (DARS) co-located on-site. The location
also includes the Central Virginia Partnership for Economic Development, Piedmont Workforce
Network, the Central Virginia Small Business Development Center, Virginia Department of
Veterans Services, Jobs for Veterans State Grants staff, Career Support Systems, The Choice
Group, WIOA Title I Programs, Piedmont Virginia Community College, Senior Community
Service Employment Program (SCSEP), and Worksource Enterprises. The composition of the

Local Plan – 2016-2020
83 | P a g e
future comprehensive One Stop Center is still unclear, but we have confirmed presence from the
VEC regional office, WIOA Title I Programs, Piedmont Virginia Community College, and one
office for DARS. PWN will work with the partners that are currently in the space going forward
to retain as many partners as possible going forward into the new space.
8. If applicable, the locations of Virginia Workforce Network affiliated sites, partner sites or specialized centers
PWN is very fortunate to have localities within the region that are passionate about
workforce development and understand the need for services to be provided in rural areas. Prior
to the reauthorization of the WIOA legislation, some localities in the region funded and
developed what were known as Satellite Centers within the region. These outposts were located
in Albemarle County, the City of Charlottesville (Downtown), Louisa County, and Fauquier
County. These locations were funded solely by the localities through their annual budgetary
process and were staffed by various agencies within those localities. PWN has worked with these
Satellite Centers to provide services on-site, such as workshops, intakes, job search assistance,
etc. Another Satellite Center exists in Orange County and was originally operated with WIOA
funding. PWN has worked with Orange County for two years to set up a phase-in agreement,
where in FY2018, Orange County will be funding the operations completely. Under the new
definition of Affiliate Centers that was developed by the Virginia Board of Workforce
Development, some of these locations that were considered Satellite Centers of PWN operations
are not able to meet the definition of Affiliate Centers. A description of the Satellite Centers in
PWN’s region is below, with a description of how PWN will work with the localities to have
them be considered as Affiliate Centers:
Orange Workforce Center - The current location of the Orange Workforce Center in downtown
Orange has WIOA Title I Program staff, Virginia Employment Commission staff, SCSEP staff,

Local Plan – 2016-2020
84 | P a g e
and TANF/VIEW counselors from the Orange County Department of Social Services. The
Center is staffed by a Center Manager provided by Rappahannock Goodwill Industries as an in-
kind donation noted on the WIOA One Stop Operator contract. Under the Virginia Board of
Workforce Development policy, this Center will be considered an Affiliate Center and an MOU
will be developed to outline the partners’ commitment to being on-site.
Albemarle Career Center – The current location of the Albemarle Career Center is within the
Albemarle County Department of Social Services building and is staffed by a DSS employee.
Currently, the TANF/VIEW staff that is present on-site is the only core or required partner that is
located at the Center on a regular basis. PWN will work with Albemarle County Department of
Social Services and the core and required partners to develop a plan of action to have partner
services present on a more frequent basis. If an agreement can be made, then the Albemarle
Career Center will be able to be classified as an Affiliate Center.
Downtown Job Center – The current location of the Downtown Job Center is within the
Jefferson-Madison Regional Library just off the Downtown Mall in the City of Charlottesville.
The Downtown Job Center was set up to provide easy access to workforce development services
for the populations living in public housing located in close proximity (walking distance) from
the Downtown Library. The Center is staffed by the Charlottesville Office of Economic
Development. No core or required partners are located on-site or visit the Center on an ongoing
basis. PWN will work with the Downtown Job Center and the core and required partners to
develop a plan of action to have partner services present on a regular basis. If an agreement can
be made, then the Downtown Job Center will be able to be classified as an Affiliate Center.
The Workplace – Fauquier – The current location of The Workplace in Fauquier County is
adjacent to the Fauquier County Department of Social Services and is staff by a DSS member.

Local Plan – 2016-2020
85 | P a g e
Various partners visit The Workplace on a regular basis, including Virginia Employment
Commission staff, WIOA Title I Program staff, and Adult Education and Literacy providers.
Under the Virginia Board of Workforce Development policy, this Center will be considered an
Affiliate Center and an MOU will be developed to outline the partners’ commitment to being on-
site.
Culpeper Workforce Center – The current location of the Culpeper Workforce Center in
downtown Culpeper has WIOA Title I Program staff, Virginia Employment Commission staff,
and Adult Education and Literacy providers on-site for a majority of the operating hours. In
addition, TANF/VIEW staff from Culpeper Human Services are located on the floor above the
Culpeper Workforce Center in a campus-style environment. Under the Virginia Board of
Workforce Development policy, this Center will be considered an Affiliate Center and an MOU
will be developed to outline the partners’ commitment to being on-site.
Provide a description of professional staff development strategies to include:
1. Process used to ensure that staff receive continuous training in workforce development practices
Professional development is an important aspect in providing excellent customer service
to both job seekers and employers. At the comprehensive One Stop in the region, the Center
opens at a later time on Wednesdays to provide an opportunity for staff to convene on a monthly
basis. This monthly staff meeting is conducted and cross-training occurs from different partners
and community members on programs and efforts to serve customers. PWN will strongly
encourage participation in this monthly meeting by all front-line staff and will also monitor that
partners are given the opportunity to present on their specific programs including updates to
eligibility and funding. PWN will also encourage that a similar meeting be set up in the northern
area of the region, Planning District 9, to ensure that all partners have an opportunity to cross-

Local Plan – 2016-2020
86 | P a g e
train and educate each other on performance and program parameters. By ensuring the education
of front-line staff on all services that are available in the region, services and referrals are
conducted more smoothly for the job seekers and employers.
A few years ago, the Virginia Community College System (VCCS) developed a
workforce training course online that provided an overview of the workforce development
system in the Commonwealth and also provided basic parameters for the programs available.
PWN favors this solution, as it provides a technological and cost effective approach to
professional development. While the course was helpful under the WIA legislation, it has not yet
been updated to reflect the new WIOA legislation. Once this occurs, PWN will fully support
front-line staff completing this course for certification purposes.
In order to further encourage continuous training opportunities, PWN will explore the
possibility of creating a handbook for new front-line staff regarding the workforce system in the
region. This would provide materials for new front-line staff to reference, regardless of the
agency they are employed by, to make sure that they understand the variety of services that a job
seeker or employer can receive.
2. Methods to ensure effective use of the Virginia Workforce Connection system of record and to adhere to timely data entry requirements for WIOA services
The Virginia Employment Commission and the WIOA Title I Adult, Dislocated Worker,
and Youth Programs are all using the Virginia Workforce Connection system as the system of
record and use it on a daily basis to document case notes and activities provided to job seekers
and employers. Unfortunately, the other core partners, Adult Education and Literacy and
Vocational Rehabilitation, are not required to use the Virginia Workforce Connection system, so
it is difficult to share information regarding clients without duplicating efforts. PWN supports the
Local Plan – 2016-2020
87 | P a g e
idea of integrated data systems in the Commonwealth and will work toward better methods of
sharing information about co-enrolled clients.
Visitors that come into the Resource Room to use the computers or other self-guided
services are strongly encouraged to register in the Virginia Workforce Connection. In terms of
case management services, PWN monitors the WIOA Title I Program Operator to ensure that
staff are complying with guidance released by the Virginia Community College System
regarding timely data entry. PWN strongly encourages the case management staff to use the
system of record on a daily basis and to ensure that case notes and services are entered into the
system the day of occurrence, and if not on the same day, within a two week period (14 days).
3. Process to measure staff performance and delivery of high-quality customer service
In order to manage performance of the front-line staff in the Center, a customer
satisfaction survey is distributed to visitors and the results are analyzed by the Center Manager
and the Management Team for the One Stop Centers. The Management Team reviews these
surveys to monitor performance and reviews comments to find opportunities for improvement.
PWN has also discussed with the partner agencies a possibility of implementing customer
service training for front-line staff, and PWN will explore this further over the duration of the
plan. If issues do arise that involve customer service, PWN staff are alerted and remedies are
developed to ensure continuous improvement.
4. Process to meet and maintain staff certification and Virginia Workforce Center certification as required by Virginia Workforce Council Policy 10-01
The current Virginia Workforce Council Policy 10-01 was developed under the old WIA
legislation and is neither relevant to the new WIOA legislation nor cost effective with the
Local Plan – 2016-2020
88 | P a g e
budgetary restrictions imposed on the Local Workforce Development Boards. Policy 10-01
refers to the Certified Workforce Development Professional (CWDP) certification that is
provided by the National Association of Workforce Development Professionals and required that
60% of front-line staff within the region be considered CWDPs. In order to achieve that
certification, competency must be shown in a variety of workforce development areas. Staff are
able to document their significant work history within the field of workforce development to
prove the competencies or the individual can choose to take a course through a third party
provider to show the competencies. When the policy was put into place, the Virginia Community
College System was fortunate to have an agreement with Dynamic Works to provide the training
at no cost to Virginia front-line staff. Since that time, the price of the training has gone up
significantly and PWN does not have adequate funding to support the number of individuals that
would need to go through the training. Also, with turnover rates in front-line positions in PWN’s
region, the staff do not have the ability to show adequate work history and competencies. PWN
does support the Virginia Community College System’s process to revise the policy and make
the certification process more relevant to Virginia’s workforce system. The more the
Commonwealth can educate the front-line staff on the workforce development system and the
services that are available, the more effective staff will be to assist that individual or employer in
meeting their needs.
F. ADULT & DISLOCATED WORKER SERVICES PROVIDED
Provide a description and assessment of the type and availability of adult and dislocated worker employment and training activities in the local area, to include:
1. Access to and delivery of career services (basic, individualized, and follow-up)
With the removal of the mandatory tier of services (core, intensive, and training) in the
new WIOA legislation, PWN sees the opportunity to evaluate and revise the triage of services

Local Plan – 2016-2020
89 | P a g e
and customer flow in the One Stop service delivery strategy to make it easier and more efficient
for the region’s job seekers to access training services. The customer flow that has been in place
since the establishment of the comprehensive One Stop Center in 2007 will be revisited to ensure
that there is no wrong-door entry point for individuals to gain access to training services and that
they have access to basic and individualized career services for their job search needs. PWN and
the partner agencies in the workforce development system envision the following process for
registration and assessment within the One Stop Centers:
Walk-in
Register in Labor Exchange System
Skills/Needs Assessment
Career Counseling
Training Services
Job Placement

Local Plan – 2016-2020
90 | P a g e
The partners and parties that will conduct each tier in the customer flow has yet to be
finalized, but systems will be put into place to begin using this process as soon as possible. The
Memorandum of Understanding (MOU) that is being developed to correspond with the new
WIOA legislation will outline the roles and responsibilities of the partner agencies within the
workforce development system and will help to identify the triage process for customers. One
aspect of customer flow that has been identified is that Wagner Peyser will be primarily
responsible for providing basic career services in the Resource Room. In order to ensure that
Wagner Peyser staff are adequately training in providing resources to job seekers, PWN will
work to develop a training manual and materials to be provided to these front-line staff. This will
ensure that Wagner Peyser staff understand the various programs and services provided by all
workforce development partners in order to facilitate appropriate referrals.
The main strategy that has been identified to keep at the forefront of discussions with the
revision of customer flow is that a primary focus of all staff within the workforce development
system should be skill development and training services, rather than immediate placement.
Under the previous legislation, PWN and its partner agencies were focused on finding
individuals the “right now job” instead of the “right job”. In the recession period, job seekers
were not able to take time away from employment to attend training and were hesitant to focus
on anything other than finding steady income. Now, it will be critical to ensure that individuals
are placed into career pathway opportunities in order to further their education and skills, make
them more marketable in today’s economy, and guarantee self-sufficient employment. Co-
enrollment between the workforce development system programs will need to be utilized more
as there will be an increase in the number of individuals seeking training opportunities. Like
many other regions in the Commonwealth, PWN has faced budget restrictions and reductions. In

Local Plan – 2016-2020
91 | P a g e
order to maximize funding and ensure that services are not duplicated, co-enrollment will be a
necessary strategy. PWN will utilize models such as Integrated Resource Teams to discuss
services and eliminate duplication. Individualized and follow-up services will be provided to
individuals based on eligible determination and suitability for the programs available through the
One Stop system.
2. The area's definition of self-sufficiency to be used when determining eligibility for intensive and training services for employed individuals
Many groups in the region have conducted research on the cost of living and the
necessary wages and individual needs to be considered self-sufficient. The Charlottesville Works
Initiative, in partnership with the Charlottesville Chamber of Commerce, released the Orange
Dot report that reported on the poverty levels and the cost of living data in the greater
Charlottesville region. PWN used this data, coupled with other information provided by Board
members, Council members, and partners in the system, to arrive at an annual wage of $35,000
as the area’s definition of self-sufficiency. This definition has been in place since 2010, and with
the new WIOA legislation, a changing economic scene, and more data collected through the MIT
Living Wage Calculator, PWN and its partners in the workforce development system agree that
this number may need to be evaluated. With an increased focus on career pathways that lead to
in-demand occupations with a self-sufficient wage, it will be important to use the MIT Living
Wage Calculator as a guide to start on the career pathway. PWN and its partner agencies will
revisit this self-sufficiency definition to ensure that the number is still relevant and is applicable
to current programmatic strategies.
3. The area's definition of hard-to-serve populations with additional barriers to employment
PWN’s unique region, encompassing both urban and rural areas, as well as the high cost
of living in the City of Charlottesville, and the Counties of Albemarle and Fauquier, has a

Local Plan – 2016-2020
92 | P a g e
diverse population with varying levels of barriers to employment. The presence of the University
of Virginia, coupled with the low unemployment rate in the region, skews the perspective of
non-area residents about this region’s economy. Like many other regions in the Commonwealth,
PWN’s population includes individuals living at or below the poverty level, ex-offenders,
individuals that are basic skills deficient (low reading and math levels), homeless individuals,
foster care youth, and high rates of teen pregnancy in some localities. In terms of individuals
living at or below the poverty level, PWN has a higher percentage of the population receiving
SNAP benefits than the percentage in the Commonwealth (PWN – 13.2%; Virginia – 10.9%17).
With the high cost of living associated with the localities in the region, the assistance that is
needed by the low-income population is greater than in other regions where the cost of living is
lower. Assistance for these individuals goes above and beyond providing education and training
activities to individuals to include childcare assistance, transportation reimbursement, and
emergency or needs based related payments. When individuals attend training and education
activities, while it is beneficial to them in the long-run, the short-term challenges of not having
income quickly mount, and without supportive services, job seekers are less likely to obtain
and/or retain employment.
G. RAPID RESPONSE COORDINATION
Provide a description of how the Local WDB will coordinate workforce investment activities carried out in the local area with statewide rapid response activities, as appropriate.
In the past, Rapid Response has been a key partner with employer who are closing, facing
reductions in force, or are experience challenges to sustaining operations. While these activities
will continue to be a focus for the Rapid Response Unit in the Commonwealth, a priority will
17 JobsEQ, Chmura Economic, January 2017

Local Plan – 2016-2020
93 | P a g e
also be added to conduct layoff aversion strategies for local employers in the region. PWN will
continue to work with the Rapid Response Coordinator(s) in the region to ensure that the goals
for activities surrounding layoff aversion and rapid response events align with the strategic and
operational goals of the PWN Board, Council (CLEO), economic development, and One Stop
partners. These entities will also be involved in the development of regional plans and
events/summits for Rapid Response. PWN will work with the Rapid Response Coordinator
annually to establish a Memorandum of Understanding (MOU) detailing the goals and strategic
priorities of the region for Rapid Response activities.
The Rapid Response Coordinator assigned to the area will also sit on the Business
Services Teams in the region and will provide information to the team on business visits,
inquiries, upcoming WARN notices, or conversations with employers in the PWN region. As a
member of this team, the Rapid Response Coordinator will adhere to the business services plans
for outreach and services that is developed and communicated by the PWN Board and Council.
As the Rapid Response Coordinator is a contact for those businesses filing WARN notices with
the Commonwealth, they will serve as one of the many entry points to services provided through
the workforce development system. The team, along with PWN staff, will also assist the Rapid
Response Coordinator in the development of key indicators that may initiate contact with a
business to promote services available for layoff aversion.
H. YOUTH SERVICES PROVIDED
Provide a description and assessment of the type and availability of youth workforce investment activities in the local area including activities for youth who are individuals with disabilities, which must include an identification of successful models of such activities; and the following:

Local Plan – 2016-2020
94 | P a g e
A. The local area's strategy for ensuring the availability of comprehensive services for all youth
PWN fully embraces the idea of career pathways and sector strategies and will develop
programmatic initiatives in the WIOA Youth Program to provide these opportunities to youth
participants. This comprehensive approach will result in youth participants being enrolled longer
and receiving more services than traditionally have been offered. This will also lead to more time
spent by the case management staff on career counseling and transition activities, as well as
increased expenditures per person due to providing training for stackable credentials. These two
aspects will also lead to fewer individuals being served on the program. While the goal is to
serve individuals with significant barriers to employment, it is also important to move those
individuals toward more in-demand occupations with target industries and avoid education
programs that lead to low wage, unstable occupations.
The target industries for the Youth Program will follow the same target industries as the
Adult and Dislocated Worker Programs; Business & Financial Services, Health Services,
Information Technology, and Manufacturing/Distribution. It will also be important for PWN and
the WIOA Youth Program Operator to leverage other funding sources for youth program
activities in order to stretch the WIOA funding farther. PWN will explore the opportunity to
integrate further with the community colleges, including exploring best practices around the
Commonwealth for partnerships and collaboration.
B. How the area will identify and select successful providers of youth activities and delivery of the fourteen youth program elements required under WIOA
PWN uses a competitive procurement process to select the WIOA Youth Program
Operator, which is responsible for the delivery and coordination of the fourteen youth program
elements under WIOA. Many of the elements are provided in-house through the One Stop
Centers or by Operator initiated programs, but some, including tutoring, financial literacy, and

Local Plan – 2016-2020
95 | P a g e
occupational skills training, are provided by other partners within the workforce development
system. The competitive procurement process includes a Request for Proposals (RFP) release at
a maximum of every three years. Contracts are awarded to organizations that submit successful
proposals that are approved by the PWN Board and Council (CLEO). The contracts that are
developed are one year contracts with the possibility of two one-year extensions, which are
evaluated on an annual basis by the Board and Council. Successful providers of youth services
will adhere to the scope of work outlined in the RFP and the response provided by the
organization chosen to operate the WIOA program as well as demonstrate success in meeting
performance goals for the WIOA Youth Program as set forth in the provider’s contract with
PWN.
C. Strategies to ensure that all eligible WIOA youth receive access to the required program elements and activities during their enrollment in the WIOA youth program
Tutoring – PWN sees this program element as a requirement for any youth that tests as Basic
Skills Deficient when enrolling in the program. It is imperative for youth to have a reading and
math level that will allow for them to be successful in employment and/or educational
opportunities. Title II – Adult Education and Literacy providers are experts in this arena and the
WIOA Youth Program Operator will seek out their assistance to provide this basic skills
development. Tutoring and other adult education activities may be provided as contextualized
learning, in partnership with post-secondary educational institutions, with additional
occupational skills training or workplace readiness skills development.
Alternative Secondary School Services or Dropout Recovery Services – These services will be
provided to in-school youth that are in need of assistance in order to prevent them from dropping
out of secondary school. These services can also be provided to in-school youth that are
attending alternative school due to a barrier to education.

Local Plan – 2016-2020
96 | P a g e
Paid and Unpaid Work Experience – PWN values the Paid and Unpaid Work Experience as one
of the most critical components of the WIOA Youth Program. Many youth in the region have
little to no work experience and find themselves not ready to enter the workplace. Work
Experiences can provide basic workplace readiness skills (soft skills) or it can provide more
technical skills. It also provides an outlet for youth to explore potential career opportunities prior
to enrolling or attending post-secondary education. Many employers value work experiences as
well as educational credential and, because of this, PWN will work toward providing a work
experience to each youth that attends occupational skills training to boost their resume and make
them more marketable to employers.
Occupational Skills Training – Career pathways development is also key for the youth
population, as many times they are not immediately ready for intense technical training
programs. Developing and implementing career pathways strategies with youth, especially the
WIOA Youth Program, will be a requirement for the WIOA Youth Program Operator. WIOA
funds that are expended on occupational skills training must be in the target industries identified
by the PWN Board and Council on an annual basis. This is to ensure that employers needs are
met and credentials that are valued and in high demand are prioritized.
Contextualized Education – This service may be provided to youth who are in need of basic
skills or workplace readiness skill development prior to being successful in occupational skills
training. Title II – Adult Education and Literacy providers will be instrumental in developing
these opportunities for youth in the region, in partnership with post-secondary training providers,
such as community colleges or vocational education providers.
Leadership Development – All youth in the WIOA Youth Program must receive leadership
development services, which include work readiness activities. Examples of these activities

Local Plan – 2016-2020
97 | P a g e
include but are not limited to, resume writing class, mock interviewing and interview etiquette,
college visits (including visits to community colleges), team building activities, and more. PWN
will encourage the WIOA Youth Program Operator to be creative in the development of these
activities and capitalize on existing workshops, activities, and cohort groups.
Supportive Services – Supportive services are also key to assisting WIOA youth in starting and
remaining in educational or employment opportunities. Many times, the supportive services that
are needed by youth include transportation assistance, uniforms and kits, and books that support
educational opportunities. While childcare is a great need in the community, PWN is unable to
provide funding for this activity due to monetary restrictions and limitations. PWN will rely on
other workforce development partners, such as the United Way, YMCA, and other childcare
providers for assistance. PWN will work with these partners to expand qualified childcare
opportunities in the region.
Follow-up Services (12 months) – The Follow-up Case Manager is required to track and gather
supplemental information regarding a youth participant for 12 months after exit from the
program. This Case Manager is also required to provide information and resources to participants
that may need additional assistance from the program to remain employed. These services could
include job search assistance, supportive services, such as transportation assistance, or referrals
to other workforce development agencies. These are provided on an as needed basis.
Comprehensive Guidance and Counseling – This service is provided to youth that are in need of
mental health counseling, drug and alcohol abuse counseling, or other substance abuse
counseling. Referrals to qualified agencies that provide these services will be completed on an as
needed basis.

Local Plan – 2016-2020
98 | P a g e
Financial Literacy Education – Financial literacy education is a new program element and PWN
will mandate that all WIOA Youth participants are exposed to financial literacy resources.
Workforce development partners in the system provide financial literacy training which varies
from basic to advanced financial literacy skills. The WIOA Youth Program Operator will explore
opportunities to provide this to youth that are entering employment and need assistance in
managing their new paycheck. Currently, one of the two Title II – Adult Education and Literacy
providers operate financial literacy programs, and the other providers will explore the
opportunity to develop a similar curriculum.
Entrepreneurial Skills Training – The Central Virginia Small Business Development Center
(CVSBDC) is conveniently located at the comprehensive One Stop Center. For youth that are
interested in exploring how to open their own business, the CVSBDC offers workshops at the
comprehensive One Stop Center on “How to Start a Small Business” and can make referrals to
other organizations as necessary.
Labor Market Information Services – Theses services will be provided to all WIOA Youth
program participants and should be provided during the development period of the Individual
Employment Plan. All youth will be exposed to career pathways that exist in the region and the
information related to in-demand occupations and industries. They also will be given a tutorial
on the labor exchange system, administered by the Virginia Employment Commission (VEC).
PWN will explore the opportunity to create a work readiness activity conducted by the VEC
regarding the Virginia LMI system and how to best access the information.
Transitional Activities to post-secondary education and training – There are many activities that
are currently ongoing that support the transition from secondary education to post-secondary
education and training. Bridge programs, such as PluggedIn exist in the region to bridge the gap

Local Plan – 2016-2020
99 | P a g e
between basic skills achievement, workplace readiness, and occupational skills training, PWN
fully supports these programs and the One Stop system facilitates referrals to these programs for
appropriate job seekers. PWN looks to further provide these opportunities to youth participants
and will explore the addition of job shadowing, tours of local businesses and college programs,
workshops on college readiness and financial aid applications, workshops in the local high
schools and more to help with this transition.
D. How the required program design elements will be addressed as part of the development of youth service strategies
When the new WIOA legislation took effect in July 2015, PWN worked with the
Compliance Review Team at the Virginia Community College System to redevelop the Youth
Service Strategy for the WIOA Title I Youth program. This new Youth Individual Employment
Plan focuses solely on the participant’s barriers to employment and which of the fourteen
elements will be used to address those barriers and assist the participant enter education and/or
achieve employment. The Individual Employment Plan assesses the participant’s job search
skills, work experience, barriers to employment and more and allows the case management staff
to document the activities and outcomes achieved through the program.
E. Strategies to identify, recruit and retain out-of-school youth, and efforts to ensure the required percent of WIOA youth funds are expended
PWN has found that the point of vulnerability for youth in the region is the period of time
right after graduation from a secondary education institution, whether that be private, public, or
alternative high school. Youth that are undecided or choose to seek employment rather than
furthering education often fall through the cracks and may have difficult navigating services and
assistance to meet their needs. There are many resources available to in-school youth but most of
those services and assistance end once the youth have graduated and received their high school
diploma or the equivalent. A key relationship for PWN and its partners to further develop to

Local Plan – 2016-2020
100 | P a g e
serve out-of-school youth effectively is with the K-12 school systems, Career & Technical
Education, and guidance counseling departments. By coordinating efforts prior to the end of the
school year, the workforce development system programs are able to provide information and
enroll youth prior to them falling through the cracks. By providing them support once they
graduate, this will bridge the gap between secondary school and employment or post-secondary
education.
It will also be critical that PWN and its partners engage in the use of technology when
recruiting out-of-school youth. In the past, mailing letters to potential and current youth
participants was the main communication method for marketing initiatives. Phone calls and
mailings no longer reach youth effectively in the region. Many youth are frequenting social
media outlets to find news and communicate regarding employment and education opportunities.
By using Facebook and Twitter, PWN will have a way to market and recruit out-of-school youth
more effectively. Other messaging outlets such as text, email, and social media messaging will
be used more prominently than physical mailings.
TANF/VIEW programs will also be a key partner in recruiting out-of-school youth, as the
local Departments of Social Services will have records and information on youth that are
pregnant or parenting, which is considered a barrier to employment for the WIOA Title I Youth
program. PWN will work with the TANF/VIEW partners to ensure that all staff at the
Departments of Social Services are educated on the eligibility, services, and activities that the
WIOA Title I Youth program can provide. This will foster an efficient referral system for co-
enrollment with other system partners.
In terms of expenditures, PWN staff ensure that 75% of WIOA Title I Youth funds are
used on expenditures to out-of-school youth. This process is done during the budget cycle, and

Local Plan – 2016-2020
101 | P a g e
PWN staff only allocate funding to the WIOA Title I Youth program according to the 75%-25%
mandate.
A best practice that has been noted in other states in the nation is the enrollment of youth
in their senior year of high school as an in-school youth, but then transitioning the youth to out-
of-school once they graduate. During their senior year, youth would be able to receive work
readiness skill training, career and college exploration assistance, and interest and aptitude
assessments, coupled with the services the high schools are already providing. Once they
graduate, expenditures would then be classified as out-of-school, and they would be well on their
way to entering employment or education. PWN will explore this possibility with the Virginia
Community College System to create more opportunities for the youth population.
F. Policy regarding serving youth who do not meet income eligibility guidelines, including appropriate referrals
Under the WIOA legislation, it is permissible to have up to 5% of youth enrolled in the
WIOA Youth Program be over the income guidelines. PWN has traditionally not allowed this
aspect of youth eligibility due to the large number of individuals who were considered low
income accessing services. As the recession has ended and the economy has recovered, there are
youth in the region that are just about the income guidelines for eligibility, yet they and their
families are not able to be self-sufficient due to the high cost of living the region. As guidance is
released by the Virginia Community College System regarding the 5% low income exception in
the WIOA Youth program, PWN will consider using this to serve more youth with barriers to
employment who are in need of assistance.
G. Efforts to coordinate with Job Corps, youth opportunity grants where applicable, registered apprenticeship programs, local offices on youth, and other youth services, including those administered through community colleges and other higher education institutions and local human services agencies

Local Plan – 2016-2020
102 | P a g e
While the requirement for a Youth Council was eliminated under WIOA, a team of youth
practitioners is key to coordinating referral and collaboration efforts. PWN will explore the
possibility of creating a youth practitioners group, using the model of Integrated Resource
Teams, to coordinate efforts to reach youth in the region. An existing group in the region may be
utilized to coordinate these efforts and will be the priority for PWN, rather than the creating of a
new entity. Ideally, this team will include practitioners from organization such as the WIOA
Youth Program, Job Corps, programs administered by the community colleges, such as Great
Expectations, Youth Career Counselors in the K-12 system, and youth internship programs, such
as Charlottesville Area Internship Youth Program (CAYIP).
While a Job Corps training center is not located within the PWN region, there are
outreach specialists that continue to do work in the comprehensive and affiliate One Stop
Centers. Job Corps is an excellent training option for youth that are interested in trade
occupations and all workforce development partners refer youth to the agency when appropriate.
PWN will continue to encourage the coordination of Job Corps and the WIOA Title I programs,
to leverage funding and provide appropriate training to the region’s youth participants.
The Charlottesville Albemarle Technical Education Center (CATEC) and Germanna
Community College both serve as regional coordinators for the Registered Apprenticeship
programs. CATEC in particular is directly connected to the K-12 school systems, as it is funded
by the City of Charlottesville Public Schools and Albemarle County Public Schools. Youth are
referred to the vocational education center from the public school systems when they are
interested in vocational education and obtaining technical credentials.
One of the other initiatives that PWN will implement is the development of a Youth
Employment Summit, at the request of the PWN Council (CLEO) members. This Youth

Local Plan – 2016-2020
103 | P a g e
Employment Summit will invite regional and local youth practitioners to come together, discuss
challenges faced by the region’s youth in entering education or obtaining employment,
highlighting resources that are still needed to serve youth in the region, and provide an outlet for
planning and coordination for future programs and funding applications.
H. Efforts taken to ensure compliance with applicable child labor and safety regulations
Any activity that is subject to child labor and safety regulations, such as Work
Experience, Internships, or On-the-Job Training activities are monitored to be compliant will all
applicable regulations. All employers that participate in work based training opportunities
through the WIOA Youth program are required to adhere to manuals that have been developed
for the programs, and sign a contract that reviews child labor and safety regulations. All youth
that are involved with work experiences are not eligible to work more than 40 hours per week
and this is noted in both the manual and contract with employers. Youth participants must also
have supervision on-site at all times, and the employer must sign off that this will be adhered to
for the duration of the activity. Youth participants that are in-school at the time they participate
in work based learning activities are limited further on the hours that they work during the week
to ensure that school activities are not affected by employment. Work site visits are conducted by
case management staff on a monthly basis to not only speak with work site supervisors about
progress made by the participant and to speak with the participant to ensure regulations and rules
are being followed.
I. Pay-for-performance policy as applicable
PWN has chosen not to execute pay-for-performance contracts for youth services at this
time.

Local Plan – 2016-2020
104 | P a g e
I. SUPPORTIVE SERVICE PROVISION
Provide a description of how the Local WDB will coordinate WIOA Title I workforce investment activities with the provision of transportation and other appropriate supportive services in the local area.
Due to low funding levels under the WIOA Title I programs, priority for supportive
services has been for those activities that are included in the training definition specified in
Virginia Workforce Letter #14-17. Transportation assistance, credentialing or licensing feeds,
books and training materials, and other required uniforms or work related materials are
prioritized and funded with WIOA Title I funding in the Adult and Dislocated Worker programs.
Under previous legislation and policy, PWN had the ability to provide additional supportive
services, such as childcare and emergency housing related assistance or needs based payments.
These are no longer available to be funded by WIOA due to restrictions and limited funding. In
order to meet the needs of the WIOA participants, and to further leverage funding, WIOA funds,
while used for allowable activities, are also used as a last resort, with other resources required to
be exhausted first. Once a participant has requested supportive services or a need has been
identified, WIOA Title I staff review the capability of other workforce development system
partners to provide the funding for the supportive service. Examples of these partners include the
United Way, Community Action Agencies, Head Start programs, local Departments of Social
Services, scholarship and grant opportunities, literacy councils, housing networks, and regional
transportation networks. WIOA Title I Program staff must document the lack of funding from
other agencies to support these activities prior to WIOA funding being allocated.
J. TRAINING SERVICES
Provide a description of how training services outlined in WIOA sec. 134 will be provided through the use of individual training accounts, including, if contracts for training services will be used; and the following:

Local Plan – 2016-2020
105 | P a g e
1. How the use of such contracts will be coordinated with the use of individual training accounts
PWN does not traditionally use contracts with entities to provide training services.
Instances of using these contracts may occur if customized training activities were conducted.
Individual Training Accounts (ITAs) are the most common way that funding is provided to
eligible WIOA participants to attend training to develop their skills. In order to streamline and
ensure that federal funding is used in an efficient and effective manner, PWN will prioritize
funding provided through ITAs to programs that lead to in-demand occupations within the
Health Services, Information Technology, Manufacturing/Distribution, and Business and
Financial Services industries. These industries and the in-demand occupations associated with
them will be reviewed on an annual basis, with input provided by the PWN Board, Council, and
economic development representatives in the area, to ensure that the priority for PWN remains
relevant with the local economy.
ITAs are provided to participants in the WIOA program for training activities and up to
$5,000 can be provided in a program year per participant. This $5,000 includes funding that is
used to provide supportive services to the participant to attend those training activities. A
lifetime maximum of $10,000 (also including supportive services costs) is provided to each
participant. Multiple training services can be provided to participants in the WIOA programs, as
the goal of the programs is to introduce individuals to a career pathway, which more often times
than not requires the attainment of stackable, portable credentials.
While ITAs are the most common method of allocating funding for training activities, the
need may arise to conduct customized training in order to meet a business need. The contract that
would be formed as a result of an employer needing customized training would be coordinated

Local Plan – 2016-2020
106 | P a g e
with the WIOA programs to ensure that funding allocated through that contract does not
duplicate or exceed the amounts for ITAs that are distributed for participants.
2. How the Local WDB will ensure informed customer choice in the selection of training programs regardless of how the training services are to be provided
Once a career pathway or occupation has been chosen, all participants on the Adult and
Dislocated Worker programs that are interested in training activities through WIOA will be
distributed a list of providers and programs in the region that administer training or educational
activities that lead to the occupation or pathway of their choice. The providers and programs that
will be given to the participant will only include those that have been approved for the Virginia
Eligible Training Provider List (ETPL). This list will include the provider name, the cost of the
program, and performance information, if any, that has been gathered. This information can all
be found on the Virginia Workforce Connection, the system of record for the Commonwealth,
and participants will be directed there to conduct research on the best provider and program of
their choice. While the WIOA Youth program is not required to adhere to the Virginia ETPL list,
the PWN Board and Council (CLEO) strongly encourage the use of this list when providing
services to participants.
K. COLLABORATION WITH THE COMMUNITY COLLEGES
Provide a description of how the Local WDB will collaborate local workforce investment activities with the community colleges in their area in the planning and delivery of workforce and training services.
The community colleges throughout the region have been excellent partners in the
workforce development system and continue to provide essential resources to the region’s job
seekers and employers. PWN has strived to make them an integral partner and involved in many
of the initiatives being undertaken by the Board, Council, and committees. Not only have
representatives of the community colleges become present at the comprehensive and affiliate

Local Plan – 2016-2020
107 | P a g e
One Stop Centers in the region, representatives from 2 of 3 of the colleges in the region are
represented on the PWN Board and also chair two of the committees that oversee detailed
operations. In any future developments of initiatives in the region, PWN will always involve the
community colleges in discussions as their expertise of education and training needs and
opportunities is not duplicated by any other partner.
There are many ways in which PWN already collaborates with the community colleges
on initiatives in the region. As the community colleges have been designated the training
coordinators by the Code of Virginia, many of the initiatives that are undertaken by the PWN
related to training are coordinated or developed in partnership with community college staff. The
Virginia Incumbent Worker Innovation Program funding that was secured by PWN in June 2016
had significant development assistance by community college staff, and the outreach to local
employers regarding this program has largely been conducted by community college staff. By
capitalizing on current staff at the community colleges that are assigned to conduct employer
outreach and have them promote the incumbent worker training funds available, PWN is able to
operate the grant without additional staff for program management. PWN also leverages the
funding that is provided through the Workforce Credentials Grant to better serve job seekers and
employers in the region and will continue to do so to stretch dollars further.
In the future, PWN will continue to serve on Employer Advisory Councils with the
community colleges to offer input and advice on curriculums and programs needed by the local
employers. PWN will also encourage further collaboration between Title II – Adult Education
and Literacy providers and the community colleges to create contextualized training
opportunities for individuals with barriers to employment and/or basic skills deficient
populations. In order for PWN to be successful in assisting the individuals who remain

Local Plan – 2016-2020
108 | P a g e
unemployed or underemployed at the present, all partners must work together to address their
skill deficiencies and help them work toward career pathways development.
Utilizing the community colleges expertise further, and by partnering with regional and
local economic development offices, PWN will explore the possibility of hosting a regional
summit on workforce and economic development initiatives and activities for local employers.
Employers in the region are interested in the events and resources available to them and the steps
being taken to make the region and localities more prosperous for their business to grow and
succeed.
L. COLLABORATION WITH EDUCATION
Provide a description of how the Local WDB will coordinate relevant secondary and postsecondary education programs and activities with education and workforce investment activities to coordinate strategies, enhance services, and avoid duplication of services.
Collaboration with education, especially with secondary education programs and
activities, has been an area in which PWN and the partners in the workforce development system
have been striving to improve. K-12 school systems have recently become more involved with
the PWN Board and Council, with Career and Technical Education (CTE) representatives
serving at the committee level to the PWN Board. PWN has also been involved with CTE
advisory councils in a couple of the localities in the region, providing data and information
regarding workforce trends, employer needs, and occupation and credential demands. One of the
ways in which PWN can further collaboration with all CTE groups in the region is to request to
be a member of CTE groups for the local school systems. These groups are an entry way to the
school systems and will provide opportunities for PWN to promote services and programs that
are available to youth in the region to help them prepare for employment or post-secondary
education.

Local Plan – 2016-2020
109 | P a g e
All of the workforce development system partners are tasked with serving youth in some
capacity, and it is important that the partners understand the goals and measures that each partner
must meet with this population. In order to eliminate the duplication of services and capitalize on
the potential to leverage funding sources, PWN and the partners in the system will work together
to develop strategies to serve youth through the public school system. One potential strategy
would be to convene the partners in the One Stop Center that provide services to youth, such as
the Department for Aging and Rehabilitative Services, WIOA Title I Youth Programs, etc. to
discuss workshops and seminars that could be conducted on-site at local high schools to students.
Potential topics for these workshops could be resumes and cover letter development, social
media etiquette, interviewing tactics, and more. By providing these workshops, the workforce
development system would be bringing services in-house and into rural communities, as well as
recruiting and screening for potential participants.
In 2014, PWN began an event known as the Help Wanted! Teen Opportunities Fair,
which occurs in early Spring solely for youth ages 16-24. This event brings together employers,
nonprofit organizations, workforce development system partners, and local school systems, to
provide an opportunity for youth to explore employment, internship, and volunteer opportunities.
Having the participation by the local school systems allows them to drive the conversations and
provide input on the needs and wants of their students. This event will continue to be held and
PWN will be working with the local school systems to look for ways to improve operations and
expand services.
Another strategy that will be implemented by PWN and its partner organization will be
the development of specific marketing and informational materials to distribute to the K-12
school systems, including CTE departments. These materials will include cheat sheets for school

Local Plan – 2016-2020
110 | P a g e
staff on the services available, including potential eligibility requirements, flyers and marketing
materials to distribute to parents, and information on post-secondary workshops and resources
available in the region. There is also discussion to develop a 12 month calendar that would be
general in nature and lay out events that are conducted and facilitated by the workforce
development system. This would include any job fairs that occur, seasonal and peak hiring
seasons for local employers (depending on industry), events held at the One Stops in the region,
and more.
M. COLLABORATION WITH ADULT EDUCATION AND LITERACY
Provide a description of how the Local WDB will coordinate WIOA Title I workforce investment activities with adult education and literacy activities under WIOA Title II, including how the Local WDB will carry out the review of local applications submitted under Title II consistent with WIOA secs. 107(d)(l)(A) and (B)(i) and WIOA sec. 232.
Adult Education and Literacy serves have changed under the new WIOA legislation with
the mandate that services be expanded with no financial resources to make the necessary
changes. Traditionally, in PWN’s region, Adult Education and Literacy activities are the services
that have the least financial backing, and the need to access additional resources and eliminate
duplication among partners applies to Title II more than ever. In order for the organizations
providing Title II services to be successful, it will be a necessity for those organizations to have
access to training dollars through Title I WIOA programs. Integrated education has been a
proven successful model in the region and Adult Education providers are poised to implement
these training programs, such as Plugged In, in an enhanced way going forward. By adding the
organizations that administer Title II to the Virginia Eligible Training Provider List, these
organizations will have access to training funds to further expand these successful programs. It
will also be important to make sure that all financial resources are being leveraged, and that costs

Local Plan – 2016-2020
111 | P a g e
for programs that lead to credential are affordable for not only the individual, but also for the
programs supporting those individuals.
Another important aspect of Title II programs is the capacity to bring the lowest skilled
population, including English Language Learners and individuals with low basic skills, to a place
where they are ready to enter the career pathways in PWN’s target industries. By providing
foundational skills, such as customer service, basic skills to achieve a high school diploma or
equivalent, or digital literacy competencies, individuals will be more prepared and have greater
opportunities for success in self-sufficient, in-demand occupations. Integrated education that
includes foundational skills being taught at the same time as more technical skills, such as
training that leads to a credential, will be a model that PWN works toward in the future. This will
involve discussions among agencies in the workforce development system on how to achieve
this goal. One barrier that does currently exist is the minimum education requirements needed to
enter courses with the community colleges. PWN will work with the community college partners
and adult education providers to break down this barrier and make integrated education a
possibility for the region.
N. PRIORITY OF SERVICE
Provide a description of how the direction given by the Governor and the Local WDB to the one-stop operator to ensure priority for adult career and training services will be given to recipients of public assistance, other low-income individuals, and individuals who are basic skills deficient consistent with WIOA sec. 134(c)(3)(E) and § 680.600.
PWN will adhere to the priority of service provision in the WIOA legislation for Adult
career and training services. A policy has been developed to enforce this priority of service, and
has been attached in Appendix A.

Local Plan – 2016-2020
112 | P a g e
O. INCORPORATION OF TECHNOLOGY
Provide a description of how one-stop centers are implementing and transitioning to an integrated, technology-enabled intake and case management information system for programs carried out under WIOA and by one-stop partners.
The PWN and the One Stop Centers embrace technology and look for ways to
incorporate new strategies with technology into daily operations. One challenge to doing this is
funding for the equipment to upgrade the systems in place. In FY2017, PWN allocated funding
to purchase iPads for the comprehensive One Stop in Charlottesville to potentially make the
sign-in and referral process smoother for visitors. PWN also allocated funding to purchase two
(2) sets of laptop computers, one set for Planning District 10 and one set for Planning District 9,
to be used as mobile computer labs. These computers can be checked out of the One Stop
Centers by any partner agency and taken to rural and outlying counties to conduct workshops,
perform intakes, and provide services that are convenient for the region’s constituents. The
funding that was allocated for these activities came solely from money contributed to PWN by
the localities through their annual budget cycles.
Case management can also benefit from the use of technology and integrated systems.
Ideally, the core partners in the One Stop System that will consistently be utilizing co-enrollment
to leverage resources, Title I – WIOA Programs, Title II – Adult Education and Literacy, Title
III – Wagner Peyser, and Title IV – Vocational Rehabilitation, would all share the same case
management system and have the ability to see activities and services through technology. With
the Commonwealth of Virginia receiving funding to research the possibility of a Common Intake
system, PWN will participate as much as possible to provide feedback and input on a system and
how it could function within the Local Workforce Development Areas. In the meantime, PWN
will commit to working with the Virginia Community College System in order to explore the

Local Plan – 2016-2020
113 | P a g e
possibility of having WIOA case management files stored electronically. This will reduce costs
for the programs as well as provide easy access to case management staff and allow for travel to
more rural areas.
P. EFFICIENT AND EFFECTIVE SERVICE DELIVERY
Provide a description of the plans, assurances, and strategies for maximizing coordination, improving service delivery, and avoiding duplication of Wagner-Peyser Act (29 U.S.C. 49 et seq.) services and other services provided through the one-stop delivery system.
Wagner-Peyser services are detailed in Title III of the WIOA legislation, and in Virginia,
are administered by the Virginia Employment Commission (VEC). The VEC regional office
located within PWN’s region operates these programs and provides a labor exchange system
(Virginia Workforce Connection (VaWC)) that facilitates the connection between employers and
job seekers. The VaWC system provides a location for job seekers to search available
employment opportunities and connects them with the hiring process to apply for those positions
and also provides an outlet for employers to post their jobs and recruit potential employees. Self-
services are also available through the VaWC system and are promoted through the
Comprehensive and Affiliate One Stop Centers. The WIOA One Stop and Program Operator
coordinates with the services provided by the VaWC and works side-by-side with VEC staff,
especially in the comprehensive One Stop Center to provide career services. As stated by policy
developed by the Virginia Board of Workforce Development, the primary provider of career
services will be VEC staff, with other partners assisting when necessary.
PWN works with the VEC, as well as the other partners in the workforce development
system to provide comprehensive services to the business community as well as job seekers. By
using the Business Services Teams as the single point of contact outlet for employers, the
coordination of these teams eliminates the duplication of services. The One Stop Management

Local Plan – 2016-2020
114 | P a g e
Teams oversee the general operations of the One Stop Centers, which include Business Services,
and oversee the service delivery processes put into place in order to provide services to
employers and job seekers. The Management Teams consist of regional or local managers from
all of core partners, as well as other partners that are co-located at the One Stop Centers. Both of
these teams have been put into place to provide an outlet for coordination and a discussion group
for continuous improvement methods.
The local Memorandum of Understanding (MOU) that will be developed to comply with
the new WIOA legislation will detail the roles and responsibilities of each of the core and
required partners and the services that each will provide to employers and job seekers as a part of
the workforce development system. The MOU will be developed in compliance with this Local
Plan, with the vision of the Virginia Combined State Plan in mind, and with adherence to any
Virginia Board of Workforce Development policies that have been developed.
Q. FISCAL AGENT
Provide a description of the fiscal and budgetary strategies used in the local area, to include:
1. Identification of the entity/fiscal agent responsible for the disbursal of grant funds described in WIOA sec. 107(d)(12)(B)(i)(lll), as determined by the chief elected official
As the PWN is not an official entity, the Chief Local Elected Official has designated that
the Central Virginia Partnership for Economic Development will serve as the fiscal and
administrative agent for the region. The Central Virginia Partnership is the regional economic
development organization covering the City of Charlottesville and the Counties of Albemarle,
Culpeper, Fluvanna, Greene, Louisa, Madison, Nelson, and Orange. Fauquier and Rappahannock
Counties do not identify with a regional economic development organization, but are included

Local Plan – 2016-2020
115 | P a g e
within GO Virginia Region 9, and the Central Virginia Partnership is the lead organization for
this initiative.
An agreement between the City of Charlottesville, the PWN Council, which is made up
of the Chief Local Elected Official, or their designee, from each of the eleven localities, and the
Central Virginia Partnership exists which outlines the duties of the fiscal and administrative
agreement. This agreement has been attached in Appendix A of the Local Plan. The Central
Virginia Partnership provides quarterly reports to the PWN Council and review of the fiscal and
administrative agents duties are done on an ongoing basis.
2. The methods and strategies used to ensure timely expenditure of WIA funds
PWN Board staff, who are employees of the Central Virginia Partnership, ensure the
timely expenditure of funds in partnership with the WIOA One Stop and Program Operator.
During the budgetary process, the Central Virginia Partnership and PWN Board staff review
current year allocations, carryforward funds, and projected expenditures for the year. During the
year, the Grant Accountant and Assistant Director ensure that funds are spent on a first-in-first-
out basis when possible, but also analyze the proper program year to categorize expenditures
toward. The expenditures are monitored on a monthly basis during the reimbursement process
and discussions are held with the WIOA Program Operator to analyze budget versus actual
amounts. When funds are not spent in a timely manner, the WIOA Program Operator and PWN
Board staff work together to come up with solutions for how to increase the level of spending,
including transferring funds, the creation of new programs, or additional staff in different
programs.

Local Plan – 2016-2020
116 | P a g e
3. The competitive process to be used to award the grants and contracts in the local area for activities carried out under WIA
PWN follows the City of Charlottesville’s local procurement process, as the City is the
Grant Recipient of WIOA funding for Local Workforce Development Area 6. In terms of the
WIOA One Stop and Program Operator for the Adult, Dislocated Worker, and Youth programs,
PWN uses a competitive procurement process which outlines the statement of work, funding
allocations, and general terms and conditions for program. This procurement process occurs at a
maximum of once every three years, which each contract being awarded for one year with the
possibility of two one year extensions. A Request for Proposals (RFP) is released detailing the
parameters of the grant and technical assistance conferences are provided to potential bidders. A
general list of organizations that have submitted in the past, partners in the workforce
development system, economic development leaders, and county administrators and staff is used
to distribute the RFP announcement. The notification is also sent to partners at the state level
organizations, such as VCCS, VEC, DARS, and Department of Education. This process also
applies to other discretionary grants that are received from PWN that require competitive
procurement.
4. The strategy used by the LWDB to leverage WIOA funds with other Federal, State, local and philanthropic resources
The annual allocation of WIOA funds in PWN’s region has become the second lowest
allocation in the Commonwealth of Virginia. With limited amounts of WIOA funding available,
the funding mandates required for training expenditures, and the large demand for training by the
region’s constituents, PWN has had to explore possibilities for additional funding. While the
Department of Labor frequently releases funding opportunities other than the WIOA programs,
PWN does not consider these dollars a priority when looking for additional funding sources.
PWN’s region has a generous number of non-profits and community agencies that are interested

Local Plan – 2016-2020
117 | P a g e
in funding activities associated with workforce development. Agencies such as the United Way
and the Charlottesville Area Community Foundation release annual funding opportunities that
PWN can capitalize on for additional resources. In order to maximize future applications for all
agencies within the workforce development system, all core and required partners have agreed to
collaborate on as many grant applications as possible, instead of creating competition amongst
partners within the system. This will include vetting potential grant opportunities through the
One Stop Management Teams as well as the Program Planning & Service Delivery Committee,
which includes a number of the core and required partners in the system. Additional funding that
is received by PWN will be leveraged with existing WIOA funding in order to focus WIOA
funds on training expenditures.
R. PROCUREMENT
Provide a description of the competitive process that will be used to award the sub-grants and contracts for WIOA Title I activities.
PWN provides a competitive procurement opportunity for organizations interested in
operating the WIOA Title I Activities, including One Stop Operator, Career Services, and the
Adult, Dislocated Worker, and Youth Programs. The procurement cycle occurs at a maximum of
every three years, and is awarded to successful bidders for one year with an option for two one
year renewals. The previous procurement cycle began July 1, 2015 and runs through June 30,
2017 with a possibility for one additional year renewal until June 30, 2018. A Request for
Proposals (RFP(s)) will be released in early 2018 for One Stop Operator, Career Services, and
the Adult, Dislocated Worker, and Youth programs under WIOA. The RFP(s) will detail a
statement of work, goals for the PWN, potential funding allocations, and general terms and
conditions of being selected as the contractor. In order to comply with public notice
requirements, the announcement will be placed on the PWN & Central Virginia Partnership for

Local Plan – 2016-2020
118 | P a g e
Economic Development’s website, posted in the local newspapers, and also sent to a general
distribution list that includes workforce development system partners, local elected officials,
county administrators and staff, as well as state officials from VCCS, VEC, and DARS. A
committee established by the PWN Board reviews the submissions to the RFP(s) and makes a
recommendation to the PWN Board and Council (CLEOs) for an award to be made. Once an
intent to award has been made, public notice of that decision will be made for 10 days prior to
the award being finalized using the same distribution and posting process as noted above.
Contracts that are made with the awardees are based on items noted in the RFP(s).
S. PERFORMANCE
Provide a description of the local levels of performance negotiated with the Governor and chief elected official consistent with WIOA sec. 116(c), to be used to measure the performance of the local area and to be used by the Local WDB for measuring the performance of the local fiscal agent (where appropriate), eligible providers under WIOA Title I subtitle B, and the one-stop delivery system in the local area.
The performance levels that have been negotiated with the Virginia Community College
System, as Title I Administrator for the Commonwealth of Virginia are as follows:
PWN Performance Measures – PY2016 & PY2017 Adult PWN Virginia
Employment 2nd Quarter After Exit 73.8% 77.0% Employment 4th Quarter After Exit 78.3% 85.0% Median Earnings 2nd Quarter After Exit $3,286 $5,500 Credential Attainment 61.0% 61.0% Measurable Skills Gain Baseline Baseline
Dislocated Worker PWN Virginia Employment 2nd Quarter After Exit 77.8% 83.0% Employment 4th Quarter After Exit 83.0% 85.0% Median Earnings 2nd Quarter After Exit $6,027 $7,600 Credential Attainment 74.1% 64.0% Measurable Skills Gain Baseline Baseline
Youth PWN Virginia Employment 2nd Quarter After Exit 72.4% 63.0% Employment 4th Quarter After Exit 61.5% 60.0% Median Earnings 2nd Quarter After Exit Baseline Baseline

Local Plan – 2016-2020
119 | P a g e
Credential Attainment 77.6% 68.0% Measurable Skills Gain Baseline Baseline
T. QUALITY ASSURANCE
Provide a description of the actions the Local WDB will take toward becoming or remaining a high performing WDB, consistent with the factors developed by the State WDB.
Three aspects have been determined to the local area designation process to receive
subsequent designation by the Governor of Virginia, and PWN will use these aspects to maintain
its status as a high performing WDB.
Performed Successfully – PWN has continued to perform successfully by meeting or exceeding
WIA performance standards in the past 4 years. PWN continues to strive for this same level of
performance and works with the WIOA Title I Operator to ensure that high performance
continues.
Sustained Fiscal Integrity – PWN has maintained fiscal integrity and has never had a formal
determination done by the Department of Labor. PWN staff continue to monitor on a weekly
basis expenditures and budgets to ensure fiscal integrity.
Local Planning Regions – PWN is poised well as a planning region, but works with the
surrounding areas on a frequent basis to assist employers and job seekers in need. PWN’s region
also coincides with the new GO Virginia region 9, providing an additional opportunity for
collaboration between economic development and workforce development partners.
U. PUBLIC COMMENT PERIOD
Provide a description of the process used by the Local WDB, consistent with WIOA sec. 108{d), to provide no less than a 30-day public comment period prior to submission of the plan, including an opportunity to have input into the development of the local plan, particularly for representatives of businesses, education, and labor organizations.

Local Plan – 2016-2020
120 | P a g e
PWN has utilized a public process throughout the entire development of the Local Plan
for the region. Meetings were held with a team of partners, Board members, and other system
participants to develop the Local Plan in a collaborative manner. The team composition and
attendance at scheduled meetings was as follows:
Local Plan Development Team Members Name Organization Program
Richard Sindy Virginia Employment Commission (VEC) Title III – Wagner-Peyser Jobs for Veterans State Grants (JVSG)
Susan Erno Thomas Jefferson Adult and Career Education (TJACE) Title II – Adult Education and Literacy Carol Coffey
Caroline Smeltz Piedmont Regional Adult and Continuing Education (PRACEP) Ginger Hilleary
Martha O’Keefe Germanna Community College Community College Ben Sherman
Valerie Palamountain Piedmont Virginia Community College
Carlene Hurdle Lord Fairfax Community College Fauquier County Economic Development Economic Development
Naomi Aitken Department for Aging and Rehabilitative Services Title IV – Vocational Rehabilitation Tiffany Jenkins
Mike Thelk Department for Blind and Vision Impaired
Ridge Schuyler Piedmont Virginia Community College SNAP Employment & Training Charlottesville Works Initiative Community Based Organization
Sam Spencer Albemarle Social Services
TANF/VIEW
Diane Kuknyo City of Charlottesville Social Services Kelly Logan Carol Lee Madison County Social Services Lisa Peacock Culpeper Human Services Laura Brown Fauquier County Social Services
Casey Carwile Design Electric Registered Apprenticeship Business Representative
Marty Bywaters-Baldwin Rappahannock Goodwill Industries WIOA and One Stop Operator Clay Stein Goodwill Industries of the Valleys
Local Plan Development Meeting Attendance Team Member Oct 4th Oct 19th Oct 26th Nov 9th Nov 30th Jan 5th
Richard Sindy X X X X X Susan Erno X X X X X Ginger Hilleary X X X Carlene Hurdle X X X Martha O’Keefe X X
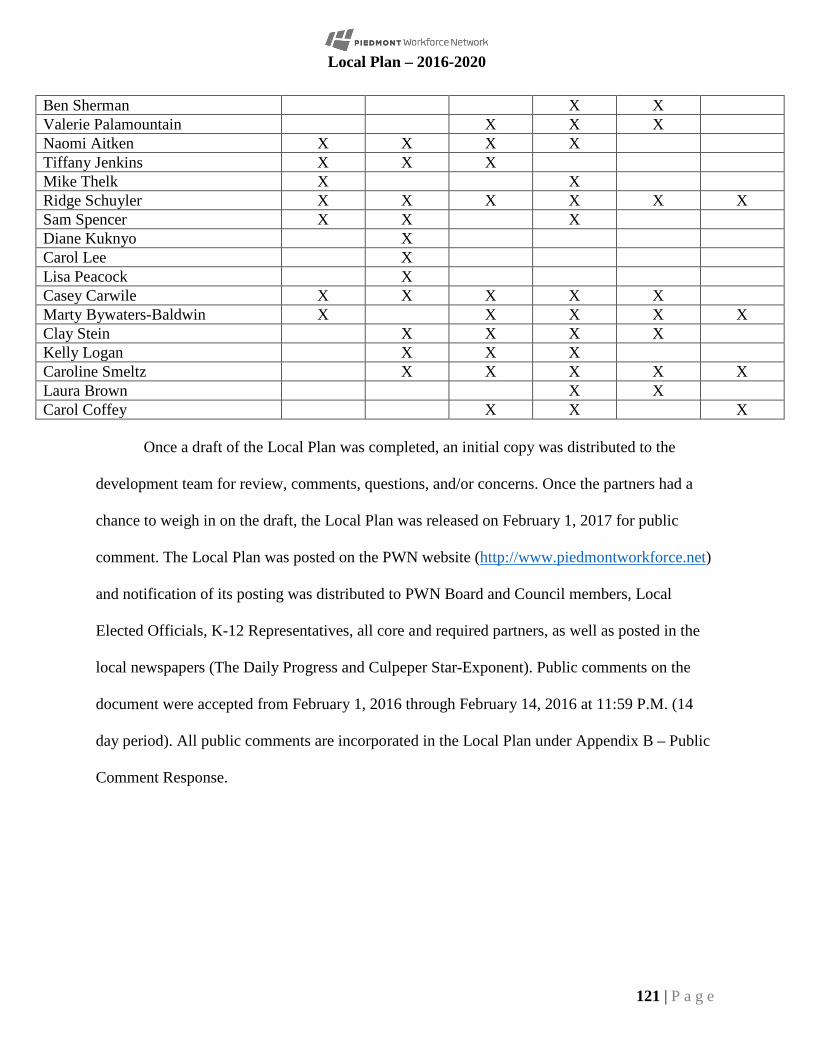
Local Plan – 2016-2020
121 | P a g e
Ben Sherman X X Valerie Palamountain X X X Naomi Aitken X X X X Tiffany Jenkins X X X Mike Thelk X X Ridge Schuyler X X X X X X Sam Spencer X X X Diane Kuknyo X Carol Lee X Lisa Peacock X Casey Carwile X X X X X Marty Bywaters-Baldwin X X X X X Clay Stein X X X X Kelly Logan X X X Caroline Smeltz X X X X X Laura Brown X X Carol Coffey X X X
Once a draft of the Local Plan was completed, an initial copy was distributed to the
development team for review, comments, questions, and/or concerns. Once the partners had a
chance to weigh in on the draft, the Local Plan was released on February 1, 2017 for public
comment. The Local Plan was posted on the PWN website (http://www.piedmontworkforce.net)
and notification of its posting was distributed to PWN Board and Council members, Local
Elected Officials, K-12 Representatives, all core and required partners, as well as posted in the
local newspapers (The Daily Progress and Culpeper Star-Exponent). Public comments on the
document were accepted from February 1, 2016 through February 14, 2016 at 11:59 P.M. (14
day period). All public comments are incorporated in the Local Plan under Appendix B – Public
Comment Response.

Local Plan – 2016-2020
122 | P a g e
APPENDIX A

2
| Thomas Jefferson Partnership for Economic Development
Regional Existing and Target Industry Analysis
Approach This report for the Thomas Jefferson Partnership for Economic Development (TJPED) region provides an understanding of the industry groups currently present in the regional economy. Since at least 80 percent of economic growth within a region is typically generated by innovative existing industry, these groups must be understood and supported by economic developers.
In this study, existing industry groups have been analyzed in terms of growth, level of specialization in the local economy, degree of connectedness to the local economy and competitiveness. The region’s strategic focus on balancing growth with maintaining the outstanding quality of life is also central to the analysis.
Potential target industry groups were screened to select sectors that have the strongest local rationale and best industry outlook. New and emerging industry, technology assets, workforce and locational strengths were considered in screening for select target sectors.
Target industry groups have been identified for the each locality and are presented in separate chapters for each locality in this report. Chart 1 on the following page summarizes the target industry groups for each locality.
This chapter of the report presents the regional target industry groups for the overall TJPED region. The targets for the region were selected with consideration to wide applicability throughout the region and to prioritization of limited resources for attraction or expansion efforts. Charlottesville and all counties and in the TJPED region can achieve economic benefits from the successful attraction and expansion of businesses of the regional targets as well as the targets specific to particular localities.

3
Chart 1 Thomas Jefferson Partnership for Economic Development Region Target Business Clusters/Industry Groups By Locality
* The type of Light Manufacturing differs by locality
Albemarle Charlottesville Culpeper Fluvanna Greene Louisa Madison Nelson Orange
• •
• • • • • • • •
• • • • • •
• •
• • • • • • • •
• • • • • •
• •
• • • • • • • •
• • • • • •
• •
• • • • • •
• •
• • • • • • • •
• • • • • •
• •
Bioscience & Medical Devices
Business & Financial Services
Information Technology
Defense & Security
Health Services
Agribusiness, Food Processing & Tech
Transportation & Logistics
Chemicals & Plastics
• • • • • •
• •
• • • • • •
•
•
•
•
Forest & Wood Products
Light Manufacturing*
Arts, Design, Sports & Media
•
•
•
•
•
•
•

4
Existing Business Clusters and Major Industry Groups
The economy of the Thomas Jefferson Partnership for Economic Development Region (TJPED) is comprised primarily of 16 major industry groups or clusters listed in Table 1. These industry groups are derived from work conducted by Purdue University’s Center for Regional Development. The widely accepted methodology was funded by the U.S. Economic Development Administration and the Kelley School of Business. The industry groups constructed by the Center each share common or complementary markets, suppliers, and workforce skills. The groups provide a standardized means to identify areas of local concentration and specialization.
Regional and individual locality data for all other industries are provided in Appendix F.
Table 1 Thomas Jefferson Partnership for Economic Development Region Major Business Clusters/Industry Groups Ranked by Size 2011
Jobs Five- Year
Change
Five- Year
Change (%)
Average Earnings
Firms
Business & Financial Services
20,988 3,534 20% $49,711 1,485
Energy & Related Construction
10,798 (119) -1% $71,024 699
Biomedical/Health Services 9,381 (549) -6% $48,238 274 Arts, Entertainment, Recreation & Visitor Industries
8,629 514 6% $23,146 284
Information Technology & Telecommunications
7,272 334 5% $74,135 501
Defense & Security 7,082 507 8% $74,437 314 Agribusiness, Food Processing & Technology
6,434 697 12% $19,358 188
Advanced Materials 4,442 (267) -6% $83,087 137 Education & Knowledge Creation
3,863 321 9% $42,243 157
Printing & Publishing 3,806 69 2% $52,656 219 Forest & Wood Products 3,310 (1,574) -32% $37,391 240 Transportation & Logistics 3,126 (87) -3% $42,325 158 Computer & Electronic Product Mfg.
1,477 (348) -19% $99,189 23
Apparel & Textiles 1,253 (111) -8% $38,298 90 Chemicals & Plastics 1,197 (348) -23% $74,318 54 Fabricated Metal Product Mfg.
290 (104) -26% $47,555 20
Seven of these industry groups added employment over the last five years, the largest number in the Business & Financial Services group, which added an additional 3,534 jobs, up 20 percent.
Of course, not all of the industry groups are present in each locality. Later chapters of this report provide detailed information on the major industry groups for each county and the City of Charlottesville. Chart 2 on the following page provides an overview of the major industry groups by locality.

5
Chart 2 Thomas Jefferson Partnership for Economic Development Region Major Existing Business Clusters/Industry Groups By Locality
Albemarle Charlottesville Culpeper Fluvanna Greene Louisa Madison Nelson Orange
•
•
•
•
Advanced Materials
Education & Knowledge Creation
Printing and Publishing
•
•
•
•
•
•
•
• •
Business & Financial Services
Energy & Related Construction
Health Services
Biomedical/ Medical Devices
Arts, Ent./Rec. & Visitor Industries
Information Technology
Defense & Security
Agribusiness, Food Processing & Tech
• • • • • •
• •
• • • • • • • •
• • • • • •
• •
• • • • • • • •
• • • • • •
• •
• • • • • • • •
• • • • • •
• •
• • • • • • • •
• • • • • •
• •
• • • • • • • •
• • • • • •
•
Transportation & Logistics • • • • • • • • •
Forest & Wood Products • • • • • • • •
•
Apparel & Textiles • • • • • • • • •
Computer & Electronic Mfg. • • • • • • • •
•
Fabricated Metal Product Mfg. • • • • • • • • •
Chemicals and Plastics • • • • • • • •

6
Business & Financial Services is the largest industry group in the region; employing 20,988 in 1,485 firms. Besides adding the most new jobs over the last five years, the group also experienced the second highest percentage increase among all groups, at 20 percent. Only the Transportation Equipment Manufacturing group, at 22 percent, grew at a higher pace. Average earnings in the Business & Financial Services group are $49,711, which is 11 percent above the regional average of $44,670, and 12 percent below the state average of $56,533. Dominant subgroups in the TJPED region include: Data Processing and Hosting, Portfolio Management, Payroll & Accounting Services, Administrative Management & General Management Consulting Services, and Scientific & Technical Consulting Services. Although the group is populated by a many smaller firms, some examples of larger local firms in the group are the State Farm Operations Center, SNL Financial, and the CFA Institute.
Energy & Related Construction is the second largest industry group in the region, comprising 699 local establishments and 10,798 employees. Over the last five years, the Energy industry group has declined slightly, down by 1 percent or 119 fewer jobs. The group includes a portion of firms directly involved in construction, such as Heavy and Civil Engineering Construction, which have been hit hard in the most recent recession. The dominant industry subgroups include Nuclear & Fossil Fuel Electric Power Generation and Power & Communication Line & Related Structures. Examples of local operations in the group include the North Anna Nuclear Generating Station, the Tenaska Virginia Generating Station, Central Virginia Electric Cooperative, and S&N Communications.
The Biomedical/Health Services industry group is the third largest group in the region, employing 9,381 workers in 274 establishments. The group declined by 549 jobs, down 6 percent over the last five years, excluding Offices of Physicians, but grew slightly overall when the growth in Offices of Physicians is included in the total.
The largest subgroup in this industry is Health Services. The Health Services subgroup is present in all localities in the region. This subgroup is comprised of a mix of Medical and Surgical Hospitals and Nursing Care Facilities.
Biosciences/Medical Devices is the other major subgroup in this industry with the TJPED region. This subgroup is concentrated in the City of Charlottesville and Albemarle County where Surgical & Medical Instrument Manufacturers and Research & Development in Life Sciences typify the industry group. Examples of local operations in the group include the University of Virginia School of Medicine, Battelle Memorial Institute, and MicroAire Surgical Instruments.

7
Figure 1 Thomas Jefferson Partnership for Economic Development Region Existing Business Clusters & Major Industry Groups By Employment Size-2011
Source: Economic Modeling Specialist, Younger Associates
20,988
10,798
9,381
8,629
7,272
7,082
6,434
4,442
3,863
3,806
3,310
3,126
1,477
1,253
1,197
290
0 5,000 10,000 15,000 20,000 25,000
Business & Financial Services
Energy
Health Services/Biomedical/Biotechnical
Arts, Entertainment, Recreation & Visitor Industries
Information Technology & Telecommunications
Defense & Security
Agribusiness, Food Processing & Technology
Advanced Materials
Education & Knowledge Creation
Printing & Publishing
Forest & Wood Products
Transportation & Logistics
Computer & Electronic Product Mfg.
Apparel & Textiles
Chemicals & Plastics
Fabricated Metal Product Mfg.

8
Figure 2 Thomas Jefferson Partnership for Economic Development Region Existing Business Clusters & Major Industry Groups By Average Annual Earnings-2011
Source: Economic Modeling Specialist, Younger Associates
Benchmarks Jobs Growth Percent Avg Earnings Firms TJPED Region 190,039 6,254 3.4% $44,670 9,977 Virginia 4,7 M 23,688 0.5% $56,533 Nation 173 M (895,331) -0.5% $52,217 Source: Economic Modeling Specialist, Younger Associates
$99,189
$83,087
$74,437
$74,318
$74,135
$71,024
$52,656
$49,711
$48,238
$47,555
$42,325
$42,243
$38,298
$37,391
$23,146
$19,358
$0 $20,000 $40,000 $60,000 $80,000 $100,000 $120,000
Computer & Electronic Product Mfg.
Advanced Materials
Defense & Security
Chemicals & Plastics
Information Technology & Telecommunications
Energy
Printing & Publishing
Business & Financial Services
Health Services/Biomedical/Biotechnical
Fabricated Metal Product Mfg.
Transportation & Logistics
Education & Knowledge Creation
Apparel & Textiles
Forest & Wood Products
Arts, Entertainment, Recreation & Visitor Industries
Agribusiness, Food Processing & Technology Region Average $44,670
State Average $56,533

9
Jobs Multiplier Effect The jobs multipliers provided in Table 2 present a measure of the expected impact of job gains or losses in each industry group as they ripple through the county. The multiplier offers an indication of the connectedness of each group within the regional economy in terms of how many indirect jobs are created to support one job in an industry group. The Business and Financial Services group has the highest jobs multiplier of 10.37, which means 9.37 additional jobs are created across all industry groups in the TJPED region to support the economic activity generated by one direct job employed in the industry group.
The Business & Financial Services group jobs multiplier is significantly higher than any of the other industry groups. The Energy & Related Construction group has the second highest jobs multiplier at 7.35. High jobs multipliers indicate a strong business cluster where many of the support services and supply chain activities for the industry occur within the regional economy.
Table 2 Thomas Jefferson Partnership for Economic Development Region Industry Specialization of Major Business Clusters/Industry Groups Listed by Number of Jobs
2011 Jobs
Five- Year
Change (%)
Specialization (LQ)
Jobs Multiplier
Firms
Business & Financial Services
20,988 20% 0.92 10.37 1,485
Energy 10,798 -1% 1.09 7.35 699 Biomedical/Health Services 9,381 -6% 0.64 1.85 274 Arts, Entertainment, Recreation & Visitor Industries
8,629 6% 1.15 1.59 284
Information Technology & Telecommunications
7,272 5% 0.95 1.69 501
Defense & Security 7,082 8% 0.90 1.9 314 Agribusiness, Food Processing & Technology
6,434 12% 1.12 1.85 188
Advanced Materials 4,442 -6% 0.81 1.61 137 Education & Knowledge Creation
3,863 9% 0.90 2.84 157
Printing & Publishing 3,806 2% 1.18 2.76 219 Forest & Wood Products 3,310 -32% 1.21 2.04 240 Transportation & Logistics 3,126 -3% 0.56 1.44 158 Computer & Electronic Product Mfg.
1,477 -19% 1.18 1.77 23
Apparel & Textiles 1,253 -8% 0.88 1.26 90 Chemicals & Plastics 1,197 -23% 0.53 1.61 54 Fabricated Metal Product Mfg.
290 -26% 0.19 1.23 20
Source: Economic Modeling Specialist, Younger Associates

10
Industry Growth and Specialization Also shown in Table 2 is the location quotient (LQ), which indicates the level of specialization in each industry group. The LQ compares the concentration of employment in an industry group in the county to the concentration of employment in that same group in the U.S. workforce, where the U.S. concentrations is stated as 1. Shown in Table 2 are the LQ’s for each major industry group in the TJPED region
Among the 16 major industry groups in the region, six demonstrate levels of specialization above the nation by having a location quotient above 1.0 (Figure 3 and Table 2). In general, the LQ’s for all industry groups are relatively low when measured for the region as a whole. This indicates that the overall region lacks areas of strong specialization. However, individual locations within the region do have high LQ’s for specific industry groups. These can be seen in the chapters of this report that focus on individual localities.
When looking at the TJPED regional economy, Forest & Wood Products has the highest degree of local specialization at 1.21. The second highest area of specialization is shared between Printing & Publishing and Computer & Electronic Product Manufacturing, both with location quotients of 1.18. Figure 3 provides a graphic comparison of the LQ’s of the industry groups in the TJPED region.
Figure 3 Thomas Jefferson Partnership for Economic Development Region Existing Business Clusters & Major Industry Groups By Location Quotients-2011
Source: Economic Modeling Specialist, Younger Associates
1.21
1.18
1.18
1.15
1.12
1.09
0.95
0.92
0.9
0.9
0.88
0.81
0.64
0.56
0.53
0.19
0 0.2 0.4 0.6 0.8 1 1.2 1.4
Forest & Wood Products
Printing & Publishing
Computer & Electronic Product Mfg.
Arts, Entertainment, Recreation & Visitor Industries
Agribusiness, Food Processing & Technology
Energy
Information Technology & Telecommunications
Business & Financial Services
Defense & Security
Education & Knowledge Creation
Apparel & Textiles
Advanced Materials
Health Services/Biomedical/Biotechnical
Transportation & Logistics
Chemicals & Plastics
Fabricated Metal Product Mfg. Nationwide IndustryEmployment Ratio

11
Figure 4 below compares the level of specialization and the local absolute growth of the major industry groups for the TJPED regional economy. Six groups fall within the “competitive quadrant” which indicates both a degree of local specialization and employment growth.
Figure 3 Thomas Jefferson Partnership for Economic Development Region Major Business Clusters/Industry Groups
Size of bubble represents 2011 employment Source: Economic Modeling Specialist, Younger Associates
Business & Financial Services Energy
Health Services/Biomedical/Biotech
nical
Arts, Entertainment, Recreation & Visitor
Industries
Information Technology & Telecommunications
Defense & Security
Agribusiness, Food Processing & Technology
Advanced Materials
Education & Knowledge Creation
Printing & Publishing
Forest & Wood Products
Transportation & Logistics
Computer & Electronic Product Mfg.
Apparel & Textiles
Chemicals & Plastics
Transportation Equipment Mfg. Machinery Mfg.
Electrical Equipment, Appliance & Component
Mfg.
Fabricated Metal Product Mfg.
0.00
0.20
0.40
0.60
0.80
1.00
1.20
1.40
(2,000) (1,000) 0 1,000 2,000 3,000 4,000
Spec
ializ
atio
n (L
Q)
Employment Change (2006-2011)
At-Risk Competitive
Declining Rising

12
Relative Competitiveness Measuring relative competitiveness among the 16 major industry groups in the region helps uncover unique local competitive advantages and industry-specific growth (Figure 5). A shift-share analysis was conducted to disaggregate local employment change over the last five years into three effects; national, industry-wide, and local competitive effect. The purpose of this analysis is to help reveal local industry growth that is due to local economic advantages. The local competitive effect is the employment change that is not explained by national or industry-wide trends, and may indicate unique local competitive advantages (or disadvantages). The analysis does not answer the underlying causes for the growth or decline.
Of the 16 major industry groups in the TJPED region, Business & Financial Services exhibited the strongest growth attributed to a local competitive effect. Although this industry group has a positive national and industry growth trend, growth within the TJPED region outpaced those trends. This is indicative of positive local competitive advantages for those firms within the region. The Information Technology & Telecommunications group had the second strongest local competitive effect, followed by the Agribusiness, Food Processing & Technology group. The Biomedical/Health Services group experienced greater job losses in the region than national and industry trends predicted. Figure 5 Thomas Jefferson Partnership for Economic Development Region Five-Year Competitiveness Major Business Clusters/Industry Groups
Size of bubble represents 2011 employment Source: Economic Modeling Specialist, Younger Associates
Business & Financial Services
Energy
Health Services Biomedical/Biotechnical
Arts, Entertainment, Recreation & Visitor
Industries
Information Technology & Telecommunications
Defense & Security
Agribusiness, Food Processing & Technology
Advanced Materials
Education & Knowledge Creation
Printing & Publishing
Forest & Wood Products Transportation & Logistics
Computer & Electronic Product Mfg.
Apparel & Textiles
Chemicals & Plastics Transportation Equipment
Mfg.
Machinery Mfg.
Electrical Equipment, Appliance & Component
Mfg.
Fabricated Metal Product Mfg.
(1,500)
(1,000)
(500)
0
500
1,000
1,500
2,000
2,500
(1,500) (1,000) (500) 0 500 1,000 1,500 2,000
Indu
stry
-Wid
e Ef
fect
(5-Y
ear
Job
Chan
ge)
Local Competitive Effect (5-Year Job Change)
Local DeclineNational Growth
Local GrowthNational Growth
Local GrowthNational Decline
Local DeclineNational Decline

13
Occupational Growth and Specialization Recognizing the region’s local occupational strengths and current job trends is just as critical as understanding its industrial position. An examination of local employment by major occupational groups reflects the region’s occupational specialization in Life, Physical, & Social Science, and Farming & Forestry occupations (Figure 6 and Table 3). In addition to a high level specialization, both occupations groups have experienced growth over the last five years. As could reasonably be expected based on industry growth, the Business & Financial Operations occupation group had the largest net increase over the last five years, up 1,594 positions.
The area has several well-paying occupational groups. Five groups have average hourly wages above $30: Education, Training, & Library; Architecture & Engineering; Legal; Computer & Mathematical; and Healthcare Practitioners & Technical. These groups exceed the region-wide average hourly wage by more than 60 percent and the overall state average by more than 40 percent. The region-wide overall average hourly wage per hour is $18.49, while the state average is $21.32.
Figure 4 Thomas Jefferson Partnership for Economic Development Region Growth & Specialization Major Occupational Groups
Size of bubble represents 2011 employment Source: Economic Modeling Specialist, Younger Associates
Management
Business & financial operations
Computer & mathematical science
Architecture & engineering
Life, physical, & social science
Community & social services
Legal
Education, training, & library
Arts, design, entertainment, sports, & media Healthcare practitioners &
technical
Healthcare support
Protective service
Food preparation & serving related
Building & grounds cleaning & maintenance
Personal care & service
Sales & related
Office & administrative support
Farming, fishing, & forestry
Construction & extraction
Installation, maintenance, & repair
Production
Transportation & material moving
Military Occupations
0.40
0.60
0.80
1.00
1.20
1.40
1.60
1.80
(3,500) (2,500) (1,500) (500) 500 1,500 2,500
Spec
ializ
atio
n (L
Q)
Employment Change (2006-2011)
At-Risk Competitive
Declining Rising

14
Table 3 Thomas Jefferson Partnership for Economic Development Region Growth & Specialization Major Occupational Groups Ranked by Specialization
2011 Jobs
Specialization LQ
Five Year Change
Average Hourly Wage
Life, physical, & social science 3,244 1.65 326 $25.96 Farming & forestry 1,776 1.43 203 $12.64 Education, training, & library 14,524 1.34 1,149 $31.99 Construction & extraction 11,585 1.34 (2,613) $17.14 Arts, design, entertainment, sports, & media 7,321 1.31 659 $15.08 Healthcare practitioners & technical 10,041 1.15 815 $30.48 Management 16,029 1.08 863 $22.56 Building & grounds cleaning & maintenance 8,044 1.07 575 $10.43 Architecture & engineering 2,924 1.02 (122) $31.59 Food preparation & serving related 12,882 1.02 924 $10.49 Business & financial operations 10,263 1.00 1,594 $22.92 Personal care & service 7,357 1.00 938 $11.13 Community & social services 2,782 0.99 497 $17.25 Computer & mathematical science 4,109 0.97 323 $30.58 Sales & related 23,283 0.97 632 $13.36 Installation, maintenance, & repair 6,208 0.94 10 $19.49 Protective service 3,081 0.87 191 $17.25 Office & administrative support 22,743 0.87 196 $14.70 Legal 1,313 0.84 128 $30.61 Healthcare support 3,830 0.79 378 $12.14 Transportation & material moving 8,723 0.79 (254) $14.59 Production 6,621 0.63 (1,231) $14.95 Military Occupations 1,356 0.61 71 $22.92 Benchmarks TJPED Region 190,039 6,254 $18.49 Virginia 4,7 mil 23,688 $21.32 Nation 173 mil (895,331) $19.94
Source: Economic Modeling Specialist, Younger Associates

15
New or Emerging Industries New or emerging industries are industry sectors that are new to the region within the last five years, or sectors that have recently experienced rapid employment growth. In some cases the industry may be represented by a single new or expanding firm. New or emerging industries may provide an early indication of changing conditions or reveal new opportunities.
Over the last five years, sixteen industries were new to the region, or had fewer than ten employees in 2006, and grew to employ 25 or more by 2011 (Figure 7 and Table 4). The largest absolute increases came in Motor Vehicle Electrical & Electronic Equipment Mfg. and Nonscheduled Air Transportation, both employing 89 in 2011. The new industries include five manufacturers, and three industries directly related to the Business & Financial Services industry group: Pension Funds, Business & Secretarial Schools, and Open-End Investment Funds.
As a group, new industries to the region are mostly very well paying, with an average annual wage of $63,506. Only three of the industries have average wages below the region average. The two top paying new industries are Open-End Investment Funds ($150,350) and Printed Circuit Assembly (Electronic Assembly) Mfg. ($99,189). Figure 7 Thomas Jefferson Partnership for Economic Development Region New Industries (or less than 10 jobs in 2006) 2006-2011 Employment Change
Source: Economic Modeling Specialist, Younger Associates
89
89
75
67
53
45
42
40
39
37
35
34
30
27
25
25
0 10 20 30 40 50 60 70 80 90
Motor Vehicle Electrical & Electronic Equipment Mfg.
Nonscheduled Air Transportation
Pension Funds
Paperboard Mills
Computer Peripheral Equipment Mfg.
Aircraft Mfg.
Printed Circuit Assembly (Electronic Assembly) Mfg.
Dental Laboratories
Dimension Stone Mining & Quarrying
Business & Secretarial Schools
Construction Material Merchant Wholesalers
Open-End Investment Funds
Meat Processed from Carcasses
In-Vitro Diagnostic Substance Mfg.
Industrial Supplies Merchant Wholesalers
Women's, Children's, & Infants' Clothing & Accessories…

16
Table 4 Thomas Jefferson Partnership for Economic Development Region New Industries (or fewer than 10 jobs in 2006) 2006-2011 Employment Change Ranked by Change
2006-2011 Change
Average Earnings
Motor Vehicle Electrical & Electronic Equipment Mfg. 89 $46,836 Nonscheduled Air Transportation 89 $60,655 Pension Funds 75 $30,330 Paperboard Mills 67 $63,536 Computer Peripheral Equipment Mfg. 53 $59,998 Aircraft Mfg. 45 $69,652 Printed Circuit Assembly (Electronic Assembly) Mfg. 42 $99,189 Dental Laboratories 40 $77,162 Dimension Stone Mining & Quarrying 39 $62,651 Business & Secretarial Schools 37 $48,251 Construction Material Merchant Wholesalers 35 $61,263 Open-End Investment Funds 34 $150,350 Meat Processed from Carcasses 30 $30,657 In-Vitro Diagnostic Substance Mfg. 27 $75,752 Industrial Supplies Merchant Wholesalers 25 $49,626 Women's, Children's, & Infants' Clothing & Accessories Merchant Wholesalers
25 $30,181
Source: Economic Modeling Specialist, Younger Associates
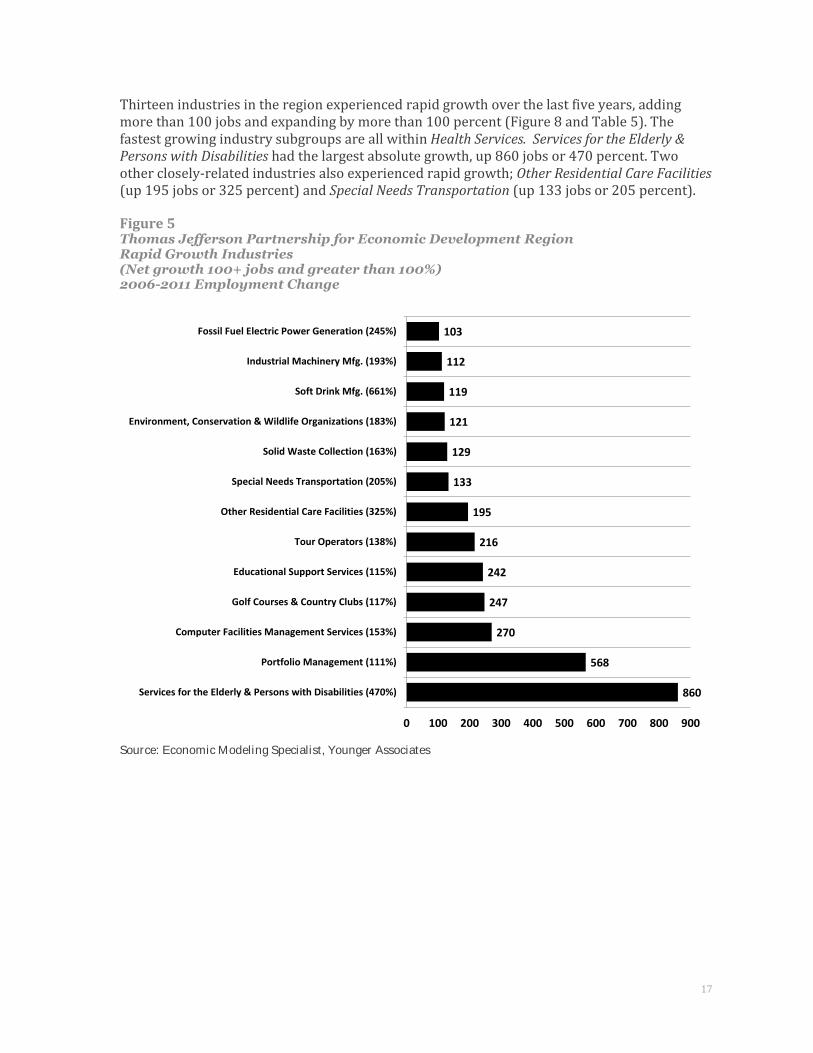
17
Thirteen industries in the region experienced rapid growth over the last five years, adding more than 100 jobs and expanding by more than 100 percent (Figure 8 and Table 5). The fastest growing industry subgroups are all within Health Services. Services for the Elderly & Persons with Disabilities had the largest absolute growth, up 860 jobs or 470 percent. Two other closely-related industries also experienced rapid growth; Other Residential Care Facilities (up 195 jobs or 325 percent) and Special Needs Transportation (up 133 jobs or 205 percent).
Figure 5 Thomas Jefferson Partnership for Economic Development Region Rapid Growth Industries (Net growth 100+ jobs and greater than 100%) 2006-2011 Employment Change
Source: Economic Modeling Specialist, Younger Associates
860
568
270
247
242
216
195
133
129
121
119
112
103
0 100 200 300 400 500 600 700 800 900
Services for the Elderly & Persons with Disabilities (470%)
Portfolio Management (111%)
Computer Facilities Management Services (153%)
Golf Courses & Country Clubs (117%)
Educational Support Services (115%)
Tour Operators (138%)
Other Residential Care Facilities (325%)
Special Needs Transportation (205%)
Solid Waste Collection (163%)
Environment, Conservation & Wildlife Organizations (183%)
Soft Drink Mfg. (661%)
Industrial Machinery Mfg. (193%)
Fossil Fuel Electric Power Generation (245%)

18
Table 5 Thomas Jefferson Partnership for Economic Development Region Rapid Growth Industries (Net growth 100+ jobs and greater than 100%) 2006-2011 Employment Change Ranked by Change
2006-2011
Change
2011 Jobs
Average Earnings
Services for the Elderly & Persons with Disabilities (470%) 860 1,043 $17,859 Portfolio Management (111%) 568 1,080 $61,980 Computer Facilities Management Services (153%) 270 447 $64,386 Golf Courses & Country Clubs (117%) 247 459 $24,951 Educational Support Services (115%) 242 452 $34,038 Tour Operators (138%) 216 373 $42,432 Other Residential Care Facilities (325%) 195 255 $37,280 Special Needs Transportation (205%) 133 198 $46,389 Solid Waste Collection (163%) 129 208 $34,447 Environment, Conservation & Wildlife Organizations (183%) 121 187 $39,350 Soft Drink Mfg. (661%) 119 137 $38,133 Industrial Machinery Mfg. (193%) 112 170 $47,968 Fossil Fuel Electric Power Generation (245%) 103 145 $107,216
Source: Economic Modeling Specialist, Younger Associates
As a group, wages in the rapidly growing industries are mixed, with eight of the thirteen below the region average. The highest average wages are in Fossil Fuel Electric Power Generation ($107,216), Computer Facilities Management Services ($64,386), and Portfolio Management ($61,980).

19
Technology Assets Technology Assets are organizations, companies, and facilities in a region that create knowledge or employ knowledge workers in significant numbers, so that they are sources of employment growth in a region. For this study lists of potential technology assets were identified by reviewing patents issued within the region, Small Business Innovation Research (SBIR) grants, Small Business Technology Transfer (STTR) programs, and large federal defense contract awards. Then, each asset was reviewed to classify it by location, industry sector and, number of employees. The complete list of assets identified for the region is in Appendix E.
The TJPED region has a significant number of technology assets when compared to other areas of the country of a similar population size. It is also notable that most of the TJPED region is rural, yet technology assets for are much more prevalent in the TJPED region than in other rural areas. Two factors influence this concentration of assets: the University of Virginia, and the region’s location in close proximity to Washington, DC.
Virginia is among the top states for SBIR and STTR grants. While grant awards are not published for regional comparisons, it appears that companies the TJPED region get a proportionate share of the high number and value awarded in the state.
The University is clearly a regional asset. While most of the start-up companies that have emerged from the research performed at the University are located near campus in the City of Charlottesville or Albemarle County, the employment impact from the University is much broader. Also, education levels in the region are higher than the U.S. average because of the University, with a larger concentration of workers with graduate and post graduate degrees. Many companies in the region maintain research ties with various centers of the University.
The location of the region close to, but somewhat removed from Washington, DC has meant that an increasing number of federal facilities have located in the region since 2011. These agencies include the National Ground Intelligence Center, Defense Intelligence Agency, and the Library of Congress National Audio-Visual Center. Contractors who work with these agencies then co-locate in the region. This has prompted the growth in the information technology and defense-related sectors.
The presence of technology assets informed the selection of target industry sectors for the region. When the list of technology assets was compiled and reviewed it fully supported the selection of Biosciences, Biomedical Devices target for Albemarle County and the City of Charlottesville as well as the selection of the Information Technology & Telecommunications target industry groups for the entire region. The number of existing patents and the annual average rate of patents issued in the region related to these sectors can be a factor in attracting companies and start-ups to the region.
Information Technology was further supported as a target by the type of federal contractors and federal agencies that have chosen to locate in the TJPED region. Much of the Defense and Security operations in the region overlap with the Information Technology sector.

20
Optimal Target Markets Optimal targets should both provide solid business rationale for firms looking to relocate or expand in the region, and provide residents with a strong reason to support their presence in the region.
Screening criteria for optimal targets include:
High relative wages Support or strengthen existing industry groups/clusters Make use of the location’s unique attributes Leverage local/national/global trends High relative jobs multiplier Utilize incumbent occupational skill-sets Match area’s educational infrastructure and postsecondary completions Match the area’s capacity and desire for growth and development Potential to employ underemployed and unemployed
Within each major target area matching the screening criteria, selected optimal target industries had to meet two additional conditions: positive projected employment growth over the next five years and industry-specific earnings greater than the overall local or state average.
Environmental suitability for the region was also a consideration in selecting target industry groups. None of the optimal targets would have a detrimental impact on the environment under typical circumstances for the industry group. Protection of natural resources, sustainability, and compatibility with the quality of life in the region were considerations.
Target Industry Group: Business & Financial Services
The TJPED region has demonstrated a clear competitive advantage in the Business & Financial Services industry group. The region presently supports 1,485 firms and 20,988 workers in this business activity. The group is the largest in the region and has experienced the highest absolute growth over the last five year, adding 3,535 jobs, up 20 percent.
The Business & Financial Services has by far the highest jobs multiplier of any industry group in the region (10.37). This projects the superior potential impact that adding jobs to the group will have on the entire region.
Business & Financial Services also exhibited the strongest growth attributed to a local competitive effect, indicating a positive unique local competitive advantage for those firms in the region. Targeting sectors within the Business & Financial Services industry group offers several strong business rationales for expansion and attraction:
High relative wages; the target sectors have average earnings of $81,867 Strong projected growth rate; the target sectors have average forecasted five-year
employment growth of 16 percent Close proximity to Washington DC metro growth and demand for target services Most localities provide prospects with lower relative wage labor force Potential retention of out-commuting workers

21
Appeal of nonurban rural small town settings to some firms Appeal of proximity to a major university Match to the region’s portfolio of available sites and buildings; wide range of firm sizes
with a mostly smaller operations footprint Existing cluster of similar firms operating in the area, indicating the presence of
supporting skilled workers, institutions, and infrastructure Presence of a redundant fiber optics network in the region College and university graduates in fields that support the industry as shown in
Table 6
Table 6 Relevant Degrees Awarded, Annual Number of Graduates
Source: IPEDS
University of
Virginia Main
Campus
Germanna Community
College
Piedmont Virginia
Community College
Accounting 107 Accounting and Related Services, Other 4 Business Administration and Management, General
390 50
Business Administration, Management and Operations, Other
21 7
Business/Commerce, General 363 Management Information Systems, General 78 Computer and Information Sciences, General 58 14 6 Mathematics, General 68 Economics, General 263

22
Table 7 Thomas Jefferson Partnership for Economic Development Region Business & Financial Services Select Optimal Targets
NAICS Code
Industry Title Forecasted Five-Year
Growth
National Average Earnings
Business & Financial Services Information 518210 Data Processing, Hosting, and Related Services* 13% $80,651 Finance and Insurance 523920 Portfolio Management 30% $80,277 524114 Direct Health and Medical Insurance Carriers 7% $86,200 525910 Open-End Investment Funds 19% $104,710 Professional, Scientific, and Technical Services 541199 Specialized Legal Services 19% $63,766 541310 Architectural Services 6% $75,271 541330 Engineering Services 9% $93,317 541380 Testing Laboratories 2% $75,650 541511 Custom Computer Programming Services 14% $97,515 541512 Computer Systems Design Services 17% $95,909 541611 Administrative Management and General Management
Consulting Services 23% $82,466
541618 Management Consulting Services 11% $80,245 541620 Environmental Consulting Services 18% $63,054 541690 Specialized Scientific and Technical Consulting Services 32% $67,101
*Also in Information Technology & Telecommunications select optimal targets Source: Economic Modeling Specialist, Younger Associates
Target Outlook
Changes in technology, demographics, energy markets, and the regulatory landscape are some of the major forces driving growth and opening new opportunities in the select Business & Financial Services targets. Summary details for select optimal targets can be found in Table 10 at the end of this chapter.

23
Target Industry Group: Information Technology & Telecommunications
The Thomas Jefferson Partnership for Economic Development Region has demonstrated competitive advantages in the Information Technology & Telecommunications industry. The region presently supports 501 firms and 7,272 workers in this business activity. The group is the fifth largest in the region and has added 334 jobs over the last five years, up 5 percent.
At $74,135, the Information Technology & Telecommunications has the fifth highest average earning of any industry group in the region, 66 percent above the regional average and 31 percent above the state. Information Technology & Telecommunications also exhibited the strong growth attributed to a local competitive effect, second only to Business & Financial Services; indicating a positive unique local competitive advantage for those firms in the region.
Targeting within sectors in the Information Technology & Telecommunications industry group offers several strong business rationales for expansion and attraction:
High relative wages; the target sectors have national average earnings of $96,074 Strong projected growth rate; the target sectors have average forecasted five-year
employment growth of 8 percent. Select targets are dominated by manufacturing, offering employment opportunities for
lower skilled workers. Provides prospects with lower relative wage labor force. Potential retention of out-commuting workers. Appeal of proximity to a major university. Existing cluster of similar firms operating in the area, indicating the presence of
supporting skilled workers, institutions, and infrastructure. Presence of a redundant fiber optics network in the region Local training support from the Daniel Technology Center at Germanna Community
College and Piedmont Virginia Community College Desire by existing workforce for training in computer technologies Regional patent activity related to this industry group is high Existing patents licensed in the region are an asset for the growth and development of
this sector Synergistic overlap with other exiting business clusters Complements defense intelligence industry subgroup, which also has a strong presence
in the region Recent growth in computer facilities management services in the region College and university graduates in fields that support the industry are listed in Table
8. Overlaps with Printing & Publishing group, which has a strong specialized presence in
the region. With an LQ of 1.18, Printing & Publishing is one of the most specialized groups in the regional economy. Integration with information technology can help transform this traditional industry group into a modern growth industry.

24
Table 8 Relevant Degrees Awarded, Annual Graduates
University of Virginia
Piedmont Virginia Community College
Germanna Community College
Computer Engineering 38 Systems Engineering 163 Electrical and Electronics Engineering
70
Engineering (physics, materials, general, other)
51 21
Computer Information Sciences 58 6 14 Source: IPEDS
While there are a broad range of industry sectors within Information Technology & Telecommunications that are compatible targets for the TJPED region, select optimal targets have been identified that meet the criteria of this analysis. Those sectors are listed in Table 9 below and described in Table 11 at the end of this chapter.
Table 9 Thomas Jefferson Partnership for Economic Development Region Information Technology & Telecommunications Select Optimal Targets NAICS Code
Industry Title Forecasted Five-Year
Growth
National Average Earnings
Information Technology & Telecommunications Computer and Electronic Product Manufacturing 334290 Specialized Communications Equipment Manufacturing 15% $95,290 334417 Electronic Connector Manufacturing 5% $69,235 334513 Instruments and Related Products Manufacturing for
Measuring, Displaying, and Controlling Industrial Process Variables
1% $87,643
334516 Analytical Laboratory Instrument Manufacturing 5% $111,647 Electrical Equipment, Appliance, and Component Manufacturing 335314 Relay and Industrial Control Manufacturing 1% $98,070 Information 518210 Data Processing, Hosting, and Related Services* 13% $80,651 519130 Internet Publishing and Broadcasting and Web Search Portals 16% $129,984 *Also in Business & Financial Services select optimal targets Source: Economic Modeling Specialist, Younger Associates

25
Target Outlook
Changes in technology, energy markets, and the regulatory landscape are some of the major forces driving growth and opening new opportunities in the select Information Technology & Telecommunications targets. Summary outlook details for target industry sectors can be found in Table 11 at the end of this chapter.
Table 10 Thomas Jefferson Partnership for Economic Development Region Select Optimal Target Descriptions Business & Financial Services
NAICS Code
Industry Title Description
518210 Data Processing, Hosting, and Related Services
This industry comprises establishments primarily engaged in providing infrastructure for hosting or data processing services. These establishments may provide specialized hosting activities, such as web hosting, streaming services or application hosting; provide application service provisioning; or may provide general time-share mainframe facilities to clients. Data processing establishments provide complete processing and specialized reports from data supplied by clients or provide automated data processing and data entry services.
523920 Portfolio Management
This industry comprises establishments primarily engaged in managing the portfolio assets (i.e., funds) of others on a fee or commission basis. Establishments in this industry have the authority to make investment decisions, and they derive fees based on the size and/or overall performance of the portfolio.
524114 Direct Health and Medical Insurance Carriers
This U.S. industry comprises establishments primarily engaged in initially underwriting (i.e., assuming the risk and assigning premiums) health and medical insurance policies. Group hospitalization plans and HMO establishments (except those providing health care services) that provide health and medical insurance policies without providing health care services are included in this industry.
525910 Open-End Investment Funds
This industry comprises legal entities (i.e., open-end investment funds) organized to pool assets that consist of securities or other financial instruments. Shares in these pools are offered to the public in an initial offering with additional shares offered continuously and perpetually and redeemed at a specific price determined by the net asset value.
541199 Specialized Legal Services
These establishments are primarily engaged in providing specialized legal or paralegal services.
541310 Architectural Services
This industry comprises establishments primarily engaged in planning and designing residential, institutional, leisure, commercial, and industrial buildings and structures by applying knowledge of design, construction procedures, zoning regulations, building codes, and building materials.
541330 Engineering Services
This industry comprises establishments primarily engaged in applying physical laws and principles of engineering in the design, development, and utilization of machines, materials, instruments, structures, processes, and systems. The assignments undertaken by these establishments may involve any of the following activities: provision of advice, preparation of feasibility studies, preparation of preliminary and final plans and designs, provision of technical services during the construction or installation phase, inspection and evaluation of engineering projects, and related services.

26
Source: U.S. Census Bureau, Younger Associates
541380 Testing Laboratories
This industry comprises establishments primarily engaged in performing physical, chemical, and other analytical testing services, such as acoustics or vibration testing, assaying, biological testing (except medical and veterinary), calibration testing, electrical and electronic testing, geotechnical testing, mechanical testing, nondestructive testing, or thermal testing. The testing may occur in a laboratory or on-site.
541511 Custom Computer Programming Services
This U.S. industry comprises establishments primarily engaged in writing, modifying, testing, and supporting software to meet the needs of a particular customer.
541512 Computer Systems Design Services
This U.S. industry comprises establishments primarily engaged in planning and designing computer systems that integrate computer hardware, software, and communication technologies. The hardware and software components of the system may be provided by this establishment or company as part of integrated services or may be provided by third parties or vendors. These establishments often install the system and train and support users of the system.
541611 Administrative Management and General Management Consulting Services
This U.S. industry comprises establishments primarily engaged in providing operating advice and assistance to businesses and other organizations on administrative management issues, such as financial planning and budgeting, equity and asset management, records management, office planning, strategic and organizational planning, site selection, new business startup, and business process improvement. This industry also includes establishments of general management consultants that provide a full range of administrative; human resource; marketing; process, physical distribution, and logistics; or other management consulting services to clients.
541618 Management Consulting Services
This U.S. industry comprises establishments primarily engaged in providing general management consulting services. Establishments providing telecommunications or utilities management consulting services are included in this industry.
541620 Environmental Consulting Services
This industry comprises establishments primarily engaged in providing advice and assistance to businesses and other organizations on environmental issues, such as the control of environmental contamination from pollutants, toxic substances, and hazardous materials. These establishments identify problems (e.g., inspect buildings for hazardous materials), measure and evaluate risks, and recommend solutions. They employ a multi-disciplined staff of scientists, engineers, and other technicians with expertise in areas, such as air and water quality, asbestos contamination, remediation, and environmental law.
541690 Specialized Scientific and Technical Consulting Services
This industry comprises establishments primarily engaged in providing specialized advice and assistance to businesses and other organizations on scientific and technical issues.

27
Table 11 Thomas Jefferson Partnership for Economic Development Region Select Optimal Target Descriptions Information Technology and Telecommunications NAICS Code
Industry Title Description
518210 Data Processing, Hosting, and Related Services
This industry comprises establishments primarily engaged in providing infrastructure for hosting or data processing services. These establishments may provide specialized hosting activities, such as web hosting, streaming services or application hosting; provide application service provisioning; or may provide general time-share mainframe facilities to clients. Data processing establishments provide complete processing and specialized reports from data supplied by clients or provide automated data processing and data entry services.
541511 Custom Computer Programming Services
This U.S. industry comprises establishments primarily engaged in writing, modifying, testing, and supporting software to meet the needs of a particular customer.
541512 Computer Systems Design Services
This U.S. industry comprises establishments primarily engaged in planning and designing computer systems that integrate computer hardware, software, and communication technologies. The hardware and software components of the system may be provided by this establishment or company as part of integrated services or may be provided by third parties or vendors. These establishments often install the system and train and support users of the system.
541690 Specialized Scientific and Technical Consulting Services
This industry comprises establishments primarily engaged in providing specialized advice and assistance to businesses and other organizations on scientific and technical issues.
334290 Specialized Communications Equipment Manufacturing
This industry comprises establishments primarily engaged in manufacturing communications equipment (except telephone apparatus, and radio and television broadcast, and wireless communications equipment).
334417 Electronic Connector Manufacturing
This U.S. industry comprises establishments primarily engaged in manufacturing electronic connectors, such as coaxial, cylindrical, rack and panel, pin and sleeve, printed circuit and fiber optic.
334513 Instruments and Related Products Manufacturing for Measuring, Displaying, and Controlling Industrial Process Variables
This U.S. industry comprises establishments primarily engaged in manufacturing instruments and related devices for measuring, displaying, indicating, recording, transmitting, and controlling industrial process variables. These instruments measure, display or control (monitor, analyze, and so forth) industrial process variables, such as temperature, humidity, pressure, vacuum, combustion, flow, level, viscosity, density, acidity, concentration, and rotation.
334516 Analytical Laboratory Instrument Manufacturing
This U.S. industry comprises establishments primarily engaged in manufacturing instruments and instrumentation systems for laboratory analysis of the chemical or physical composition or concentration of samples of solid, fluid, gaseous, or composite material.

28
NAICS Code
Industry Title Description
335314 Relay and Industrial Control Manufacturing
This U.S. industry comprises establishments primarily engaged in manufacturing relays, motor starters and controllers, and other industrial controls and control accessories.
519130 Internet Publishing and Broadcasting and Web Search Portals
This industry comprises establishments primarily engaged in 1) publishing and/or broadcasting content on the Internet exclusively or 2) operating Web sites that use a search engine to generate and maintain extensive databases of Internet addresses and content in an easily searchable format (and known as Web search portals). The publishing and broadcasting establishments in this industry do not provide traditional (non-Internet) versions of the content that they publish or broadcast. They provide textual, audio, and/or video content of general or specific interest on the Internet exclusively.
Source: U.S. Census Bureau, Younger Associates
Table 12 Business & Financial Services Target Driving Forces and Outlook
NAICS Code
Industry Title Description
518210 Data Processing, Hosting, and Related Services
Customer relations and similar functions are expected to remain local, or even return to the United States, because they are key factors in keeping clients satisfied with the product; language barriers can sometimes diminish the effectiveness of customer service and support. Users will become more widespread geographically, the need for centralizing data and delivering it to users in many locations will also increase, boosting demand for software as a service (SaaS).
523920 Portfolio Management
This industry comprises establishments primarily engaged in managing the portfolio assets (i.e., funds) of others on a fee or commission basis. Establishments in this industry have the authority to make investment decisions, and they derive fees based on the size and/or overall performance of the portfolio.
525910 Open-End Investment Funds
The aging of the population in the United States and other developed economies is assisting the growth of mutual funds, pension funds and other collective investment schemes. As an increasing share of the population approaches retirement age, the value of assets in pension plans and other forms of retirement savings is expected to increase. The range of financial products available to retail and institutional investors will substantially increase. Investors' demand for above-market returns will drive this growth. Products that better manage risk and volatility in returns will likely grow in popularity as a lingering effect from the subprime crisis. As a result, consumers will increase their demand for portfolio managers that can achieve returns and diversification within this growing product mix. The continued outsourcing of reporting, data collection and trading platforms will lower industry costs over the next five years, allowing new firms to enter the market. By leveraging new technologies, market entrants can better adapt to changing consumer tastes and offer more personalized services to consumers. Small customer-centric firms will pick up market share from large firms and new customers. Significant opportunities will exist for firms that can create products for specific age and gender demographics. Women will represent a high growth segment as a result of entering the workforce and making household financial decisions. Retirees will also seek specialized services targeted at wealth preservation and managed spending, and they will form a high growth segment for established industry players who have relationships with them.
524114 Direct Health and Medical
The US population is aging, which is an important indicator of demand for health insurance coverage. Older individuals are more likely to use medical coverage than their younger healthier counterparts. Consequently, the aging population is expected to support

29
NAICS Code
Industry Title Description
Insurance Carriers
industry growth, as individuals look to lower their exposure to health-related costs. The industry is expected to expand due to the Obama administration's healthcare plan, which is estimated to provide coverage for about 32 million individuals. States will be offering up bids or expansions for this health insurance program. This is positive news for health and medical insurers, as they will be able to take part in an additional $38.0 billion in Medicaid revenue.
541199 Specialized Legal Services
New regulations in the finance industry will create opportunities for law firms that specialize. Given the fines and reputations at stake, companies will not hesitate to spend large sums of money on appropriate cases. Economic growth will stimulate more activity in M&A and IPO markets, relieving the industry's dependence on countercyclical work. Legislative work will provide revenue for a small number of firms in the short term as new regulations are put into place. Some firms will pick up litigation work as victims of the economic crisis try to assign blame.
541310 Architectural Services
More sole proprietors will enter the industry; a general move toward offering more value-added services for clients is expected. Property developers are opting for consulting firms that have the capacity to offer a broad range of services, including pre-design, planning, interior design and engineering services. Clients will continue to seek out green building technology in order to build goodwill with the public and save money on energy costs. Consequently, an increasing number of firms will offer LEED-certified green building designs. More firms are expected to form strategic alliances to increase their involvement across the entirety of the building cycle. Architectural firms will increasingly offer clients a full range of services in order to compete with multi-disciplinary building design and construction firms.
541330 Engineering Services
The solid pace of industry expansion will be supported by the return of investment into electric-power infrastructure and communications markets, which experienced many delays over the past five years. Private fixed-capital expenditure is expected to increase, driving up demand for engineering design and process-management services on the planning and installation of industrial equipment. Such expenditure is also expected to raise demand for asset management services for the maintenance and operation of existing plants.
541380 Testing Laboratories
Growth in high-tech industries is expected to attract large R&D investment aimed at developing new products and improving existing products. Product development generally requires rigorous testing; therefore, growth in R&D activity positively affects demand for laboratory testing services. As product life cycles continue to shorten companies will seek to introduce new products to the marketplace as quickly as possible, increasing the need for testing services. For example, the development of advanced batteries, inexpensive fuel cells and microgenerators of electricity will lead to the development of more mobile electronic appliances in the future. The manufacturers must then rely on testing laboratories to perform trials, ensuring that electronic products uphold fire hazard standards. Many food companies are moving toward genetically modified (GM) foods. GM crop and livestock species were created to ward off diseases, and this trend is most prevalent in fruits, vegetables and meat products. The introduction of new GM food will create greater concern among the public because of its consumption risks. As a result, there will be more rigorous lab testing for GM and other agricultural products.
541511 Custom Computer Programming Services
This U.S. industry comprises establishments primarily engaged in writing, modifying, testing, and supporting software to meet the needs of a particular customer.
541512 Computer Systems Design Services
Consolidations are most likely to continue in the healthcare IT sector because of the government's recent push for multibillion-dollar healthcare reform. One aspect of the legislation focuses on more efficient and environmentally friendly ways to maintain hospital records. The proposal for an all-digital health record database gives IT consultants opportunities to create new systems and networks. IT consultants will be

30
NAICS Code
Industry Title Description
needed to design the system architecture to store records kept in hospitals and the communication systems that allow all hospitals to obtain patients' record. Companies will continue to demand more efficient IT systems, as technological innovation improves service offerings. It is essential that systems are in place to effectively control costs within a company. Manufacturers will increasingly rely on IT consultants to design economical computer systems related to just-in-time supply management to reduce in-process inventory and any associated carrying costs. The increasing usage of smartphone devices in the workplace represents a potential area of growth for the IT consulting industry. Corporate employees are increasingly using their smartphones for company-related work, leaving companies susceptible to security breaches given the amount of sensitive data that is stored on smartphone devices. With smartphones in the workplace expected to become more common, maintaining and designing security systems for these mobile devices represents a growth segment for the industry.
541611 Administrative Management and General Management Consulting Services
This U.S. industry comprises establishments primarily engaged in providing operating advice and assistance to businesses and other organizations on administrative management issues, such as financial planning and budgeting, equity and asset management, records management, office planning, strategic and organizational planning, site selection, new business startup, and business process improvement. This industry also includes establishments of general management consultants that provide a full range of administrative; human resource; marketing; process, physical distribution, and logistics; or other management consulting services to clients.
541618 Management Consulting Services
Management consulting services will be crucial for companies transitioning and expanding in a changing economic environment. Corporations that weathered the recession, but delayed consulting expenditures, will put retained earnings to use by making strategic adjustments to business structure and strategy. This will manifest itself as an increase in the corporate strategy and organizational design arms of management consulting firms. Human resources consulting will be instrumental as firms incorporate new employees into existing healthcare and pension plans, and as they bring existing healthcare and pension plans into compliance with new legislation. Increasingly technological focus as information technology (IT) becomes more important to the effective operation of business. The likely offshoot of this is a growing overlap between management consulting firms and IT consulting firms.
541620 Environmental Consulting Services
The increased emphasis on environmental sustainability will lead to significant industry revenue growth. As the economy improves and construction picks up, consultants will be needed to conduct audits to ensure buildings and underlying land are environmentally safe. Companies in high-polluting industries such as energy and manufacturing will come under increased pressure to present themselves as environmentally friendly. The combination of stricter regulatory requirements and a growth in corporate pressure to appear green will continue to drive the industry. As construction activity picks up and new ground is broken, consultants will be needed to assess whether the new buildings meet specific environmental codes. Furthermore, developers are now increasingly interested in constructing sustainable buildings because their value is now perceived to be higher among potential buyers. As such, consultants will step in to provide advice and aid builders in achieving their sustainable goals. Profit will also rise as more corporations use the industry's services. As companies develop a keen interest in becoming sustainable and corporate profit stays high, consultants will be able to command a premium for their services. This trend will be underpinned by increasing consumer interest in products and companies that are perceived to be sustainable, prompting companies to invest more in creating "green" marketing messages.
541690 Specialized Scientific and Technical
The services of economic consultants will be in even greater demand as the economy improves – expanding firms will require the forecasting and modeling services these consultants provide to effectively time and plan business expansions.
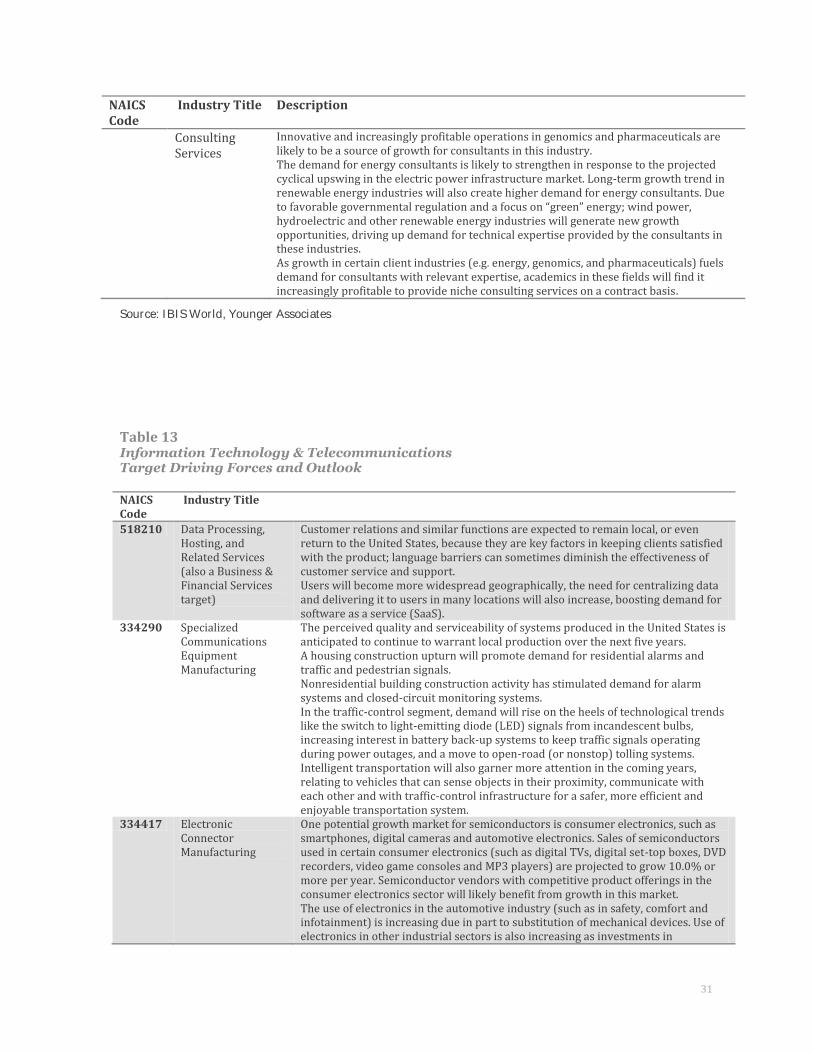
31
NAICS Code
Industry Title Description
Consulting Services
Innovative and increasingly profitable operations in genomics and pharmaceuticals are likely to be a source of growth for consultants in this industry. The demand for energy consultants is likely to strengthen in response to the projected cyclical upswing in the electric power infrastructure market. Long-term growth trend in renewable energy industries will also create higher demand for energy consultants. Due to favorable governmental regulation and a focus on “green” energy; wind power, hydroelectric and other renewable energy industries will generate new growth opportunities, driving up demand for technical expertise provided by the consultants in these industries. As growth in certain client industries (e.g. energy, genomics, and pharmaceuticals) fuels demand for consultants with relevant expertise, academics in these fields will find it increasingly profitable to provide niche consulting services on a contract basis.
Source: IBIS World, Younger Associates
Table 13 Information Technology & Telecommunications Target Driving Forces and Outlook
NAICS Code
Industry Title
518210 Data Processing, Hosting, and Related Services (also a Business & Financial Services target)
Customer relations and similar functions are expected to remain local, or even return to the United States, because they are key factors in keeping clients satisfied with the product; language barriers can sometimes diminish the effectiveness of customer service and support. Users will become more widespread geographically, the need for centralizing data and delivering it to users in many locations will also increase, boosting demand for software as a service (SaaS).
334290 Specialized Communications Equipment Manufacturing
The perceived quality and serviceability of systems produced in the United States is anticipated to continue to warrant local production over the next five years. A housing construction upturn will promote demand for residential alarms and traffic and pedestrian signals. Nonresidential building construction activity has stimulated demand for alarm systems and closed-circuit monitoring systems. In the traffic-control segment, demand will rise on the heels of technological trends like the switch to light-emitting diode (LED) signals from incandescent bulbs, increasing interest in battery back-up systems to keep traffic signals operating during power outages, and a move to open-road (or nonstop) tolling systems. Intelligent transportation will also garner more attention in the coming years, relating to vehicles that can sense objects in their proximity, communicate with each other and with traffic-control infrastructure for a safer, more efficient and enjoyable transportation system.
334417 Electronic Connector Manufacturing
One potential growth market for semiconductors is consumer electronics, such as smartphones, digital cameras and automotive electronics. Sales of semiconductors used in certain consumer electronics (such as digital TVs, digital set-top boxes, DVD recorders, video game consoles and MP3 players) are projected to grow 10.0% or more per year. Semiconductor vendors with competitive product offerings in the consumer electronics sector will likely benefit from growth in this market. The use of electronics in the automotive industry (such as in safety, comfort and infotainment) is increasing due in part to substitution of mechanical devices. Use of electronics in other industrial sectors is also increasing as investments in
32
automation grow. Another potential growth market is products that use light-emitting diodes (LEDs). Currently, the most significant market for LEDs is for illumination in mobile products, including liquid crystal displays, backlighting, keypad illumination and flash units for camera phones. The markets for LEDs are forecast to expand, permitting the technology's use as a replacement for traditional light bulbs and automotive headlamps. LEDs boast a much longer lifespan than conventional lighting technologies and greatly increased energy efficiency, which will be particularly attractive in an environment of rising energy costs.
334513 Instruments and Related Products Manufacturing for Measuring, Displaying, and Controlling Industrial Process Variables
This U.S. industry comprises establishments primarily engaged in manufacturing instruments and related devices for measuring, displaying, indicating, recording, transmitting, and controlling industrial process variables. These instruments measure, display or control (monitor, analyze, and so forth) industrial process variables, such as temperature, humidity, pressure, vacuum, combustion, flow, level, viscosity, density, acidity, concentration, and rotation.
334516 Analytical Laboratory Instrument Manufacturing
Operators will likely benefit from continued advances in navigational, measuring and control instrument technology, increased government and private equipment and machinery expenditures and higher industrial production. Downstream demand from the energy, health and biotechnology sectors and laboratory testing services demand will also positively affect firms, as these industries expand due to government initiatives and technology advancements. The healthcare reform legislation paves a clear path for generic biological drugs and provides tax breaks for smaller biotechnology operators, allowing these companies to purchase more products from this industry. As new products are developed within these sectors, industry products will be needed to test and measure equipment. US healthcare reform seeks to expand coverage to a broader range of patients. In part, the act accomplishes this expansion through a significant loosening of the eligibility criteria for enrollment in Medicaid. As a result, more people will have access to healthcare, boosting the number of physician visits and enhancing demand for medical services and some devices. Demand for medical devices and services is projected to continue growing in emerging markets due to their improving economies, rapidly increasing and aging populations and the prevalence of chronic disease.
335314 Relay and Industrial Control Manufacturing
Demand for efficient energy performance and increased electric current quality will drive the Electrical Equipment Manufacturing industry in the future. In June 2008, the Federal Energy Regulatory Commission (FERC) stated that there are "tremendous investment needs" for electricity generation, distribution and transmission between 2010 and 2030. In light of these needs, spending on power infrastructure is projected to grow at a strong pace due to aging infrastructure and other factors. Implementation of a new federal carbon policy would increase the cost and change the mix of new generation capacity, which would also help transmission investments. Energy-efficiency standards also will have a positive effect on demand for some types of electrical equipment. For example, the US Department of Energy initiated new regulations mandating air-conditioning and heat pump manufacturers can only produce components that meet a seasonal energy-efficiency ratio (SEER) rating of 13 or higher. The 2007 Energy Bill raised the industrial electric motor efficiency standards, which extends coverage to many motors not previously covered. Global warming concerns have stimulated investment in alternative power generation, including renewable energy. An expectation of high future energy costs and efforts to increase security of supply will positively influence spending. Demand for improved quality and reliability of electricity will be a key factor in determining future viability for the industry. Load growth in cities and suburbs, will drive system replacement and expansion.

33
519130 Internet Publishing
and Broadcasting and Web Search Portals
This industry should continue to grow rapidly as advertisers extend the trend of shifting resources toward the internet and as mobile internet service expands opportunities for consumption. New establishments opportunities are developing to take advantage of reallocations between advertiser-paid and subscription services.
Source: IBIS World, Younger Associates

34
| Workforce Analysis
Thomas Jefferson Partnership for Economic Development Labor Supply Survey and Workforce Analysis
Study Approach
A labor supply survey was conducted among a statistically valid sample of the Thomas Jefferson Partnership for Economic Development (TJPED) region’s population between the ages of 18-65. The study region consists of Albemarle County, the City of Charlottesville, Culpeper County, Fluvanna County, Greene County, Louisa County, Madison County, Nelson County and Orange County.
The survey was conducted in person through field interviews at locations throughout the region. With 1,184 responses, the number of surveys completed exceeded the target of 1,060 and provided enough primary data to achieve a confidence factor of 95 percent and a margin of error less than plus or minus three percent.
The large survey sample size allows for an accurate extrapolation of the actual number of people who are in the regional labor pool, the number of workers with particular skills, training needs and many other critical workforce factors. The survey was conducted by Younger Associates’ experienced team of field research specialists. The survey intercept locations included regional shopping centers, public libraries, commuter stations and public service offices.
This process enabled our team to reach the entire demographic spectrum of age, income, education and occupation. The resulting sample is demographically representative of the regional population. Actual survey statistics are provided in Tables 1 and 2.
Table 1
Labor Supply Survey Reliability
1,184 Completed Surveys
95% Confidence Level
±2.84% Margin of Error

35
Table 2
Labor Supply Survey Response Stratification by Locality
County Total population
Households % of HH to Total
95% Confidence Level +3%
Target Completed
Albemarle 98,970 38,157 30.3% 322 325 375
Charlottesville 43,475 17,778 14.1% 150 150 127
Culpepper 48,689 16,321 13.0% 138 140 152
Fluvanna 25,691 9,449 7.5% 80 80 98
Greene 18,403 6,780 5.4% 57 60 69
Louisa 33,153 12,944 10.3% 109 110 122
Madison 13,308 5,083 4.0% 43 45 51
Nelson 15,020 6,396 5.1% 54 55 65
Orange 33,481 12,895 10.3% 109 110 120
100.0% 1,060 1,075 1179
Other Regional - 5
Total 330,190 125,803 1,060 1,075 1,184
Source: Claritas, Younger Associates Labor Supply Survey
In addition to the survey data, a comprehensive statistical workforce overview has been compiled for the TJPED region. This overview is based upon the latest data from the Department of Labor, Department of Education, Department of Commerce, and pertinent state and regional reporting agencies. Combined information from the labor supply survey and the statistical overview is summarized in this chapter. Tabulated results from the survey are presented in total and by labor shed area in Appendix A of this report.

36
Workforce Analysis Findings
Thomas Jefferson Partnership for Economic Development Regional Population
The population of the Thomas Jefferson Partnership for Economic Development (TJPED) region grew at a rate more than double the U.S. growth rate between 2000 and 2010. The projected growth rate for the period 2010 to 2016, at 8.8 percent, is slightly lower than in past years, but still double the national population growth rate, as shown in Table 3.
Table 3
Population Growth 2000-2016
Year 2000 2010 2016
TJPED Region
272,311 328,190 357,168
% Growth 20.5% 8.8%
VA 7,078,515 8,001,024 8,420,247
% Growth 13.0% 5.2%
US 281,421,906 308,745,538 323,031,618
% Growth 9.7% 4.6%
Source: U.S. Census Bureau, Nielsen Claritas
Proximity to major metros, a highly desirable quality of life in a beautiful natural environment, rich cultural assets, and a major research university are among the top factors noted by people locating in the TJPED region. Culpeper County, in the northernmost part of the TJPED region, has experienced the highest growth rate, primarily from people moving out of the Washington, DC metro area. Many of the people relocating to Culpeper County have fresh skill sets and are prepared for the new economy emerging from the recession.
Nelson County, in the southernmost part of the region, experienced the lowest growth rate, which at 4% was less than half of the U.S. population growth rate between 2000 and 2010. This was due in part to the location further away from the DC metro area. It was also due in part to county policies and land planning, which protect the rural attributes. However, the rate of population growth in Nelson County is projected to double over the next five years, which would add approximately 1,200 residents.
The City of Charlottesville experienced population loss over the last decade, and that trend is predicted by demographers to continue. The small geographic confines of the city force some activities to move into the surrounding county or region in order to grow. As the urban core of the region, and a destination for national and international visitors, Charlottesville is a large factor in what attracts people to the region. However, many people prefer to reside in the more
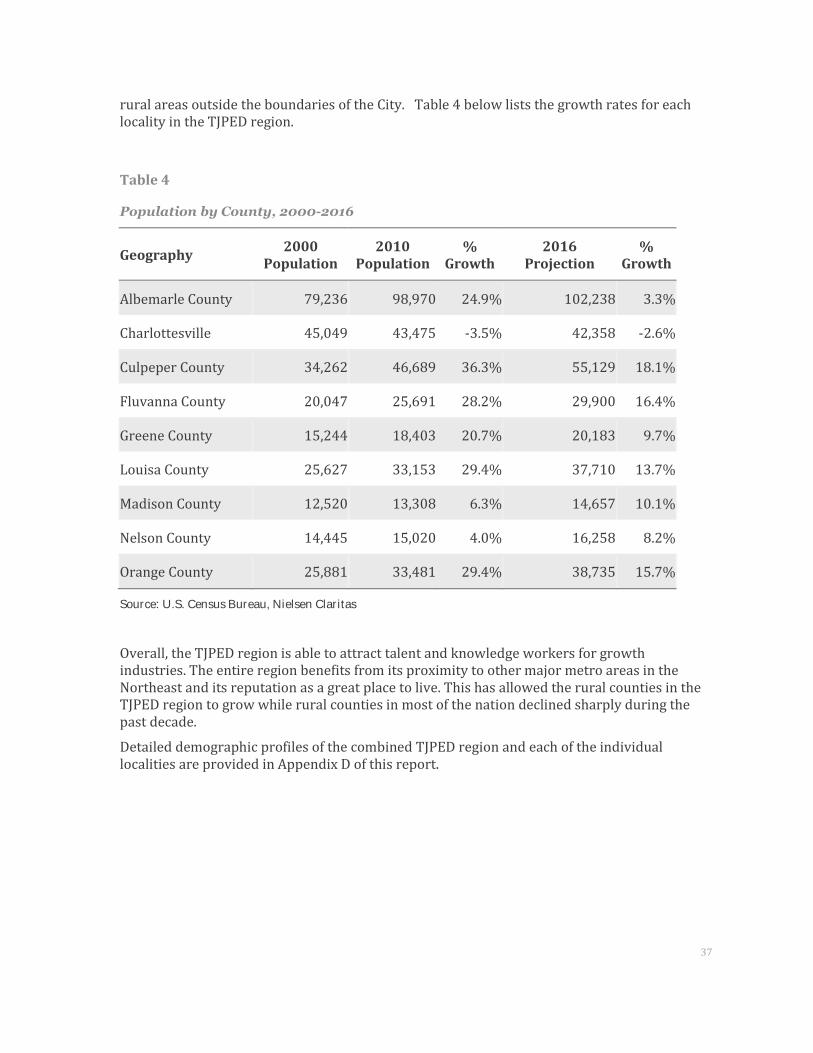
37
rural areas outside the boundaries of the City. Table 4 below lists the growth rates for each locality in the TJPED region.
Table 4
Population by County, 2000-2016
Geography 2000 Population
2010 Population
% Growth
2016 Projection
% Growth
Albemarle County 79,236 98,970 24.9% 102,238 3.3%
Charlottesville 45,049 43,475 -3.5% 42,358 -2.6%
Culpeper County 34,262 46,689 36.3% 55,129 18.1%
Fluvanna County 20,047 25,691 28.2% 29,900 16.4%
Greene County 15,244 18,403 20.7% 20,183 9.7%
Louisa County 25,627 33,153 29.4% 37,710 13.7%
Madison County 12,520 13,308 6.3% 14,657 10.1%
Nelson County 14,445 15,020 4.0% 16,258 8.2%
Orange County 25,881 33,481 29.4% 38,735 15.7%
Source: U.S. Census Bureau, Nielsen Claritas
Overall, the TJPED region is able to attract talent and knowledge workers for growth industries. The entire region benefits from its proximity to other major metro areas in the Northeast and its reputation as a great place to live. This has allowed the rural counties in the TJPED region to grow while rural counties in most of the nation declined sharply during the past decade.
Detailed demographic profiles of the combined TJPED region and each of the individual localities are provided in Appendix D of this report.

38
Age of the TJPED Population
The median and average ages of the population in the TJPED region are higher than the state and national benchmarks. This is indicative of a statistically significant number of people who choose to move to the area to retire.
However, a 2011 study prepared for the Older Dominion Partnership found that residents of the Jefferson Area Board for Aging region (which coincides with the general area of TJPED) are less likely to retire at age 65 than in other areas of the state. In the Jefferson Board Area, 71% of the population over age 65 is retired versus 82% statewide in Virginia.
The high proportion of retirees in the more rural counties of the TJPED region can limit the number of available workers in the near future. Retention and recruitment of young workers for the region is necessary to support the existing business sectors and emerging business sectors. Fortunately, quality of life is an asset that can support the effort to attract and retain young workers in the TJPED region. Table 5 provides age statistics by locality.
Table 5
Average, Median Age by County, 2011
Region Median Age Average Age
Albemarle County 37.53 39.10
Charlottesville 31.17 36.60
Culpeper County 36.92 37.00
Fluvanna County 39.79 39.50
Greene County 38.34 37.80
Louisa County 41.90 40.40
Madison County 43.68 41.70
Nelson County 47.21 44.00
Orange County 41.50 40.80
Aggregate 38.35 39.10
State of Virginia 37.44 37.90
United States 36.95 37.80
Source: Nielsen Claritas
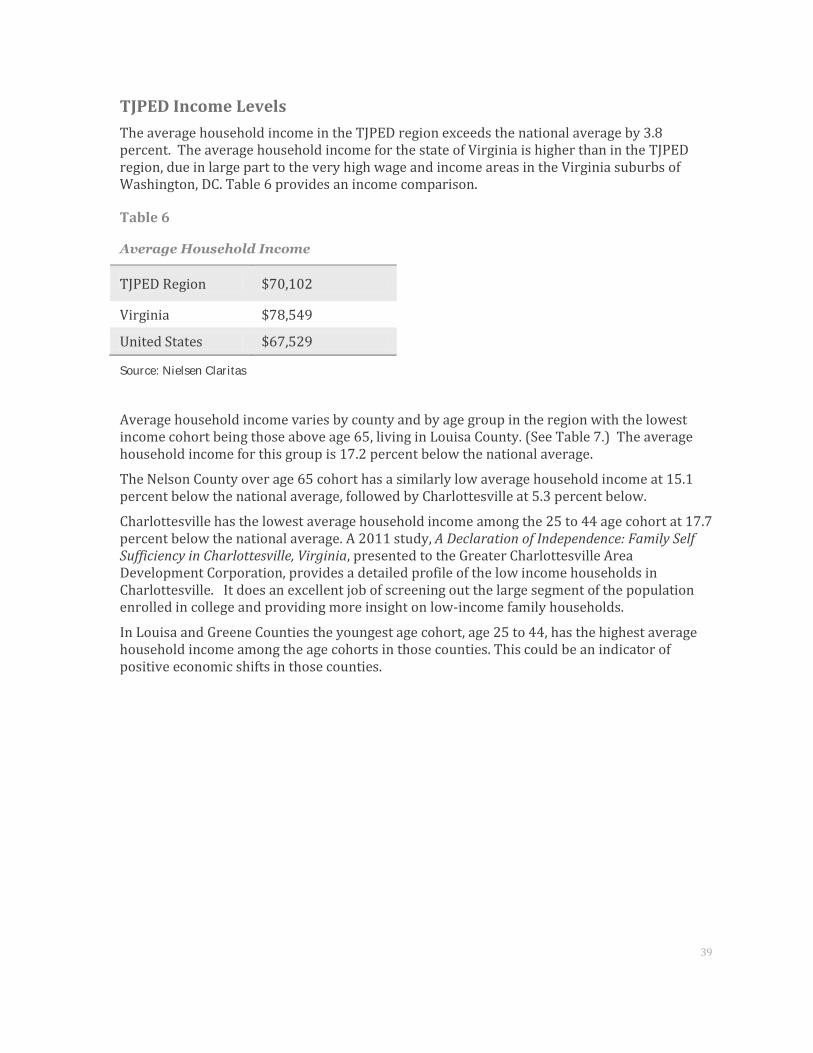
39
TJPED Income Levels
The average household income in the TJPED region exceeds the national average by 3.8 percent. The average household income for the state of Virginia is higher than in the TJPED region, due in large part to the very high wage and income areas in the Virginia suburbs of Washington, DC. Table 6 provides an income comparison.
Table 6
Average Household Income
TJPED Region $70,102
Virginia $78,549
United States $67,529
Source: Nielsen Claritas
Average household income varies by county and by age group in the region with the lowest income cohort being those above age 65, living in Louisa County. (See Table 7.) The average household income for this group is 17.2 percent below the national average.
The Nelson County over age 65 cohort has a similarly low average household income at 15.1 percent below the national average, followed by Charlottesville at 5.3 percent below.
Charlottesville has the lowest average household income among the 25 to 44 age cohort at 17.7 percent below the national average. A 2011 study, A Declaration of Independence: Family Self Sufficiency in Charlottesville, Virginia, presented to the Greater Charlottesville Area Development Corporation, provides a detailed profile of the low income households in Charlottesville. It does an excellent job of screening out the large segment of the population enrolled in college and providing more insight on low-income family households.
In Louisa and Greene Counties the youngest age cohort, age 25 to 44, has the highest average household income among the age cohorts in those counties. This could be an indicator of positive economic shifts in those counties.

40
Table 7
Median Household Income, by Age
25 to 44
years 45 to 64
years 65 years and
over
Albemarle County $ 63,689 $ 81,123 $ 53,589
Charlottesville $ 47,045 $ 50,902 $ 32,120
Culpeper County $ 70,331 $ 75,824 $ 36,549
Fluvanna County $ 68,508 $ 71,220 $ 41,215
Greene County $ 58,905 $ 56,846 $ 33,632
Louisa County $ 61,099 $ 56,962 $ 28,085
Madison County $ 56,569 $ 58,125 $ 33,448
Nelson County $ 49,886 $ 51,545 $ 28,801
Orange County $ 60,537 $ 66,069 $ 42,155
Virginia $ 60,152 $ 66,366 $ 32,240
United States $ 57,132 $ 63,398 $ 33,906
Source: U.S. Census Bureau, American Community Survey 2005-2009 Estimates. Shown in 2010 Inflation-Adjusted Dollars

41
TJPED Wage Rates
The highest-wage industry group in the overall TJPED region is the Financial Activities group with wages 46 percent higher than the combined wages of all industries in the region. (See Table 8) Professional and Business Services, Government and Information are the next highest paying industry groups in the region. This information from the Virginia Employment Commission supports the findings of the Labor Supply Survey and the Targeting Analysis portions of this study.
Table 8
Wage by Industry Type, 2010
Industry Category Number of
Establishments Annual Average
Wage All Industry 9,465 $ 65,784 Construction 1,190 $ 58,903 Education & Health Services 1,370 $ 70,618 Financial Activities 808 $ 96,047 Government 433 $ 85,912 Information 178 $ 84,866 Leisure & Hospitality 738 $ 24,411 Manufacturing 300 $ 77,893 Natural Resources & Mining 197 $ 40,286 Other Services 1,029 $ 50,454 Professional & Business Services 1,560 $ 88,447 Retail Trade 1,062 $ 36,739 Transportation, Warehousing & Utilities 154
$ 69,242
Wholesale Trade 343 $ 67,115 Source: Virginia Employment Commission

42
0.0%
2.0%
4.0%
6.0%
8.0%
10.0%
12.0%
2000 2005 2010 Nov. 2011
TJPED Region
Virginia
U.S.
Comparative Unemployment
Overall, the economy in the TJPED region outperformed the state and the nation in employment before and during the recession. So far, as the economy recovers, the employment rate for the region is improving faster than the state and nation. Figure 1 compares unemployment rates for the region over time and Figure 2 provides recent unemployment rates by locality.
When a small labor market experiences unemployment rates of 5% or lower, businesses seeking a location may overlook that region in favor of larger markets or markets with a higher unemployment rate. Prospect businesses may perceive that they will find more applicants in larger or higher unemployment markets. Data from this analysis prepares TJPED to overcome this perception.
Of course, large pockets of unemployment remain in the TJPED region. This study provides a tool for identifying skill sets and attributes of the not-employed and underemployed. This will enable TJPED to compete with regions with much higher unemployment, which may initially seem more attractive to employers seeking workers.
Figure 1
Unemployment Rates, 2000-2011
Source: LAUS Unit and Bureau of Labor Statistics, Virginia Employment Commission

43
Figure 2
Unemployment Rates by County, November 2011
Source: LAUS Unit and Bureau of Labor Statistics, Virginia Employment Commission
1.0%
2.0%
3.0%
4.0%
5.0%
6.0%
7.0%
8.0%
9.0%

44
Educational Attainment Levels
The proportion of the TJPED workforce that has a high school equivalent or lower education level is slightly smaller than in the U.S. workforce as a whole. The TJPED region also has a smaller proportion of the workforce with some education beyond high school, but below the baccalaureate degree level than the national workforce (See Figure 3).
For the past decade, many traditional employers have sought this level of worker (some education beyond high schools, usually with some technical training), because they meet the minimum requirements to be successful in the work environment. Today’s globally competitive manufacturing employers must be presented with evidence that enough workers are present in a region to fill large numbers of these jobs. These employers are termed “advanced manufacturers,” because they rely on automation and statistical processes to remain competitive in the global economy.
The local network of community colleges, Germanna and Peidmont, is prepared to train more workers at this level. This study provides documentation that some workers at this level are available, but not in large numbers.
The prime asset for the TJPED regional workforce is the high proportion of workers with degrees and advanced degrees. The proportion of these workers is 17 percent higher than in the national workforce as a whole. This allows the TJPED region to pursue targets in the Business and Financial Services group, the Information Technology group and Biosciences, all groups that most other parts of the country cannot successfully pursue because they do not have an available skilled workforce.
Figure 3
Educational Attainment, 2011
Source: Nielsen Claritas
0
5
10
15
20
25
30
35
40
Less than High School
High School Diploma Only
12-15 Years 16+ Years
TJP Region
Virginia
US

45
K-12 Public Education
Generally, good K-12 education is one of the factors contributing to the high quality of life rating for the region. Except for Charlottesville and Nelson County, high school graduation rates are higher than the state rate, which is significantly higher than the national rate.
Math proficiency is lower than it should be in a region preparing workers for financial and technical fields. Fluvanna, Madison, Nelson and Orange Counties, as well as Charlottesville, have high school math proficiency rates below the state average. A multi-year effort to raise levels of math and science proficiency, reported by local officials in interviews for this study, is being considered for Albemarle and Charlottesville schools. This effort should be vigorously pursued, with the type of long-term effort that is necessary to impact education levels.
Piedmont Virginia Community College reports that approximately 40 percent of local high school graduates require remedial reading and math when they enter the college. While this rate is not out of line with the national remedial needs of community college entrants, it is not sufficient for a region that wishes to target industry groups that are emerging in the new knowledge-based economy.
Appendix C of this study provides detailed data for each school system in the TJPED region. Key data is summarized in Table 9 below.
Table 9
Public School Data
District Name Enrollment Graduation
Rate % Adv Math
% Proficient
Math % Adv Science
% Proficient
Science Albemarle County 13,213 88% 58 31 43 49 Charlottesville 4,030 75% 26 30 38 45 Culpeper County 7,710 81% 62 29 34 58 Fluvanna County 3,773 83% 36 41 29 64 Greene County 2,887 84% 45 27 38 55 Louisa County 4,731 87% 10 39 40 58 Madison County 1,849 83% 35 47 17 53 Nelson County 1,966 72% 35 43 35 72 Orange County 5,237 80% 45 57 Virginia 1,267,063 80% 47 35 40 52 United States 74% 30 35 Source: Virginia Department of Education; National Center for Education Statistics, NAEP

46
Higher Education
The TJPED region is associated with higher education based upon the national reputation of the University of Virginia. The Technology Asset Inventory chapter of this report provides information on the research and intellectual property aspects of the University. The overall academic excellence of the University is equally important to the workforce of the region.
Together, the three higher education institutions in the TJPED region produce approximately 7,600 graduates per year. Appendix C of this report provides the number of graduate per degree or program of study.
The institutions produce a relatively high number of graduates in the science, technology, engineering and mathematics (STEM) fields. A larger number of graduates in these fields have been identified nationally as necessary to support the growth and competitiveness of companies in the new knowledge-based economy. Table 10 below summarizes key higher education data for the region.
Table 10
Higher Education
Study Area Graduates Institutions
Thomas Jefferson Partnership for Economic Development Region
7,578 3
Source: National Center for Education Statistics, IPEDs
Higher education graduates are an important component of the potential labor pool. While no region is able to retain all the graduates from the higher education institutions located there, regions with a strong pipeline of graduates are more capable of meeting the needs of employers. Employers have the choice of recruiting graduates from outside the area or recruiting more directly from local institutions.
Employers interviewed for this study report that both Germanna Community College and Piedmont Virginia Community College collaborate well with them. Both colleges have programs that are directly responsive to the training and specialized skill needs of local employers.
Area Institutions
Germanna Community College
Piedmont Virginia Community College
University of Virginia
STEM Degrees
Science 461
Technology 111
Engineering & Engineering Technology
579
Math 76

47
Labor Supply Findings Unemployment statistics understate, in intentional and unintentional ways, the number of people who do not have jobs. To be officially counted in the state and federal workforce statistics as unemployed, a person must have held a paying job, left that job through no fault of their own within the time period allowed for payment of unemployment benefits, registered with the local workforce investment network office, and stayed in touch with that office with proof that they are looking for a job.
Many people without jobs do not meet the criteria to be included in unemployment statistics. Recent high school and post-secondary graduates are not included. People returning to the workforce after extended absences, such as parents and caregivers ready to return to work, are not included. Other examples of potential workers who do not qualify as officially unemployed are people who have relocated into an area, people who never applied for unemployment benefits, most separating military and early retirees who want to return to some type of employment.
The labor supply survey conducted for the TJPED region identifies all these types of workers and provides a count of the total “not employed.” The not employed includes the officially unemployed, plus all other working-age people who could potentially be in the workforce. Younger Associates limited the age range of the survey to ages 18 to 65 and did not include recent high school graduates who are seeking any form of higher education.
The labor supply survey found 22.2% of the TJPED potential workforce to be not employed. When applied to the working age population this percentage translates to over 46,700 people in the TJPED region who are not employed as shown in Table 11.
Table 11
Workforce Status
Employment Status Total Survey TJPED Region
Employed 77.8% 163,884
Not Employed 22.2% 46,708
Total 100% 210,592
Source: Younger Associates Labor Supply Survey
Workforce Component: The Not Employed
Not everyone who is Not Employed is interested in finding a job or seeking immediate employment. The labor supply survey screened for those who are actually interested in finding employment. Because the age range was limited to those 18 to 65, and most recent high school graduates were not included, the percentage of the Not Employed seeking employment is high. In the TJPED region it was atypically high, with 46,379 reporting an interest in finding a job.

48
Workforce Component: The Underemployed
Another important component of the workforce is the pool of workers who are underemployed. The underemployed are defined by the Younger Associates analysis to be those who are: currently employed; have been previously successfully employed at a higher skill level job than the one they have now; and would prefer to hold a higher skill-level job. Another category of this worker pool would be workers who have recently and successfully completed training or certification for a higher skill-level job.
The labor supply survey found 16.8 percent of the TJPED region labor supply pool to be Underemployed. This translates to over 27,500 workers in the region who are Underemployed. Employers across the country frequently report that this is the most desirable pool of potential workers. This is because employers view these workers as being motivated to work and having a productive work ethic. Although they have not found a job that matches their skills and training potential, they remain in the workforce.
Workforce Component: Part-Time Employees
Among the people who are employed in the region, almost 21% are employed part-time as shown in Table 12. This includes those who prefer to be employed part-time and those who would prefer full-time work.
Table 12
Full-Time and Part-Time Employment
Employment Type Total Survey TJPED Region
Full-Time 79.2% 129,840
Part-Time 20.8% 34,044
Total 100% 163,884
Source: Younger Associates Labor Supply Survey
The labor supply survey found that over 40% of the people who are currently employed part-time would prefer to be employed full-time. In the TJPED region, this indicates that more than 13,700 people employed part-time would accept full-time work if it was available.
These workers are an important component of the labor supply because employers often prefer to hire workers who have proven their reliability through part-time work. These workers may also have gained workplace skills that may not be found among people who have never worked or who have been out of the workplace for a long time.

49
Hidden Potential Labor Supply
When the components of the labor supply pool are combined, the total Hidden Potential Labor Supply can be seen. Table 13 below shows all the components, including the number of annual graduates from the three higher education institutions in the TJPED region. In the TJPED region, employers have a potential labor pool of over 95,100 workers, many with past work experience and training that can be beneficial to employers in key industry groups.
Table 13
Potential Hidden Labor Supply
Employment Status TJPED Region
Not employed, but interested in working 46,379
Underemployed 27,538 Residents employed part-time, who would prefer full-time employment 13,703
Recent post-secondary graduates 7,578
Total 95,198
Source: Younger Associates Labor Supply Survey

50
Less than High School
11%
High school graduate or equivalent
41% Some college, no degree
21%
Associates degree or technical certificate
9%
Bachelors degree
10%
Graduate degree
8%
Key Characteristics of the Underemployed and Not Employed, but Interested
Among the Not Employed, but Interested group, approximately half the group has some education beyond the high school equivalency level as shown in Figure 4. This is beneficial to the effort of connecting these potential workers to employers. In particular, the 21 percent of the Not Employed, but Interested labor supply component can potentially be provided with specific skill training that prepares them to be quickly productive for existing employers in the region, based upon their current education level.
Figure 4
Not Employed, but Interested Education Levels
Source: Younger Associates Labor Supply Survey
Table 14 below shows the extrapolated number of workers currently Not Employed, but Interested and Underemployed, by education level, in the TJPED region.
Table 14 Educational Attainment by Employment Status Not Employed,
but Interested Underemployed
Less than High School 4,969 672 High school graduate or equivalent 20,208 5,374 Some college, no degree 8,945 4,366 Associates degree or technical certificate 3,975 4,869 Bachelors degree 4,638 6,549 Graduate or Professional degree 3,644 5,709 Total 46,379 27,538 Source: Younger Associates Labor Supply Survey

51
Among the Not Employed, but Interested component, recent layoff or company closure is the top reason for lack of employment, as shown in Table 15.
Table 15
Top Reasons for Lack of Employment Among Not Employed, but Interested
%
Not Employed, but Interested
Laid Off / Company Closure 31.9% 14,788 Other 21.0% 9,746 Retired 10.9% 5,041 Cannot find job with hours / schedule I need 10.1% 4,705 Lack of jobs in field 8.7% 4,033
Source: Younger Associates Labor Supply Survey
Many of the jobs skills reported by the Not Employed, but Interested are in areas hard hit by the recession, such as construction, retail, and food preparation, as shown in Table 16. These are also low skill groups that do not match the recommended target industry groups for the overall region well (Some county targets can utilized these skill groups.) However, some of skill groups such as office and administrative support, computer support, management, and transportation provide a good labor supply pool for the target industry groups.
Table 16
Not Employed, but Interested Most Frequently Reported Job Skills
Leading Occupational Skills %
Not Employed, but Interested
Construction 8.8% 4,077 Office & Administrative Support 8.2% 3,822 Retail Sales & Service 7.7% 3,568 Food Preparation & Serving 7.1% 3,313 Financial 5.5% 2,548 Cleaning & Maintenance 4.9% 2,293 Computer/IS-Support/Tech 4.9% 2,293 Management-Entry Level 4.9% 2,293 Transportation & Material Moving 4.9% 2,293
Source: Younger Associates Labor Supply Survey

52
Among the Underemployed component, many workers report skills and past experience that would make them an attractive potential workforce for target industry sectors, specifically the Business and Financial Services industry group. As shown in Table 17, four of the seven most frequently reported employment skills groups would match that industry group.
Table 17
Underemployed Most Frequently Reported Job Skills
Leading Occupational Skills % Underemployed
Education-Professional 11.9% 3,291 Business/Professional Services 10.1% 2,771 Management-Middle 9.4% 2,598 Office & Administrative Support 5.0% 1,386 Special Trades 5.0% 1,386 Computer/IS-Support/Tech 3.8% 1,039 Protective Services 3.8% 1,039
Source: Younger Associates Labor Supply Survey

53
Training Needs
For educators and training providers, it is helpful to understand the types of training workers would prefer. This helps in planning training capacity, but is even more helpful in preparing to counsel workers to seek training in fields where the success of achieving long-term employment is high. Table 18 shows the most frequently reported training desires among the Not Employed, but Interested.
Table 18
Top Training Interests among Not Employed, but Interested
%
Not Employed, but Interested
Computer - General 23.6% 7,768 Medical Related (except nursing) 9.4% 3,107 Nursing 5.7% 1,864 Special Trades 5.7% 1,864 Office/Clerical 4.7% 1.554
Source: Younger Associates Labor Supply Survey
While the types of training desired by the Not Employed, but Interested may generally apply to existing and target industry groups in the region, career counseling could help direct trainees to specific areas, which will support economic growth. For example, those seeking training in special trades (which can include electrical, HVAC, and maintenance) should be guided to the industrial special trades, rather than trades that support residential construction.
Evidence from workforce analyses completed in other areas have shown that people seeking general computer training may stop short of the skill level needed to meet current employer requirements. Specifically, trainees may seek to learn basic word processing and other basic functions, but do not reach the skill level to provide more analytical computer support for Business and Financial Services operations.

54
Other Characteristics of the Labor Supply
Among the employed, approximately 14 percent have a second job. Table 19 shows the most frequently reported types of second job. Almost half of those reporting a second job are self-employed in that second job.
Table 19 Second-Job Holder Occupations
Occupation Total Survey TJPED Region Food Preparation & Serving 13.8% 3,175 Business/Professional Services 10.9% 2,507 Retail Sales & Service 10.9% 2,507 Leisure/Entertainment 8.7% 2,006 Cleaning & Maintenance 6.5% 1,504 Farming, Fishing & Forestry 5.8% 1,337 Social Services 5.8% 1,337 Transportation & Material Moving 5.8% 1,337 Education - Professional 4.3% 1,003 Childcare 3.6% 836
Source: Younger Associates Labor Supply Survey
The majority of the workforce in the TJPED region has never worked shifts. Only 18.4 percent has ever worked any shifts, which is a very low proportion compared to other locations in the U.S. Many companies that provide 24-hour services and support and operate advanced technology require shifts to maintain operational levels. This has not been a concern or operational issue with employers in the region to date.
While this chapter contains key highlights from the labor supply survey, Appendix A provides detailed profiles of the overall workforce and each key component of the Hidden Labor Supply. A workforce is always regional in nature and the overall TJPED regional workforce profiles offer the best insights on workforce availability and characteristics.
In addition to the overall regional profiles, a profile has been prepared for each county in the region based upon the potential labor shed area for the county. These profiles present the workforce characteristics for the potential labor shed area for each county. The labor shed area contains the group of counties from which an employer paying average industry wages could reasonably expect to attract workers. The labor shed areas are based upon survey results and historic commute patterns and supporting data is presented in Appendix B of this report.
Due to the small geographic area involved, the labor shed areas do not differ greatly. Charlottesville and Albemarle County have the same geographic labor shed area and are presented together in this one section of the report.
The survey data is tabulated and presented in an online tool so members of TJPED can create profiles of specific county groupings. This may be helpful when an employer or consultant requests data for a general area that differs from the labor shed area. The TJPED online workforce data tool can be accessed at http://surveys.younger-associates.com/va/tjped/ .

Title: Target Industries & Demand Occupations Policy Policy #: Effective Date: July 1, 2016 Revision Date:
Purpose:
The purpose of this policy is to define the Target Industries for the Piedmont Workforce Network region (Local Workforce Development Area 6) and to also provide demand occupations within those industries. This will allow for the PWN staff and WIOA Operator to prioritize the federal, state and local funding toward in demand occupations for the area’s participants.
Policy:
Target industries for LWDA 6 are established for funding purposes and should be used to assist job seekers in seeking training and employment that will allow them to be self-sufficient. Target industries and occupations will be reviewed on an annual basis to ensure that changing economic trends are addressed, if necessary.
Target Industries
In 2012, the Central Virginia Partnership for Economic Development (Partnership) released the comprehensive Target Markets Report, which defined the target industries for economic development purposes in the Piedmont region. These industries have become the basis for the Piedmont Workforce Network when looking at ways to maximize federal funding and providing a return on investment for the Workforce Innovation and Opportunity Act (WIOA) funding for job seekers. The target industries for the Piedmont Workforce Network are defined as follows:
Agribusiness Bioscience & Medical Devices Business & Financial Services Defense & Security Health Services Information Technology Manufacturing
While all of these industries are considered target industries for economic development purposes, the Piedmont Workforce Network will focus federal funding on the following industries:
Business & Financial Services Health Services Information Technology Manufacturing/Distribution

Demand Occupations
Each of the target industries has demand occupations associated with the sector and provide a great opportunity for individuals to have stable, self-sufficient employment. A list of the occupations associated with each of the target industries is provided below, along with information regarding the 10-year projection of demand.
Health Services 29-1141 Registered Nurses 39-9021 Personal Care Aides 31-1011 Nursing Assistants 43-4171 Receptionists and Information Clerks 31-9092 Medical Assistants 29-2061 Licensed Practical and Licensed Vocational Nurses 29-1123 Physical Therapists 43-6013 Medical Secretaries 31-9091 Dental Assistants 43-9061 Office Clerks, General 39-9011 Childcare Workers 29-1069 Physicians and Surgeons, All Other 37-2012 Maids and Housekeeping Cleaners 43-3021 Billing and Posting Clerks 11-9111 Medical and Health Services Managers 35-2012 Cooks, Institution and Cafeteria 35-3041 Food Servers, Non-restaurant 43-1011 First-Line Supervisors of Office and Administrative Support Workers 21-1093 Social and Human Service Assistants 31-2021 Physical Therapist Assistants 29-2021 Dental Hygienists 25-2011 Preschool Teachers, Except Special Education 29-1171 Nurse Practitioners 43-6014 Secretaries and Administrative Assistants, Except Legal, Medical, and Executive 11-1021 General and Operations Managers 29-1127 Speech-Language Pathologists 29-1122 Occupational Therapists 29-1062 Family and General Practitioners 31-2022 Physical Therapist Aides
Information Technology 15-1132 Software Developers, Applications 15-1121 Computer Systems Analysts 15-1133 Software Developers, Systems Software 15-1151 Computer User Support Specialists 11-3021 Computer and Information Systems Managers 15-1142 Network and Computer Systems Administrators 41-3099 Sales Representatives, Services, All Other 11-1021 General and Operations Managers 43-4051 Customer Service Representatives

15-1134 Web Developers 13-1111 Management Analysts 15-1143 Computer Network Architects 15-1152 Computer Network Support Specialists 43-9061 Office Clerks, General 13-1161 Market Research Analysts and Marketing Specialists 41-4011 Sales Representatives, Wholesale and Manufacturing, Technical and Scientific Products 15-1122 Information Security Analysts 13-2011 Accountants and Auditors 15-1199 Computer Occupations, All Other 15-1141 Database Administrators 13-1199 Business Operations Specialists, All Other 17-2061 Computer Hardware Engineers 13-1071 Human Resources Specialists 11-9199 Managers, All Other 15-2031 Operations Research Analysts 13-1151 Training and Development Specialists 43-6014 Secretaries and Administrative Assistants, Except Legal, Medical, and Executive 41-9031 Sales Engineers 11-2022 Sales Managers 11-2021 Marketing Managers
Business & Financial Services 13-2011 Accountants and Auditors 13-2082 Tax Preparers 43-3021 Billing and Posting Clerks 11-3031 Financial Managers 43-9061 Office Clerks, General 43-4051 Customer Service Representatives 11-1021 General and Operations Managers 43-6014 Secretaries and Administrative Assistants, Except Legal, Medical, and Executive 43-1011 First-Line Supervisors of Office and Administrative Support Workers 53-7062 Laborers and Freight, Stock, and Material Movers, Hand 43-9021 Data Entry Keyers 41-3099 Sales Representatives, Services, All Other 43-3051 Payroll and Timekeeping Clerks 27-2011 Actors 43-3011 Bill and Account Collectors 43-4171 Receptionists and Information Clerks 13-1111 Management Analysts 13-1071 Human Resources Specialists 13-2052 Personal Financial Advisors 11-9199 Managers, All Other 13-1161 Market Research Analysts and Marketing Specialists 15-1151 Computer User Support Specialists 29-2071 Medical Records and Health Information Technicians 13-2051 Financial Analysts

15-1121 Computer Systems Analysts 11-3121 Human Resources Managers 13-2099 Financial Specialists, All Other 11-3011 Administrative Services Managers 43-5061 Production, Planning, and Expediting Clerks 27-2012 Producers and Directors
Manufacturing 51-2092 Team Assemblers 51-9111 Packaging and Filling Machine Operators and Tenders 53-7062 Laborers and Freight, Stock, and Material Movers, Hand 51-4041 Machinists 51-7041 Sawing Machine Setters, Operators, and Tenders, Wood 49-9041 Industrial Machinery Mechanics 51-9061 Inspectors, Testers, Sorters, Samplers, and Weighers 53-7051 Industrial Truck and Tractor Operators 51-1011 First-Line Supervisors of Production and Operating Workers 51-4011 Computer-Controlled Machine Tool Operators, Metal and Plastic 51-9198 Helpers--Production Workers 11-1021 General and Operations Managers 17-2112 Industrial Engineers 51-9012 Separating, Filtering, Clarifying, Precipitating, and Still Machine Setters, Operators, and
Tenders 41-4012 Sales Representatives, Wholesale and Manufacturing, Except Technical and Scientific
Products 53-3032 Heavy and Tractor-Trailer Truck Drivers 41-2031 Retail Salespersons 51-7042 Woodworking Machine Setters, Operators, and Tenders, Except Sawing 49-9071 Maintenance and Repair Workers, General 51-7011 Cabinetmakers and Bench Carpenters 11-3051 Industrial Production Managers 17-2141 Mechanical Engineers 43-5081 Stock Clerks and Order Fillers 51-4121 Welders, Cutters, Solderers, and Brazers 53-7064 Packers and Packagers, Hand 43-4051 Customer Service Representatives 51-2022 Electrical and Electronic Equipment Assemblers 43-5061 Production, Planning, and Expediting Clerks 51-9023 Mixing and Blending Machine Setters, Operators, and Tenders 51-4081 Multiple Machine Tool Setters, Operators, and Tenders, Metal and Plastic
Distribution 53-3032 Heavy and Tractor-Trailer Truck Drivers 53-7062 Laborers and Freight, Stock, and Material Movers, Hand 53-7051 Industrial Truck and Tractor Operators 53-3033 Light Truck or Delivery Services Drivers 53-3022 Bus Drivers, School or Special Client 43-5081 Stock Clerks and Order Fillers

53-7064 Packers and Packagers, Hand 53-1031 First-Line Supervisors of Transportation and Material-Moving Machine and Vehicle
Operators 53-3041 Taxi Drivers and Chauffeurs 43-5032 Dispatchers, Except Police, Fire, and Ambulance 53-2031 Flight Attendants 43-4051 Customer Service Representatives 53-1021 First-Line Supervisors of Helpers, Laborers, and Material Movers, Hand 11-1021 General and Operations Managers 53-2011 Airline Pilots, Copilots, and Flight Engineers 43-9061 Office Clerks, General 43-5071 Shipping, Receiving, and Traffic Clerks 43-4181 Reservation and Transportation Ticket Agents and Travel Clerks 49-3031 Bus and Truck Mechanics and Diesel Engine Specialists 53-3021 Bus Drivers, Transit and Intercity 49-9071 Maintenance and Repair Workers, General 53-7063 Machine Feeders and Offbearers 11-3071 Transportation, Storage, and Distribution Managers 41-3099 Sales Representatives, Services, All Other 43-5011 Cargo and Freight Agents 49-3011 Aircraft Mechanics and Service Technicians 53-6099 Transportation Workers, All Other 43-1011 First-Line Supervisors of Office and Administrative Support Workers 53-7061 Cleaners of Vehicles and Equipment 53-2012 Commercial Pilots

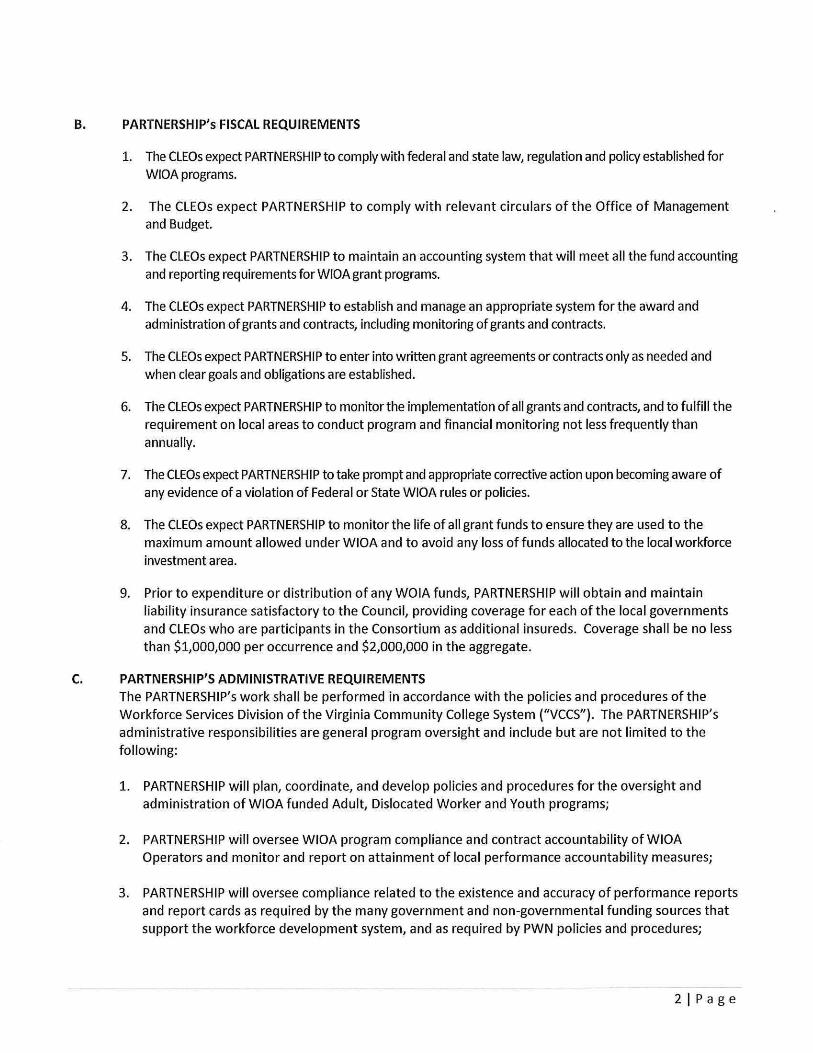


Title: Priority of Service Policy Policy #: 1
Effective Date: July 1, 2015 Revision Date:
Purpose:
The purpose of career and training services is to provide eligible customers with the means to obtain the necessary skills to become gainfully employer or re-employed. This policy is intended to define and establish parameters for the priority of service with WIOA Title I Adult funds.
Policy:
Priority
Priority for career and training services funded with WIOA Title I Adult funds shall be given to recipients of public assistance, other low-income individuals and individuals who are basic skills deficient, as well as any *covered person under the Veterans’ priority, in the local area. Thus, the following sequence of services priority will apply:
1. First priority will be provided to recipients of public assistance, other low-income individuals andindividuals who are basic skills deficient in the local area who are covered persons with respectto Veterans’ priority;
2. Second priority will be provided to recipients of public assistance, other low-incomeindividuals and individuals who are basic skills deficient in the local area;
3. Third priority will be covered persons with respect to the Veterans’ priority (these coveredpersons not considered to be recipients of public assistance or low-income);
4. Other local discretionary target population groups currently defined as the **working poor.
*Covered Person
The term “covered person” includes anyone who is a Veteran. The term “covered person” also includes spouses of Veterans that fall into the following categories:
1. Any veteran who died of a service-connected disability2. Any member of the armed forces on active duty who, at the time of the spouse’s application, is
listed in one or more of the following categories and has been so listed for more than 90 days:a. Missing in action;b. Captured in the line of duty by a hostile force; orc. Forcible detained or interned in the line of duty by a foreign government or power.
3. Any Veteran who has a total disability resulting from a service-connected disability; or4. Any Veteran who while a disability so evaluated was in existence.

**Working Poor
WIOA funds may also be used to serve the working poor – those employed persons who have not yet achieved self-sufficiency – but priority must be given to low-income clients. Service providers shall track number of clients served and limit services to non-priority clients.
Geographic Area
WIOA funds allocated to LWDA 6 are reserved for clients who reside in or are/were employed within the geographic area comprising the Local Workforce Development Area.