Embed Size (px)
Citation preview

Local scale modelling across Europe with uEMEP
Bruce Rolstad Denby, Qing Mu, Eivind Grøtting Wærsted, Hilde Fagerli
(EMEP/MSC-W, MET Norway)
EPCAC Sep. 2020
Meteorological Synthesizing Centre - West
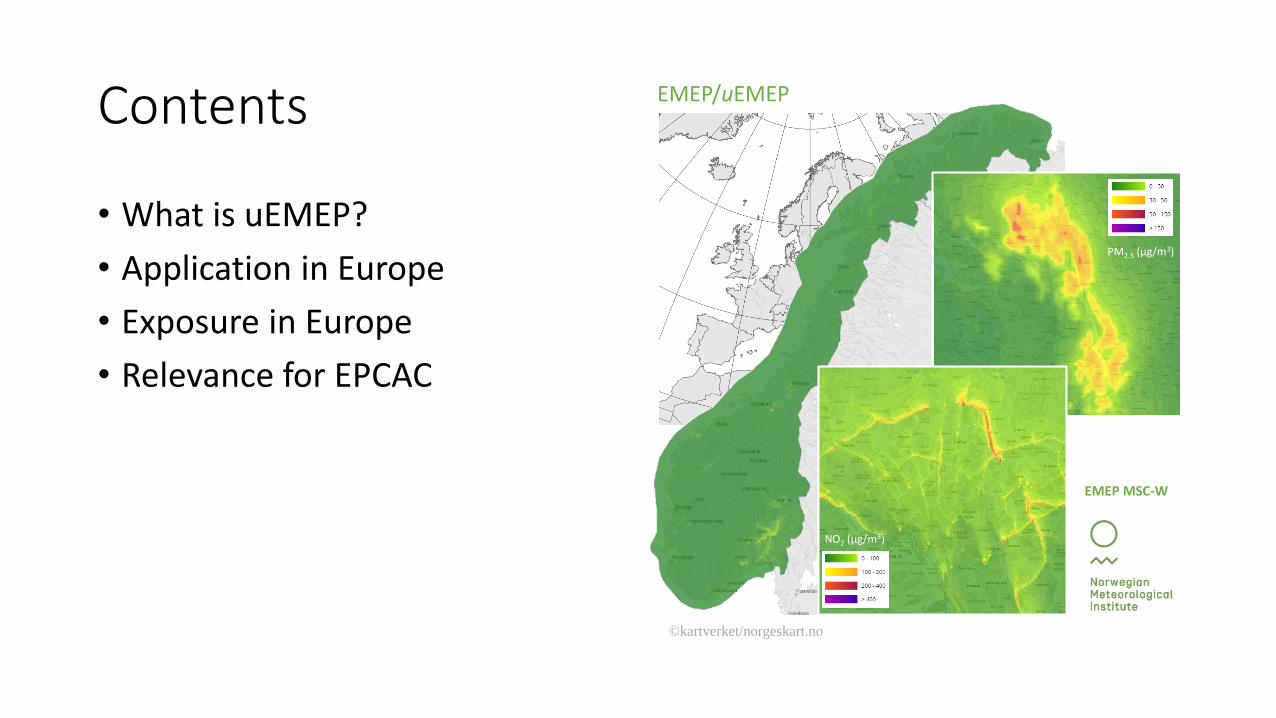
Contents
• What is uEMEP?
• Application in Europe
• Exposure in Europe
• Relevance for EPCAC
EMEP/uEMEP
NO2 (µg/m3)
PM2.5 (µg/m3)
EMEP MSC-W
©kartverket/norgeskart.no

What is uEMEP?
• uEMEP (urban EMEP) is an extension of the EMEP MSC-W model used to downscale EMEP to around 100 m
• It can be inserted anywhere in the EMEP domain and deals with double counting of emissions by utilizing the ‘local fraction’ output from EMEP
• uEMEP dispersion is calculated using a Gaussian dispersion model
• It can be run on hourly data (Norwegian forecast) or can calculate annual meansusing a rotationally symmetric dispersion kernel (European application)
• Emissions can be provided in two ways. Using independent sub-grid emissions(Norwegian forecast) or by redistributing EMEP gridded emissions using proxyemission data (Europe)
• Source contributions are calculated for each downscaled sector and pollutant
• Maps are made between 50 m and 250 m resolution and calculations at individualreceptor points are at 25 m

How does uEMEP downscaling work ?
Non-local
Local
EMEP grid concentration
Non-local
Combine localsub-grid with
non-local EMEP
DispersionuEMEP sub-grid
Local fractionEMEP
Redistributedsub-grid
emissions
Local
EMEP griddedemissions (0.1 o)
uEMEP sub-grid (250 m)
Non-local
Non-local contributioncan be seen as
regional background

Some points when downscaling
• The uEMEP ‘local’ downscaling calculation extends over a limited region. In the European application this is ± 0.1o . The uEMEP calculations represent all sub-grid emissions within these regions
• Outside of this region, or for sectors that are not downscaled, EMEP provides the ‘non-local’ contribution
• Downscaling is limitted to primary emissions (NOX is downscaled and convertedto NO2)
• The sub-grid traffic data are line sources so higher resolutions will better reflect the traffic contribution
• The sub-grid resolution of residential combustion (and other) proxy emissions is 250 m so any higher resolution calculations will not improve these contributions
• 250 m population data is used for exposure

European air quality downscaling

Method for the European applicationhttp://emep.int/publ/emep2020_publications.html
• EMEP MSC-W chemical transport model is used to calculate air quality at 0.1o x 0.1o in Europe for 2018 (as in 2020 EMEP report) including ‘local fraction’ in just a 5 x 5 grid region
• EMEP 0.1o emissions are used but GNFR3 (residential combustion) is replaced with TNO GNFR3 emissions that include condensables
• Only annual mean concentrations are calculated by uEMEP
• Emission proxies used to redistribute gridded EMEP emissions :• Traffic emissions are downscaled using Open Street Maps as proxy (weighting by road category)
• Residential combustion (GNFR3) downscaled using 250 m population as proxy
• Shipping emissions downscaled using AIS based shipping emissions
• All these proxies are global datasets
• Downscaled concentration maps for Europe are calculated at 250 and 100 m and at Airbase station positions at 25 m

• uEMEP is calculated on separate individual tiles in order to efficiently process the calculations
• At 250 m resolution there are 199 tiles
• At 100 m resolution there are 1097 tiles
• These are then fitted together when presenting results
Tiling
100 m resolution uEMEP tiles 100 x 100 km2 each

Example maps
Poland and France

Poland NO2 (2018)
EMEP 0.1o uEMEP 250m
610 610
©kartverket/norgeskart.no

Tile 610 (Krakow) NO2 (2018)
EMEP 0.1o uEMEP 100m
©kartverket/norgeskart.no
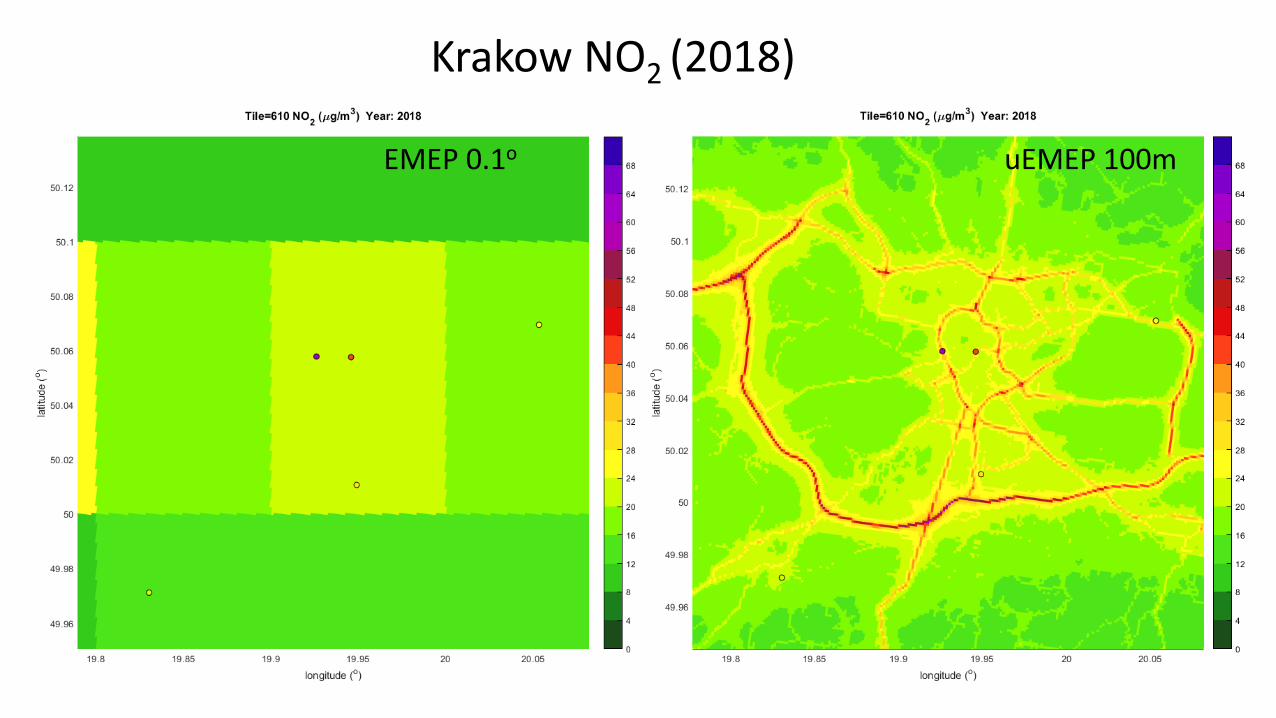
Krakow NO2 (2018)
EMEP 0.1o uEMEP 100m

France PM2.5 (2018)
EMEP 0.1o uEMEP 250m 263263
©kartverket/norgeskart.no

Tile 263 (Lyon) PM2.5 (2018)
EMEP 0.1o uEMEP 100m
©kartverket/norgeskart.no
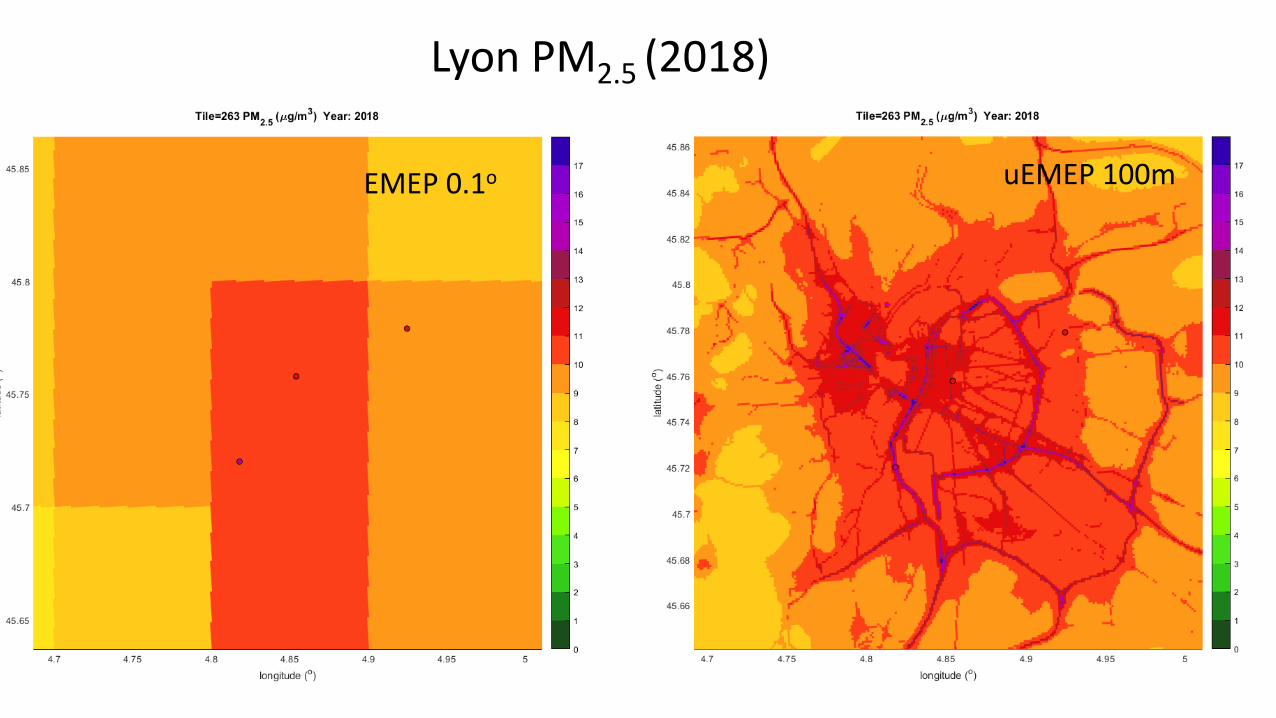
Lyon PM2.5 (2018)
EMEP 0.1o uEMEP 100m

Validation for NO2 and PM2.5
all Airbase stations

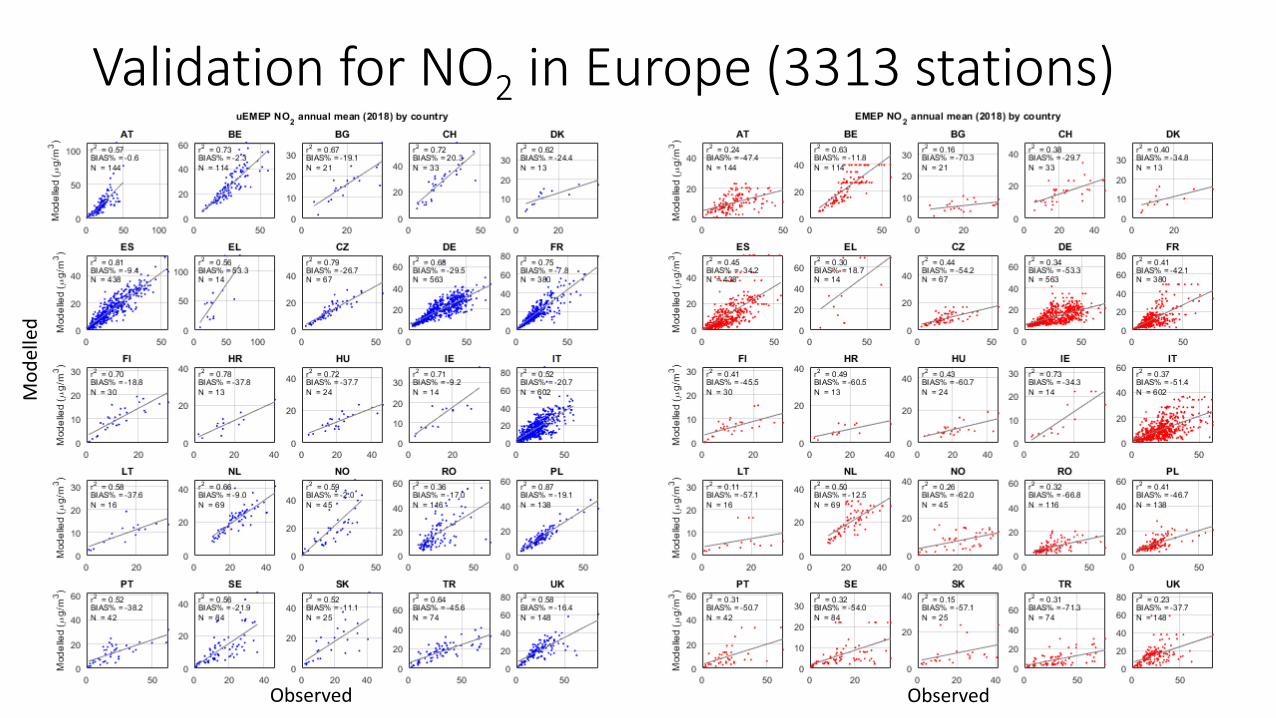
Validation for NO2 in Europe (3313 stations)
Observed Observed
Mo
del
led
Validation for NO2 in Europe (3313 stations)

Validation for PM2.5 in Europe (1377 stations)

Observed Observed
Mo
del
led
Validation for PM2.5 in Europe (1377 stations)

Summary of European downscaling validation
• Downscaled NO2 concentrations are still generally lower than observed but this varies from country to country• uEMEP Bias = -17% compared to -46% for EMEP
• Spatial correlation for NO2 is significantly improved with downscaling in all countries • All stations individually in Europe: r2=0.56 compared to r2=0.32 for EMEP
• Average country: r2=0.65
• Variability between countries, probably due to reported emissions, reduces the European r2
• Downscaled PM2.5 concentrations are generally still lower than observed• uEMEP Bias = -10% compared to -21% for EMEP
• Spatial correlation for PM2.5 is improved in less than half the countries with downscaling• uEMEP r2=0.46 compared to r2=0.49 for EMEP for all of Europe
• Still work to be done here

Exposure

EMEP 0.1o
Calculated exposure distribution for NO2 (EU28+EFTA)

Calculated exposure distribution for NO2 (EU28+EFTA)
uEMEP 250 m

EMEP 0.1o
Calculated exposure distribution for PM2.5 (EU28+EFTA)
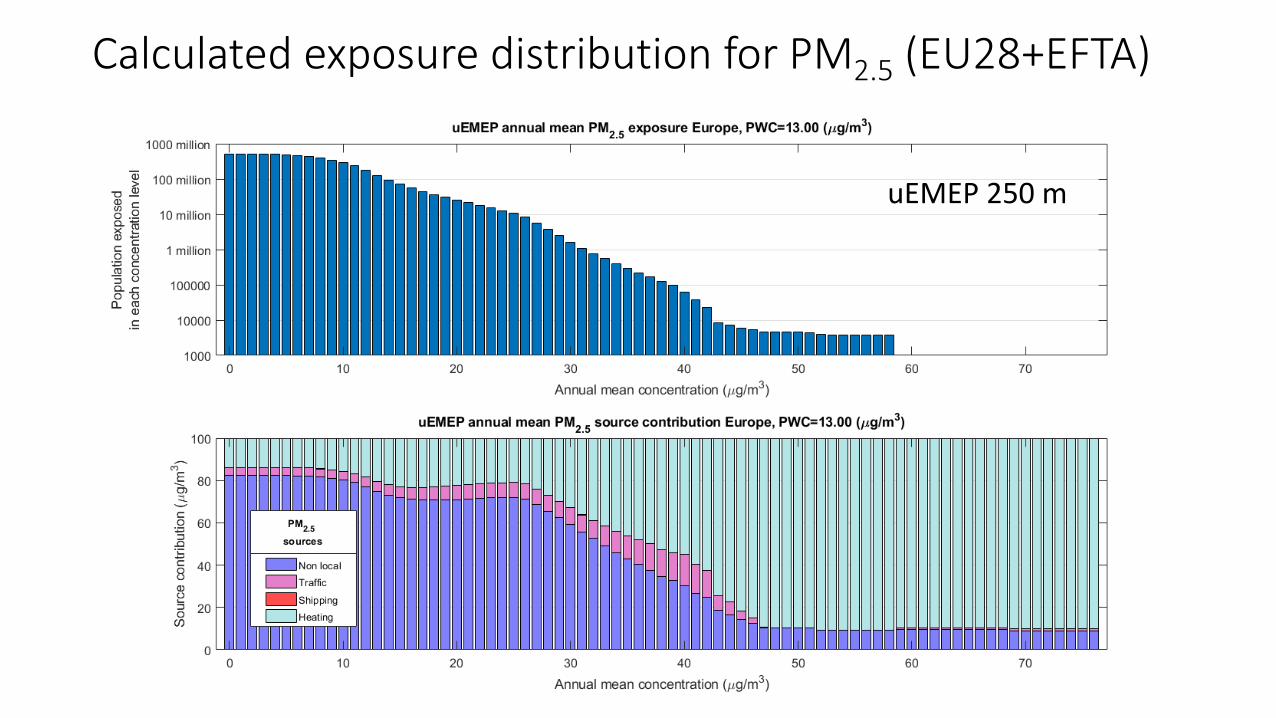
Calculated exposure distribution for PM2.5 (EU28+EFTA)
uEMEP 250 m
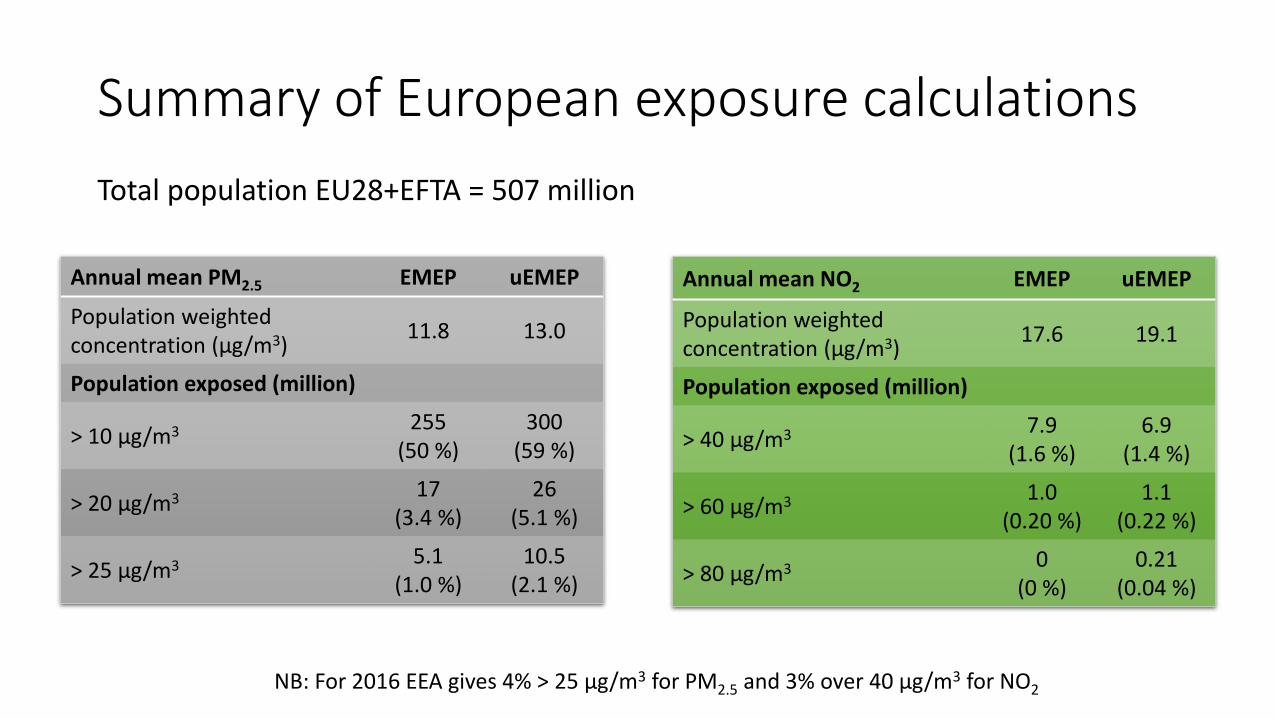
Summary of European exposure calculations
Total population EU28+EFTA = 507 million
Annual mean PM2.5 EMEP uEMEP
Population weightedconcentration (µg/m3)
11.8 13.0
Population exposed (million)
> 10 µg/m3 255(50 %)
300(59 %)
> 20 µg/m3 17(3.4 %)
26(5.1 %)
> 25 µg/m3 5.1(1.0 %)
10.5(2.1 %)
Annual mean NO2 EMEP uEMEP
Population weightedconcentration (µg/m3)
17.6 19.1
Population exposed (million)
> 40 µg/m3 7.9(1.6 %)
6.9(1.4 %)
> 60 µg/m3 1.0(0.20 %)
1.1(0.22 %)
> 80 µg/m3 0(0 %)
0.21(0.04 %)
NB: For 2016 EEA gives 4% > 25 µg/m3 for PM2.5 and 3% over 40 µg/m3 for NO2

Summary of European exposure calculations
PM2.5
• Most important contributor in the downscaling is residential combustion
• Using population as a proxy means that emissions are moved towards where peoplelive, increasing concentrations there and reducing them where they do not live
• Significant increase in exposure as a result
NO2
• Most important contributor in the downscaling is traffic
• Using OSM as a proxy can move the emissions away from the population sincepeople often do not live near major roads
• Exposure can be less with downscaling because of this
• Extreme values of exposure can be captured with downscaling

Relevance for EPCAC

Advantages of uEMEP in Europe
• Gives significant improvement for NO2 concentrations and is directly comparable with, but shouldnot be as good as, national models (e.g. Norway, The Netherlands)
• Redistribution of EMEP emissions for the local uEMEP calculations means that total emissions areconsistent through all scales
• Provides a consistent modelling methodology across Europe, covering all cities, large or small and provides insight into differences between countries and reported country emissions
• Provides source contributions for downscaled sectors that are emitted locally, allowing the impact oflocal measures to be quickly assessed by post-processing
• In combination with EMEP source receptor calculations using ‘local fractions’ uEMEP/EMEP canprovide source contributions across all scales
• The non-local contribution from EMEP, using the ‘local fraction’ calculation, is suitable as regional background for other model studies (option A)
• Can provide a reference/benchmark for EPCAC European city studies

Disadvantages of uEMEP in Europe
• Does not show improvement in spatial correlation for PM but does reduce negative bias. Room for improvement in the uEMEP proxy data and/or the EMEP emission data
• Uses basic proxy data to redistribute emissions that are globally available. Local modelling shouldhave better high resolution emission data and hence results (as seen in Norway)
• Can only downscale primary emissions
• Annual mean concentrations do not provide information on percentiles. Hourly calculations for all ofEurope at 100 m are computationally prohibitive but for individual cities this is possible.

Documentation, data and models• Regional scale model: EMEP MSC-W model rv4.34 (0.1° x 0.1°)
• https://github.com/metno/emep-ctm
• Downscaling model: uEMEP v6 (250 – 25 m)• https://github.com/metno/uEMEP
• Regional scale emissions: EMEP 0.1o with GNFR3 replaced by TNO Ref2 emissions including condensables• https://www.ceip.at/webdab-emission-database
• Downscaling population data: GHS-POP, Global Human Settlement-Population, (9 arcsec)• https://ghsl.jrc.ec.europa.eu/ghs_pop2019.php
• Downscaling traffic data: Open street maps• https://www.openstreetmap.org/
• uEMEP model description and Norwegian application:• https://gmd.copernicus.org/preprints/gmd-2020-119/
• EMEP local fraction model description:• https://gmd.copernicus.org/articles/13/1623/2020/
• uEMEP application in Europe: EMEP report 2020• https://emep.int/publ/reports/2020/EMEP_Status_Report_1_2020.pdf

The end


![[Aviation] Modelling Manuals 01 - Basic Aviation Modeling [Osprey Modelling Manuals] [scale model.pdf](https://img.pdfslide.net/doc/110x75/563db9b8550346aa9a9f47bb/aviation-modelling-manuals-01-basic-aviation-modeling-osprey-modelling.jpg)