Embed Size (px)
Citation preview
International Journal of Sediment Research, Vol. 30, No.1, 2015, pp. 39–47 - 39 -
International Journal of Sediment Research 30 (2015) 39-47
Local scour around bridge abutments under ice covered condition − an experimental study
Peng WU1, Faye HIRSHFIELD2, and Jue-yi SUI3*
Abstract The local scour around bridge abutments has been an active research topic for many decades. But very few
studies have been conducted regarding the impacts of ice cover on the local scour phenomenon around bridge abutments. A series of ice covered flume experiments were conducted in this study. The shape factors of different abutment types in the local scour were compared. Under ice cover, the shape factor for semi-circular abutments ranges from 0.66~0.71. Three different non-uniform sediments were used with D50s of 0.58 mm, 0.50 mm, and 0.47 mm respectively. Two types of ice cover, namely smooth and rough cover, were created to simulate the impacts of ice cover around the abutments. Maximum scour depth was analyzed under different conditions. The contours of the scour holes were plotted to show the bed morphology and sediment deposition around bridge abutments. An empirical relationship between maximum scour depth, densimetric Froude number and sediment size was developed.
Key Words: Bridge abutment, Ice cover, Local scour, Maximum scour depth
1 Introduction Local scour is the engineering term used to describe sediment removal around hydraulic structures by running water. It
may result in bridge failures as it can undermine piers and abutments that support bridges. The Federal Highway Administration has estimated that over 60% of bridge collapses in the US was from local scour. Luigia et al. (2012) indicated that approximately 50 to 60 bridges fail on average each year in the US. A worldwide survey also indicated that, the main cause of bridge collapse is natural hazards, among which flooding and scour is responsible for around 60% of the failures (Imhof, 2004).
An important consideration in bridge abutment design is to estimate the maximum scour to make sure the bridge foundation can be built deep enough to avoid the possibility of undermining. In the past few decades, local scour around bridge abutments and piers in open channels has received wide attention and many scholars have conducted various studies on this topic (Laursen and Toch, 1956; Froehlich, 1989; Melville, 1997; Coleman et. al., 2003; Dey and Barbhuiya, 2005; etc.). To estimate the maximum scour depth, several formulae have been developed. As reviewed by NCHRP in 2011, five major dimensionless parameter groups are classified for the scour depth estimation formulae.
The first group is Flow and Sediment, which indicates flow interaction with sediment and can be used to classify clear-water or live-bed scour. The second group is Abutment and Sediment scale, which is related to the degree of model scaling. The third group is Abutment and Flow geometry, which will measure abutment dimensions relative to the scale of flow field. The fourth group is Abutment Flow distribution, which is the discharge per unit width in the approach and contracted sections. The fifth group is Scour and Geotechnical Failure, which is the scour that leads to the slope instability which is difficult to model in the laboratory.
The five groups listed above include almost all the variables in the local scour estimation formulae around bridge abutments. However, in the northern areas, ice cover is an issue because it can stay as long as 5 months on some rivers. Ice cover can result in many problems such as ice jamming, flooding, restricting the generation of hydro-power, block river navigation and affect the ecosystem balance (Hicks, 2009). Moreover, ice cover can also significantly change the flow field and change the flow properties around bridge foundations, such as velocity profile, bed shear stress distribution, mixing properties, and sediment transport (Lau and Krishnappan, 1985). Ettema et al. (2000) developed a method to estimate the sediment transport in ice covered channels. Sui et al. (2000) derived interrelationships of
1 PhD, Environmental Engineering Program, University of Northern British Columbia, Prince George, Canada. 2 PhD Candidate, Environmental Engineering Program, University of Northern British Columbia, Prince George, Canada. 3* Prof., Environmental Engineering Program, University of Northern British Columbia, Prince George, Canada. Corresponding
author, E-mail: [email protected]. Note: The original manuscript of this paper was received in Apr. 2013. The revised version was received in Sept. 2014. Discussion
open until Jan. 2016.
- 40 - International Journal of Sediment Research, Vol. 30, No. 1, 2015, pp. 39–47
suspended sediment concentrations and riverbed deformation under ice cover in Hequ Reach of Yellow River. Some other researches on the sediment transport and scour under ice including: Ettema and Daly, 2004; Hains and Zabilansky, 2004; Wang et al. 2008. However, to date there is limited research on the local scour around bridge structures under ice cover (Ackermann et al., 2002; Hains 2004; Sui et al., 2009; Sui et al., 2010; Wu et al., 2014). To fill this gap, a series of experiments were conducted to find the parameter that can describe the ice cover impact on the scour depth. 2 Experimental setup
Based on the previous review of local scour around bridge abutments, flume experiments were designed to evaluate the impacts of ice cover on scour depth. The following three hypotheses were tested in this research.
Hypothesis 1: Shape factor of abutments Bridge abutments are designed in different sizes and shapes. The shape factor is important in abutment local scour
estimation. According the Melville (1992), the effect of shape can be expressed using a shape factor Ks. In open channels, the shape factor for square abutment is 1.0 and for semi-circular one is 0.75. The shape factor was examined under ice covered conditions.
Hypothesis 2: Non-uniform sediment Most of the existing work on local scour focuses on uniform sediments in small laboratory flumes with very few
studies that look at non-uniform sediments. However, a more practical problem for engineers is that natural riverbeds are normally non-uniform. Three non-uniform different sediments were used in this study to see the scour contour and sediment deposition. The maximum scour depths from different non-uniform sediments were also compared.
Hypothesis 3: Ice cover roughness impact Since the roughness of the ice cover impacts the velocity distribution in the water regime. In this research, two
different types of ice cover were created, namely smooth cover and rough cover. The maximum scour depths under different covers were compared. 2.1 Experimental design
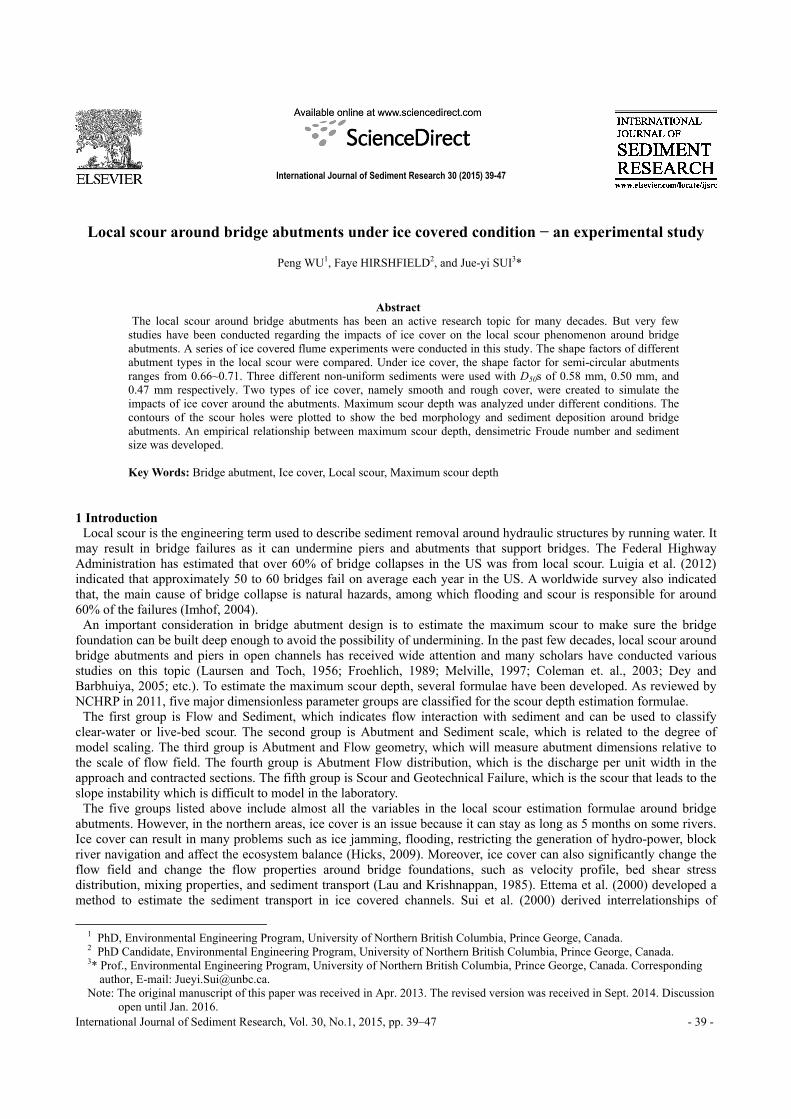
Experiments were carried out in an outdoor flume in 2012. The flume is 40 m long, 2 m wide and 1.3 m deep. The slope of the concrete bottom is 0.2%. Figure 1(a) shows the flume geometry and design. Two abutment models were made from Plexiglass to permit observation of the scour process during experiments. The dimensions of the abutment can be found in Fig. 1(b).
A holding tank with a volume of 90 m3 was created upstream of the flume. Two valves to adjust flow rate were connected to the holding tank. The flow depth can be adjusted by the tailgate at the end of the holding tank. Two sand boxes were created to simulate riverbed, with a distance 10.2 m from each other. Each sand box can have 30 cm depth of sediment (Fig. 2). Sand box 1 has a velocity range of 0.16~0.26 m s-1, while Sand box 2 has a velocity range of 0.14~0.21 m s-1.
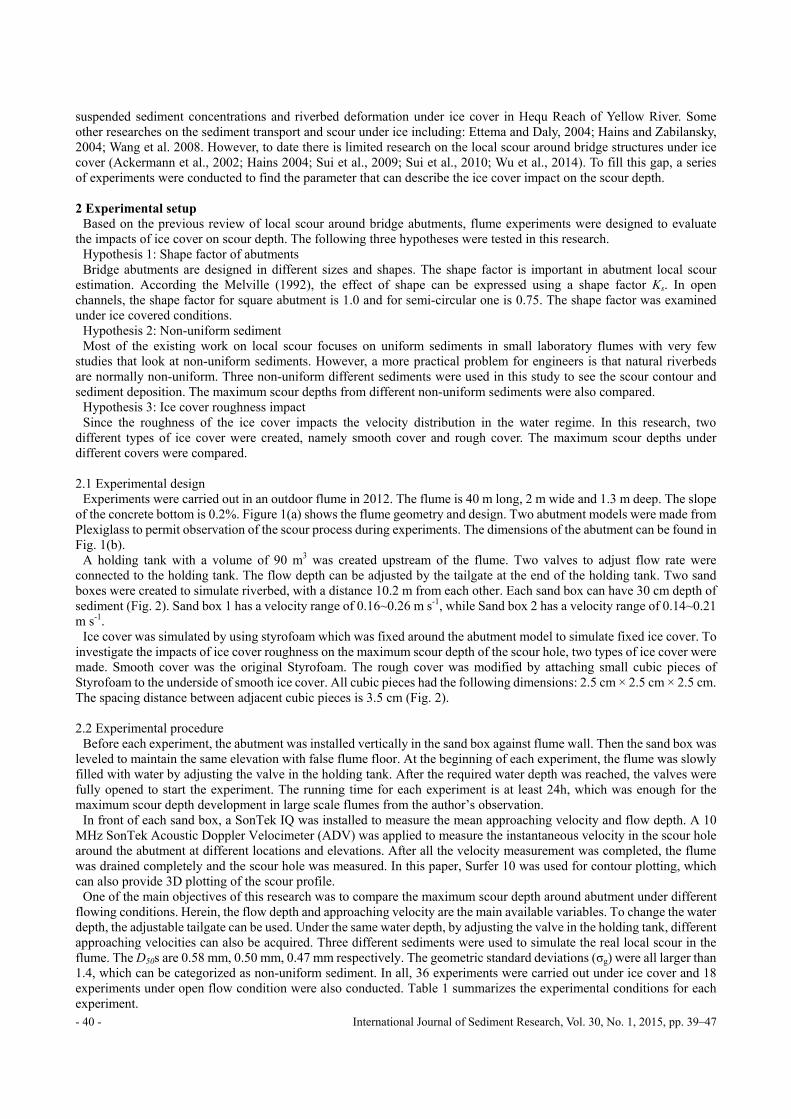
Ice cover was simulated by using styrofoam which was fixed around the abutment model to simulate fixed ice cover. To investigate the impacts of ice cover roughness on the maximum scour depth of the scour hole, two types of ice cover were made. Smooth cover was the original Styrofoam. The rough cover was modified by attaching small cubic pieces of Styrofoam to the underside of smooth ice cover. All cubic pieces had the following dimensions: 2.5 cm × 2.5 cm × 2.5 cm. The spacing distance between adjacent cubic pieces is 3.5 cm (Fig. 2). 2.2 Experimental procedure
Before each experiment, the abutment was installed vertically in the sand box against flume wall. Then the sand box was leveled to maintain the same elevation with false flume floor. At the beginning of each experiment, the flume was slowly filled with water by adjusting the valve in the holding tank. After the required water depth was reached, the valves were fully opened to start the experiment. The running time for each experiment is at least 24h, which was enough for the maximum scour depth development in large scale flumes from the author’s observation.
In front of each sand box, a SonTek IQ was installed to measure the mean approaching velocity and flow depth. A 10 MHz SonTek Acoustic Doppler Velocimeter (ADV) was applied to measure the instantaneous velocity in the scour hole around the abutment at different locations and elevations. After all the velocity measurement was completed, the flume was drained completely and the scour hole was measured. In this paper, Surfer 10 was used for contour plotting, which can also provide 3D plotting of the scour profile.
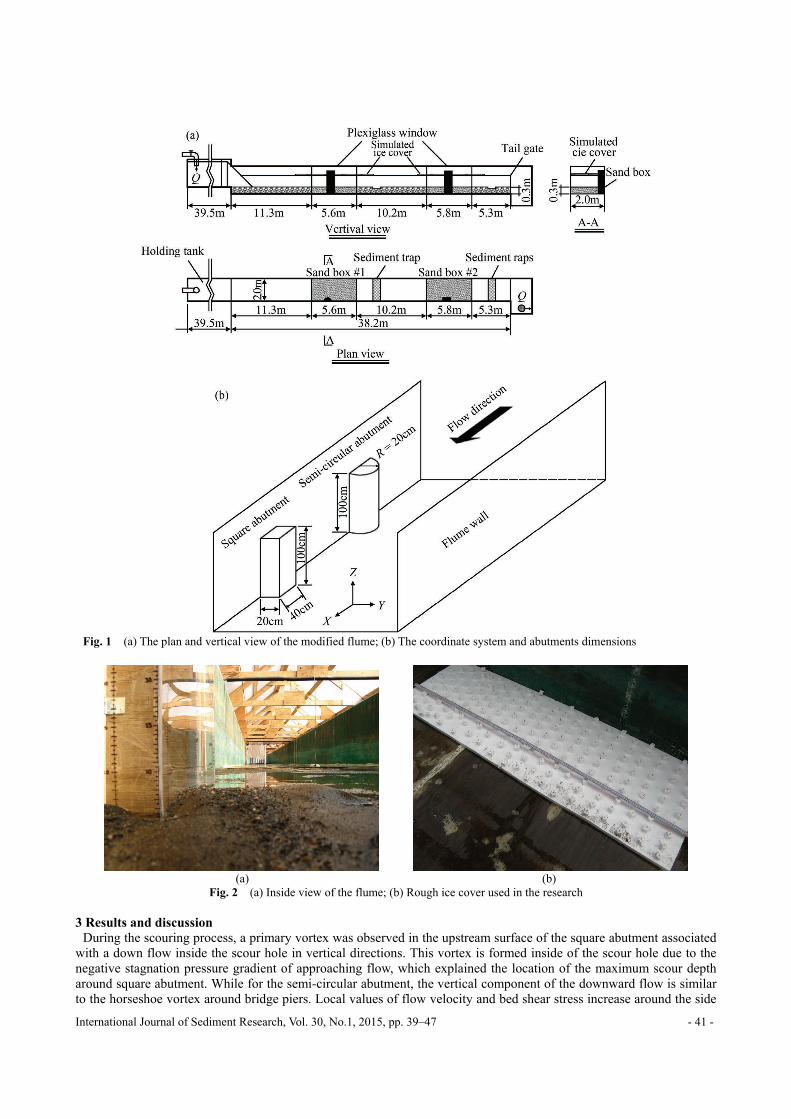
One of the main objectives of this research was to compare the maximum scour depth around abutment under different flowing conditions. Herein, the flow depth and approaching velocity are the main available variables. To change the water depth, the adjustable tailgate can be used. Under the same water depth, by adjusting the valve in the holding tank, different approaching velocities can also be acquired. Three different sediments were used to simulate the real local scour in the flume. The D50s are 0.58 mm, 0.50 mm, 0.47 mm respectively. The geometric standard deviations (σg) were all larger than 1.4, which can be categorized as non-uniform sediment. In all, 36 experiments were carried out under ice cover and 18 experiments under open flow condition were also conducted. Table 1 summarizes the experimental conditions for each experiment.
International Journal of Sediment Research, Vol. 30, No.1, 2015, pp. 39–47 - 41 -
Fig. 1 (a) The plan and vertical view of the modified flume; (b) The coordinate system and abutments dimensions
(a) (b)
Fig. 2 (a) Inside view of the flume; (b) Rough ice cover used in the research 3 Results and discussion
During the scouring process, a primary vortex was observed in the upstream surface of the square abutment associated with a down flow inside the scour hole in vertical directions. This vortex is formed inside of the scour hole due to the negative stagnation pressure gradient of approaching flow, which explained the location of the maximum scour depth around square abutment. While for the semi-circular abutment, the vertical component of the downward flow is similar to the horseshoe vortex around bridge piers. Local values of flow velocity and bed shear stress increase around the side
- 42 - International Journal of Sediment Research, Vol. 30, No. 1, 2015, pp. 39–47
of the abutment. As reported by Melville (1997), for circular bridge piers, the increases in bed shear velocity that cause the scour occurs at the side of the pier. A similar scouring location was found around the semi-circular abutment in the present research. The maximum scour depth located around 45 degrees from the flume wall in our cases.
Table 1 Summary of running conditions
Abutment type Cover
condition D50
(mm) Running time (h)
Flume width (m)
Water depth (m)
Approaching velocity (m s-1)
Square Open 0.58 24 2 0.07 0.26 Square Open 0.58 24 2 0.07 0.21 Square Open 0.58 24 2 0.19 0.21
Semicircular Open 0.58 24 2 0.07 0.21 Semicircular Open 0.58 24 2 0.19 0.23 Semicircular Open 0.58 24 2 0.07 0.26 Semicircular Smooth 0.58 24 2 0.07 0.23 Semicircular Smooth 0.58 24 2 0.19 0.20 Semicircular Smooth 0.58 24 2 0.07 0.20
Square Smooth 0.58 24 2 0.07 0.20 Square Smooth 0.58 24 2 0.19 0.16 Square Smooth 0.58 24 2 0.07 0.23 Square Rough 0.58 24 2 0.07 0.22 Square Rough 0.58 24 2 0.07 0.20 Square Rough 0.58 24 2 0.19 0.14
Semicircular Rough 0.58 24 2 0.07 0.20 Semicircular Rough 0.58 24 2 0.19 0.20 Semicircular Rough 0.58 24 2 0.07 0.22
Square Open 0.47 24 2 0.07 0.26 Square Open 0.47 24 2 0.07 0.21 Square Open 0.47 24 2 0.19 0.21
Semicircular Open 0.47 24 2 0.07 0.21 Semicircular Open 0.47 24 2 0.19 0.23 Semicircular Open 0.47 24 2 0.07 0.26 Semicircular Smooth 0.47 24 2 0.07 0.23 Semicircular Smooth 0.47 24 2 0.19 0.20 Semicircular Smooth 0.47 24 2 0.07 0.20
Square Smooth 0.47 24 2 0.07 0.20 Square Smooth 0.47 24 2 0.19 0.16 Square Smooth 0.47 24 2 0.07 0.23 Square Rough 0.47 24 2 0.07 0.22 Square Rough 0.47 24 2 0.07 0.20 Square Rough 0.47 24 2 0.19 0.14
Semicircular Rough 0.47 24 2 0.07 0.20 Semicircular Rough 0.47 24 2 0.19 0.20 Semicircular Rough 0.47 24 2 0.07 0.22
Square Open 0.50 24 2 0.07 0.26 Square Open 0.50 24 2 0.07 0.21 Square Open 0.50 24 2 0.19 0.21
Semicircular Open 0.50 24 2 0.07 0.21 Semicircular Open 0.50 24 2 0.19 0.23 Semicircular Open 0.50 24 2 0.07 0.26 Semicircular Smooth 0.50 24 2 0.07 0.23 Semicircular Smooth 0.50 24 2 0.19 0.20 Semicircular Smooth 0.50 24 2 0.07 0.20
Square Smooth 0.50 24 2 0.07 0.20 Square Smooth 0.50 24 2 0.19 0.16 Square Smooth 0.50 24 2 0.07 0.23 Square Rough 0.50 24 2 0.07 0.22 Square Rough 0.50 24 2 0.07 0.20 Square Rough 0.50 24 2 0.19 0.14
Semicircular Rough 0.50 24 2 0.07 0.20 Semicircular Rough 0.50 24 2 0.19 0.20 Semicircular Rough 0.50 24 2 0.07 0.22
International Journal of Sediment Research, Vol. 30, No.1, 2015, pp. 39–47 - 43 -
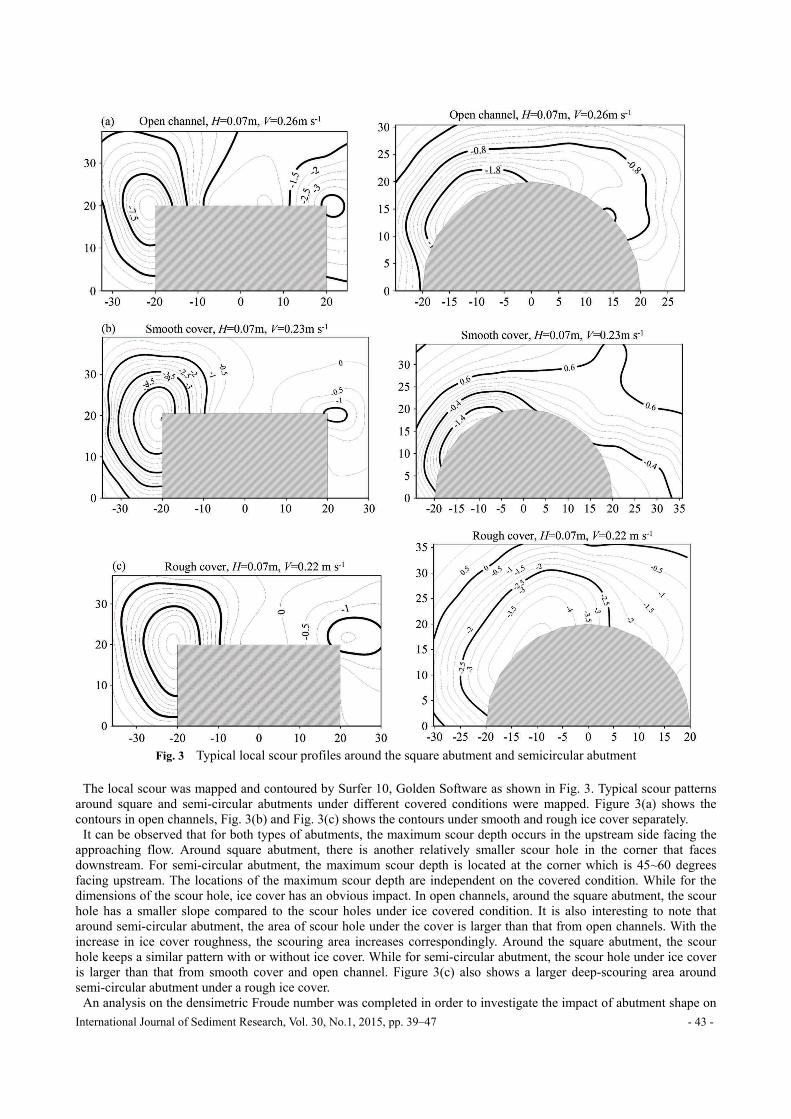
Fig. 3 Typical local scour profiles around the square abutment and semicircular abutment
The local scour was mapped and contoured by Surfer 10, Golden Software as shown in Fig. 3. Typical scour patterns
around square and semi-circular abutments under different covered conditions were mapped. Figure 3(a) shows the contours in open channels, Fig. 3(b) and Fig. 3(c) shows the contours under smooth and rough ice cover separately.
It can be observed that for both types of abutments, the maximum scour depth occurs in the upstream side facing the approaching flow. Around square abutment, there is another relatively smaller scour hole in the corner that faces downstream. For semi-circular abutment, the maximum scour depth is located at the corner which is 45~60 degrees facing upstream. The locations of the maximum scour depth are independent on the covered condition. While for the dimensions of the scour hole, ice cover has an obvious impact. In open channels, around the square abutment, the scour hole has a smaller slope compared to the scour holes under ice covered condition. It is also interesting to note that around semi-circular abutment, the area of scour hole under the cover is larger than that from open channels. With the increase in ice cover roughness, the scouring area increases correspondingly. Around the square abutment, the scour hole keeps a similar pattern with or without ice cover. While for semi-circular abutment, the scour hole under ice cover is larger than that from smooth cover and open channel. Figure 3(c) also shows a larger deep-scouring area around semi-circular abutment under a rough ice cover.
An analysis on the densimetric Froude number was completed in order to investigate the impact of abutment shape on
- 44 - International Journal of Sediment Research, Vol. 30, No. 1, 2015, pp. 39–47
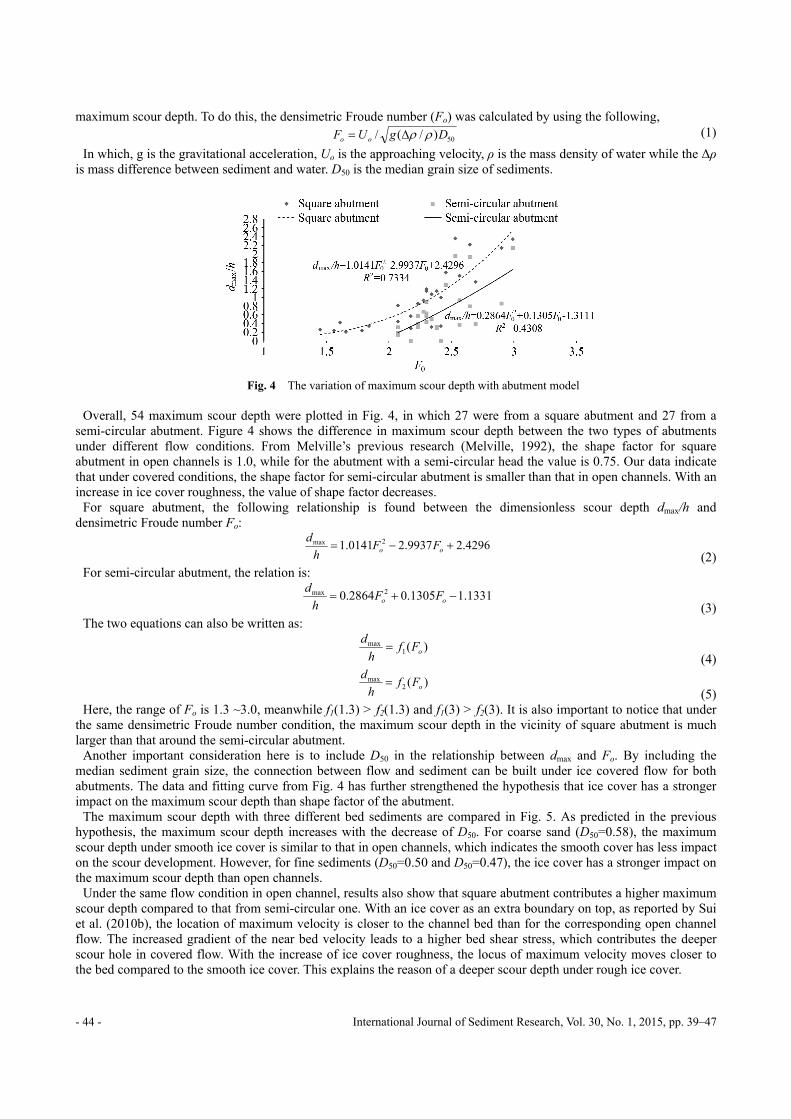
maximum scour depth. To do this, the densimetric Froude number (Fo) was calculated by using the following,
50)/(/ DgUF oo (1)
In which, g is the gravitational acceleration, Uo is the approaching velocity, ρ is the mass density of water while the Δρ is mass difference between sediment and water. D50 is the median grain size of sediments.
Fig. 4 The variation of maximum scour depth with abutment model
Overall, 54 maximum scour depth were plotted in Fig. 4, in which 27 were from a square abutment and 27 from a
semi-circular abutment. Figure 4 shows the difference in maximum scour depth between the two types of abutments under different flow conditions. From Melville’s previous research (Melville, 1992), the shape factor for square abutment in open channels is 1.0, while for the abutment with a semi-circular head the value is 0.75. Our data indicate that under covered conditions, the shape factor for semi-circular abutment is smaller than that in open channels. With an increase in ice cover roughness, the value of shape factor decreases.
For square abutment, the following relationship is found between the dimensionless scour depth dmax/h and densimetric Froude number Fo:
4296.29937.20141.1 2max oo FFh
d
(2) For semi-circular abutment, the relation is:
1331.11305.02864.0 2max oo FFh
d
(3) The two equations can also be written as:
)(1max
oFfh
d
(4)
)(2max
oFfh
d
(5) Here, the range of Fo is 1.3 ~3.0, meanwhile f1(1.3) > f2(1.3) and f1(3) > f2(3). It is also important to notice that under
the same densimetric Froude number condition, the maximum scour depth in the vicinity of square abutment is much larger than that around the semi-circular abutment.
Another important consideration here is to include D50 in the relationship between dmax and Fo. By including the median sediment grain size, the connection between flow and sediment can be built under ice covered flow for both abutments. The data and fitting curve from Fig. 4 has further strengthened the hypothesis that ice cover has a stronger impact on the maximum scour depth than shape factor of the abutment.
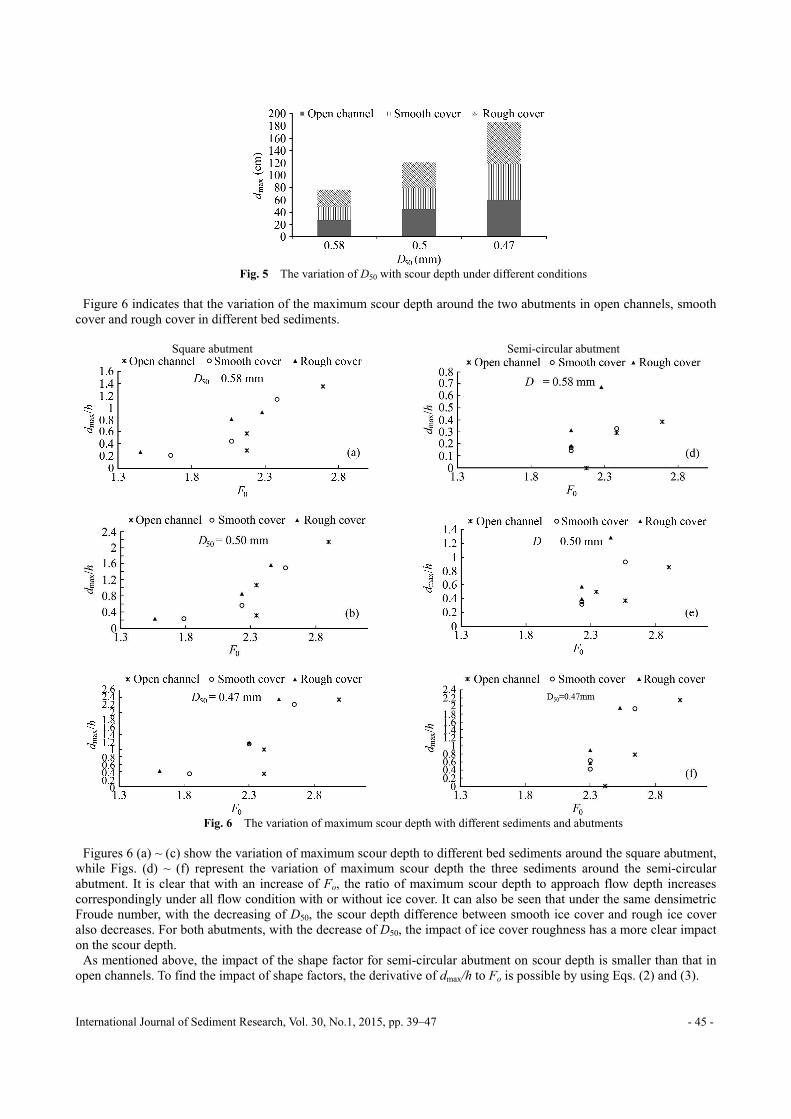
The maximum scour depth with three different bed sediments are compared in Fig. 5. As predicted in the previous hypothesis, the maximum scour depth increases with the decrease of D50. For coarse sand (D50=0.58), the maximum scour depth under smooth ice cover is similar to that in open channels, which indicates the smooth cover has less impact on the scour development. However, for fine sediments (D50=0.50 and D50=0.47), the ice cover has a stronger impact on the maximum scour depth than open channels.
Under the same flow condition in open channel, results also show that square abutment contributes a higher maximum scour depth compared to that from semi-circular one. With an ice cover as an extra boundary on top, as reported by Sui et al. (2010b), the location of maximum velocity is closer to the channel bed than for the corresponding open channel flow. The increased gradient of the near bed velocity leads to a higher bed shear stress, which contributes the deeper scour hole in covered flow. With the increase of ice cover roughness, the locus of maximum velocity moves closer to the bed compared to the smooth ice cover. This explains the reason of a deeper scour depth under rough ice cover.
International Journal of Sediment Research, Vol. 30, No.1, 2015, pp. 39–47 - 45 -
Fig. 5 The variation of D50 with scour depth under different conditions
Figure 6 indicates that the variation of the maximum scour depth around the two abutments in open channels, smooth
cover and rough cover in different bed sediments.
Square abutment Semi-circular abutment
Fig. 6 The variation of maximum scour depth with different sediments and abutments
Figures 6 (a) ~ (c) show the variation of maximum scour depth to different bed sediments around the square abutment,
while Figs. (d) ~ (f) represent the variation of maximum scour depth the three sediments around the semi-circular abutment. It is clear that with an increase of Fo, the ratio of maximum scour depth to approach flow depth increases correspondingly under all flow condition with or without ice cover. It can also be seen that under the same densimetric Froude number, with the decreasing of D50, the scour depth difference between smooth ice cover and rough ice cover also decreases. For both abutments, with the decrease of D50, the impact of ice cover roughness has a more clear impact on the scour depth.
As mentioned above, the impact of the shape factor for semi-circular abutment on scour depth is smaller than that in open channels. To find the impact of shape factors, the derivative of dmax/h to Fo is possible by using Eqs. (2) and (3).
- 46 - International Journal of Sediment Research, Vol. 30, No. 1, 2015, pp. 39–47
9937.20282.2)'( max oFh
d
(6)
1305.05728.0)'( max oFh
d
(7) By making Eq. (6) equals to Eq. (7), it is found that when Fo =2.11, the difference between square abutment and
semi-circular abutment is the smallest. At this point, the shape factor for semi-circular abutment is 0.66. From the calculation, the shape factor for semi-circular abutment has a range from 0.66 ~0.71.
The following multi relationship can be used in to describe the impact of shape factor on maximum scour depth:
),(maxso KFf
h
d
(8) In which, Fo is the densimetric Froude number and Ks is the shape factor for different abutments. For square abutment,
the shape factor has a value of 1, which is same to that in open channels. However, for the semi-circular abutment under ice covered condition, the shape factor will be around 0.66~0.71, which is smaller than that in open channels.
The presence of an ice cover induces a redistribution of the highest velocities compared with the open channel flow around bridge abutments, and thus leading to a higher available energy for the scouring phenomenon. The relationship in Fig. 7 also shows that with an increase in D50, the ratio of maximum scour depth to flow depth decreases. While under the same flow and sediment condition, the ice cover can result in a deeper scour depth. By increasing the densimetric Froude number, the ratio increases correspondingly under open channel, smooth cover and rough cover. But compared to the ratio in open channels, the rough cover has the highest value and then smooth cover has a higher one.
Fig. 7 The variation of maximum scour depth with different covered conditions
The experimental research conducted by Munteanu and Frenette (2010) showed that, an increase up to 55% of
maximum scour depth can be reached around the bridge pier under ice covered conditions. From our study, for bridge abutments under rough ice cover, the increase on maximum scour depth is around 30% ~ 40% for all the sediments. While for the smooth cover, under the same flow condition, the increase of maximum scour depth is less than 30%. From the authors’ understanding, the sediment transport under ice cover depends on the flow re-distribution due to ice cover. A rough ice cover can cause more turbulence compared to the smooth ice cover and open channel. 4 Conclusions
Ice cover plays an important role in the development of local scour hole around bridge abutments. Experiments have been conducted to study the impact of ice cover on bridge abutments with solid foundations in the soil. Two types commonly used abutments were built, namely semi-circular and square abutments. For three non-uniform sediments, the profiles of local scour around abutments were plotted. By using Buckingham Pi theorem for dimensional analysis, the densimetric Froude number was used as one parameter to investigate the impact of shape factor and ice cover roughness on maximum scour depth around abutments. Results indicate that the impact of shape factor for semi-circular abutments on maximum scour depth is smaller in covered conditions than that in open channels. The range of shape factor is between 0.66 and 0.71. Additionally, ice cover roughness also has a more pronounced impact on the maximum scour depth. However, due to the limitation of experimental data, further experiments can lead to a higher degree of certainty regarding the influence of shape factor on scour for semi-circular abutment under ice covered conditions. Future work will include: flow velocity analysis in the vicinity of bridge abutments under ice cover and analysis of the armor layer. Acknowledgement
Funding provided by the UNBC Graduate Research Award and Natural Sciences and Engineering Research Council of
International Journal of Sediment Research, Vol. 30, No.1, 2015, pp. 39–47 - 47 -
Canada (NSERC) is appreciated. The experiments for this study were conducted at the Quesnel River Research Center (QRRC), Likely, British Columbia, Canada. The authors are grateful for the support provided by the staff. References Ackermann N. L., Shen H. T., and Olsson P. 2002, Local scour around circular piers under ice covers. Proceeding of the 16th IAHR
International Symposium on Ice, International Association of Hydraulic Engineering Research, Dunedin, New Zealand. Coleman S. E., Lauchlan C. S., and Melville B. W. 2003, Clear water scour development at bridge abutments. Journal of Hydraulic
Research, Vol. 41, No. 5, pp. 521–531. Dey S. and Barbhuiya A. K. 2005, Time variation of scour at abutments. Journal of Hydraulic Engineering, ASCE, Vol. 131, No. 1,
pp. 11–23. Ettema R. and Daly S. F. 2004, Sediment transport under ice. ERDC/CRREL TR-04-20. Cold Regions Research and Engineering
Laboratory, US Army Corps of Engineers. Ettema R., Braileanu F., and Muste M. 2000, Method for estimating sediment transport in ice covered channels. Journal of Cold
Regions Engineering, Vol. 14, No. 3, pp. 130–144. Froehlich D. C. 1989, Local scour at bridge abutments. Proc. Natl. Conf. Hydraulic Engineering, ASCE, pp. 13–18. Hains D. B. 2004, An experimental study of ice effects on scour at bridge piers. PhD Dissertation, Lehigh University, Bethlehem,
PA. Hains D. and Zabilansky L. 2004, Laboratory test of scour under ice: Data and preliminary results. ERDC/CRREL TR-04-09. Cold
Regions Research and Engineering Laboratory, US Army Corps of Engineers. Hicks F. 2009, An overview of river ice problems: CRIPE 07 guest editorial. Cold Regions Science and Technology, 55: pp.
175-185. Imhof D. 2004. Risk assessment of existing bridge structures. PhD thesis, University of Cambridge, UK. Lau Y. L. and Krishnappan B. G. 1985, Sediment transport under ice cover. Journal of Hydraulic Engineering, ASCE, Vol. 111, No.
6, pp. 934–950. Laursen E. M. and Toch A. 1956, Scour around bridge piers and abutments. Iowa Highway Research Board Bulletin, No. 4. Luigia B., Paolo P., and Giuliano D. B. 2012, Bridge pier scour: a review of process, measurements and estimates. Environmental
Engineering and Management Journal, Vol. 11, No. 5. Munteanu A. and Frenette R. 2010, Scouring around a cylindrical bridge pier under ice covered flow condition-experimental analysis,
R V Anderson Associates Limited and Oxand report. Melville B. W. 1992, Local scour at bridge abutments. Journal of Hydraulic Engineering, ASCE, Vol. 118, No. 4, pp. 615-631. Melville B. W. 1997, Pier and abutment scour: Integrated approach. Journal of Hydraulic Engineering, ASCE, Vol. 123, No. 2,
pp.125–136. NCHRP Web-only Document 181, 2011, Evaluation of Bridge-Scour Research: Abutment and Contraction Scour Processes and
Prediction. NCHRP Project 24–27(02). Sui J., Wang D., and Karney B. 2000, Suspended sediment concentration and deformation of riverbed an a frazil jammed reach.
Canadian Journal of Civil Engineering, Vol. 27, pp. 1120–1129. Sui J., Faruque M. A. A., and Balanchandar R. 2009, Local scour caused by submerged square jets under model ice cover. Journal of
Hydraulic Engineering, ASCE, Vol. 135, No. 4, pp. 316–319. Sui J., Afzalimehe H., Samani A. K., and Meherani M. 2010, Clear-water scour around semi-elliptical abutments with armored beds.
International Journal of Sediment Research, Vol. 25, No. 3, pp. 233–244. Wang J., Sui J., and Karney B. 2008, Incipient motion of non-cohesive sediment under ice cover – an experimental study. Journal of
Hydrodynamics, Vol. 20, No. 1, pp. 177–124. Wu P., Hirshfield F., and Sui J. 2014, Further studies of incipient motion and shear stress on local scour around bridge abutment
under ice-cover. Canadian Journal of Civil Engineering, CJCE-2013-0552, published on line Sept. 9 2014.


![Experimental Investigation of Abutment Scour in … Shoubra/Civil...literature to estimate the equilibrium scour at bridge abutments [1, 5-14]. Clear water abutment scour occurs in](https://img.pdfslide.net/doc/110x75/5f2cefc419ee8a00b27e3fad/experimental-investigation-of-abutment-scour-in-shoubracivil-literature-to-estimate.jpg)