Embed Size (px)
Citation preview
Local site symmetry of Sm3þ in sol–gel derived α0-Sr2SiO4: Probedby emission and fluorescence lifetime spectroscopy
Santosh K. Gupta n, N. Pathak, S.K. Thulasidas, V. NatarajanRadiochemistry Division, Bhabha Atomic Research Centre, Trombay, Mumbai 400085, India
a r t i c l e i n f o
Article history:Received 27 August 2014Received in revised form1 October 2014Accepted 6 October 2014
Keywords:Sm3þ
Sr2SiO4
Photo-luminescenceSymmetryStructure
a b s t r a c t
Trivalent samarium-doped strontium silicate (Sr2SiO4) phosphors were prepared by sol–gel synthesisusing tetra ethyl orthosilicate (TEOS) as precursor. The synthesis temperature could be brought down to600 1C for the formation of a single phase sample. The emission and excitation spectra, and decay curveswere employed to study the luminescence properties. The calcined powders of the Sm3þ ions doped inthe Sr2SiO4 emit reddish orange light. In our present study, the 4G5/2-
6H5/2 (MD) transition of Sm3þ
ions is less intense than 4G5/2-6H9/2 (ED) transition. This indicates that Sm3þ ions preferentially occupy
asymmetric site in α-Sr2SiO4. Fluorescence life time measurement has shown monoexponential behaviorfor Sm3þ in strontium silicate with lifetime value of 2.23 ms. Based on lifetime and emission spectra, itcan be inferred that Sm3þ occupies 9-coordinated Sr2þ site in strontium silicate. Based on stark splittingpattern it was inferred that site symmetry around Sm3þ is C3v which further justifies it's occupancy in9-coordinated sites. It was observed that, the emission intensity of Sm3þ increases with the increase inconcentration initially, reaching maxima at 1.0 mol % and then decreases with the increasingconcentration due to concentration quenching. At higher concentrations (x40.01), however, theobserved decay curves were bi-exponential.
& 2014 Elsevier B.V. All rights reserved.
1. Introduction
Among the materials currently evaluated as host for lanthanideions, in this work our attention was focused on alkaline earthsilicates. These materials are characterized by good transmissionproperties in the visible part of the electromagnetic spectrum andby relatively low phonon energies. They can be efficiently dopedwith lanthanide ions, due to the similarity between the ionicradius of the alkaline earth and the lanthanide ions. Thereforethese materials are prospective high efficiency luminophors andare attracting increasing interest for photonics and optoelectronicsapplications. Indeed alkaline earth silicates are resistant to manychemicals and air exposure and can also be grown with low-costtechniques.
Oxide-based hosts have received considerable attention for usein flat-panel displays due to their luminescent characteristics,stability in high vacuum, and the absence of corrosive gas emissionunder electron bombardment, as compared to currently usedsulfide-based phosphors [1]. Therefore, oxide-based phosphorsare likely to emerge as the choice for field emission diodes (FED)
green or red phosphors. Among these, strontium silicate is anexcellent matrix due to its stable crystal structure, good mechan-ical strength and high thermal stability provided by the tetrahe-dral silicate (SiO4)2� group [2]. Sr2SiO4 has attracted interest dueto its special structural features and potential application indeveloping white light-emitting-diodes (LEDs), because GaN(400 nm chip) coated with Sr2SiO4: Eu2þ exhibits better luminousefficiency than that of industrially available products such asInGaN (460 nm chip) coated with YAG: Ce [3]. The optical bandgap of alkaline earth silicate is in the range of 4–7 eV and thereforethese materials are characterized by good transmission propertiesin the visible part of the electromagnetic spectrum.
When an active dopant is introduced into structures withmultiple sites (A and B), their optical and magnetic propertiesare dramatically changed depending on its distribution in theceramic. Studies of dopant ion distribution among different siteshave attracted much attention because they may allow betterunderstanding of the correlations between structure and proper-ties such as color, magnetic behavior, catalytic activity, and opticalproperties, etc., which are strongly dependent on the occupationof these two sites by metals.
Eu3þ is a well known structural probe [2,4–7] because of itsnon-degenerate ground state 7F0 and non-overlapping 2Sþ1LJmultiplets. Local environment of Eu3þ and Dy3þ in Sr2SiO4 has
Contents lists available at ScienceDirect
journal homepage: www.elsevier.com/locate/jlumin
Journal of Luminescence
http://dx.doi.org/10.1016/j.jlumin.2014.10.0090022-2313/& 2014 Elsevier B.V. All rights reserved.
n Corresponding author. Tel.: þ91 22 25590636; fax: þ91 22 25505151.E-mail address: [email protected] (S.K. Gupta).
Please cite this article as: S.K. Gupta, et al., J. Lumin. (2014), http://dx.doi.org/10.1016/j.jlumin.2014.10.009i
Journal of Luminescence ∎ (∎∎∎∎) ∎∎∎–∎∎∎
been reported by our group in our previous work [2,8]. Due totheir sharp emission lines; the Sm3þ ions could also be used as aluminescent probe [9].
Although reports do exist in the literature on luminescenceproperties of Sm3þ ions in Sr2SiO4 [10,11], none of them explainthe site occupancy of Sm3þ and their related effect on lumines-cence properties in these matrices. TRES is extensively used tounderstand such phenomena. In Sr2SiO4, there are two types ofsites for Sr2þ , one is a more symmetric 10 coordinated site Sr(1) and the other is a less symmetric 9 coordinated site Sr (2). Wehave also tried to investigate the effect of concentration of Sm3þ
and annealing temperature on its luminescence properties.
2. Experimental results
2.1. Synthesis
All the chemicals used in the sample preparation were of ARgrade and procured from Sigma-Aldrich. The alkaline earth silicatesamples were prepared via a sol–gel route using tetraethylorthosilicate (TEOS) and strontium nitrate adopting the standardprocedure [12].
2.2. Instrumentation
The phase purity of the prepared phosphors were confirmed byX-ray diffraction (XRD). The measurements were carried out on aSTOE X-ray diffractometer equipped with Ni filter, scintillationcounter and graphite monochromator. The diffraction patterns wereobtained using monochromatic Cu-Kα radiation (λ¼1.5406 Å) keep-ing the scan rate at 1 s/step in the scattering angle range (2θ) of101–601. The Kα2 reflections were removed by a stripping procedureto obtain accurate lattice constants.
PL data were recorded on an Edinburgh CD-920 unit equippedwith a Xe flash lamp as the excitation source. The data acquisitionand analysis were done by F-900 software provided by EdinburghAnalytical Instruments, UK.
3. Results and discussion
3.1. Phase purity: X-ray diffraction
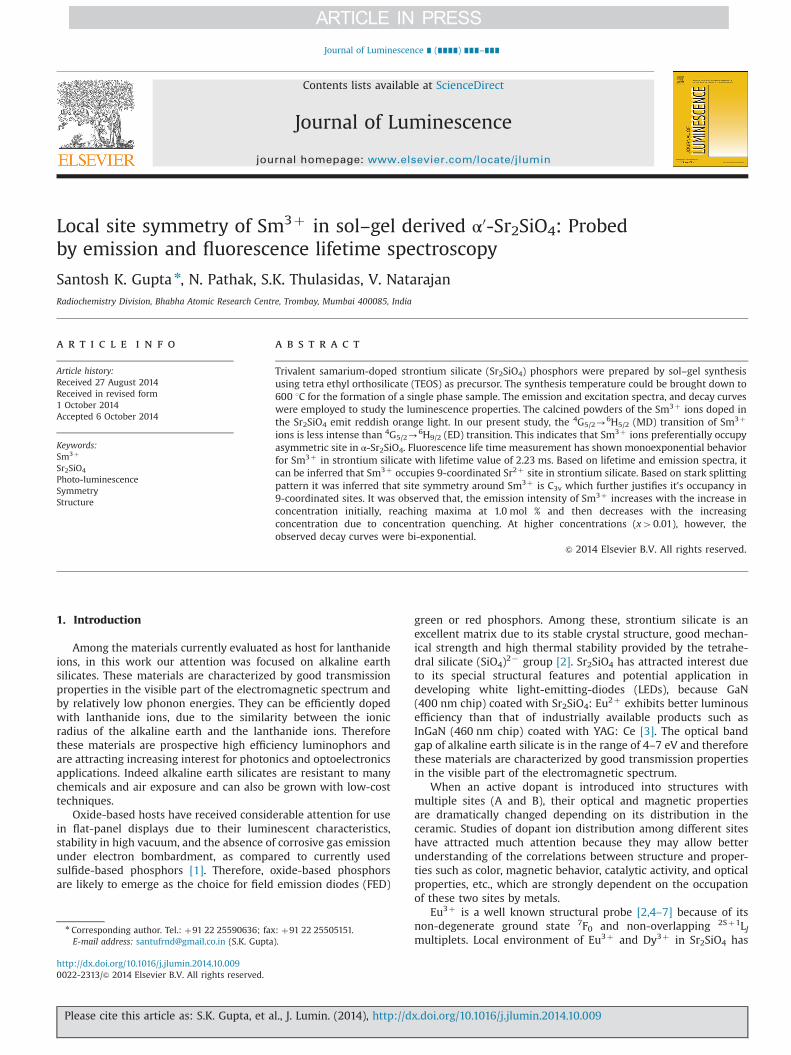
Fig. 1 shows the PXRD patterns of undoped and 0.5 mol% Sm3þ
doped Sr2SiO4. The PXRD patterns were in agreement with standardJCPDS no. 39–1256 corresponding to orthorhombic phase. Furtherno additional peaks can be found in doped samples. Since ionicradius of Sm3þ was relatively less when compared to Sr, it wasexpected that the Sm3þ ion can easily enter the Sr lattice withoutdisturbing the crystal structure. It is natural to assume that Sm3þ
occupies the Sr2þ position though cation vacancies are introducedin vicinity to ensure local charge compensation. A structural detailof Sr2SiO4 has been given in our previous work [10].
3.2. Photoluminescence excitation and emission spectroscopy
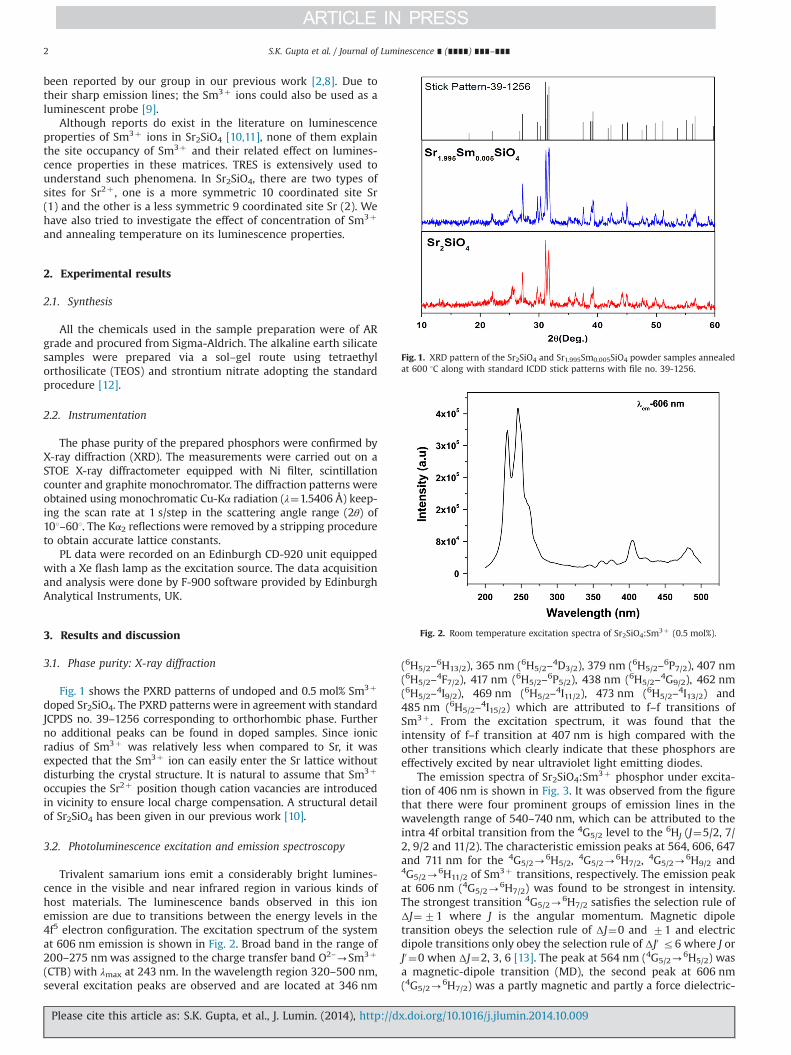
Trivalent samarium ions emit a considerably bright lumines-cence in the visible and near infrared region in various kinds ofhost materials. The luminescence bands observed in this ionemission are due to transitions between the energy levels in the4f5 electron configuration. The excitation spectrum of the systemat 606 nm emission is shown in Fig. 2. Broad band in the range of200–275 nm was assigned to the charge transfer band O2–-Sm3þ
(CTB) with λmax at 243 nm. In the wavelength region 320–500 nm,several excitation peaks are observed and are located at 346 nm
(6H5/2–6H13/2), 365 nm (6H5/2–
4D3/2), 379 nm (6H5/2–6P7/2), 407 nm
(6H5/2–4F7/2), 417 nm (6H5/2–
6P5/2), 438 nm (6H5/2–4G9/2), 462 nm
(6H5/2–4I9/2), 469 nm (6H5/2–
4I11/2), 473 nm (6H5/2–4I13/2) and
485 nm (6H5/2–4I15/2) which are attributed to f–f transitions of
Sm3þ . From the excitation spectrum, it was found that theintensity of f–f transition at 407 nm is high compared with theother transitions which clearly indicate that these phosphors areeffectively excited by near ultraviolet light emitting diodes.
The emission spectra of Sr2SiO4:Sm3þ phosphor under excita-tion of 406 nm is shown in Fig. 3. It was observed from the figurethat there were four prominent groups of emission lines in thewavelength range of 540–740 nm, which can be attributed to theintra 4f orbital transition from the 4G5/2 level to the 6HJ (J¼5/2, 7/2, 9/2 and 11/2). The characteristic emission peaks at 564, 606, 647and 711 nm for the 4G5/2-
6H5/2, 4G5/2-6H7/2, 4G5/2-
6H9/2 and4G5/2-
6H11/2 of Sm3þ transitions, respectively. The emission peakat 606 nm (4G5/2-
6H7/2) was found to be strongest in intensity.The strongest transition 4G5/2-
6H7/2 satisfies the selection rule ofΔJ¼71 where J is the angular momentum. Magnetic dipoletransition obeys the selection rule of ΔJ¼0 and 71 and electricdipole transitions only obey the selection rule of ΔJ0 r6 where J orJ0 ¼0 when ΔJ¼2, 3, 6 [13]. The peak at 564 nm (4G5/2-
6H5/2) wasa magnetic-dipole transition (MD), the second peak at 606 nm(4G5/2-
6H7/2) was a partly magnetic and partly a force dielectric-
Fig. 1. XRD pattern of the Sr2SiO4 and Sr1.995Sm0.005SiO4 powder samples annealedat 600 1C along with standard ICDD stick patterns with file no. 39-1256.
Fig. 2. Room temperature excitation spectra of Sr2SiO4:Sm3þ (0.5 mol%).
S.K. Gupta et al. / Journal of Luminescence ∎ (∎∎∎∎) ∎∎∎–∎∎∎2
Please cite this article as: S.K. Gupta, et al., J. Lumin. (2014), http://dx.doi.org/10.1016/j.jlumin.2014.10.009i
dipole transition, and the peak at 647 nm (4G5/2-6H9/2) was
purely electric dipole transition (ED) which was sensitive to thecrystal field [14].
Generally, the intensity ratio of ED and MD (Asymmetry ratio,A21) transitions was used to measure the symmetry of the localenvironment of the trivalent 4f ions [15] which was sensitive tothe nature of the Sm3þ ions environment in the host lattice. Thisgives a measure of the degree of distortion from inversionsymmetry of the local environment surrounding the Sm3þ ionsin the host matrix. Greater the intensity of the ED transition, themore the asymmetry nature. In our present study, the 4G5/2-
6H9/2
(ED) transitions of Sm3þ ions were more intense than 4G5/2-6H5/2
(MD) transition, indicating the asymmetric nature of Sm3þ ions inSr2SiO4 host matrix. Consider the ratio between the intensities ofthe electric dipole transition and magnetic dipole transition. Thelocal symmetry was measured with the relative intensities of thesetwo transitions. The larger value of this ratio means more distor-tion from the inversion symmetry. The obtained values for A21
were found to be 1.18 (4 1), which means that the Sm3þ ionswere embedded in highly asymmetric environment.
Average ionic radius of Sm3þ is around 114 pm, which is closerto 9-coordinated Sr2þ (131 pm) and unfavorable geometry in10-coordination (136 pm) causes most of the Sm3þ to occupy9-coordinated Sr2þ sites in strontium silicate. Ionic size andcharge differences between Sm3þ and Sr2þ sites disturbs the localfield, where such disturbance is evidenced by the more intenseemission of 4G5/2-
6H9/2. It can be concluded that the 9-coordinated strontium polyhedra in host lattice are distorted andthere is a lack of inversion symmetry at the Sm3þ site.
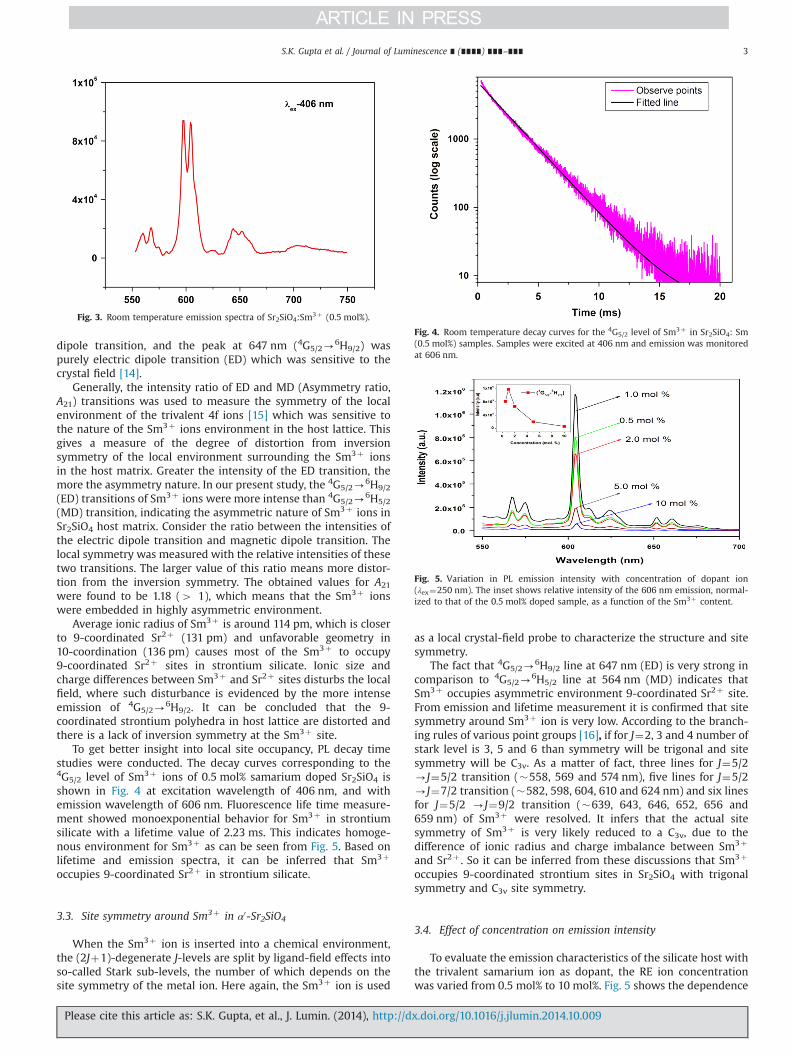
To get better insight into local site occupancy, PL decay timestudies were conducted. The decay curves corresponding to the4G5/2 level of Sm3þ ions of 0.5 mol% samarium doped Sr2SiO4 isshown in Fig. 4 at excitation wavelength of 406 nm, and withemission wavelength of 606 nm. Fluorescence life time measure-ment showed monoexponential behavior for Sm3þ in strontiumsilicate with a lifetime value of 2.23 ms. This indicates homoge-nous environment for Sm3þ as can be seen from Fig. 5. Based onlifetime and emission spectra, it can be inferred that Sm3þ
occupies 9-coordinated Sr2þ in strontium silicate.
3.3. Site symmetry around Sm3þ in α0-Sr2SiO4
When the Sm3þ ion is inserted into a chemical environment,the (2Jþ1)-degenerate J-levels are split by ligand-field effects intoso-called Stark sub-levels, the number of which depends on thesite symmetry of the metal ion. Here again, the Sm3þ ion is used
as a local crystal-field probe to characterize the structure and sitesymmetry.
The fact that 4G5/2-6H9/2 line at 647 nm (ED) is very strong in
comparison to 4G5/2-6H5/2 line at 564 nm (MD) indicates that
Sm3þ occupies asymmetric environment 9-coordinated Sr2þ site.From emission and lifetime measurement it is confirmed that sitesymmetry around Sm3þ ion is very low. According to the branch-ing rules of various point groups [16], if for J¼2, 3 and 4 number ofstark level is 3, 5 and 6 than symmetry will be trigonal and sitesymmetry will be C3v. As a matter of fact, three lines for J¼5/2-J¼5/2 transition (�558, 569 and 574 nm), five lines for J¼5/2-J¼7/2 transition (�582, 598, 604, 610 and 624 nm) and six linesfor J¼5/2 -J¼9/2 transition (�639, 643, 646, 652, 656 and659 nm) of Sm3þ were resolved. It infers that the actual sitesymmetry of Sm3þ is very likely reduced to a C3v, due to thedifference of ionic radius and charge imbalance between Sm3þ
and Sr2þ . So it can be inferred from these discussions that Sm3þ
occupies 9-coordinated strontium sites in Sr2SiO4 with trigonalsymmetry and C3v site symmetry.
3.4. Effect of concentration on emission intensity
To evaluate the emission characteristics of the silicate host withthe trivalent samarium ion as dopant, the RE ion concentrationwas varied from 0.5 mol% to 10 mol%. Fig. 5 shows the dependence
Fig. 3. Room temperature emission spectra of Sr2SiO4:Sm3þ (0.5 mol%).
Fig. 4. Room temperature decay curves for the 4G5/2 level of Sm3þ in Sr2SiO4: Sm(0.5 mol%) samples. Samples were excited at 406 nm and emission was monitoredat 606 nm.
Fig. 5. Variation in PL emission intensity with concentration of dopant ion(λex¼250 nm). The inset shows relative intensity of the 606 nm emission, normal-ized to that of the 0.5 mol% doped sample, as a function of the Sm3þ content.
S.K. Gupta et al. / Journal of Luminescence ∎ (∎∎∎∎) ∎∎∎–∎∎∎ 3
Please cite this article as: S.K. Gupta, et al., J. Lumin. (2014), http://dx.doi.org/10.1016/j.jlumin.2014.10.009i
of the PL emission intensity (obtained with λex¼250 nm) of therare earth ion with varying doping concentration.
It was observed that, the emission intensity of Sm3þ increaseswith the increase in concentration initially, reaching maxima at1.0 mol% and then decreases with the increasing concentrationdue to concentration quenching. Thus the optimum concentrationfor Sm3þ is 1.0 mol%. The concentration quenching might be dueto non-radiative energy transfer from one Sm3þ ion to anotherSm3þ ion. Non-radiative energy transfer takes place via twodifferent mechanisms (i) Forster resonance energy transfer (multi-pole–multipole interaction) and (ii) Dexter mechanism (exchangeinteraction).
Forster resonance energy transfer (FRET or FET) is a dynamicquenching mechanism, because energy transfer occurs when thedonor is in the excited state. FRET is based on classical dipole–dipole interactions between the transition dipoles of the donorand acceptor and is extremely dependent on the donor–acceptordistance, R, falling off at a rate of 1/R6. FRET also depends on thedonor–acceptor spectral overlap and the relative orientation of thedonor and acceptor transition dipole moments. FRET can typicallyoccur over distances up to 100 Å. Dexter (also known as exchangeor coalitional energy transfer) is another dynamic quenchingmechanism. Dexter energy transfer is a short-range phenomenon(r 10 Å) that decreases with e�R and depends on spatial overlapof donor and quencher molecular orbital's.
In many cases, the concentration quenching is due to energytransfer from one activator to another until an energy sink in thelattice is reached, which is related to the interaction between anactivator and another ion. For this reason, it is possible to obtainthe critical distance (Rc) from the concentration quenching data. Rcis the critical separation between donor (activator) and acceptor(quenching site), for which the nonradiative transfer rate equalsthe internal decay rate. Blasse [17] assumed that for the criticalconcentration the average shortest distance between nearestactivator ions is equal to the critical distance.
A rough estimation of the critical transfer distance (Rc) for energytransfer can be obtained using the relation given by Blasse [17].
RC ¼ 23V
4πNXC
� �1=3
ð1Þ
where V is the volume of the unit cell, XC the critical concentrationand N is the number of available crystallographic sites occupied bythe activator ions in the unit cell. Values of V and N for the crystallineSr2SiO4 (orthorhombic system with primitive lattice, One unit cell ofSr2SiO4 comprises of 4 formula units) are 391.2 Å3 and 8, respectively(ICDD card 39-1256). Considering XC ¼1% (0.01), critical energytransfer distance Rc in Sr2SiO4: Sm3þ phosphor was calculated to be21 Å. In this case, the Sm3þ–Sm3þ distance is larger than 10 Å. Thusthe exchange interactions are ruled out. Therefore, the electricmultipolar interaction is believed to be the only mode for the energytransfer among the Sm3þ ions in Sr2SiO4 phosphor.
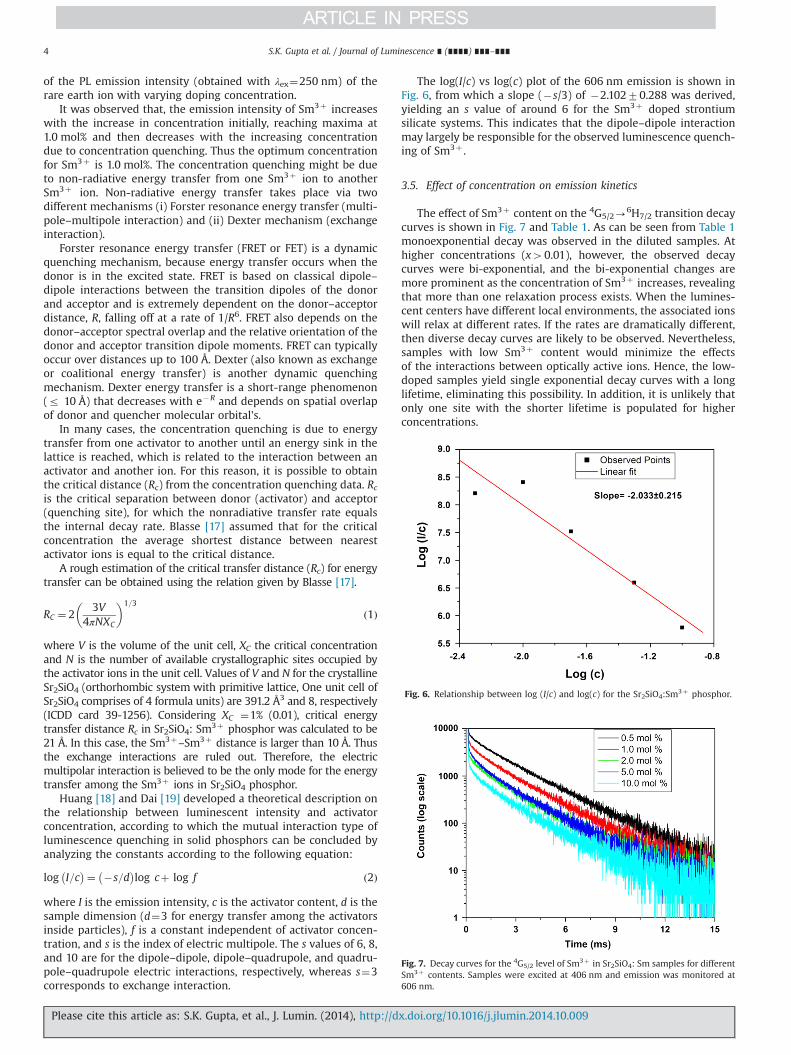
Huang [18] and Dai [19] developed a theoretical description onthe relationship between luminescent intensity and activatorconcentration, according to which the mutual interaction type ofluminescence quenching in solid phosphors can be concluded byanalyzing the constants according to the following equation:
log I=c� �¼ �s=d
� �log cþ log f ð2Þ
where I is the emission intensity, c is the activator content, d is thesample dimension (d¼3 for energy transfer among the activatorsinside particles), f is a constant independent of activator concen-tration, and s is the index of electric multipole. The s values of 6, 8,and 10 are for the dipole–dipole, dipole–quadrupole, and quadru-pole–quadrupole electric interactions, respectively, whereas s¼3corresponds to exchange interaction.
The log(I/c) vs log(c) plot of the 606 nm emission is shown inFig. 6, from which a slope (�s/3) of �2.10270.288 was derived,yielding an s value of around 6 for the Sm3þ doped strontiumsilicate systems. This indicates that the dipole–dipole interactionmay largely be responsible for the observed luminescence quench-ing of Sm3þ .
3.5. Effect of concentration on emission kinetics
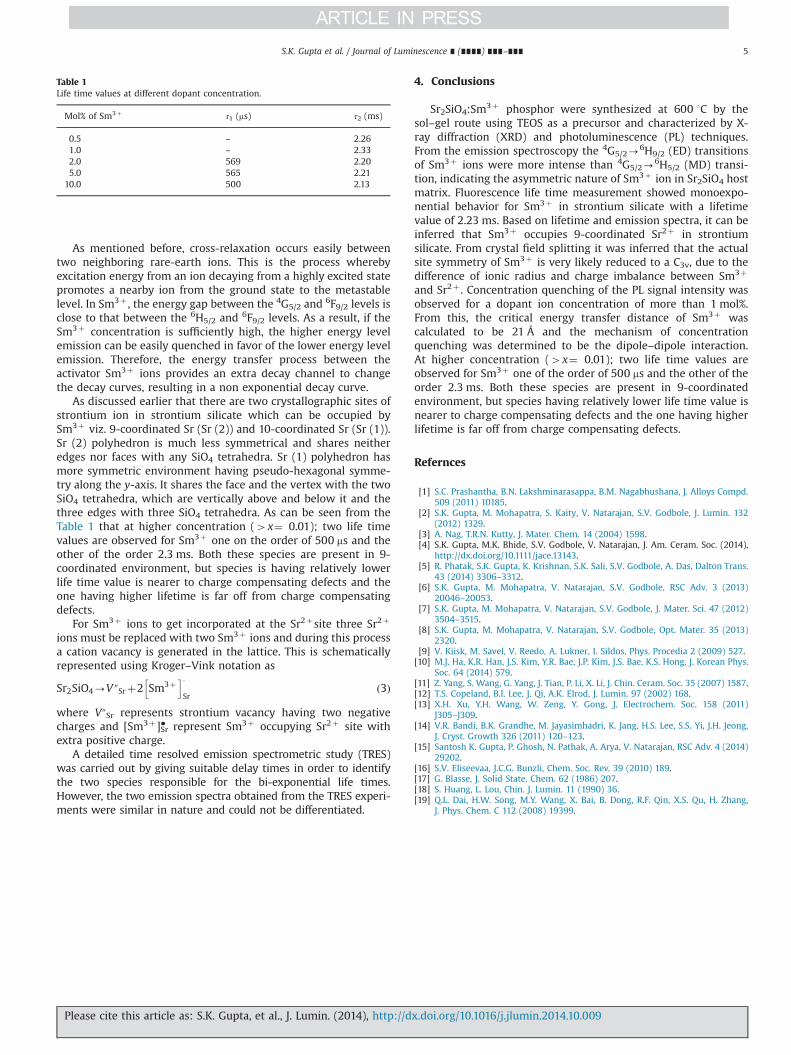
The effect of Sm3þ content on the 4G5/2-6H7/2 transition decay
curves is shown in Fig. 7 and Table 1. As can be seen from Table 1monoexponential decay was observed in the diluted samples. Athigher concentrations (x40.01), however, the observed decaycurves were bi-exponential, and the bi-exponential changes aremore prominent as the concentration of Sm3þ increases, revealingthat more than one relaxation process exists. When the lumines-cent centers have different local environments, the associated ionswill relax at different rates. If the rates are dramatically different,then diverse decay curves are likely to be observed. Nevertheless,samples with low Sm3þ content would minimize the effectsof the interactions between optically active ions. Hence, the low-doped samples yield single exponential decay curves with a longlifetime, eliminating this possibility. In addition, it is unlikely thatonly one site with the shorter lifetime is populated for higherconcentrations.
Fig. 6. Relationship between log (I/c) and log(c) for the Sr2SiO4:Sm3þ phosphor.
Fig. 7. Decay curves for the 4G5/2 level of Sm3þ in Sr2SiO4: Sm samples for differentSm3þ contents. Samples were excited at 406 nm and emission was monitored at606 nm.
S.K. Gupta et al. / Journal of Luminescence ∎ (∎∎∎∎) ∎∎∎–∎∎∎4
Please cite this article as: S.K. Gupta, et al., J. Lumin. (2014), http://dx.doi.org/10.1016/j.jlumin.2014.10.009i
As mentioned before, cross-relaxation occurs easily betweentwo neighboring rare-earth ions. This is the process wherebyexcitation energy from an ion decaying from a highly excited statepromotes a nearby ion from the ground state to the metastablelevel. In Sm3þ , the energy gap between the 4G5/2 and 6F9/2 levels isclose to that between the 6H5/2 and 6F9/2 levels. As a result, if theSm3þ concentration is sufficiently high, the higher energy levelemission can be easily quenched in favor of the lower energy levelemission. Therefore, the energy transfer process between theactivator Sm3þ ions provides an extra decay channel to changethe decay curves, resulting in a non exponential decay curve.
As discussed earlier that there are two crystallographic sites ofstrontium ion in strontium silicate which can be occupied bySm3þ viz. 9-coordinated Sr (Sr (2)) and 10-coordinated Sr (Sr (1)).Sr (2) polyhedron is much less symmetrical and shares neitheredges nor faces with any SiO4 tetrahedra. Sr (1) polyhedron hasmore symmetric environment having pseudo-hexagonal symme-try along the y-axis. It shares the face and the vertex with the twoSiO4 tetrahedra, which are vertically above and below it and thethree edges with three SiO4 tetrahedra. As can be seen from theTable 1 that at higher concentration (4x¼ 0.01); two life timevalues are observed for Sm3þ one on the order of 500 ms and theother of the order 2.3 ms. Both these species are present in 9-coordinated environment, but species is having relatively lowerlife time value is nearer to charge compensating defects and theone having higher lifetime is far off from charge compensatingdefects.
For Sm3þ ions to get incorporated at the Sr2þsite three Sr2þ
ions must be replaced with two Sm3þ ions and during this processa cation vacancy is generated in the lattice. This is schematicallyrepresented using Kroger–Vink notation as
Sr2SiO4-V″Srþ2 Sm3þh i�
Srð3Þ
where V″Sr represents strontium vacancy having two negativecharges and [Sm3þ]�Sr represent Sm3þ occupying Sr2þ site withextra positive charge.
A detailed time resolved emission spectrometric study (TRES)was carried out by giving suitable delay times in order to identifythe two species responsible for the bi-exponential life times.However, the two emission spectra obtained from the TRES experi-ments were similar in nature and could not be differentiated.
4. Conclusions
Sr2SiO4:Sm3þ phosphor were synthesized at 600 1C by thesol–gel route using TEOS as a precursor and characterized by X-ray diffraction (XRD) and photoluminescence (PL) techniques.From the emission spectroscopy the 4G5/2-
6H9/2 (ED) transitionsof Sm3þ ions were more intense than 4G5/2-
6H5/2 (MD) transi-tion, indicating the asymmetric nature of Sm3þ ion in Sr2SiO4 hostmatrix. Fluorescence life time measurement showed monoexpo-nential behavior for Sm3þ in strontium silicate with a lifetimevalue of 2.23 ms. Based on lifetime and emission spectra, it can beinferred that Sm3þ occupies 9-coordinated Sr2þ in strontiumsilicate. From crystal field splitting it was inferred that the actualsite symmetry of Sm3þ is very likely reduced to a C3v, due to thedifference of ionic radius and charge imbalance between Sm3þ
and Sr2þ . Concentration quenching of the PL signal intensity wasobserved for a dopant ion concentration of more than 1 mol%.From this, the critical energy transfer distance of Sm3þ wascalculated to be 21 Å and the mechanism of concentrationquenching was determined to be the dipole–dipole interaction.At higher concentration (4x¼ 0.01); two life time values areobserved for Sm3þ one of the order of 500 ms and the other of theorder 2.3 ms. Both these species are present in 9-coordinatedenvironment, but species having relatively lower life time value isnearer to charge compensating defects and the one having higherlifetime is far off from charge compensating defects.
Refernces
[1] S.C. Prashantha, B.N. Lakshminarasappa, B.M. Nagabhushana, J. Alloys Compd.509 (2011) 10185.
[2] S.K. Gupta, M. Mohapatra, S. Kaity, V. Natarajan, S.V. Godbole, J. Lumin. 132(2012) 1329.
[3] A. Nag, T.R.N. Kutty, J. Mater. Chem. 14 (2004) 1598.[4] S.K. Gupta, M.K. Bhide, S.V. Godbole, V. Natarajan, J. Am. Ceram. Soc. (2014),
http://dx.doi.org/10.1111/jace.13143.[5] R. Phatak, S.K. Gupta, K. Krishnan, S.K. Sali, S.V. Godbole, A. Das, Dalton Trans.
43 (2014) 3306–3312.[6] S.K. Gupta, M. Mohapatra, V. Natarajan, S.V. Godbole, RSC Adv. 3 (2013)
20046–20053.[7] S.K. Gupta, M. Mohapatra, V. Natarajan, S.V. Godbole, J. Mater. Sci. 47 (2012)
3504–3515.[8] S.K. Gupta, M. Mohapatra, V. Natarajan, S.V. Godbole, Opt. Mater. 35 (2013)
2320.[9] V. Kiisk, M. Savel, V. Reedo, A. Lukner, I. Sildos, Phys. Procedia 2 (2009) 527.[10] M.J. Ha, K.R. Han, J.S. Kim, Y.R. Bae, J.P. Kim, J.S. Bae, K.S. Hong, J. Korean Phys.
Soc. 64 (2014) 579.[11] Z. Yang, S. Wang, G. Yang, J. Tian, P. Li, X. Li, J. Chin. Ceram. Soc. 35 (2007) 1587.[12] T.S. Copeland, B.I. Lee, J. Qi, A.K. Elrod, J. Lumin. 97 (2002) 168.[13] X.H. Xu, Y.H. Wang, W. Zeng, Y. Gong, J. Electrochem. Soc. 158 (2011)
J305–J309.[14] V.R. Bandi, B.K. Grandhe, M. Jayasimhadri, K. Jang, H.S. Lee, S.S. Yi, J.H. Jeong,
J. Cryst. Growth 326 (2011) 120–123.[15] Santosh K. Gupta, P. Ghosh, N. Pathak, A. Arya, V. Natarajan, RSC Adv. 4 (2014)
29202.[16] S.V. Eliseevaa, J.C.G. Bunzli, Chem. Soc. Rev. 39 (2010) 189.[17] G. Blasse, J. Solid State. Chem. 62 (1986) 207.[18] S. Huang, L. Lou, Chin. J. Lumin. 11 (1990) 36.[19] Q.L. Dai, H.W. Song, M.Y. Wang, X. Bai, B. Dong, R.F. Qin, X.S. Qu, H. Zhang,
J. Phys. Chem. C 112 (2008) 19399.
Table 1Life time values at different dopant concentration.
Mol% of Sm3þ τ1 (ms) τ2 (ms)
0.5 – 2.261.0 – 2.332.0 569 2.205.0 565 2.21
10.0 500 2.13
S.K. Gupta et al. / Journal of Luminescence ∎ (∎∎∎∎) ∎∎∎–∎∎∎ 5
Please cite this article as: S.K. Gupta, et al., J. Lumin. (2014), http://dx.doi.org/10.1016/j.jlumin.2014.10.009i